Article

Li-Ion Battery Lifetime Model’s Influence on the Economic Assessment of a Hybrid Electric Bus’s Operation

by
Egoitz Martinez-Laserna
*,
Victor I. Herrera
,
Iñigo Gandiaga
,
Aitor Milo
,
Elixabet Sarasketa-Zabala
and
Haizea Gaztañaga
IK4-IKERLAN, Pº J. M. Arizmendiarrieta 2, 20500 Arrasate, Spain
*
Author to whom correspondence should be addressed.
World Electr. Veh. J. 2018, 9(2), 28; https://doi.org/10.3390/wevj9020028
Submission received: 21 June 2018 / Revised: 19 July 2018 / Accepted: 23 July 2018 / Published: 26 July 2018

Abstract

:
The present paper is focused on the evaluation of the economic influence of a battery lifetime model upon the optimal sizing and energy management strategy of a dual energy storage system (ESS) composed of Lithium-ion batteries and supercapacitors. The operation of a Hybrid Bus is taken as a case study in order to evaluate the effects of battery lifetime models’ accuracy on ESS sizing and operation in a heavy-duty application. For this purpose, two different lifetime models (a Wöhler-curve-based model and a semi-empirical model) were applied in the multi-objective optimisation of a hybrid electric urban bus. Differences up to ca. 8% on the daily operation costs and ca. 25% on the dual ESS costs were estimated depending on the lifetime model considered for the optimisation.

Graphical Abstract

1. Introduction

The development of new electrochemical energy storage technologies and the growing maturity of lithium-ion (Li-ion) batteries are promoting the penetration of advanced electro-mobility solutions. In the urban context, one of the most promising alternatives to reduce emissions is the use of hybrid electric buses (HEB), which are considered a more economically viable alternative than full-electric buses in the medium term [1].
The implementation of battery-based energy storage systems (ESSs) entails inherent challenges, since the reduction of fuel consumption is related to a higher use of the batteries. This leads to a great number of battery charge/discharge cycles and thus a potential early degradation [2]. To cover the lifetime of a heavy-duty application, e.g., in the case of urban buses, multiple battery replacements might be necessary. Therefore, extending battery lifetime, both in terms of calendar and cycle life, would be crucial to make electric or hybrid buses a cost-competitive alternative to conventional buses [3]. To solve this issue, the use of a dual ESS, composed of batteries (BTs) and supercapacitors (SCs), is investigated in this paper. A dual ESS may reduce the power demands on the batteries by using a complementary high power energy storage device (in this case SC) which shaves sudden power peaks.
The sizing of the ESS [4,5,6] is commonly addressed during the design stage of a vehicle. Despite the fact that, in a dual ESS based on BTs and SCs, the function of each energy storage unit during operation is quite defined (energy provided by the BT pack and power peak regulation by the SC pack), a proper methodology is still required to define their suitable sizing and to obtain efficient and economic performance. Thus, it can be noted that the system’s sizing and operation are key factors to ensure the fulfillment of the application requirements, the proper harnessing of the onboard energy sources, and the defined economic objectives [7,8]. In close-to-market applications, the economic issue becomes in an important decision factor as the solution has to be competitive and profitable both for the manufacturer and the end-users. Therefore, both technical and economic factors have to be evaluated to develop more efficient and cost-competitive HEBs [9].
In this context, the lifetime model of a battery becomes an important tool to evaluate its degradation behaviour during vehicle operation, as the battery lifetime is reported to be typically shorter than that of supercapacitors [10]. The proper assessment of battery lifetime [11] may even affect the design and definition of business models, either for vehicle manufacturers or vehicle operators, conditioning how certain economic targets could be achieved [1]. Nevertheless, most publications in the literature rarely emphasize lifetime modelling when describing the sizing and operation of an ESS [12,13,14]. This paper extends the analysis provided in [15] by analysing the HEB application, in which different operation constraints and ESS demands are implied.
The aim of this paper is to analyse the techno-economic influence of the battery lifetime model on the sizing and operation of a hybrid ESS. A multi-objective (MO) is defined, which covers the total costs of the battery ESS and the supercapacitor ESS and the total fuel costs. Two different battery lifetime models were considered for the targeted MO optimisation: (i) a Wöhler-curve-based lifetime model (simple and cost-efficient but less accurate) and (ii) a semi-empirical lifetime model (costly and time-consuming, but accurate) [16]. Results obtained in the optimisation, which involved dual ESS sizing and operation strategy definition, were obtained with each of the two lifetime models. These results are compared in economic terms, and the ageing behaviour estimated with each model is analysed to approach how the dual ESS would perform in a real application.

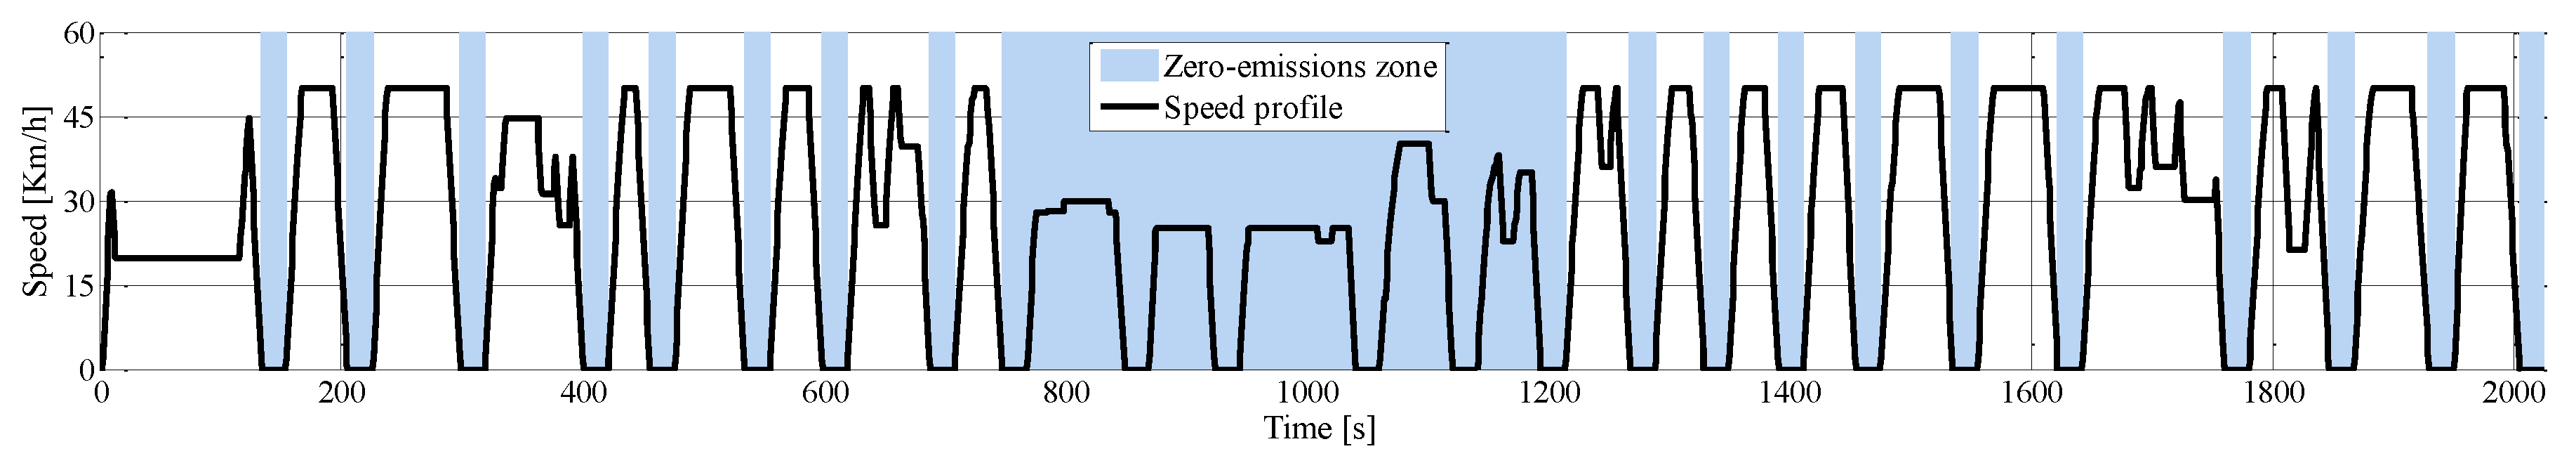
2. Scenario Overview

The scenario analysed in this paper is based on a Series Hybrid Electric Bus (SHEB) for urban operation. Figure 1 depicts the powertrain configuration of the SHEB including a dual ESS [17]. The main propulsion element is the electric motor (EM) powered from the direct current (DC) bus and mechanically connected to the vehicle transmission (T). The EM operates as generator during the regenerative braking phase. The SHEB includes a dual ESS composed of: (i) a Li-ion battery that provides high energy density; and (ii) a supercapacitor system with high power density, which is conceived to absorb or inject power peaks during regenerative braking or acceleration events, respectively. Among the different possible dual ESS connection topologies [6], a fully active or parallel-connection topology was selected. Such a topology allows for decoupling the operation of batteries and supercapacitors in order to maximise the functionalities of each energy storage technology. The genset considered includes an Internal Combustion engine (ICE) and an electric generator (EG) set.
The route profile considered includes several stops (which were considered as zero-emission zones), a maximum speed of 50 km/h, and a travelling distance of around 27 km (round trip). The considered route also included a full-electric operation zone with a driving section of around 2.4 km. Thus, the considered SHEB is intended to operate both in hybrid mode (powered by the genset and the dual ESS) and in full-electric mode (only propelled by the dual ESS). The speed profile depicted in Figure 2 was repeated several times to complete a daily profile of 16 h of operation.
The simulation model was developed in Matlab/Simulink. The powertrain was modelled following a backwards (or effect–cause) approach [17]. The power consumed by the bus at each discrete step was calculated following a predefined speed profile by going upstream through the vehicle components [17].

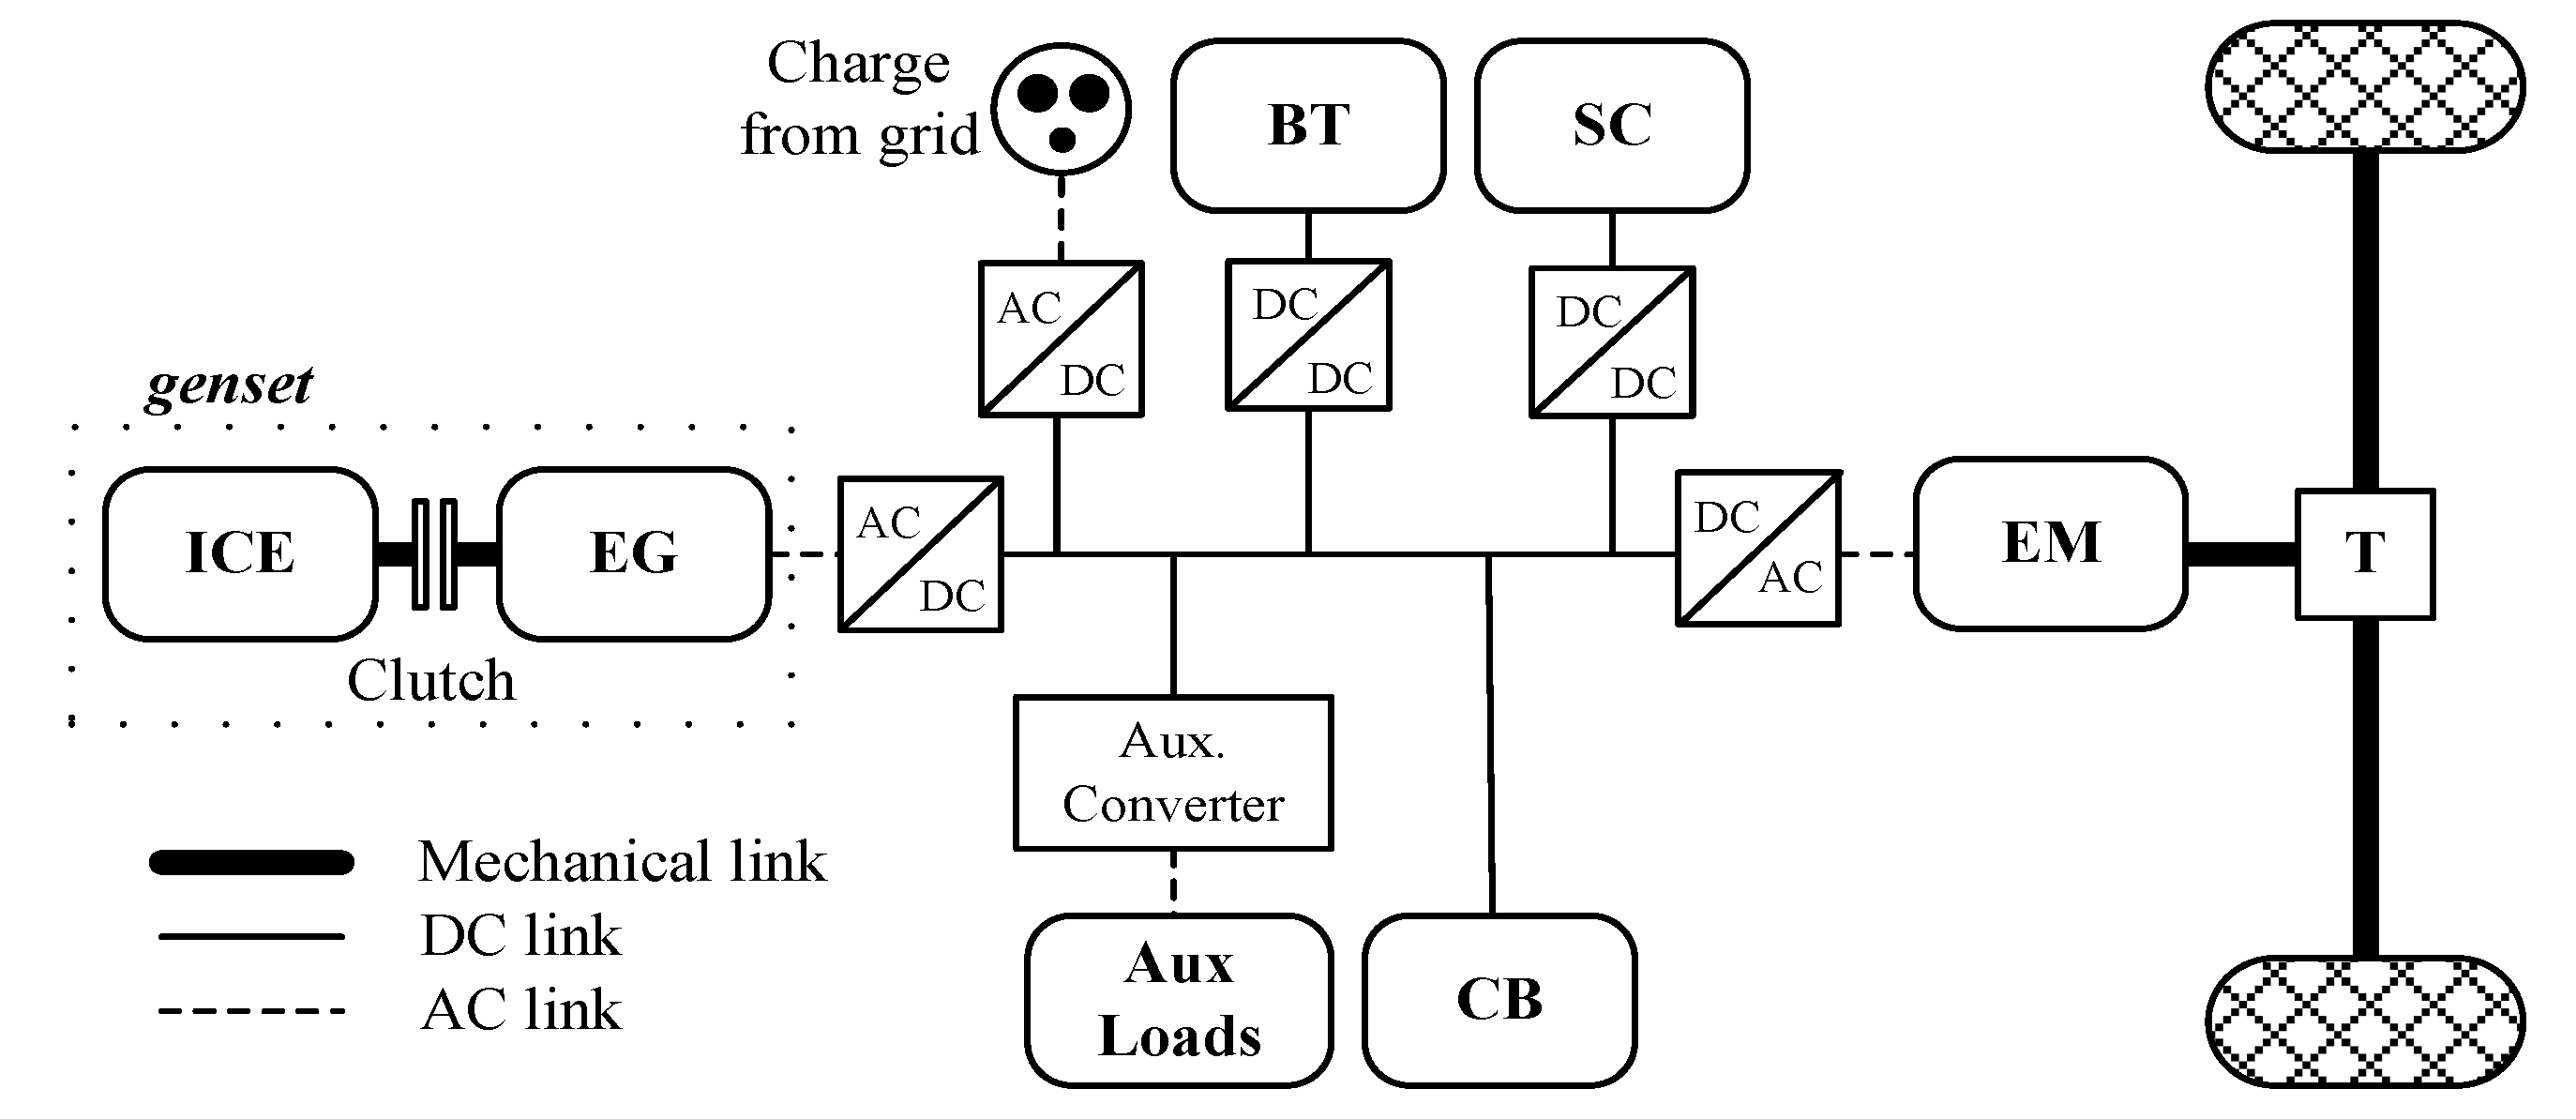
3. Modelling of the Onboard Dual ESS

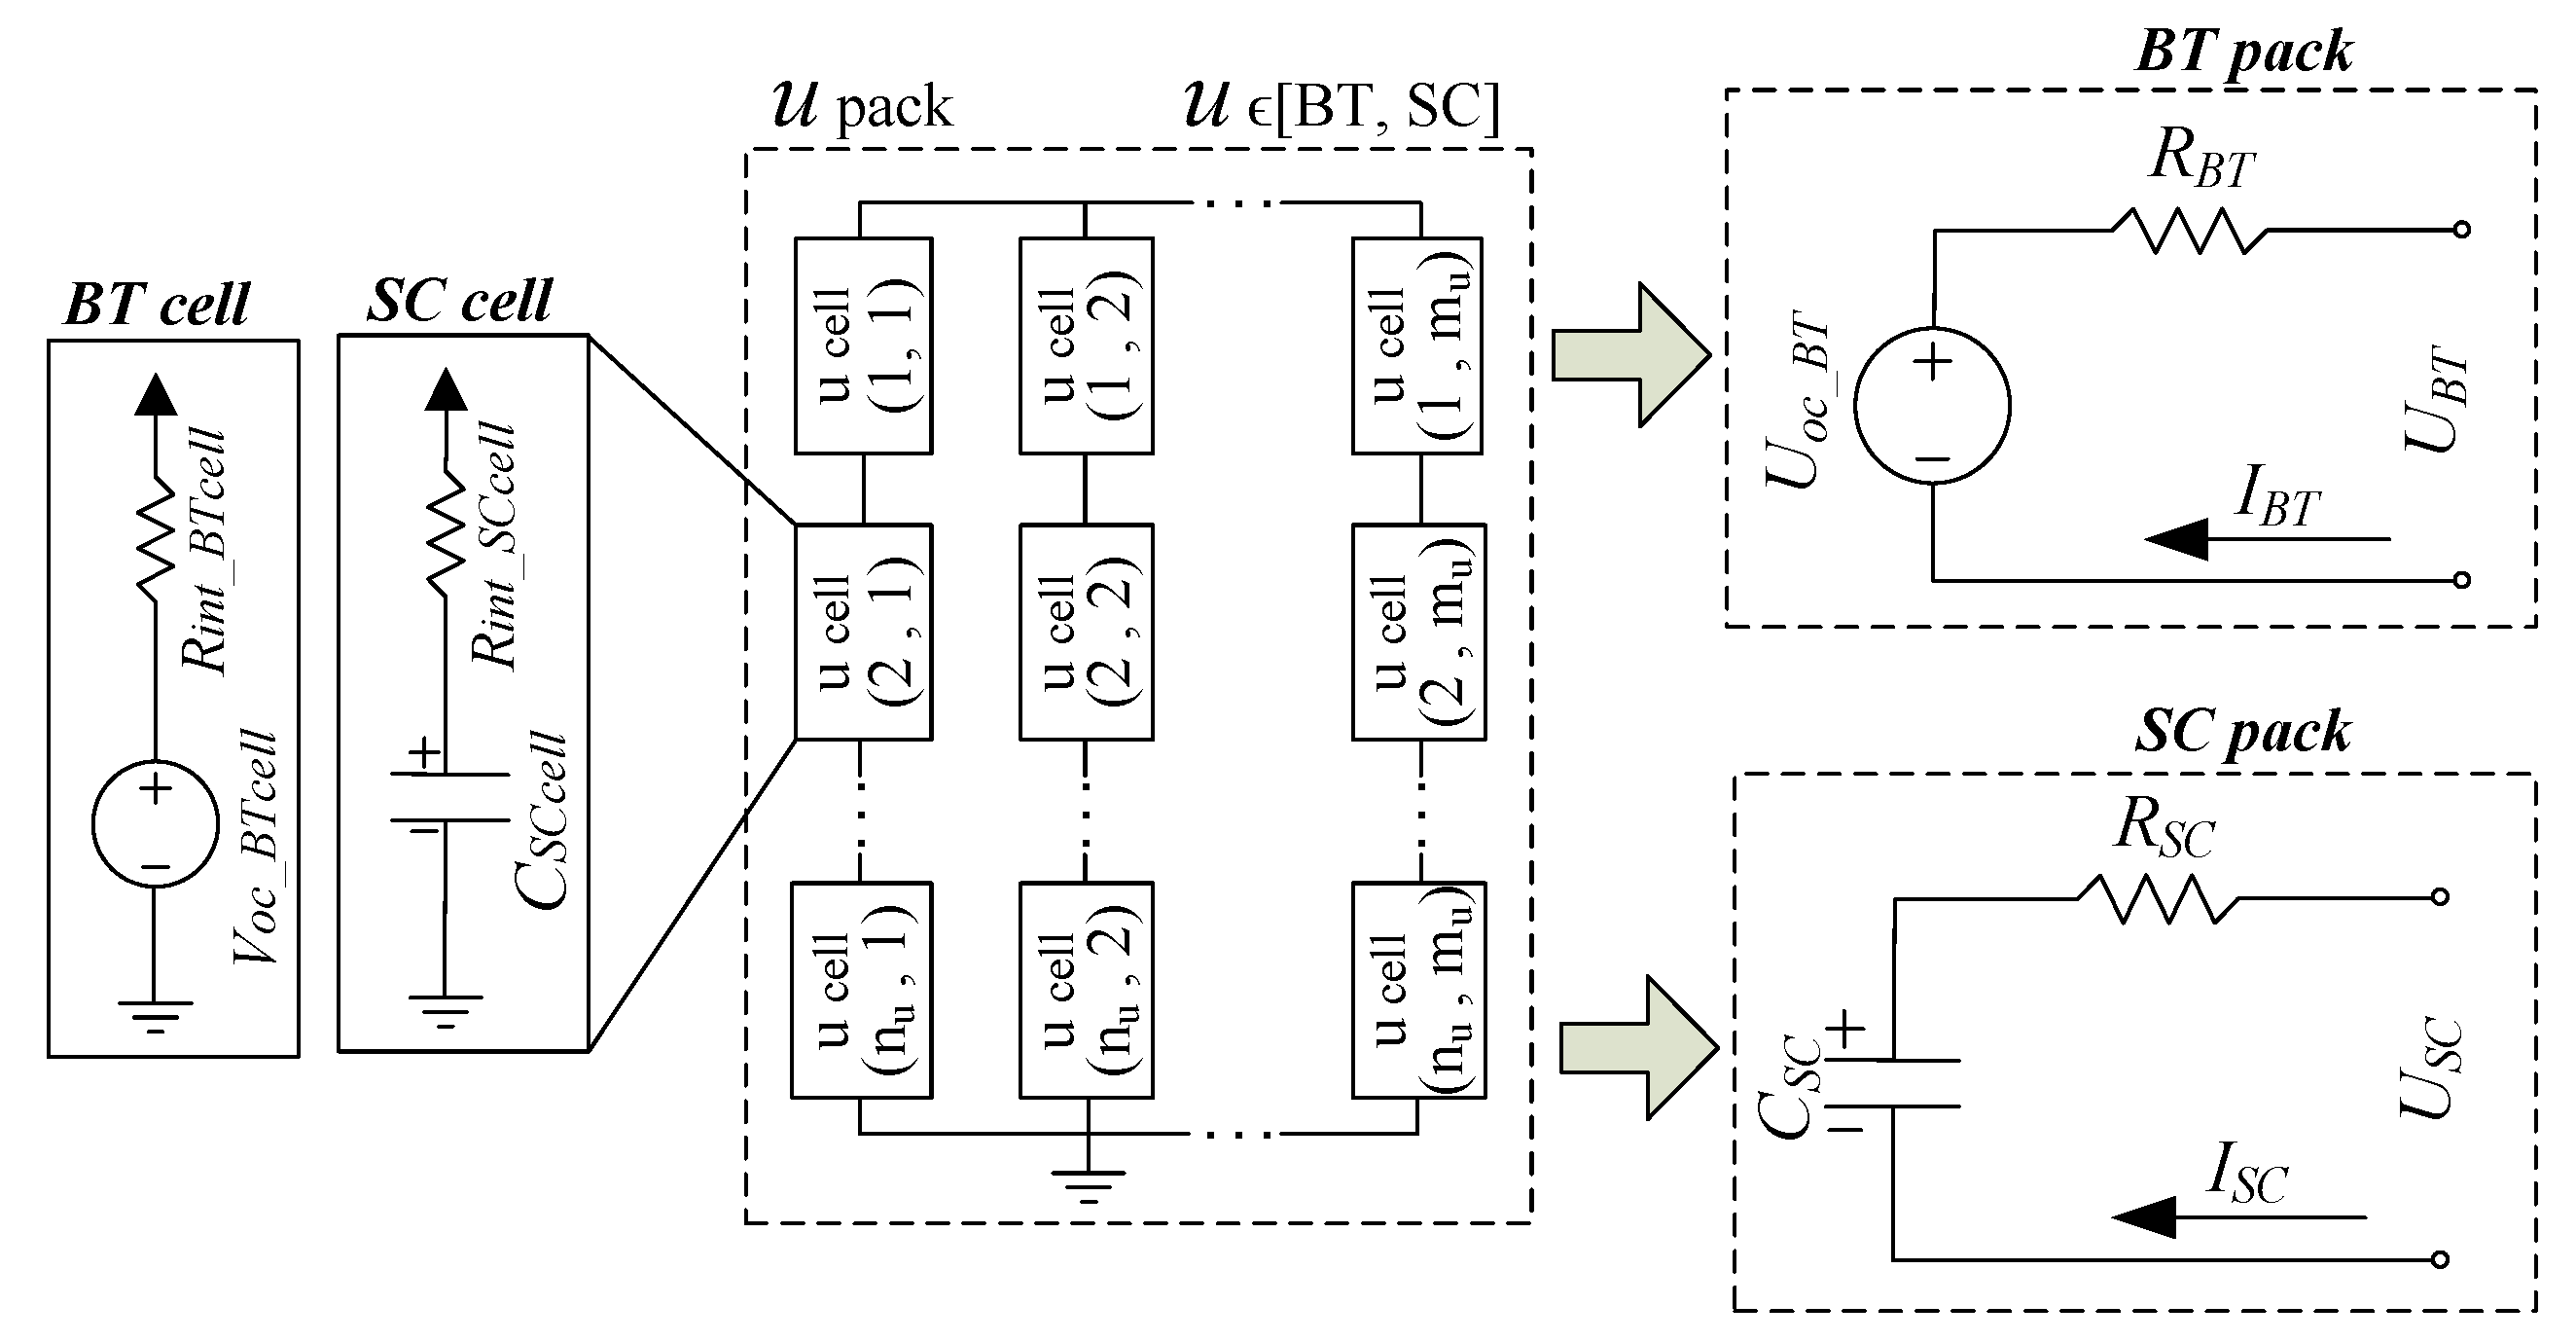
3.1. Electrical Modelling

The dual ESS considered is composed of an SC pack and Li-ion BT pack connected on a parallel topology as described in the previous section. The electrical modelling was simplified to limit the computational cost [15]. This was performed considering that the implemented simplified model (described below) would be capable of capturing the most relevant part of the transient voltage variation when responding to varying power demands. A more detailed electric model of the batteries would also reproduce the capacitive nature of the voltage response on the batteries. However, this would have a minimal influence on the obtained results, as the Energy Management Strategy (EMS) described below is defined in terms of the energy demands and the available energy on the ESS.
A supercapacitor model consisting of a 3000 F electric double-layer capacitor C S C c e l l (F) in series with a resistance R i n t _ S C c e l l (Ω) was implemented as described in Figure 3.
Assuming that a string contains SSC supercapacitor cells in series and the SC pack groups BSC strings in parallel, the equations describing the equivalent electrical model for the SC pack were implemented as follows:
C S C = B S C · C S C c e l l / S S C   ( F )
R S C = S S C · R i n t _ S C c e l l / B S C   ( Ω )
being C S C (F) and R S C (Ω) the equivalent capacitance and internal resistance at SC pack level, respectively.
In the case of the battery, a model consisting of a voltage source V o c _ B T c e l l (V) in series with a resistance R i n t _ B T c e l l (Ω) was implemented as presented in Figure 3. In this case, assuming that a string contains SBT battery cells in series and the BT pack groups BBT strings in parallel, the equations for the equivalent electrical model of the BT pack were implemented as follows:
U B T = V O C _ B T c e l l · S B T   ( V )
R B T = S B T · R i n t _ B T c e l l / B B T   ( Ω )
being U B T (V) and R B T (Ω) the voltage and equivalent internal resistance for the BT pack, respectively.
Table 1 summarises the main parameters of the battery and supercapacitor references considered in this scenario. On the one hand, the maximum C rate for charging and discharging the batteries was limited to 3.5 C to maintain the reliability of the lifetime model considered (described in the next section) and extend the battery lifetime [18].

3.2. Lifetime Modelling

With respect to the ageing performance of the supercapacitors, it was considered that these devices can typically withstand a significant amount of cycles, comparatively larger than Li-ion batteries. Therefore, a constant value of 106 cycles and a maximum lifetime of 10 years were implemented as the upper limit for the SC lifetime. On the contrary, the lifetime estimation of the Li-ion batteries was one of the core elements of the present study. Two different battery lifetime models were considered to evaluate their impact upon the ESS sizing and the determination of the optimal operation constraints: (i) a Wöhler-curve-based lifetime model and (ii) a semi-empirical lifetime model. These two different approaches represent different levels of complexity and experimental labour costs, but also are unequally accurate for prediction of BT lifetime under real operation conditions.

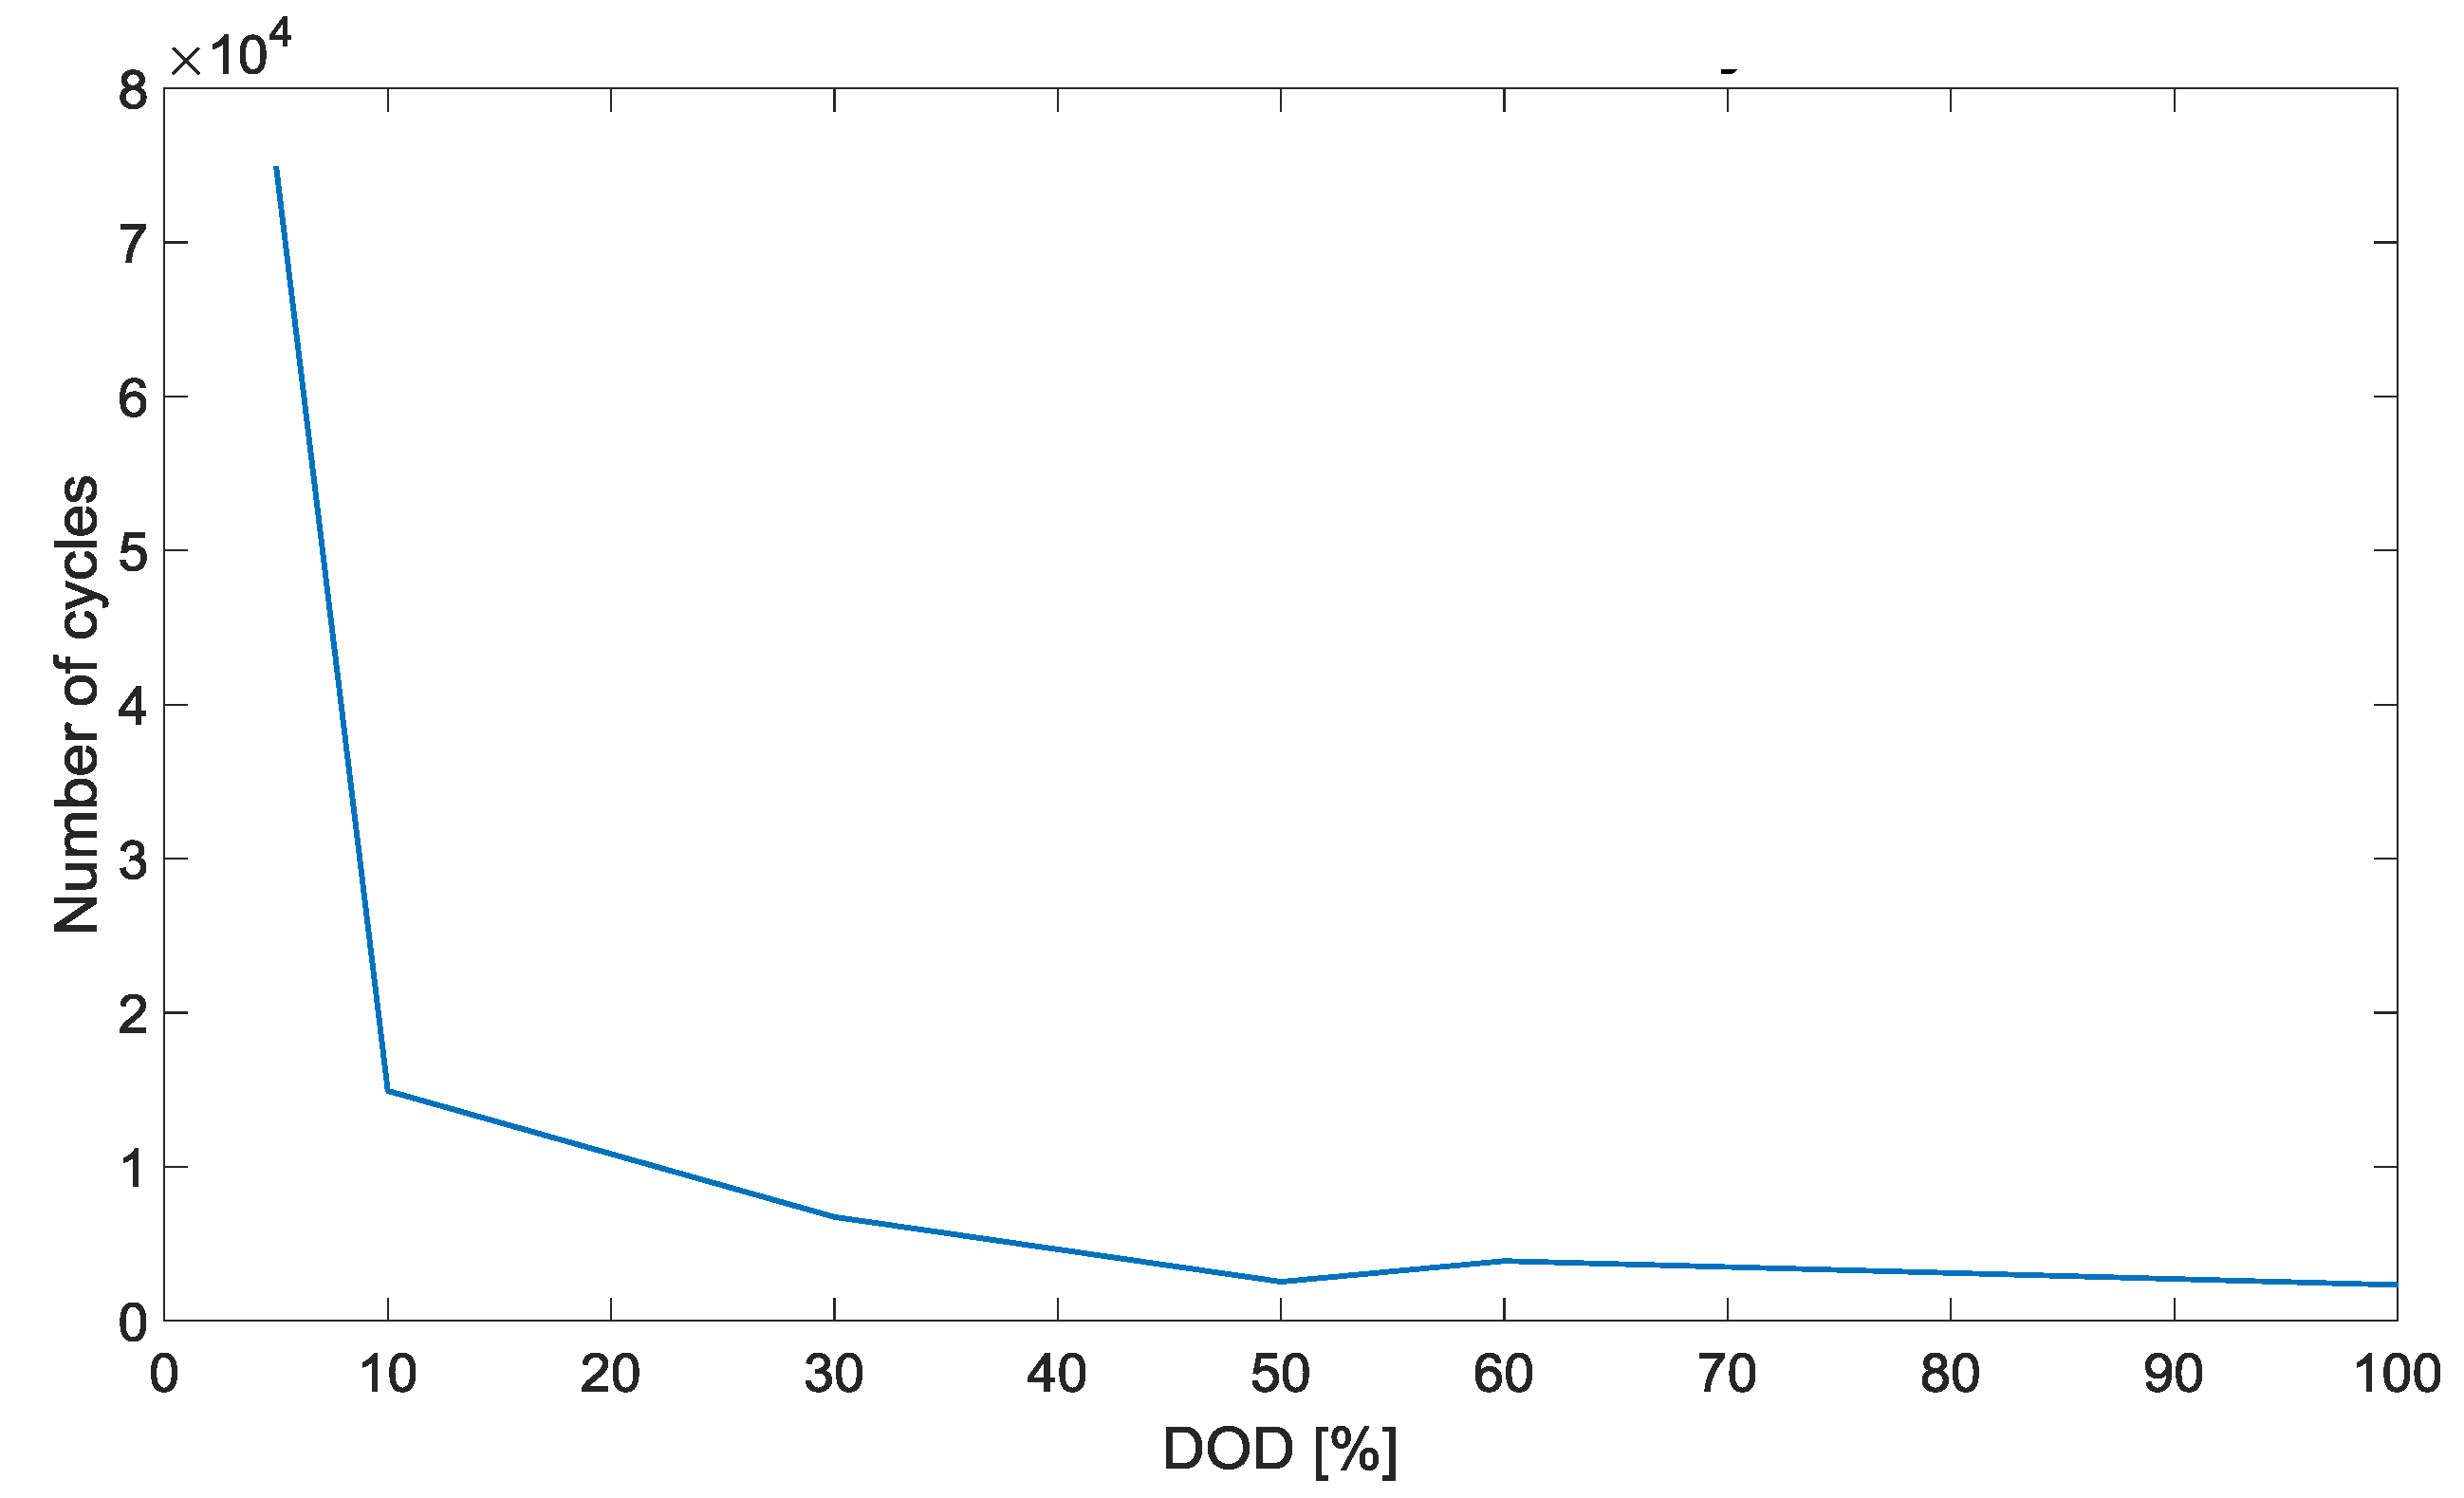
3.2.1. Wöhler-Curve-Based Lifetime Model

The use of Wöhler-curve-based ageing models has been typically considered in the literature, especially for sizing purposes or to perform economic analysis in applications where a battery-based ESS is integrated.
The idea behind this modelling approach consists of mathematically expressing the number of events i that can occur during the lifetime of a battery until it reaches its End-of-Life (EOL). The mathematical expression is described in Equation (5). In this case, i represents a certain Depth of Discharge (DOD) and the model evaluates the effect of the DOD upon the degradation of the battery, typically done using a Rainflow cycle counting algorithm [19,20]. L L i represents the lifetime decrease caused by the occurrence of a certain number of i events (i.e., the number of charge–discharge full cycles at a certain DOD).
L L i = N E i N E i m a x
where N E i m a x is the maximum number of events i that the battery can withstand and N E i the number of events counted. Thereby, L L i represents the lifetime lost as consequence of the occurrence of a certain number of i events; i.e., as a consequence of a number of charge–discharge cycles at a certain DOD. Similarly, for the whole range of DOD (from 0 to 100%), the total loss of lifetime is expressed according to Equation (6):
L L = i L L i .
Accordingly, when the lifetime lost L L equals 1, it is considered that the cell has reached its EOL. This method allows for evaluating the corresponding loss of lifetime for a certain battery State of Charge (SOC) profile, from which the number of events at each DOD range can be defined.
Then, considering the duration of the SOC profile introduced, the total lifetime can be calculated as the inversion of L L , typically measured in years (for a one-year SOC profile):
L i f e t i m e = 1 L L .
The maximum number of events N E i m a x at each DOD was deduced from the Wöhler curve of the batteries considered. In this case, for the considered LFP-based cell, the Wöhler curve obtained from experimental testing described in [21] was implemented as displayed in Figure 4.

3.2.2. Semi-Empirical Lifetime Model

A thorough semi-empirical lifetime model was implemented in the study, comprising both cycling and calendar ageing. Such an ageing model allowed for more accurately evaluating the impact of the lifetime model upon the dual ESS sizing [21]. The implemented semi-empirical battery lifetime model evaluates the capacity fade experienced over time by superimposing the effect of calendar and cycle operation.
The capacity loss due to calendar life Q l o s s c a l (%) was calculated as described in [22] according to Equation (8). Results were obtained from an extensive testing matrix including cells stored on climatic test chambers at different ambient temperatures and different levels of SOC [22].
Q l o s s c a l [ % ] = α 1 · e β 1 · T 1 · α 2 · e β 2 · S O C · t 0.5
where T (K) and SOC (%) are the ambient temperature and the state of charge at which the cell is stored, respectively, t is the time elapsed on storage, and α 1 , α 2 , β 1 , β 2 are fitting coefficients.
The capacity loss due to cycling, Q l o s s c y c (%), was calculated as described in Ref. [18] according to Equations (9) and (10). In this case, the effect of the C rate was limited to 3.5 C and its influence on battery lifetime was neglected as no conclusive effect was concluded from the ageing study performed and described in depth in [5,8]. Thereby, only the effects of the DOD and the Ampere hour throughput were considered. Further details about cycle ageing behaviour and specific modelling issues can be found in [16,18].
{ Q l o s s c y c ( D O D ) = ( γ 1 · D O D 2 + γ 2 · D O D + γ 3 ) · k · A h 0.87 f o r   10 % D O D 50 % Q l o s s c y c ( D O D ) = ( α 3 · e β 3 · D O D · α 4 · e β 4 · D O D ) · k · A h 0.65 f o r   10 % > D O D > 50 %
where Q l o s s c y c (%) is the equivalent capacity fade caused by cycling; D O D (%) represents the DOD at which the cycles are performed, and A h the Ampere hours throughput during the considered cycling period. Additionally, γ 1 , γ 2 , γ 3 , α 3 , α 4 , β 3 , and β 4 are constant fitting coefficients and k represents the acceleration factor caused by static cycling ageing tests [18].
Finally, the resultant total capacity loss Q l o s s (%) is calculated as the sum of the capacity loss caused by the calendar life Q l o s s c a l and by the cycle life ageing Q l o s s c y c [16] as shown in Equation (10).
Q l o s s [ % ] = Q l o s s c a l + Q l o s s c y c
The precision of this model has been thoroughly validated under different ageing conditions based on the methodology deeply described in [16,21]. For all of the cases considered in validation, the root mean square error (RMSE) prediction error calculated for the semi-empirical ageing model was below 1.4%.

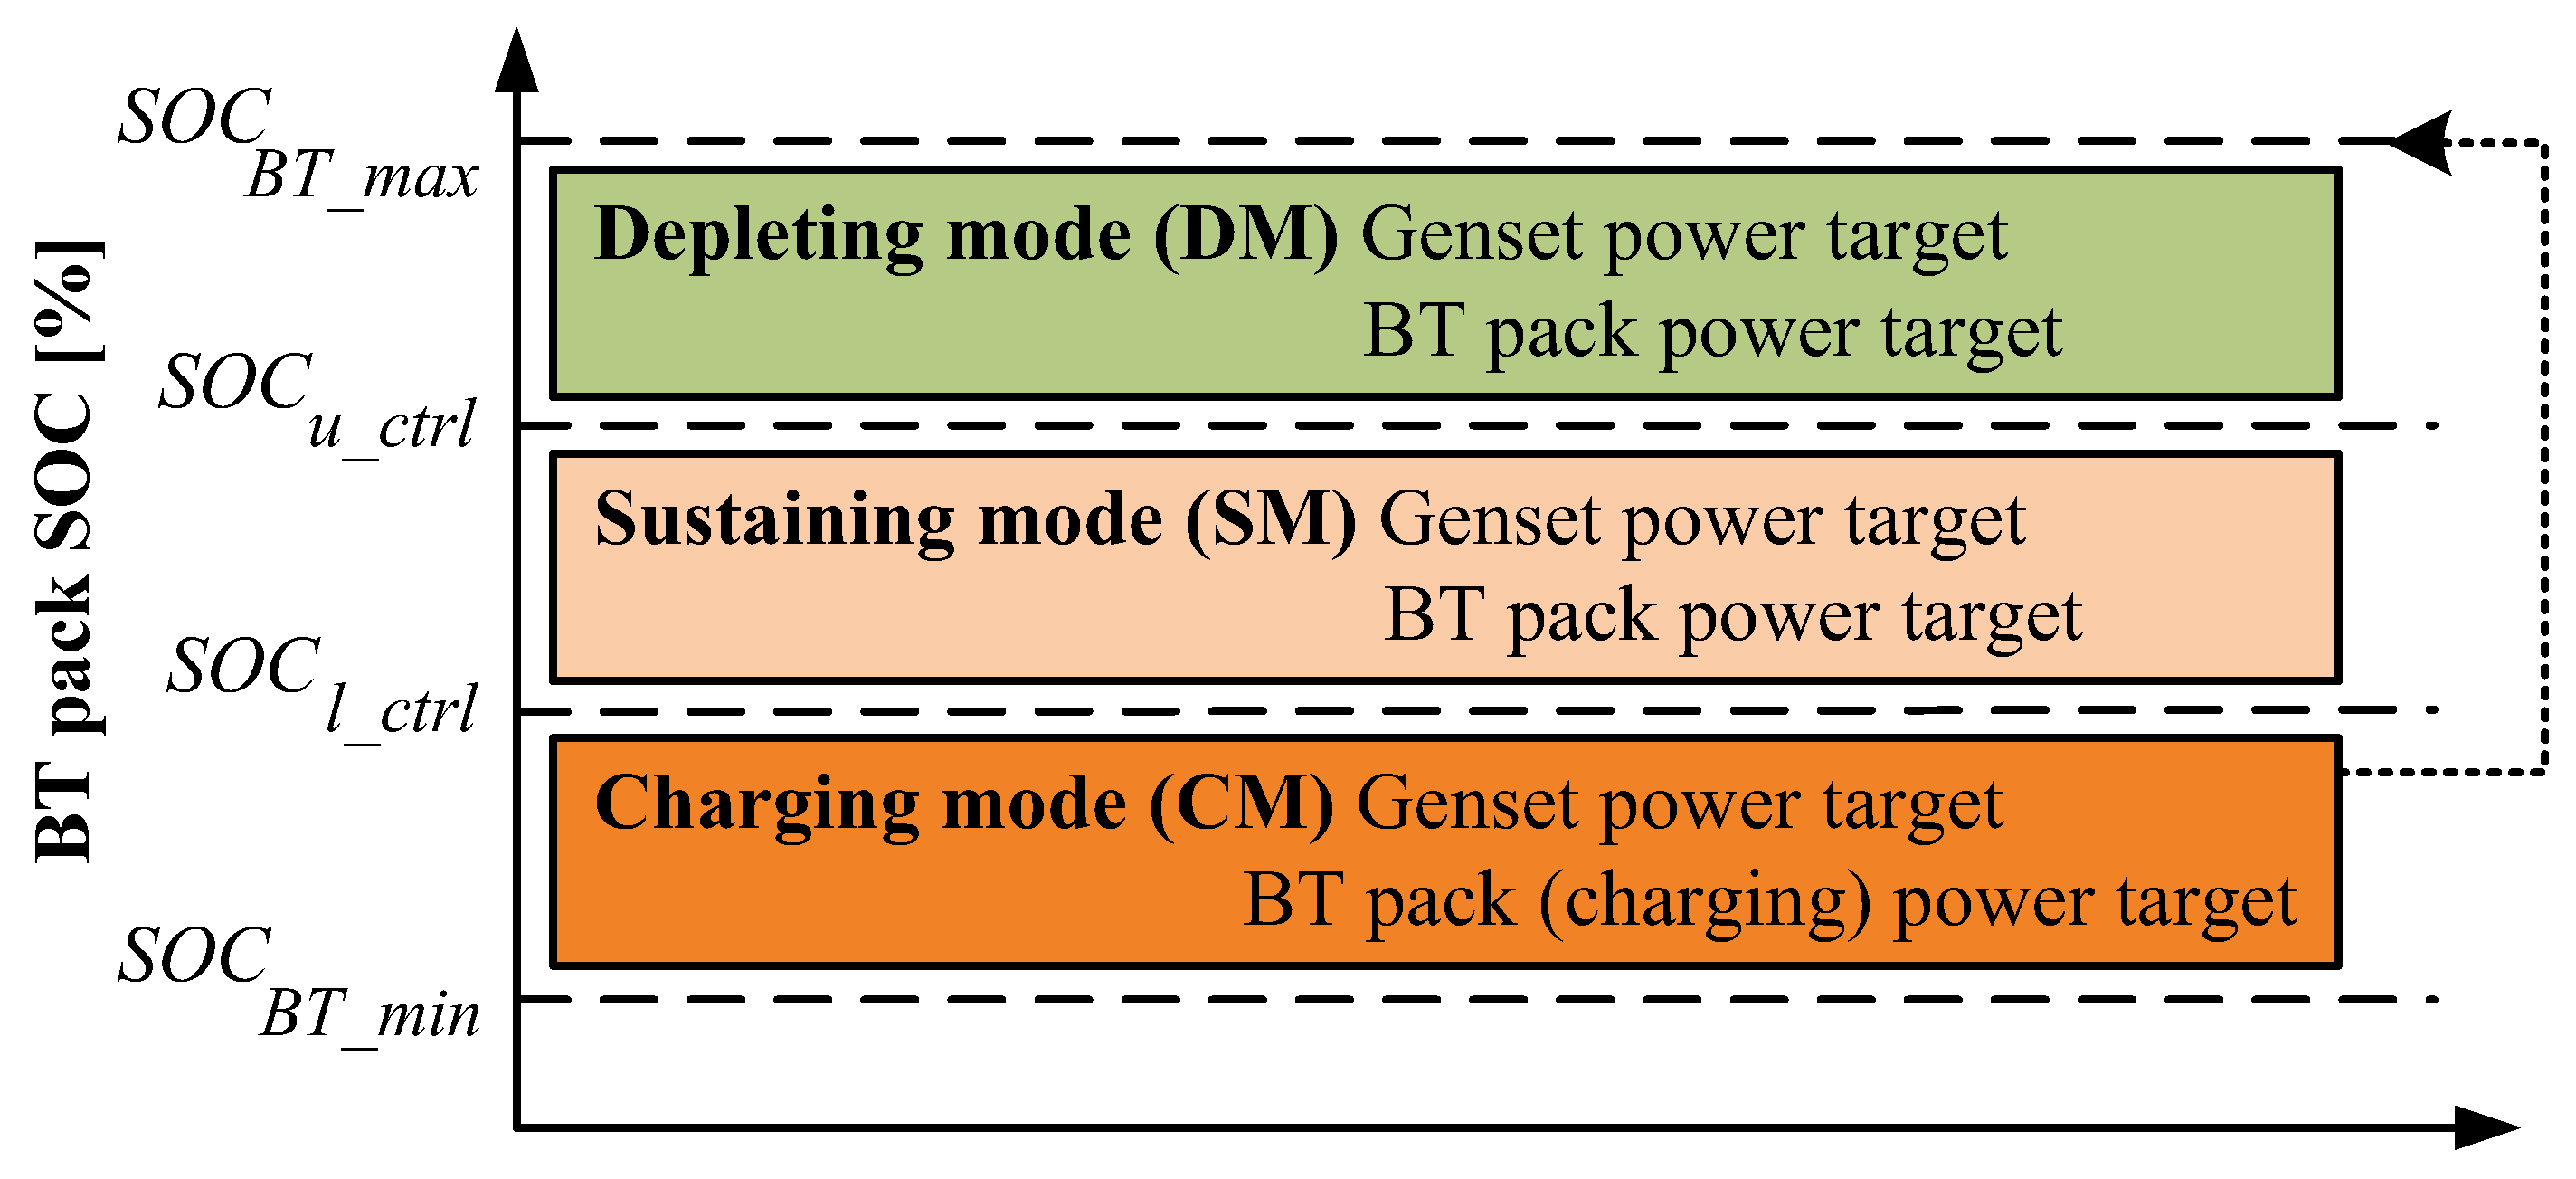
4. Rule-Based Energy Management Strategy

In order to operate the vehicle under the scenarios of hybrid and full-electric performance, and also considering the proposed dual ESS, different operation modes were defined [23]. The performance of the Rule-Based Energy Management Strategy (RB-EMS) thus depends on the instantaneous driving mode.

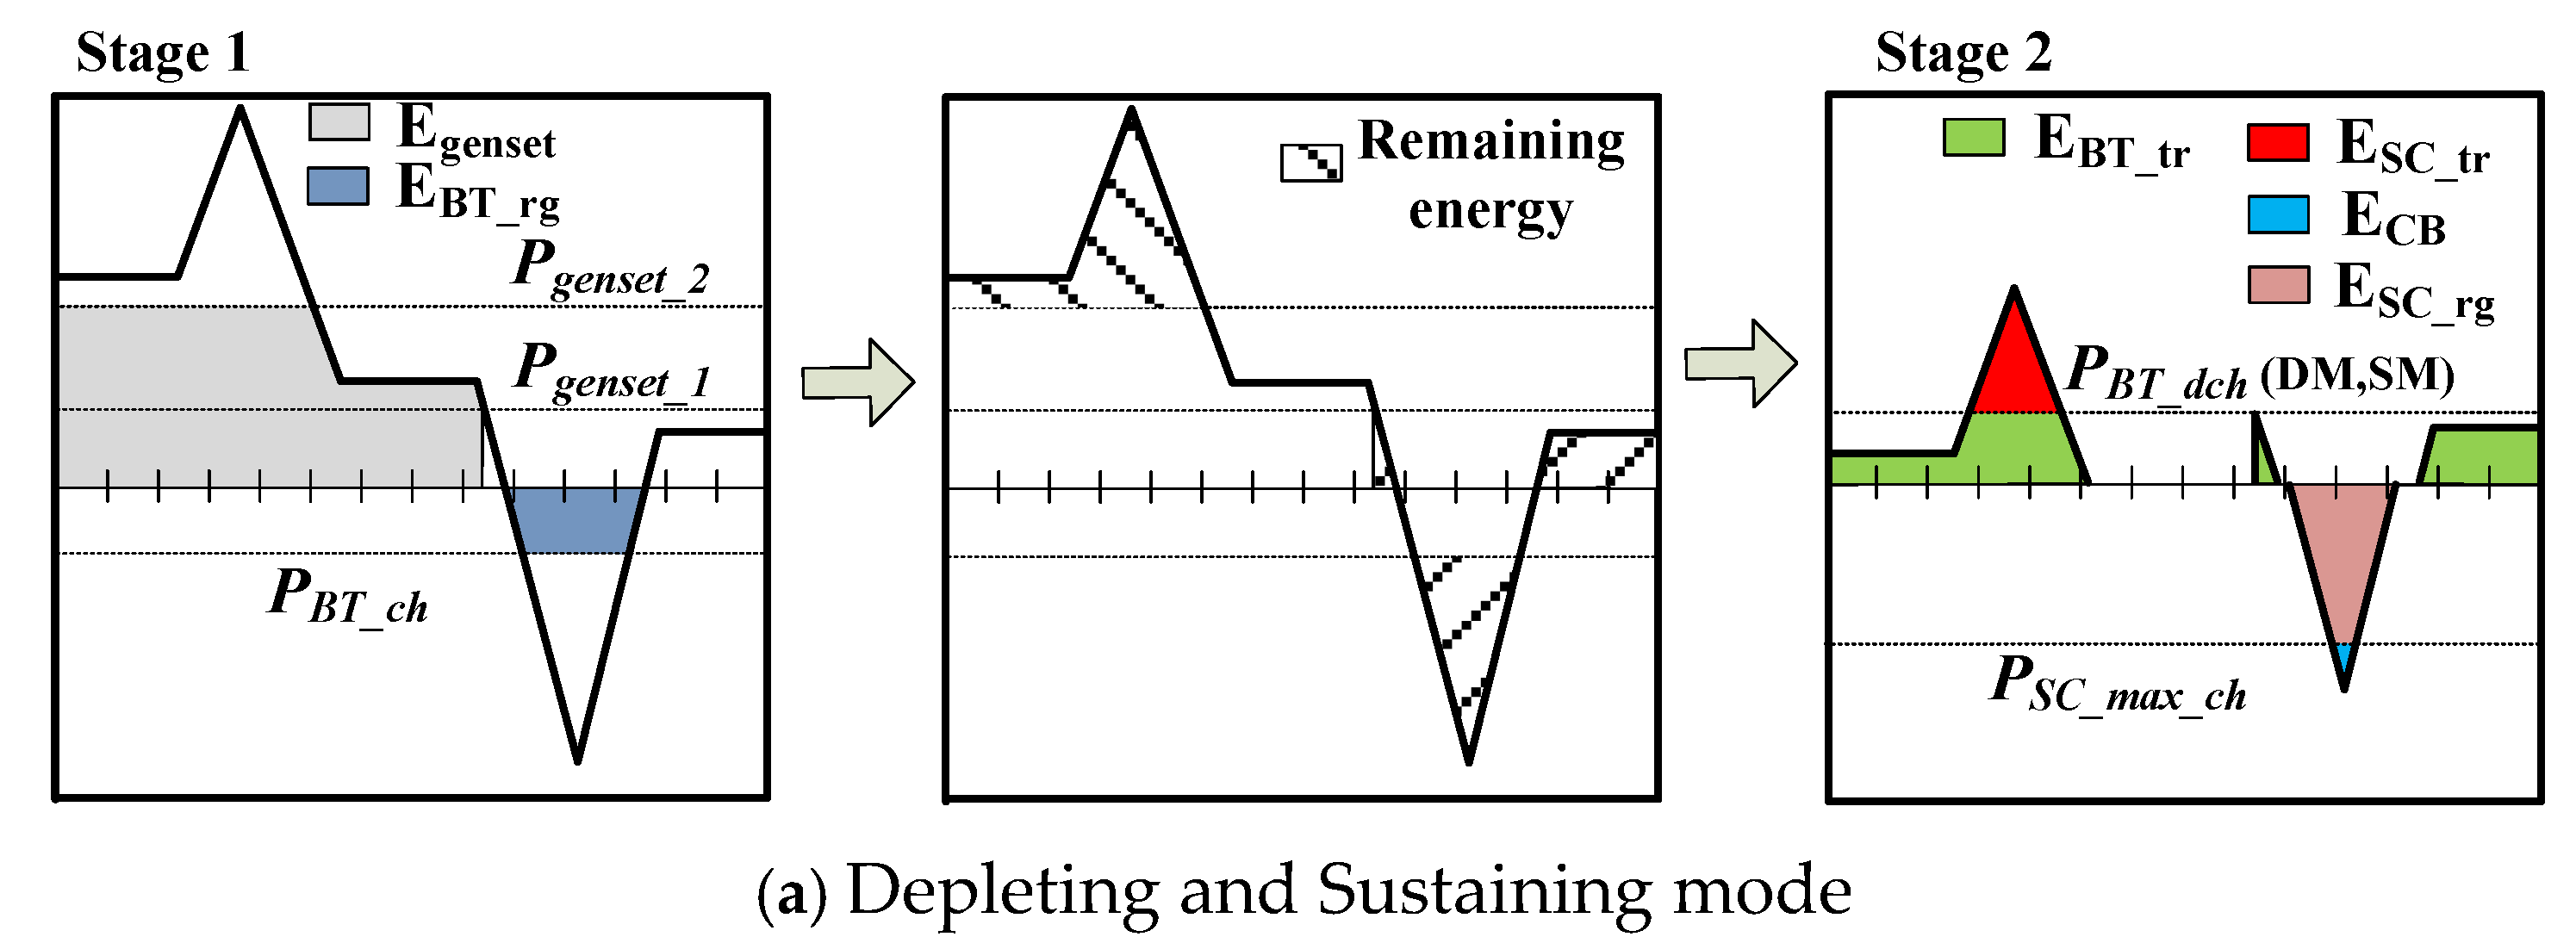
4.1. Hybrid Driving Mode

In this operation mode, both the genset and the dual ESS operate together. As depicted in Figure 5, the performance of the hybrid driving mode depends on the State of Charge of the battery ( S O C B T ) with two defined control levels ( S O C u _ c t r l and S O C l _ c t r l ) defining the energy mode for the SHEB operation. Thus, within the hybrid driving mode the following energy modes were defined: (i) Depleting mode (DM), (ii) Sustaining mode (SM), and (iii) Charging mode (CM).
In the first two modes, both the genset and the BT pack supply vehicle energy demands. Figure 6a,b depict the proposed strategy. The power demand P D E M ( k ) at each discrete step k is split between the genset and BT and SC packs and mathematically described according to Equations (12) and (13):
P B T _ d c h = ( V n o m _ B T c e l l · S B T ) ( I 1 C _ B T c e l l · C r a t e · B B T ) · p d c h / 10 3
P B T _ c h = ( V n o m B T c e l l · S B T ) ( I 1 C B T c e l l · C r a t e · B B T ) · p c h / 10 3 C r a t e · B B T ) · p c h / 10 3
being:
  • P g e n s e t ( k )   ( kW ) the genset power target.
  • P B T _ d c h (kW) the BT power target during discharge.
  • P B T _ c h   ( kW ) the BT power target during charge.
  • V n o m _ B T c e l l   ( V ) the nominal voltage of the BT cell.
  • I 1 C _ B T c e l l   ( A ) the nominal current of the BT cell.
  • C r a t e the C-rate limitation for the BT operation.
  • p d c h the ratio for BT pack discharging ( p d c h [ 0 1 ] ) with different values for DM, SM, and Electric Mode (EM).
  • p c h the ratio for charging the BT pack ( p c h [ 0 1 ] ).
  • E C B   ( kWh ) the energy dissipated in the crowbar.
The BT pack in depleting mode provides more energy for traction than in sustaining mode ( p d c h _ D M > p d c h _ S M ) . The genset power target P g e n s e t ( k )   ( kW ) is selected to operate between the power range P g e n s e t _ 2 P g e n s e t ( k ) P g e n s e t _ 1 , which is defined by optimisation (see Section 5).
Regarding Figure 6:
  • P S C _ m a x _ c h   ( kW ) is the maximum allowable power target for charging the SC pack (maximum power of the DC/DC).
  • E B T _ t r , E B T r g ( kWh ) is the energy provided/stored in the BT pack during a traction and braking phase.
  • E S C _ t r , E S C r g ( kWh ) is the energy provided/stored in the SC pack during a traction and braking phase.
  • E C B   ( kWh ) is the energy dissipated in the crowbar.
  • E g e n s e t   ( kWh ) is the energy provided by the genset.
  • E B T _ c h   ( kWh ) is the energy provided by the genset to charge the BT pack.
In the case of the charging mode, the battery does not provide energy. The genset is in charge of providing energy both to fulfil the vehicle’s demand as well as to recharge the BT pack as described by the following equation:
P g e n s e t ( k ) = P D E M ( k ) + P B T _ c h .

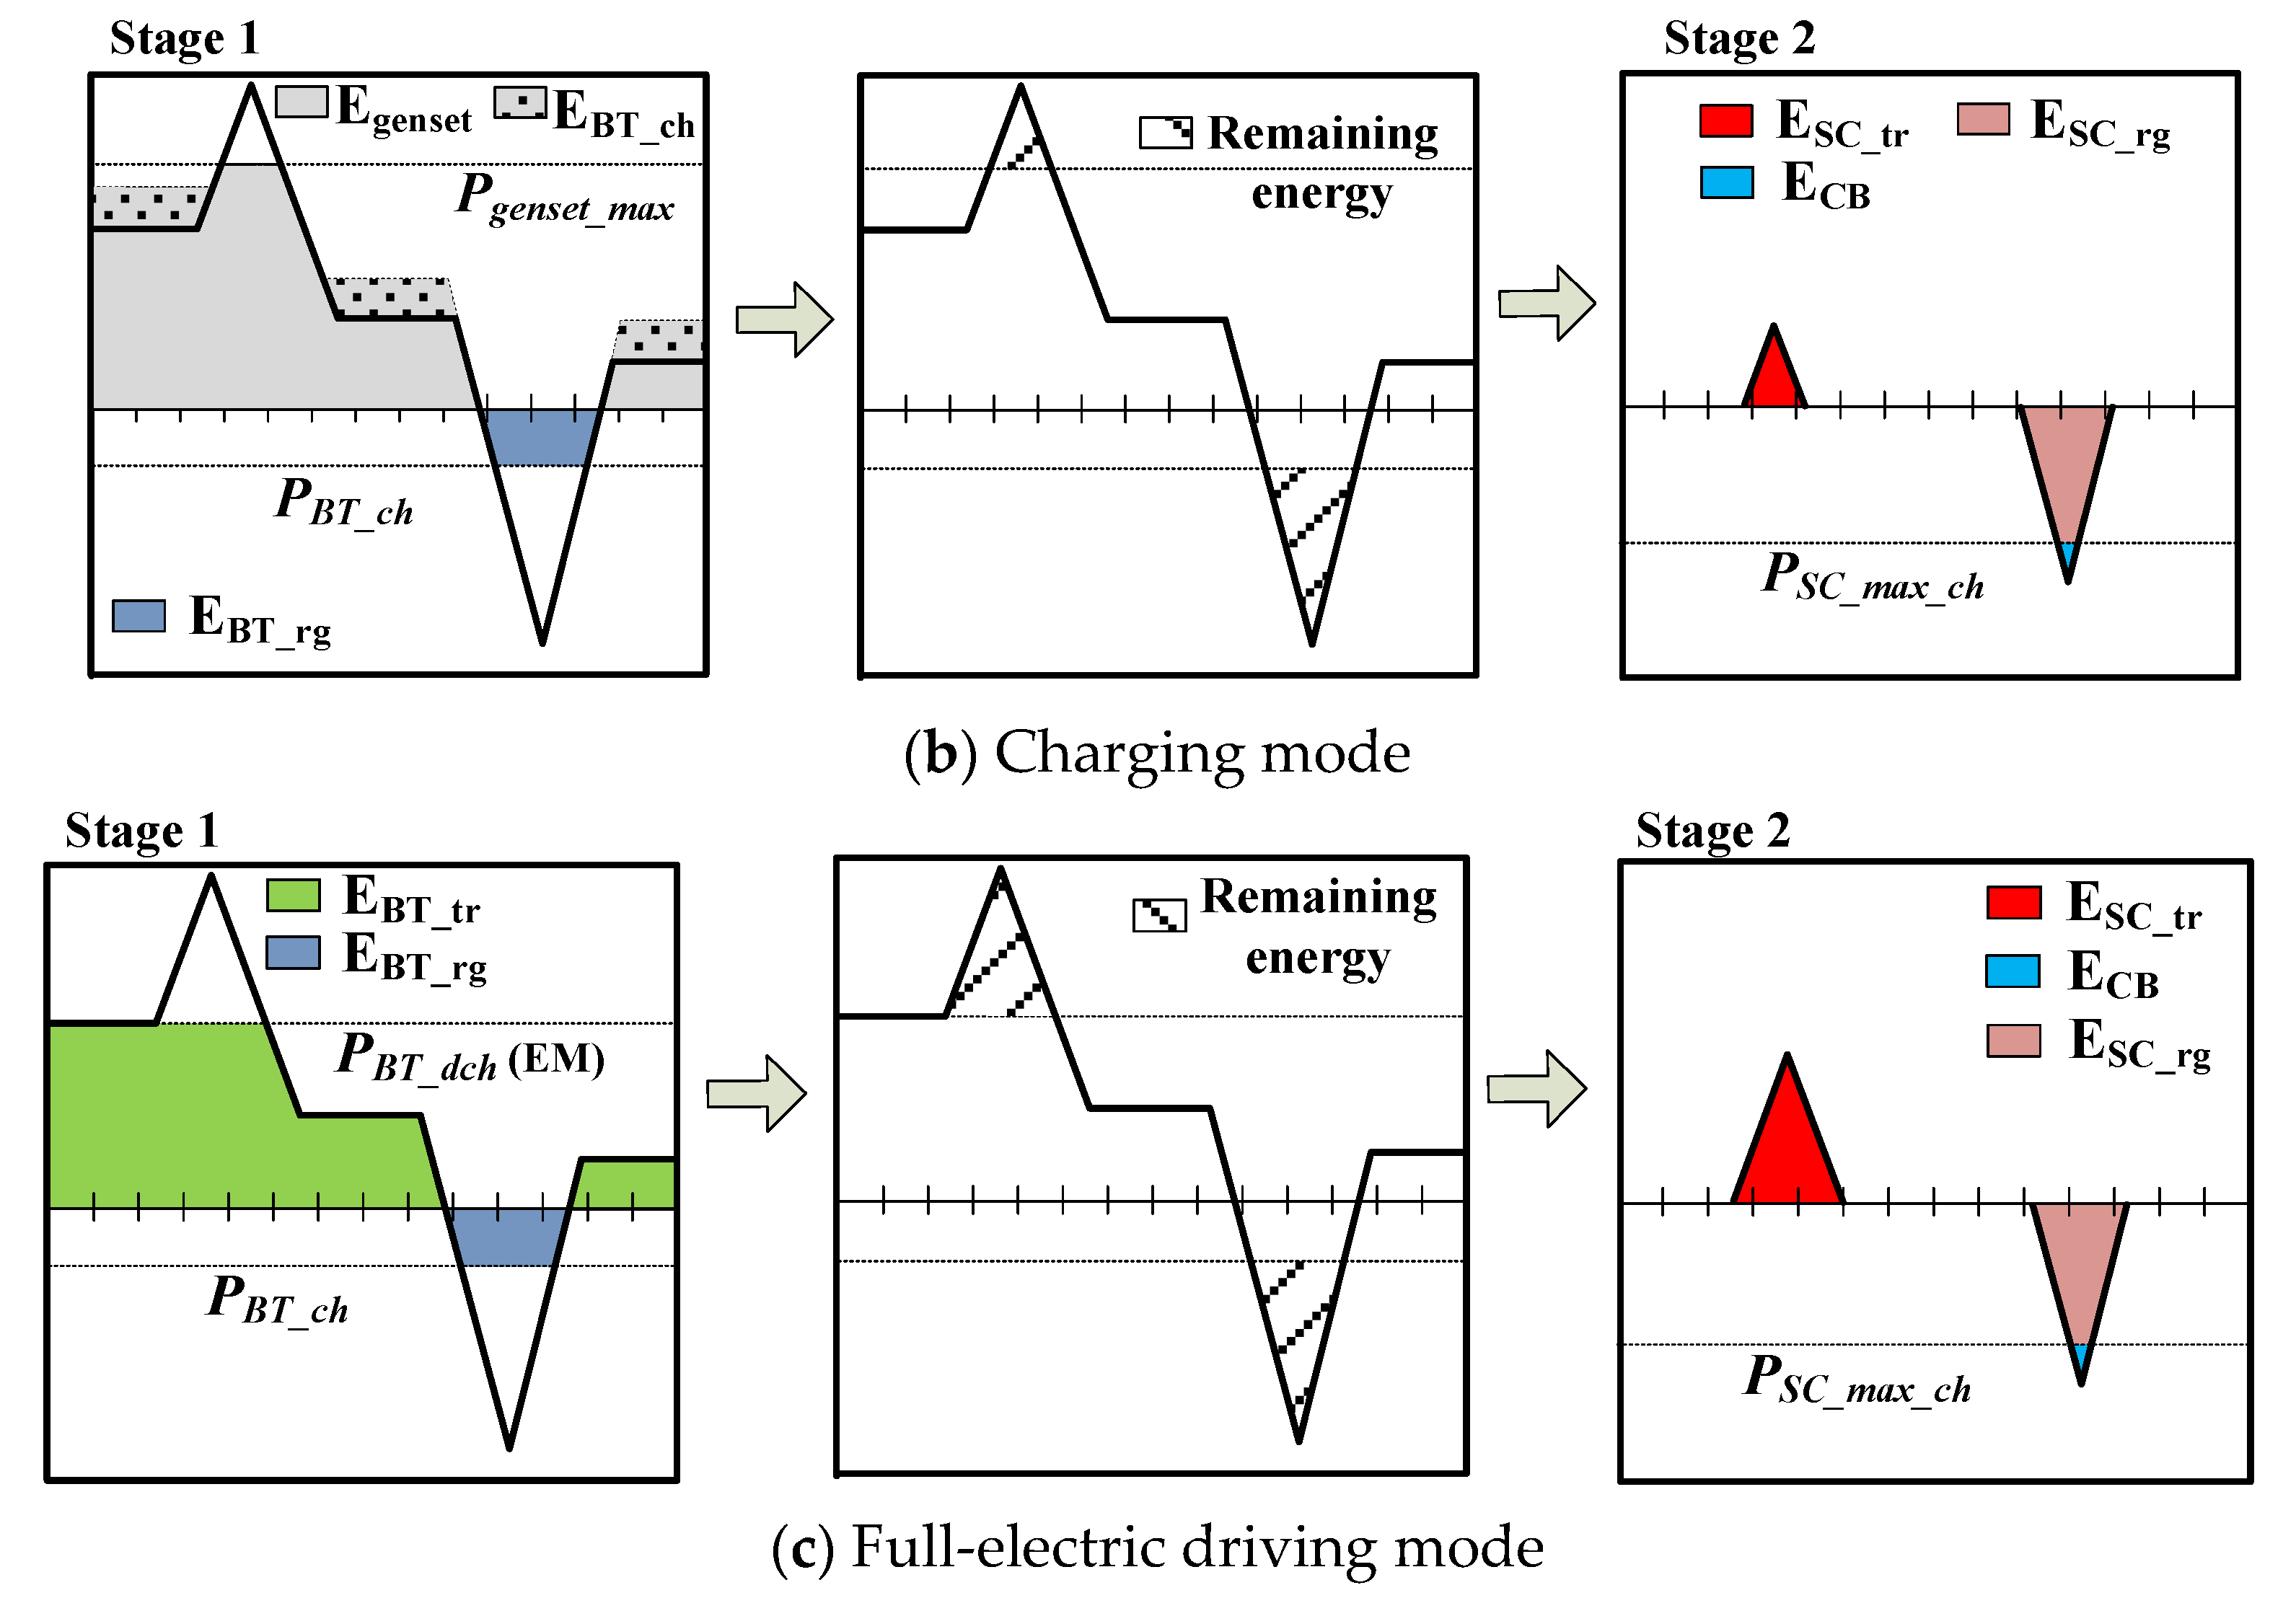
4.2. Full-Electric Driving Mode

In this mode, Figure 6c, only the dual ESS operates to propel the vehicle, while the genset is turned off. During a traction phase ( P D E M ( k ) 0 ), the power target P B T _ d c h (kW) (Equation (11)) was configured at the maximum optimal power target for discharging ( p d c h = p d c h _ E M ). In this case, p d c h _ E M represents the optimal ratio to configure Equation (12) when the vehicle is in charging mode. The remaining energy would then be supplied by the SC pack.
In a regenerative braking phase ( P D E M ( k ) < 0 ), the same power targets ( P B T _ c h (kW), P S C _ m a x _ c h (kW)) as in hybrid driving mode were applied.

5. Multi-Objective Optimisation Problem

To apply the MO optimisation to the proposed scenario, the fitness function that quantifies the score of each evaluated solution pursues finding the minimum operation costs for the SHEB as described in Equation (14):
m i n X Ω C T ( X ) = [ B T T c o s t ( X ) , S C T c o s t ( X ) ,   F u e l T c o s t ( X ) ]
where C T (€⁄day) represents the total operation cost of the SHEB; B T T c o s t ( X ) , S C T c o s t ( X ) , and F u e l T c o s t represent the economic models (described below) employed to estimate the operation cost of the BT pack, SC pack, and genset, respectively; and X is the vector containing the design variables in the proposed optimisation, Equation (15), subject to the constraints of the space of feasible solutions described in Equation (16).
X = [ S O C u _ c t r l ,   S O C l _ c t r l ,   P g e n s e t _ 1 ,   P g e n s e t _ 2 ,   p d c h _ D M ,   p d c h _ S M ,   p d c h _ E M ,   p c h _ C M ,   B B T ,   B S C ]
Ω = { 50 S O C u _ c t r l 95   [ % ] S O C u _ c t r l   40 S O C l _ c t r l 85   [ % ] S O C l _ c t r l   30 P g e n s e t _ 1 80   [ kW ] P g e n s e t _ 1   80 P g e n s e t _ 2 155   [ kW ] P g e n s e t _ 2   0 p d c h   ( D M ,   S M ,   E M ) ,   p c h ( C M ) 1   p d c h   ,   p c h 1 B B T 25   [ b r a n c h e s ] B B T   1 B S C 10   [ b r a n c h e s ] B S C  
In this scenario, the variables S B T and S S C were assumed to be constant in order to reach a battery pack voltage of 600   V and a supercapacitor voltage of 390   V . Thus, the dual ESS sizing optimisation will only consider the variation of energy capacity (number of branches: B S C , B B T ). The MO problem is solved by means of genetic algorithms (GA). The iterative process carried out by the GA is described in detail in [24].

Operation Cost of the Dual ESS

The total operation cost of the dual ESS was defined according to Equation (17) [15]. As can be observed, the term u refers to either the battery or the supercapacitor pack. Thus, the cost components corresponding to the battery and supercapacitor pack costs in Equation (14) were calculated equally according to the following equations.
u T c o s t = ( u M y + u C a y + u R e y ) / 360   u   ϵ   [ B T ,   S C ]
being u M y ( / year ) the annualised maintenance cost of the u pack. The annualised capital cost for the u pack u C a y   ( / year ) was defined as follows:
u C a y = ( C k W d c d c · P d c d c u + C k W h u · C a u ) · I · ( 1 + I ) T ( 1 + I ) T 1
being C k W d c d c (€/kW) the referential cost of the DC/DC converter; P d c d c u (kW) the power rate of the DC/DC converter; C k W h u (€/kWh) the referential cost of the considered u energy storage technology; C a u (kWh) the sizing of the u pack; and I (%) and T (years) the banking interest rate and the lifetime of the whole system (SHEB), respectively.
The annualised replacement cost (cycling cost) of the u pack, u R e y (€/year), was defined as follows:
u R e y = i = 1 c e i l ( T / L i f e u 1 ) [ C k W h u · C a u · I · ( 1 + I ) T ( 1 + I ) T + 1 ] · [ ( 1 + I ) i · L i f e u ]
where c e i l ( x ) rounds its argument x to the higher integer value; and L i f e u (years) is the lifetime estimation for the u pack provided by the corresponding lifetime model (as described in Section 3.2).

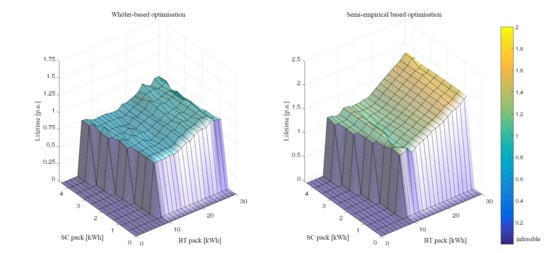
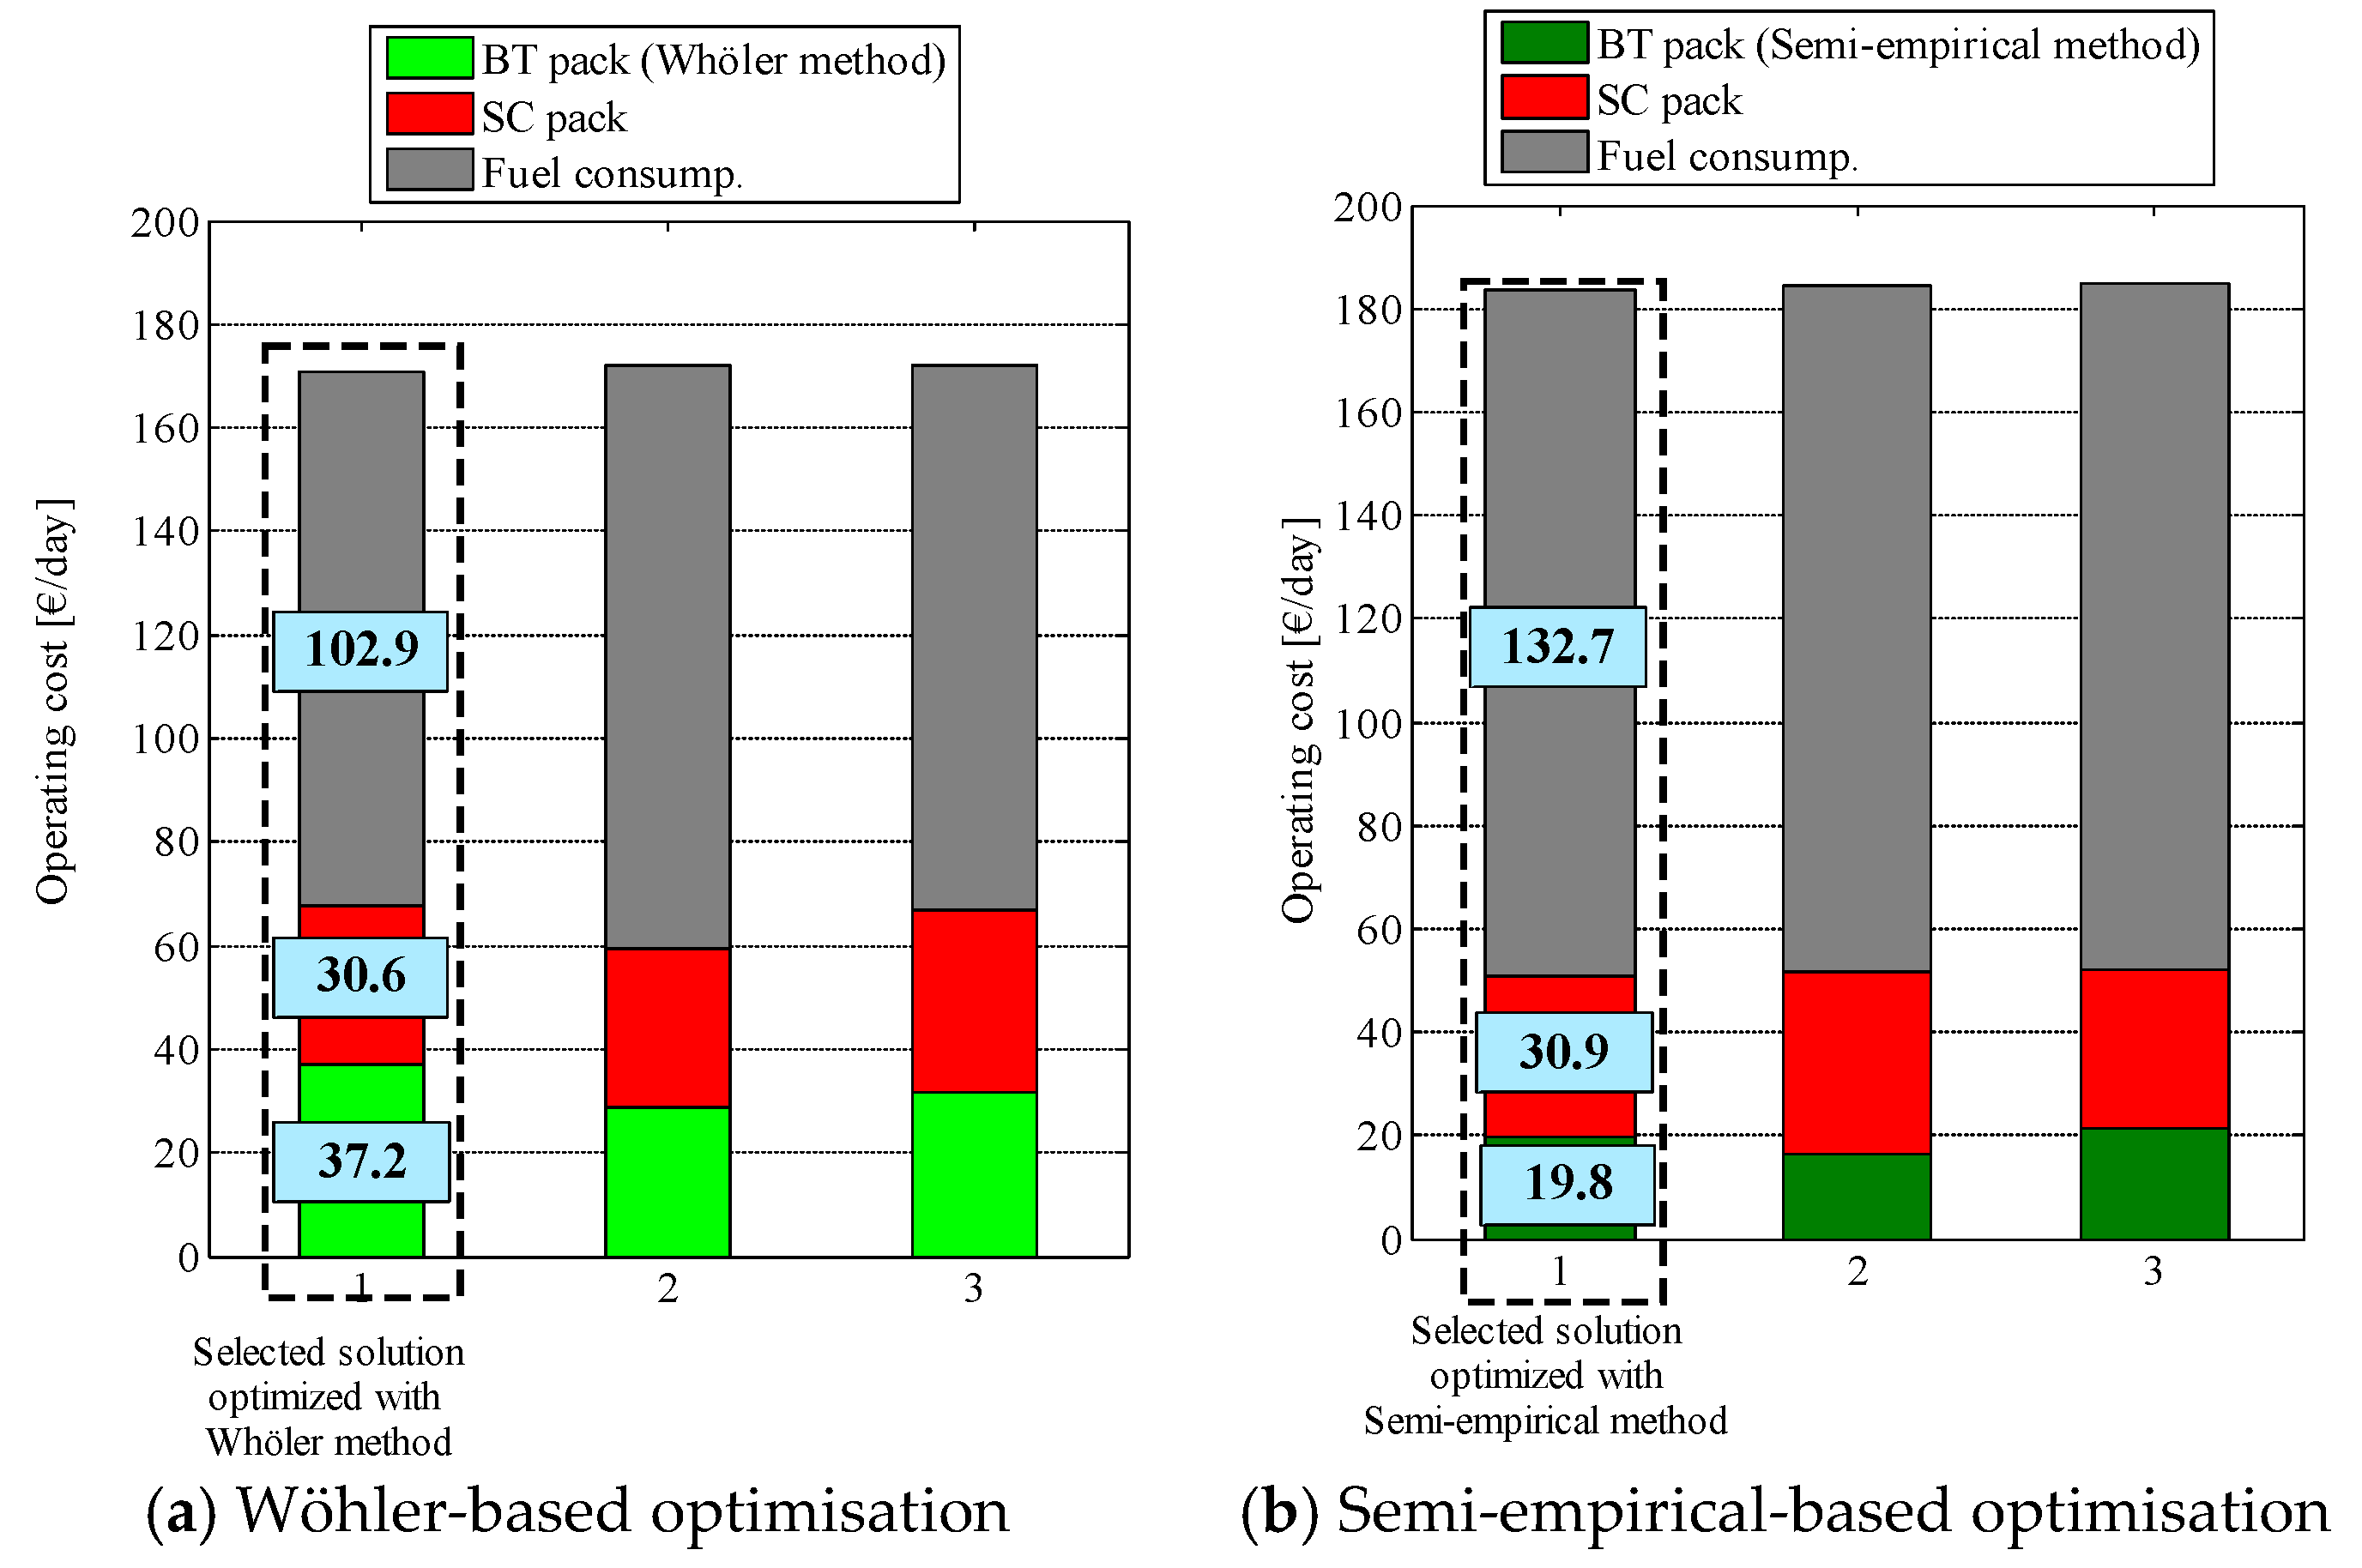
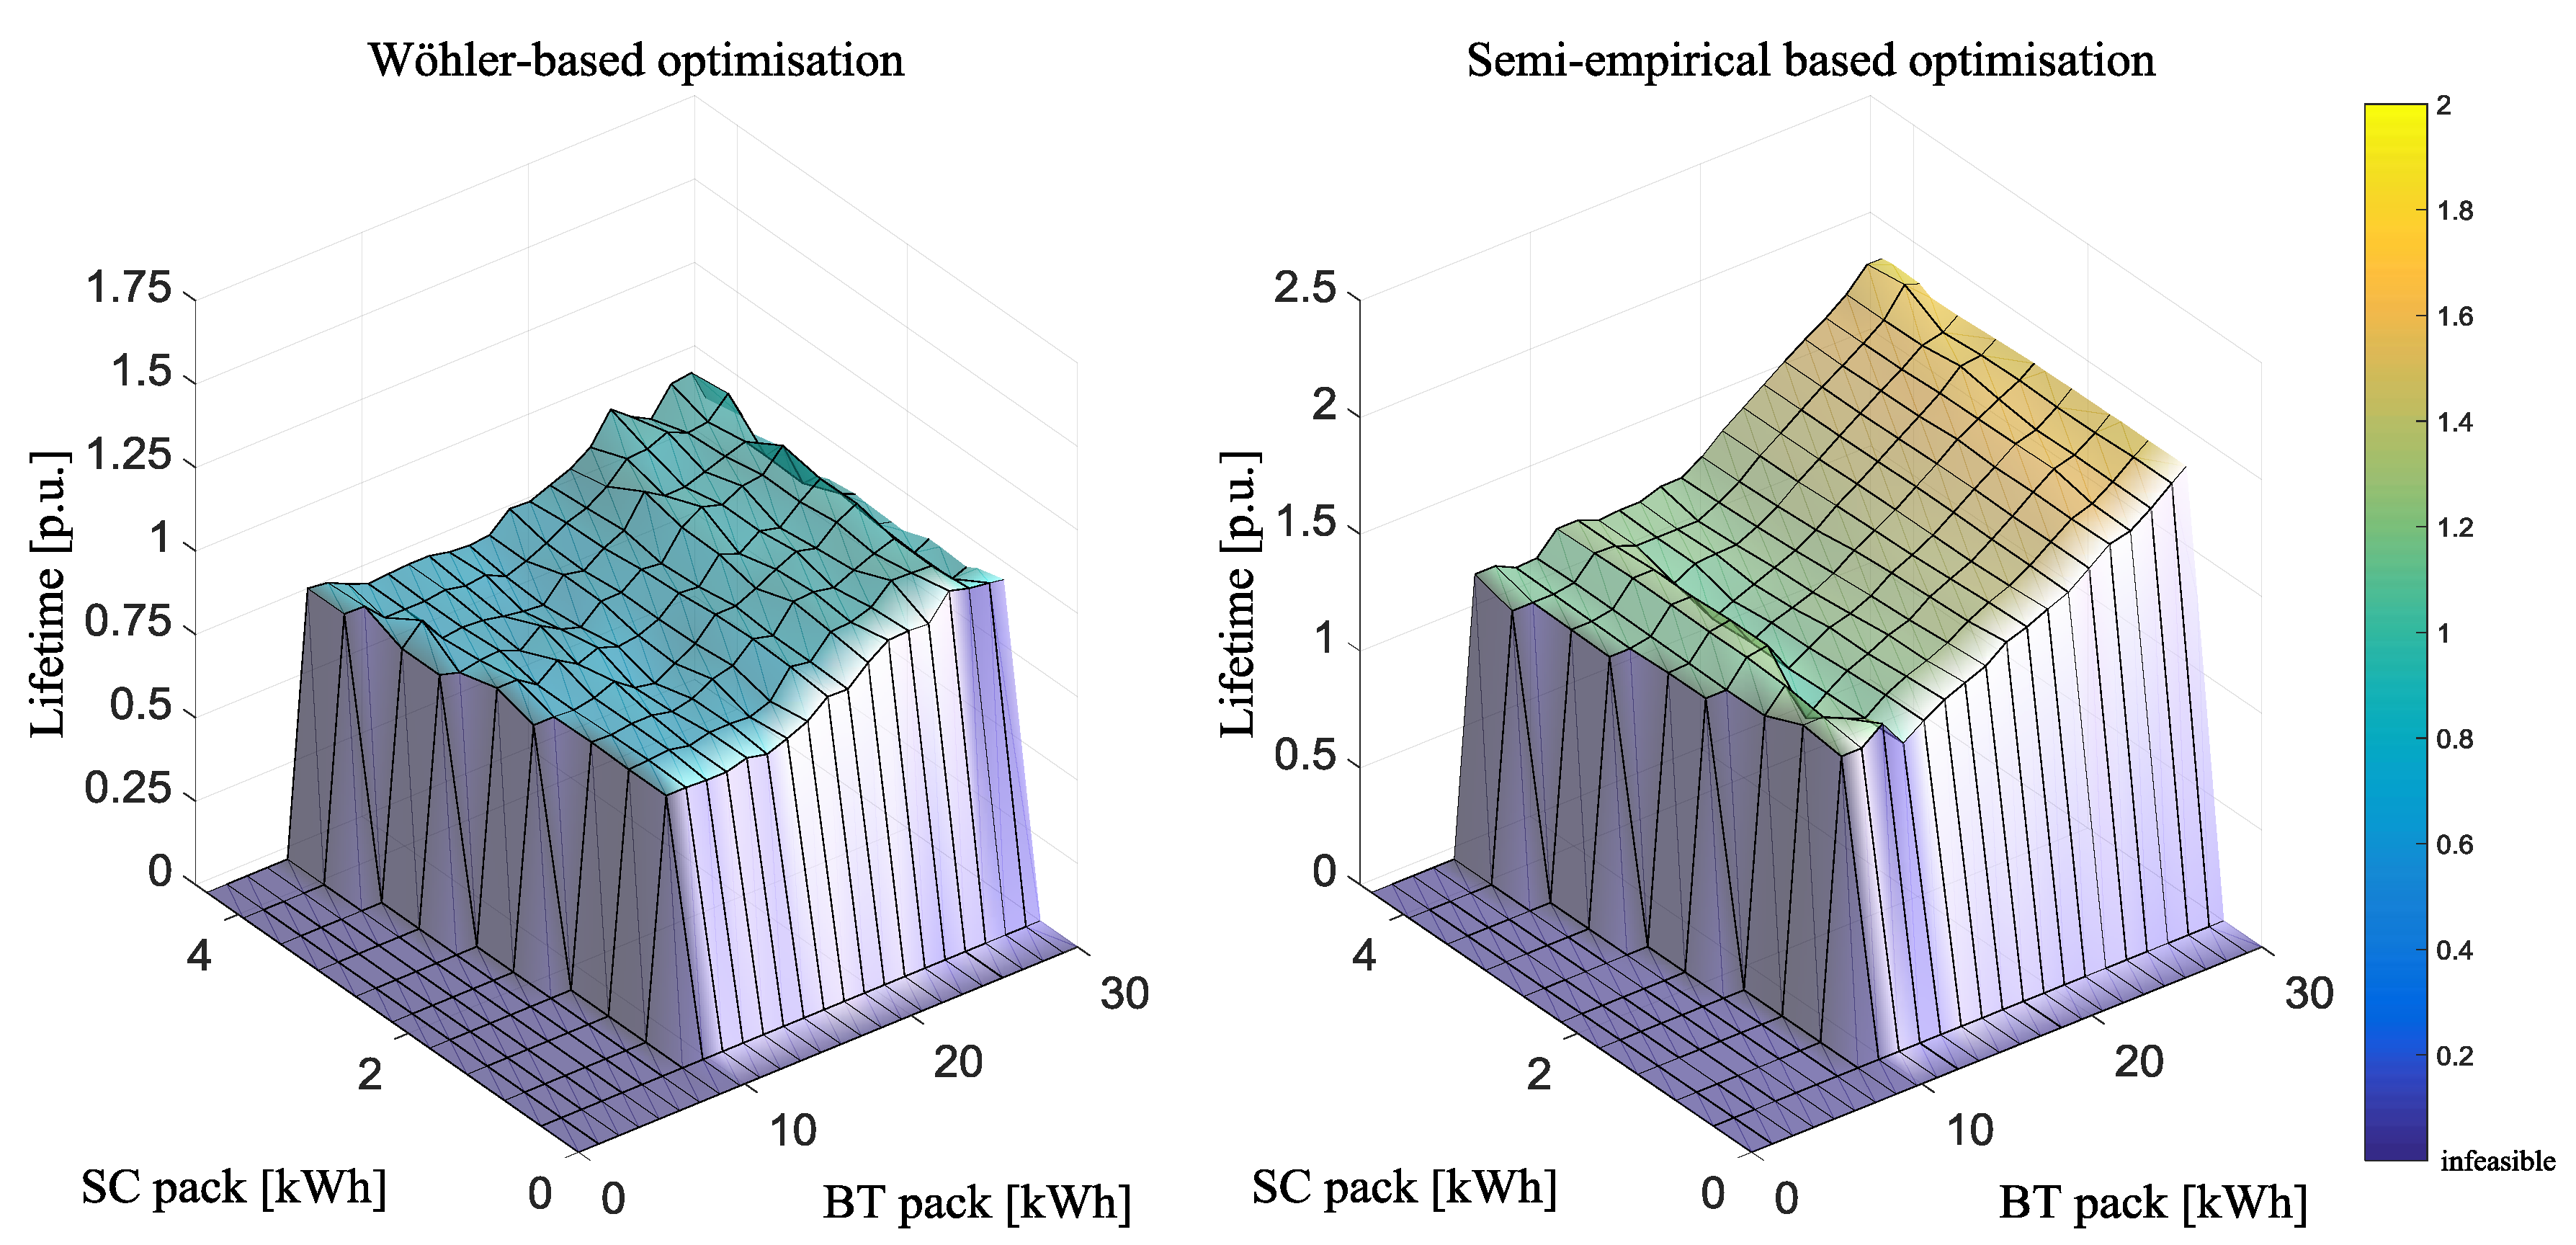
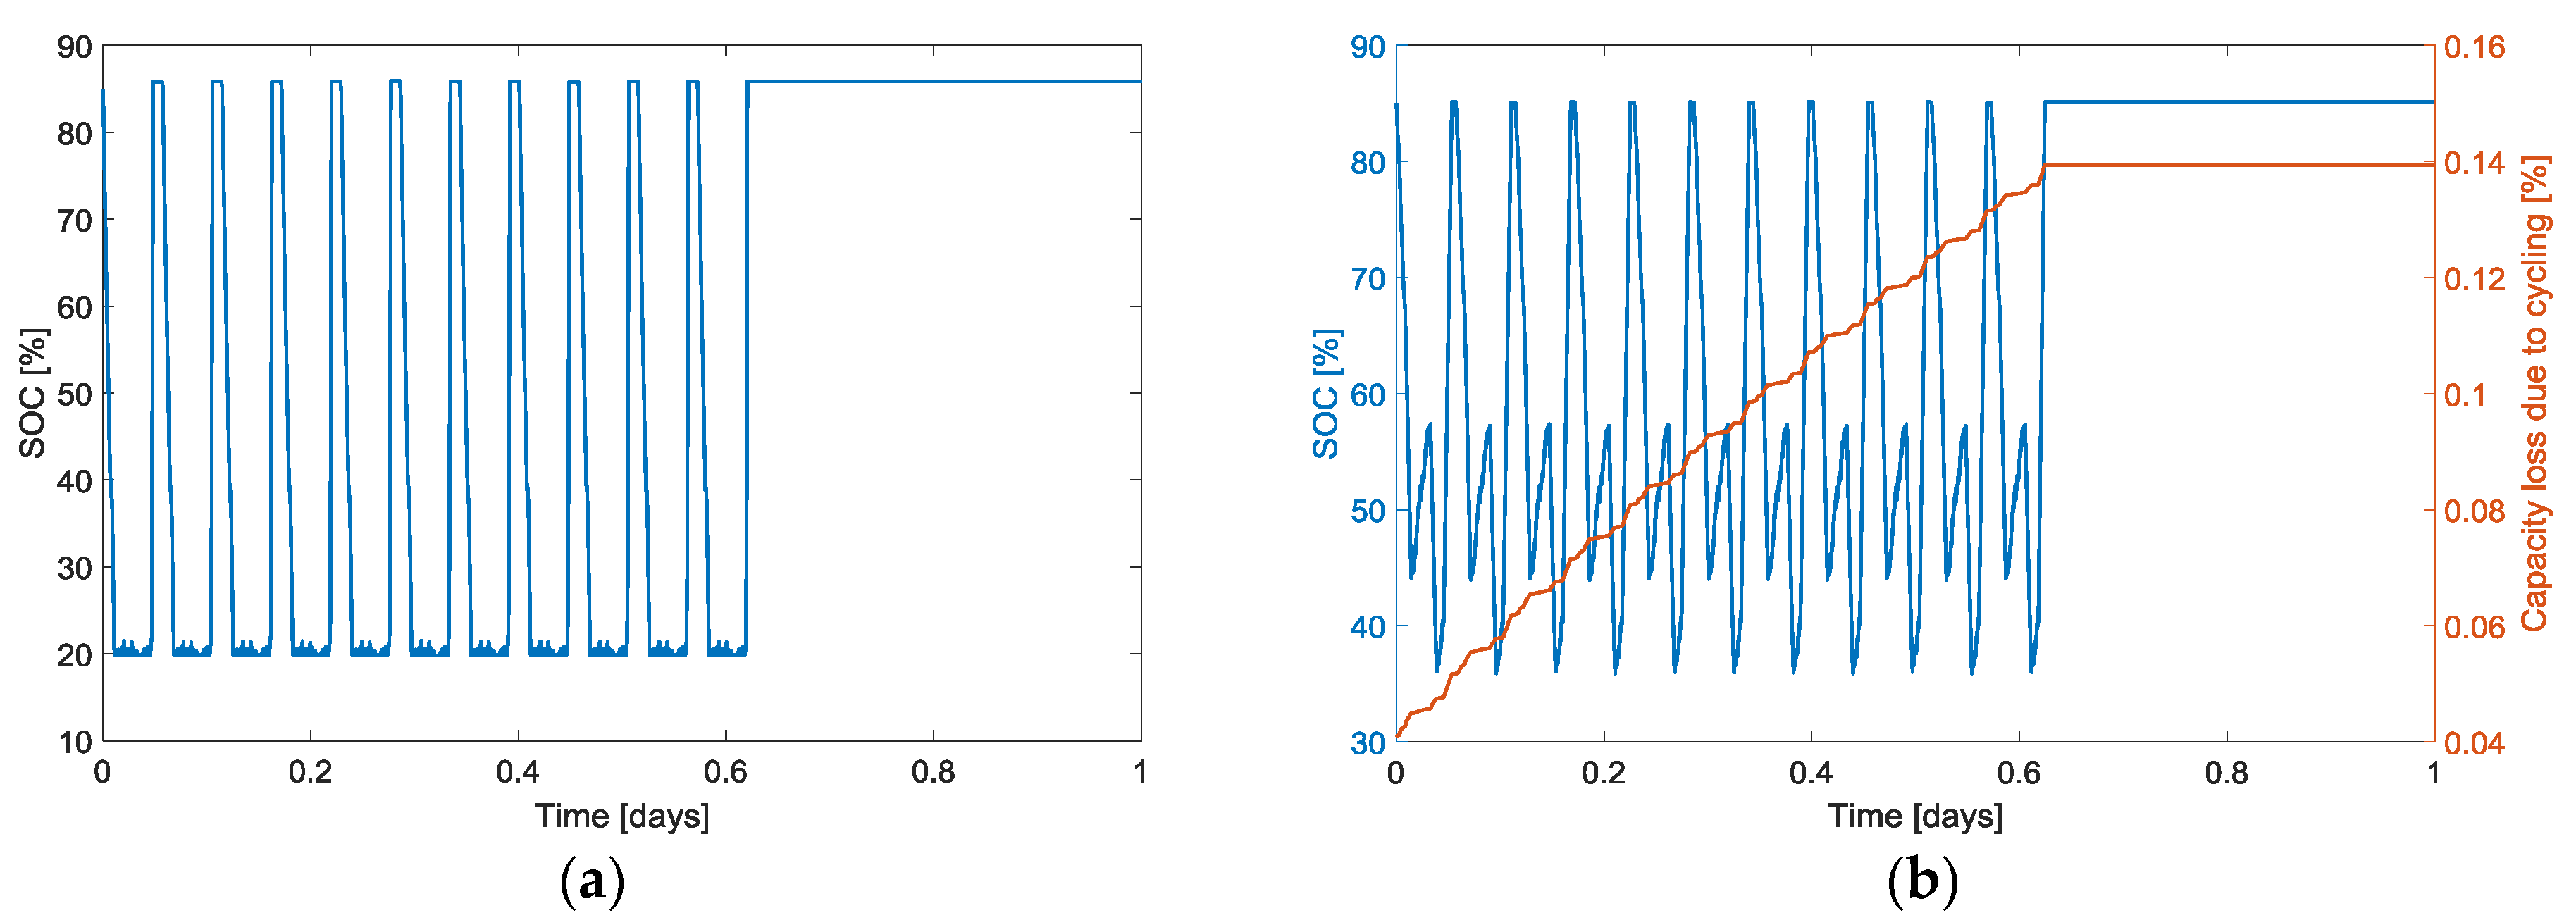
6. Results and Discussion

The optimisation of the operation constraints and the sizing of the dual ESS were performed considering the two different battery lifetime models described in Section 3.2. In the two cases, all the remaining elements of the modelled SHEB were unaltered, including the EMS, route, dual ESS electrical models, and the lifetime model employed to estimate the lifespan of the supercapacitor pack.
Figure 7 shows the three solutions selected from the Pareto front obtained in the optimisation with (a) the Wöhler-curve-based and (b) the semi-empirical lifetime models. The solution number 1 was selected as the most suitable solution for each of the two cases. Table 2 summarises the optimal set of values for the design variables assigned for the optimisations performed with each lifetime model.
In the case of the optimal solution calculated with the Wöhler-curve-based lifetime model, the dual ESS would be composed of a battery pack of 16.56 kWh (182S12P) and a supercapacitor pack of 0.86 kWh (144S2P). The operating costs of the SHEB would be ca. 170 €/day, being the daily costs of the batteries and supercapacitors 37.2 and 30.6 €/day, respectively. For the optimal solution calculated with the semi-empirical lifetime model, the selected sizing for the dual ESS would be composed of a battery pack of 13.80 kWh (182S10P) and a supercapacitor pack of 0.86 kWh (144S2P). In that case, the operating costs of the SHEB would be ca. 183 €/day, being the daily costs of the batteries and supercapacitors 19.8 and 30.9 €/day, respectively.
When the semi-empirical lifetime model was employed, the optimisation tended towards a smaller battery sizing. The lifetime of different battery and supercapacitor sizing solutions was evaluated in order to further explore the reasons behind such differences for the optimal case selection. The optimal set of constraints calculated for each selected optimal solution (one for each of the two lifetime models) was maintained while varying only the sizing of the dual ESS. Thereby, Figure 8 shows the variation in the battery lifetime estimation (for each of the two lifetime models) considering the operating conditions defined for each of the two selected optimal solutions. The obtained lifetime values were scaled on a p.u. basis, considering as reference value the lifetime estimated with the Wöhler-curve-based lifetime model (the solution with the greatest lifetime in the leftmost plot in Figure 8 is 1 p.u.).
The results in Figure 7 and Figure 8 revealed a significant influence of the selected lifetime model on the selection of the optimal solution. Indeed, the semi-empirical lifetime model provided significantly larger lifetime estimations. This allowed the optimisation to increase the operation constraints while maintaining a smaller dual ESS sizing compared to the optimal case calculated with the Wöhler-curve-based lifetime model.
As can be observed in Figure 9, the batteries are subjected to a repetitive SOC pattern in which deep BT charges and discharges dominate their degradation. In Figure 9b, it can be observed that in the case of the optimisation performed with the semi-empirical model a better exploitation of the batteries was imposed even when accounting for a smaller dual ESS sizing. On the contrary, in the case of the optimisation performed with the Wöhler-curve-based model, the optimal set of operation constraints forced the battery to operate in a saturated status in which the battery remained most of the time at low SOC levels. Moreover, several micro-cycles were performed in that region. The typical shape of the Wöhler curves provides a large amount of cycles at low DOD ranges, driving the optimisation to that zone of battery operation. However, experimental battery ageing labours at low DOD values are costly and time-consuming, and thus the reliability of any lifetime model in such an area is usually lower.
On the contrary, the used semi-empirical lifetime model was validated under several operating conditions, including micro-cycles [16]. Thus, the lifetime estimations obtained in the low DOD operation area are more accurate than those obtained with the Wöhler-curve-based lifetime model, and the optimisation was driven to other areas of battery operation in which an extended battery lifetime was achieved.
From the figures presented in this section, a significant impact of the lifetime model could be observed in the obtained optimisation results. Thereby, simplifications on the battery lifetime estimation, e.g., when using the widely referenced Wöhler-curve-based lifetime model, may yield inconvenient decisions on the battery sizing and operation strategy. This would certainly have an impact upon the system cost and performance, but most importantly it may even influence the business model definition and the cost structure and revenue streams.

7. Conclusions

In this paper, a thorough analysis of the influence of the battery lifetime model upon the optimisation results for ESS sizing and operation constraints was presented considering a SHEB as the case study.
The obtained results suggest a significant influence of the lifetime model’s accuracy on the costs associated with both the operation of the hybrid bus and the sizing of the BT and SC. A difference of up to ca. 8% on SHEB daily operation costs was estimated, depending on the employed lifetime model (170 €/day for Wöhler-based optimisation and 183 €/day for semi-empirical-based optimisation). Similarly, when only dual ESS costs were considered, a difference of ca. 25% was estimated depending on the employed lifetime model (67.8 €/day for Wöhler-based optimisation and 50.7 €/day for the semi-empirical-based optimisation).
According to the obtained results, and considering the strong impact of the ESS upon total system costs, a detailed and accurate evaluation of battery lifetime is crucial. Therefore, the use of an accurate battery lifetime model is advisable to gain full control of the system and its cost structures.

Author Contributions

Conceptualization, E.M.-L. and V.I.H.; Funding acquisition, A.M. and H.G.; Investigation, E.M.-L., V.I.H. and E.S.-Z.; Methodology, E.M.-L., V.I.H., and H.G.; Supervision, I.G., A.M., E.S.-Z., and H.G.; Validation, I.G. and E.S.-Z.; Writing (original draft), E.M.-L. and V.I.H.; Writing (review & editing), I.G., A.M., E.S.-Z., and H.G.

Funding

This research received no external funding.

Conflicts of Interest

The authors declare no conflicts of interest.

References

  1. Hu, X.; Johannesson, L.; Murgovski, N.; Egardt, B. Longevity-conscious dimensioning and power management of the hybrid energy storage system in a fuel cell hybrid electric bus. Appl. Energy 2015, 137, 913–924. [Google Scholar] [CrossRef]
  2. Luo, X.; Wang, J.; Dooner, M.; Clarke, J. Overview of current development in electrical energy storage technologies and the application potential in power system operation. Appl. Energy 2015, 137, 511–536. [Google Scholar] [CrossRef]
  3. Dimitrova, Z.; Maréchal, F. Techno-economic design of hybrid electric vehicles and possibilities of the multi-objective optimization structure. Appl. Energy 2016, 161, 746–759. [Google Scholar] [CrossRef]
  4. Shen, J.; Dusmez, S.; Khaligh, A. Optimization of Sizing and Battery Cycle Life in Battery/Ultracapacitor Hybrid Energy Storage Systems for Electric Vehicle Applications. IEEE Trans. Ind. Inform. 2014, 10, 2112–2121. [Google Scholar] [CrossRef]
  5. Masih-Tehrani, M.; Ha’iri-Yazdi, M.R.; Esfahanian, V.; Safaei, A. Optimum sizing and optimum energy management of a hybrid energy storage system for lithium battery life improvement. J. Power Sources 2013, 244, 2–10. [Google Scholar] [CrossRef]
  6. Song, Z.; Li, J.; Han, X.; Xu, L.; Lu, L.; Ouyang, M. Multi-objective optimization of a semi-active battery/supercapacitor energy storage system for electric vehicles. Appl. Energy 2014, 153, 212–224. [Google Scholar] [CrossRef]
  7. Xi, J.; Li, M.; Xu, M. Optimal energy management strategy for battery powered electric vehicles. Appl. Energy 2014, 134, 332–341. [Google Scholar] [CrossRef]
  8. Hu, X.; Murgovski, N.; Johannesson, L.; Egardt, B. Energy efficiency analysis of a series plug-in hybrid electric bus with different energy management strategies and battery sizes. Appl. Energy 2013, 111, 1001–1009. [Google Scholar] [CrossRef]
  9. Zakeri, B.; Syri, S. Electrical energy storage systems: A comparative life cycle cost analysis. Renew. Sustain. Energy Rev. 2015, 42, 569–596. [Google Scholar] [CrossRef]
  10. Fuchs, G.; Lunz, B.; Leuthold, M.; Sauer, D.U. Technology Overview on Electricity Storage; ISEA: Aachen, Germany, 2012. [Google Scholar]
  11. Barré, A.; Deguilhem, B.; Grolleau, S.; Gérard, M.; Suard, F.; Riu, D. A review on lithium-ion battery ageing mechanisms and estimations for automotive applications. J. Power Sources 2013, 241, 680–689. [Google Scholar] [CrossRef]
  12. Dufo-López, R. Optimisation of size and control of grid-connected storage under real time electricity pricing conditions. Appl. Energy 2015, 140, 395–408. [Google Scholar] [CrossRef]
  13. Pavković, D.; Hoić, M.; Deur, J.; Petrić, J. Energy storage systems sizing study for a high-altitude wind energy application. Energy 2014, 76, 91–103. [Google Scholar] [CrossRef]
  14. Aichhorn, A.; Greenleaf, M.; Li, H.; Zheng, J. A cost effective battery sizing strategy based on a detailed battery lifetime model and an economic energy management strategy. In Proceedings of the 2012 IEEE Power and Energy Society General Meeting, San Diego, CA, USA, 22–26 July 2012; pp. 1–8. [Google Scholar] [CrossRef]
  15. Herrera, V.; Milo, A.; Gaztañaga, H.; Etxeberria-Otadui, I.; Villarreal, I.; Camblong, H. Adaptive energy management strategy and optimal sizing applied on a battery-supercapacitor based tramway. Appl. Energy 2016, 169, 831–845. [Google Scholar] [CrossRef]
  16. Sarasketa-Zabala, E.; Martinez-Laserna, E.; Berecibar, M.; Gandiaga, I.; Rodriguez-Martinez, L.M.; Villarreal, I. Realistic lifetime prediction approach for Li-ion batteries. Appl. Energy 2016, 162, 839–852. [Google Scholar] [CrossRef]
  17. Herrera, V.I.; Saez-de-Ibarra, A.; Milo, A.; Gaztañaga, H.; Camblong, H. Optimal energy management of a hybrid electric bus with a battery-supercapacitor storage system using genetic algorithm. In Proceedings of the 2015 International Conference on Electrical Systems for Aircraft, Railway, Ship Propulsion and Road Vehicles (ESARS), Aachen, Germany, 3–5 March 2015; pp. 1–6. [Google Scholar]
  18. Sarasketa-Zabala, E.; Gandiaga, I.; Martinez-Laserna, E.; Rodriguez-Martinez, L.M.; Villarreal, I. Cycle ageing analysis of a LiFePO4/graphite cell with dynamic model validations: Towards realistic lifetime predictions. J. Power Sources 2015, 275, 573–587. [Google Scholar] [CrossRef]
  19. Facinelli, W.A. Modeling and Simulation of Lead-Acid Batteries for Photovoltaic Systems. Ph.D. Thesis, Arizona State University, Tempe, AZ, USA, 1983. [Google Scholar]
  20. Sauer, D.U.; Wenzl, H. Comparison of different approaches for lifetime prediction of electrochemical systems—Using lead-acid batteries as example. J. Power Sources 2008, 176, 534–546. [Google Scholar] [CrossRef]
  21. Sarasketa-Zabala, E. A Novel Approach for Lithium-Ion Battery Selection and Lifetime Prediction. Ph.D. Thesis, Mondragon University, Mondragón, Spain, 2014. Ik4-Ikerlan. [Google Scholar]
  22. Sarasketa-Zabala, E.; Gandiaga, I.; Rodriguez-Martinez, L.M.; Villarreal, I. Calendar ageing analysis of a LiFePO4/graphite cell with dynamic model validations: Towards realistic lifetime predictions. J. Power Sources 2014, 272, 45–57. [Google Scholar] [CrossRef]
  23. Herrera, V.I.; Milo, A.; Gaztañaga, H.; Camblong, H. Multi-Objective Optimization of Energy Management and Sizing for a Hybrid Bus with Dual Energy Storage System. In Proceedings of the 2016 IEEE Vehicle Power and Propulsion Conference (VPPC), Hangzhou, China, 17–20 October 2016; pp. 1–6. [Google Scholar]
  24. MathWorks. Fuzzy Logic Toolbox User’s Guide R2017a; The MathWorks, Inc.: Natick, MA, USA, 2017. [Google Scholar]
Figure 1. Series Hybrid Electric Bus powertrain configuration. BT, battery; SC, supercapacitor; AC, alternating current; DC, direct current; EM, electric motor; T, transmission; ICE, internal combustion engine; EG, electric generator; CB, crowbar.
Wevj 09 00028 g001
Figure 2. Speed profile for hybrid electric bus (HEB) operation.
Wevj 09 00028 g002
Figure 3. Battery and Supercapacitor pack configuration.
Wevj 09 00028 g003
Figure 4. Number of cycles versus Depth of Discharge (DOD) curve considered for the Whöler curve [21].
Wevj 09 00028 g004
Figure 5. Energy Management Strategy (energy modes) in hybrid driving mode.
Wevj 09 00028 g005
Figure 6. Power split strategy.
Wevj 09 00028 g006aWevj 09 00028 g006b
Figure 7. Optimisation results: (a) Wöhler-based and (b) Semi-empirical-based.
Wevj 09 00028 g007
Figure 8. Lifetime estimated for different battery and supercapacitor sizing values with the set of optimal operation constraints obtained with each of the two lifetime models considered. The lifetime is scaled in p.u. considering the maximum lifetime obtained for the Wöhler-based optimisation.
Wevj 09 00028 g008
Figure 9. Comparison of the daily battery operation profile for the optimal solutions calculated: (a) with the Wöhler-curve-based and (b) semi-empirical lifetime models.
Wevj 09 00028 g009
Table 1. Electrical parameters of the BT and SC base cells [15].
BT (LFP 2.3Ah 26650-Type)SC (BCAP3000)
Nominal voltage3.3 VNominal voltage2.7 V
Nominal capacity2.3 AhNominal capacitance3000 F
DC internal resistance R i n t ( S O C B T ) DC internal resistance0.29 mΩ
Max C rate disch./ch.3.5/3.5--
Gravimetric Energy Density108 Wh/kgGravimetric Energy Density6.0 Wh/kg
Number of cells in series (pack)182Number of cells in series (pack)144
DC/DC converter rating50 kWDC/DC converter rating150 kW
LFP: Lithium Iron Phosphate.
Table 2. Optimal solution selected for the two optimisation cases.
VariableWöhler-Based OptimisationSemi-Empirical-Based Optimisation
S O C u _ c t r l (%)6693
S O C l _ c t r l (%)3944
P g e n s e t _ 1 (kW)5363
P g e n s e t _ 2 (kW)83124
p d c h _ D M (kW)7871
p d c h _ S M (kW)8125
p d c h _ A M (kW)2130
p c h _ C M (kW)8177
B B T (-)1210
B S C (-)22

