Article

Active and Reactive Power Scheduling of Distribution System Based on Two-Stage Stochastic Optimization

1
Shaoxing Power Supply Company, State Grid Zhejiang Electric Power Co., Ltd., Shaoxing 312000, China
2
School of Automation, Nanjing University of Science and Technology, Nanjing 210094, China
*
Author to whom correspondence should be addressed.
World Electr. Veh. J. 2025, 16(9), 515; https://doi.org/10.3390/wevj16090515
Submission received: 14 July 2025 / Revised: 6 September 2025 / Accepted: 9 September 2025 / Published: 11 September 2025

Abstract

With the large-scale integration of distributed resources into the distribution network, such as wind/solar power and electric vehicles (EVs), the uncertainties have rapidly increased in the operation optimization of the distribution network. In this context, it is of great practical interest to ensure the security and economic operation of the distribution network. This paper addresses this issue and makes the following contributions. Firstly, a two-stage stochastic rolling optimization framework for active–reactive power scheduling is established. In the first stage, it dispatches the active power of distributed resources. In the second stage, it optimizes the reactive power compensation based on the first-stage scheduling plan. Secondly, the simulation-based Rollout method is proposed to obtain the improved active power dispatching policy for cost optimization in the first stage. Meanwhile, the aggregated power of EVs can be determined based on the mobility and charging demand of EVs. Thirdly, based on the aggregated power of EVs, a scenario-based second-order cone programming is applied to perform the rolling optimization of reactive power compensation for voltage performance improvement in the second stage. The numerical results demonstrate that this method can effectively improve the economic operation of the distribution network while enhancing its operational security by leveraging the charging elasticity of EVs.

1. Introduction

With the increasing demand for renewable energy, distributed wind and solar power generation have attracted much attention in recent years and are now a core component for the transformation of the power system, especially in the distribution network [1]. Integrating distributed wind and solar power into distribution networks not only helps reduce dependence on fossil fuels and lower carbon emissions but also enhances the flexibility and diversity of the power supply in the distribution network.
On the other hand, on the demand side of the distribution network, electric vehicles (EVs) have characteristics such as low carbon emissions and environmental pollution, and have gradually become an important load type in the distribution network. Since EVs can be considered mobile energy storage, their energy storage capacity provides a new means of regulation for the distribution network [2]. Through Vehicle-to-Grid (V2G) technology, EVs can feed electricity back into the grid during the discharging process, thereby helping to balance supply and demand, stabilize the voltage of the distribution network, and enhance the operational stability of the distribution network [3].
Although integrating distributed wind/solar power and EVs into the distribution network brings many advantages, the uncertainties and volatility of these distributed resources also pose challenges to the operation and control of the distribution network. For example, the fluctuation of wind/solar power, as well as the uncertainty of the charging duration and required energy for EVs, may lead to frequency and voltage fluctuations in the distribution network. This in turn affects the stability of the power system [4]. Therefore, in order to enhance the economic and secure operation of the distribution network, this paper primarily studies active and reactive power scheduling considering the integration of distributed wind/solar power and EVs into the distribution network.
The main difficulties of the aforementioned problem are as follows: The first is the temporal coupling of active and reactive power scheduling in the distribution network. Due to the time-coupling nature of power scheduling processes such as the charging and discharging process of EVs and energy storage, the power scheduling of the distribution network is a multi-stage optimization problem where the current decision influences the operational performance of the distribution network in the future. The second is the spatial coupling of active and reactive power scheduling in the distribution network. Since EVs may transfer between different nodes in the distribution network, the number of controllable EVs will dynamically change at each node. Meanwhile, the power flow between nodes is interrelated to ensure voltage performance. The final difficulty is stochastic optimization with a large number of discrete decision variables. Due to the large number of EVs in the distribution network, their charging and discharging decisions will bring about a large number of discrete decision variables. Moreover, due to the uncertain future outputs of wind/solar power and charging demands, power scheduling is also a stochastic optimization problem which is difficult to solve.
The power scheduling of the distribution network has been one of the important research topics in recent years. Its goal is to improve the operational efficiency of the distribution network, reduce energy consumption, and ensure its operational reliability and stability. Currently, the existing literature on the power scheduling models of the distribution network can be divided into three categories. The first category is the economic dispatch model. This model mainly considers the optimization of active power resources with the objective function of minimizing system operation costs or maximizing profits. In [5], the authors analyze the improvement in the operational profits of the distribution network after the integration of a power-to-gas plant. In [6], the authors address the unit commitment problem considering the integration of distributed renewable energy into the distribution network, which can reduce the operational costs of the distribution network through multi-stage stochastic dual dynamic programming. The second category is the operational security model. Compared to the first category, which focuses on economic operation, this model pays more attention to the reliability of the distribution network, such as power loss and transmission loss. In [7], the authors address the operational security issue of the distribution network considering the integration of EVs. The voltage quality of the distribution network can be ensured based on distributed model predictive control. In [8], the authors consider the optimal siting and sizing problem of high-proportion distributed generation resources in the distribution network. It reduces the line losses and harmonics through genetic algorithms. In [9], it is used to propose a novel fuzzy inference system enhanced data integrity attack recovery framework to counteract the potential adverse effect of driving the power system into an uneconomic operation state. The third category combines the aforementioned two models and considers both economic and security aspects during the power scheduling of the distribution network. In [10], the authors address the optimal scheduling problem of the distribution network considering the integration of distributed renewable energy and hydrogen storage. The optimization objectives include the operational cost, energy loss, reliability, and flexibility. In [11], the authors propose a bi-level scheduling model. The upper level optimizes the siting and capacity of energy storage to reduce the operational cost of the distribution network, while the lower level controls the charging and discharging process of energy storage to minimize energy losses in the distribution network. With the integration of large-scale EVs into the distribution network, the uncertainties and spatio-temporal variations in charging demand further increase the modeling complexity for the distribution network. In order to overcome the difficulties incurred by the integration of large-scale EVs, EV aggregation is usually applied in the existing literature. In [12], the authors propose a safe deep reinforcement learning method for the low-carbon scheduling of EV aggregators in a distribution network. In [13], the authors develop an analytical polytope approximation EV aggregation model to participate in the day-ahead power scheduling of a distribution network. In [14], the authors propose a low-carbon ADMM-based scheduling strategy considering the EV aggregation, distribution system operator, and load aggregator. However, few of these studies consider stochastic optimization for both uncertainties in distributed renewable energy and EVs. Furthermore, most of the existing studies focus on optimization for EV aggregators, and joint economic and secure operation optimization for the distribution network is usually neglected.
The economic and secure operation of the distribution network involves complex power flow constraints, a large amount of uncertain charging demand, and distributed renewable energy. This brings in high solution complexity for the above model. Currently, the solution methods for the above model can be divided into three categories. The first category is intelligent optimization algorithms, such as GA (Genetic Algorithm) [8] and PSO (Particle Swarm OPtimization) [11]. These algorithms have no strict requirements for the mathematical models and can handle complex, high-dimensional, and nonlinear models. However, since they primarily depend on population-based iterative evolution to search for the optimal solution, they suffer from time-consuming optimization issues. The second category is traditional operation research optimization methods. In [15], the authors model the distribution network’s secure operation problem as a MILP problem for solving. In [16], the authors use cone programming to solve the optimal power flow problem in an active distribution network. These methods linearize the scheduling model to speed up solving. However, these methods have requirements for the structural characteristics of the power scheduling model. The third category is deep reinforcement learning methods, such as classical DQN (Deep Q-network) [17], PPO (Proximal Policy Optimization) [18], and MADDPG (Multi-agent Deep Deterministic Policy Gradient) [19]. Based on the strong function fitting capability of deep neural networks, they can solve various complex economic and secure operation models of distribution networks. However, these methods usually suffer from needing large amounts of data and time-consuming training, and the decision-making process being unexplainable.
Based on the above discussion, this paper studies the economic and secure operation problem of the distribution network considering a large amount of movable random charging demand and uncertain distributed wind/solar power. This paper mainly makes the following contributions to addressing the above issue:
  • For the active and reactive power scheduling problem of the distribution network, a two-stage stochastic rolling optimization framework is proposed to reduce the model solution difficulty. By decoupling active and reactive power scheduling, the first stage performs active power dispatch by considering the energy exchange between different nodes with multi-energy, while the second stage performs reactive power compensation based on the first-stage scheduling plan.
  • For the active power dispatch at the first stage, the elastic scheduling capacity of EVs at each node is obtained through the aggregation of EV charging demand considering the random and nonlinear mobility of EV charging demand. Then, a simulation-based Rollout method is proposed to improve the active power dispatch policy of the distribution network in an online fashion which can achieve operational cost optimization.
  • For the reactive power compensation at the second stage, a scenario-based second-order cone programming method is proposed to achieve the stochastic rolling optimization for the voltage performance improvement of the distribution network based on the optimized aggregated total power of EVs. Numerical experiments demonstrate that the proposed method can achieve economic and secure optimization of the distribution network.
Table 1 summarizes the main differences between the proposed work and related work. The comparisons include whether the economic dispatch, operation security, uncertain DG (Distributed Generation), uncertain charging demand, and EV aggregation are considered in the paper. In general, the existing work only considers some of these factors, while the proposed work studies the economic and secure scheduling of the distribution network considering the uncertain DG and EV charging demand with EV aggregation. This is barely considered in the literature. Furthermore, a two-stage stochastic rolling optimization method is proposed to reduce the solution difficulty of the proposed problem by active and reactive power decoupling.
The rest of the paper is organized as follows. Section 2 introduces the two-stage stochastic rolling optimization model for the distribution network. Section 3 introduces the two-stage stochastic rolling optimization method. Section 4 discusses the numerical experimental results. Section 5 provides a discussion, and Section 6 provides a brief summary.

2. Problem Formulation

This paper considers a typical active and reactive power scheduling scenario as shown in Figure 1. Taking the IEEE 33-bus distribution network as an example [20], it is assumed that there exists multi-type supply and demand at each node of the distribution network. Each node consists of base load, distributed wind/solar power generation, energy storage, and EVs. In the figure, nodes #19, #8, and #15 are equipped with distributed wind/solar power, energy storage, and EVs for illustration. At the same time, to achieve reactive power compensation, some nodes in the distribution network are equipped with static VAR compensators (SVCs). In the figure, node #31 is equipped with SVC for illustration. Note that the other nodes can also be equipped with SVC based on the actual scenario. As EVs may transfer between different nodes, such as residential areas and working areas, and the charging demand and distributed wind/solar power generation are stochastic, the distribution system operator needs to make decisions on the trading power between each node, the energy storage, and the EV charging and discharging power in order to minimize the overall operational costs of the distribution network. At the same time, in order to ensure the voltage performance and improve the secure operation capability of the distribution network, the distribution system operator is also responsible for the control of EV charging/discharging behaviors and the reactive power compensation of SVCs at each node.  
In the following, we first introduce the stochastic rolling optimization model for the active and reactive power scheduling. Then, by the decoupling of active and reactive power scheduling, we introduce the active power dispatch model in the first stage and reactive power compensation model in the second stage, respectively.

2.1. Stochastic Rolling Optimization Model for Power Scheduling

Suppose there are K nodes in the distribution network. Each node (bus) is represented by the index k where k = 1 , 2 , , K . The objective function for active and reactive power scheduling is denoted as follows:
max p τ , k b , z τ , n , p τ , k k , q τ , k c J = E { τ = t t + T 1 k = 1 K [ λ τ e x p τ , k e x Δ t + ( λ τ e v λ e v , s ) p τ , k e v Δ t λ τ g p τ , k g Δ t λ τ w p τ , k w Δ t λ τ s p τ , k s Δ t ω | V τ , k 1 | ] }
where J denotes the total operation profit of the distribution network from the current decision time t to future time t + T 1 ; p τ , k b denotes the charging ( p τ , k b > 0 ) and discharging ( p τ , k b < 0 ) power of the energy storage at the k-th node at time τ ; z τ , n denotes the charging ( z τ , n = 1 ), discharging ( z τ , n = 1 ), or idle (( z τ , n = 0 )) action for the n-th EV at time τ ; p τ , k k denotes the provided power from the k -th node to the k-th node; and q τ , k c denotes the compensation power of the SVC at node k. In (1), p τ , k , z τ , n , p τ , k k , and q τ , k c are the main decision variables. As there exist uncertainties in the distributed wind/solar power and EV charging, there is an expectation operator E in the objective function. In the right equation of (1), λ τ e x p τ , k e x Δ t denotes the operation profit earned by providing power to other nodes, where λ τ e x denotes the price for exchange power, p τ , k e x denotes the total power provided by the k-th node, and Δ t denotes the time interval. λ τ e v p τ , k e v Δ t denotes the charging earnings from providing a charging service to EVs or the discharging cost from requiring a discharging service from the EVs. λ e v , s denotes the additional subsidized price for EVs to permit charging/discharging control. This can increase the participation enthusiasm for EVs. λ τ g p τ , k g Δ t , λ τ w p t , k w Δ t , and λ τ s p τ , k s Δ t denote the operation cost for power purchasing from the grid, distributed wind power generation, and distributed solar power generation, respectively. Similarly, λ τ e v , λ τ g , λ τ w , and λ τ s denote the corresponding unit price and p τ , k e v , g τ , k , p t , k w , and p τ , k s denote the aggregated EV charging/discharging power, purchasing power from the gird, distributed wind power, and distributed solar power, respectively. Note that p τ , k e v will be positive when the aggregated power of EV is charging; else, p τ , k e v will be negative, which means the aggregated discharging behavior that will bring about operation cost. The last term of the right equation in (1) denotes the voltage performance, where V τ , k denotes the per-unit value of voltage for the k-th node at time τ and ω denotes the weighting parameter.
For the above objective function of the active and reactive power scheduling problem, there exist several constraints, which are shown below,
(1) Power flow constraints. For each branch and node in the distribution network, the following constraints must be satisfied:
V τ , j 2 = V τ , i 2 2 ( r i , j P τ , i j + x i , j Q τ , i j ) + ( r i , j 2 + x i , j 2 ) I τ , i j 2
p τ , j = P τ , i j r i , j I τ , i j 2 k : j k P τ , j k
q τ , j = Q τ , i j x i , j I τ , i j 2 k : j k Q τ , j k
I τ , i j 2 = P τ , i j 2 + Q τ , i j 2 V τ , i 2
where V τ , j and V τ , i are the voltages of nodes j and i at time τ , respectively; r i , j and x i , j are the real and imaginary parts of the impedance for the i j branch; P τ , i j and Q τ , i j are the active and reactive power for the i j branch at time τ ; I τ , i j denotes the current for the i j branch at time τ ; and p τ , j and q τ , j denote the active and reactive injected power of node j at time τ .
(2) Distributed generation constraints. For the generation of distributed wind and solar power, there exist the following constraints:
p ¯ τ , k w = p w , c , v r < v τ , k v co p w , c ( v τ , k v r ) 3 , v ci v τ , k v r 0 , otherwise
p ¯ τ , k s = p s , c ψ s ( I τ , k I s )
0 p τ , k w p ¯ τ , k w , 0 p τ , k s p ¯ τ , k s
where p ¯ τ , k w and p ¯ τ , k s denote the generated distributed wind and solar power for the k-th node at time τ , respectively; p w w , c and p s , c denote the wind and solar generation capacity, respectively; v τ , k denotes the wind speed at the k-th node; v ci / v co / v r denote the cutin, cutout, and rated speed, respectively; ψ s denotes the generation efficiency for the distributed solar power; and I τ , k and I s are the current and standard solar radiation intensity of the k-th node, respectively. In (8), the actual utilization of distributed wind and solar power is regulated to stay within the generated power at each time.
(3) Injected power constraints. For each node in the distribution network, there exist the following constraints for the injected power:
p τ , j = p τ , j w + p τ , j s + p τ , j g p τ , j e x p τ , j e v p τ , j b p τ , j d
q τ , j = q τ , j g + q τ , j c q τ , j d
where q τ , j g denotes the reactive power corresponding to p τ , j g , q τ , j c denotes the compensation power of the SVC, and p τ , j d / q τ , j d denote the active/reactive load of node j at time τ , respectively.
(4) Exchange power constraints. In order to improve the operation efficiency of the distribution network, the nodes in the distribution network can exchange power with each other. Therefore, there exist the following constraints:
p τ , k j p τ , j k = 0 , p τ , k k = 0
p τ , j e x = k = 1 K p τ , j k
0 p τ , k j max ( 0 , p τ , k w + p τ , k s p τ , k e v p τ , k b p τ , k d )
In (11), bi-directional energy exchange between two nodes or a node with itself in the distribution network is avoided. Equation (12) denotes the total exchange energy provided by the j-th node in the distribution network. Equation (13) stipulates that the energy exchange happens only when there exists excess energy for the k-th node.
(5) Reactive power compensation constraints. The compensation power of the SVC should satisfy the following constraints.
q ̲ j c q τ , j c q ¯ j c
where q ̲ j c and q ¯ j c denote the lower and upper bounds for the compensation power.
(6) Energy storage operation constraints. For each energy storage device, the following constraints should be satisfied.
b τ + 1 , j = b τ , j + p τ , j b Δ t / e ¯ j
p ¯ j p τ , j p ¯ j , 0 b τ , j 1
where b τ , j denotes the SOC (State of Charge) of the energy storage at the j-th node, e ¯ j denotes the energy capacity of the storage, and p ¯ j denotes the maximum charging/discharging power of the energy storage. Equation (15) denotes the SOC transition of the energy storage.
(7) EV control constraints. Suppose that there are N EVs in the distribution network. Each EV is represented by the index n where n = 1 , 2 , , N . Then, there are the following constraints when controlling the EV charging or discharging process.
0 d τ n e c a p , n I ( l τ n > 0 )
0 a τ n T e v I ( l τ n > 0 )
where d τ n and a τ n denote the required charging energy and remaining parking time for the n-th EV; e c a p , n denotes the battery capacity of the n-th EV; l τ n = 0 , 1 , 2 , , K denotes the parking status of the n-th EV, where l τ n = 0 means the n-th EV is on the road, else it means the n-th EV is parked at the l τ n -th node in the distribution network; I ( ) denotes the indicator function where I ( ) = 1 when its parameter in the function holds true, else I ( ) = 0 ; and T e v denotes the maximum parking duration of the EV. Equation (17) denotes that the required charging energy should not exceed the EV’s battery capacity when parked and d τ n = 0 when the EV is on the road. Similarly, Equation (18) denotes that the parking duration should not exceed the maximum parking duration when parked; otherwise, a τ n = 0 . Note that d τ n and a τ n are all uncertain variables before the EV begins to park, i.e., in the case when ( l τ n > 0 , l τ 1 n = 0 ) . Meanwhile, the variable l τ n is also uncertain for the operator of the distribution network.
As the EV can be charged ( z τ , n = 1 ), discharged ( z τ , n = 1 ), or kept idle when parking, its remaining charging demand during parking can be denoted as follows:
d τ + 1 n = d τ n z τ , n P Δ t
a τ + 1 n = a τ n Δ t
where P denotes the constant charging/discharging power of the EV. The constant charging/discharging power can prolong the service time of the EV battery. The proposed model can also be adapted when the charging/discharging power can be adjusted, which means the charging/discharging power should be seen as a decision variable. Note that the above equations hold only when the EV is parking at some nodes. When the EV is on the road, d τ n and a τ n will remain zero based on (17) and (18). For EVs at the same node, the control action and the aggregated power have the following relationship:
I ( l τ n > 0 ) z τ , n I ( l τ n > 0 )
p τ , j e v = n = 1 N I ( l τ n = = j ) z τ , n P
Equation (21) denotes that the EV control only happens when the EV is parked at some node in the distribution network. Equation (22) denotes the aggregated power of the EVs for the j-th node at time τ .
Based on the above introduction, the stochastic rolling optimization problem for active and reactive power scheduling can be summarized as the model (1) to (22). This model is non-trivial to solve due to the following difficulties. The first is the uncertainties in d τ n , a τ n , l τ n , p τ , k w , and p τ , k s . The formulated model is a multi-stage stochastic optimization. The second is the large-scale discrete decision variables z τ , n for EVs. This brings in a discontinuous solution space. The third is the nonlinear constraints, such as (17) and (18). This further exacerbates the difficulty of solving the proposed model. In order to overcome these difficulties, a two-stage power scheduling model will be introduced in the following to reduce the solution difficulty by the decoupling of active and reactive power scheduling.

2.2. Active Power Dispatch Model for the First Stage

For the two-stage power scheduling model, the first stage focuses on the active power dispatch from the current time t to future time t + T 1 in the distribution network. Furthermore, in order to avoid the difficulties incurred by the large-scale decision variables of EVs, the power dispatch for the first stage considers that the aggregated power optimization and the detailed EV control will be decided in the second stage. Based on the EV aggregation method proposed in [21], the EV aggregation can be implemented according to the initial condition of the EV when it arrives at some node, i.e.,
(1) No controllable elastic. When d τ n a r n a τ n a r n P , where the arrival time of the EV is τ n a r and the departure time is τ n d e , this indicates no control elastic of this EV. In this case, the upper and lower bounds of the output power and accumulated energy for the EV can be denoted as follows:  
p ¯ τ , n = p ̲ τ , n = P , τ n a r τ τ n d e 0 , otherwise
e ¯ τ , n = e ̲ τ , n = P ( τ τ n a r ) Δ t , τ n a r τ τ n d e P ( τ n d e τ n a r ) Δ t , τ τ n d e 0 , otherwise
where p ¯ τ , n and p ̲ τ , n are the upper and lower bounds for the output power of the n-th EV, respectively; e ¯ τ , n and e ̲ τ , n are the upper and lower bounds for the accumulated energy of the n-th EV, respectively.
(2) Controllable elastic. When the above case does not hold and there is s o c τ n a r , n s o c min , n , where s o c τ n a r , n denotes the SOC status of the n-th EV when it begins to park and s o c min , n denotes the minimum SOC of the n-th EV before it can discharge, this indicates that there exists controllable elastic for this EV, which can be charged or discharged based on the requirement. In this case, the upper and lower bounds of the output power and accumulated energy for the EV can be denoted as follows:
p ¯ τ , n = P , τ n a r τ τ n d e 0 , otherwise
p ̲ τ , n = P , τ n a r τ τ n d e 0 , otherwise
e ¯ τ , n = min ( e ¯ τ 1 , n + P Δ t , ( s o c max , n s o c τ a r , n ) e c a p , n ) , τ n a r τ τ n d e e ¯ τ n d e , n , τ τ n d e 0 , otherwise
e ̲ τ , n = max ( e ̲ τ 1 , n P Δ t , ( s o c min , n s o c τ a r , n ) e c a p , n , ( s o c τ d e , n s o c τ a r , n ) e c a p , n P ( τ d e τ ) Δ t ) , τ n a r τ τ n d e e ̲ τ n d e , n , τ τ n d e 0 , otherwise
where s o c max , n denotes the maximum required SOC of the n-th EV before departure and s o c τ n d e , n denotes the departure SOC of the n-th EV, which can be obtained based on d τ n a r n and s o c τ a r , n . Note that the constant charging/discharging power P should be replaced by the maximum charging/discharging power if the variable charging/discharging power for EVs is considered in the model.
(3) Partially controllable elastic. When the first case does not hold and and there is s o c τ n a r , n s o c min , n , this indicates that this EV will firstly be charged until its SOC reaches s o c min , n , which meets the constraints (23) and (24). Then, this EV will be fully controllable which meets the constraints (25) to (28).
Based on the above discussions, the upper and lower bounds for the aggregated power and accumulated energy of EVs in the distribution network can be denoted as follows:
p ¯ τ , j e v = n = 1 N I ( τ τ , l τ n = = j ) p ¯ τ , n
p ̲ τ , j e v = n = 1 N I ( τ τ , l τ n = = j ) p ̲ τ , n
e ¯ τ , j e v = n = 1 N I ( τ τ , l τ n = = j ) e ¯ τ , n
e ̲ τ , j e v = n = 1 N I ( τ τ , l τ n = = j ) e ̲ τ , n
where p ¯ τ , j e v and p ̲ τ , j e v denote the upper and lower bounds of the aggregated EV power at the j-th node, respectively; e ¯ τ , j e v and e ̲ τ , j e v denote the upper and lower bounds of the aggregated accumulated EV energy at the j-th node, respectively. Note that, when the EV leaves the j-th node, p ¯ τ , n and p ̲ τ , n will become zero based on (23), (25), and (26). Meanwhile, e ¯ τ , n and e ̲ τ , n will keep the same values upon departure, respectively. When making decisions for aggregated EVs in the distribution network, there are the following constraints:
e τ , j e v = e τ 1 , j e v + p τ , j e v Δ t
e ̲ τ , j e v e τ , j e v e ¯ τ , j e v
p ̲ τ , j e v p τ , j e v p ¯ τ , j e v
Finally, the active power dispatch model for the first stage can be denoted as follows, where the exchange power of each node in the distribution network, the output power of energy storage, and aggregated EVs are the main decision variables:
max p τ , k b , p τ , j e v , p τ , k k J a = E { τ = t t + T 1 k = 1 K [ λ τ e x p τ , k e x Δ t + ( λ τ e v λ e v , s ) p τ , k e v Δ t λ τ g p τ , k g Δ t λ τ w p τ , k w Δ t λ τ s p τ , k s Δ t ] } s . t . ( 6 ) ( 8 ) , ( 11 ) ( 13 ) , ( 15 ) ( 16 ) , ( 23 ) ( 35 ) p τ , j w + p τ , j s + p τ , j g + k = 1 K p τ , k j k = 1 K p τ , j k = p τ , j e x + p τ , j e v + p τ , j b + p τ , j d

2.3. Reactive Power Compensation Model for the Second Stage

Based on the active power dispatch result in the first stage, the second stage focuses on the voltage performance of the distribution network by reactive compensation optimization. For the distribution network, the reactive power compensation model for the second stage can be denoted as follows:
min z τ , n , q τ , k c J r = E { τ = t t + T 1 k = 1 K [ | V τ , k 1 | ] } s . t . ( 2 ) ( 5 ) , ( 9 ) ( 10 ) , ( 14 ) , ( 17 ) ( 22 )
In this reactive power compensation model, the main decision variables are the charging/discharging control of each EV and the compensation power of the SVC. The objective function is to reduce the voltage variation. Note that, based on (22), the total power of the decision variables z τ , n in each node of the distribution network should meet the dispatched result p τ , j e v of the first-stage model, and each decision variable z τ , n should satisfy the constraints (23), (25), and (26).
Finally, the stochastic rolling optimization model for power scheduling can be reduced to the first-stage problem (36) and the second-stage problem (37). The first-stage model mainly focuses on the active power dispatch considering the impact of the multi-stage decision, uncertainties, and the nonlinear constraints. The second-stage model is a simplified optimization model which focus on the reactive compensation of the distribution network considering the impact of large-scale EV control variables. In the following, we introduce a two-stage optimization method to solve the above two-stage model.

3. Solution Methodology

For the proposed two-stage power scheduling model, it can been seen that the first-stage model (36) is a multi-stage stochastic optimization problem with nonlinear constraints, while the second-stage model (37) is a simplified stochastic optimization problem. In the following, a simulation-based Rollout method will be introduced to solve the first-stage model, while a scenario-based second-order cone programming will be introduced to solve the second-stage model.

3.1. Simulation-Based Rollout for First-Stage Model

In order to solve the stochastic optimization problem in the first-stage model (36), simulations are often applied to generate the possible realization of the uncertain variables [22], such as d τ n , a τ n , l τ n , p τ , k w , and p τ , k s in the proposed model. However, it is usually time-consuming to find the optimal solutions among these large numbers of simulations. A more feasible method is to check the current scheduling model and try to improve upon the current scheduling model. This is the core idea of the Rollout method proposed in [23]. This method is an online stochastic optimization method which tries to improve from the base policy. The optimal scheduling policy can be achieved after implementing this Rollout method iteratively. This method has been widely used in many scenarios, such as EV charging scheduling [24], robotic control [25], and wave energy converter control [26]. The details of the proposed simulation-based Rollout are introduced below.
According to the theory of Markov decision process [27], the Q-factor is used to evaluate the performance of choosing an action corresponding to the observed state, i.e.,
Q t ( s t , x t ) = r t ( s t , x t ) + E [ V t + 1 ( s t + 1 , x t + 1 ) | s t , x t ]
where s t = ( v t , k , I t , k , p t , k d , b t , k , e t , k e v , e ¯ t , k e v , e ̲ t , k e v , p ¯ t , k e v , p ̲ t , k e v ) denotes the state; x t = ( p t , k b , p t , j e v , p t , k k ) denotes the action; Q t ( s t , x t ) represents the performance when choosing action x t for state s t at time t; and r t ( s t , x t ) denotes the one-step reward function when choosing action x t for state s t at time t, i.e.,
r t ( s t , x t ) = k = 1 K [ λ t e x p t , k e x + λ t e v p t , k e v λ t g p t , k g λ t w p t , k w λ t s p t , k s ]
V t + 1 ( s t + 1 , x t + 1 ) | s t , x t denotes the optimal value function for state–action pair ( s t + 1 , x t + 1 ) from time t + 1 to the last decision epoch considering the observation of state–action pair ( s t , x t ) at time t. Based on the Bellman equation [27], the optimal value function can be represented as follows:
V t + 1 ( s t + 1 , x t + 1 ) = E τ = t + 1 t + T 1 r τ ( s τ , x τ )
where x τ denotes the optimal action which is derived by using the optimal active power dispatch policy μ , and μ ( s τ ) = x τ .
As introduced above, it is usually difficult to find the optimal policy μ for the proposed active power dispatch model due to the existence of the large number of simulations. Furthermore, as the state s t comprises the detailed status of each node in the distribution network, this incurs a heavy computation burden when trying to find the optimal policy μ due to the curse of dimensionality. Therefore, this paper proposes the Rollout method to efficiently solve this first-stage model. The main idea of this method is to use the current dispatch policy μ b as the base policy. This policy can be easily found from the operator of the distribution network. Then, the improved active power dispatch policy μ I can be obtained based on the following equations:
μ I ( s t ) = x t I = arg max x t X t r t ( s t , x t ) + E { r t + 1 [ s t + 1 , μ b ( s t + 1 ) ] | s t , x t ] }
where x t I is the improved decision variable and X t denotes the feasible action space constrained by the constraints in the first-stage model (36). Based on the cost improvement property proved in [23], it can ensure that V t ( s t , μ I ( s t ) ) V t ( s t , μ b ( s t ) ) , where V t denotes the value function from t to the last decision epoch by choosing the specific action for the current observing state; i.e., the performance of active power dispatch policy μ I will be improved.
Furthermore, as it is usually difficult to compute the expectation operator in (41), the simulations can be used to approximately compute the improved active power dispatch policy μ I , i.e.,
μ I ( s t ) = x t I arg max x t X t r t ( s t , x t ) + 1 M m = 1 M τ = t + 1 t + T 1 { r τ [ s τ , μ b ( s τ ) ] | ζ m , s t , x t ] }
where M denotes the total number of simulations and ζ m denotes the m-th simulation. The value of M can be determined based on the uncertainty level of the distributed wind/solar and EVs. In the following experiment, the proposed method is validated by setting M = 50 . Note that each simulation comprises the possible realization of distributed wind power, solar power, EV mobility, EV parking duration, and required charging energy. There exist many studies focusing on the simulation of distributed renewable energy and EV trip chains, such as the work proposed in [28]. These simulation methods can be applied to generate ζ m . Usually, the sampling strategy of these simulation methods adopts random sampling based on the probability distributions of the distributed wind power, solar power, EV mobility, EV parking duration, and required charging energy. In practice, these simulations can be implemented by the operator at each node of the distribution network in parallel, which can further reduce the optimization time of the active power dispatch model in the first stage.

3.2. Scenario-Based Second-Order Cone Programming for Second-Stage Model

After obtaining the improved active power dispatch policy for first-stage model, the reactive power compensation model (37) for the second stage is reduced to a simplified model with decision variables comprising the charging/discharging actions of EVs and the reactive compensation power of the SVC. The objective function is to minimize the expected total voltage deviation from the required standard voltage for each node in the distribution network.
In order to solve this simplified stochastic optimization problem for the second-stage model, the scenarios can be introduced to represent the uncertainties of the EV charging demand; i.e., the second-stage model (37) can be rewritten as follows:
min z τ , n m , q τ , k c , m J r = 1 M m = 1 M { τ = t t + T 1 k = 1 K [ | V τ , k m 1 | ] } s . t . ( 2 ) ( 5 ) , ( 9 ) ( 10 ) , ( 14 ) , ( 17 ) ( 22 ) holds for each ζ m e v m , ( z t , n m , q t , k c , m ) keep the same for current time t
where z τ , n m , q τ , k c , m , and V τ , k m denote the charging/discharging control of EVs, the reactive compensation power of the SVC, and the voltage for the k-th node at time τ for the m-th scenario; ζ m e v denotes the scenarios corresponding to the EVs. Note that ζ m e v can be obtained from the simulations generated in the first-stage model, which can avoid repetitive simulation and save optimization time. Based on the theory of scenario-based optimization [29], the optimal decision variables should be computed for each scenario ζ m e v , and all the values of the decision variables for the current time t should remain the same for all the scenarios. For each scenario, the other decision variables besides ( z τ , n m , q τ , k c , m ) can be determined based on the improved policy π I from the first-stage model. Furthermore, when the number of scenarios M is large, the scenario reduction method can be applied to speed up the solution of the second-stage model (43), such as the fast forward method proposed in [30].
Another difficulty in solving the second-stage model (37) is the nonlinear optimization, such as the constraints (2)–(5), (17)–(18), and (21)–(22) and the absolute operation in the objective function of model (43). For the nonlinear constraints (17)–(18) and (21)–(22), they become linear constraints when the corresponding scenario is generated because the position of the EV is deterministic in the scenario. For the absolute operation in the objective function of model (43), it can be transformed into a linear operation by introducing the auxiliary variable y τ , k m , i.e.,
min z τ , n m , q τ , k c , m J r = 1 M m = 1 M { τ = t t + T 1 k = 1 K y τ , k m } s . t . y τ , k m = | V τ , k m 1 | , y τ , k m V τ , k m 1 , y τ , k m 1 V τ , k m ( 2 ) ( 5 ) , ( 9 ) ( 10 ) , ( 14 ) , ( 17 ) ( 22 ) holds for each ζ m e v m , ( z t , n m , q t , k c , m ) keep the same for current time t
The nonlinear constraints (2)–(5) incurred by the power flow can be transformed into convex constraints by angle relaxation and second-order cone relaxation according to the work proposed in [31]. Finally, the second-order cone programming can be applied to solve the reactive compensation optimization model (44).

3.3. Algorithm Summary

Based on the introduction above, the solution algorithms for the first-stage model and second-stage model can be summarized as follows. Algorithm 1 shows the proposed simulation-based Rollout method for the first-stage active power dispatch optimization. Note that, as this method is implemented in an online fashion, it will make decisions and generate an improved dispatch action x t I for the current observed state s t . At the same time, the original dispatch policy π b will be updated as improved policy π I according to the seventh step of Algorithm 1. The dispatch policy will keep on updating over time until it becomes the optimal dispatch policy. Algorithm 2 shows the proposed scenario-based second-order cone programming for the second-stage reactive compensation optimization. Based on ζ m e v and μ I generated by the first-stage model, the decision variables in the first-stage model can all be determined. Therefore, the rest of the optimal decision variables ( z τ , n m , q τ , k c , m ) can be obtained by using second-order cone programming, for which many commercial solvers can be applied, such as Cplex and Gurobi.
Algorithm 1: Simulation-based Rollout for first-stage model.
1:
Offline: Each node in the distribution network generates M simulations of d τ n , a τ n , l τ n , p τ , k w and p τ , k s ;
2:
Input: Receive current decision epoch t and the current active power dispatch policy μ b from the operator of the distribution network;
3:
Compute the upper and lower bound of the aggregated power and accumulated energy of EVs based on (29) to (32);
4:
Observe the current state s t = ( v t , k , I t , k , p t , k d , b t , k , e t , k e v , e ¯ t , k e v , e ̲ t , k e v , p ¯ t , k e v , p ̲ t , k e v ) ;
5:
Determine the feasible action set X t based on the constraints in (36);
6:
Find the action x t I which has the maximum value of Q-factor from X t based on (42);
7:
Obtain the improved active power dispatch policy μ I by setting μ I ( s t ) = x t I and keep the same as μ b for the other states.
Algorithm 2: Scenario-based second-order cone programming for second-stage model.
1:
Input: Receive current decision epoch t, the simulations ζ m e v and the improved dispatch policy μ t I from the first-stage model;
2:
Generate the other decision variables besides ( z τ , n m , q τ , k c , m ) based on each scenario ζ m e v and the improved dispatch policy μ I ;
3:
Solve the model (44) by second-order cone programming.

4. Numerical Results

4.1. Experiment Settings

In order to demonstrate the effectiveness of the proposed two-stage stochastic optimization for the active and reactive power scheduling of the distribution network, the IEEE 33-bus distribution network data from [32] is considered for the experiment which is shown in Figure 1. The load profile at each node is shown in Table 2. In the experiment, node #19, node #8, and node #15 are assumed to be equipped with distributed wind power, distributed solar power, energy storage, and EVs, as these nodes are located at the end of the distribution network, which can help us to analyze the impact of these devices on the distribution network. However, the proposed method does not require the specific location. It can be applied to the cases when other nodes are equipped with these devices. EVs will be on the road or parked at a specific node of the distribution network. The SVC is equipped at node #31 to compensate for the reactive power, where its lower and upper bounds of compensation power are set at −0.2 MVar and 1 MVar, respectively. Table 3 shows the parameter settings for the experiment where the parameters of EVs come from the work in [14]. The energy storage and price data come from the work proposed by [33]. The charging/discharging price λ τ e v of EVs equals 0.34 CNY/kWh for 1:00 to 6:00, 0.67 CNY/kWh for 7:00 to 9:00 and 21:00 to 24:00, 0.75 CNY/kWh for 10:00 to 17:00, and 1.12 CNY/kWh for 18:00 to 20:00, respectively. The subsidy price λ e v , s is set at 0.25 CNY/kWh. The power purchasing price λ τ g equals 0.26 CNY/kWh for 1:00 to 8:00, 0.50 CNY/kWh for 9:00 to 14:00 and 23:00 to 24:00, and 0.74 CNY/kWh for 15:00 to 22:00, respectively.
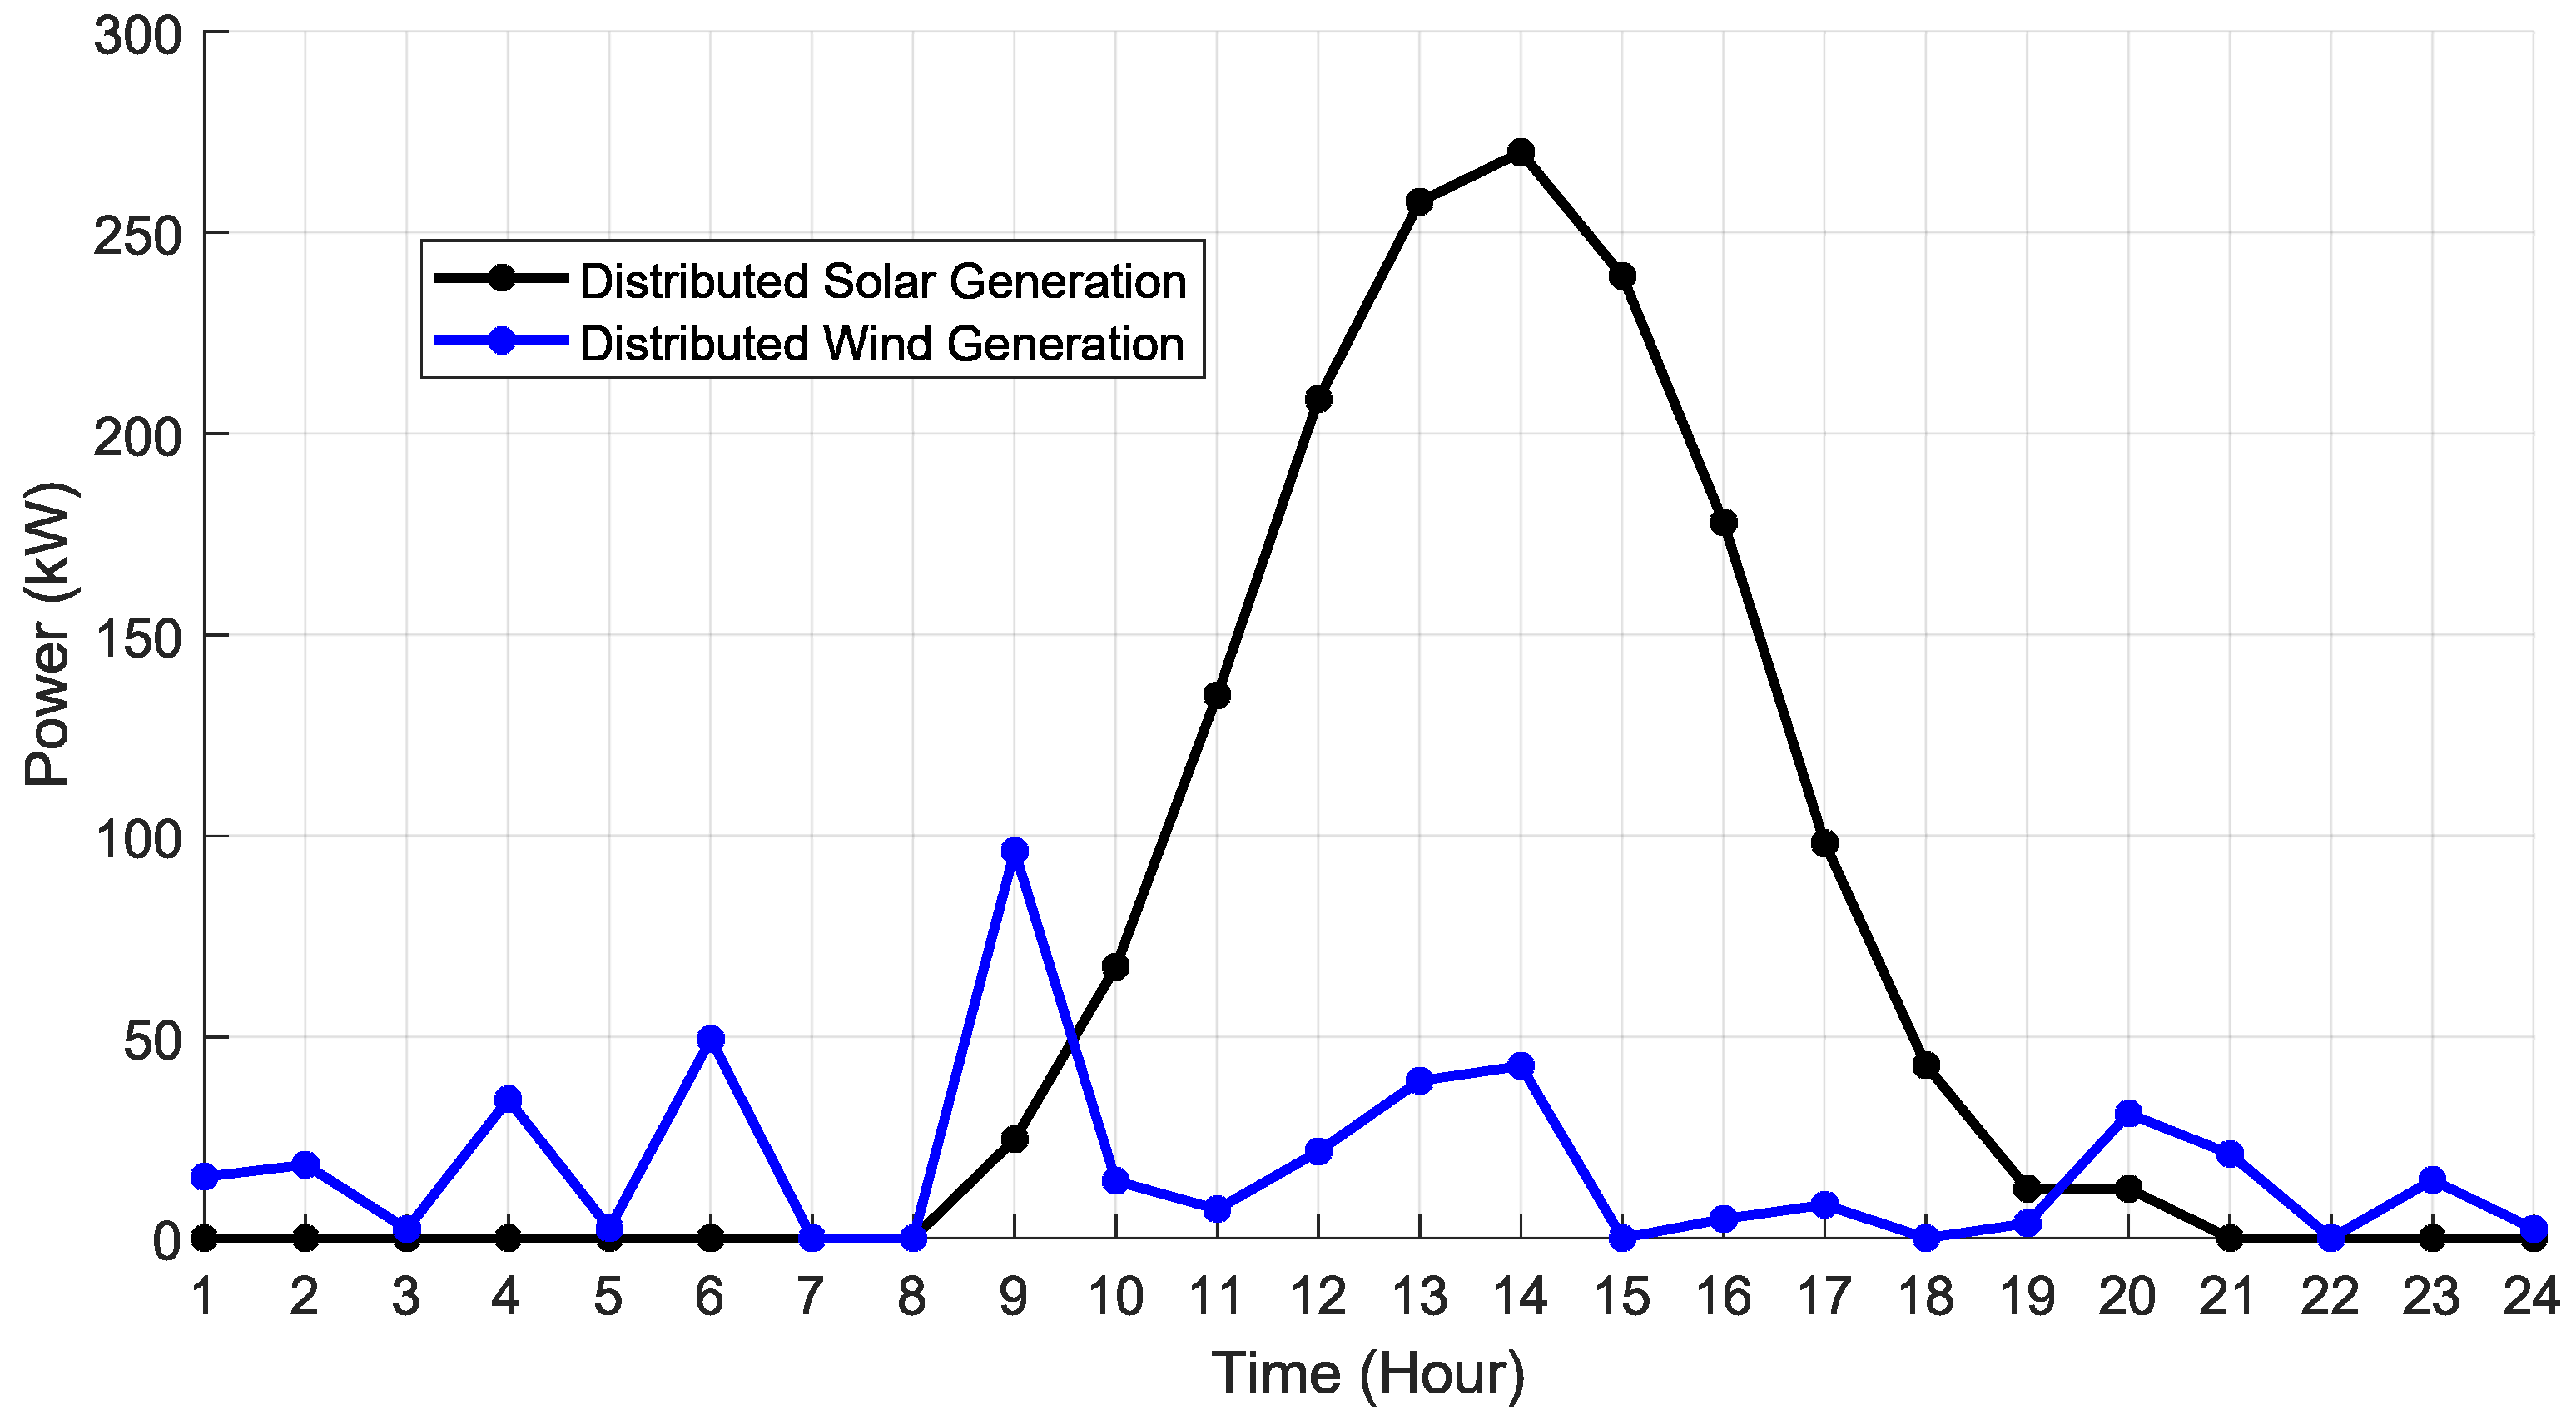
In order to simulate the uncertainties existing in EV control, the arrival time of EVs is assumed to follow a normal distribution, with the mean value set at 8:00 and standard deviation set at 3 h. The departure time is also assumed to follow a normal distribution, with a mean value set at 17:00 and standard deviation set at 2 h. The arrival and departure SOCs are assumed to follow uniform distributions within [ 0 , 1 , 0.6 ] and [ 0 , 5 , 0.9 ] , respectively. The maximum number of EVs for node #19, node #8, and node #15 is set at 120, respectively. The uncertainties of the distributed wind power and solar power are assumed to follow normal distributions, with the mean values being the actual generation of the distributed wind power and solar power, which is shown in Figure 2. Note that the proposed method can also be applied when other probability distributions or data-driven probabilistic modeling for uncertain wind and solar power is used.

4.2. Overall Performance of the Two-Stage Stochastic Optimization

In order to demonstrate the effectiveness of the proposed method, we firstly investigate the overall performance of the optimization result, i.e., the optimized value of the objective function. As the proposed first-stage active power dispatch model focuses on operation cost optimization, the following three cases are considered to compare the active power dispatch result for the first-stage.
  • Improved dispatch policy μ I under multiple simulations. In this case, the proposed simulation-based Rollout method is applied with M = 50 . The base policy μ b is set as follows. EVs will be charged as soon as possible. Each node will firstly meet its own demand and then provide surplus power to the energy storage and other nodes in turn. When the demand of the node is still unsatisfied by power exchange among the nodes, a node will finally purchase power from the grid.
  • Improved dispatch policy μ s under a single simulation. In this case, the proposed simulation-based Rollout method is applied with M = 1 . This case is used to demonstrate the importance of the consideration of the uncertainties in the distributed wind/solar generation and EV charging demand.
  • Improved dispatch policy μ e with no power exchange among nodes. In this case, the proposed simulation-based Rollout method is applied with M = 1 and no consideration of power exchange among nodes.
The operation results of the distribution network corresponding to policies μ I , μ s , and μ e are listed in Table 4. It can been seen that the proposed policy μ I has the minimum total operation cost compared to the other two policies. The total operation cost of policy μ I is close to zero for the distribution system operator. The main improvement comes from the largely reduced purchasing cost from the grid. Comparing μ I with μ s demonstrates that a larger number of simulations will bring about better optimization performance considering the uncertainties in distributed wind power, distributed solar power, and EVs. Comparing μ s with μ e can demonstrate that the power exchange among nodes can also reduce the purchasing cost. For these three policies, the generation of distributed wind power and solar power will be fully used, which incurs the same operation cost for distributed wind and solar power. It is also important to compare the EV operation performance of these three policies. As the total EV charging demand is the same for these three policies, the EV subsidy cost of policies μ I , μ s , and μ e is also the same. The main difference between these policies lies in the EV operation profit caused by charging and discharging, which is denoted as a negative value in Table 4 to distinguish it from the positive cost value. Based on the subsidy mechanism, the actual charging price for the EV is 0.34 CNY/kWh when implementing policy μ I , which is much cheaper than the posted charging price λ τ e v . Meanwhile, the distribution system operator can achieve a low operation cost. This demonstrates that it is a win–win policy for the EVs and distribution system operator.
As the proposed second-stage reactive compensation model focuses on the voltage performance, the average voltage deviation per hour before and after the second-stage stochastic optimization is compared. Upon applying the proposed scenario-based second-order cone programming for the second-stage model, the optimized average voltage deviation is 0.0075, while the average voltage deviation before optimization is 0.0146, where there is no EV charging/discharging control for voltage performance improvement. This demonstrates that the proposed method can improve the voltage performance of the distribution network through EV charging/discharging control and SVC scheduling.

4.3. EV Control Analysis

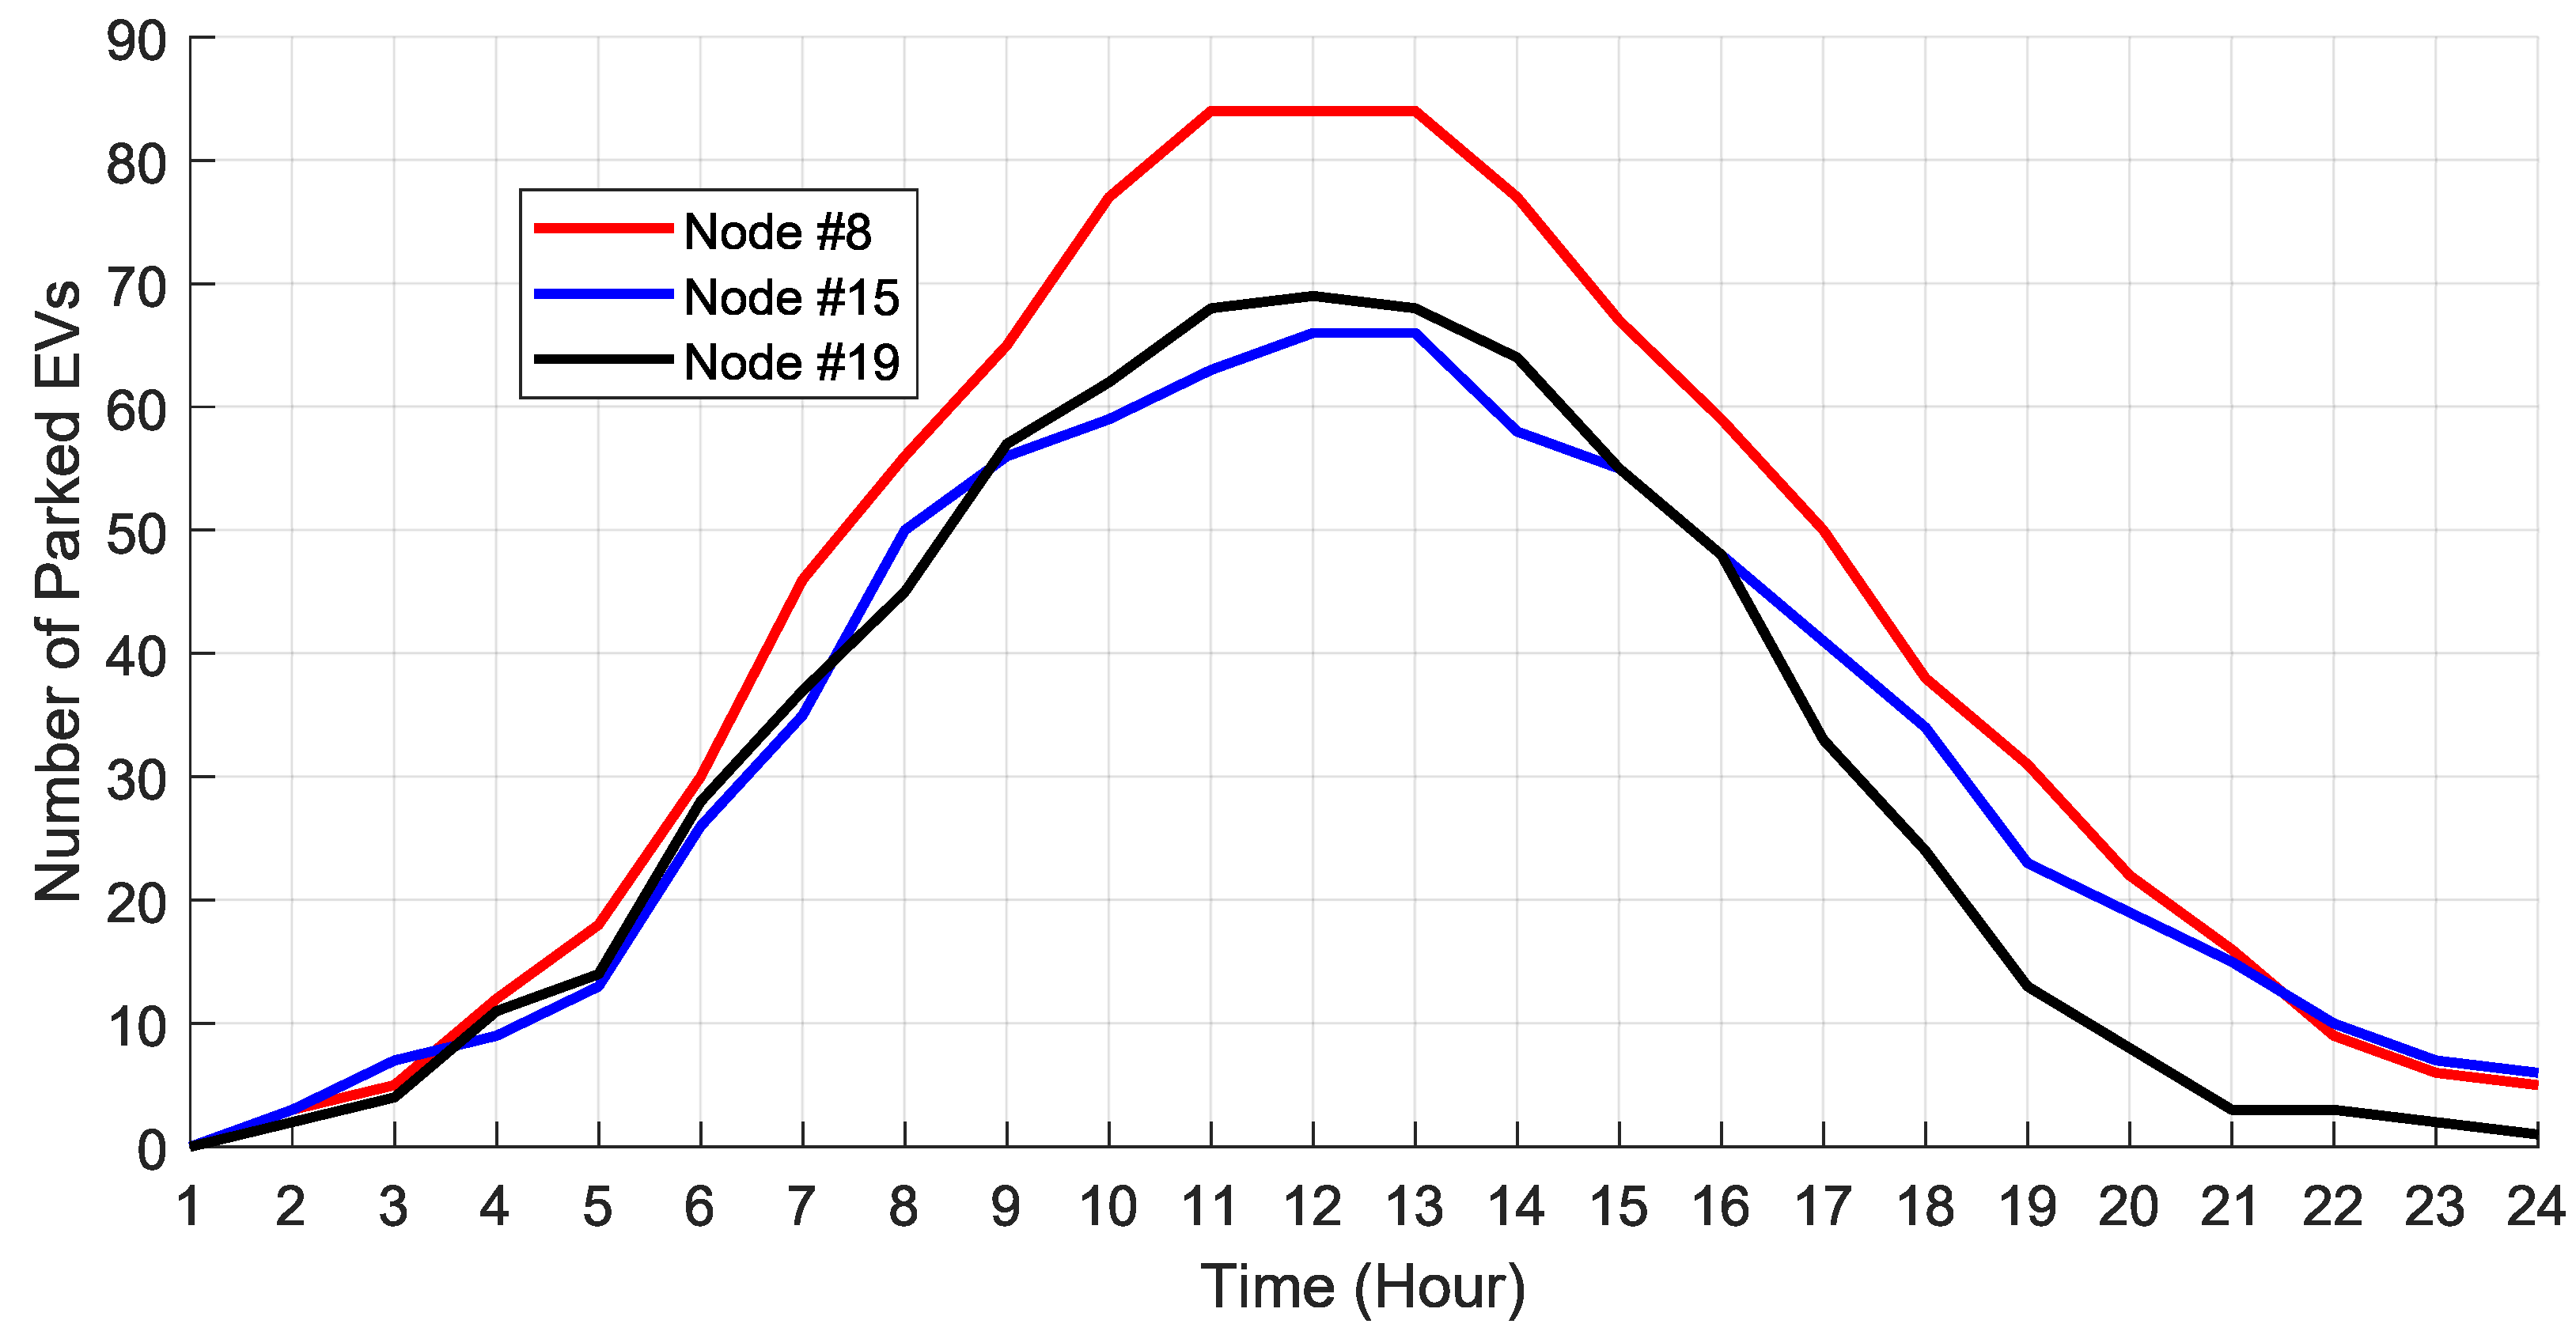
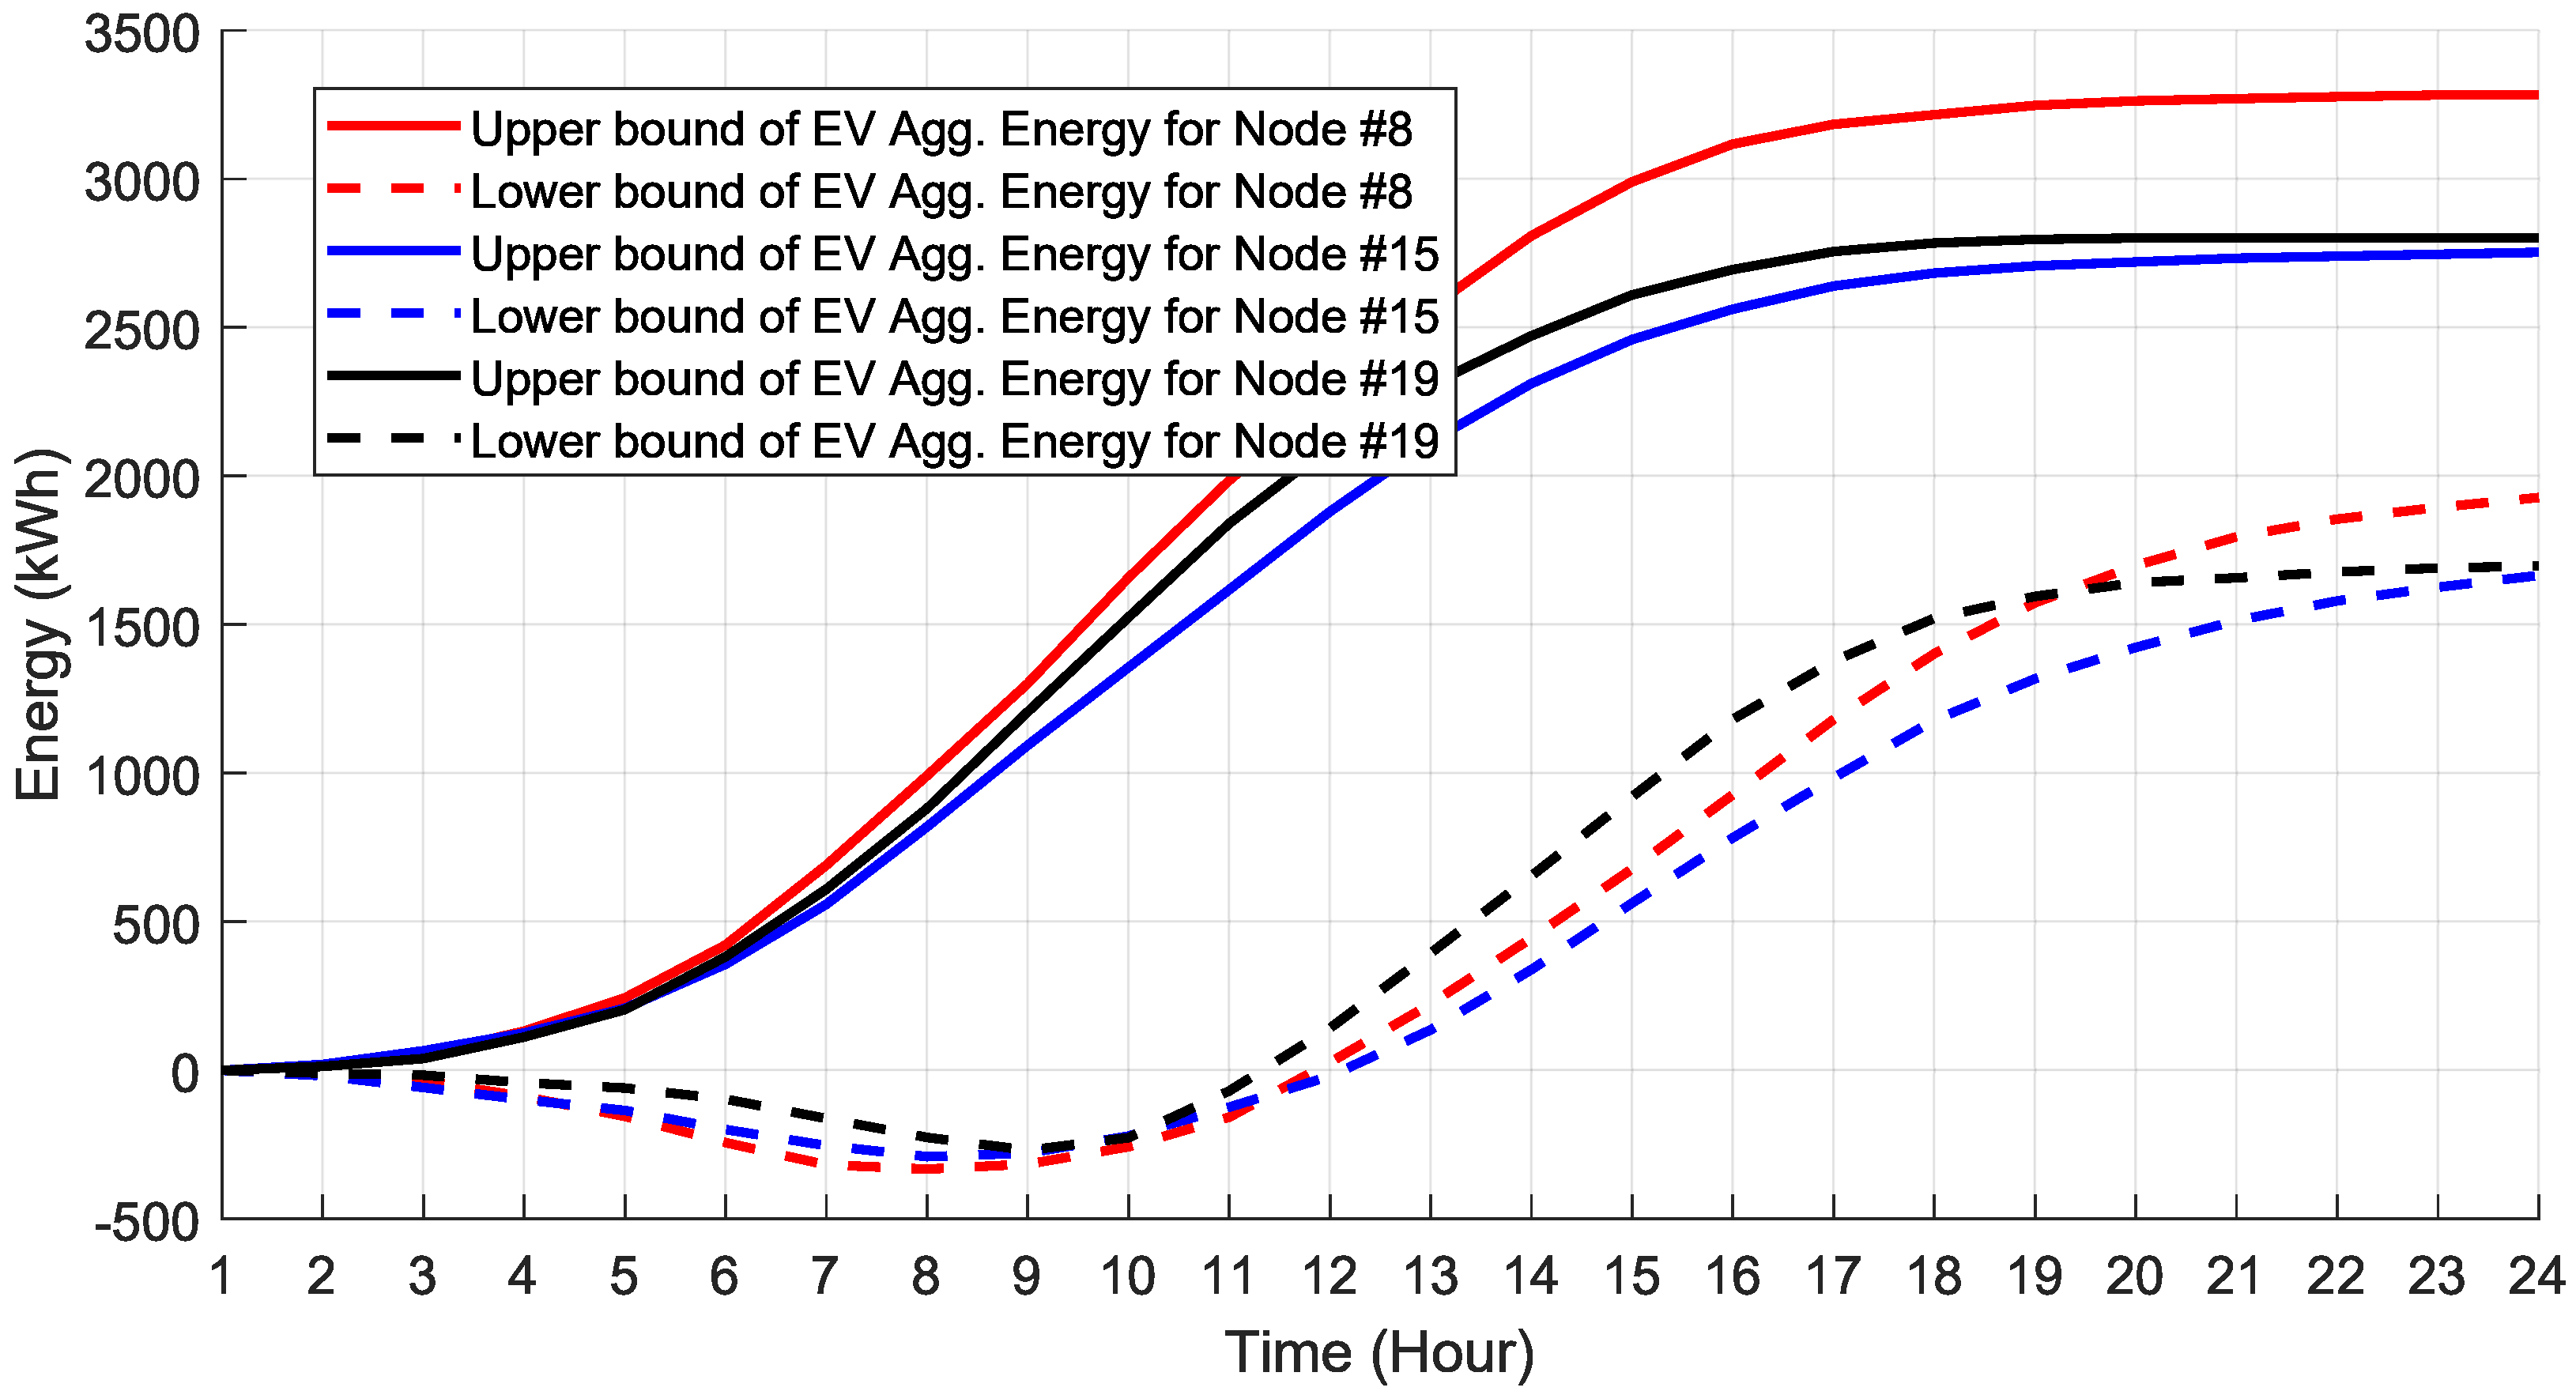
As the first-stage stochastic optimization model mainly uses EV aggregation to avoid the impact of large-scale charging/discharging decision variables, the EV aggregation result is also investigated. Figure 3 shows the number of parked EVs at each time for node #19, node #8, and node #15. It can be seen that, as the EVs are regulated to arrive in the morning and depart in the late afternoon, the number of parked EVs will firstly increase and then decrease. Due to the uncertainties in the EV mobility, the number of parked EVs in node #19, node #8, and node #15 is different. Figure 4 shows the computed upper and lower bounds of the accumulated EV energy based on (23) to (32). As the upper bound of the EV accumulated energy is mainly decided by the number of parked EVs and the required charging energy for EVs, the upper bound will keep increasing with an increase in parked EVs during 1:00 to 16:00. After 16:00, most EVs will depart and few will arrive to charge. This causes the steady state of the upper bound after 16:00. Note that the upper and lower bounds will remain unchanged after EV departure. Therefore, there is no decrease for the lower and upper bounds of the accumulated EV energy after 16:00 in Figure 4. For the lower bound of the EV accumulated energy, the departure time is relatively early when the EV just arrives during 1:00 to 11:00. Therefore, EVs can provide discharge elasticity for the distribution network during these periods, which brings about the negative lower bound of the accumulated EV energy during 1:00 to 11:00. After 11:00, with the increase in the parked EVs and the approach to departure time, the discharging elasticity decreases and the lower bound will keep increasing until reaching the steady state. Note that, although the lower bounds of the accumulated EV energy are positive most of time, some EVs with controllable elasticity can also provide a discharge service as long as the overall energy status is greater than the lower bound.
Figure 5 shows the aggregated EV power for policies μ I , μ s , and μ e at node #19. Comparing μ I and μ s with μ e , it can be seen that there exist discharging actions for μ I and μ s , while only charging behavior happens for policy μ e . This causes the largest charging service earning for μ e in Table 4. Comparing μ I with μ s , it can be seen that the aggregated power of policy μ s has larger volatility than policy μ I . This is because the number of simulations for policy μ s is much smaller than that for μ I . This causes μ s to be unable to find a good enough policy for all the possible realizations of future uncertainties, which makes the decision suboptimal. On the contrary, the policy μ I can find an improved EV control strategy, which brings in larger charging profits compared with μ s , as demonstrated in Table 4.

4.4. Power Exchange and Procurement Analysis

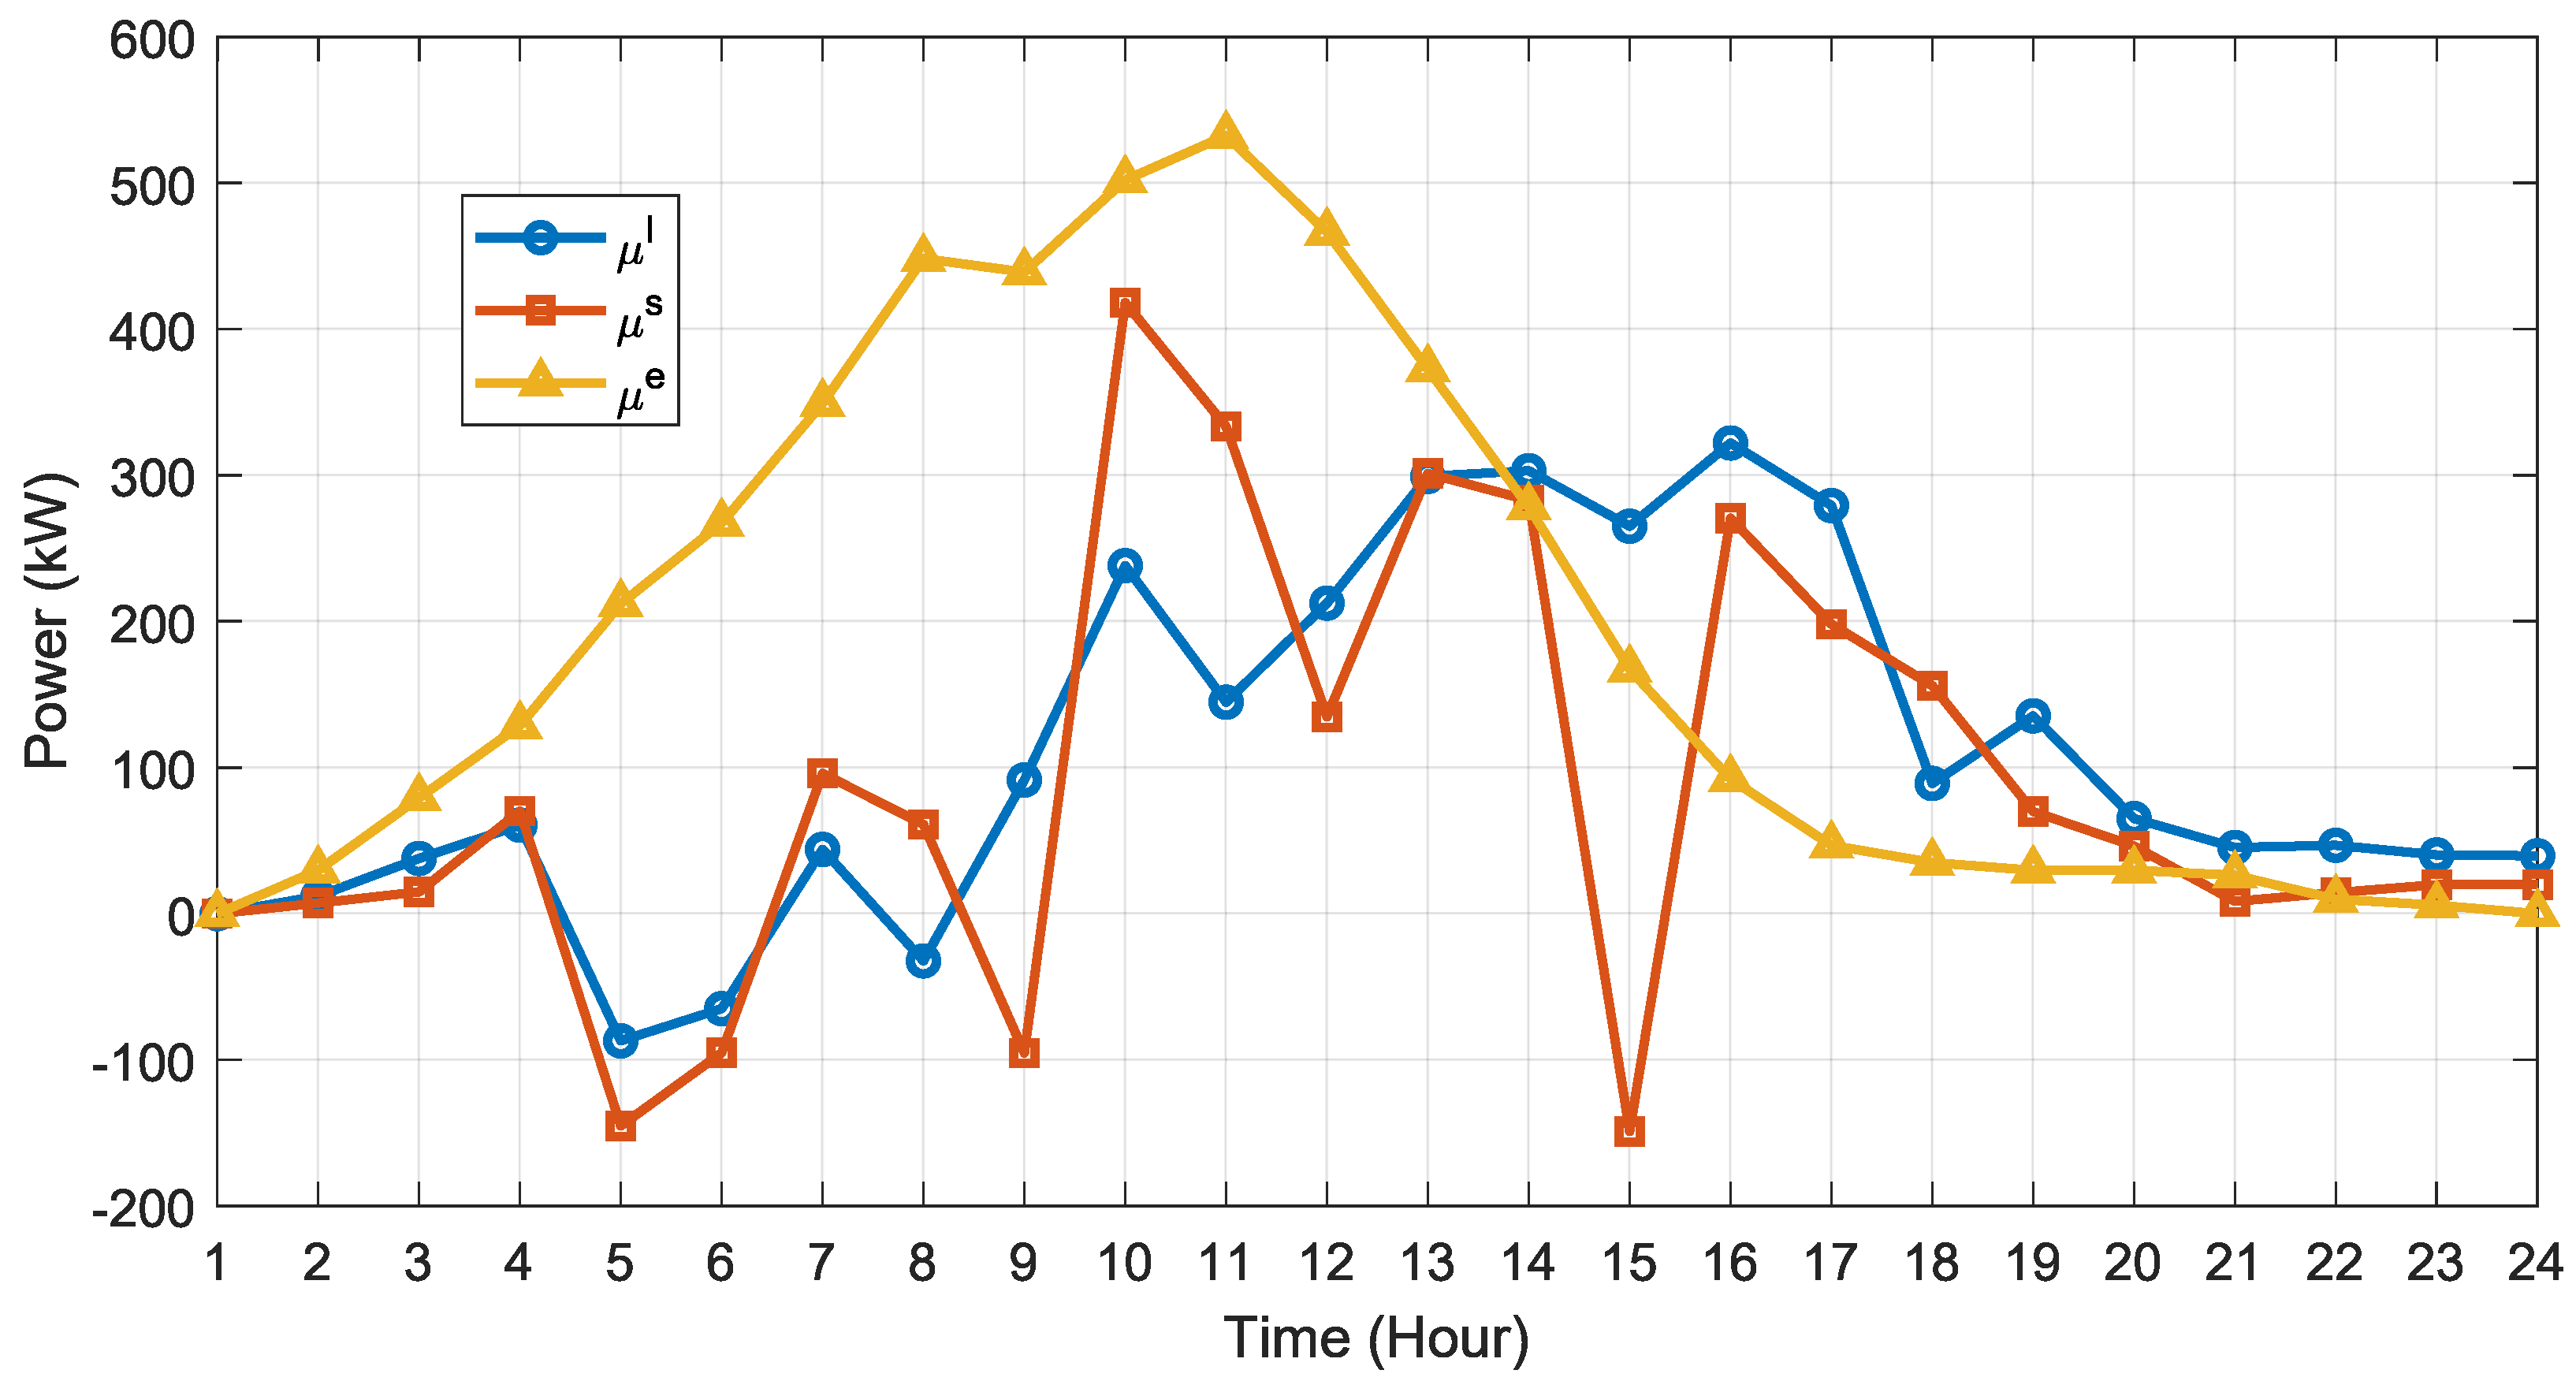
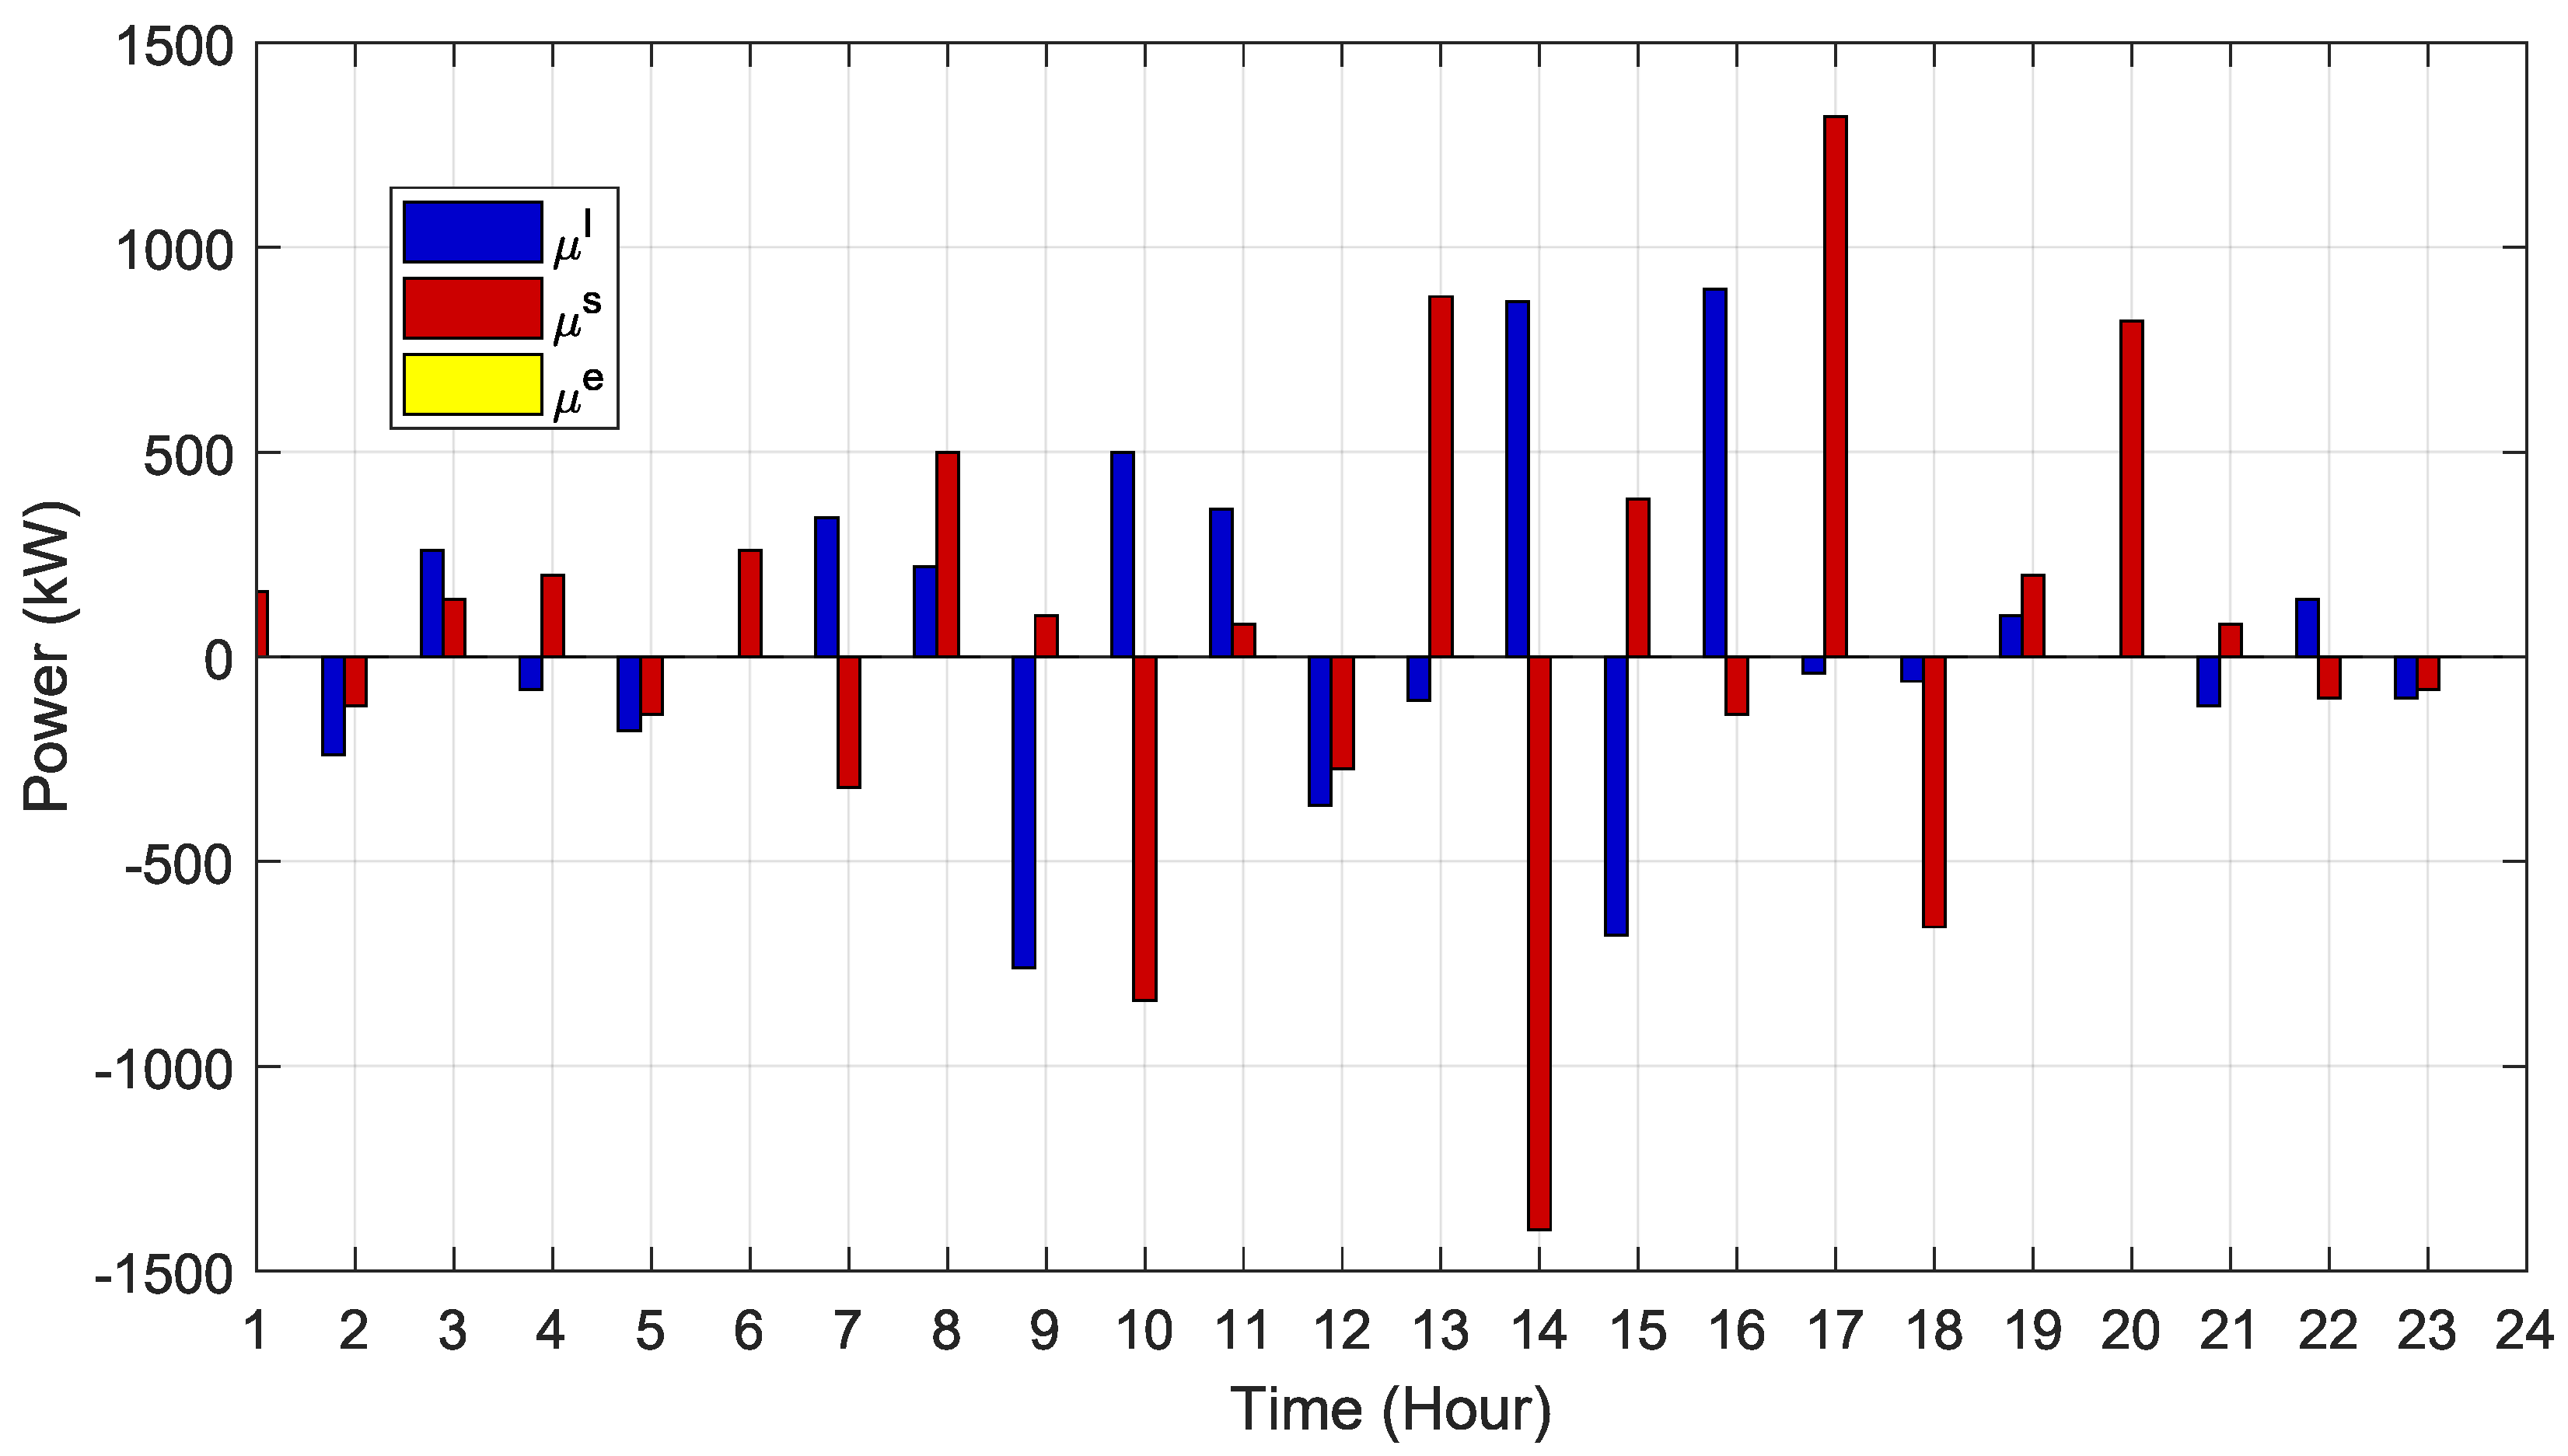
Figure 6 shows the exchange power of policies μ I , μ s , and μ e for node #19. A negative value means that the excess power is sold to other nodes, while a positive value means that this node purchases power from other nodes. It can be seen that, as there is no consideration of power exchange for policy μ e , the exchange power remains zero for policy μ e . Comparing policy μ s with μ I , it can be found that the volatility of policy μ s is also larger than that of μ I . This is also caused by the lower simulation during the optimization in policy μ s . The frequency for power exchange is the highest and the exchange power is the largest during the daytime due to the increased charging demand at node #19.
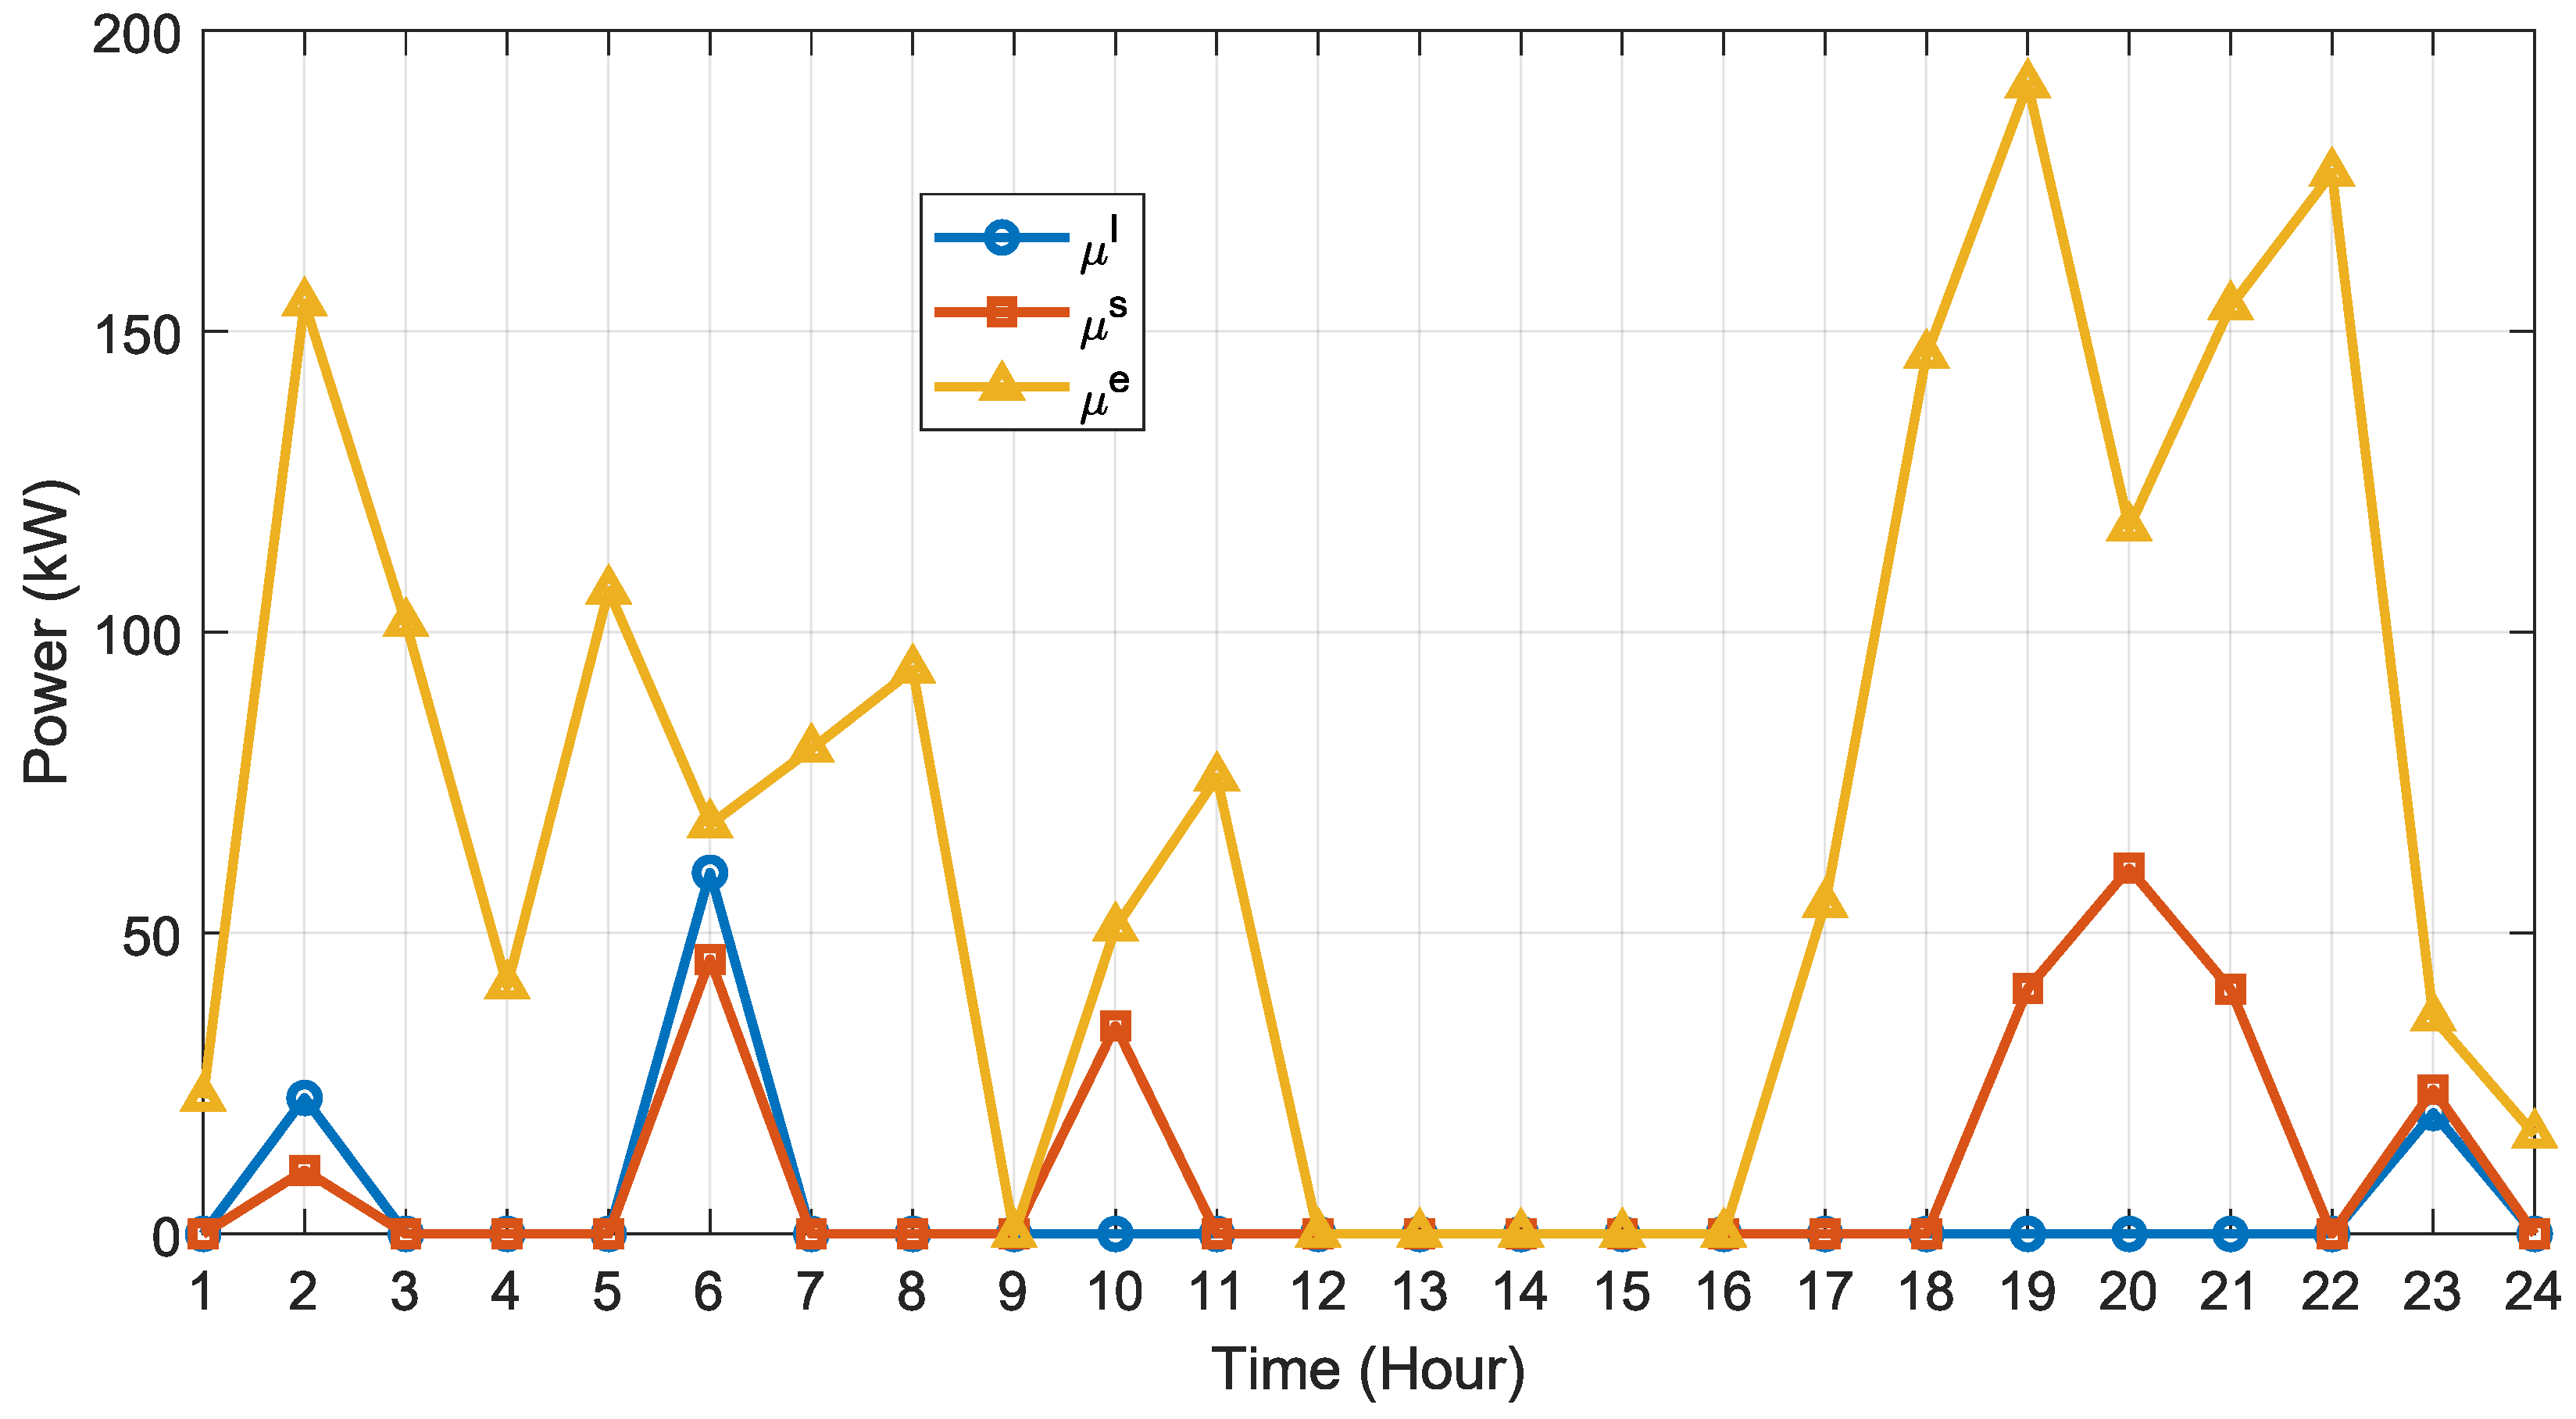
Figure 7 shows the purchase power variation of policies μ I , μ s , and μ e for node #19. It can been seen that the power procurement is the largest for policy μ e . This causes the large purchasing cost in Table 4. In contrast, policy μ s only purchases power early in the morning and late at night, which largely reduces the purchasing cost. With an increase in the simulations, the purchasing power of policy μ I can be further improved with the avoidance of purchasing power during 19:00 to 21:00. This further reduces the operation cost when comparing μ I with μ s , as also demonstrated in Table 4.

4.5. Voltage Performance Analysis

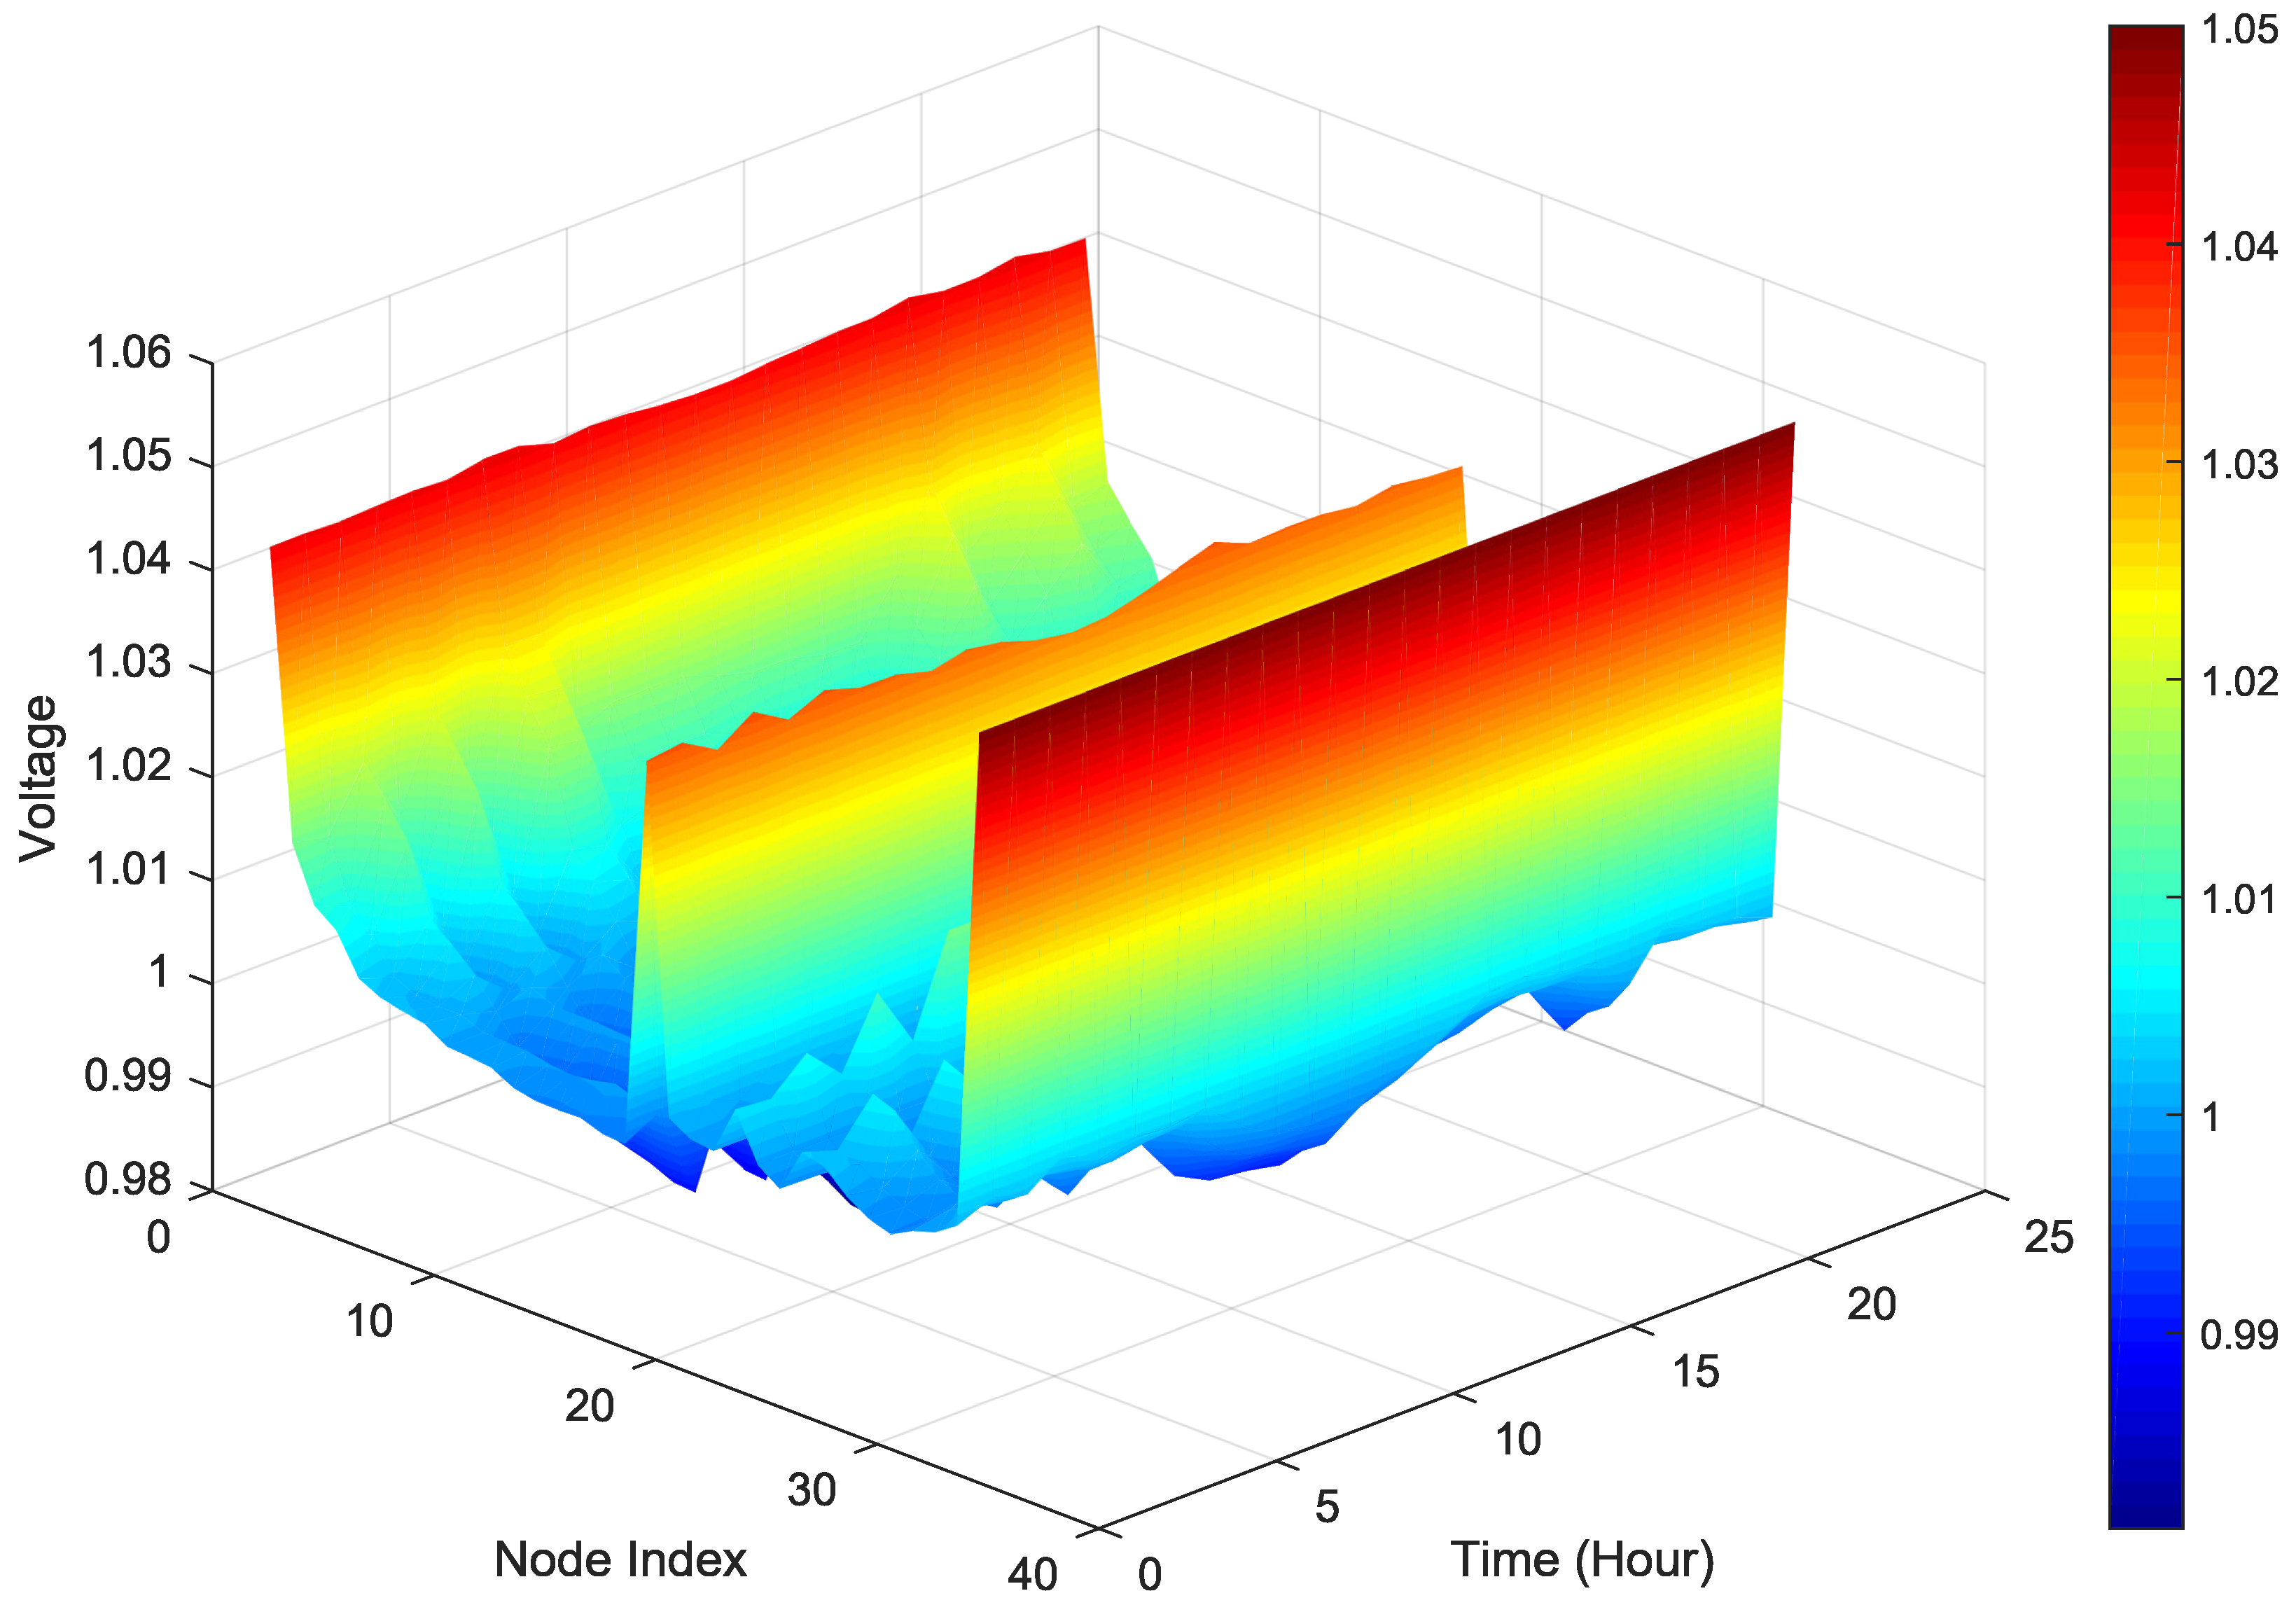
Figure 8 shows the voltage levels of all the nodes in the distribution network. When the voltage level is closer to 1p.u., it means that the voltage deviation is smaller. The voltage at node #33 is set as the rated voltage, which is 1.05p.u. For node #1 and node #18, their voltages are relatively high, as these two nodes are close to node #33. For the nodes after node #1 and the nodes after node #18, it can be seen that their voltage levels gradually decrease to a value around 1p.u. In general, it can be seen that the voltages of all the nodes are around [0.95p.u, 1.05p.u], whose deviations are relatively small. This can ensure the voltage performance of the distribution network.
Figure 9 shows the average voltage deviation of the distribution network at each time epoch with and without the SVC. It can be clearly seen that the voltage deviation and its variation can be reduced by deploying the SVC in the distribution network. The average voltage deviation when using the SVC is 0.0072p.u., while the average voltage deviation without using the SVC is 0.0099p.u. This indicates that the SVC can improve the voltage performance of the distribution network.

4.6. Distributed Solar Power Fluctuation Analysis

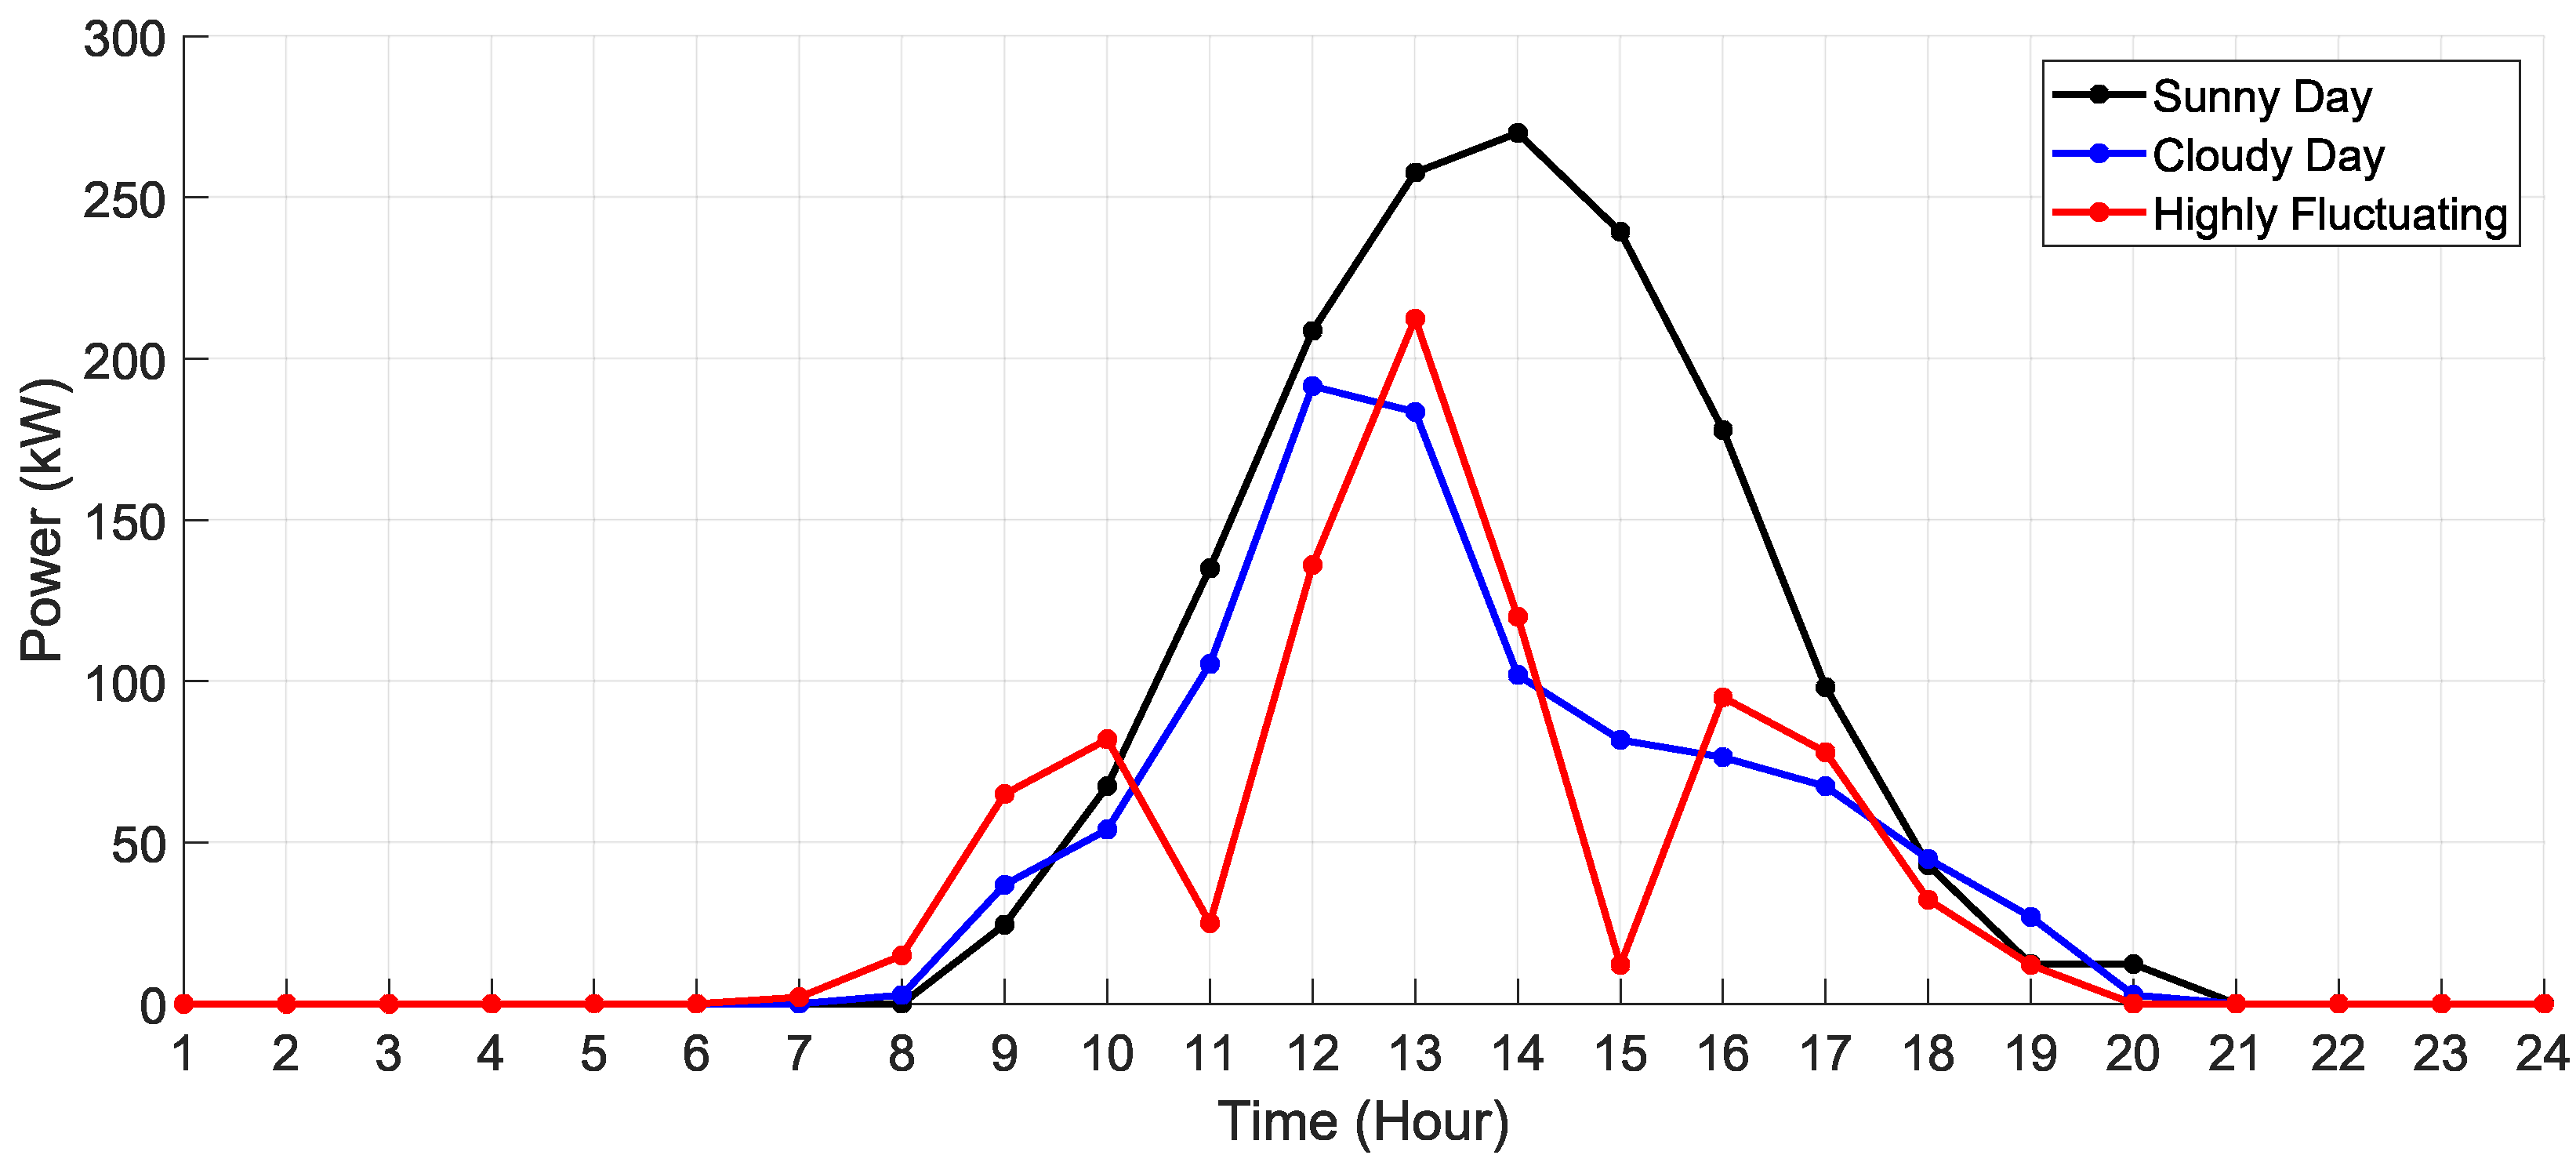
In order to further validate the robustness of the proposed method, optimization results under different generation scenarios of distributed solar power are collected and compared. Figure 10 shows three different generation scenarios for distributed solar power, i.e., sunny day, cloudy day, and highly fluctuating day, respectively. The generation data on the sunny day remains the same as that in Figure 2. For the cloudy day, it can be seen that the solar generation is smaller than that on the sunny day. For the highly fluctuating day, the volatility of the solar generation is larger than that in the other two scenarios. Note that Figure 10 only shows the actual generation of the distributed solar power in three different scenarios. When implementing the proposed method, the actual generation is initially unknown and only the probability distribution of the distributed solar generation is used during optimization, with the mean value set as the actual generation.
Table 5 shows the cost impact on the distribution network under these three generation scenarios for distributed solar power. Comparing with Table 4, it can be seen that all these three scenarios achieve lower costs compared with policies μ s and μ e , which shows the effectiveness of the proposed method under different solar power generation scenarios. Comparing the sunny scenario with the other two scenarios, it can be seen that the total operation cost and electricity purchasing cost are the smallest because of the larger generation of distributed solar power in the sunny scenario. Due to the large volatility of the distributed solar power in the highly fluctuating scenario, the total operation cost and the electricity purchasing cost are the largest in order to counteract the uncertainty impact of the distributed solar power. Note that the total operation cost can be larger or smaller than the electricity purchasing cost depending on the EV operation profit, which is discussed in Table 4.

4.7. Energy Storage Control Analysis

Figure 11 shows the variation in the remaining energy of energy storage for node #19. It can be seen that the remaining energy of policy μ e remains zero most of the time. This is because this policy does not consider the power exchange among nodes and its generation cannot satisfy the basic load and the EV charging demand. Therefore, this incurs little energy to store in policy μ e . On the contrary, the proposed policy μ I will store the energy through power exchange among nodes. This can help to reduce the electricity purchase from the grid when the electricity price is high. For example, it can be seen that policy μ I will store much energy during 15:00 to satisfy the high demand at night. Comparing policy μ I with μ s , it can be seen that the stored energy of μ s is more fluctuating than μ I during 14:00 to 19:00. This is because the large number of simulations in policy μ I will provide a better estimation of the future uncertainties, which brings about more stable control performance.

4.8. Operation Analysis for Different IEEE Test Grid

In order to compare the performance difference under a different IEEE test grid, the IEEE 69-bus distribution network is considered, whose data can be derived from [34]. Similar to the experiment settings for the IEEE 33-bus distribution network, node #35, node #65, and node #27 are assumed to be equipped with distributed wind power, distributed solar power, energy storage, and EVs which are located at the end of the distribution network. Node #67 is equipped with an SVC to compensate for the reactive power. The other parameters are kept the same as before. The operation results are shown in Table 6. It can be seen that the proposed method μ I can still largely decrease the total operation cost from CNY 1894.40 to CNY 266.36 in the IEEE 69-bus distribution network when comparing μ I with μ e . This further demonstrates the effectiveness of the proposed method. Comparing the operation results of the IEEE 69-bus with those of the 33-bus by using the proposed method μ I , it can be seen that the total operation cost and purchasing cost both increase due to the larger load demand incurred by the larger number of nodes in the IEEE 69-bus distribution network.

5. Discussion

The integration of large-scale EVs and uncertain distributed wind/solar power brings about economic and security issues for the operation of a distribution network. Based on the proposed two-stage stochastic rolling optimization method, the original active and reactive joint scheduling problem can be decoupled into two sub-problems which are easier to solve. The experiment results show that the operation cost of the distribution network and the charging cost of EV users can be reduced, while the voltage performance of the distribution network can be ensured. These results can be used for several application scenarios, such as pricing for the EV charging market, the low-carbon operation of the distribution network, and cost analysis for the EV user and distribution network.
As aforementioned, the current solution methods can be divided into three categories, i.e., intelligent optimization [8,11], operation research optimization [15,16], and deep reinforcement learning [17,18,19]. Comparing the proposed solution with these solutions, the advantages and disadvantages of these solutions can be summarized as in Table 7. In general, the advantages of the proposed method are the weak requirements for the model structure, supporting stochastic optimization and offering a computation enhancement mechanism. These ensure better optimization performance of the proposed solution. However, the proposed solution cannot find an optimal scheduling policy rapidly unless iterations large enough for policy improvement are implemented. This disadvantage also exists for intelligent optimization and deep reinforcement learning. In future work, the proposed solution method will be improved to enhance its optimal policy search capability by designing a more efficient value function approximation mechanism.
Note that there also exist some limitations for the proposed method. The first is the degradation impact on the EV battery. The frequent charging and discharging behavior will reduce the battery life of EVs. This will reduce the participation degree of EV users for the economic and secure operation of the distribution network. The second is the impact of multi-type EVs on the distribution network. There exist multiple types of EVs in the distribution network, such as electric buses, electric taxis, and electric trucks. Different types of EVs have different driving characteristics, whose impacts on the operation of the distribution network need further study. Therefore, future work will consider these limitations during the modeling for the active and reactive power scheduling of the distribution network. Meanwhile, the proposed solution method will be investigated to solve the extended model.

6. Conclusions

Considering the uncertainties of the distributed wind/solar power and EV charging, this paper proposes a two-stage stochastic rolling optimization framework to obtain an economic and secure operation policy for the distribution network. It can reduce the model solution difficulty by active and reactive power decoupling. The numerical results show that the operation cost of the distribution network can be reduced from CNY 1330.83 to CNY 88.06 when applying the proposed scheduling method. The actual charging price can be reduced by 0.16 CNY/kWh, which is a win–win situation for EV users and the distribution system operator. Furthermore, the voltage profile can also be maintained in an acceptable range. These demonstrate that the economic and secure operation of the distribution network can be simultaneously satisfied by leveraging the proposed method.

Author Contributions

Conceptualization, Y.X.; methodology, J.R.; project administration, Y.X.; resources, D.D.; software, H.Z.; supervision, J.R. and Q.H.; writing—original draft, H.Z.; writing—review and editing, Q.H. and D.D. All authors have read and agreed to the published version of the manuscript.

Funding

This research was supported by the Science and Technology Project of State Grid Zhejiang Electric Power Co., Ltd. (Grant No. B311SX240002).

Institutional Review Board Statement

Not applicable.

Informed Consent Statement

Not applicable.

Data Availability Statement

Data available upon request from the authors.

Conflicts of Interest

Authors Yangchao Xu, Jia Ren, Qiang He and Dongyang Dong were employed by the company State Grid Zhejiang Electric Power Co., Ltd. The authors declare that this study received funding from State Grid Zhejiang Electric Power Co., Ltd. The funder was not involved in the study design, collection, analysis, interpretation of data, the writing of this article or the decision to submit it for publication.

References

  1. Ntombela, M.; Musasa, K.; Moloi, K. A comprehensive review of the incorporation of electric vehicles and renewable energy distributed generation regarding smart grids. World Electr. Veh. J. 2023, 14, 176. [Google Scholar] [CrossRef]
  2. Hemavathi, S.; Shinisha, A. A study on trends and developments in electric vehicle charging technologies. J. Energy Storage 2022, 52, 105013. [Google Scholar] [CrossRef]
  3. Cui, D.; He, J.; Cheng, X.; Liu, Z. Electric vehicle charging transaction model based on alliance blockchain. World Electr. Veh. J. 2023, 14, 192. [Google Scholar] [CrossRef]
  4. Li, C.X.; Shah, N.; Li, Z.; Liu, P. Modelling of wind and solar power output uncertainty in power systems based on historical data: A characterisation through deterministic parameters. J. Clean. Prod. 2024, 484, 144233. [Google Scholar] [CrossRef]
  5. Fambri, G.; Diaz-Londono, C.; Mazza, A.; Badami, M.; Sihvonen, T.; Weiss, R. Techno-economic analysis of power-to-gas plants in a gas and electricity distribution network system with high renewable energy penetration. Appl. Energy 2022, 312, 118743. [Google Scholar] [CrossRef]
  6. Lan, Y.; Zhai, Q.Z.; Liu, X.M.; Guan, X.H. Fast stochastic dual dynamic programming for economic dispatch in distribution systems. IEEE Trans. Power Syst. 2022, 38, 3828–3840. [Google Scholar] [CrossRef]
  7. Hu, J.D.; Ye, C.J.; Ding, Y.; Tang, J.J.; Liu, S. A distributed MPC to exploit reactive power V2G for real-time voltage regulation in distribution networks. IEEE Trans. Smart Grid 2021, 13, 5768–588. [Google Scholar] [CrossRef]
  8. Fu, J.; Han, Y.; Li, W.; Feng, Y.; Zalhaf, A.S.; Zhou, S.; Yang, P.; Wang, C. A novel optimization strategy for line loss reduction in distribution networks with large penetration of distributed generation. Int. J. Electr. Power Energy Syst. 2022, 150, 109112. [Google Scholar] [CrossRef]
  9. Lin, J.; Qiu, J.; Liu, G.; Yao, Z.; Yuan, Z.; Lu, X. A fuzzy logic approach to power system security with non-ideal electric vehicle battery models in vehicle-to-grid systems. IEEE Internet Things J. 2025, 12, 21876–21891. [Google Scholar] [CrossRef]
  10. Liang, H.J.; Pirouzi, S. Energy management system based on economic flexi-reliable operation for the smart distribution network including integrated energy system of hydrogen storage and renewable sources. Energy 2024, 293, 130745. [Google Scholar] [CrossRef]
  11. Li, Y.; Feng, B.; Wang, B.; Sun, S.C. Photovoltaic consumption strategy of distribution network considering carbon emission and user experience. Energy 2022, 245, 123226. [Google Scholar] [CrossRef]
  12. Shi, X.; Xu, Y.; Chen, G.; Guo, Y. An augmented Lagrangian-based safe reinforcement learning algorithm for carbon-oriented optimal scheduling of EV aggregators. IEEE Trans. Smart Grid 2023, 15, 795–809. [Google Scholar] [CrossRef]
  13. Jian, J.; Zhang, M.; Xu, Y.; Tang, W.; He, S. An analytical polytope approximation aggregation of electric vehicles considering uncertainty for the day-ahead distribution network dispatching. IEEE Trans. Sustain. Energy 2023, 15, 160–172. [Google Scholar] [CrossRef]
  14. Xu, X.; Qiu, Z.; Zhang, T.; Gao, H. Distributed source-load-storage cooperative low-carbon scheduling strategy considering vehicle-to-grid aggregators. J. Mod. Power Syst. Clean Energy 2024, 12, 440–453. [Google Scholar] [CrossRef]
  15. Moghari, P.; Chabanloo, R.M.; Torkaman, H. Distribution system reconfiguration based on MILP considering voltage stability. Electr. Power Syst. Res. 2023, 222, 109523. [Google Scholar] [CrossRef]
  16. Chowdhury, M.M.; Biswas, B.D.; Kamalasadan, S. Second-order cone programming (SOCP) model for three phase optimal power flow (OPF) in active distribution networks. IEEE Trans. Smart Grid 2023, 14, 3732–3743. [Google Scholar] [CrossRef]
  17. Guo, C.Y.; Wang, X.; Zheng, Y.H.; Zhang, F. Optimal energy management of multi-microgrids connected to distribution system based on deep reinforcement learning. Int. J. Electr. Power Energy Syst. 2021, 131, 107048. [Google Scholar] [CrossRef]
  18. Li, H.P.; He, H.B. Learning to operate distribution networks with safe deep reinforcement learning. IEEE Trans. Smart Grid 2022, 13, 1860–1872. [Google Scholar] [CrossRef]
  19. Lu, Y.; Xiang, Y.; Huang, Y.; Yu, B.; Weng, L.G.; Liu, J.Y. Deep reinforcement learning based optimal scheduling of active distribution system considering distributed generation, energy storage and flexible load. Energy 2023, 271, 127087. [Google Scholar] [CrossRef]
  20. Dolatabadi, S.H.; Ghorbanian, M.; Siano, P.; Hatziargyriou, N.D. An enhanced IEEE 33 bus benchmark test system for distribution system studies. IEEE Trans. Power Syst. 2021, 36, 2565–2572. [Google Scholar] [CrossRef]
  21. Zhang, H.C.; Hu, Z.C.; Xu, Z.W.; Song, Y.H. Evaluation of achievable vehicle-to-grid capacity using aggregate PEV model. IEEE Trans. Power Syst. 2016, 32, 784–794. [Google Scholar] [CrossRef]
  22. Powell, W.B. Reinforcement Learning and Stochastic Optimization: A Unified Framework for Sequential Decisions; Wiley: Hoboken, NJ, USA, 2022. [Google Scholar]
  23. Bertsekas, D. Multiagent reinforcement learning: Rollout and policy iteration. IEEE CAA J. Autom. Sin. 2021, 8, 249–272. [Google Scholar] [CrossRef]
  24. Long, T.; Jia, Q.S.; Wang, G.M.; Yang, Y. Efficient real-time EV charging scheduling via ordinal optimization. IEEE Trans. Smart Grid 2021, 12, 4029–4038. [Google Scholar] [CrossRef]
  25. Bhattacharya, S.; Kailas, S.; Badyal, S.; Gil, S.; Bertsekas, D. Multiagent reinforcement learning: Rollout and policy iteration for pomdp with application to multirobot problems. IEEE Trans. Robot. 2023, 40, 2003–2023. [Google Scholar] [CrossRef]
  26. Lin, Z.C.; Huang, X.R.; Xiao, X. A novel model predictive control formulation for wave energy converters based on the reactive rollout method. IEEE Trans. Sustain. Energy 2022, 13, 491–500. [Google Scholar] [CrossRef]
  27. Puterman, M.L. Markov Decision Processes; John Wiley & Sons: Hoboken, NJ, USA, 1994. [Google Scholar]
  28. Zeng, F.; Yuan, X.; Pan, Y.; Wang, M.; Miao, H.; Han, H.; Lyu, S. GWO-based charging price determination for charging station with competitor awareness. Electr. Eng. 2024, 106, 7587–7601. [Google Scholar] [CrossRef]
  29. Wu, L.; Shahidehpour, M.; Li, Z. Comparison of scenario-based and interval optimization approaches to stochastic SCUC. IEEE Trans. Power Syst. 2011, 27, 913–921. [Google Scholar] [CrossRef]
  30. Rujeerapaiboon, N.; Schindler, K.; Kuhn, D.; Wiesemann, W. Scenario reduction revisited: Fundamental limits and guarantees. Math. Program. 2022, 191, 207–242. [Google Scholar] [CrossRef]
  31. Alizadeh, F.; Goldfarb, D. Second-order cone programming. Math. Program. 2003, 95, 3–51. [Google Scholar] [CrossRef]
  32. Baran, M.; Wu, F. Network reconfiguration in distribution systems for loss reduction and load balancing. IEEE Trans. Power Del. 1989, 4, 1401–1407. [Google Scholar] [CrossRef]
  33. Li, J.; Xiao, Y.; Lu, S. Optimal configuration of multi microgrid electric hydrogen hybrid energy storage capacity based on distributed robustness. J. Energy Storage 2024, 76, 109762. [Google Scholar] [CrossRef]
  34. Bach, K. A novel method for global voltage sag compensation in IEEE 69 bus distribution system by dynamic voltage restorers. J. Eng. Sci. Technol. 2019, 14, 1893–1911. [Google Scholar]
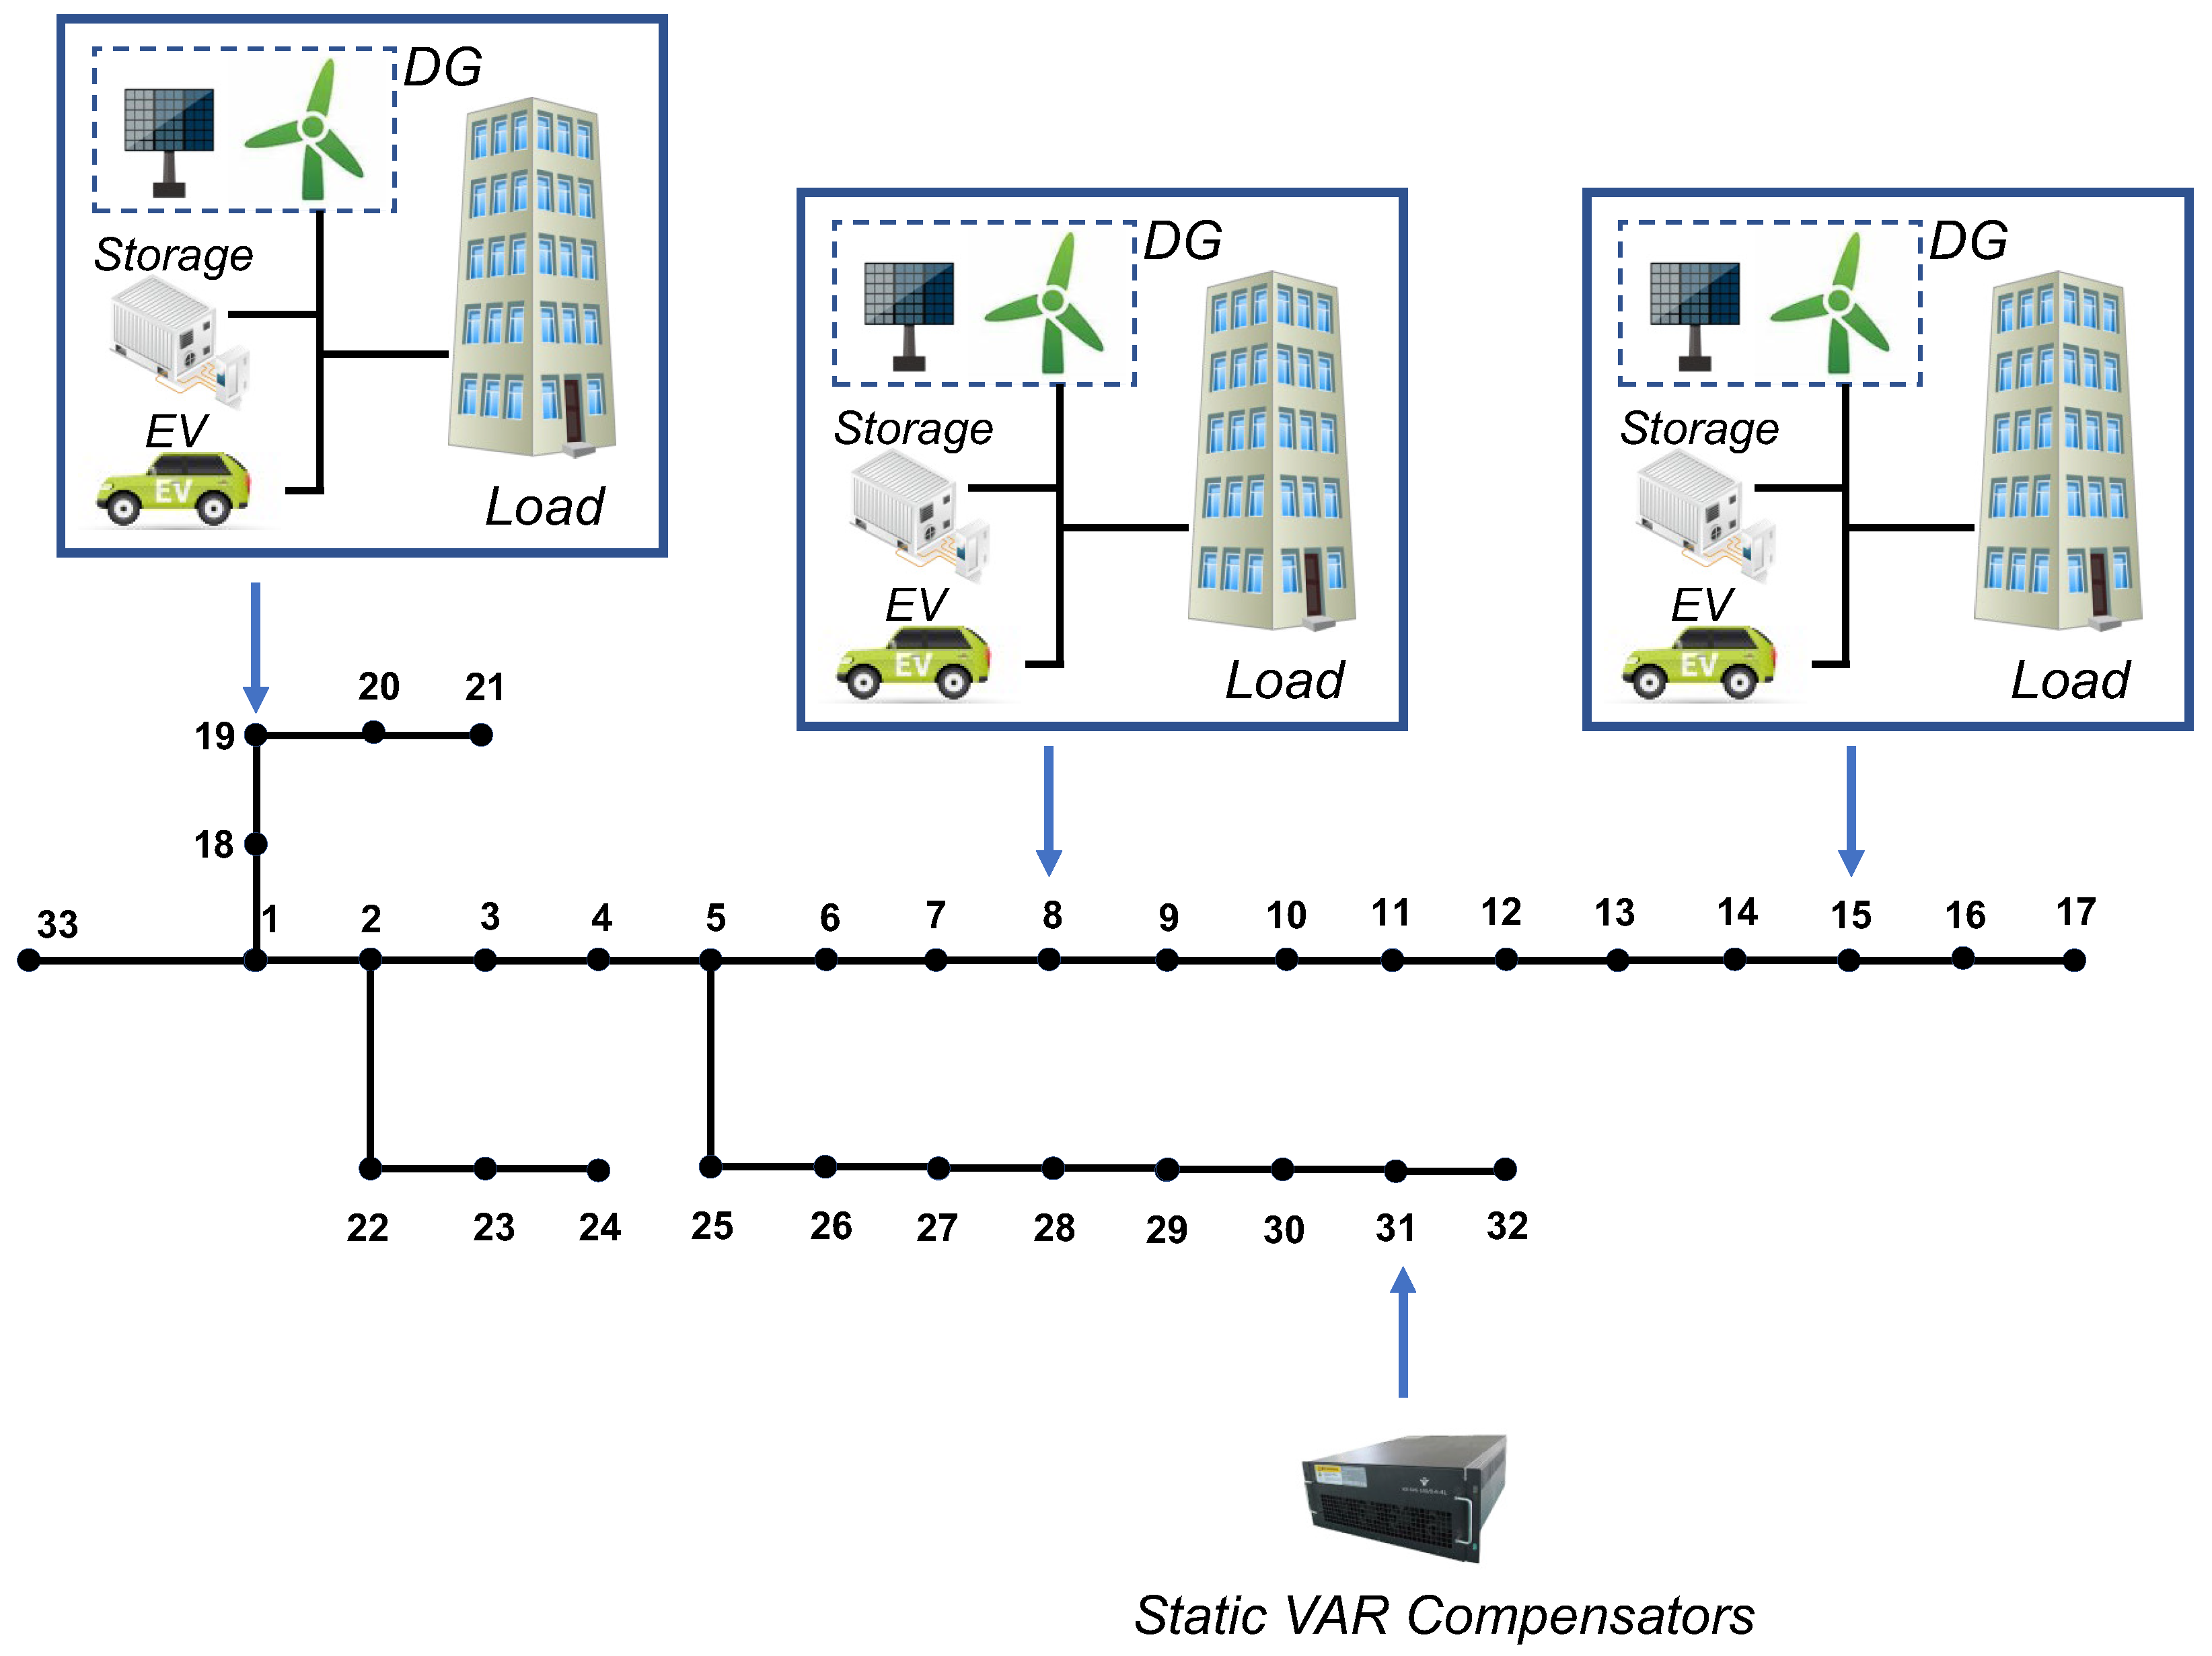
Figure 1. Typical scenario for the active and reactive power scheduling of the distribution system.
Wevj 16 00515 g001
Figure 2. Actual generation of distributed wind power and solar power at node #19, node #8, and node #15.
Wevj 16 00515 g002
Figure 3. Number of parked EVs at node #19, node #8, and node #15.
Wevj 16 00515 g003
Figure 4. Upper and lower bounds of accumulated EV energy at node #19, node #8, and node #15.
Wevj 16 00515 g004
Figure 5. Aggregated power for EVs at node #19.
Wevj 16 00515 g005
Figure 6. Exchange power analysis for node #19.
Wevj 16 00515 g006
Figure 7. Purchase power analysis for node #19.
Wevj 16 00515 g007
Figure 8. Voltage performance analysis for distribution network.
Wevj 16 00515 g008
Figure 9. Voltage deviation analysis for distribution network.
Wevj 16 00515 g009
Figure 10. Actual generation of distributed solar power on sunny, cloudy, and highly fluctuating day.
Wevj 16 00515 g010
Figure 11. Remaining energy analysis of the energy storage for node #19.
Wevj 16 00515 g011
Table 1. Comparisons between the proposed work and related work.
References Economic DispatchOperation SecurityUncertain DGUncertain Charging DemandEV Aggregation
[3,17]
[4]
[5]
[6]
[7,11]
[8]
[9,19]
[10]
[12,13,14]
[15,16]
[18]
Proposed Work
Table 2. Load profile settings at each node in IEEE 33-bus distribution network.
NodeActive PowerReactive PowerNodeActive PowerReactive Power
193.33 kw48 kvar1884 kw32 kvar
284 kw32 kvar1984 kw32 kvar
3112 kw64 kvar2084 kw32 kvar
456 kw24 kvar2184 kw32 kvar
556 kw16 kvar2284 kw40 kvar
6186.67 kw80 kvar23392 kw160 kvar
7186.67 kw80 kvar24392 kw160 kvar
856 kw16 kvar2556 kw20 kvar
956 kw16 kvar2656 kw20 kvar
1042 kw24 kvar2756 kw16 kvar
1156 kw28 kvar28112 kw56 kvar
1256 kw28 kvar29186.67 kw480 kvar
13112 kw64 kvar30140 kw56 kvar
1456 kw8 kvar31196 kw80 kvar
1556 kw16 kvar3256 kw32 kvar
1656 kw16 kvar330 kw0 kvar
1784 kw32 kvar
Table 3. Parameter settings.
ParameterSettingParameterSetting
e c a p , n 66 kWhP6.6 kW
s o c max , n 0.9 s o c min , n 0.1
e ¯ j 1200 kWh λ τ e x 0.5 CNY/kWh
λ τ w 0.35 CNY/kWh λ τ s 0.35 CNY/kWh
T24 h p ¯ j 300 kW
q ̲ j c −0.2 MVar q ¯ j c 1 MVar
Table 4. Operation results for policies μ I , μ s , and μ e .
PolicyOper.
Cost
Purchasing
Cost
EV Oper.
Profit
EV Sub.
Cost
Solar Gen.
Cost
Wind Gen.
Cost
μ I CNY 88.06CNY 83.51CNY −3547.58CNY 1478.50CNY 1623.60CNY 450.03
μ s CNY 524.81CNY 266.49CNY −3293.81CNY 1478.50CNY 1623.60CNY 450.03
μ e CNY 1330.83CNY 2020.28CNY −4241.58CNY 1478.50CNY 1623.60CNY 450.03
Table 5. Operation results for different generation scenarios of distributed solar power.
ScenarioSunnyCloudyHighly Fluctuating
Total Operation CostCNY 88.06CNY 234.76CNY 350.81
Electricity Purchasing CostCNY 83.51CNY 286.95CNY 343.43
Table 6. Operation analysis for different IEEE test grid.
Test GridOper. CostPurchasing CostEV Oper. Profit
69-bus with μ I CNY 266.36CNY 126.57CNY 3412.34
69-bus with μ e CNY 1894.40CNY 2197.70CNY 3855.43
33-bus with μ I CNY 88.06CNY 83.51CNY 3547.58
Table 7. Comparisons between the proposed solution and related solutions.
ReferencesModel RequirementStochastic OptimizationComputation EnhancementPolicy
Optimality
[8,11]WeakNot SupportedNoNear Optimal
[15,16]StrongNot SupportedYesOptimal
[17,18,19]WeakSupportedNoNear Optimal
Proposed SolutionWeakSupportedYesNear Optimal
Disclaimer/Publisher’s Note: The statements, opinions and data contained in all publications are solely those of the individual author(s) and contributor(s) and not of MDPI and/or the editor(s). MDPI and/or the editor(s) disclaim responsibility for any injury to people or property resulting from any ideas, methods, instructions or products referred to in the content.