Article

A Bibliometric Analysis of the Research on Electromobility and Its Implications for Kuwait

1
Kuwait Institute for Scientific Research (KISR), P.O. Box 24885, Safat, Kuwait City 13109, Kuwait
2
LSE Middle East Centre (MEC), Centre for Sustainability Research and Consultancy (CSRC)—Australian University (AU), Tebyan Group, Salhiya Complex, Gate 6, Office 116, Safat, Kuwait City 13095, Kuwait
*
Author to whom correspondence should be addressed.
World Electr. Veh. J. 2025, 16(8), 458; https://doi.org/10.3390/wevj16080458
Submission received: 27 May 2025 / Revised: 27 July 2025 / Accepted: 3 August 2025 / Published: 11 August 2025

Abstract

This article examines the evolution of the most extensively researched subjects in e-mobility during the previous two decades. The objective of this analysis is to identify the lessons that the State of Kuwait, which is falling behind other nations in terms of e-mobility, can learn from in its efforts to adopt electric vehicles (EVs). To strengthen the body of knowledge and determine the most effective and efficient route to an “EV-ready” nation, the authors compiled data on the latest developments in the EV industry. A bibliometric analysis was performed on 3962 articles using VOSviewer software, which identified six noteworthy clusters that warranted further discussion. Additionally, we examined the sequential progression of these clusters as follows: (1) the environmental ramifications of electric mobility; (2) advancements in EV technology, including range extension and soundless engines, as well as the capital expenditure (CAPEX) and operating expenditure (OPEX) of purchasing and operating EVs; (3) concerns regarding the effectiveness and durability of EV batteries; (4) the availability of EV charging stations and grid integration; (5) charging time; and, finally, (6) the origin and source of the energy used in the development of e-mobility. Delineating critical aspects in the development of e-mobility can help to equip policymakers and decision makers in Kuwait in formulating timely and economical choices pertaining to sustainable transportation. This study contributes by cross-walking six global bibliometric clusters to Kuwait’s ten EV adoption barriers and mapping each to actionable policy levers, linking evidence to deployment guidance for an emerging market grid. Unlike prior bibliometric overviews, our analysis is Kuwait-specific and heat-contextual, and it reports each cluster’s size and recency to show where the field is moving. Using Kuwait driving logs, we found that summer (avg 43.2 °C) reduced the effective full-charge range by 24% versus pre-winter (approximately 244 km vs. 321 km), underscoring the need for shaded PV-coupled hyper-hubs and active thermal management.

1. Introduction

1.1. Energy Efficiency of Electric Vehicles vs. Internal Combustion Engine Cars

Many criteria are used when comparing EVs to ICE automobiles, such as capital and operational price factors, the quality of driving, ease of use and maintenance, and environmental factors. One of the most critical criteria for EVs, along with the environmental one, is energy efficiency. Upstream and tailpipe emissions account for all of the greenhouse gas (GHG) emissions in the transportation sector. Upstream emissions originate from power plants and analogous sources, while tailpipe emissions are produced by vehicles. When the upstream emissions are held constant, transitioning to electric vehicles (EVs) can effectively mitigate emissions [1]. Transitioning to EVs is strongly advised to significantly reduce total global carbon dioxide (CO2) emissions from the transportation sector, which currently stand at 16%. EVs are particularly well suited to supplant internal combustion engine (ICE) cars due to their superior energy efficiency and comparatively low energy losses relative to the systems that supply energy to ICEs. EVs are five times more efficient than ICE vehicles at delivering energy to axles [2]. A well-to-tank analysis revealed a mere 6% power loss [2] compared to the 45% power loss observed in gasoline sourcing [3]. Combining well-to-tank and tank-to-wheel analyses revealed an even more pronounced efficiency gap in favor of EVs over ICE vehicles. Research on tank-to-wheel energy efficiency has indicated that the efficiency of EVs greatly supersedes that of internal combustion engine automobiles, regardless of whether they are powered by gasoline or diesel. One of the primary reasons for this glaring contrast between EVs and ICEs is that ICEs fail to fully use their energy value, converting most of their fuel energy value into heat rather than power for the wheels [4] (see Figure 1). The enormous efficiency disparity between ICEs and EVs raises the question of whether ICE technology is obsolete and will soon be replaced by electric-powered vehicles. An examination of e-mobility using a well-to-wheel analysis revealed a mere 23% energy loss, or 77% efficiency, in contrast to the substantial 84% energy loss, or mere 16% efficiency, observed in vehicles powered by liquid petrol/gasoline [5]. This disparity in efficiency is of the order of nearly five times. Hence, the difference in carbon footprint, which is contingent upon the source of electricity, assumes a subordinate position when juxtaposed with the difference in efficiency [6]. The fuel efficiency of internal combustion engines is projected to gradually increase up to 2050. However, greater efficiency gains are anticipated from EV batteries, particularly with the advent of solid-state batteries, which represent a significant leap in efficiency from production to usage [7].
This study differs from prior bibliometrics by cross-walking six global clusters directly to Kuwait’s ten EV-adoption barriers and by adding a Kuwait-specific performance case under extreme heat. We translate each cluster into actionable policy levers (see Section 4), moving beyond descriptive mapping to deployment guidance for an emerging-market grid.

1.2. Other Benefits of EVs over ICE Vehicles

EVs have many other advantages over ICEs: they do not produce tailpipe emissions or pollutants, they make less noise, and they have fewer moving parts, leading to significantly lower maintenance costs. However, even though many developments have occurred in terms of vehicle appearance, performance, etc., according to the International Energy Agency (IEA), only 9% of newly sold cars in 2021 were EVs [1]. Half of all EVs sold in 2021 were purchased in China, and another 40% were sold in the USA and Europe. The rest of the world combined only bought about 10% of the EVs sold in 2021. Many of the countries with emerging markets, such as the State of Kuwait, have close to zero contributions towards developing sustainable, electric transportation. Without all countries’ involvement, achieving the IEA’s target of 30% of new vehicles sold globally in 2030 being EVs will be a complicated task. To increase the EV market share in emerging markets to a reasonable level, much planning and financial support is needed, in addition to transferring knowledge and best practices from countries that are further along in their EV transition.
Recent behavioral work shows that perceived reliability and residual-value risk are the dominant drivers of EV reluctance [8], a pattern that mirrors the concerns we observe in Kuwait’s surveys [9]. Clarifying these psycho-social barriers early would allow policy instruments to target range anxiety and resale price guarantees in tandem.

1.3. Reasons for Low EV Adoption Rates in Emerging Markets

The World Economic Forum identified four crucial reasons for the low EV adoption rates in emerging markets: first, the difference in the cost of purchasing a new EV or an ICE vehicle; second, fear of the risk of EV vehicle/battery fires; third, the lack of support and dealership facilities; and fourth, the lack of charging facilities [10].
The “10-reason” survey drew from Kuwait’s car-owning population via a stratified web panel (600 valid responses; 52% male; fielded 5–19 September 2023). The sample frame was the Public Authority for Civil Information’s vehicle registration list; quotas reflected the national distribution of age, gender, and governorate. The margin of error was ±4% at 95% confidence. Questions were piloted in Arabic and English. Ethical approval: LSE-REC #00558000004KJE9AAO.
In addition to the above reasons, ten reasons were presented at a conference on the future of sustainable transportation in Kuwait, where the results of a two-year exhaustive mixed-method study were presented. In-depth qualitative interviews were conducted with all automobile dealers who sold EVs; 15 current owners of EVs in Kuwait were qualitatively interviewed in depth, and a comprehensive survey of 600 participants was administered to determine the conditions under which they would purchase an EV as their next vehicle.
(1) The findings of these studies indicated that the primary factor contributing to the low EV adoption rates was the lack of public fast charging stations with a charging power of 300–500 kW direct current (DC to DC).
(2) The second reason was Kuwaiti landlords’ hesitancy to permit EV owners to install EV wall-box chargers and charge their vehicles on their property for fear of fire and interference with household electricity, particularly the air conditioning units. This adamant opposition to the home charging of EVs effectively prevented the expatriate population (comprising around 75% of the population) from owning EVs, since real estate ownership in the State of Kuwait is restricted to Kuwaiti nationals only.
(3) Thirdly, Kuwait has one of the most affordable petroleum retail prices in the world. However, substantial subsidies are also provided for residential electricity, whereas residential electricity is sold for USD 0.03 per kWh compared to USD 0.13 per kWh and USD 0.14 per kWh in the USA and the world on average, respectively. The cost of electric charging is approximately one-fourth that of gasoline, even though gasoline is priced as low as USD 0.3 per liter. Even though there are typically fuel price savings of around USD 50 per month, this amount is simply not enough on its own to encourage the switch to electric. This is especially true given that to see these savings, EV owners would typically need to buy a home charging station (wall box), which costs around USD 1.500–1.700 to install, and it takes around 2–3 years to achieve any fuel savings [11].
(4) An additional factor contributing to the limited uptake of EVs in Kuwait was their prohibitively high purchase price, which is typically 30% higher than that of an equivalent ICE vehicle with a comparable body. Notably, this substantial price differential is primarily attributable to the absence of a financial incentive program in Kuwait, which gives no preference for EVs over ICE vehicles [12].
(5) The fifth reason cited was that Kuwaiti consumers who are in the market for new vehicles are risk-averse in general and are especially skeptical about the durability of lithium batteries in Kuwait’s extreme heat conditions.
(6) The sixth reason was the absence of an EV community. While Kuwaiti consumers typically seek guidance from their peer group before making significant purchasing decisions (e.g., purchasing a new car), it is difficult to find a reliable source of advice among friends and family for EVs, which comprise less than 1% of the automobiles in the country.
(7) Existing EV owners in Kuwait cited a seventh reason for low adoption: dealerships’ reluctance to develop technical capacity due to the minimal or nonexistent EV maintenance services, which generate negligible to no profit.
(8) The eighth reason was also given by EV owners, who complained that the exceptionally high speedbumps in residential areas to deter low-riding muscle cars from entering were particularly hazardous; the battery, which is the most expensive component of an electric vehicle and is positioned beneath it, could be damaged in areas where the ground clearance does not exceed a speedbump’s height.
(9) The lack of designated EV facilities (excluding DC fast charging (DCFC) stations), such as priority lanes and designated parking, was the ninth reason for the low rate of EV adoption in comparison with that in other nations. EV owners expressed dissatisfaction with the tendency of drivers to park ICE vehicles in specified EV parking areas or alternating-current charging stations, given that the consequences for parking in EV facilities will cease to apply by the end of 2023 [12,13,14].
(10) The final reason provided was the lack of environmental zeal among policymakers and decision makers, in contrast to other countries, where numerous political parties are devoted to environmental causes. Others noted that the correlation between the participation of women in politics and government support for ecological initiatives is quite robust. The political participation of women is generally inadequate in most nations with emerging markets. A recent OECD study on women and transport demonstrated that women gave more attention to environmental factors than men, and women in power supported more environmental transportation policies, with strong correlations between the percentage of EVs vs. ICE vehicles sold to representatives in congress and governments.
To assist nations with emerging markets, such as the State of Kuwait, in becoming “EV ready” and catching up to the rest of the world, the authors of this study determined from interviews and surveys that the above 10 points warrant priority in the development of an efficient and effective set of recommendations for nations who have not yet adopted EVs and are still in the process of establishing a sustainable transportation system [15,16,17,18,19,20].

2. Methodology

2.1. What Is Bibliometric Analysis?

To verify if our 10 reasons for low EV adoption in Kuwait were congruent with theoretical interest, a bibliometric analysis (BA) was chosen as the guiding methodology of this paper. BA involves a quantitative software application used by researchers to conduct literature reviews and identify emergent research trends within a specific field [21]. BA gained considerable popularity after the advancement of available software packages such as Gephi Version 0.10.0, Leximancer Version 5.0, and VOSviewer version 1.6.20, which can run scientific databases provided by Scopus and Web of Science. BA can be used to conduct a cross-disciplinary analysis of bibliometric methodology, employing large volumes of scientific data and generating high-impact research. The analysis of data mining, mathematical, and statistical functionalities enables researchers to systematically visualize trends. Numerous researchers have employed this methodology to augment their knowledge bases more efficiently and in less time in comparison with the conventional qualitative approach to data analysis. Before undertaking an extensive literature review, scholars [22,23,24,25,26,27,28] have employed bibliometric analyses to identify noteworthy domains that warrant their attention. Similarly, numerous researchers have employed BA as an initial methodology in their investigations. Fifteen publishing houses and their affiliated partners that accepted articles for Scopus-indexed journals in 2021 are detailed in Table 1.

2.2. VOX-Viewer Methodology

The developed methodology (see Figure 2) is described in detail in this subsection. For quality purposes, we selected and limited our search to Scopus-accepted journals. The search was carried out in Scopus with the following criteria:
TITLE (electric AND vehicle) AND PUBYEAR > 2000 AND (LIMIT-TO (SUBJAREA, “ENER”)) AND (LIMIT-TO (LANGUAGE, “English”)) AND (LIMIT-TO (EXACTKEYWORD, “Electric Vehicle”) OR LIMIT-TO (EXACTKEYWORD, “Charging (batteries)”))
We searched for articles in the English language that were published after 2000 about energy and that had “electric vehicle” in their title and either “electric vehicle” or “charging (batteries)” as keywords.
Accordingly, 3962 references were extracted from the search and exported to 19 Research Information System (.ris) files, which were later merged into a single file. The data represented studies conducted by researchers from 93 countries, with most of the contributions being from China and the USA.
The volume of EV-related articles published in Scopus-indexed journals was unmanageable. Consequently, the outcomes were refined through the inclusion of a keyword proposed by Scopus, namely, “Charging (Batteries)”. Given this study’s focus on developing infrastructure for emerging electricity markets, we are confident that the inclusion of this keyword did not affect the outcomes. Using this keyword, the number of search results was reduced to a manageable level while preserving this study’s context. The numbers of citations and the years of publication were entered into a table.
Clustering aims to facilitate the comprehension of large information sets by categorizing them into distinct groups or labels [29]. One simple example of cluster analysis is dividing consumers into distinct categories so that each can be managed appropriately. Although cluster analysis provides a comprehensive understanding of numerous fields and related subfields, the researchers decided to choose their areas of interest. A thousand keywords were categorized into six clusters and assigned names based on their frequency of occurrence with the assistance of the VOSviewer software. Each cluster is described in detail below. For Section 4, we cross-referenced each bibliometric cluster to the ten Kuwaiti non-adoption factors by matching keyword themes to survey codes (see Appendix A for the mapping table).
Reproducibility note (data extraction). Database: Scopus. Extraction date: 15 February 2024. Primary query (exact Scopus syntax):
TITLE (electric AND vehicle) AND PUBYEAR > 2000 AND (LIMIT-TO (SUBJAREA, “ENER”)) AND (LIMIT-TO (LANGUAGE, “English”)) AND (LIMIT-TO (EXACTKEYWORD, “Electric Vehicle”) OR LIMIT-TO (EXACTKEYWORD, “Charging (batteries)”)).
Variants tested (not used in the final run): adding EXACTKEYWORD(“battery electric vehicle”) and EXACTKEYWORD(“fast charging”). Exclusions: duplicates, editorials, non-English.
In the next step, the review of the published literature was uploaded to VOSviewer—Ver 1.6.20, a Java-based software that is freely available to the research community. With the help of this software, users can construct a network of various attributes of scientific publications, such as authors and keywords. It accepts database files, reference manager files, and application programming interfaces (APIs) as inputs [30]. In this study, we used reference manager files to input data into the software. Accordingly, the combined RIS file was uploaded, and the software was run. Among the various options available to visualize the data, we selected a combination of options, as explained in Figure 3 and Table 2.
From the first version of network mapping (Figure 3), it was clear that different authors used slightly different but similar keywords, with 2055 keywords used in total.
To improve readability, we decided to merge similar keywords to avoid confusion. By doing so, we reduced the number of keywords to 1000, the default number of keywords appearing in the VOSviewer software. Old and suggested keywords listed in a thesaurus file were used to replace the existing keywords. Examples of a few sets of keywords (old and new) that appear often are presented in Table 3. The merging/creation of new keywords was discussed in detail with all the authors, who spent time developing the thesaurus file.
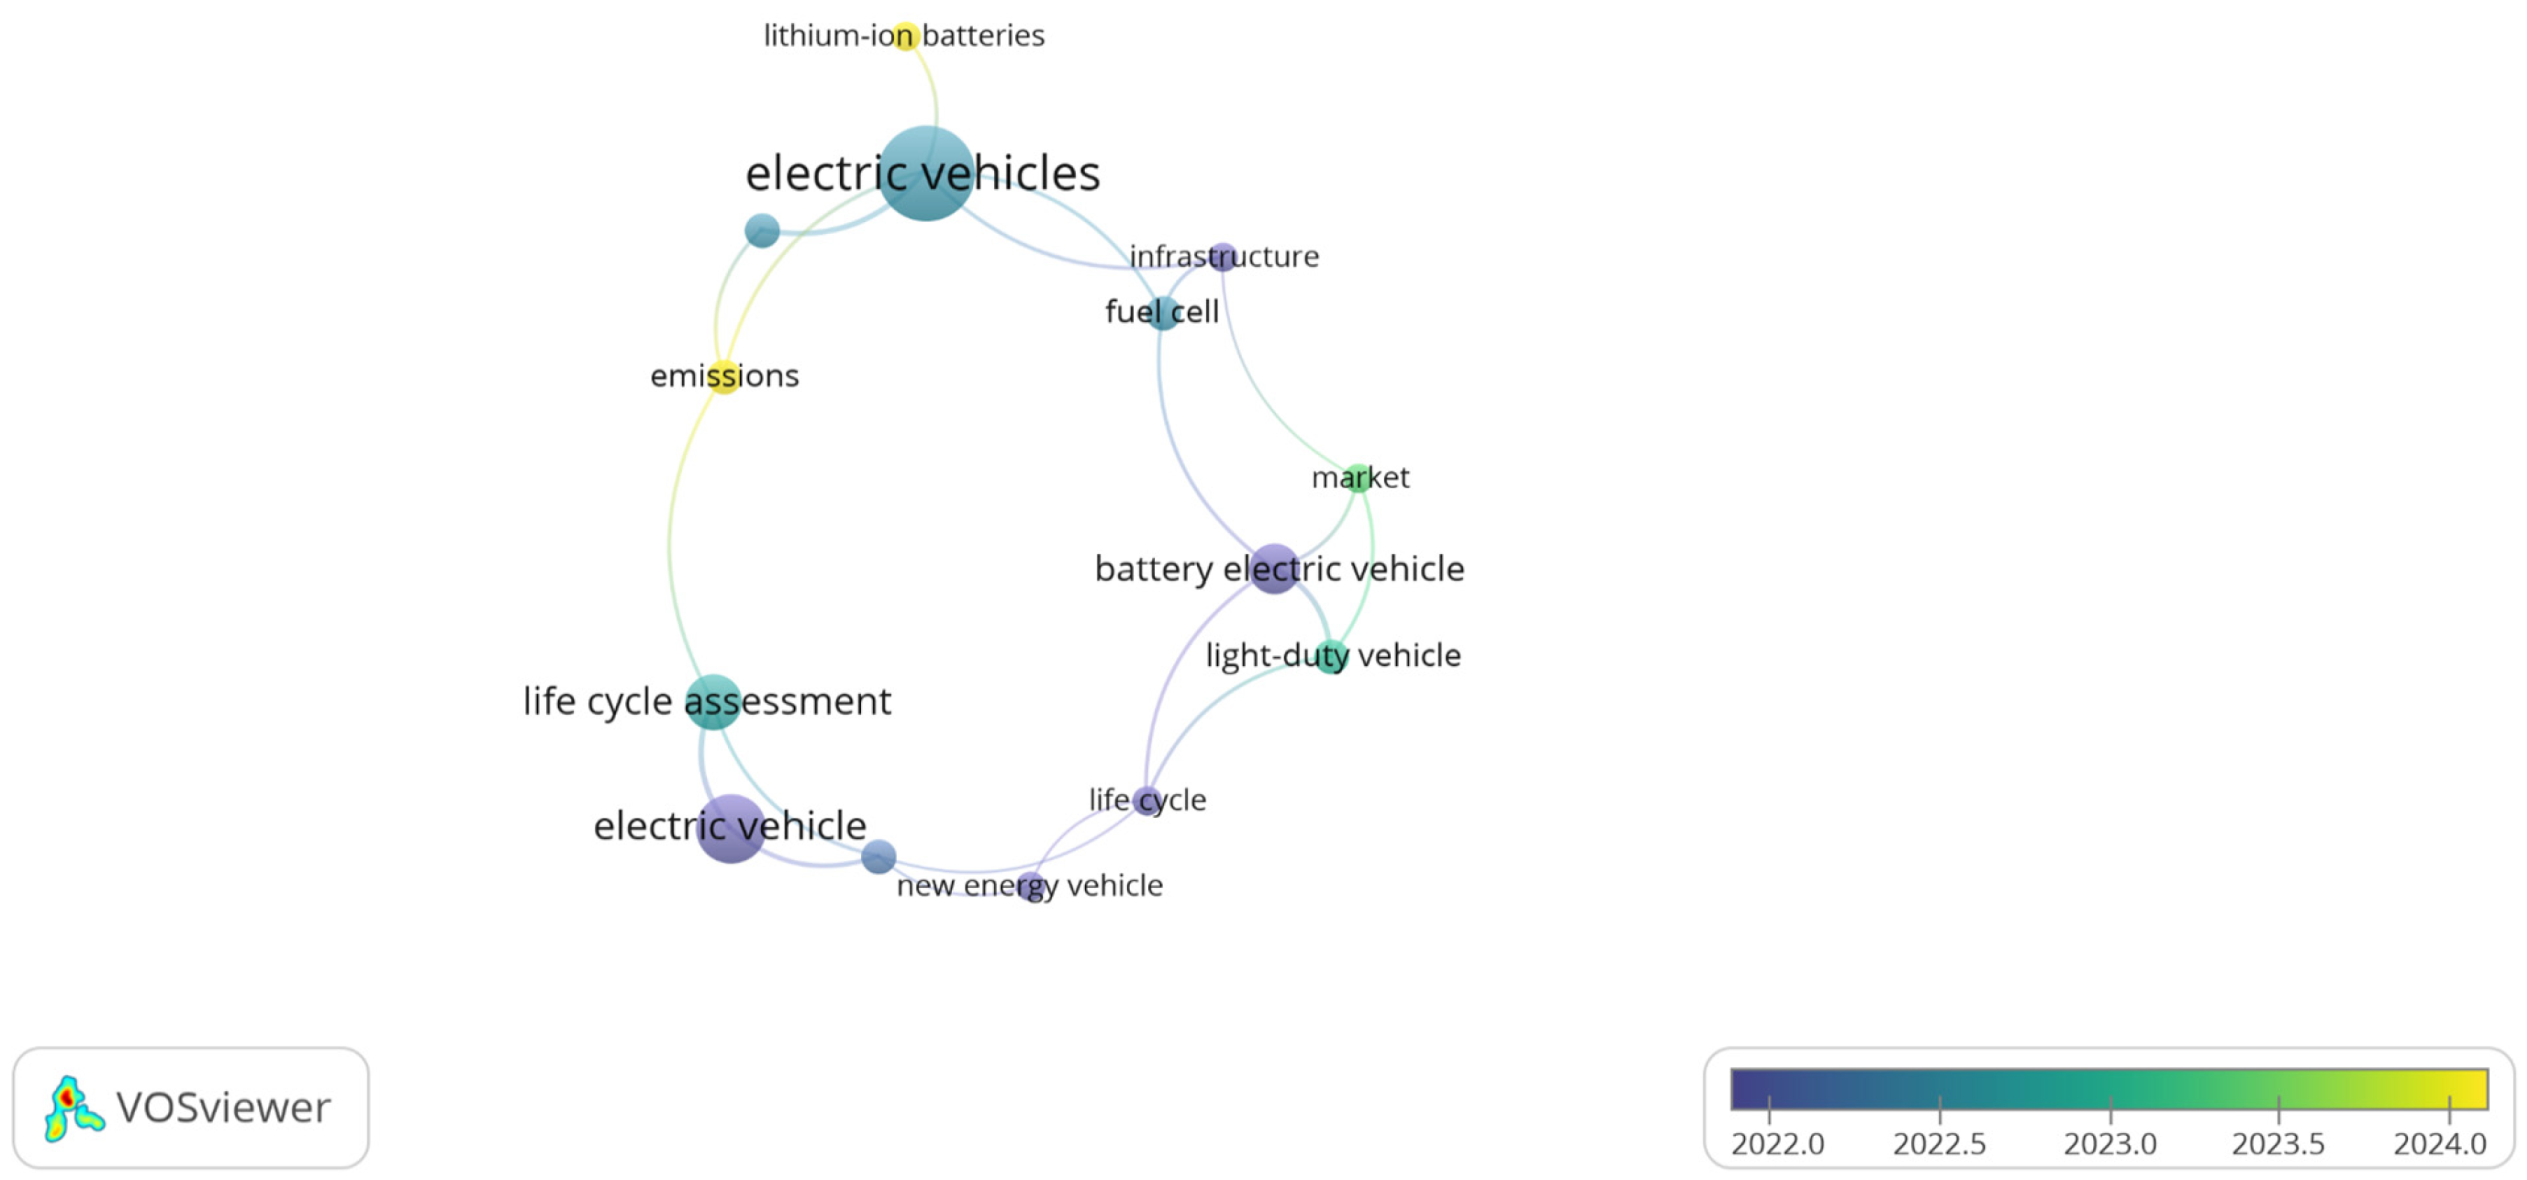
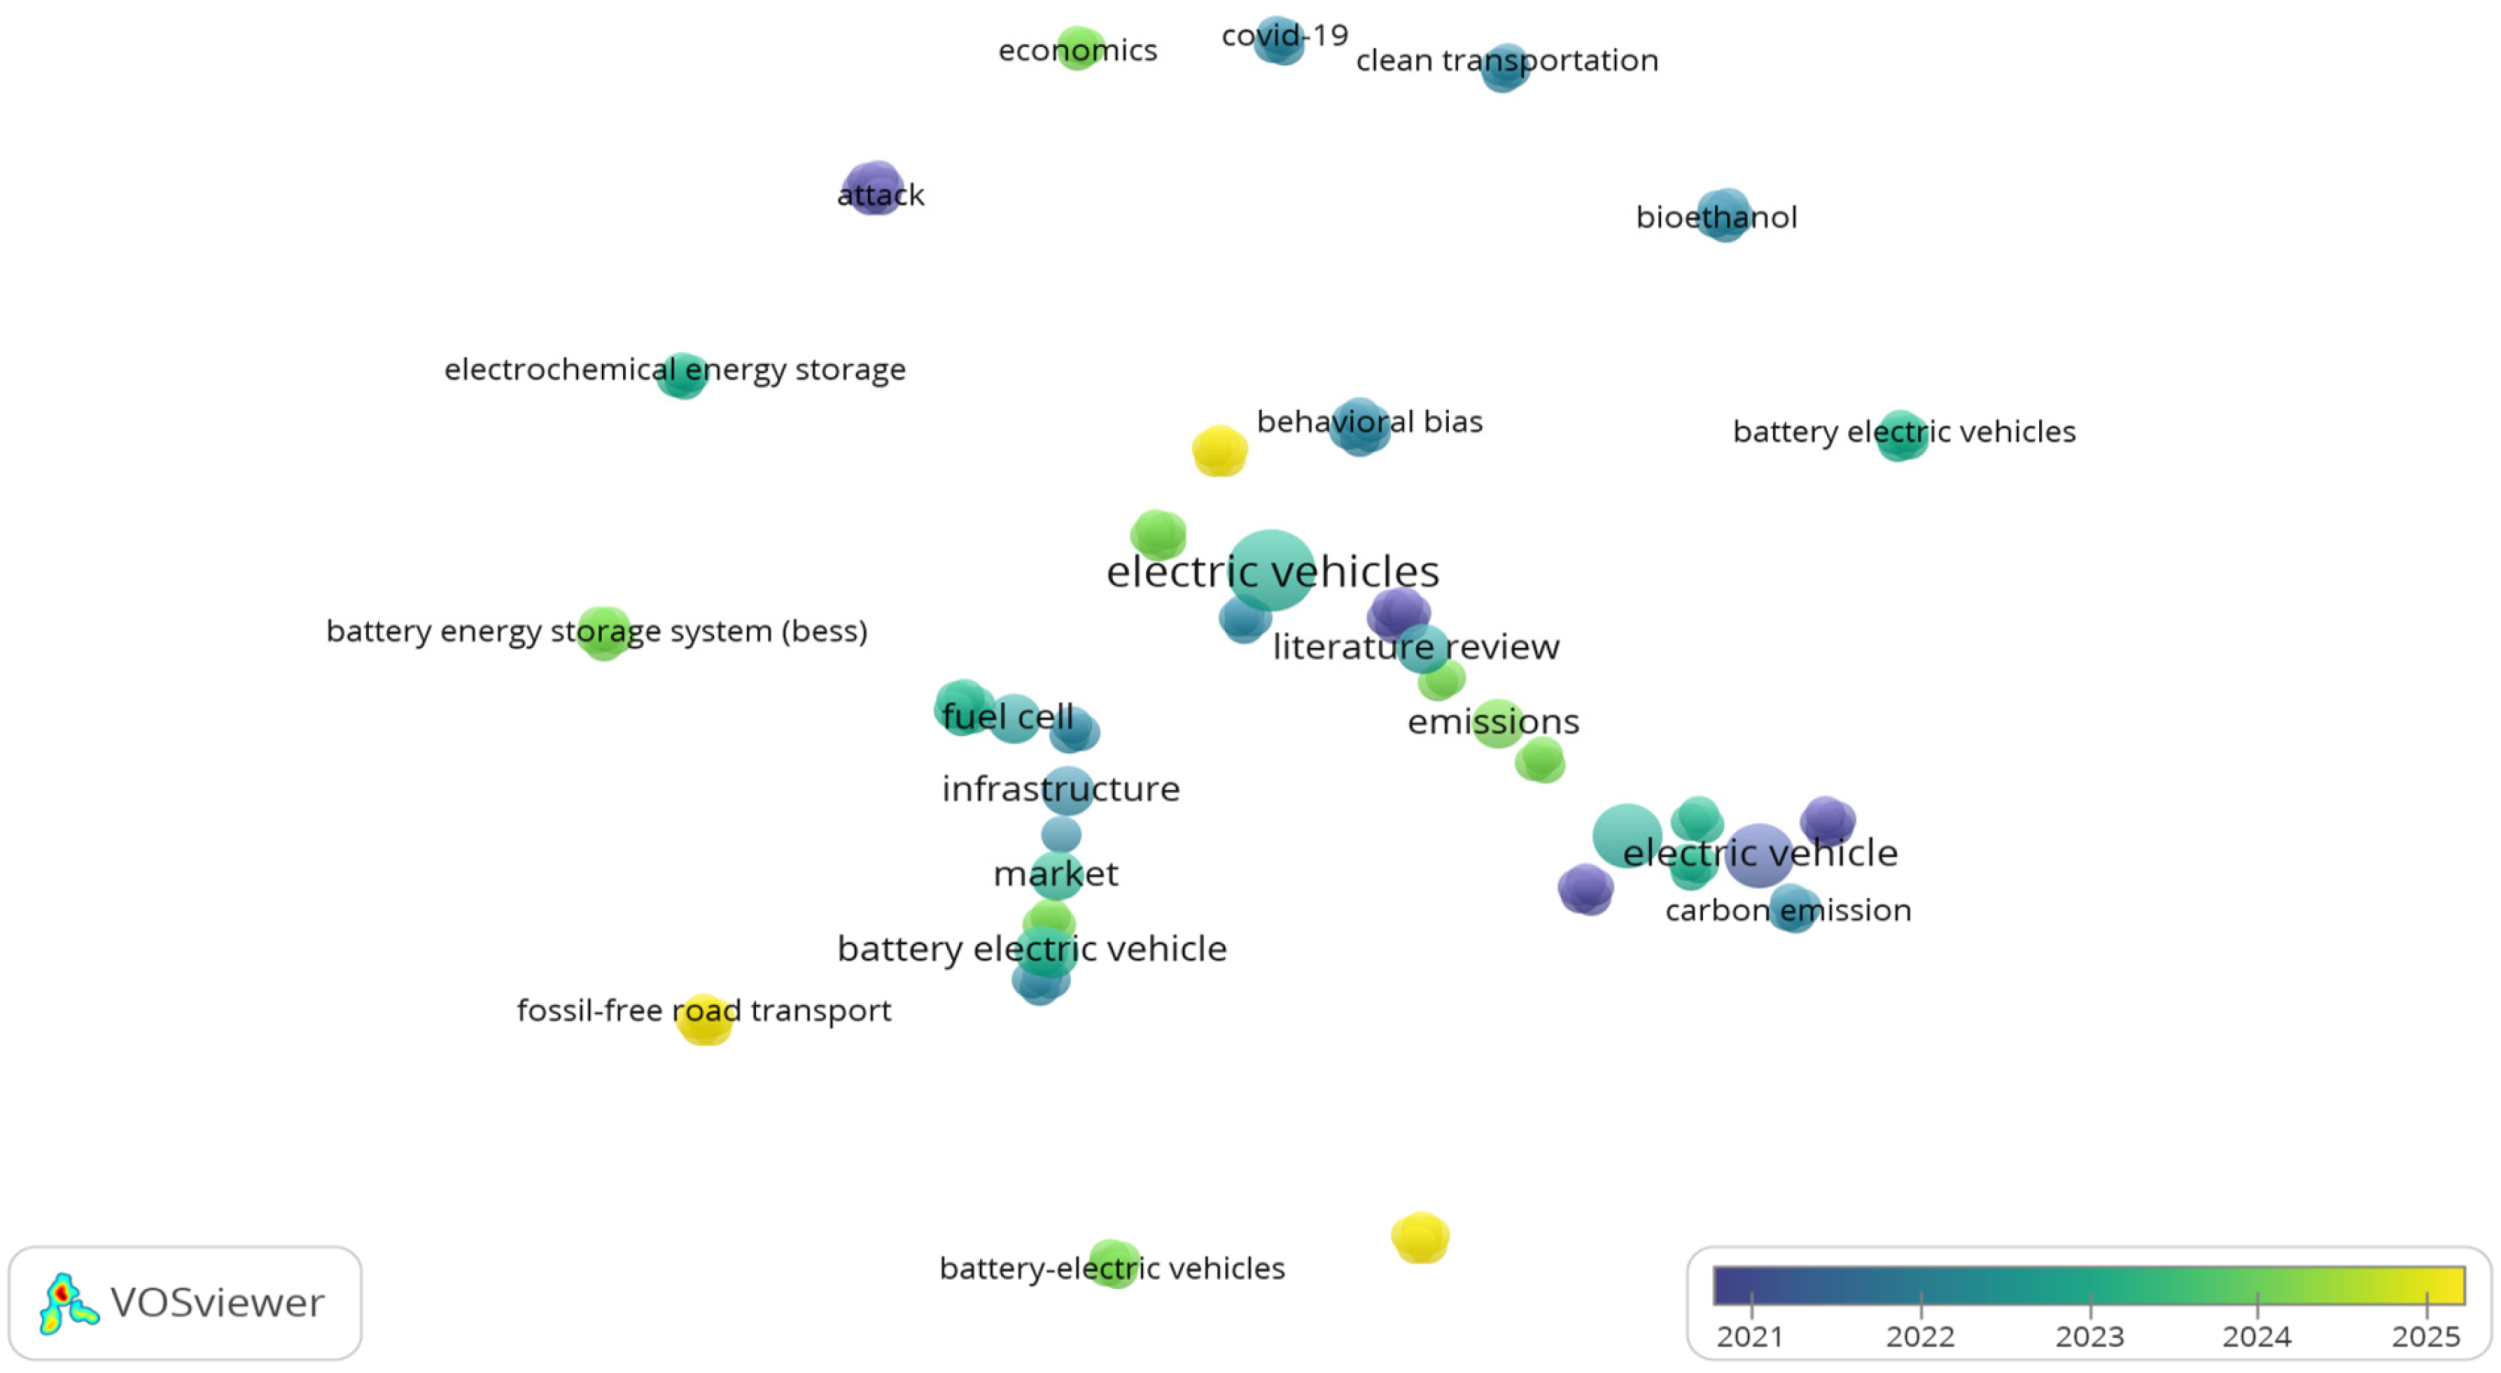
To minimize synonym noise, we merged lexically equivalent keywords (e.g., BEV → battery electric vehicle; EVs → electric vehicle; V2G → vehicle-to-grid; PV → photovoltaic; Li-ion/LIB → lithium-ion battery) into a master thesaurus before running VOSviewer. The minimum occurrence threshold was ≥ 5; sensitivity checks at 4 and 6 changed cluster membership by <3%, confirming robustness. We capped the retained keywords at 1000 and used the VOSviewer thesaurus format [31]. The second-phase map (Figure 4a) and the overlay timeline (Figure 4b) reflect the cleaner vocabulary, with a marked post-2017 rise in wireless-charging and vehicle-to-grid terms.
One important feature of VOSviewer is its ability to cluster references based on their occurrences and co-occurrences. Cluster analysis is a blind data management model providing output [29]. Accordingly, the software arranged all 1000 keywords into six clusters. Even though the software did not suggest any names for the clusters, we named them based on our understanding of them, as shown in Table 4. A detailed elaboration of the results is given in the following section.

3. Results and Discussion

Table 2 summarizes the two-stage screening flow, and Figure 5 visualizes the publication and citation trends. As Figure 5 shows, the scientific community has conducted extensive research on EVs over the last two decades.

3.1. Cluster Analysis

Table 2 summarizes the two-stage screening flow, and Figure 5 visualizes the publication and citation trends using clustering diagnostics. VOSviewer used association strength normalization, Leiden clustering (resolution = 1.00), fractional counting, and a minimum keyword occurrence of ≥5. The cluster names reflect the top five keywords (by link strength) within each group. This yielded six well-separated communities.

3.2. Cluster 1: Charging Station

This cluster (Figure 6) helped us to understand that several developments took place in the areas of EVs and charging stations. Since 2023, the field has pivoted from single-station optimization to corridor-level hyper-hub planning (multi-bay sites co-locating ≥350 kW DC fast chargers with PV carports and stationary storage) [32] to shave peaks [33,34]. For Kuwait, the implication for designing infrastructure is to prioritize shaded solar canopies (which have a dual benefit: insolation harvest and thermal mitigation) [35]. In the visualization, even though the co-occurrence of the keyword “electric vehicle” was higher than that of “charging station”, much research is being conducted around charging stations. Hence, more attention is given to exploring recent trends related to the keyword “charging station” and other associated keywords in this section.
Charging stations mainly function in two ways: conductive and inductive charging. As the name suggests, conductive charging can be called wired charging, while inductive charging is wireless. Conductive charging can be divided into overnight depot charging and pantograph charging. Overnight depot charging stations are typically equipped with slow chargers; this is also known as type 1 charging [36]. This charging method is used for vehicles with high capacities, such as buses and trucks. Their batteries can be charged at bus stops and truck loading and unloading bays by connecting to a charging pole. Usually, high-power DC lines are recommended for this purpose. Pantograph charging can also be carried out in two ways. In the first case, all charging equipment is kept on the roof of a waiting area for buses. Connecting to it allows batteries to be charged very quickly with an amount sufficient to drive the vehicle to the next station. In the second case, all necessary equipment is installed on the bus roof, where the pantograph can directly connect to overhead lines.
With the help of a model, the authors explained the various components of a system for managing EV charging stations. The charging framework suggested allows EVs to communicate with charging stations in the network; they can select a station based on the travel time and waiting time [37]. So-what for Kuwait: prioritize shaded DC fast charging (DCFC) hyper hubs co-located with PV canopies and on-site storage to shave peaks and mitigate heat-related performance losses.

3.3. Cluster 2: Battery Management Systems

The popularity of battery management systems (BMSs) is linked to that of lithium-ion batteries (LIBs). Research now couples physics-based aging models with on-board machine learning-based predictors of health status that run in real time [38]. Implementing such BMS upgrades can extend cycle life by 15–20% in Gulf climates where calendar aging is accelerated [39]. Recent studies combine empirical models with machine learning predictors to estimate RUL/SoH and show that high-temperature operation (≥45 °C) accelerates degradation; functional safety aspects are also central in large-pack BMS designs [38,39,40]. The performance of LIBs is subject to factors such as overvoltage and temperature variations. With the help of proper sensors, BMSs monitor and control the health of the LIBs, for example, through charge balancing and thermal management. In addition to safeguarding LIBs from high-voltage stress, short-circuit currents, and other critical parameters, BMSs help improve the overall performance and safety of LIBs. They also accurately predict the remaining amount of energy required for travel. As seen in Figure 7, this concerns the efficiency and effectiveness of the whole charging system, from electricity generation to the battery giving power to the wheels [41]. Two themes seem to emerge here. The first theme is the effectiveness and scalability of home charging using a 380 V wall-box charger. The second theme that emerges is the speed of public direct-current fast charging (DCFC). Interestingly, the topic of battery swapping has gathered much attention, as battery swapping seems to be the only current technology that can compete with the time that it takes to fill ICE vehicles with gasoline (5 min) [42]. Recent evidence shows that lithium-ion cells age much faster at hot-climate temperatures (≥45 °C), underscoring the need for conservative charge/thermal limits, accurate state-of-health estimation, and BMS functional safety controls. So-what for Kuwait: require BMS designs and procurement specs that emphasize active thermal management and real-time state-of-health monitoring, with summer heat validation, to slow battery aging and maintain range.

3.4. Cluster 3: Vehicle–Grid Integration

EVs connected to the grid are called grid-able EVs (GEV). The recent literature converges on bidirectional charging tariffs indexed to marginal fuel cost; Californian aggregators earned USD 110 vehicle−1 yr−1 in 2024 demand–response markets [43]. For Kuwait’s subsidized tariff (0.002 KWD kWh−1), V2G is only profitable if fuel subsidies are reformed. Vehicle-to-grid integration (VGI) can be viewed both in terms of energy transfer from the grid to the vehicle or from the vehicle to the grid [44]. A VGI-enabled vehicle can receive electricity from the grid and supply it to the grid if required. In a typical scenario, VGI-enabled vehicles can charge their batteries fully during the nighttime and use the charge to drive during the daytime. Such facilities should be aligned with demand–response programs so that the EV owners receive extra revenue in addition to their free commute. Demand–response programs are one way of managing demand by involving end-users. Similarly, EV owners can also support each other in cases of emergency by charging and discharging. Recent research has pointed out many benefits of VGI, such as there being less anxiety, more incentives, backup power for homes, emission control, and other social aspects. Different strategies involving VGI are being employed. These are grid-to-vehicle (G2V), vehicle-to-grid (V2G), and vehicle-to-vehicle (V2V) strategies.
Typical G2V connections come in two types: AC and DC. DC charging is comparatively faster than AC charging. Chargers that are placed inside an EV are called on-board chargers, while those placed outside are called off-board chargers. On-board chargers come in different variations, such as single-stage, two-stage, integrated, and multifunctional chargers. Likewise, off-board chargers are classified into bidirectional AC-to-DC converters, unidirectional AC-to-DC converters, bidirectional DC-to-DC conductors, and unidirectional DC-to-DC converters [45].
In the V2G scenario, EVs act as virtual power stations and are implemented differently. The most promising strategy is charging EVs using RE sources when they are not running and are in a static position in either parking lots or other locations with access to charging. The excess energy stored in EVs can be exported to the grid during peak hours, which would generally be managed through software. Studies suggest that a fully charged EV can power a house for five hours. According to a projection made by the authors in 2025, if appropriately implemented, California will have half a million EVs, which could provide 1 GW of storage capacity.
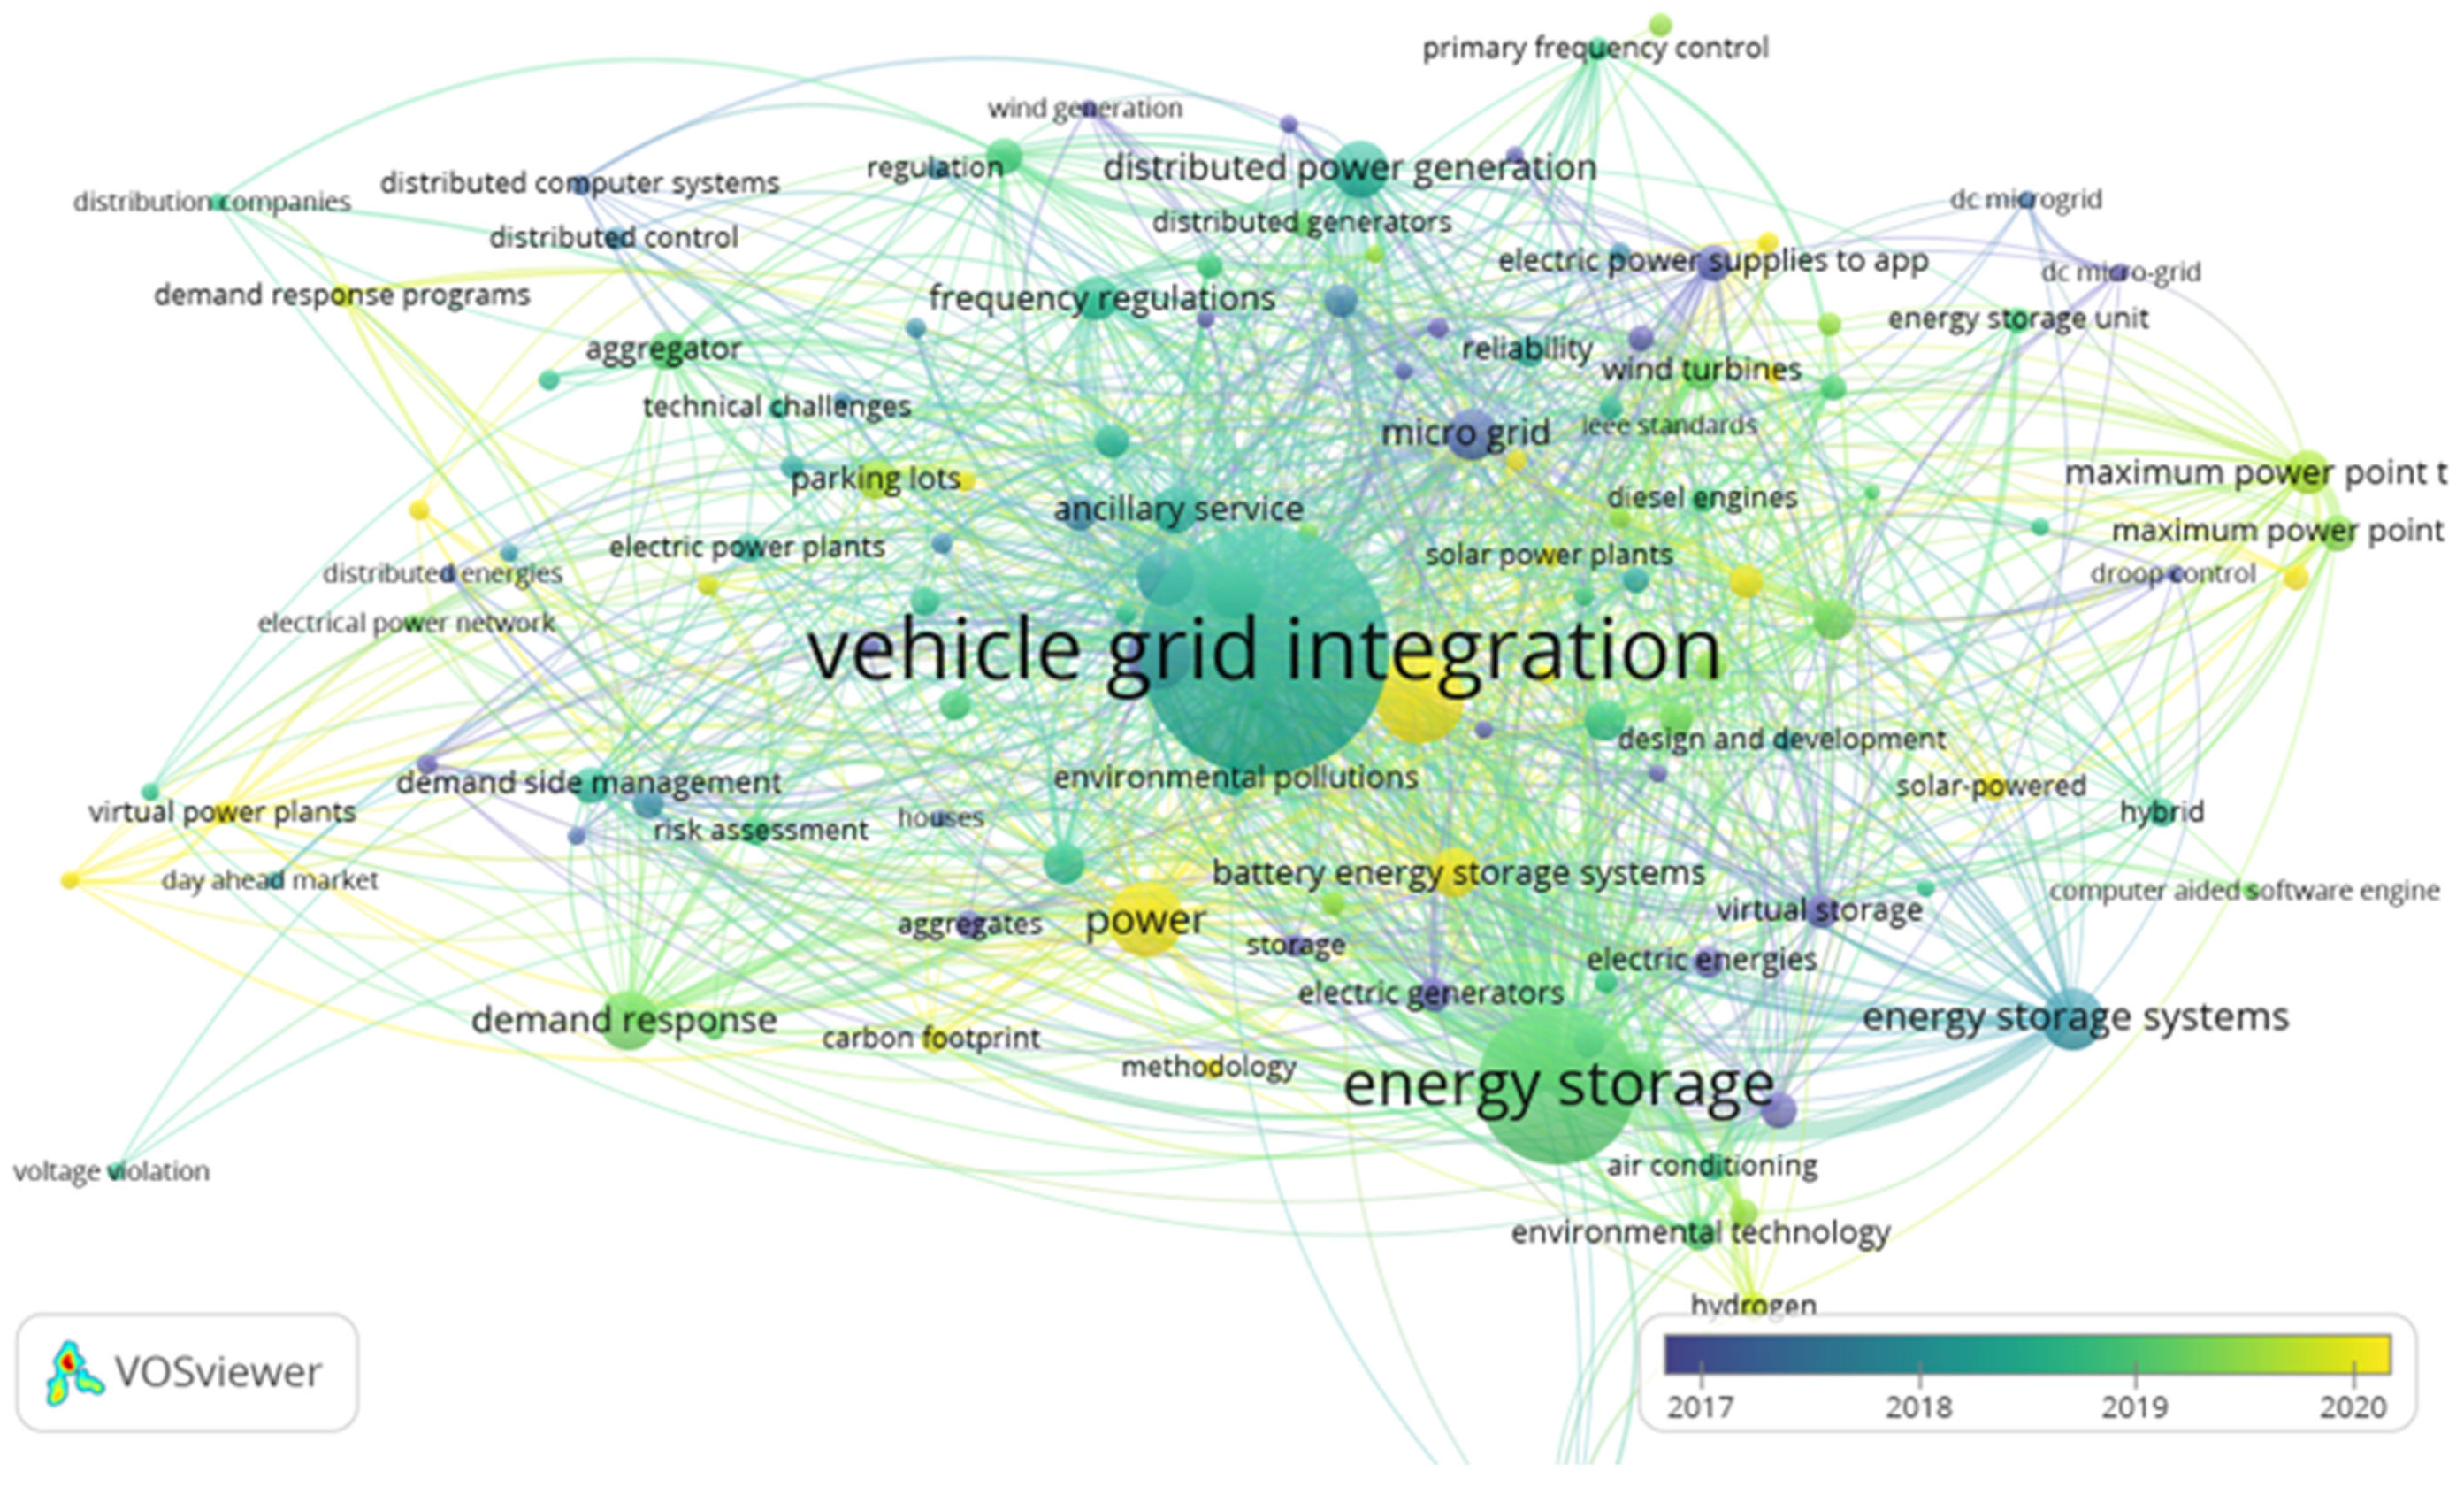
In the V2V scenario, EVs are charged from an adjacent donor vehicle in either a conductive or inductive manner. Even though this strategy is used during emergencies where electric charging stations are not nearby, the potential of using this method in other areas is still being studied. Figure 8 visualizes the prominence of VGI. So-what for Kuwait: run depot-based V2G pilots with high utilization fleets under a simple time-of-use tariff; use bidirectional chargers with aggregator control and feeder export limits to shave evening peaks and provide contingency reserves.

3.5. Cluster 4: Battery Swapping and Logistics

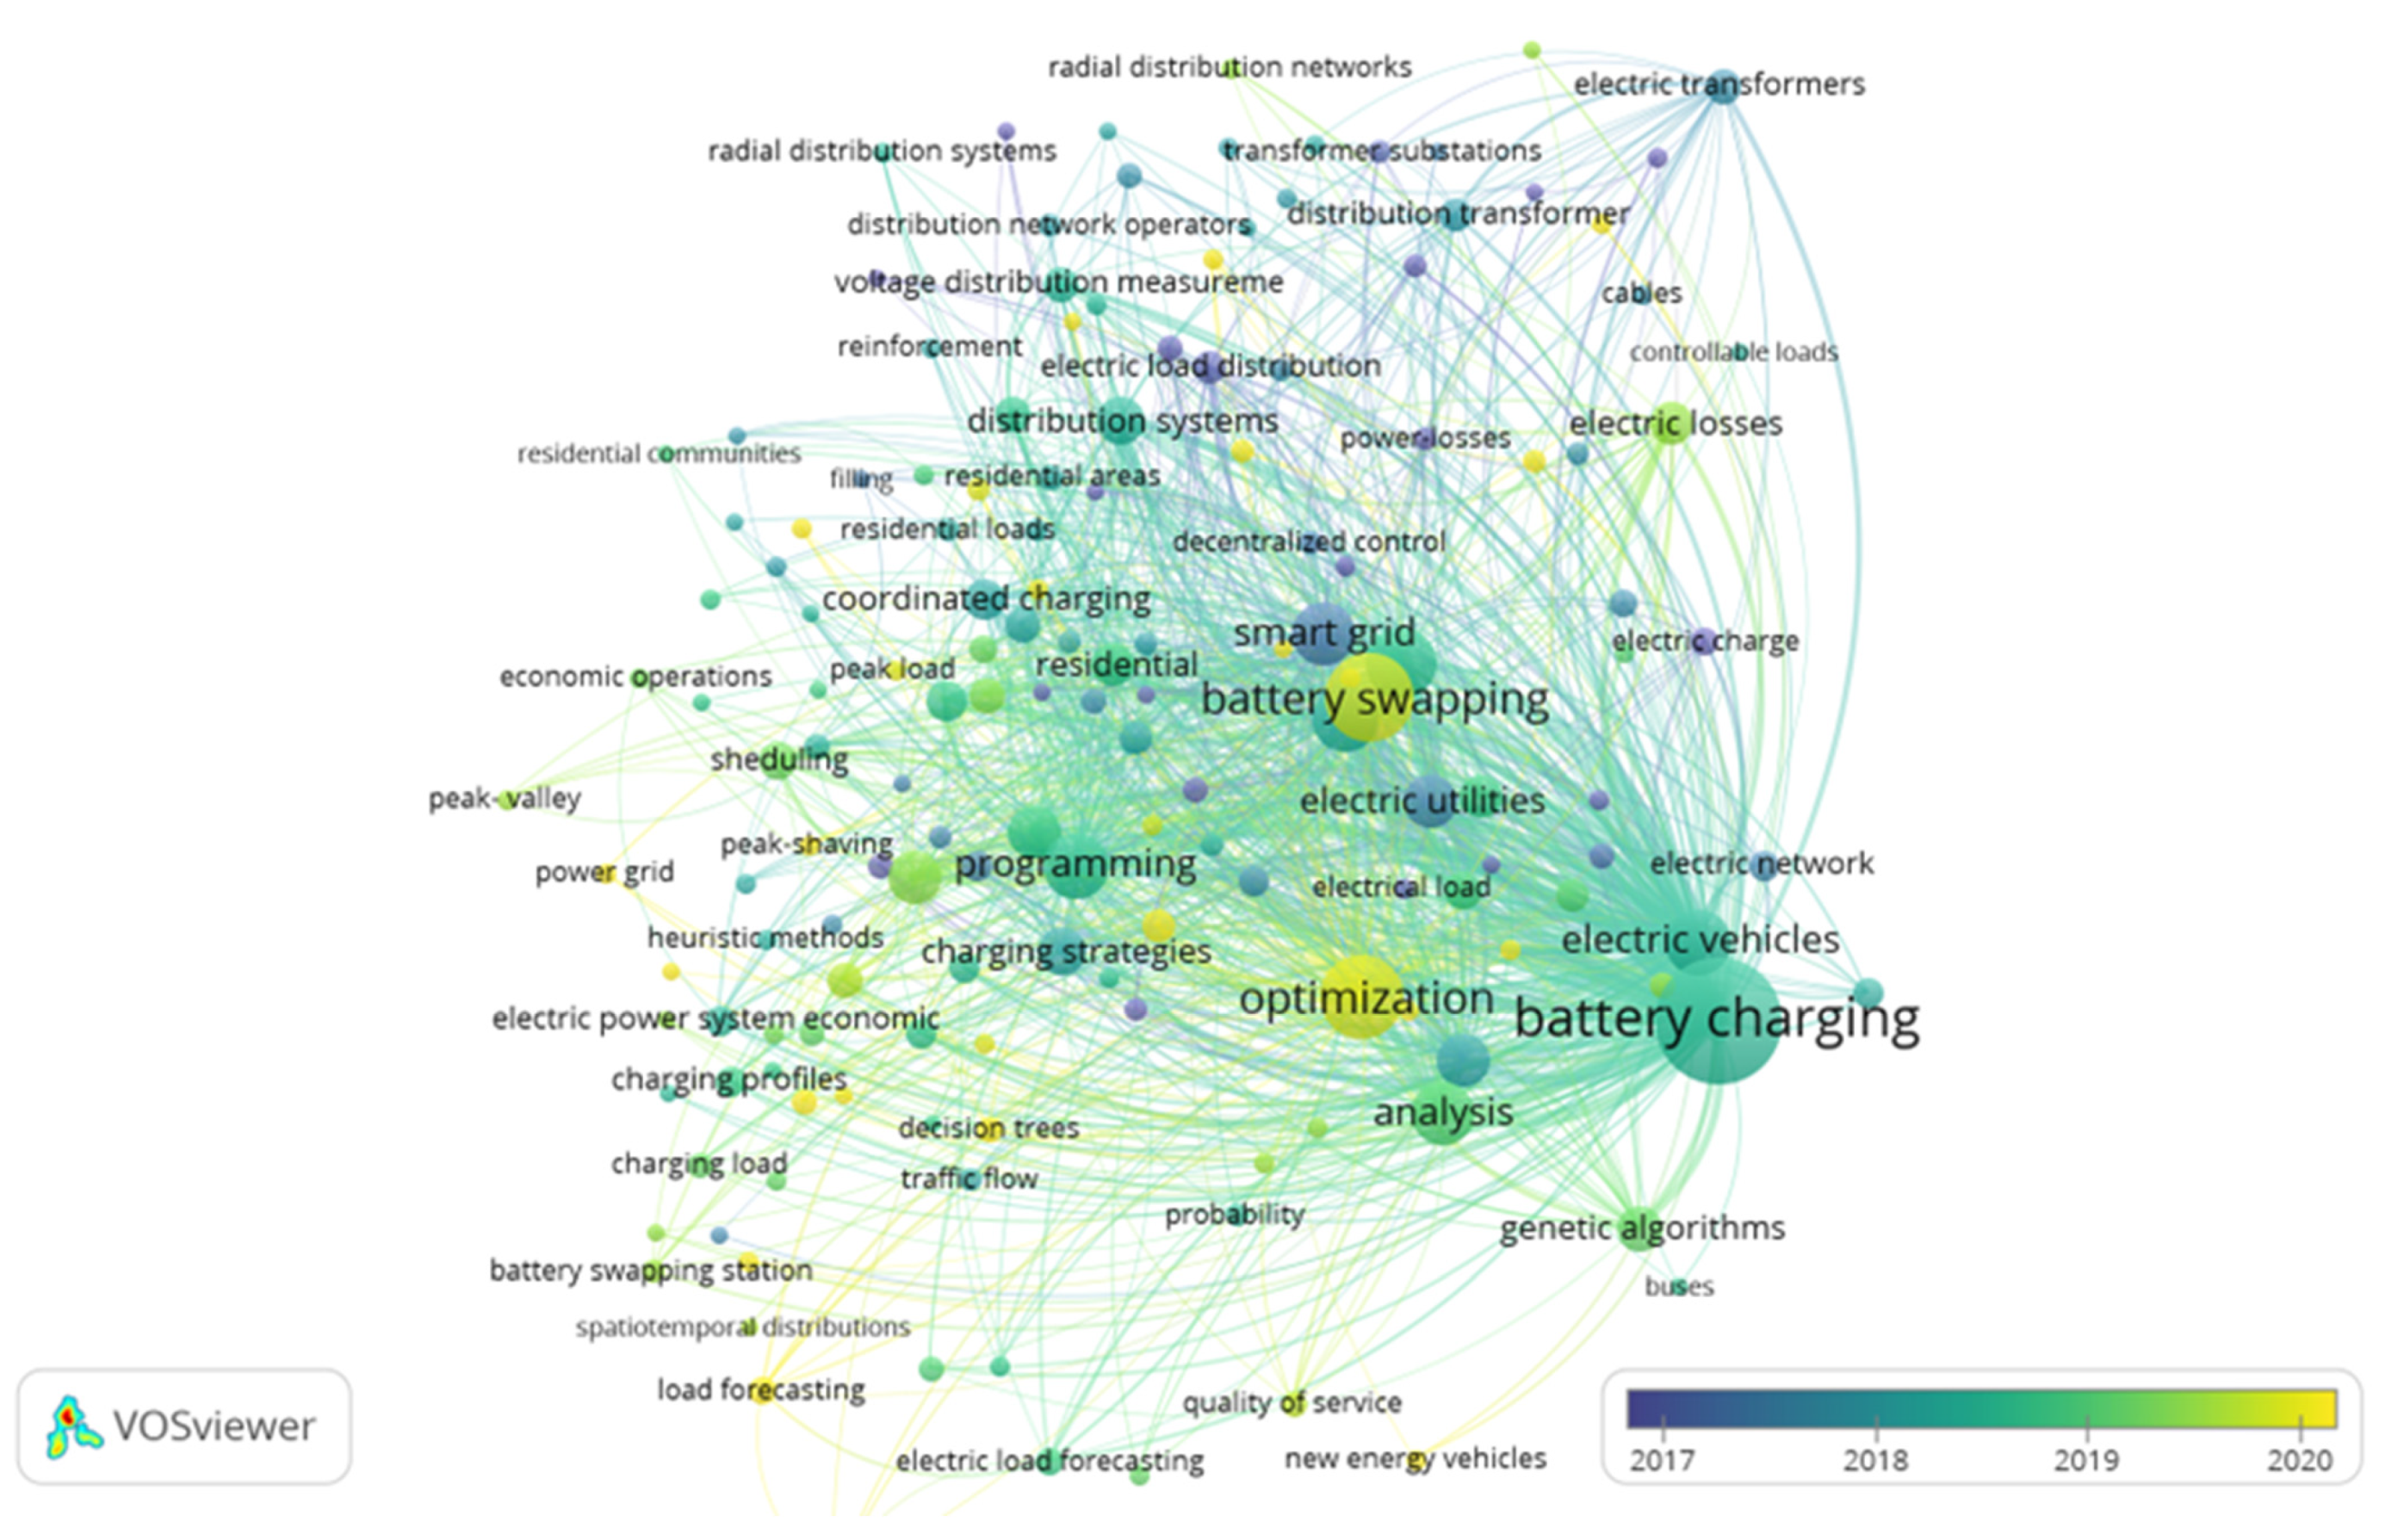
Pilot taxi fleets in China exceeded 12,000 daily swaps in 2024 [46], with sub-180 throughput proving that the business case can be scaled once the swap-station density approaches 0.5 km2 per site [47]. Commercial operators now quote levelized costs of energy at USD 0.13 kWh−1, which is competitive with DC fast charging (DCFC), because each pack performs six to eight cycles a day and is cooled off-board [48]. Global OEMs are converging on standardized under-floor cartridges (44 kWh, 400 V) to unlock network effects; NIO and Geely announced cross-platform compatibility in 2025. Half of the daily trips in Kuwait end within 6 km of the CBD, and GIS modeling shows that 35 swap stations could cover 65% of trip ends, halving curbside charging demand [49]. Safety studies report a <0.01% thermal event rate after 1 million swaps thanks to automated pack inspection and humidity purging [50]. Finally, logistics modeling indicates that swap depots can buffer the grid by charging packs during off-peak hours [51] and returning them warm, cutting demand spikes at DC hubs [52]. These factors make swap logistics a complementary pathway to DCFC in emerging hot-climate markets and merit equal policy attention [53] (see Figure 9). So what for Kuwait: pilot battery swapping for high utilization fleets (taxis, delivery vans, buses) at depot hubs with cooled pack storage and strict state-of-health logging; defer private car swapping until standards and interoperability mature.

3.6. Cluster 5: Wireless Charging

Keyword statistics show that “power quality” (47 occurrences) and “wireless charging” (45) are the two most frequent terms in Cluster 5. We retained the latter as the anchor because its average publication year (2023.2) and burst strength indicate a steeper recent growth, better aligning with the review’s forward-looking focus. Even though power quality is equally predominant in this cluster (Figure 10), we chose wireless charging as the primary keyword because of the subject’s importance. Inductive pads reached 90% 11 kW efficiency in 2025 prototypes while complying with ICNIRP EMF limits [54]. However, sand ingress tests at 60 °C showed a 12% efficiency loss [55], reinforcing the need for enclosure ratings > IP68 in desert deployments [56]. Wireless power transfer (WPT) is another alternative to regular charging stations. WPT mainly uses inductive, capacitive, radiofrequency, and laser-based technologies. However, magnetic resonant chargers (inductive) have only recently become well known and commercially available. WPT’s advantages are that it is safer, as no physical wiring is required; that it can be used while an EV is in a static or moving condition; and that less supervision is required (see Figure 10).
Inductive WPT works according to the same principle as a transformer. In this case, the receiver converts AC into DC and feeds the battery with sufficient power [57]. However, for effective charging, the resonance frequency of both the donor and the acceptor must be maintained. This is achieved through proper compensation networks. Charging systems are typically divided into two types: static and dynamic. There are three types of WPT: capacity WPT, permanent magnetic gear WPT, and inductive WPT. In capacitive WTP, EVs are recharged while they are parked [58]. The WPT occurs through the changes in the electric field between the transmitter and receiver. In permanent magnetic gear WPT, both transmitters and receivers are made up of synchronous windings and armature windings. In inductive WPT, mutual induction creates a magnetic field between the coil of the receiver and that of the transmitter. When AC power is given to the transmitter point, changes are observed in the magnetic field, generating power. So-what for Kuwait: limit near-term wireless deployments to static pads at bus lay-bys, taxi ranks, and shaded parking structures; require coil designs validated for ≥50 °C surfaces and sand ingress, with automatic alignment and payment; defer in-road dynamic lanes until maintenance and economics are proven.

3.7. Cluster 6: Renewable Energy

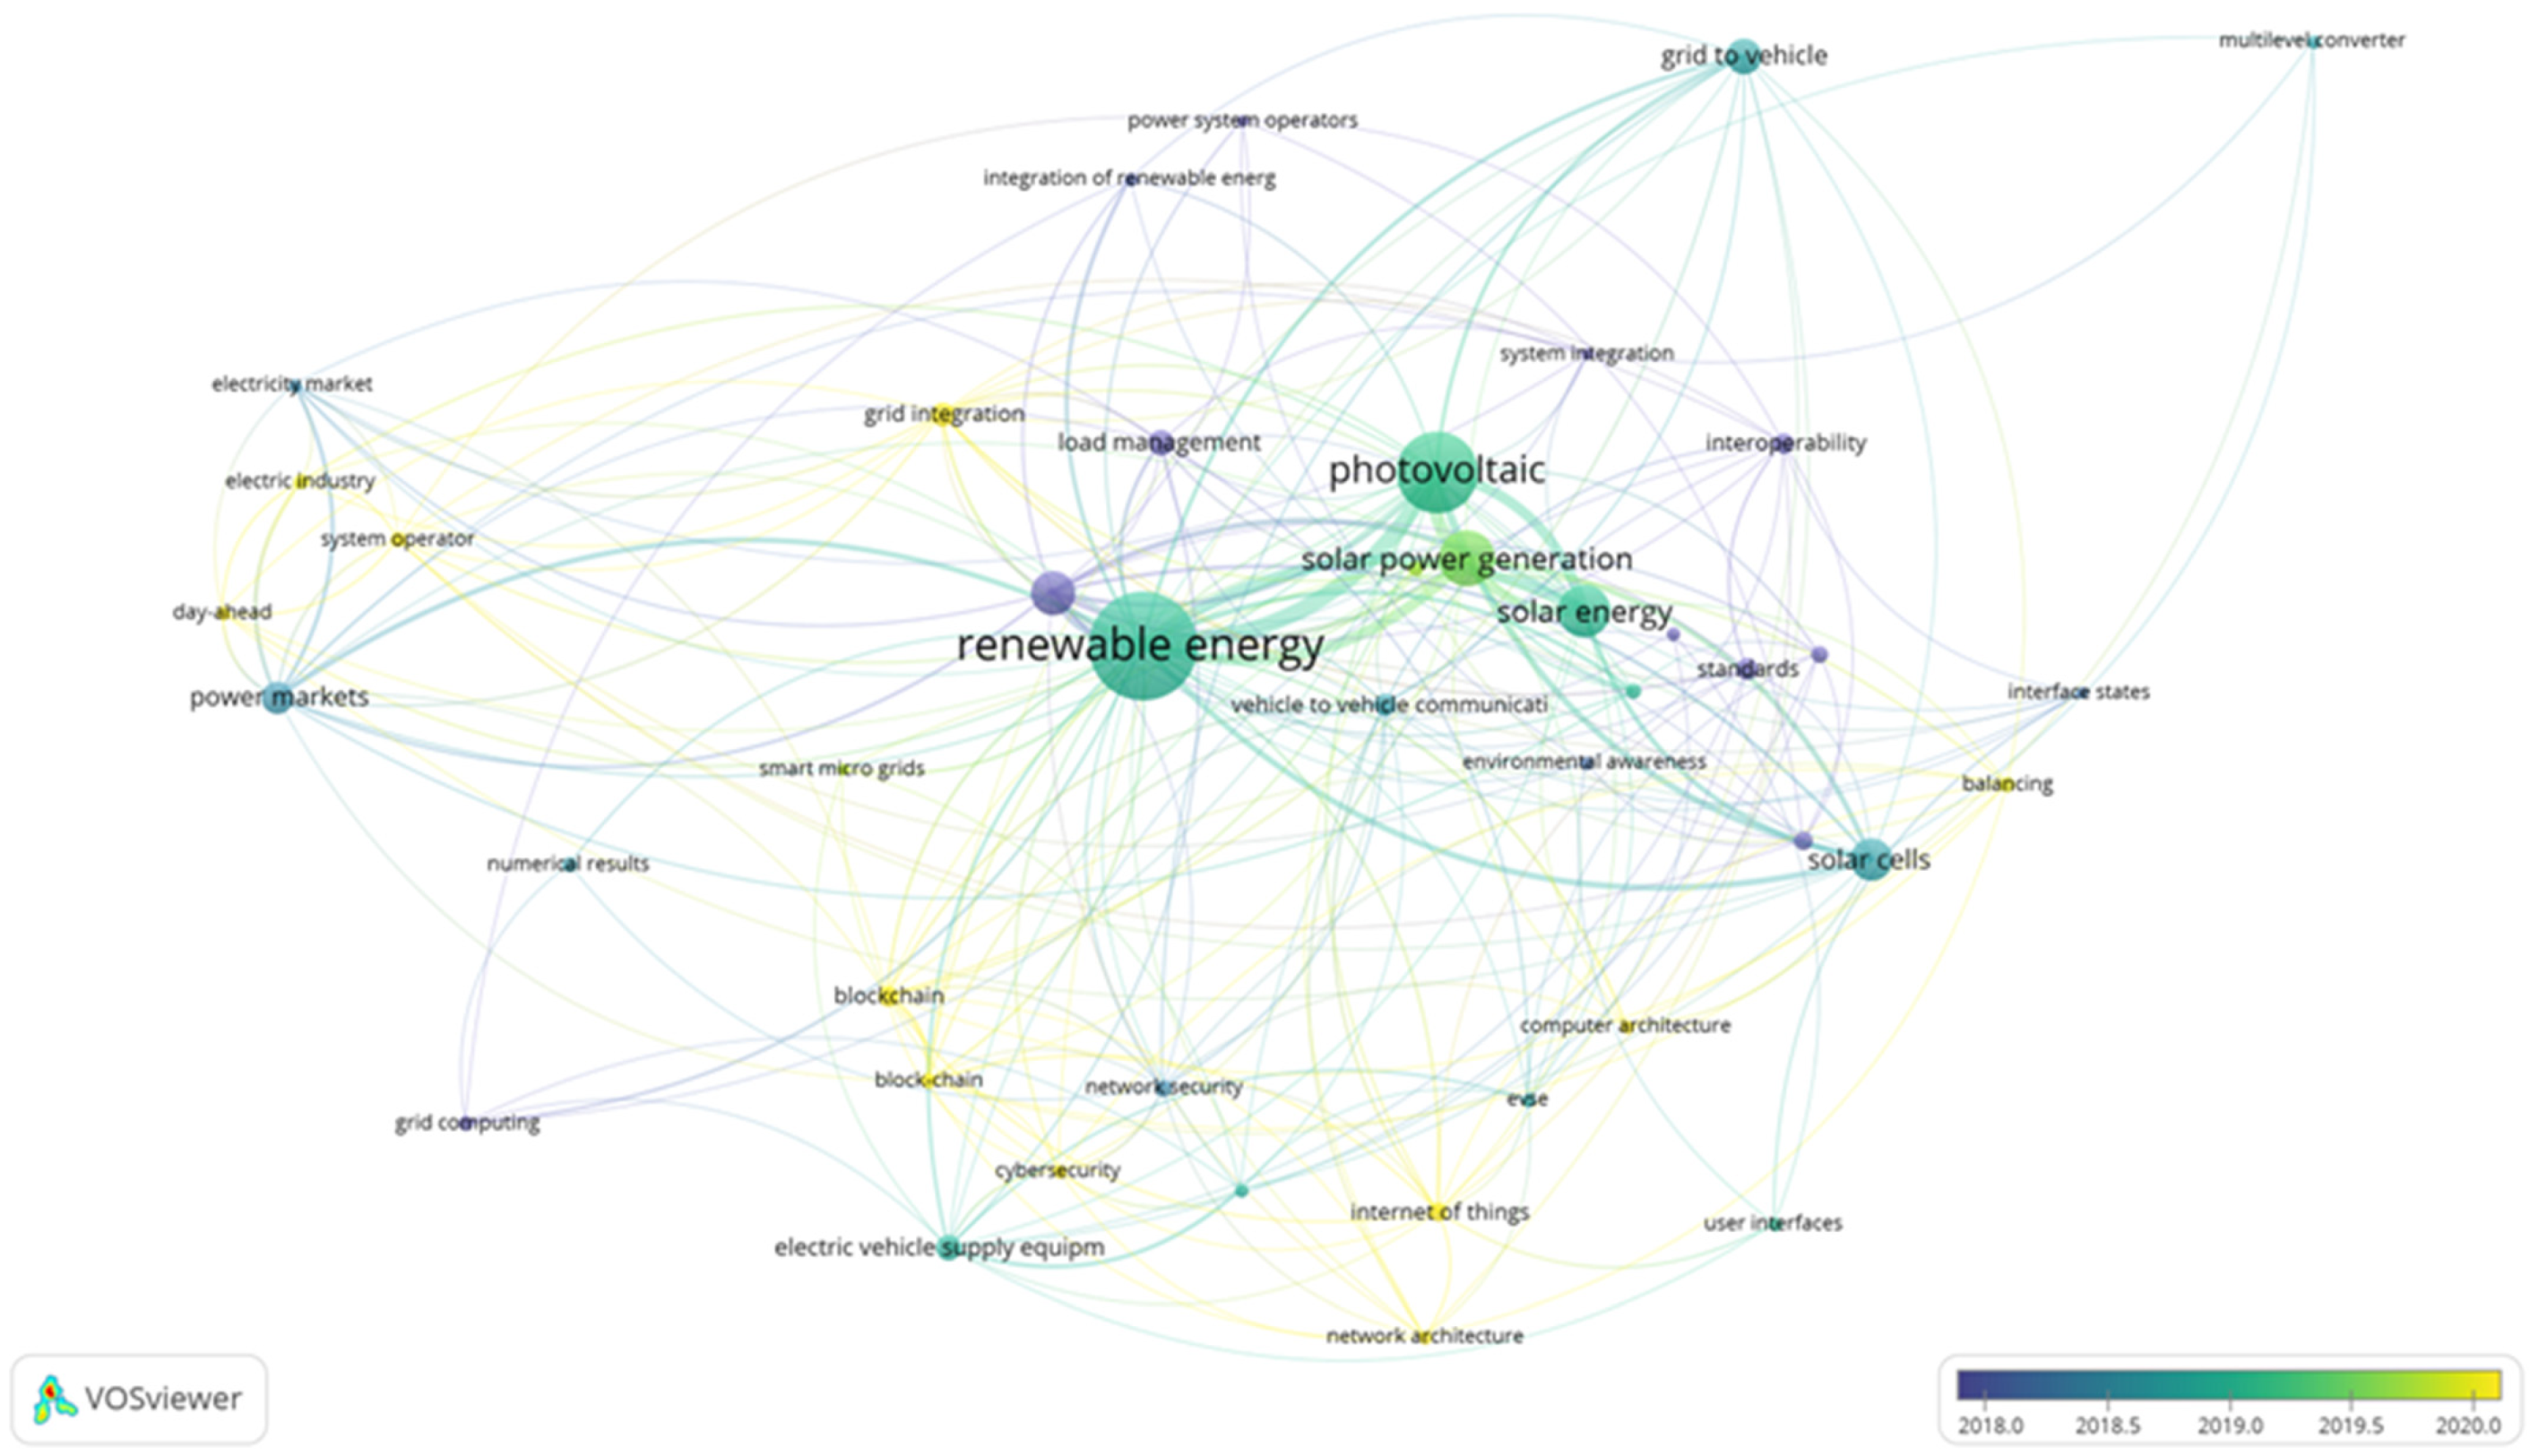
Another critical theme suggested by the software was “renewable energy”. Life-cycle studies confirm that PV-coupled chargers yield a 46% GHG reduction relative to gas-fired grid power in MENA markets [49]. Hybrid PV + wind micro-grids further stabilize midday duck curve oversupply [59]. If not adequately planned, the promotion of EVs on a large scale will lead to high electricity demand and more emissions. One way to escape the blame of dirty power is linking EV requirements to renewable energy sources (RESs), such as solar, wind, and tidal energy. Charging EVs using RESs will have a multifold impact on emissions. The World Resources Institute suggested optimizing RESs and EV charging in four scenarios. The first scenario, “utility offerings that shift charging times and provide access to renewable energy”, encourages charging EVs during times of high RES availability and off-peak demand hours [51]. In the second scenario, “rates that match EV charging with the timing of excess renewables”, discounted rates are offered to customers to encourage them to charge their EVs when excess renewables are on the grid. In the third scenario, “managed to charge”, a charging program is used to align EV charging with RESs. In the final scenario, “coupling EV charging with on-site renewables”, EVs are charged by on-site RESs and sometimes batteries (see Figure 11).
Recent studies show practical pathways to renewable-coupled EV charging: wind resources can feed fast-charge corridors, and PV-coupled charging in the Gulf reduces well-to-wheel emissions versus gas-fired baselines [60,61]. So-what for Kuwait: co-locate PV canopies with DC fast charging (DCFC) hubs and target ≥30% on-site solar with 2–4 h battery storage and inverter ride through, plus quarterly panel cleaning standards, to cut peak grid draw and maintain service during heatwaves.

3.8. Summary of the Cluster Analysis

The six areas discussed in the cluster analysis benefit every electricity/transport sector around the globe. Many technologies for charging EVs are available on the market, and each has its pros and cons. The large-scale adoption of EVs will require more power capacity, and if fossil fuel-based power plants are used to meet the demand, the original goal will not be achieved. To achieve the aims of EV adoption, renewable energy-supported supply-side management is essential.
The clustering of keywords may vary based on the nature and depth of the reference documents collected. However, the likelihood that the above discussed keywords appear in any bibliometric analyses related to EVs is high. Hence, Section 4 examines Kuwait’s status via a case study and benchmarks it against peer countries. Section 4 translates these six clusters into Kuwait-specific policy levers; Section 4 summarizes the mapping between cluster themes, Kuwaiti non-adoption factors, and actionable interventions.

4. Takeaways for Countries with Emerging Markets, Such as the State of Kuwait

To link the global evidence to Kuwait’s reality, Table 5 maps each bibliometric cluster to the relevant Kuwaiti non-adoption factor(s) and the policy lever(s) that address them.
GCC benchmark (brief): Regional EV programs in the Gulf prioritize (i) corridor DC fast charging (DCFC) backbones linking airports, CBDs, and ring roads; (ii) fleet-first pilots for buses, taxis, and delivery vans; (iii) interoperability via OCPP-compliant back-ends and roaming; and (iv) utility private partnerships for site selection and operations. Incentives commonly used are preferential parking/registration terms, electricity time-of-use tariffs for fleets, and standards for shaded PV canopies at hubs. For Kuwait, the implication is to focus on an airport CBD–ring road DCFC spine with shaded PV canopies and 2–4 h storage, adopt interoperability/roaming from day one, and run depot-based V2G pilots under a simple TOU tariff.
Main implementation considerations for Kuwait: a practical rollout should (i) build a 350–500 kW DCFC corridor spine on airport CBD-ring roads, co-located with shaded PV carports to cut both grid peaks and cabin cooling losses; (ii) enforce EV-only bays and anti-ICEing rules at malls, offices and ministries; (iii) pilot time of use tariffs for public DC and workplace charging (while keeping home charging subsidized) to steer demand away from evening peaks; (iv) heat stress proof standards (IP68 enclosures, sand ingress testing) for DC hardware; and (v) defer V2G at scale until tariff reform narrows the subsidy gap.

4.1. The Most Researched Topics in the Kuwaiti Context: Charging States and Battery Performance

The six bibliometric clusters mirror the ten obstacles to EV uptake: charging access (Cluster 1 and Cluster 5), battery longevity (Cluster 2), swap logistics (Cluster 3), grid interaction (Cluster 4), renewable energy coupling (Cluster 6), and power quality concerns (Cluster 5). Mapping the Kuwaiti barriers onto these evidence-based clusters lets policymakers target each obstacle with the most recent technical solutions identified in the global literature. Kuwait is recognized globally for its substantial energy subsidies [10,13,14]. To fulfill Sustainable Development Goal (SDG) 13.1, Kuwait must substantially mitigate its carbon dioxide (CO2) emissions, given that most of its power facilities operate on fossil fuels. To put it another way, attaining SDG 3.7, which pertains to mortality caused by pollution, is not a trivial accomplishment for Kuwait [62]. Recent research examined the “charging anxiety” that consumers may experience as a deterrent to purchasing EVs [48]. In Kuwait, approximately fifty public AC Level 2 chargers, which are frequently located in retail centers, offer a full charge within five hours. However, no public DC fast charging (DCFC) stations with a charging duration of approximately 20 min have been installed. The analysis of the second cluster revealed that this subject is similarly of utmost significance for Kuwait. The duration of battery charging and the distance that a vehicle can travel on a single charge are of specific relevance. The national laboratory, the Kuwait Institute for Scientific Research (KISR), selected a Chevrolet Bolt, one of the first EVs to arrive in Kuwait, to evaluate its range and charge capabilities for a period of two years, from 2019 to 2021 (except for the lockdown period during the COVID-19 pandemic). The EV’s specifications are detailed in Table 6.
We have diligently documented all critical parameters in a data log page, including the distance covered, energy consumption, recharge time, and more. We identified two critical performance-related issues during the data analysis, which are described in detail in the following.

4.2. Variations in Performance with Seasons

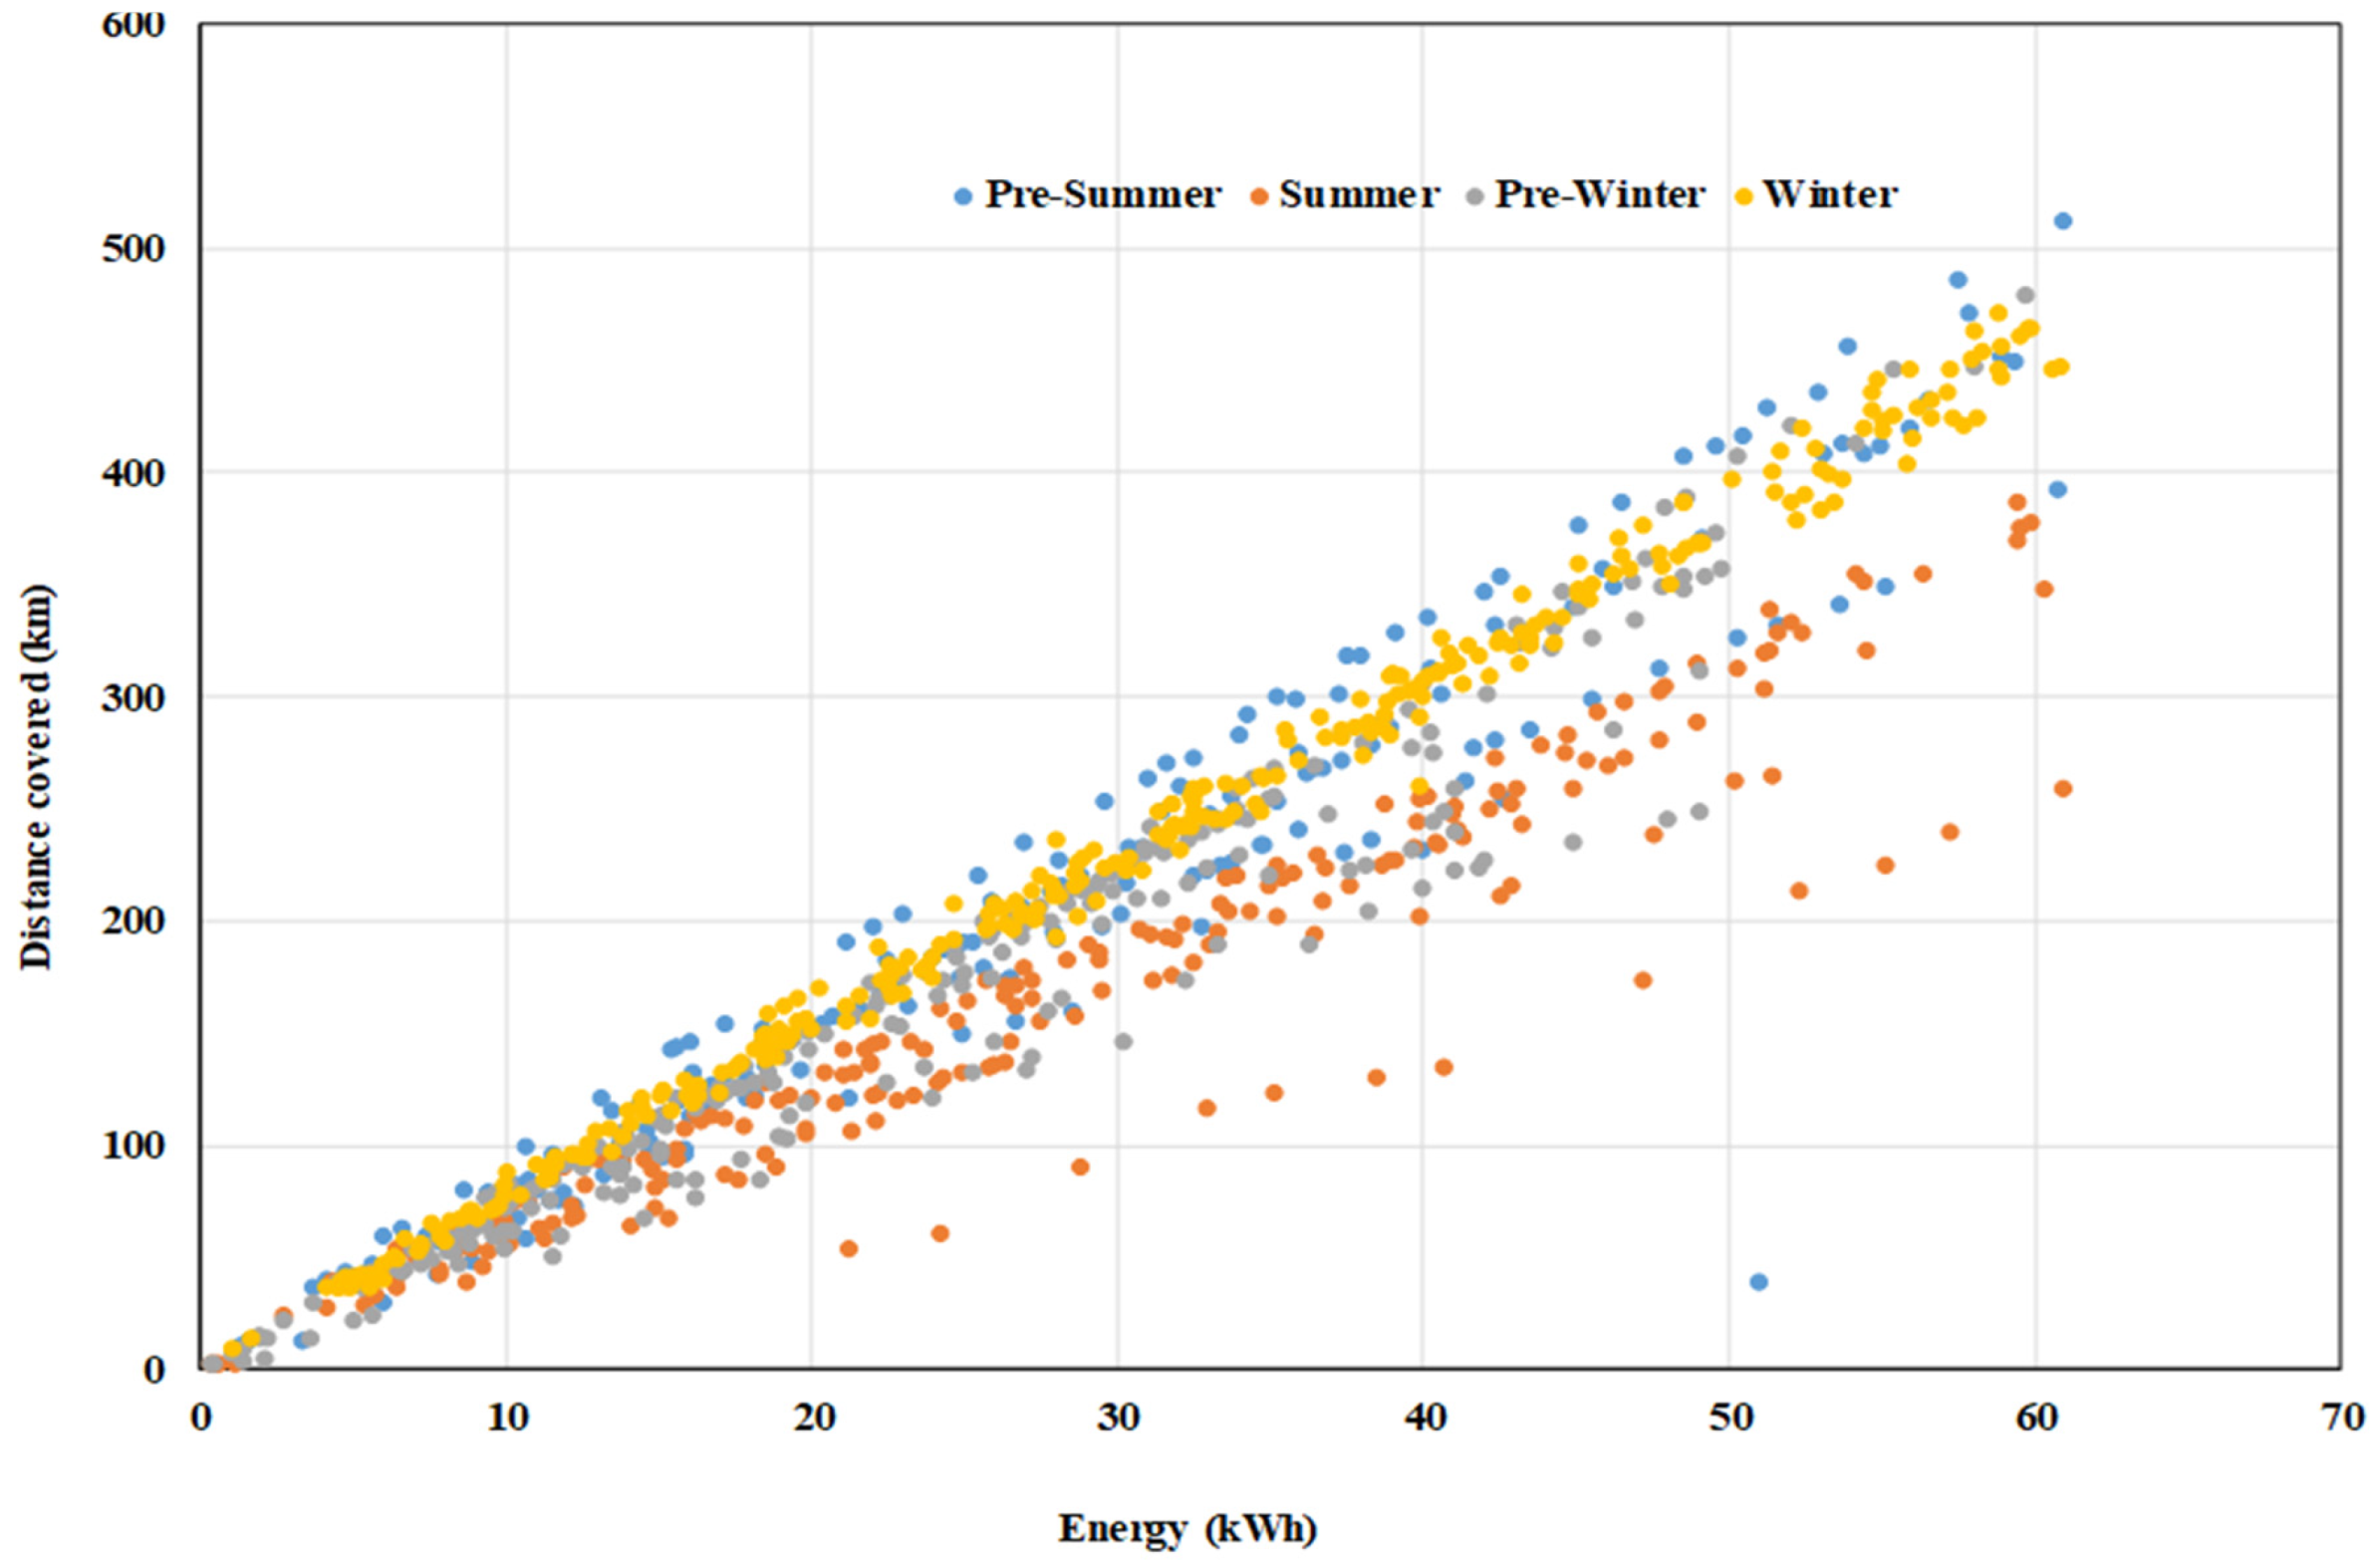
A basic data analysis was conducted on the gathered information to ascertain the distance traveled per unit of energy (Km/kWh), as illustrated in Figure 3. Nonetheless, Kuwait, similarly to numerous other developing nations, experiences temperatures well below the ideal 25 degrees Celsius in the absence of both heating and air conditioning systems. Pre-winter is depicted in the figure as spanning the months of October to November, summer from June to September, pre-summer from March to May, and winter from December to January. The figure illustrates how the temperatures in the summer and winter impact the performance of the EV [63]. The magnitude of the impact is greatest in the summer and is moderate in the winter. The period preceding summer is characterized by optimal performance (Figure 12). It is worth noting that the range significantly decreases in the summer because the battery management system necessitates increased cooling and the constant operation of the air conditioning at maximum capacity [63]. Kuwait seasonal effect: compared with pre-winter driving (avg 17.6 °C), summer (avg 43.2 °C) showed a 24.1% reduction in effective full charge range (approximately 244 km in summer vs 321 km in winter), computed from distance per battery percent logs over two 5-day windows.

4.3. Variations in Charging Time in Different Seasons

The time necessary to recharge EVs fluctuates, mirroring the similarities and differences in performance in different seasons. Despite deviating slightly from the ambient temperature pattern, its influence cannot be disregarded. The charging duration varies by approximately three hours between the summer and winter seasons, resulting in an increase in charging time of approximately forty percent (Figure 13).
This study’s findings caution policymakers about the potential hazards associated with the importation of EVs and recharging stations without appropriately adapting them to the ambient conditions and other influencing factors of the destination country. Furthermore, the findings emphasize the importance of self-reliability in a multitude of critical components, including the battery, charging system, and BMS.

4.4. Wireless Power Transfer for EVs vs. Cooling Constraints at Charging Stations in Kuwait

Even though our cluster analysis indicated that research is beginning to focus on wireless charging, we deem these alternatives to be too advanced for nations which are lagging in EV adoption, such as Kuwait, which is still in the process of implementing its first DC fast charging (DCFC) stations. A representative from the Ministry of Electricity and Water stated at the recent Sustainable Transport Conference in Kuwait that the current air- and water-cooling mechanisms are incapable of regulating the heat in Kuwait [32]. During charging, the temperature under a vehicle can reach 70 degrees Celsius, posing a fire hazard that could be particularly severe if an EV’s battery catches fire and causes a chemical reaction. The ministry asserted that solid-state batteries for EVs are eagerly anticipated due to their noncombustible characteristics [40]. Evaluations indicate that DC fast charging (DCFC) stations in Kuwait are only capable of operating at approximately one-third capacity due to the inability of existing charging mechanisms to withstand the extremely high temperatures there [45]. Additionally, the dust in Kuwait can be a significant annoyance, according to ChargedKW, which has a charging station in Kuwait. They asserted that particulate filter replacements are significantly more expensive than in other locations where the same DC fast charging (DCFC) stations are operating. Due to these factors, wireless charging will lag once the issue with DC fast charging (DCFC) has been resolved. Nevertheless, once such charging station solutions are identified, dynamic EV charging (DEVC), which entails the implementation of WPT on highways, can be contemplated. At 25 kW and 100 km h−1, a 100 m WPT segment delivers only ≈ 0.02 kWh (approximately 2–3 s of transfer), which helps maintain state-of-charge en route rather than fully recharging. Nonetheless, substantial financial investment is necessary for the implementation of such a system. However, this can be intelligently applied to congested highways, roundabouts, and traffic signals. Such a configuration may extend to the most rudimentary degree of mobile V2V functionality.

4.5. Renewable Energy-Supported Vehicle–Grid Integration (VGI)

The presence of an abundance of fossil fuels and extremely generous government subsidies that finance the most power for companies and individuals discourages mass-scale energy and fuel transition initiatives, except for marginal image-promoting projects for solar and wind energy [61]. Even though most Kuwaitis do not use public transportation, it is unlikely that petroleum-powered buses will be replaced with sustainable alternatives. Nevertheless, the literature reviewed for this investigation elucidated that the fleet of buses operating in public transportation systems possesses a considerable capacity for conversion into EVs. Since most of their operations occur during the day, it would be a good idea to install RE power antennas in every bus station. When an enterprise reaches bus terminals, the pantographs that have been installed can be affixed to the antennas to recharge the batteries. Every parking lot—including rail yards—has the potential to function as a virtual power facility. By establishing charging stations powered by solar energy, all EV batteries can be charged during the day and discharged during prime hours. To achieve this, an appropriate software-controlled system must be developed. Kuwait can still achieve this utopian future if the ruling aristocracy prioritizes it above all else.

4.6. Battery Swapping

This “charging” alternative is particularly intriguing and could potentially represent a paradigm shift in the cooling challenge associated with operating DC fast charging (DCFC) stations. In comparison with other alternatives, battery swapping would be a viable option in terms of establishing new infrastructure, given the shorter delay time for EV owners. Consequently, it is necessary to establish battery manufacturing facilities in appropriate nations and ensure that the design specifications align with the prevailing environmental conditions. The foundation of such a system should be a BMS-enabled, high-quality, custom-designed battery charging facility with a substantial capacity for recharging batteries, backed by effective supply chain management. As this process can be completed in a matter of minutes, strategically placed charging stations would allow patrons to replace their batteries at a rate equivalent to or even surpassing that of refueling an ICE vehicle.

4.7. Environmental Impact of Driving an EV

Notably absent is a discussion of the environmental impact of operating an EV; this leads us to the conclusion that editors and publishers are no longer interested in this subject matter, as it has been extensively covered and discussed previously. However, this subject remains pertinent for nations with emerging markets due to the relatively recent transition to renewable energy and fuel alternatives [6]. Countries with emerging markets will continue to find environmental impact analysis to be a pertinent subject, and we sincerely hope that editors will maintain an interest in this area.

4.8. Environmental Life-Cycle Impact

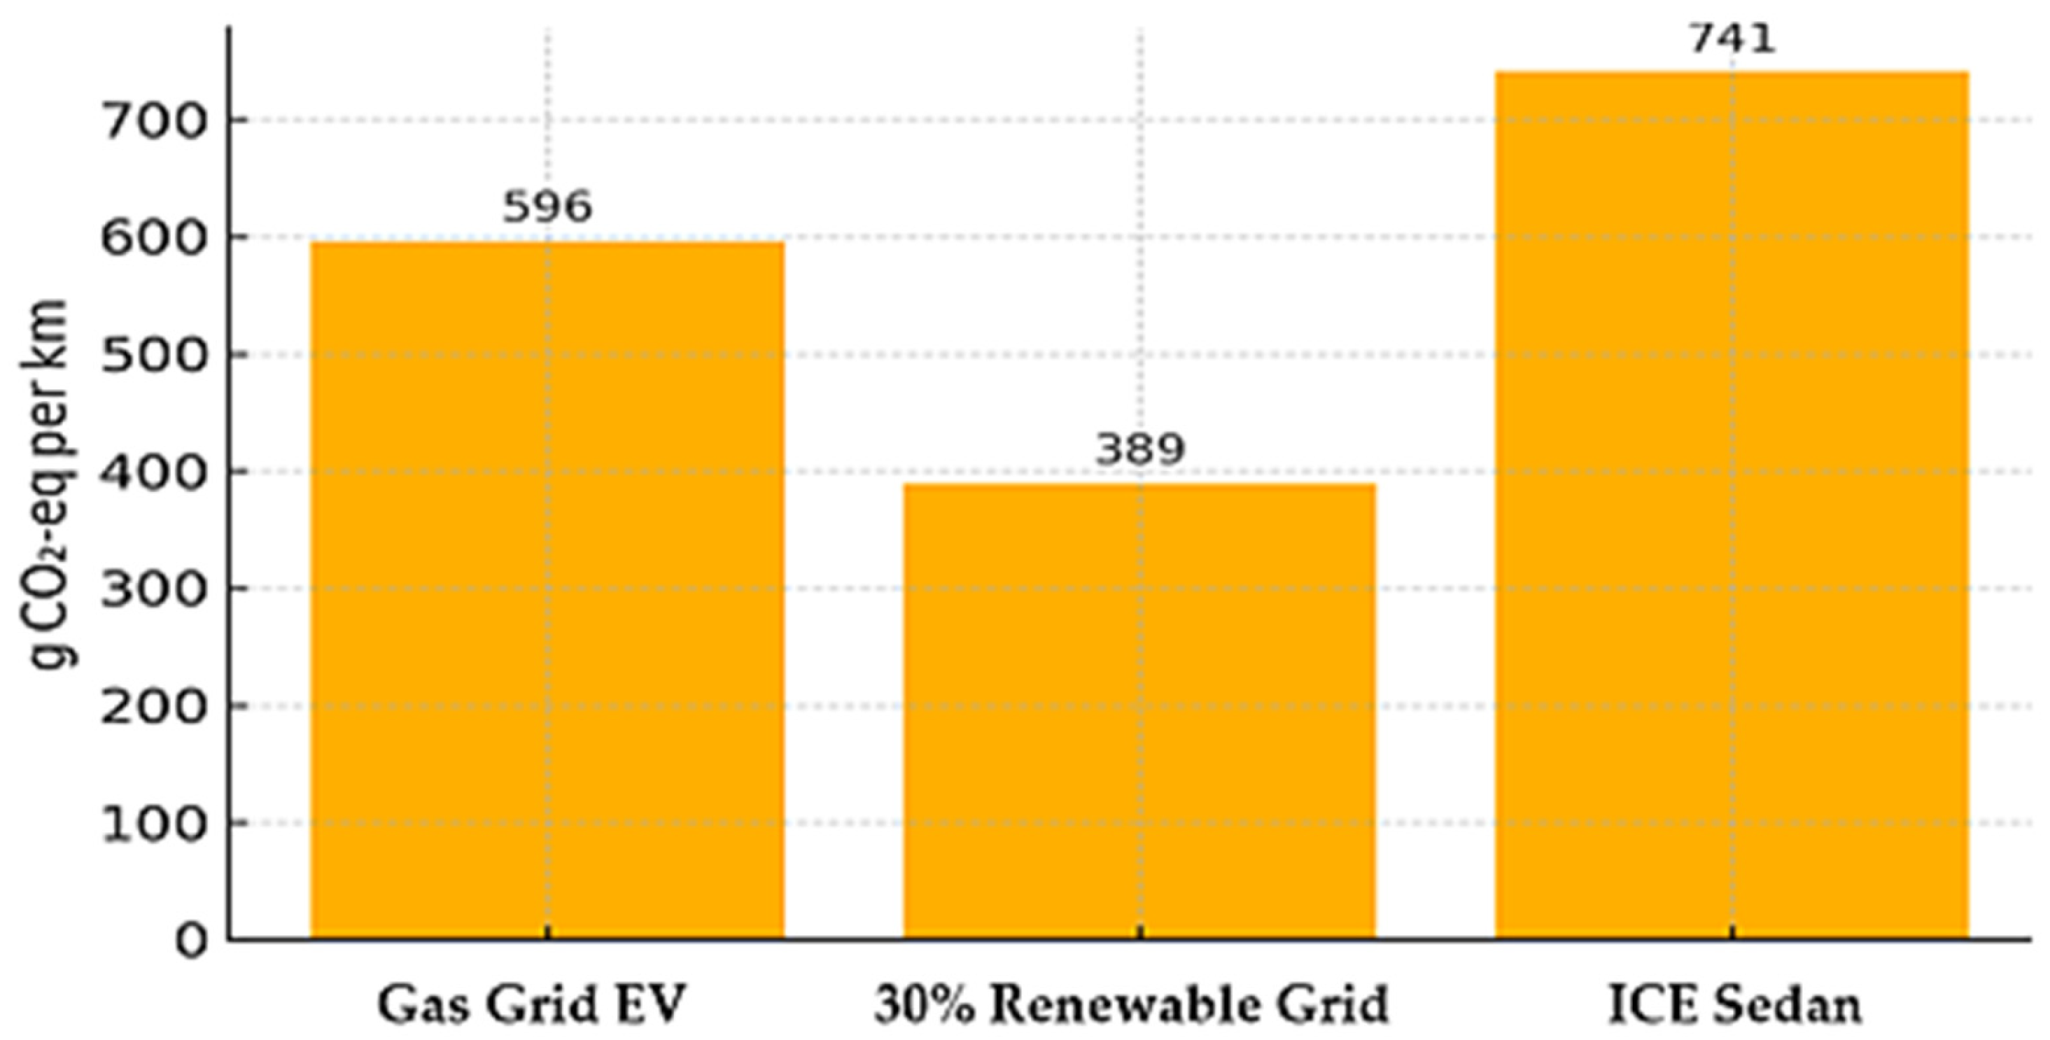
Figure 14 contrasts the well-to-wheel GHG intensity of an average Kuwaiti EV when (a) charged from today’s 100% gas-fired grid (assumed 596 g CO2-eq km−1) versus (b) a 30 % renewable mix foreseen in the 2030 plan (389 g km−1, using 156.6 Wh km−1). Even the fossil scenario undercuts a comparable ICE sedan (741 g km−1), chiefly due to drivetrain efficiency.

4.9. Limitations and Scope

This bibliometric study relies on Scopus-indexed, English-language sources; relevant Arabic-language or non-indexed papers may be missing. Choices made in preprocessing (merging lexical variants into a master thesaurus; minimum keyword occurrence ≥5) can change cluster membership at the margin, so results should be interpreted as indicative themes rather than exhaustive taxonomies. The Kuwait case study simplifies well-to-wheel accounting (EV—156.6 Wh km−1; grid intensities 596/389 g CO2-eq kWh−1; ICE comparator—741 g km−1) and is intended to be decision-oriented rather than inventory-grade. Finally, the 600-respondent driver survey is quota-balanced but web-panel-based and thus subject to self-selection and recall biases. Future work should triangulate across Web of Science and Arabic-language databases, add sensitivity analysis to the bibliometrics, and extend the Kuwait efficiency dataset with summer telematics to quantify uncertainty. The seasonal range estimate is derived from two short windows (5 days each) and should be treated as indicative pending a larger telematics sample.

5. Conclusions

Bringing every nation under the “EV-ready” rubric requires considerable effort from a variety of stakeholders. Nations must maintain self-sufficiency in supplying all consumable and spare parts necessary to ensure the uninterrupted operation of EVs. Considering the findings derived from the bibliometric analysis and case study, end-users are compelled to accept a performance compromise when EVs and related hardware are imported into their respective nations without undergoing country-specific modifications. Our findings show that the level of charging infrastructure is the biggest indicator of how ready a nation will be for mass adoption of electric vehicles over internal combustion engine automobiles. That depends in part on how technologically easy and user-friendly setting up and using a home wall-box charger is. Furthermore, the interconnectedness of the grid of DC-DC fast charging (DCFC) stations should be on par with gasoline stations for ICE vehicles. Finally, the charging time for fast charging also should be on par with ICE vehicle charging. We found that research was lacking on the subject of fast charging in extreme heat, such as that found in Kuwait and its neighboring countries. In particular, research is needed on extreme heat’s effect on charging time and safety. During a question-and-answer session at the recent conference on renewable energy, it was suggested that the widespread adoption of electric vehicles in Kuwait might be difficult as demand on the electric grid system is at its peak in the summertime due to the heavy use of air conditioning systems. It was also suggested that electricity production was so heavily subsidized that mass usage of electric charging for transportation might prove very costly. Whether or not that is the case in reality, it at least deserves further research.
Studies such as this one are pinpointing the greatest issues in decarbonizing transportation in the context of Kuwait, which is striving to catch up to the rest of the world in its transition to a sustainable transportation system. It could use all of the support available. This study was especially beneficial in identifying the four distinct categories of the known and unknown. The first category refers to challenges that are widely recognized and understood to be the main issues at hand, and for which solutions are readily available and implementable. The second category, which is referred to as known unknowns, pertains to matters that we are aware of but for which we do not readily possess a solution. The third category consists of unknowns, which are occasionally referred to as “wicked problems” because we know what is wrong but not necessarily what caused it or how it evolved; therefore, these unknowns must be investigated prior to attempting to find a solution for the root cause. The fourth category, which is referred to as “unknown unknowns”, comprises unforeseen matters, concerns, and problems that we were not cognizant of before commencing this study but became apparent during it through an epiphany, “aha!” moment, or “genius moment” and, consequently, we finished this exploratory study considerably more informed. This study reveals that the known unknowns are related to the lack of charging facilities, while the unknowns are the best solutions for extreme heat conditions and a system that can widely compete or surpass the ease and usefulness of electric vehicles versus internal combustion engine automobiles.
Phased rollout for Kuwait (actionable guide): In Phase 1 (0–12 months), shade existing DCFC bays; adopt procurement specs with ≥50 °C heat validation for chargers and BMS; publish a simple time-of-use tariff for fleets; and require OCPP-compliant back ends with quarterly PV canopy cleaning. In Phase 2 (12–36 months), deploy corridor hyper hubs (≥8 bays, ≥150 kW per bay) co-located with PV canopies and 2–4 h storage; run depot V2G pilots for buses/taxis with feeder export limits and aggregator control; and add static wireless pads at bus lay-bys/taxi ranks where justified. In Phase 3 (36–60 months), expand urban hubs, enforce interoperability, scale fleet electrification (buses/taxis/delivery vans), and integrate hubs into demand response/contingency reserves to shave evening peaks during heatwaves.

Author Contributions

H.H. was this study’s project leader and was responsible for its conception, methodology, formal analysis, and data collection administration. A.O. was responsible for editing, formatting, and publishing, as well as for the acquisition and administration of funds. R.A. and S.A. were accountable for the literature review, conceptualization, synthesis, methodology, validation, data curation, and writing and preparation of the original document. All authors have read and agreed to the published version of the manuscript.

Funding

This paper is a part of a wider study called “Breaking the ICE’s reign: A mixed-method study of attitudes towards buying and using EVs in Kuwait”. This study was funded by the Kuwait Foundation for the Advancement of Sciences and administered by the London School of Economics and Political Science—Middle East Center (grant number: KFAS-MEC LSE 2021 001), and it received approval from the LSE Research Ethics Committee.

Institutional Review Board Statement

This study has been approved by the London School of Economics and Political Science Ethics Committee (00558000004KJE9AAO, dated 24 November 2021).

Informed Consent Statement

Informed consent was obtained from all subjects involved in the study.

Data Availability Statement

The original contributions presented in the study are included in the article, further inquiries can be directed to the corresponding author.

Acknowledgments

We acknowledge the use of AI tools for proofreading, grammar refinement, and stylistic editing of key sections to enhance their clarity and coherence.

Conflicts of Interest

The authors declare no conflicts of interest.

Abbreviations

BABibliometric analysis
BMSBattery management system
CAPEXCapital expenditure
DCFCDirect current fast charging
DEVCDynamic electric vehicle charging
EVElectric vehicle
G2V/V2GGrid to vehicle/vehicle to grid
GHGGreenhouse gas
ICEInternal combustion engine
LIBLithium-ion battery
OPEXOperating expenditure
RESRenewable energy source

Appendix A. Mapping of Bibliometric Clusters to Kuwaiti EV Adoption Barriers

Cluster (Section 3)Dominant Keyword ThemesKuwaiti Survey Factor (¼ of the Ten Reasons Listed in Section 1.3)Brief Explanation
Charging stations and infrastructurecharging station, corridor hyper-hubs“Lack of public charging sites”Research focuses on siting and hub design, matching the “no places to charge” concern.
Battery management and healthstate of health, aging models“Battery replacement cost”Health prediction and life extension papers target the fear of cost.
Vehicle–grid integrationV2G, tariff design“High electricity tariff”Cluster research shows bidirectional pricing schemes.
Battery swapping and logisticsswap stations, taxi trials“Long charging time/waiting”Battery swaps remove dwell time entirely.
Wireless charginginductive pads, EMF limits“Safety of charging technology”EMF compliance and sand ingress tests speak to safety.
Renewable energy couplingPV carports, micro-grids“High well-to-wheel emissions”Papers quantify GHG cuts from PV-coupled charging.

References

  1. International Energy Agency. Global EV Outlook 2022: Securing Supplies for an Electric Future; OECD Publishing: Paris, France, 2022. [Google Scholar] [CrossRef]
  2. Apostolaki-Iosifidou, E.; Codani, P.; Kempton, W. Measurement of power loss during electric vehicle charging and discharging. Energy 2017, 127, 730–742. [Google Scholar] [CrossRef]
  3. Conti, M.; Kotter, R.; Putrus, G. Energy Efficiency in Electric and Plug-in Hybrid Electric Vehicles and Its Impact on Total Cost of Ownership. In Electric Vehicle Business Models Lecture Notes in Mobility; Springer: Cham, Switzerland, 2015. [Google Scholar] [CrossRef]
  4. Chan, C.C.; Wong, Y.S. The State of the Art of Electric-Vehicle Technology. In Proceedings of the 4th International Power Electronics and Motion Control Conference, Xi’an, China, 14–16 August 2004; pp. 46–57. [Google Scholar]
  5. Beeton, D.; Meyer, G. (Eds.) Electric Vehicle Business Models: Global Perspectives; Springer International Publishing: Cham, Switzerland, 2015. [Google Scholar] [CrossRef]
  6. Coignard, J.; Saxena, S.; Greenblatt, J.; Wang, D. Clean vehicles as an enabler for a clean electricity grid. Environ. Res. Lett. 2018, 13, 054031. [Google Scholar] [CrossRef]
  7. Machín, A.; Márquez, F. The Next Frontier in Energy Storage: A Game-Changing Guide to Advances in Solid-State Battery Cathodes. Batteries 2023, 10, 13. [Google Scholar] [CrossRef]
  8. Wood, J. Electric vehicles: The 3 main factors holding back sales. World Economic Forum. 26 October 2022. Available online: https://www.weforum.org/stories/2022/10/ev-sales-charging-infrastructure-transport-sector-sustainable/ (accessed on 14 June 2024).
  9. Dudziak, A.; Caban, J.; Stopka, O.; Stoma, M.; Sejkorová, M.; Stopková, M. Vehicle Market Analysis of Drivers’ Preferences in Terms of the Propulsion Systems: The Czech Case Study. Energies 2023, 16, 2418. [Google Scholar] [CrossRef]
  10. 4 Reasons Why Electric Cars Haven’t Taken Off Yet, World Econ. Forum—Energy Transit. 2021. Available online: https://www.weforum.org/agenda/2021/07/electric-cars-batteries-fossil-fuel/ (accessed on 12 March 2024).
  11. Yoon, K.; Kim, H.; Han, S.; Chan, T.S.; Ko, K.H.; Jo, S.; Park, J.; Kim, S.; Lee, S.; Noh, J.; et al. Detrimental Effect of High-Temperature Storage on Sulfide-Based All-Solid-State Batteries. Appl. Phys. Rev. 2022, 9, 031403. [Google Scholar] [CrossRef]
  12. Turan, F.K. Policy incentives versus purchase-price elasticity in emerging EV markets. Transp. Policy 2024, 148, 192–205. [Google Scholar] [CrossRef]
  13. Alasseri, R.; Rao, T.J.; Sreekanth, K.J. Pre-implementation assessment for introducing direct load control strategies in the residential electricity sector. Int. J. Energy Environ. Eng. 2021, 12, 433–451. [Google Scholar] [CrossRef]
  14. Alasseri, R.; Rao, T.J.; Sreekanth, K.J. Institution of incentive-based demand response programs and prospective policy assessments for a subsidized electricity market. Renew. Sustain. Energy Rev. 2020, 117, 109490. [Google Scholar] [CrossRef]
  15. Ottesen, A.; Navfal, M.; Hamwi, H.; Kous, A.A. Kuwaiti EV Owners’ Experience and Recommendations for Mass Adoption for the World’s EV Laggard. World Electr. Veh. J. 2025, 16, 117. [Google Scholar] [CrossRef]
  16. Ottesen, A.; Banna, S.; Alzougool, B. Attitudes of Drivers towards Electric Vehicles in Kuwait. Sustainability 2022, 14, 12163. [Google Scholar] [CrossRef]
  17. Ottesen, A.; Banna, S.; Alzougool, B. How to Cross the Chasm for the Electric Vehicle World’s Laggards—A Case Study in Kuwait. World Electr. Veh. J. 2023, 14, 45. [Google Scholar] [CrossRef]
  18. Ottesen, A.; Banna, S.; Alzougool, B. Women Will Drive the Demand for EVs in the Middle East over the Next 10 Years—Lessons from Today’s Kuwait and 1960s USA. Energies 2023, 16, 3756. [Google Scholar] [CrossRef]
  19. Ottesen, A.; Thom, D.; Bhagat, R.; Mourdaa, R. Learning from the Future of Kuwait: Scenarios as a Learning Tool to Build Consensus for Actions Needed to Realize Vision 2035. Sustainability 2023, 15, 7054. [Google Scholar] [CrossRef]
  20. Banna, S.; Ottesen, A.; Alzougool, B. Reasons Why Only Kuwaiti Citizens Drive Electric Vehicles despite Being Only a Quarter of the Population. World Electr. Veh. J. 2023, 14, 287. [Google Scholar] [CrossRef]
  21. Donthu, N.; Kumar, S.; Mukherjee, D.; Pandey, N.; Lim, W.M. How to conduct a bibliometric analysis: An overview and guidelines. J. Bus. Res. 2021, 133, 285–296. [Google Scholar] [CrossRef]
  22. Bouzembrak, Y.; Klüche, M.; Gavai, A.; Marvin, H.J.P. Internet of Things in food safety: Literature review and a bibliometric analysis. Trends Food Sci. Technol. 2019, 94, 54–64. [Google Scholar] [CrossRef]
  23. Nuryakin, N.; Ngetich, B.K.; Krishna, B.V. Open innovation in SMEs a bibliometric literature review using VOSviewer. J. Siasat Bisnis 2022, 26, 154–171. [Google Scholar] [CrossRef]
  24. Roig-Tierno, N.; Gonzalez-Cruz, T.F.; Llopis-Martinez, J. An overview of qualitative comparative analysis: A bibliometric analysis. J. Innov. Knowl. 2017, 2, 15–23. [Google Scholar] [CrossRef]
  25. Shukla, A.K.; Janmaijaya, M.; Abraham, A.; Muhuri, P.K. Engineering applications of artificial intelligence: A bibliometric analysis of 30 years (1988–2018). Eng. Appl. Artif. Intell. 2019, 85, 517–532. [Google Scholar] [CrossRef]
  26. Shi, Y.; Blainey, S.; Sun, C.; Jing, P. A literature review on accessibility using bibliometric analysis techniques. J. Transp. Geogr. 2020, 87, 102810. [Google Scholar] [CrossRef]
  27. Xie, L.; Chen, Z.; Wang, H.; Zheng, C.; Jiang, J. Bibliometric and Visualized Analysis of Scientific Publications on Atlantoaxial Spine Surgery Based on Web of Science and VOSviewer. World Neurosurg. 2020, 137, 435–442.e4. [Google Scholar] [CrossRef]
  28. Koseoglu, M.A.; Rahimi, R.; Okumus, F.; Liu, J. Bibliometric studies in tourism. Ann. Tour. Res. 2016, 61, 180–198. [Google Scholar] [CrossRef]
  29. Li, W.; Zhao, Y. Bibliometric analysis of global environmental assessment research in a 20-year period. Environ. Impact Assess Rev. 2015, 50, 158–166. [Google Scholar] [CrossRef]
  30. Al-Ashmori, Y.Y.; Othman, I.; Rahmawati, Y. Bibliographic analysis of BIM Success Factors and Other BIM Literatures using Vosviewer: A Theoretical Mapping and Discussion. J. Phys. Conf. Ser. 2020, 1529, 042105. [Google Scholar] [CrossRef]
  31. Nobanee, H.; Al Hamadi, F.Y.; Abdulaziz, F.A.; Abukarsh, L.S.; Alqahtani, A.F.; AlSubaey, S.K.; Alqahtani, S.M.; Almansoori, H.A. A Bibliometric Analysis of Sustainability and Risk Management. Sustainability 2021, 13, 3277. [Google Scholar] [CrossRef]
  32. Tamala, J.K.; Maramag, E.I.; Simeon, K.A.; Ignacio, J.J. A bibliometric analysis of sustainable oil and gas production research using VOSviewer. Clean. Eng. Technol. 2022, 7, 100437. [Google Scholar] [CrossRef]
  33. Qin, Y.; Xu, Z.; Wang, X.; Škare, M. Green energy adoption and its determinants: A bibliometric analysis. Renew. Sustain. Energy Rev. 2022, 153, 111780. [Google Scholar] [CrossRef]
  34. Bigliardi, B.; Bottani, E.; Casella, G. Enabling technologies, application areas and impact of industry 4.0: A bibliographic analysis. Procedia Manuf. 2020, 42, 322–326. [Google Scholar] [CrossRef]
  35. Santos, R.; Costa, A.A.; Grilo, A. Bibliometric analysis and review of Building Information Modelling literature published between 2005 and 2015. Autom. Constr. 2017, 80, 118–136. [Google Scholar] [CrossRef]
  36. Everitt, B.S.; Landau, S.; Leese, M.; Stahl, D. Cluster Analysis; Wiley: London, UK, 2021. [Google Scholar]
  37. van Eck, N.J.; Waltman, L. VOSviewer Manual. 2013. Available online: https://www.vosviewer.com/documentation/Manual_VOSviewer_1.6.18.pdf (accessed on 14 December 2024).
  38. Li, K.; Li, Z.; Huang, C.; Ai, Q. Thermal management of 350 kW fast-charging stacks under Gulf-climate conditions. Appl. Energy 2024, 358, 122631. [Google Scholar] [CrossRef]
  39. Lokesh, B.T.; Min, J.T.H. A Framework for Electric Vehicle (EV) Charging in Singapore. Energy Procedia 2017, 143, 15–20. [Google Scholar] [CrossRef]
  40. Wu, J.; Zhao, P.; Li, L.; Shi, F.; Li, B. PV-carport micro-grids coupled to EV hubs: Oman case study. Int. J. Electr. Power Energy Syst. 2023, 152, 109234. [Google Scholar] [CrossRef]
  41. Yang, K.; Chen, P. Optimization of Charging Schedule for Battery Electric Vehicles Using DC Fast Charging Stations. IFAC-Pap. 2021, 54, 418–423. [Google Scholar] [CrossRef]
  42. Abu Dagga, N. E-Mobility—Electric Vehicles Technology and Innovation. In Proceedings of the Public Lecture at Australian University Kuwait, West Misref, Kuwait, 8 May 2023. [Google Scholar]
  43. Mastoi, M.S.; Zhuang, S.; Munir, H.M.; Haris, M.; Hassan, M.; Usman, M.; Bukhari, S.S.H.; Ro, J.-S. An In-Depth Analysis of Electric Vehicle Charging Station Infrastructure, Policy Implications, and Future Trends. Energy Rep. 2022, 8, 11504–11529. [Google Scholar] [CrossRef]
  44. See, K.W.; Wang, G.; Zhang, Y.; Wang, Y.; Meng, L.; Gu, X.; Zhang, N.; Lim, K.C.; Zhao, L.; Xie, B. Critical review and functional safety of a battery management system for large-scale lithium-ion battery pack technologies. Int. J. Coal Sci. Technol. 2022, 9, 36. [Google Scholar] [CrossRef]
  45. Lv, Z.; Chen, Z.; Wang, P.; Wang, C.; Di, R.; Li, X.; Gao, H. Empirical model, capacity recovery-identification correction and machine learning co-driven Li-ion battery remaining useful life prediction. J. Energy Storage 2024, 103, 114274. [Google Scholar] [CrossRef]
  46. Menye, J.S.; Camara, M.-B.; Dakyo, B. Lithium Battery Degradation and Failure Mechanisms: A State-of-the-Art Review. Energies 2025, 18, 342. [Google Scholar] [CrossRef]
  47. Leippi, A.; Fleschutz, M.; Murphy, M.D. A Review of EV Battery Utilization in Demand Response Considering Battery Degradation in Non-Residential Vehicle-to-Grid Scenarios. Energies 2022, 15, 3227. [Google Scholar] [CrossRef]
  48. Geely and NIO Sign Cross-Platform Battery-Swap Standard Agreement, Geely Hold. Group Press Release 2025. Available online: https://www.nio.com/news/geely-nio-battery-swap-standard-press-release (accessed on 10 May 2024).
  49. Krueger, H.; Cruden, A. Integration of electric vehicle user charging preferences into Vehicle-to-Grid aggregator controls. Energy Rep. 2020, 6, 86–95. [Google Scholar] [CrossRef]
  50. Suryawan, I.W.K.; Lee, C.-H. Smart-city V2G aggregator economics under fuel-subsidy reform. Sustain. Cities Soc. 2023, 97, 104765. [Google Scholar] [CrossRef]
  51. Zhang, G.; Wen, J.; Xie, T.; Zhang, K.; Jia, R. Air- and liquid-cooling retrofits for DC fast-charging stations in deserts. Energy 2023, 280, 128236. [Google Scholar] [CrossRef]
  52. Feng, Y.; Lu, X. Construction Planning and Operation of Battery Swapping Stations for Electric Vehicles: A Literature Review. Energies 2021, 14, 8202. [Google Scholar] [CrossRef]
  53. Qiang, H.; Hu, Y.; Tang, W.; Zhang, X. Research on Optimization Strategy of Battery Swapping for Electric Taxis. Energies 2023, 16, 2296. [Google Scholar] [CrossRef]
  54. Hamwi, H.; Rushby, T.; Mahdy, M.; Bahaj, A.S. Effects of High Ambient Temperature on Electric Vehicle Efficiency and Range: Case Study of Kuwait. Energies 2022, 15, 3178. [Google Scholar] [CrossRef]
  55. Niu, S.; Yu, H.; Niu, S.; Jian, L. Power Loss Analysis and Thermal Assessment on Wireless Electric Vehicle Charging Technology: The Over-Temperature Risk of Ground Assembly Needs Attention. Appl. Energy 2020, 275, 115344. [Google Scholar] [CrossRef]
  56. Wang, Y.; Zhang, N.; Kang, C.; Lu, Z. Battery-swap thermal-event probabilities after two million cycles. Appl. Energy 2023, 218, 121877. [Google Scholar] [CrossRef]
  57. Hu, Y.; Liu, Z.; Jiang, B.; Zhao, F.; Yan, Z.; Wang, X.; Ma, B. Second-life EV batteries for demand-response in MENA markets. Energy Storage 2023, 73, 108874. [Google Scholar] [CrossRef]
  58. Lipu, M.S.H.; Mamun, A.A.; Ansari, S.; Miah, M.S.; Hasan, K.; Meraj, S.T.; Abdolrasol, M.G.M.; Rahman, T.; Maruf, M.H.; Sarker, M.R.; et al. Battery Management, Key Technologies, Methods, Issues, and Future Trends of Electric Vehicles: A Pathway toward Achieving Sustainable Development Goals. Batteries 2022, 8, 119. [Google Scholar] [CrossRef]
  59. Tappeta, V.S.R.; Appasani, B.; Patnaik, S.; Ustun, T.S. A Review on Emerging Communication and Computational Technologies for Increased Use of Plug-In Electric Vehicles. Energies 2022, 15, 6580. [Google Scholar] [CrossRef]
  60. Triviño, A.; González-González, J.M.; Aguado, J.A. Wireless Power Transfer Technologies Applied to Electric Vehicles: A Review. Energies 2021, 14, 1547. [Google Scholar] [CrossRef]
  61. Carrilero, I.; González, M.; Anseán, D.; Viera, J.C.; Chacón, J.; Pereirinha, P.G. Redesigning European Public Transport: Impact of New Battery Technologies in the Design of Electric Bus Fleets. Transp. Res. Procedia 2018, 33, 195–202. [Google Scholar] [CrossRef]
  62. World Health Organization. Sustainable Development Goal Indicator 3.9.1: Mortality Attributed to Air Pollution; WHO: Geneva, Switzerland, 2024; Available online: https://www.who.int/publications/i/item/9789240099142 (accessed on 10 February 2025)ISBN 978-92-4-009914-2.
  63. Alrajhi, J.; Alhaifi, N.; Alazemi, J.; Aldaihani, F.; Alhaifi, K. A Comparative Study of Electric and Internal Combustion Engine Vehicle Performance Under High Ambient Temperatures: A Case Study of Kuwait. SSRG Int. J. Mech. Eng. 2024, 11, 22–28. [Google Scholar] [CrossRef]
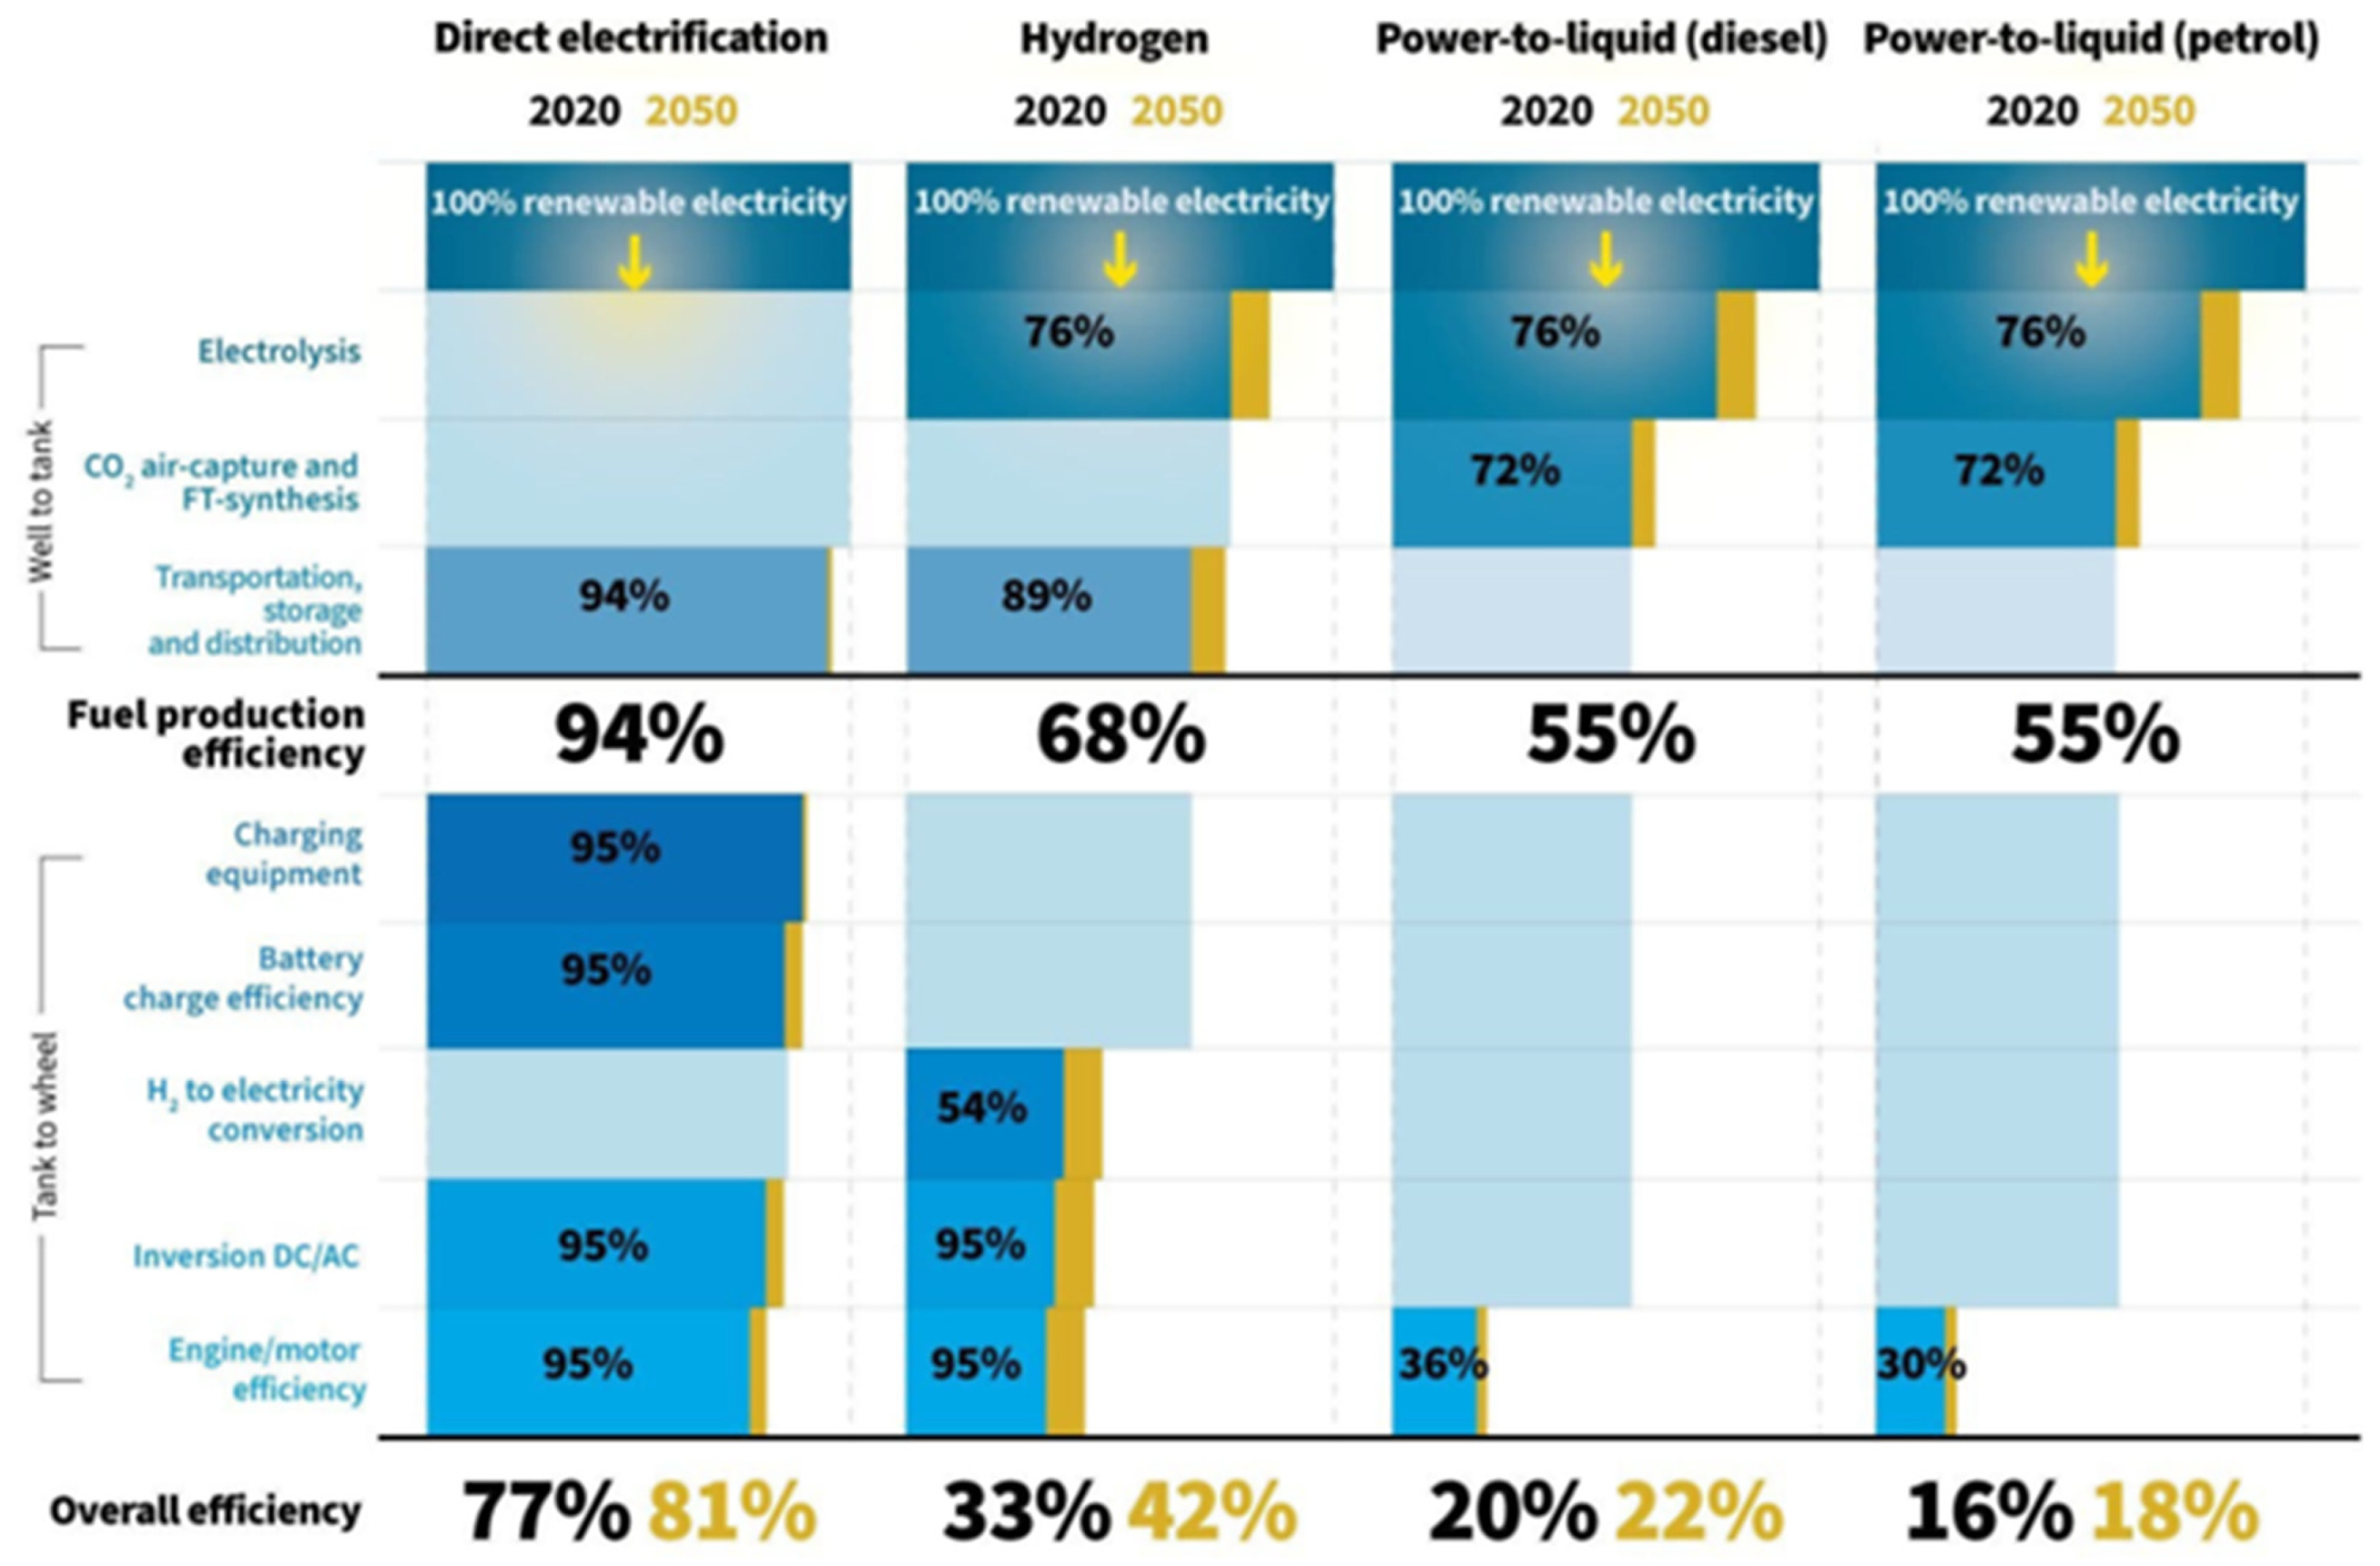
Figure 1. Vehicle fuel energy efficiency; source: Powerid. Printed with permission [1]. Blue color for values for 2020 and yellow color for projected values in 2050.
Wevj 16 00458 g001
Figure 2. Methodological steps taken in this bibliometric analysis.
Wevj 16 00458 g002
Figure 3. Keyword co-occurrence network (phase 1, before thesaurus merging) clustered with VOSviewer (association strength normalization; Leiden resolution = 1.0; fractional counting; minimum keyword occurrence ≥5). Six communities emerge corresponding to charging stations, battery management systems, battery swapping, vehicle–grid integration, wireless charging, and renewable energy. Node size = occurrence; link width = association strength.
Wevj 16 00458 g003
Figure 4. (a) Refined map with 1000 keywords. (b) VOSviewer overlay timeline of keyword growth (2000–2024). Colors indicate average publication year; association strength normalization and fractional counting with a minimum keyword occurrence ≥5 were used. After thesaurus merging, n = 1000 retained keywords. The post-2017 acceleration is evident.
Wevj 16 00458 g004
Figure 5. Distribution of EV-related articles (left axis) and citations (right axis) per year, 2000–2022. Publications rise sharply after 2017, with citations lagging publication growth by a few years.
Wevj 16 00458 g005
Figure 6. Overlay network for Cluster 1 (charging stations) showing the 12 most frequent keywords. Colors indicate average publication year (overlay visualization). Node size = occurrence; link width = association strength. VOSviewer settings: fractional counting; association strength normalization; minimum keyword occurrence ≥5.
Wevj 16 00458 g006
Figure 7. Cluster 2: EV battery issues.
Wevj 16 00458 g007
Figure 8. Cluster 3: vehicle–grid integration.
Wevj 16 00458 g008
Figure 9. Battery swapping and logistics cluster (2000–2024).
Wevj 16 00458 g009
Figure 10. Cluster 5: wireless charging.
Wevj 16 00458 g010
Figure 11. Cluster 6: renewable energy.
Wevj 16 00458 g011
Figure 12. Seasonal performance summary for a Chevrolet Bolt in Kuwait (2019–2021): effective full charge range estimated from distance per battery percent logs over two 5-day windows (244 km in summer [avg 43.2 °C] vs. 321 km in prewinter [avg 17.6 °C]; −24.1%).
Wevj 16 00458 g012
Figure 13. Charging duration by month in Kuwait (2019–2021): time required to charge fully (hh:mm; left axis) with average ambient temperature overlaid (°C; right axis). Charging takes approximately 40% longer in summer than in winter.
Wevj 16 00458 g013
Figure 14. Well-to-wheel GHG intensity comparison: EV charged on Kuwait’s current gas-fired grid vs. a 30% renewable mix, and a comparable ICE sedan. Assumptions: EV—156.6 Wh km−1; grid—596 g CO2-eq kWh−1; 30% RES scenario—389 g km−1; ICE—741 g km−1 [60].
Wevj 16 00458 g014
Table 1. Numbers of articles employing bibliometric analyses by publisher in 2021 [24].
PublisherNo. of Articles
Elsevier229
Springer180
MDPI174
University of Idaho Library144
Frontiers Media S.A.69
Institute of Electrical and Electronics Engineers Inc.60
Emerald Group Holdings Ltd.57
IOP Publishing Ltd.42
Taylor and Francis Ltd.41
Routledge38
SAGE Publications37
John Wiley and Sons Inc27
BioMed Central Ltd.26
Dove Medical Press Ltd.21
Hindawi Limited19
Others664
Table 2. Options selected for the bibliometric analysis.
OptionsSelected OptionExplanation
Type of dataMap based on bibliographic dataTo determine co-occurrences
Data sourceReference manager fileExported information from Scopus in .ris format and merged into one file
Type and unit of analysisOccurrenceThis gives us a clear idea of the interlinkages among different keywords.
Counting methodFractional
Use of a thesaurus fileYesUsed in phase 2 of the analysis
Number of occurrences of the keyword5When the number of occurrences of keywords increases, the number of keywords in the results will be reduced; five is the default value assigned by the software.
Number of keywords2055 in the first phase and 1000 in the second phaseBy merging similar words, the total number of keywords was reduced to 1000.
Table 3. Examples of keyword merging.
Old KeywordNew Keyword
wireless charging system
renewable energy resources
wireless charging
renewable energy
Table 4. The details of the clusters.
Cluster NumberMost Significant KeywordsOther Major Keywords
1Charging stationEmissions, Cost, Crashworthiness, Sustainable development
2Battery management systemEnergy management, Programming, Prediction
3Battery swappingCharging optimization, Electrical network, Simulation, Scheduling
4Vehicle–grid integration Vehicle to grid, Grid to vehicle, Vehicle to vehicle
5Wireless chargingConverter, Power electronics, Inductive power transfer
6Renewable energy Solar energy, Wind energy, Grid integration
Table 5. Mapping of bibliometric clusters to Kuwaiti non-adoption factors and policy levers.
ClusterKuwaiti Non-Adoption Factor(s) Addressed (IDs from Section 4)Policy Lever(s)
1. Charging stations(1) Lack of 300–500 kW DC fast charging (DCFC); (9) weak enforcement of EV-only baysPhase-1 DCFC spine (airport CBD–ring road) with shaded PV carports; enforce EV-only parking and anti-ICEing rules
2. Battery management systems(5) Skepticism about battery durability in extreme heatHeat-soak certification (≥70 °C under-car), longer battery warranties, dealer demo data for summer range
3. Battery swapping(1) DCFC scarcity; (7) Dealers’ low EV service capacityTaxi-fleet swap pilot; standardized under-floor packs; off-board cooled charging depots
4. Vehicle–grid integration(3) Flat subsidized tariffs reduce smart-charging/V2G valueTime-of-use tariff pilot at public DC hubs; small V2G buy-back rate; aggregator rules
5. Wireless charging(8) Oversized speedbumps and dust ingress risksIP68 pad/enclosure standard; pad sitting and ramp-height spec for EV bays; maintenance schedule for filters
6. Renewable energy(10) Low environmental salience among policymakers/publicPV-carport program at malls/bus depots; visible generation dashboards; corporate PPAs for charger hubs
Note: Numbers in parentheses are the IDs of Kuwait’s ten non-adoption factors defined in Section 4. Each cluster lists only the factors it addresses, so the IDs are not sequential.
Table 6. Key specifications of the selected EV.
Model NoRange (Km)Energy Consumption (Wh/km)Battery (kWh)
Chevrolet Bolt383156.660
Disclaimer/Publisher’s Note: The statements, opinions and data contained in all publications are solely those of the individual author(s) and contributor(s) and not of MDPI and/or the editor(s). MDPI and/or the editor(s) disclaim responsibility for any injury to people or property resulting from any ideas, methods, instructions or products referred to in the content.