Article

Applying a Deep Neural Network and Feature Engineering to Assess the Impact of Attacks on Autonomous Vehicles

Laboratory of Advanced Systems Engineering, Ibn Tofail University, Kénitra 14000, Morocco
*
Author to whom correspondence should be addressed.
World Electr. Veh. J. 2025, 16(7), 388; https://doi.org/10.3390/wevj16070388
Submission received: 15 January 2025 / Revised: 19 March 2025 / Accepted: 22 March 2025 / Published: 9 July 2025

Abstract

Autonomous vehicles are expected to reduce traffic accident casualties, as driver distraction accounts for 90% of accidents. These vehicles rely on sensors and controllers to operate independently, requiring robust security mechanisms to prevent malicious takeovers. This research proposes a novel approach to assessing the impact of cyber-attacks on autonomous vehicles and their surroundings, with a strong focus on prioritizing human safety. The system evaluates the severity of incidents caused by attacks, distinguishing between different events—for example, a pedestrian injury is classified as more critical than a collision with an inanimate object. By integrating deep neural network technology with feature engineering, the proposed system provides a comprehensive impact assessment. It is validated using metrics such as MAE, loss function, and Spearman’s correlation through experiments on a dataset of 5410 samples. Beyond enhancing autonomous vehicle security, this research contributes to real-world attack impact assessment, ensuring human safety remains a priority in the evolving autonomous landscape.

1. Introduction

The acceleration of urbanization is a global phenomenon. For the first time in 2008, the urban population surpassed the rural population [1]. According to current estimates, by 2030, more than 60% of the world’s population will live in cities increasingly concentrated in Africa, Asia, and Latin America [2]. By 2050, the global urban population could increase by two-thirds and travel within or near cities will be complicated. To avoid congestion, many solutions revolve around the idea of smart cities. Concepts such as intelligent transportation and autonomous vehicles represent viable solutions for future mobility. The development of autonomous vehicles was born from a need to reduce road accident rates.
Human factors cause about 90% of road accidents [3]. By removing all driver control of the vehicle (the driver becomes a passenger), autonomous vehicles can reduce accidents through better response time and driving at higher speeds without increasing risks [4]. Also, these vehicles will make traveling a great experience for passengers. Autonomous vehicles are equipped with digital sensors (cameras, radar, sonar, LiDAR, etc.) to discover roads [1], other vehicles, and possible obstacles [5]. The data collected by all the sensors are sent to the vehicle’s brain, which is the computer software installed on an embedded computer (ECU). It analyzes and gives meaning to the data in real time. It can then perform the necessary commands on the wheel, the accelerator, and the brakes to drive the vehicle. These vehicles can drive without drivers, are connected, and use an ad hoc network (VANET) to communicate with the infrastructure and with each other. Therefore, the emergence of autonomous vehicles, which consist of software and are guided by analysis and data exchange, is directly confronted with cyber security risks, whether they are caused by a system failure or by hackers’ malicious acts [5]. The main goal of this article is to analyze the range of threats aimed at smart and connected vehicles, which are assumed to be autonomously operated, especially focusing on possible assaults against sensors, buses, or ports. The impact of such attacks goes beyond just the vehicle because it can affect the system’s operation and endanger people nearby. Combating these threats requires an effective threat detection and impact assessment model that will help make informed decisions during emergencies. As a result, the creation of predictive models that can estimate attack consequences becomes the most important part of establishing effective prevention measures against cyber threats in self-driving cars. By knowing how badly the attack can affect the vehicle and system, we can have solutions to limit every occurrence of disaster. For instance, if a vehicle is threatened by an attack that aims to control its speed system, the attack’s consequences will be irreversible, especially if the road is congested and full of obstacles [6]. Therefore, our system must detect the impact of this attack as critical and urgent. A quick decision must be made as soon as possible to avoid human and material damage. This paper presents research and an application of a deep neural network for predicting the impact of attacks on autonomous vehicles. In the forthcoming sections, this article will introduce an in-depth methodology that includes attack categorization, feature extraction methods, and deep neural network construction to predict the effects of cyber assaults on autonomous vehicles. The main aim of this study is to elucidate and elaborate on the details in the ever-changing dynamic environment of cyber security with respect to self-driving vehicles. Additionally, we endeavor to delineate effective strategies aimed at bolstering threat mitigation and fortifying resilience in the face of emerging cyber threats.

2. Materials and Methods

The concept of this article is to build a system that can measure the impact of an attack on an AV. The autonomous vehicle is equipped with several sensors [7] and technologies that present several advantages but also have some drawbacks, such as being used as a door for an attacker to access the system and conduct multiple attacks. The danger of the attacks varies from one attack to another, and the impact of the attack varies according to a set of criteria. The system that we create aims to predict the impact of attacks on the autonomous vehicle. For instance, GPS sensors present some vulnerabilities that can be exploited by an attacker. The attackers could send erroneous location data to cause an accident. In this case, our system can study the environment of the vehicle to measure the impact of the attack and inform the RSU and other vehicles of the existence of a malicious vehicle that is sending erroneous location data.

2.1. Impact Variables
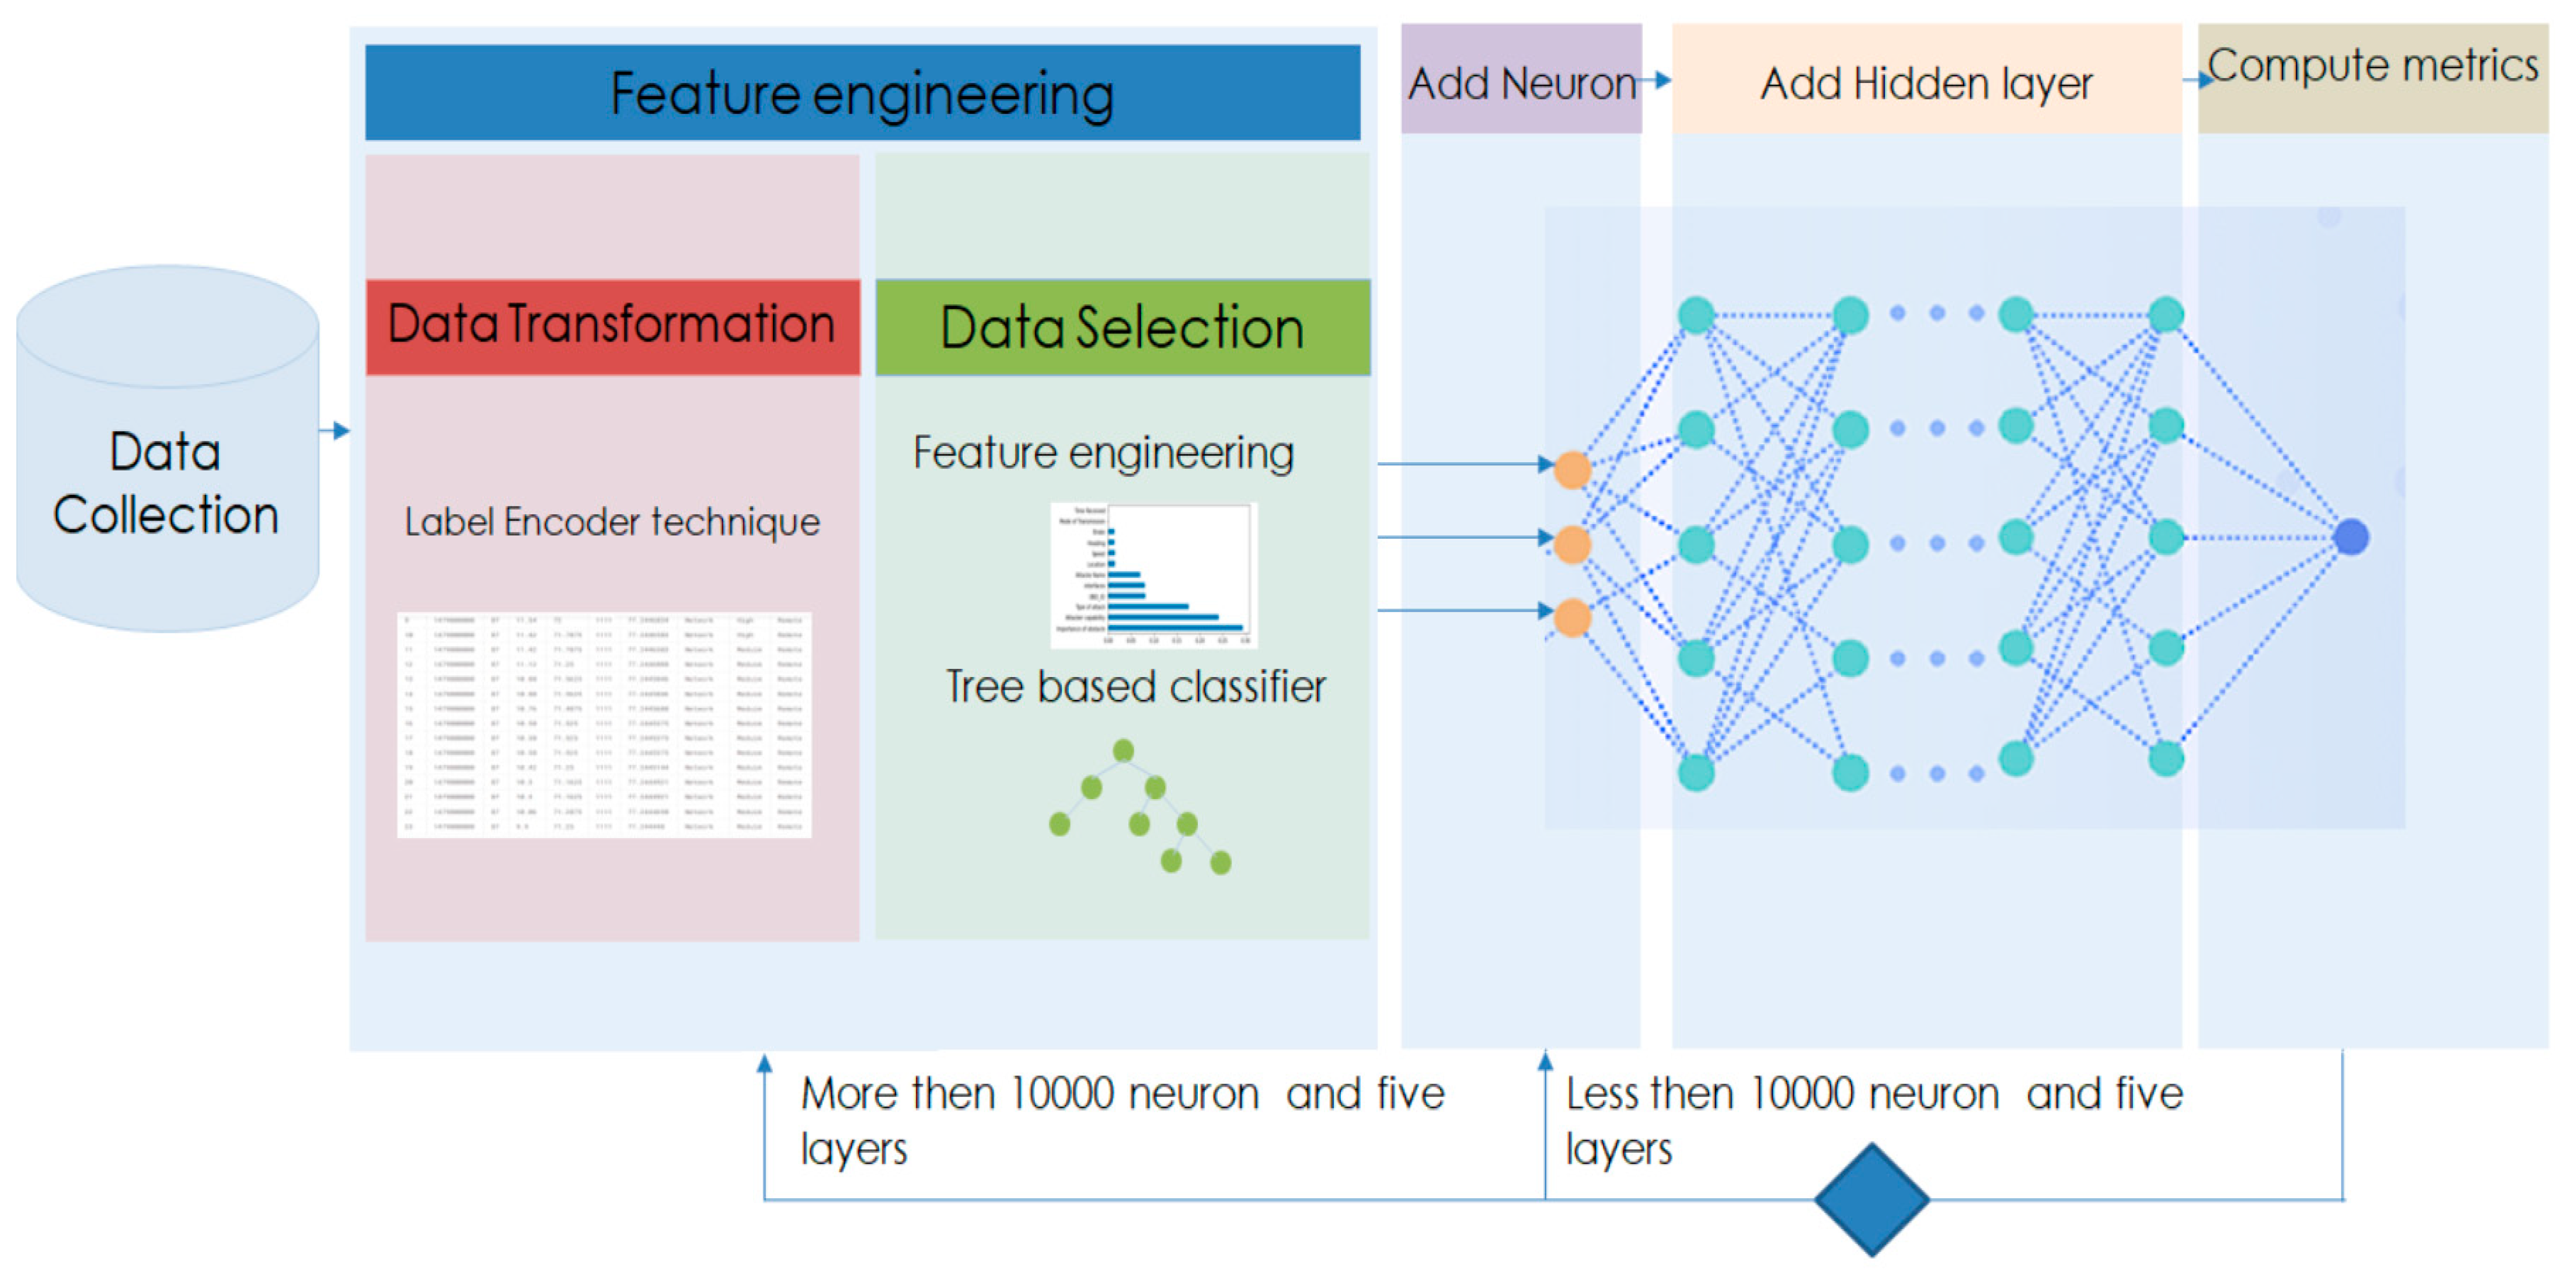
To measure impact, it is necessary to first understand the impact and variables involved in measuring it. The key question asked during our study is how can impact be measured? Is it a positive effect? In our case, we are only dealing with negative impacts since an attacker’s goal is to harm the network. To quantify the impact I of an attack on an autonomous vehicle, we define the relationship as a weighted sum of the danger level of the attack D , the criticality of surrounding obstacles O , and contextual factors C .
I = α · D + β · O + γ C
where α, β, γ are weight coefficients that represent the relative importance of each component D ,   O , C , ensuring that α + β + γ = 1.
The danger level D is computed by considering the feasibility, severity, and detection difficulty of the attack, with the formula:
D = ω f · F + ω s · S + ω d · D
Attacks likely to target an AV can be caused either by the VANET network or the vehicle itself [2]. The vehicle has a set of sensors and an engine control unit (ECU) that the hacker can exploit to change the vehicle’s road or conduct other malicious manipulations [8]. Our work was designed to provide a classification of attacks according to the level of danger. We use five criteria to classify them as shown in Table 1: The interface from where the attack comes from. The name of the attack, The capability of the attacker, which means the degree of expertise that a hacker must have to carry out an attack, as well as the necessary budget to buy the equipment that makes it possible to carry out the attack. We also highlighted the physical/remote criterion of knowing if an attack requires contact with the AV or can occur remotely. Finally, we include the damages that the attack can cause. The classification of attacks by the level of hazardousness will be beneficial for our work. It will simplify the implementation of the database of various attacks that could threaten an autonomous vehicle, and this database will be of great help to improve the prediction task.
The attacks we will be interested in are those with high feasibility of success, namely attacks on GPS, cameras, and ECU attacks. The attacks carried out on the GPS have a very high feasibility of success because the tools used for jamming are inexpensive. This type of attack does not require advanced expertise in the field; the system’s detection of GPS attacks becomes difficult. On the other hand, attacks on GPS are dangerous, as an attacker can control a vehicle and redirect it to another direction. An attacker can also be the cause of accidents by transmitting erroneous data about its location. The camera is considered a vision system for the vehicle; attacks that threaten the camera have great feasibility of success because they usually use inexpensive equipment such as lasers and are difficult to detect. However, the danger of these attacks is less critical than that of GPS because the other sensors installed in the vehicle, such as LiDAR and radar, can detect obstacles and objects on the road if the vehicle’s cameras are disabled. If the other sensors (LiDAR, radar, GPS) are working correctly, obstacle detection will not be a problem if the attacker blinds the camera. However, the detection of traffic signs is a problem. In this case, the degree of dangerousness will fluctuate depending on the type of attack carried out. In the case of an attack that scrambles the camera but can still detect traffic signs, the degree of dangerousness will be lower than an attack that completely scrambles the camera. The ECU is considered the vehicle’s core, so any attack on the ECU can severely damage its vital functions (brakes, window, speed). To attack the ECU, the attacker must have direct access to it. Attacks applied to ECUs are divided into two types: those coming from the OBD-II port and those coming from buses such as the CAN. The OBD-II has much vulnerability. Indeed, the OBD-II Scanner tool is a cheap tool that is available to everyone. Moreover, the ECU is connected to other ECUs via a CAN bus that is not equipped with any protection. If we have infected data, the infection can quickly spread to other ECUs. ECU attacks are dangerous because no measures have been taken to increase the security of both access routes and, consequently, the protection of access to the ECU. Modern vehicles can also be paired with mobile devices; for instance, the driver can connect to the phone via Bluetooth or Wi-Fi. Implementing these protocols remains imperfect; they can lead to direct attacks, in which case an attacker located near the car terminal will try to control the vehicle. By allowing interaction with these devices, such as a smartphone, the attacker can install a vehicle diagnostic application that will inject malicious data and easily control the vehicle. The danger of attacks on the ECU depends on which ECU the attacker targeted. An attack aimed at controlling the car’s windows is not as dangerous as an attack aimed at controlling the brakes or speed. The remaining attacks have a low to medium degree of attacker capability. Therefore, the attacker must have some knowledge and expertise to successfully conduct the attack [20] since the system is protected against this type of attack. However, this does not mean that they should be neglected; on the contrary, they should be considered when creating the database while knowing that their threat level is still lower than other types of attacks. According to those variables, we create four impact levels. The first level is the most important one, which is the impact on human life. The second level concerns the material damage related to the VANET Network; the third level involves material and ecological damage. The fourth and last level is moral damage—attacks that aim to steal the driver’s information or spy on the network information. It should also be noted that we may have a combination of these types of damage; in some cases, we may face material and physical damage or material and moral damage.
A vehicle is always surrounded by obstacles and can be the target of several types of attacks. Concerning the degree of importance of these obstacles, it varies according to their type (see Table 2). A pedestrian is more important than a tree, while a tree is more important (from an ecological point of view) than a pole; here, the importance is related to the type of obstacle encountered. In the above example, a vehicle that causes an accident and the victim is a pedestrian; this accident’s impact will be more virulent than the impact of a vehicle hitting a tree or a pole since it is human life that is the most valuable.
The criticality of obstacles O is calculated using the human, ecological, and material damage caused by the obstacle, as represented by:
O = ω h H + ω e · E + ω m · M
and contextual factors C can include the vehicle’s speed and environmental conditions:
C = ω v · V + ω W · W
This equation provides a comprehensive framework to model the impact of an attack on autonomous vehicles by integrating multiple dimensions of attack severity, obstacle criticality, and real-time context. To validate the robustness and accuracy of this model, Spearman’s rank correlation coefficient ( ρ ) is applied to assess the strength and direction of the relationship between ranked attack types and obstacle criticality. Spearman’s ρ is calculated using the formula:
ρ = 1 6 d i 2 n ( n 2 1 )
where d i represents the difference between the ranks of attack danger and obstacle criticality, and n is the total number of observations. A high ρ value (close to 1) indicates that the relationship between attack danger and obstacle criticality is strongly correlated, providing evidence for the validity of the impact model.

2.2. Method

When we start building the model, we first need to look at the data. Understanding data is critical in data science to build powerful functions and efficient models. Looking at the data will help create insight and understanding, which leads to generating assumptions about new potential features that can lead to a better understanding. This section focuses on feature engineering, which is a process of choosing and transforming variables when building a predictive model through machine learning or statistical modeling (such as in-depth learning, decision trees, or regression). To understand the data, we follow a three-step process. We start the process by transforming the data into a homogenous set. A predictive pattern where all predictors are at the same level can facilitate interpretation. The next step is the selection of the best feature. Applying this step before modeling can be beneficial; it can reduce over-fitting because we will have less duplicated data. Additionally, it will improve the model by reducing false data and reducing training time because we will have smaller data points, which will reduce the algorithm’s computational and training time. The visualization step is also very beneficial because by visualizing data, we can better understand.

2.2.1. Data Transformation

The data of our work are a combination of the output of a detection system [21] and the data related to the environment of the vehicle. We used a database that contains 5410 samples; 3376 are normal data, and 2034 are anomalous data.
The detection system provides information about the interface of the attack, the type of attack, and information about the attacker. The rest of the data are collected from different sensors. The importance of obstacles, damages, and attacker’s capability variables have a categorical value (such as low, high, or medium). The vehicle’s interface presents a vulnerability that will help measure the impact because an attack that threatens an ECU is different from an attack that threatens a camera or LiDAR. The name and type of attack (remote or physical) that have a string type are very important in measuring the impact since prior information about the kind of attack provides more information when measuring the impact. After all, an attack that targets the ECU controlling the vehicle’s speed is dangerous compared to an eavesdropping attack that aims to listen to the traffic and steal information. Those three variables have a typed string. The last three variables are numerical: the obstacle, the distance, and the speed. Obstacles are among the most critical variables in measuring an attack’s impact because a vehicle that crashes into a tree or a wall does not have the same impact value as a vehicle that hits a pedestrian. After defining the variables and the type of each variable, we can conclude that we have different types of variables (ordinal, numerical, categorical). We should first transform those data into homogenous data and convert all data into an integer type. We use a label encoder technique to transform the data into a homogenous structure. This method is very simple; it converts each field value into a number.

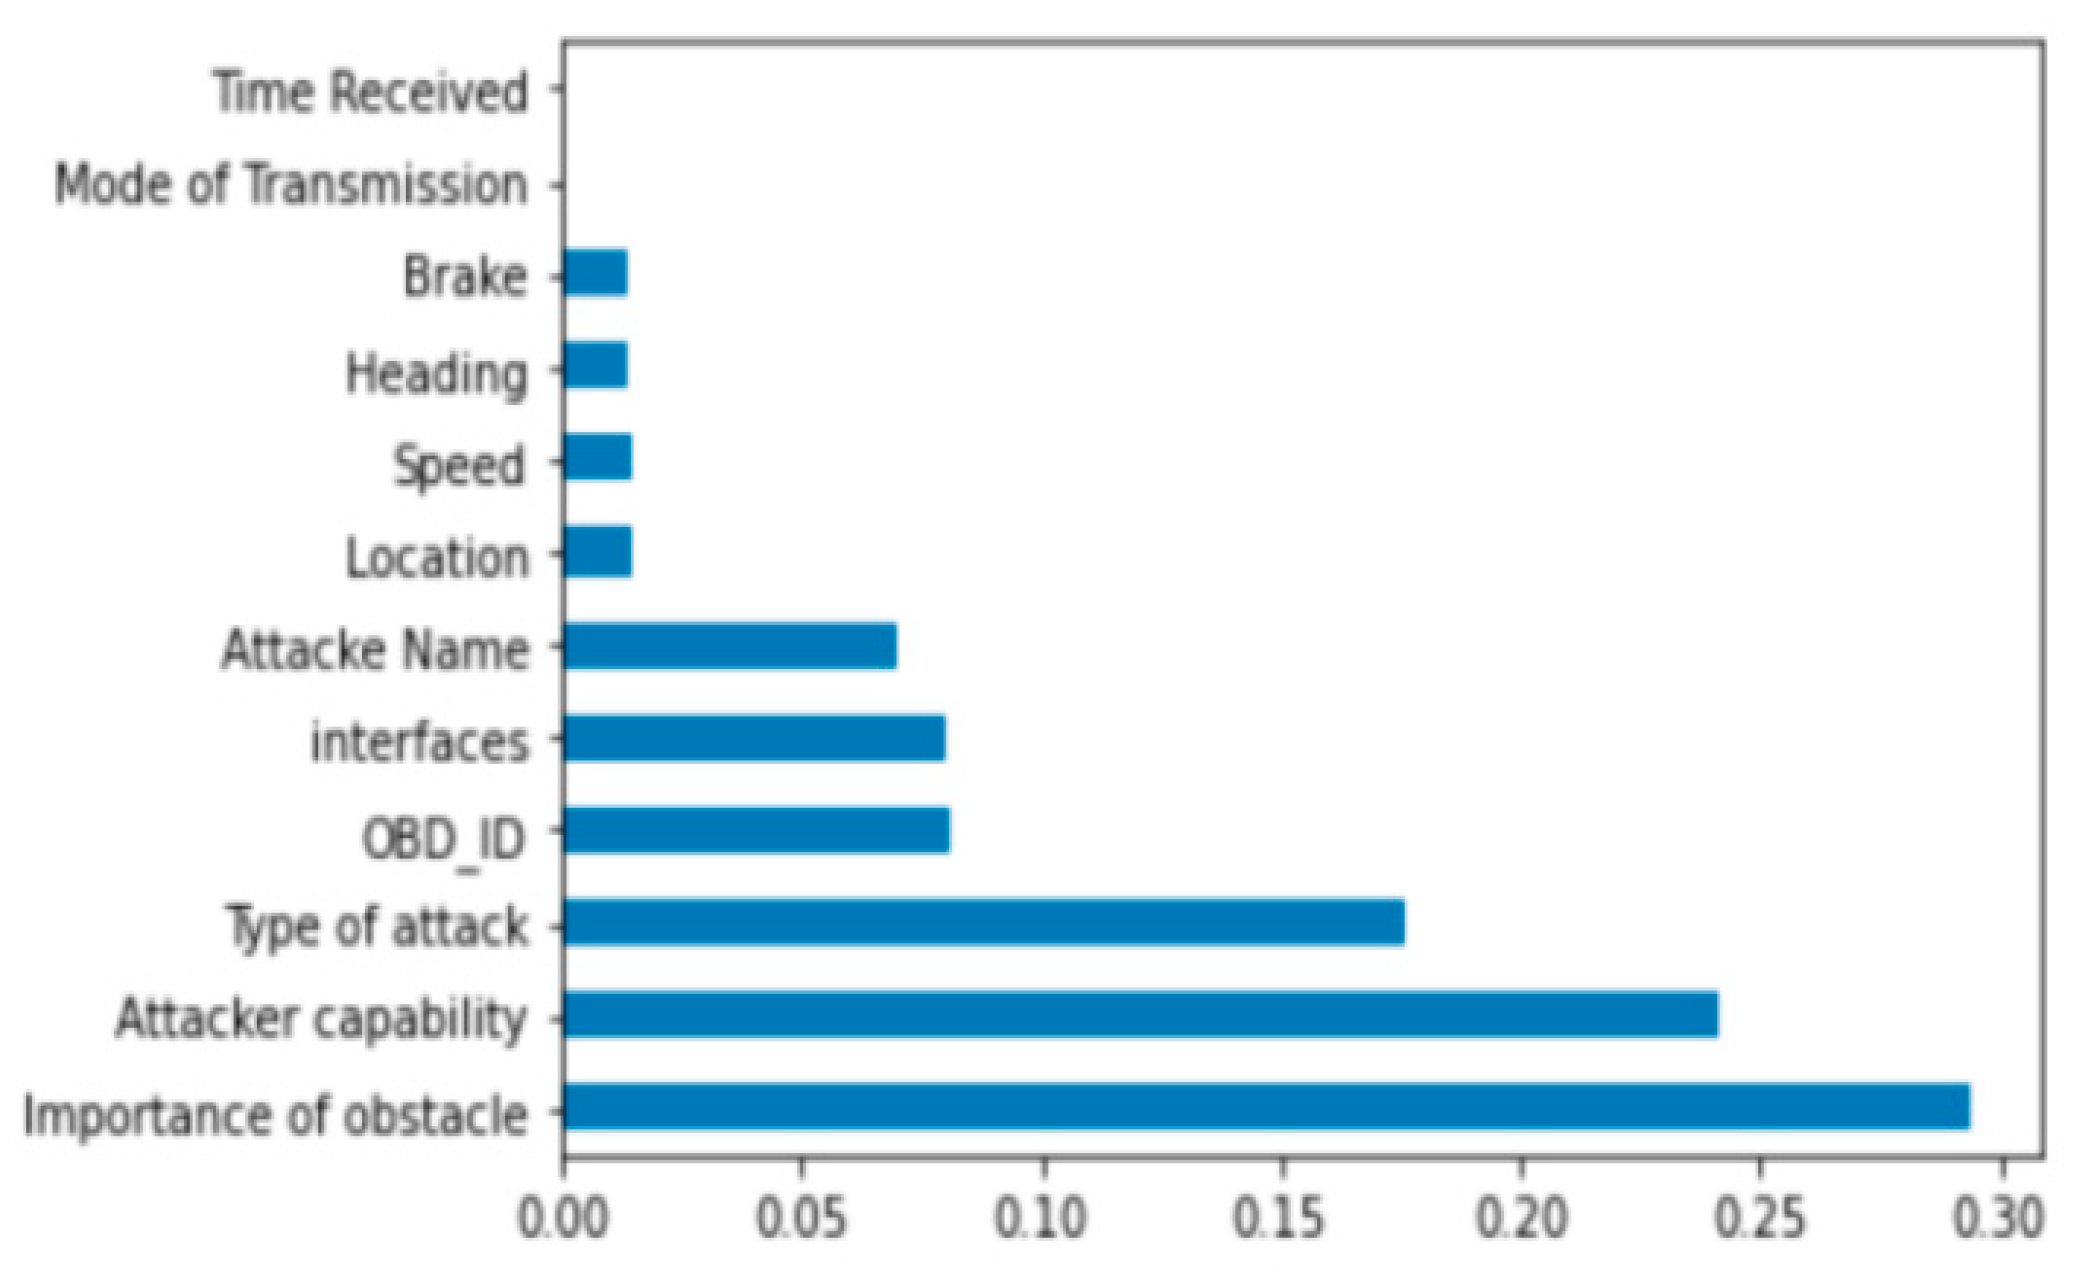
2.2.2. Feature Selection

Ensuring that the model accurately predicts the impact of an attack on an autonomous vehicle is crucial. However, identifying the most important variables is equally significant, as it helps enhance early detection capabilities and improves the safety of autonomous vehicles. By selecting the most relevant features, we not only improve model interpretability [22] but also enhance computational efficiency by reducing training time without compromising accuracy.
To achieve this, we employed Gini Importance [23], a feature selection technique based on decision trees, to rank and extract the most influential features. Specifically, we used the Extra Trees Classifier, an ensemble learning method similar to Random Forest but differing in tree construction, as it selects split points randomly rather than optimizing them. This randomness reduces variance and improves generalization.
The feature selection process was conducted as follows:
Initial Feature Evaluation:
We initially considered all available features in the dataset.
The Gini index was computed for each feature to measure its contribution to reducing uncertainty in classification.
Feature Ranking and Selection:
The Extra Trees Classifier assigned importance scores to each feature by calculating the total normalized reduction of the Gini index.
Features with higher importance scores were prioritized, while those with minimal contribution were eliminated.
A cutoff threshold was applied, and the top 12 features were retained for model training.
Results of Feature Selection:
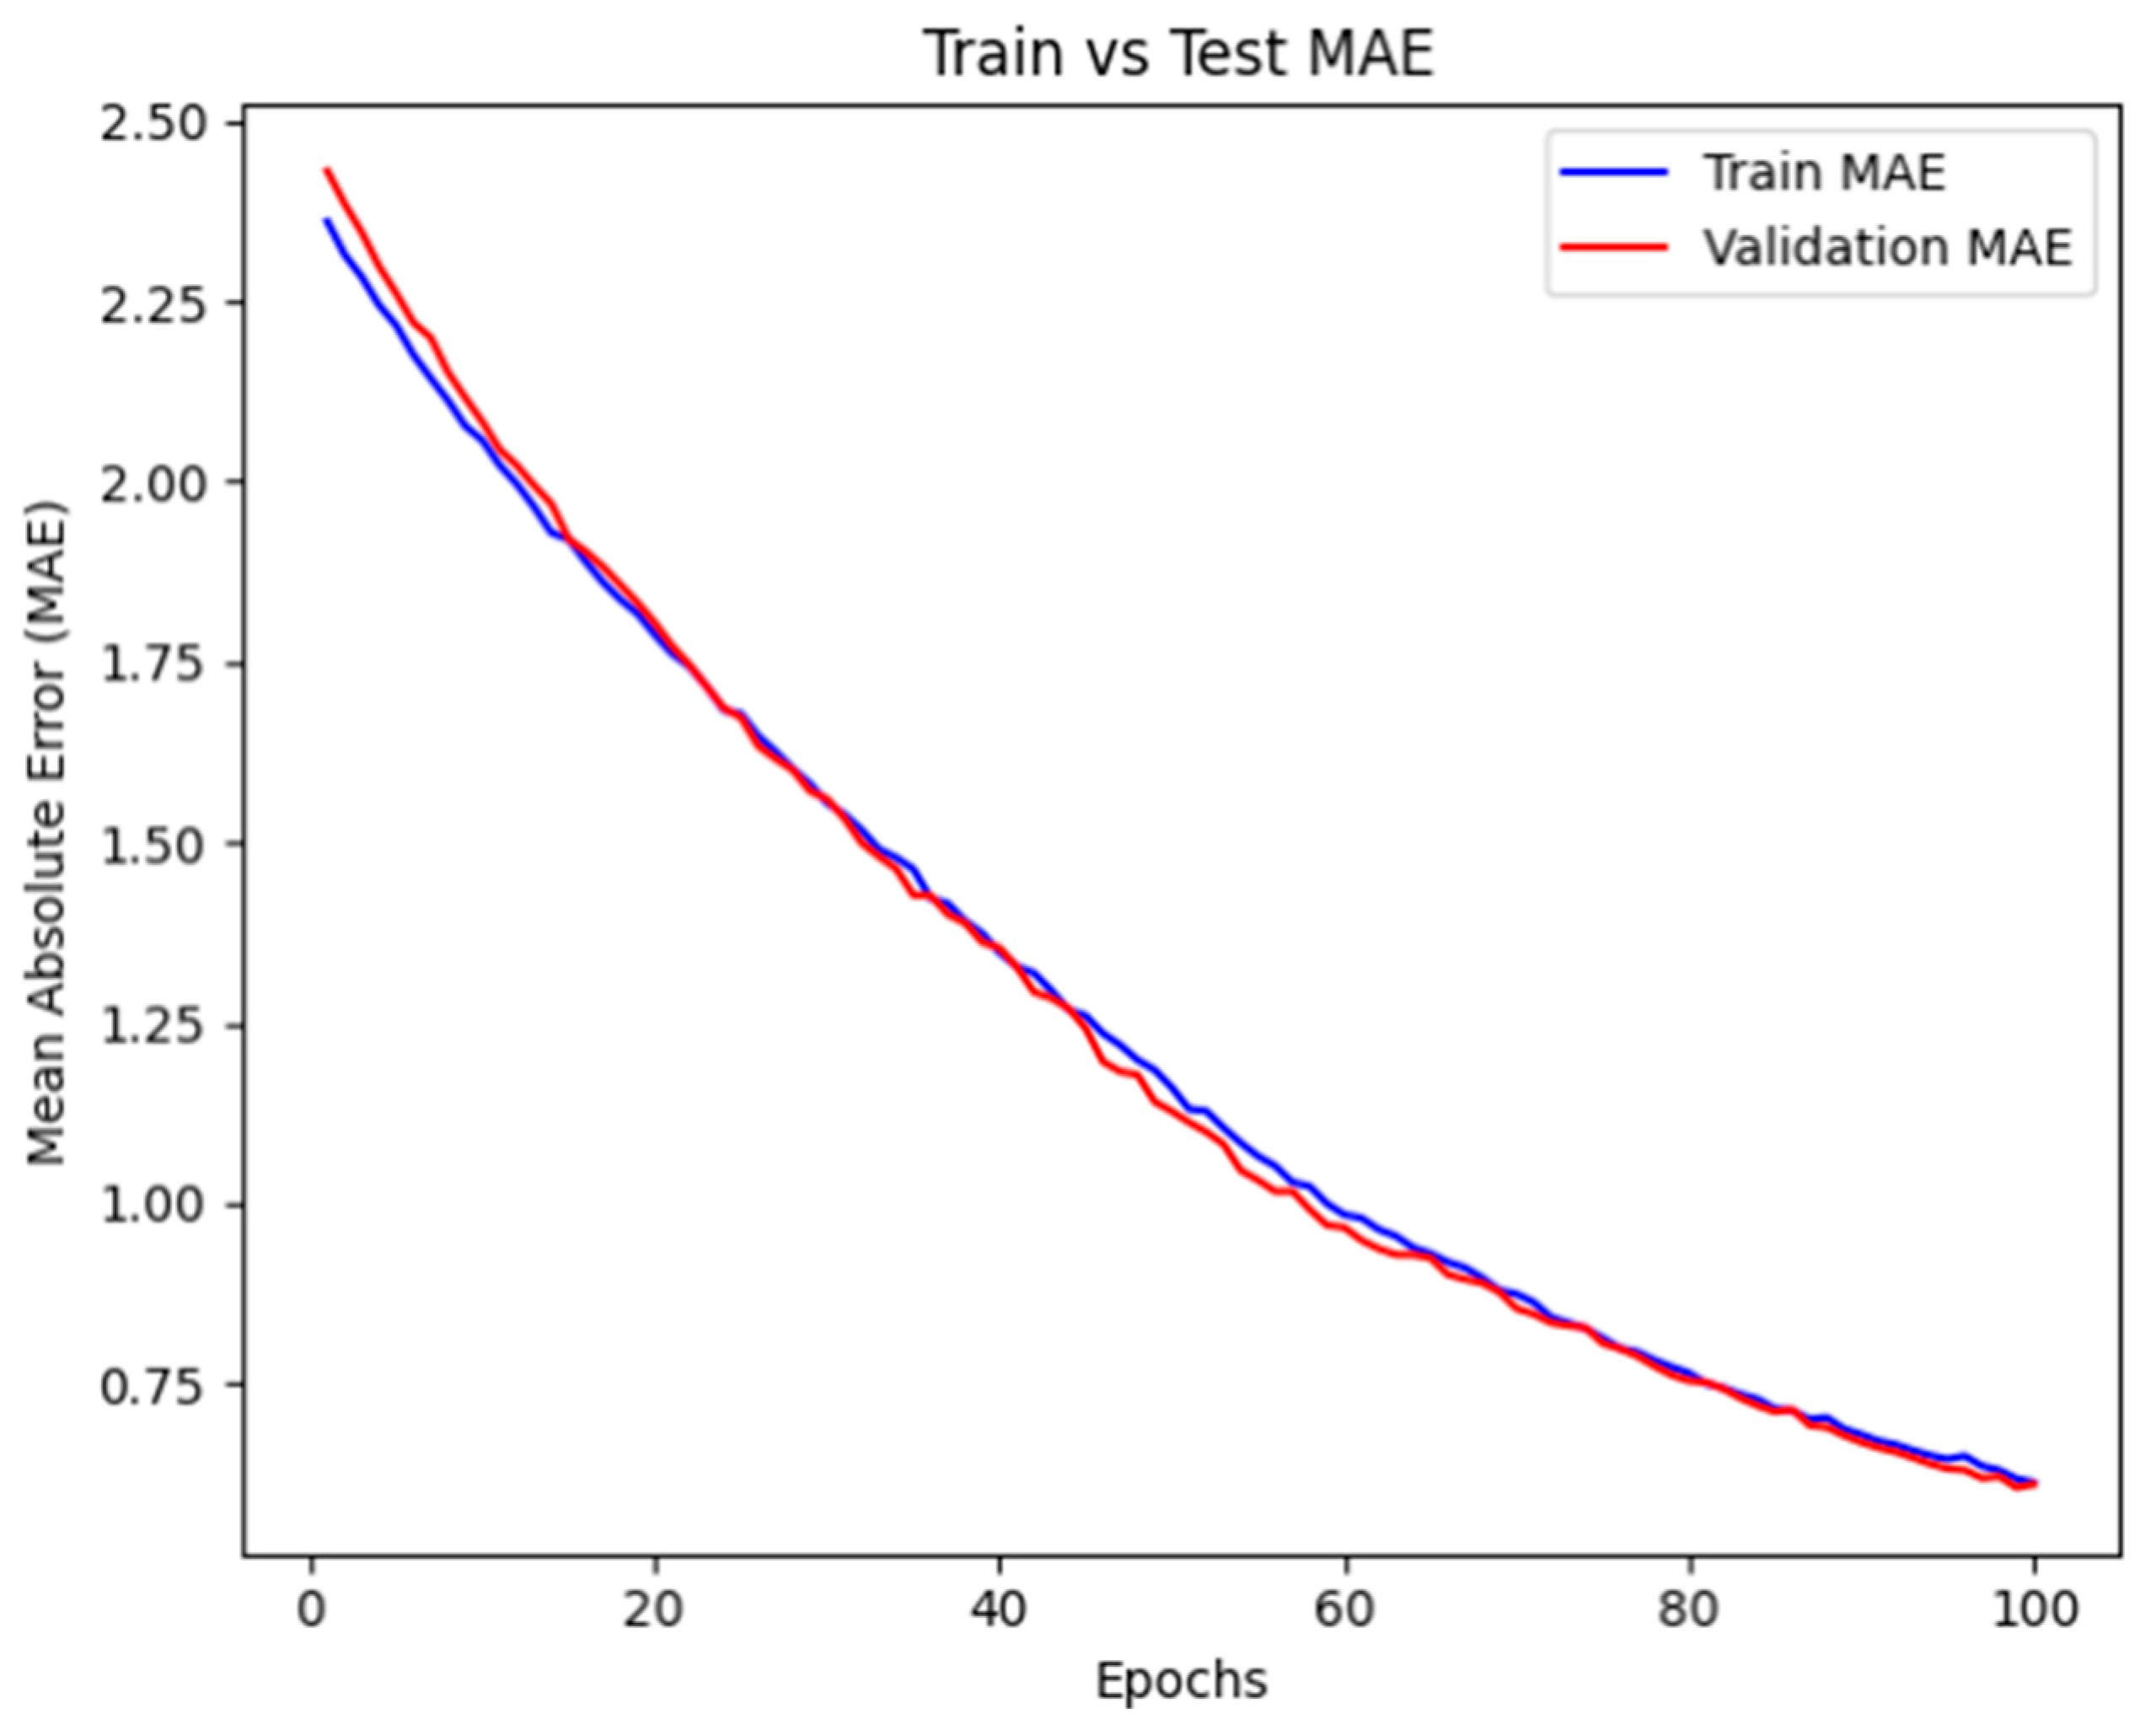
Reducing the feature set improved training efficiency, leading to a faster convergence of the deep neural network.
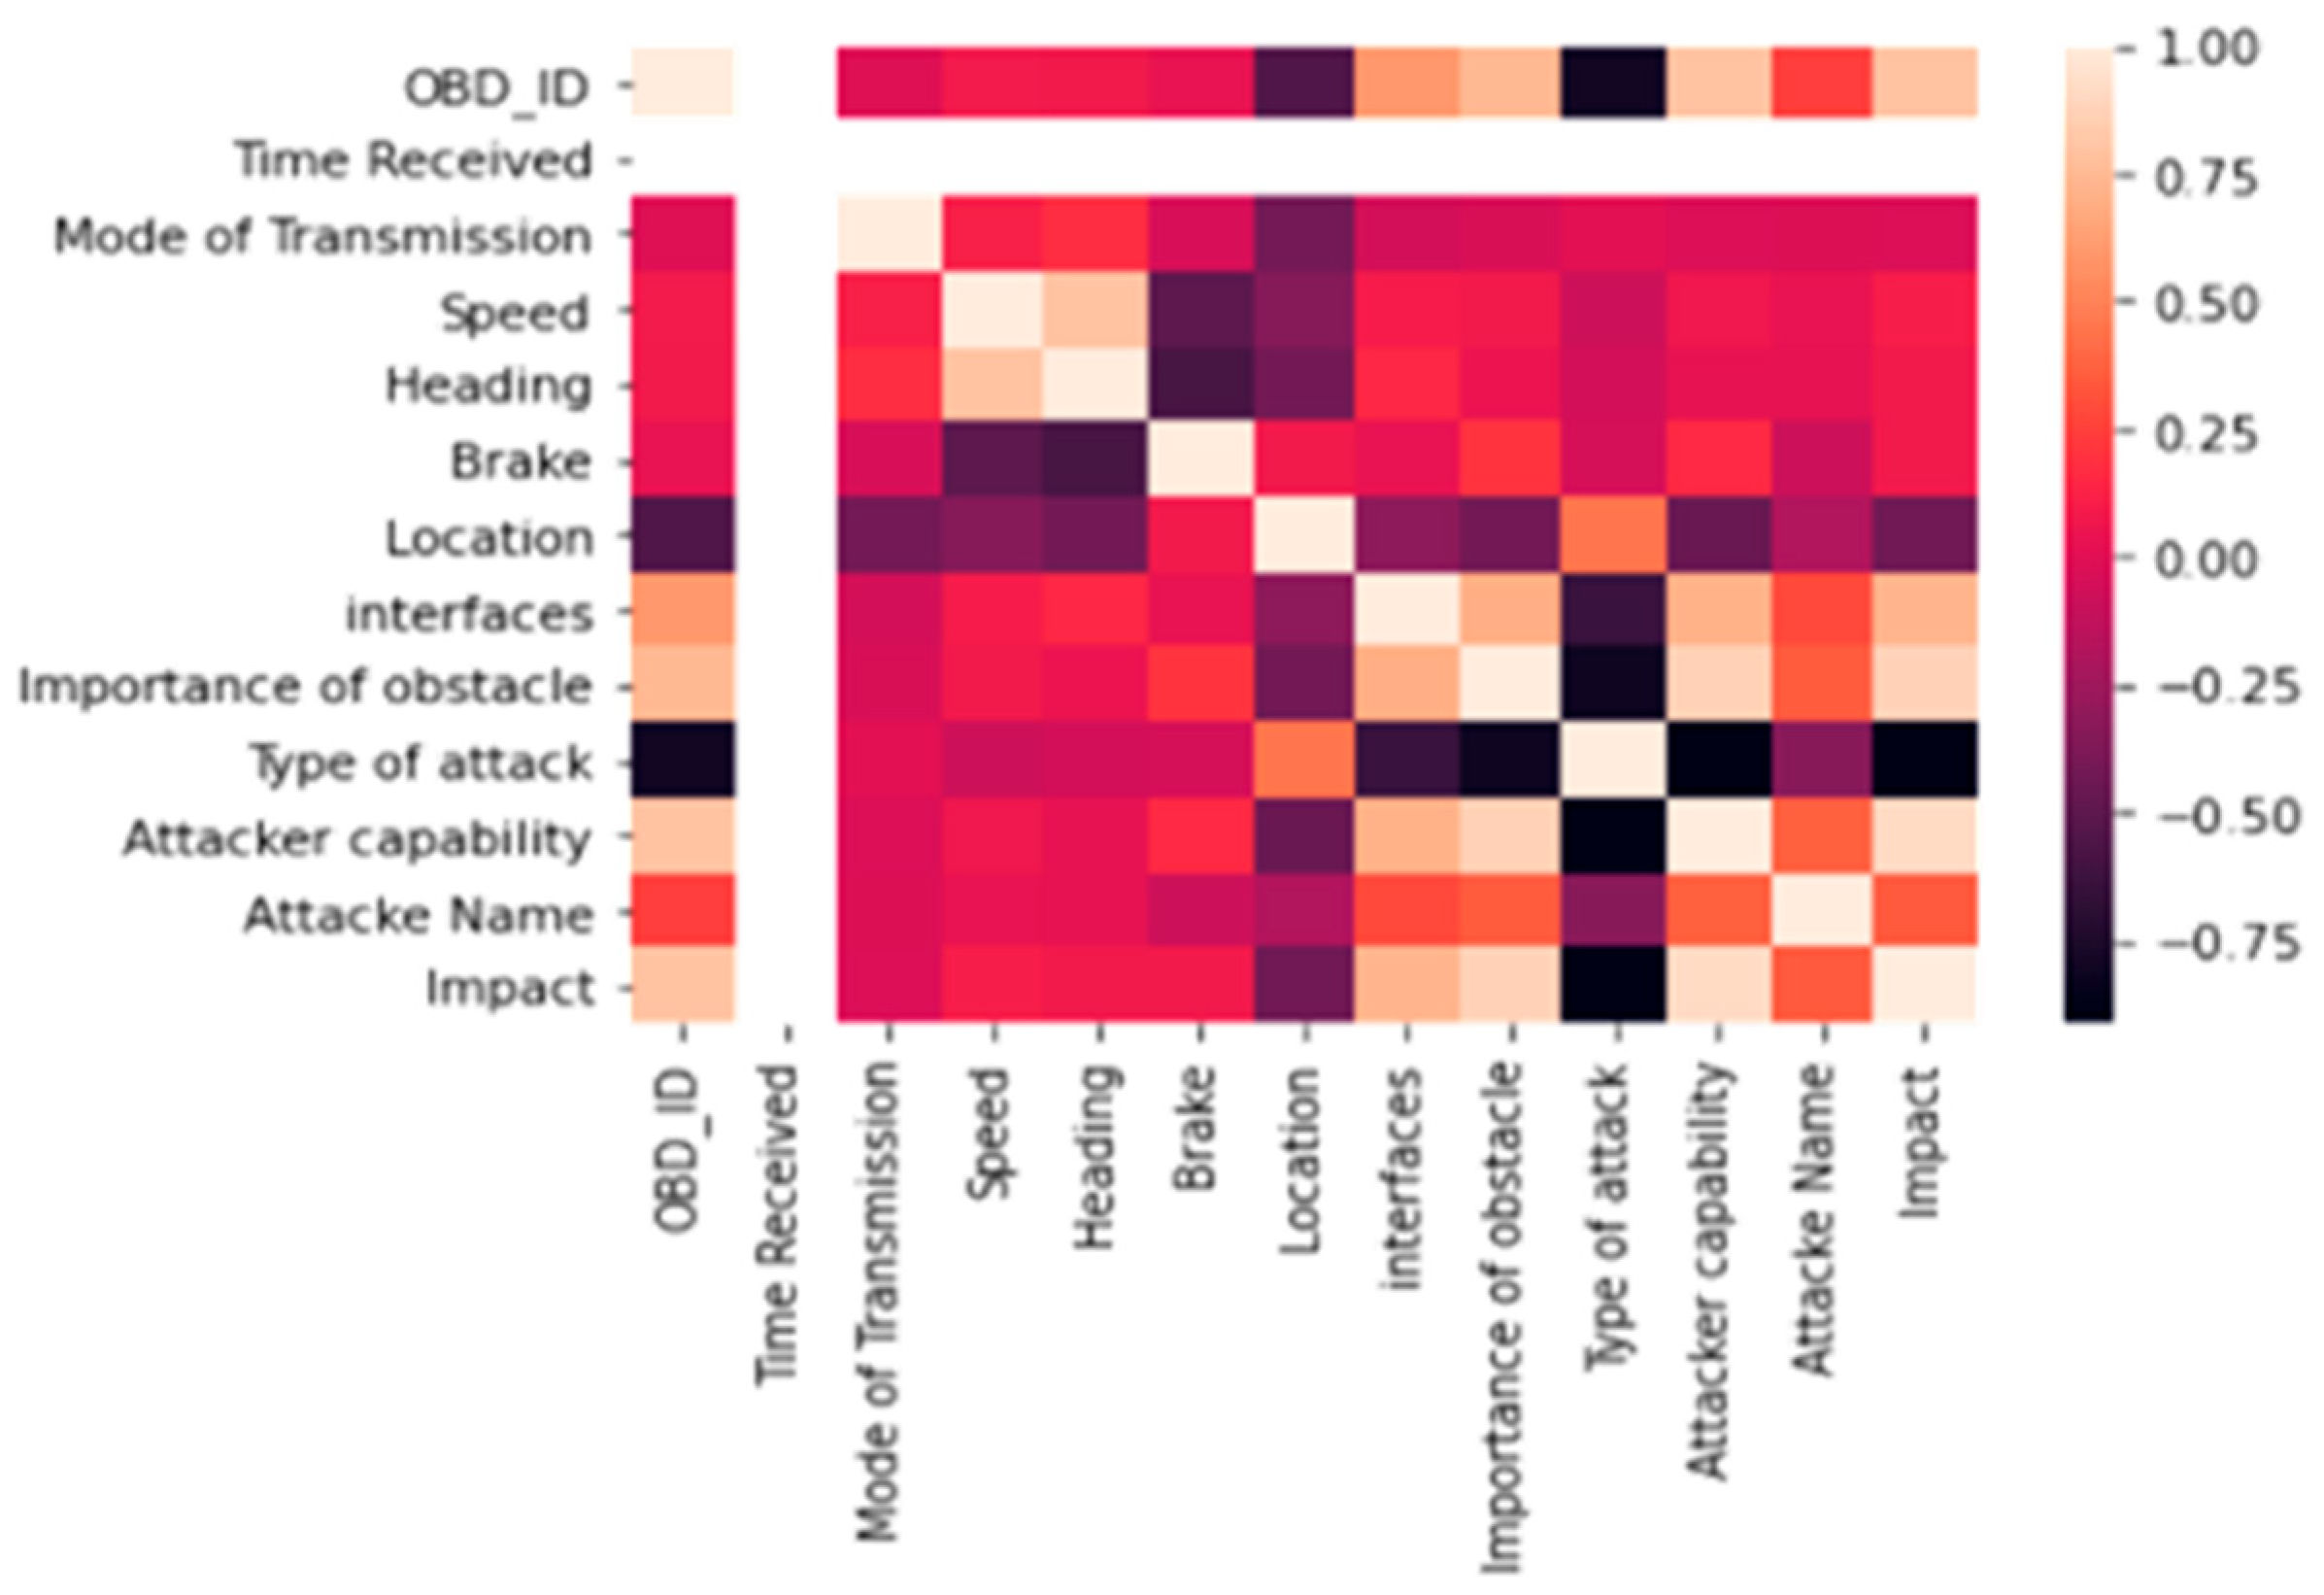
The final selected features preserved the model’s predictive performance, as verified through Spearman’s correlation and model validation metrics (MAE and loss function).
The trade-off between model complexity and interpretability was optimized, ensuring that only the most critical features influencing attack impact were considered.
This structured feature selection process allowed us to refine the model while maintaining accuracy, making it better suited for real-world applications in assessing cyber-attack impacts on autonomous vehicles.

2.2.3. Designing a Neural Network

For a successful neural network design, six essential elements must be identified: The input and output, the number of hidden layers, the activation function, the loss function, the optimizer, and the metrics.
The input to the deep neural network consists of 12 selected features, chosen through the Gini Importance method using the Extra Trees Classifier. These features were determined to have the highest impact on the model’s predictive performance. The selected input variables represent key aspects influencing attack severity, including the following:
Vehicle status parameters (e.g., speed, braking status, acceleration);
Sensor data (e.g., LiDAR or camera readings);
Environmental conditions (e.g., weather, road surface state);
System vulnerabilities (e.g., attack type, affected system component).
The input data are structured as an n × 12 feature matrix, where n represents the number of samples (5410 in this study). Before feeding the data into the neural network, we apply normalization techniques to ensure all features are within a comparable range, improving training efficiency.
The deep neural network outputs a quantitative impact score, which represents the severity of the attack on the autonomous vehicle and its surroundings. The impact score is determined based on the following:
Human factors (e.g., injuries or fatalities);
Material and ecological damage (e.g., vehicle damage, infrastructure impact);
Moral impacts (e.g., ethical concerns, trust in autonomous systems).
This output serves as an essential metric to assess how critical an attack is, allowing stakeholders to prioritize mitigation strategies accordingly.
By structuring the input and output in this way, our model ensures a comprehensive assessment of attack severity, balancing accuracy, interpretability, and computational efficiency.
There are no “secret” rules for working out the number of layers and hidden nodes in the neural network, yet a couple of tips can assist with tracking down the best ones. The correct number of hidden nodes is a combination of the following: The amount of input and output nodes, the quantity of training data available, and the difficulty of the function to be learned. When the data can be linearly partitionable, then, at that point, there is no requirement for hidden layers. In other cases, there is a consensus regarding adding extra hidden layers. Hence, a single hidden layer is adequate for, by far, most issues. There are many optimization functions, yet we decided on Adaptive Moment Estimation (Adam) since it is widely used in deep learning as it obtains great outcomes rapidly [24]. Several metrics are additionally used to assess the achievements of the model.
The input to the deep neural network consists of 12 selected features, chosen through the Gini Importance [23] method using the Extra Trees Classifier. These features were determined to have the highest impact on the model’s predictive performance. The selected input variables represent key aspects influencing attack severity:
  • Vehicle status parameters (e.g., speed, braking status, acceleration);
  • Sensor data (e.g., LiDAR or camera readings);
  • Environmental conditions (e.g., weather, road surface state);
  • System vulnerabilities (e.g., attack type, affected system component).
The input data are structured as an n × 12 feature matrix, where n represents the number of samples (5410 in this study). Before feeding the data into the neural network, we apply normalization techniques to ensure all features are within a comparable range, improving training efficiency.
The deep neural network outputs a quantitative impact score, which represents the severity of the attack on the autonomous vehicle and its surroundings. The impact score is determined based on the following:
  • Human factors (e.g., injuries or fatalities);
  • Material and ecological damage (e.g., vehicle damage, infrastructure impact);
  • Moral impact (e.g., ethical concerns, trust in autonomous systems).
This output serves as an essential metric to assess how critical an attack is, allowing stakeholders to prioritize mitigation strategies accordingly.
To design the neural network, we began with a shallow network with one hidden layer and evaluated the model using the previously defined metrics. Based on the performance assessment, we iteratively adjusted the architecture:
If the model performance was poor, we added a second hidden layer with a similar number of neurons and re-evaluated the results.
If further improvements were needed, we increased the number of neurons and adjusted the hidden layers.
If the model showed persistent overfitting or underfitting, or if performance metrics remained low, we reconsidered feature engineering before exceeding five layers or 1000 nodes.
There are no strict rules for determining the number of hidden layers and nodes, but an optimal architecture is influenced by the following:
  • The number of input and output nodes.
  • The amount of available training data.
  • The complexity of the function to be learned.
For linearly separable data, hidden layers are unnecessary. However, for more complex problems, a single hidden layer is often sufficient, though deeper architectures may be beneficial in certain cases.
The DNN is trained using the backpropagation algorithm with stochastic gradient descent (SGD) to iteratively update the network’s weights. To enhance convergence speed and stability, we employed the Adam optimizer, which adaptively adjusts learning rates based on momentum and RMSprop principles. We use mean squared error (MSE) as the loss function, which measures the average squared difference between predicted and actual impact scores. MSE is suitable for regression tasks and helps minimize large prediction errors. We used mean absolute error (MAE) as a performance metric that measures the average absolute difference between predictions and actual impact scores. Finally, we used Spearman’s rank correlation to ensure that predicted rankings of attack severity aligned with real-world rankings.
After experimenting with different architectures and tuning various parameters, we finally arrived at an optimized neural network. The final model was trained with the following hyper-parameters as shown in Table 3.
By structuring the input, output, and training process in this manner (Figure 1), our model ensures a comprehensive assessment of attack severity, balancing accuracy, interpretability, and computational efficiency.
To design the neural network, we began with a short network with one hidden layer; then, at that point, we assessed the model by utilizing the recently defined measures. There are two cases after the assessment of the model. The results of the model will either be good or the opposite. In our case, the result was unfavorable, so we added a second layer with a similar number of neurons, and we recalculated the metrics to assess the model. If the result is unfavorable, we added more neurons while changing the hidden layers. In situations where the model continually overfits or underfits the data, the metrics are extremely low, the number of layers surpasses five, and the quantity of nodes surpasses 1000, we should return to the feature engineering step to enhance it.

3. Results

To build our deep neural network that predicts the impact of attacks on autonomous vehicles, we used Keras and TensorFlow the work environment is described in Table 4. First, we started with the feature engineering technique to extract the relevant data. Then, to build our neural network, we followed the process shown in Figure 2. The ReLU activation function helped overcome the issues and is used in most cases these days. The ReLU function should only be used in the hidden layers when building a network. We can begin using the ReLU function; then, we can switch to other activation functions if the ReLU function does not yield good performance.
The results obtained from calculating feature gains using the feature importance method are shown in Figure 2. The top three most important features were identified as follows:
  • The importance of obstacles;
  • The attacker’s capability;
  • The type of attack.
The result also highlighted that weather was excluded, as it does not significantly impact the assessment. Variables with high correlation values (e.g., importance of obstacles) were identified as critical, while those with weak correlations (e.g., location) were considered less relevant.
We also used the correlation matrix represented in Figure 3 to better understand the relationship between input and output variables and select variables that are not relevant as inputs for the development of our model. A correlation can be positive, which means that the two variables move in the same direction, or negative, which means that as the value of one variable increases, the values of other variables decrease. The correlation can also be neuronal or zero, which means that the variables are not related. The correlation matrix confirms the results found when calculating the feature gains. Variables with a dark color (black and black degradation) have a very weak correlation with the output variable, such as location and type of attack. Variables with skin color have a very high correlation with the output variable, such as the importance of the obstacle and the attacker’s capability.
In this study, a deep neural network (DNN) was employed to assess the impact of attacks on autonomous vehicles using a dataset with various features. The model was trained using the Adam optimizer with mean squared error (MSE) as the loss function, and its performance was evaluated based on both mean absolute error (MAE) and MSE across training and validation datasets. The results shown in Figure 4 and Figure 5 demonstrated a progressive decline in both loss and error metrics over successive epochs, indicating that the model successfully learned patterns from the data.
However, traditional loss-based metrics alone do not fully capture the reliability of predictions, particularly in scenarios where the ranking of impact severity is crucial. To provide a more rigorous validation, Spearman’s rank correlation coefficient was employed to assess the monotonic relationship between the predicted and actual impact scores (Figure 6). The obtained correlation of 0.7270, with a statistically significant p-value of 0.0000, confirms a strong positive association, indicating that the model effectively preserves the relative ordering of impact values. This is particularly important in decision-making applications, where understanding the ranking of risks is more critical than minimizing absolute errors. Unlike conventional validation approaches, Spearman’s coefficient ensures that the model captures not only numerical accuracy but also the underlying structure of the data, making it a robust metric for evaluating predictive reliability in impact assessment models. These findings reinforce the suitability of DNNs for analyzing impact in autonomous vehicle security and highlight the necessity of rank-based validation techniques in similar predictive modeling tasks.

4. Discussion

A detailed comparison of the feature importance method and the correlation matrix provides valuable insights into their complementary roles in feature evaluation. The feature importance method prioritizes the type of attack, reflecting a broader classification of harmful activities that could compromise vehicle functionality. Conversely, the correlation matrix gives more weight to the attack’s name, suggesting nuanced insights based on specific attack characteristics.
This divergence underscores the complexity of attack impacts. For example, a physical attack targeting a vehicle’s ECU (Electronic Control Unit) might uniformly pose a high risk due to direct control over critical systems. However, the attack name provides granular context, distinguishing between severe threats like a direct hacking attempt and less impactful ones like passive eavesdropping. This suggests that integrating both methodologies could yield a more holistic understanding of feature relevance, particularly when addressing edge cases in cybersecurity scenarios.
The decreasing trend of the loss function across epochs, coupled with the minimal gap between training and testing datasets, signifies a well-generalized model with negligible overfitting. However, MAE metrics alone do not fully validate the model’s effectiveness, particularly in cases where ranking the severity of attacks is crucial for impact assessment. To address this limitation, Spearman’s rank correlation coefficient was employed to evaluate the model’s ability to preserve the relative ranking of attack impacts.
The Spearman’s correlation of 0.7270, with a statistically significant p-value < 0.0001, indicates a strong positive monotonic relationship between the predicted and actual impact scores. Unlike traditional classification metrics, Spearman’s coefficient ensures that the model’s predictions align with the underlying structure of impact severity, making it a robust validation technique in cybersecurity applications. This is particularly important in scenarios where understanding the relative ranking of attack threats is more valuable than minimizing absolute errors. By preserving the order of impact severity, the model enables more effective decision-making in prioritizing cybersecurity measures and allocating resources to mitigate the most severe threats.
The results have significant implications for improving the cybersecurity resilience of autonomous vehicles. The importance of obstacles and attacker capabilities suggests that physical and operational aspects of the environment should be core considerations in vehicle security protocols. For example, advanced sensors and obstacle detection mechanisms could be designed to identify potentially malicious interference.
Additionally, the interplay between attack type and name highlights the need for adaptive security frameworks capable of responding to diverse threat profiles. The ability to differentiate between attack types and their associated risks could inform the prioritization of defensive measures, ensuring that resources are allocated efficiently to mitigate the most severe threats.
Despite the model’s strong performance, several challenges remain. The divergence between the feature importance and correlation matrix results suggests that relying solely on one method could lead to biased or incomplete conclusions. Future work should explore hybrid approaches that integrate multiple feature evaluation techniques to leverage their respective strengths.
Moreover, the exclusion of weather as a significant feature raises questions about the role of environmental factors in cybersecurity. While it may not directly influence attack impacts in controlled settings, dynamic real-world conditions, such as adverse weather, could exacerbate vulnerabilities or affect system performance. This warrants further investigation into the interplay between environmental and systemic factors in autonomous vehicle security.
Lastly, while the current model achieves excellent results, its performance should be validated across diverse datasets representing varying geographical, operational, and attack conditions. Expanding the dataset to include novel attack types and real-world scenarios could enhance the model’s generalizability and practical utility.

5. Conclusions

This article aimed to develop an algorithm capable of measuring and predicting the impact of cyberattacks on autonomous vehicles. We first conducted a comprehensive study to identify key variables influencing impact assessment and classified attacks based on five criteria. Feature engineering techniques were then applied to refine variable selection and enhance the performance of our predictive model. Finally, we utilized a deep neural network to assess attack impact, and the results demonstrated high accuracy, as indicated by the MAE and loss function values during training and validation.
Our findings contribute significantly to autonomous vehicle cybersecurity by enabling proactive risk assessment and aiding decision-making systems in mitigating potential threats. By quantifying the impact of different attacks, our approach allows for a prioritization strategy that helps implement targeted defense mechanisms against high-risk threats.
For future research, further refinements could be made by integrating real-time data streams into the model to improve dynamic threat detection. Additionally, incorporating adversarial machine learning techniques to enhance the robustness of the predictive system against sophisticated cyberattacks is an important avenue to explore. Expanding the dataset with real-world attack scenarios and testing on diverse AV architectures will also strengthen the applicability of our approach.

Author Contributions

Conceptualization, S.F.; methodology, S.F.; software, S.F.; validation, S.F.; investigation, S.F.; resources, S.F.; writing—original draft preparation, S.F.; writing—review and editing, S.F. and T.M.; visualization, S.F. and T.M.; supervision, T.M. All authors have read and agreed to the published version of the manuscript.

Funding

This research received no external funding.

Data Availability Statement

The original contributions presented in the study are included in the article; further inquiries can be directed to the corresponding author.

Acknowledgments

Thank you to everyone who has helped with this research.

Conflicts of Interest

The authors declare no conflicts of interest.

References

  1. United Nations Department of Economic and Social Affairs. World Urbanization Prospects: The 2018 Revision; UN: New York, NY, USA, 2019. [Google Scholar] [CrossRef]
  2. Fagnant, D.J.; Kockelman, K. Preparing a nation for autonomous vehicles: Opportunities, barriers and policy recommendations. Transp. Res. Part A Policy Pract. 2015, 77, 167–181. [Google Scholar] [CrossRef]
  3. Dingus, T.A.; Guo, F.; Lee, S.; Antin, J.F.; Perez, M.; Buchanan-King, M.; Hankey, J. Driver crash risk factors and prevalence evaluation using naturalistic driving data. Proc. Natl. Acad. Sci. USA 2016, 113, 2636–2641. [Google Scholar] [CrossRef] [PubMed]
  4. Fu, X.; Meng, H.; Wang, X.; Yang, H.; Wang, J. A hybrid neural network for driving behavior risk prediction based on distracted driving behavior data. PLoS ONE 2022, 17, e0263030. [Google Scholar] [CrossRef] [PubMed]
  5. Petit, J.; Shladover, S.E. Potential Cyberattacks on Automated Vehicles. IEEE Trans. Intell. Transport. Syst. 2014, 16, 546–556. [Google Scholar] [CrossRef]
  6. Malik, S.; Sun, W. Analysis and Simulation of Cyber Attacks Against Connected and Autonomous Vehicles. In Proceedings of the 2020 International Conference on Connected and Autonomous Driving (MetroCAD), Detroit, MI, USA, 27–28 February 2020; pp. 62–70. [Google Scholar] [CrossRef]
  7. Chellapandi, V.P.; Yuan, L.; Brinton, C.G.; Zak, S.H.; Wang, Z. Federated Learning for Connected and Automated Vehicles: A Survey of Existing Approaches and Challenges. arXiv 2023. [Google Scholar] [CrossRef]
  8. Seetharaman, A.; Patwa, N.; Jadhav, V.; Saravanan, A.S.; Sangeeth, D. Impact of Factors Influencing Cyber Threats on Autonomous Vehicles. Appl. Artif. Intell. 2021, 35, 105–132. [Google Scholar] [CrossRef]
  9. Parkinson, S.; Ward, P.; Wilson, K.; Miller, J. Cyber Threats Facing Autonomous and Connected Vehicles: Future Challenges. IEEE Trans. Intell. Transport. Syst. 2017, 18, 2898–2915. [Google Scholar] [CrossRef]
  10. Thing, V.L.L.; Wu, J. Autonomous Vehicle Security: A Taxonomy of Attacks and Defences. In Proceedings of the 2016 IEEE International Conference on Internet of Things (iThings) and IEEE Green Computing and Communications (GreenCom) and IEEE Cyber, Physical and Social Computing (CPSCom) and IEEE Smart Data (SmartData), Chengdu, China, 15–18 December 2016; pp. 164–170. [Google Scholar] [CrossRef]
  11. Li, Z.; Li, S.; Zhang, H. Overview of Sensing Attacks on Autonomous Vehicle Technologies and Impact on Traffic Flow. arXiv 2024, arXiv:2401.15193. [Google Scholar]
  12. Yan, C. Can You Trust Autonomous Vehicles: Contactless Attacks Against Sensors of Self-Driving Vehicle. 2016. Available online: https://av.tib.eu/media/36252 (accessed on 14 January 2025).
  13. Giannaros, A.; Karras, A.; Theodorakopoulos, L.; Karras, C.; Kranias, P.; Schizas, N.; Kalogeratos, G.; Tsolis, D. Autonomous Vehicles: Sophisticated Attacks, Safety Issues, Challenges, Open Topics, Blockchain, and Future Directions. J. Cybersecur. Priv. 2023, 3, 493–543. [Google Scholar] [CrossRef]
  14. Gasimova, A.; Khoei, T.T.; Kaabouch, N. A Comparative Analysis of the Ensemble Models for Detecting GPS Spoofing attacks on UAVs. In Proceedings of the 2022 IEEE 12th Annual Computing and Communication Workshop and Conference (CCWC), Las Vegas, NV, USA, 26–29 January 2022; pp. 310–315. [Google Scholar] [CrossRef]
  15. Tzoannos, Z.-R.; Kosmanos, D.; Xenakis, A.; Chaikalis, C. The Impact of Spoofing Attacks in Connected Autonomous Vehicles under Traffic Congestion Conditions. Telecom 2024, 5, 747–759. [Google Scholar] [CrossRef]
  16. Lothes, R.N.; Szymanski, M.B.; Wiley, R.G. Radar Vulnerability to Jamming; The Artech House Radar Library; Artech House: Boston, MA, USA, 1990; ISBN 978-0-89006-388-0. [Google Scholar]
  17. Pham, M.; Xiong, K. A Survey on Security Attacks and Defense Techniques for Connected and Autonomous Vehicles. arXiv 2020, arXiv:2007.08041. [Google Scholar] [CrossRef]
  18. Roome, S.J. Digital radio frequency memory. Electron. Commun. Eng. J. 1990, 2, 147. [Google Scholar] [CrossRef]
  19. Harris, M. Researcher Hacks Self-driving Car Sensors. IEEE Spectrum 2015, 9. Available online: http://spectrum.ieee.org/cars-that-think/transportation/self-driving/researcher-hacks-selfdriving-car-sensors (accessed on 14 January 2025).
  20. Stottelaar, B.G.B. Practical Cyber-Attacks on Autonomous Vehicles. Master’s Thesis, University of Twente, Enschede, The Netherlands, 2015. [Google Scholar]
  21. Rouf, I.; Miller, R.; Mustafa, H.; Taylor, T.; Oh, S.; Xu, W.; Gruteser, M.; Trappe, W.; Seskar, I. Security and Privacy Vulnerabilities of In-Car Wireless Networks: A Tire Pressure Monitoring System Case Study. p. 17. Available online: https://www.usenix.org/legacy/events/sec10/tech/full_papers/Rouf.pdf (accessed on 14 January 2025).
  22. El-Rewini, Z.; Sadatsharan, K.; Sugunaraj, N.; Selvaraj, D.F.; Plathottam, S.J.; Ranganathan, P. Cybersecurity Attacks in Vehicular Sensors. IEEE Sensors J. 2020, 20, 13752–13767. [Google Scholar] [CrossRef]
  23. Chowdhury, M.A.; Apon, A.; Dey, K. (Eds.) Data Analytics for Intelligent Transportation Systems; Elsevier: Amsterdam, The Netherlands, 2017; ISBN 978-0-12-809851-6. [Google Scholar]
  24. Kumar, A.D.; Chebrolu, K.N.R. A Brief Survey on Autonomous Vehicle Possible Attacks, Exploits and Vulnerabilities. arXiv 2018. [Google Scholar] [CrossRef]
  25. El-Rewini, Z.; Sadatsharan, K.; Selvaraj, D.F.; Plathottam, S.J.; Ranganathan, P. Cybersecurity challenges in vehicular communications. Veh. Commun. 2020, 23, 100214. [Google Scholar] [CrossRef]
  26. Hoppe, T.; Dittman, J. Sniffing/replay attacks on can buses: A simulated attack on the electric window lift classified using an adapted cert taxonomy. In Proceedings of the 2nd Workshop on Embedded Systems Security (WESS), Salzburg, Austria, 4 October 2007; pp. 66–72. [Google Scholar]
  27. Koscher, K.; Czeskis, A.; Roesner, F.; Patel, S.; Kohno, T.; Checkoway, S.; McCoy, D.; Kantor, B.; Anderson, D.; Shacham, H.; et al. Experimental Security Analysis of a Modern Automobile. In Proceedings of the 2010 IEEE Symposium on Security and Privacy, Oakland, CA, USA, 16–19 May 2010; pp. 447–462. [Google Scholar] [CrossRef]
  28. Liu, J.; Zhang, S.; Sun, W.; Shi, Y. In-Vehicle Network Attacks and Countermeasures: Challenges and Future Directions. IEEE Netw. 2017, 31, 50–58. [Google Scholar] [CrossRef]
  29. do Nascimento, R.M.; Oening, A.P.; Marcilio, D.C.; Aoki, A.R.; de Paula Rocha, E.; Schiochet, J.M. Outliers’ detection and filling algorithms for smart metering centers. In Proceedings of the PES T&D 2012, Orlando, FL, USA, 7–10 May 2012; pp. 1–6. [Google Scholar] [CrossRef]
  30. Rao, R.; Akella, S.; Guley, G. Power line carrier (PLC) signal analysis of smart meters for outlier detection. In Proceedings of the 2011 IEEE International Conference on Smart Grid Communications (SmartGridComm), Brussels, Belgium, 17–20 October 2011; pp. 291–296. [Google Scholar] [CrossRef]
  31. Begum, M.; Raja, G.; Guizani, M. AI-Based Sensor Attack Detection and Classification for Autonomous Vehicles in 6G-V2X Environment. IEEE Trans. Veh. Technol. 2024, 73, 5054–5063. [Google Scholar] [CrossRef]
Figure 1. The proposed process.
Wevj 16 00388 g001
Figure 2. The score of features after application of GINI importance.
Wevj 16 00388 g002
Figure 3. Correlation matrix.
Wevj 16 00388 g003
Figure 4. Test and training model MAE.
Wevj 16 00388 g004
Figure 5. The loss function of the model.
Wevj 16 00388 g005
Figure 6. Value of Spearman’s rank correlation.
Wevj 16 00388 g006
Table 1. Taxonomy of attacks on an autonomous vehicle based on five criteria.
InterfaceAttackCapability of AttackersPhysical/Remote AccessDamages
CameraBlind the camera [5,9,10,11].HighRemoteThe vehicle cannot detect obstacles
GPSSpoofing, Jamming [9,10,12,13,14].HighRemoteWrong positioning;disable vehicle’s navigation mechanism;redirect vehicles [15]
RadarJamming, Ghost vehicle [11,12,16,17,18].HighRemoteTurn off radar/degrade mode;
false detection
LiDARSpoofing, Jamming [5,9,10]HighRemoteForce the vehicle to stop [19,20]
TPMSTPMS-based attack [5,9,10,21,22]MediumRemoteIncorrect information
ECUCarShark, Fuzzing, Reverse engineering [23]HighPhysicalDepending on the malware’s capability, control the vehicle
OBUCode Modification, Code Injection, Packet Sniffing, Packet Fuzzing [10]HighPhysicalControl the vehicle;inject code to the ECU;modification of code [24]
CANReplayattack, DOS, Eavesdroppingattack,
Injection attack [25,26,27,28]
High
Low
(for eavesdropping attack)
Physical andRemoteControl ECU
V2V/V2IBlackhole, Sybil attack, DDOS [23,29,30]MediumRemoteRedirect traffic;flood the network;track vehicles;falsify information
V2X [7]Inject malware [23,31]MediumRemoteControl vehicle;depends on the malware’s capability
In-vehicle devices Inject malware [24]MediumPhysical and RemoteDepends on the malware’s capability
Table 2. Obstacle and degree of importance of each obstacle.
ObstacleDegree of Importance
PedestrianVery High
TreeMedium
BuildingMedium
RSUHigh
Vehicle Very high
Table 3. Hyperparameters for training our model.
Learning RateBatch SizeEpochsOptimizer
0.0013250Adam with L2 regularization
Table 4. Work environment.
OptimizerLoss FunctionActivation FunctionMetricsTensorflow Version Operating System
AdaptiveMomentEstimationMAEand ReLU functionMAE2.4.1Windows 11
Disclaimer/Publisher’s Note: The statements, opinions and data contained in all publications are solely those of the individual author(s) and contributor(s) and not of MDPI and/or the editor(s). MDPI and/or the editor(s) disclaim responsibility for any injury to people or property resulting from any ideas, methods, instructions or products referred to in the content.

