Abstract
In light of increasing environmental issues, green and environmentally friendly growth has emerged as a global consensus., making the progression of a low-carbon and eco-friendly new energy vehicle (NEV) industry essential for countries globally. This study focuses on the 26 provinces of China, employing benchmark regression, mediation analysis, spatial econometrics, and difference-in-differences models to comprehensively investigate the impact and underlying mechanisms of NEV industry agglomeration on high-quality green development, using a unified framework to measure both agglomeration and development standards, which enhances the accuracy of previous measurements using a single indicator. The findings show that NEV industry agglomeration directly promotes high-quality green development, mediated significantly by green technological innovation and public environmental awareness. Analysis reveals significant regional heterogeneity, with stronger NEV industry agglomeration in midwestern regions, areas prioritizing sustainable and low-carbon policies, and regions with advanced economic and financial systems, leading to a greater positive impact on high-quality green development. NEV industry agglomeration influences high-quality green development in neighboring regions through spatial spillover effects. The results remain robust when using instrumental variables and treating NEV-related policy formulation as a quasi-natural experiment. This study provides theoretical guidance and policy recommendations to encourage high-quality green development through NEV industry agglomeration.
1. Introduction
Global population growth and economic development increase demand for petroleum, but limited reserves cannot meet this demand [1]. Oil extraction and combustion significantly pollute the environment, exacerbating global warming and climate change. Fossil fuel consumption, including coal and oil, is increasing carbon emissions. Emissions from conventional vehicles, including carbon dioxide, nitrogen oxides, and particulate matter, degrade air quality, harming human health and ecosystems [2]. New energy vehicles (NEVs), particularly electric and hybrid models, have gained consumer interest, transforming the vehicle market. Promoting NEV development is a global strategic priority [3]. The NEV industry’s development is a strategic goal for the automotive sector and critical for China’s carbon peaking and neutrality targets, despite technological, supply chain, and societal challenges [4]. The Chinese government has designated the NEV industry as one of seven strategic emerging industries, with rapid growth driven by supportive policies.
Neoclassical growth theory emphasizes total factor productivity (TFP) as a key economic driver [5], but it often overlooks environmental costs, undermining economic development assessments. Green total factor productivity (GTFP), incorporating environmental factors, is a vital indicator for evaluating and improving economic progress [6,7]. Green development supports high-quality growth, and the NEV industry’s extensive supply chain, derived from the traditional automotive sector, relies on industrial agglomeration as a key development model. A detailed analysis is needed to assess how the NEV industry’s agglomeration model promotes high-quality green development, given its current trajectory and unique characteristics.
The NEV industry, a strategic emerging sector, supports high-quality green development through resource sustainability, environmental protection, and energy conservation. This study employs a comprehensive literature review and theoretical framework to define research objectives and methodologies. Building upon an in-depth understanding of the connotations and requirements of industrial clustering and high-quality green development within the NEV industry, the research adopts a regional perspective. Data from 26 Chinese provinces spanning 2012 to 2023 are utilized, with the degree of NEV industry agglomeration quantified through entropy weighting of three indices: location quotient, market concentration ratio, and Herfindahl–Hirschman Index, culminating in a composite score. An SBM directional distance function based on “unexpected output” is constructed and integrated with the GML index to assess the level of high-quality green development. The study further employs baseline regression and mediating effect models to examine the direct and indirect impacts of NEV industry clustering on green development quality. A binary adjacency matrix is used within an SDM framework to analyze the spatial spillover effects of industry clustering. Additionally, a difference-in-differences (DID) approach is applied to evaluate policy shocks related to the NEV industry.
The study is organized as follows. Section 2 reviews the literature, critically evaluating research on the NEV industry, industrial agglomeration, and high-quality green development. It identifies research gaps and highlights the study’s potential contributions. Section 3 outlines the theoretical framework and formulates hypotheses based on current conditions and established theories. Section 4 describes variable measurements, data sources, and econometric methodologies, including mediation and spatial models. Section 5 presents empirical findings, analyses the role of NEV policies, and includes robustness checks. Section 6 confirms the presence of spatial spillover effects. Section 7 discusses the contributions and limitations of this study. Section 8 summarizes the conclusions and suggests corresponding responses.
2. Literature Review
2.1. Investigate Trends in the Agglomeration of the New Energy Vehicle Industry
In 1997, Dargay et al. analyzed the potential trajectory of the NEV industry, evaluating vehicle ownership, gross national product, and population demographics [8]. The growing NEV industry has driven economic growth and delivered significant societal and environmental benefits. Globally, NEVs are critical for addressing energy and environmental challenges, promoting sustainable development in the automotive sector [9]. Their advancement supports energy conservation, emissions reduction, and environmental quality while driving automotive industry reforms. NEVs also enhance product quality and consumer satisfaction through increased market competition [10]. The latest research employs a Stackelberg game model between battery manufacturers and retailers to demonstrate that recycling subsidies increase end-of-life battery recovery rates by 25%, although tiered reuse may diminish remanufacturing profits for manufacturers; a hybrid subsidy strategy optimizes supply chain profitability [11]. China’s NEV industry has grown rapidly, driven by policies [12], fostering economic growth and environmental benefits through policy incentives, technological innovation, financial support, and market mechanisms. These benefits are evident in reduced emissions, a shift to a carbon-efficient economy, and the adoption of circular economy principles. The environmental impact of the NEV industry depends on industrial advancement, technological progress, and policy support. Future strategies should focus on long-term policy planning, refined market mechanisms, increased financial support, and technological innovation. Improved infrastructure, robust environmental governance, greater public environmental awareness, and consideration of regional heterogeneity are essential for sustainable, high-quality industrial development [13,14]. Industrial agglomeration is a key driver of regional economic growth and innovation. Recent research has focused on industrial agglomeration’s effects on environmental pollution, green development, innovation capabilities, and regional variations in sustainable corporate innovation. Industrial agglomeration positively affects green total factor productivity (GTFP), with innovation clustering and institutional differences as positive moderators. The NEV industry, a high-tech emerging sector, shows a strong link between innovation, developmental efficiency, and spatial agglomeration [15]. Industrial agglomeration significantly enhances Green Total Factor Productivity (GTFP) by alleviating mismatches in capital and energy inputs; however, it does not improve GTFP through the resolution of labor market mismatches [16]. Industrial agglomeration’s effects on environmental outcomes and innovation vary significantly across urban scales, regions, and industries [17].
The NEV industry, a strategic emerging sector, is defined by industrial agglomeration. Spatial concentration of NEV firms positively impacts regional pollution reduction and environmental efficiency, especially in eastern regions [18]. Enhanced industrial agglomeration supports coordinated pollution and carbon emissions reduction. These effects are driven by green technological innovation and improved industrial upgrading [19]. Industrial agglomeration in the NEV sector drives green innovation, environmental governance, and industrial upgrading. Research shows that moderate industrial agglomeration significantly boosts innovation, green innovation efficiency, and regional environmental performance in the NEV industry. Excessive agglomeration or resource misallocation can lead to negative outcomes [20]. Industrial agglomeration is commonly measured using the location quotient (LQ), Duranton–Overman (DO), and Ellison–Glaeser (EG) indices [21,22].
Current research on industrial clustering predominantly focuses on manufacturing sectors and high-tech industries, with relatively limited attention to the clustering dynamics within the NEV industry. Given that the NEV industry embodies characteristics of both manufacturing and high-technology sectors, clustering constitutes its primary spatial organization and developmental trajectory. However, existing studies frequently employ unidimensional metrics to quantify clustering levels, which undermines the accuracy and validity of the measurement outcomes. Regarding economic impacts, there is no consensus on the economic benefits derived from industry clustering; this inconsistency may stem from variations in research samples, methodologies, and the differential influence of positive and negative externalities associated with clustering across different contexts, leading to divergent findings.
2.2. Research Trends on High-Quality Green Development
High-quality green development refers to a process of economic development that pays more attention to the economical use of resources, the protection of the environment and sustainability, and is a new type of development model that takes environmental protection as its core and realizes the coordinated development of the economy, society, and the environment. High-quality green development that strikes a balance between environmental sustainability and economic growth has gained global attention. Current research on high-quality green development focuses on related concepts, including sustainable development, economic growth quality, green economy, and green growth. Pearce (1989) introduced the “green economy” concept in Blueprint for a Green Economy, promoting economic development within ecological limits [23]. Deakin and Reid (2014) emphasized that environmental capacity and sustainability are key criteria for assessing economic growth quality [24]. They also recommended using environmental assessment techniques to measure urban sustainability. Yang et al. (2015) used the CCR Malmquist index to evaluate green development efficiency across Chinese provinces and cities, assessing the impact of environmental legislation on regional sustainability [25]. Cao et al. (2021) developed an index to evaluate economic growth quality. Their analysis explored how technological breakthroughs affect the scale and quality of economic growth, demonstrating a significant positive impact [26].
High-quality green development, aligning economic growth with environmental sustainability, is a priority for many countries and a key driver of economic and social transformation. This approach emphasizes the coordinated advancement of economic growth and ecological preservation. This study shows that the internet-based economy promotes high-quality green development through industrial restructuring and green technological advancements [27]. Technological innovation is a key driver of high-quality green development. In high-tech sectors, technological innovation and green development are critical for optimizing industrial structures and supporting green transitions [28]. Many studies use total factor productivity (TFP) to measure economic progress. The Solow–Romer model neither captures tacit knowledge nor picks up the endogenization of technology in capital and labor appropriately, while green total factor productivity (GTFP), incorporating resource and environmental factors, aligns with sustainable growth principles [29,30]. Recent studies have used global Malmquist–Luenberger (GML) and super slack-based measure (SBM) models to assess GTFP [31], exploring its links to industrial structure, environmental regulations, and market distortions [32,33,34]. Most researchers consider technological advancement and innovation as critical drivers of sustainable growth [35].
Unfortunately, most of the previous literature analyses the direct linkage with green development at the level of the economic system such as the digital economy and the low-carbon economy, and there is a relative lack of studies linking high-quality green development from the perspective of the new energy vehicle industry. Moreover, most studies focus on the overall effect and ignore the heterogeneity and spatial spillover effects between provinces or regions, which may lead to research bias in the estimation results.
3. Theoretical Structure and Hypotheses
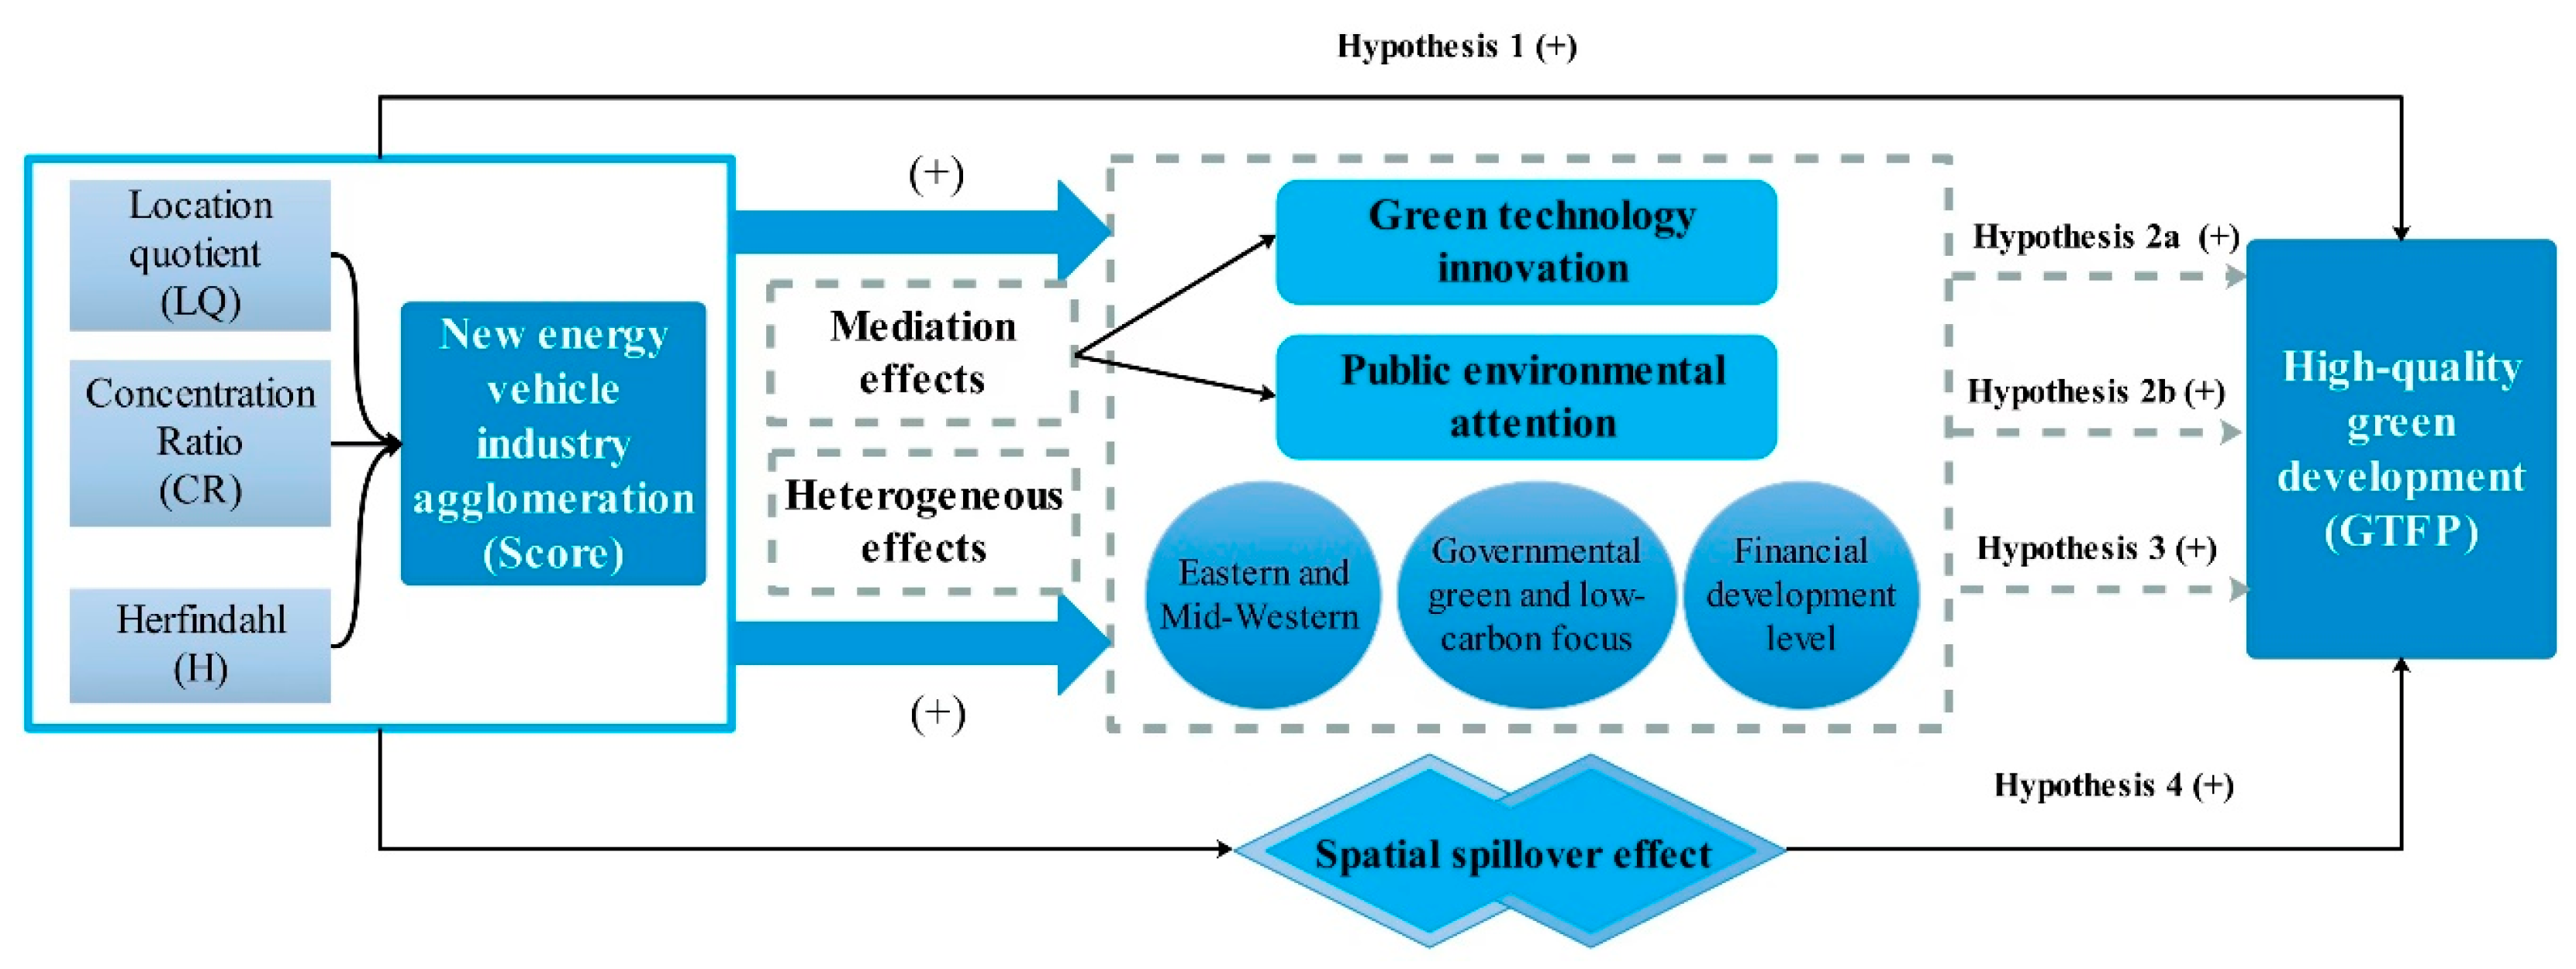
This study elucidates the influence mechanism of the agglomeration of the NEV sector on high-quality green development (refer to Figure 1).
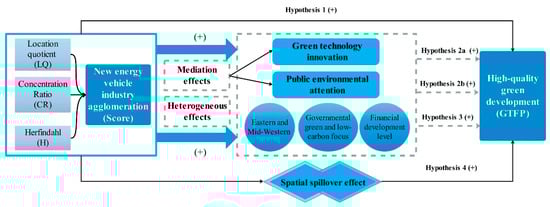
Figure 1.
Conceptual framework of NEV industry agglomeration for high-quality green development.
3.1. Direct and Indirect Impacts of New Energy Vehicle Industry Agglomeration on High-Quality Green Development
As China pursues high-quality economic growth driven by innovation, sustainability has become a cornerstone of progress. There is growing emphasis on developing eco-friendly industries and enhancing regional sustainable innovation, essential for long-term economic prosperity [36]. Expanding the NEV industry, characterized by low-carbon attributes, is a key strategy for improving environmental efficiency [18]. Green development increasingly incorporates hybrid electric and alternative fuel vehicles, reducing reliance on internal combustion engine vehicles [37]. Energy consumption and CO2 emissions data from China’s top 20 best-selling plug-in hybrid electric vehicles (PHEVs) across regions offer key insights for carbon reduction strategies [38]. Industrial agglomeration can promote green development by fostering technological innovation, strengthening environmental governance, and optimizing industrial structures. As an economy matures, resource reliance decreases, and industrial concentration increases, enhancing the role of agglomeration in sustainable development [39]. Therefore, we argue the following:
Hypothesis 1.
New energy vehicle industry agglomeration directly promotes high-quality green development.
This study examines how NEV industry agglomeration impacts high-quality green development, mediated by public environmental awareness and green technological innovation. The NEV industry, a key emerging sector in China, addresses energy shortages and fosters green technological innovation. The tension between environmental pollution and economic development challenges sustainable development. Green technological innovation, integrating environmental protection and technological advancement, is essential for addressing this issue. Green technological innovation, combining environmental conservation and technological progress, is critical for breaking this cycle [40]. Green technological innovation is vital for promoting ecological civilization and achieving sustainable development goals [41]. Green technological innovation significantly enhances China’s NEV industry, with renewable energy development and green innovation as key strategies for reducing environmental pollution and achieving sustainable economic transformation. A significant connection likely exists between these strategies, warranting further exploration [42]. NEV industry agglomeration concentrates resources and fosters collaboration, driving breakthroughs in key technologies and independent development of core components. Technological innovation in the NEV industry improves resource efficiency, reduces environmental degradation, and promotes sustainable development regionally [43], Correspondingly, we argue the following:
Hypothesis 2a.
By promoting green technology innovation more quickly, the new energy vehicle industry agglomeration indirectly supports high-quality green development.
The NEV industry agglomeration promotes information sharing and environmental awareness, increasing collective ecological engagement. Public environmental awareness supports corporate green and high-quality development by enhancing green investment efficiency [44] and fostering green innovation [45]. Sustainable development practices are increasingly vital in China’s rapidly growing economy. The NEV industry, a strategic emerging sector, advances through increased public environmental awareness. Consumer preference for eco-friendly products shifts market demand, fostering regional green and high-quality development. Hence, we propose the following:
Hypothesis 2b.
New energy vehicle industry agglomeration indirectly contributes to high-quality green development by enhancing public environmental attention.
3.2. Heterogeneous Effects of New Energy Vehicle Industry Agglomeration on High-Quality Green Development
Chinese towns exhibit significant regional variability in economic development, resource endowment, and technological advantages [46]. Locations show diverse levels of NEV industry agglomeration, which may lead to varied impacts on green development across regions. Regional heterogeneity influences how NEV industry agglomeration affects high-quality green development [27]. NEV industry agglomeration may manifest through technological dissemination, supply chain expansion, and job creation. The impact varies across regions, industries, and firms due to resource endowment, policy context, and market demand. Research shows that China’s new energy sector has significant regional disparities in industry concentration, with the western region showing the highest clustering. Green innovation efficacy follows a tiered pattern of “east, central, to west,” with midwestern regions underperforming the national average. Energy industry agglomeration is highest in the eastern region, followed by the central region, and lowest in the western region. The PVAR model indicates that regional heterogeneity, primarily in midwestern areas, reflects a cyclical relationship between economic green development and energy industry agglomeration [47]. New energy industry agglomeration and environmental efficiency are generally increasing, with notable regional heterogeneity and polarization. Government focus on green and low-carbon initiatives, combined with regional economic [48] and financial development [49], likely influences sustainable development trajectories; therefore, we propose the following:
Hypothesis 3.
The agglomeration of the new energy vehicle sector has heterogeneous effects on high-quality green development.
3.3. Agglomeration of the New Energy Vehicle Industry’s Spatial Spillover Impact on High-Quality Green Development
The NEV industry aims to promote environmentally friendly vehicles, reduce fossil fuel dependency, and lower emissions. NEV industry growth and agglomeration may drive a gradual shift to new energy vehicles in local transportation, reducing carbon and pollutant emissions and fostering a green development model. Industrial agglomeration may influence the social and cultural contexts of nearby communities [50]. The NEV sector’s emphasis on environmental sustainability can raise public awareness of sustainable development and conservation, shift consumer behavior, and promote green consumption. Renewable energy development in developing countries should consider local economic growth and its spillover effects on neighboring areas, promoting cluster development and collaborative governance [51]. Industrial agglomeration generates spatial spillover effects, promoting the low-carbon transition in the energy consumption structure of neighboring provinces [52]. NEV industry concentration in one area may influence the high-quality green growth of neighboring regions, supporting the following hypothesis:
Hypothesis 4.
Through geographical spillover effects, the agglomeration of the new energy vehicle industry has an impact on the high-quality green development of nearby regions.
3.4. Research Questions and Objectives
How can the evaluation of new energy vehicle industry clustering and high-quality green development be conducted accurately and rationally? What impact does industry clustering, driven by green technological innovation and public environmental awareness, have on high-quality green development? Do regional disparities in new energy vehicle industry clustering influence high-quality green development differently? Is there a spatial correlation in promoting high-quality green development through industry clustering? How do government policies affect the role of industry clustering in advancing high-quality green development? These constitute the primary research questions.
This study aims to contribute to the literature in the following ways. A comprehensive indicator system is developed to measure NEV industry agglomeration at the provincial level. This provides a novel perspective to the growing research field by analyzing the causal relationship between the NEV industry and high-quality green development. This study examines the mediating roles of green technological innovation, a key driver of green development, and public environmental awareness in supporting NEV industry growth and carbon neutrality goals. This approach enhances understanding of how the NEV industry influences high-quality green development. This study investigates spatial spillover effects and regional variability to assess the NEV industry’s impact on high-quality green development. The study also evaluates NEV-related policies as a quasi-natural experiment to provide insights for sustainable development in other emerging economies.
4. Data, Variables, and Techniques
4.1. Data
Due to significant data gaps or the absence of statistical analysis on new energy vehicle (NEV) industry development in provinces such as Yunnan, Hainan, Inner Mongolia Autonomous Region, Tibet Autonomous Region, and Ningxia Hui Autonomous Region, this study selects 26 provincial-level administrative regions spanning 2012 to 2023 in China as the research sample. This approach ensures data authenticity and completeness while aligning with the spatial clustering characteristics of the NEV industry. Data are primarily sourced from the CSMAR database, the China Statistical Yearbook, China Science and Technology Statistical Yearbook, China Energy Statistical Yearbook, China Environmental Statistical Yearbook, China Industrial Statistical Yearbook, and various provincial and municipal statistical compendiums, the Institute of Geographic Sciences and Natural Resources Research, Chinese Academy of Sciences. For certain missing data points, the application of moving average and interpolation techniques is employed to ensure the dataset’s integrity and scientific validity.
4.2. Variables
4.2.1. Measuring New Energy Vehicle Industry Agglomeration
In order to avoid the limitations and errors that arise from using only a single indicator for measurement, as Dargay and other initial research scholars did, this study utilizes the location quotient index, concentration ratio, and Herfindahl index as metrics to evaluate the extent of spatial agglomeration in the NEV industry. Through the linkage analysis of the three types of indicators, we can comprehensively deconstruct the spatial distribution, market structure, and competition dynamics of the new energy automobile industry agglomeration, and provide a multi-dimensional scientific basis for the formulation of industrial policy.
- Location quotient index
The location quotient index was initially introduced by P. Hagget to assess the spatial distribution of regional characteristics, indicating the level of specialization within industrial sectors. The formula of location quotient index is shown in Equation (1):
where is the location quotient of industry in region , denotes the economic indicators of industry in region , denotes the sum of the economic indicators of all industries in the region, denotes the sum of the economic indicators of the industry at the national level, and then represents the summation of economic indicators for all industries at the national level.
- Concentration ratio
The concentration ratio denotes the aggregate economic metrics of the leading n firms within a specific industry. Industry concentration was initially used to measure the concentration of the market or industry, and later gradually became one of the metrics employed to assess industrial agglomeration. The formula of industry concentration is shown in Equation (2):
where denotes the economic indicator of the enterprise with the ith largest size ranking in the industry, can be the economic indicators such as total assets, number of employees, total output value, total production, etc., denotes that the index calculation is selected to the number of enterprises, and denotes the total number of enterprises in the industry.
- Herfindahl Index
The Herfindahl index was initially used for enterprise market power, market competition, and monopoly degree of measurement, and later gradually employed to assess the extent of agglomeration within the industry. The formula of the Herfindahl index is shown in Equation (3):
where denotes the economic indicator of the firm with the ith largest size ranking in the industry, denotes the total size of the industry, and represents the weights of the market shares.
Since the three indices, namely the location quotient index, concentration ratio, and Herfindahl Index, cannot reflect the agglomeration level of the NEV industry alone, this study further utilizes the entropy method to quantify the diverse processes as outlined below:
- Data standardization
Positive indicators are
Negative indicators are
where is the value of the th unstandardized indicator for area ; and is the value of the th standardized indicator for area .
- 2.
- Calculate the share of indicator in region :
- 3.
- Find the entropy value of the th indicator. is the number of research units in the equation, and when , it follows that :
- 4.
- Determine the entropy weight for each indicator:
- 5.
- Calculate the composite index score:
We determined a final score using the entropy approach to assess the level of agglomeration in the province’s NEV industry using the location quotient index, concentration ratio, and Herfindahl index. Figure 2 displays the MATLAB-generated (R2020b) spatial visualization interpolation of the NEV industry aggregation levels in China’s provinces for 2012, 2016, 2020, and 2023.
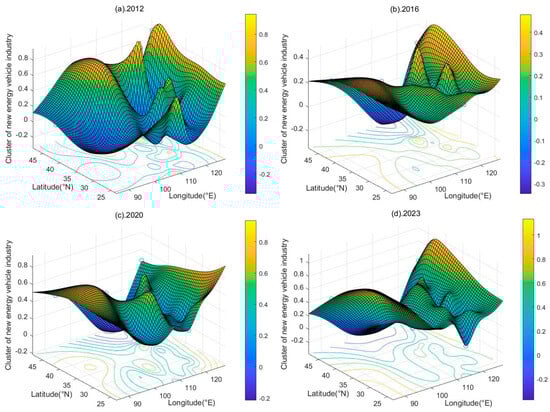
Figure 2.
Spatial interpolation maps of new energy vehicle industry agglomeration in 2012, 2016, 2020, and 2023. (a). Spatial interpolation maps of new energy vehicle industry agglomeration in 2012. (b). Spatial interpolation maps of new energy vehicle industry agglomeration in 2016. (c). Spatial interpolation maps of new energy vehicle industry agglomeration in 2020. (d). Spatial interpolation maps of new energy vehicle industry agglomeration in 2023.
Most provinces show nascent to intermediate NEV industry agglomeration over time. Spatial interpolation analysis indicates converging NEV industry agglomeration levels across provinces, with reduced spatial variability. This trend reflects increased NEV industry agglomeration in most provinces. The Chinese government’s strategic focus on NEVs, designated as a key emerging industry, drives this trend. Central government policies, such as purchase subsidies, tax exemptions, and charging infrastructure support, have driven NEV industry growth. Local governments have implemented complementary policies tailored to regional strengths. Within the “dual carbon” framework, global carbon neutrality goals have driven a consumer shift to green transportation, with NEV market penetration in China exceeding 50% in 2023, surpassing gasoline vehicles. This reflects a shift from policy-driven to demand-driven NEV market dynamics. The NEV industry uses agglomeration to share infrastructure and standardize technologies, reducing costs and improving efficiency.
4.2.2. Measuring High-Quality Green Development
This study uses GTFP and incorporates environmental elements into the framework, referencing the body of current knowledge. Employing the SBM directional distance function predicated on “unanticipated outputs” and the GML index, which is built based on previous research, GTFP is measured [53]. Methodologically, the computational process is as follows:
- Production possibilities pool.
Green total factor measurement input and output components must be incorporated into productivity’s measuring and analytical framework, and the construction of an ensemble of production possibilities that integrates input elements, desired outputs, and undesired outputs. Therefore, this study draws on [54], which treats the 26 provinces under study as independent production decision-making units (DMUs) and constructs a production frontier where factors are input during the production period inputs factors , and eventually get desired outputs and P non-desired outputs , the global production possibility set is constructed as Equation (10):
- 2.
- The directional distance function of SBM is neither radial nor angular in nature.
To exclude the possibility of slack variables that might distort the measurement results of the DEA-CCR and DEA-BCC models, this study measures GTFP using the non-radial, non-angular SBM directional distance function [55,56], which effectively overcomes the input–output slack issue by incorporating the slack variables into the original objective function. The input–output, direction, and relaxation vector of province at time is , , and . Global SBM directional distance functions are as follows in Equation (11):
- 3.
- The Global Malmquist–Luenberger Productivity Index.
The SBM framework does not incorporate the time dimension, so its measurements only reflect the static effects of efficiency. However, production activities are generally continuous, so it is also crucial for the study to observe the dynamic changes in productivity. Therefore, this study constructs a dynamic GTFP based on the SBM directional distance function for research. The dynamic GTFP is the period GML productivity index with period as the base period, and the specific formula is stated in Equation (12):
The labor input is assessed based on the personnel count in the production sector at the end of each year for every province. The aggregate energy consumption of the production sector, expressed in ten thousand tons, serves as a measure of the energy input. The anticipated output is denoted by the province’s gross domestic product. Conversely, unexpected outputs include the effluent release of industrial wastewater (ten thousand tons), industrial sulfuric acid emissions (tons), and the amount of industrial waste produced (tons).
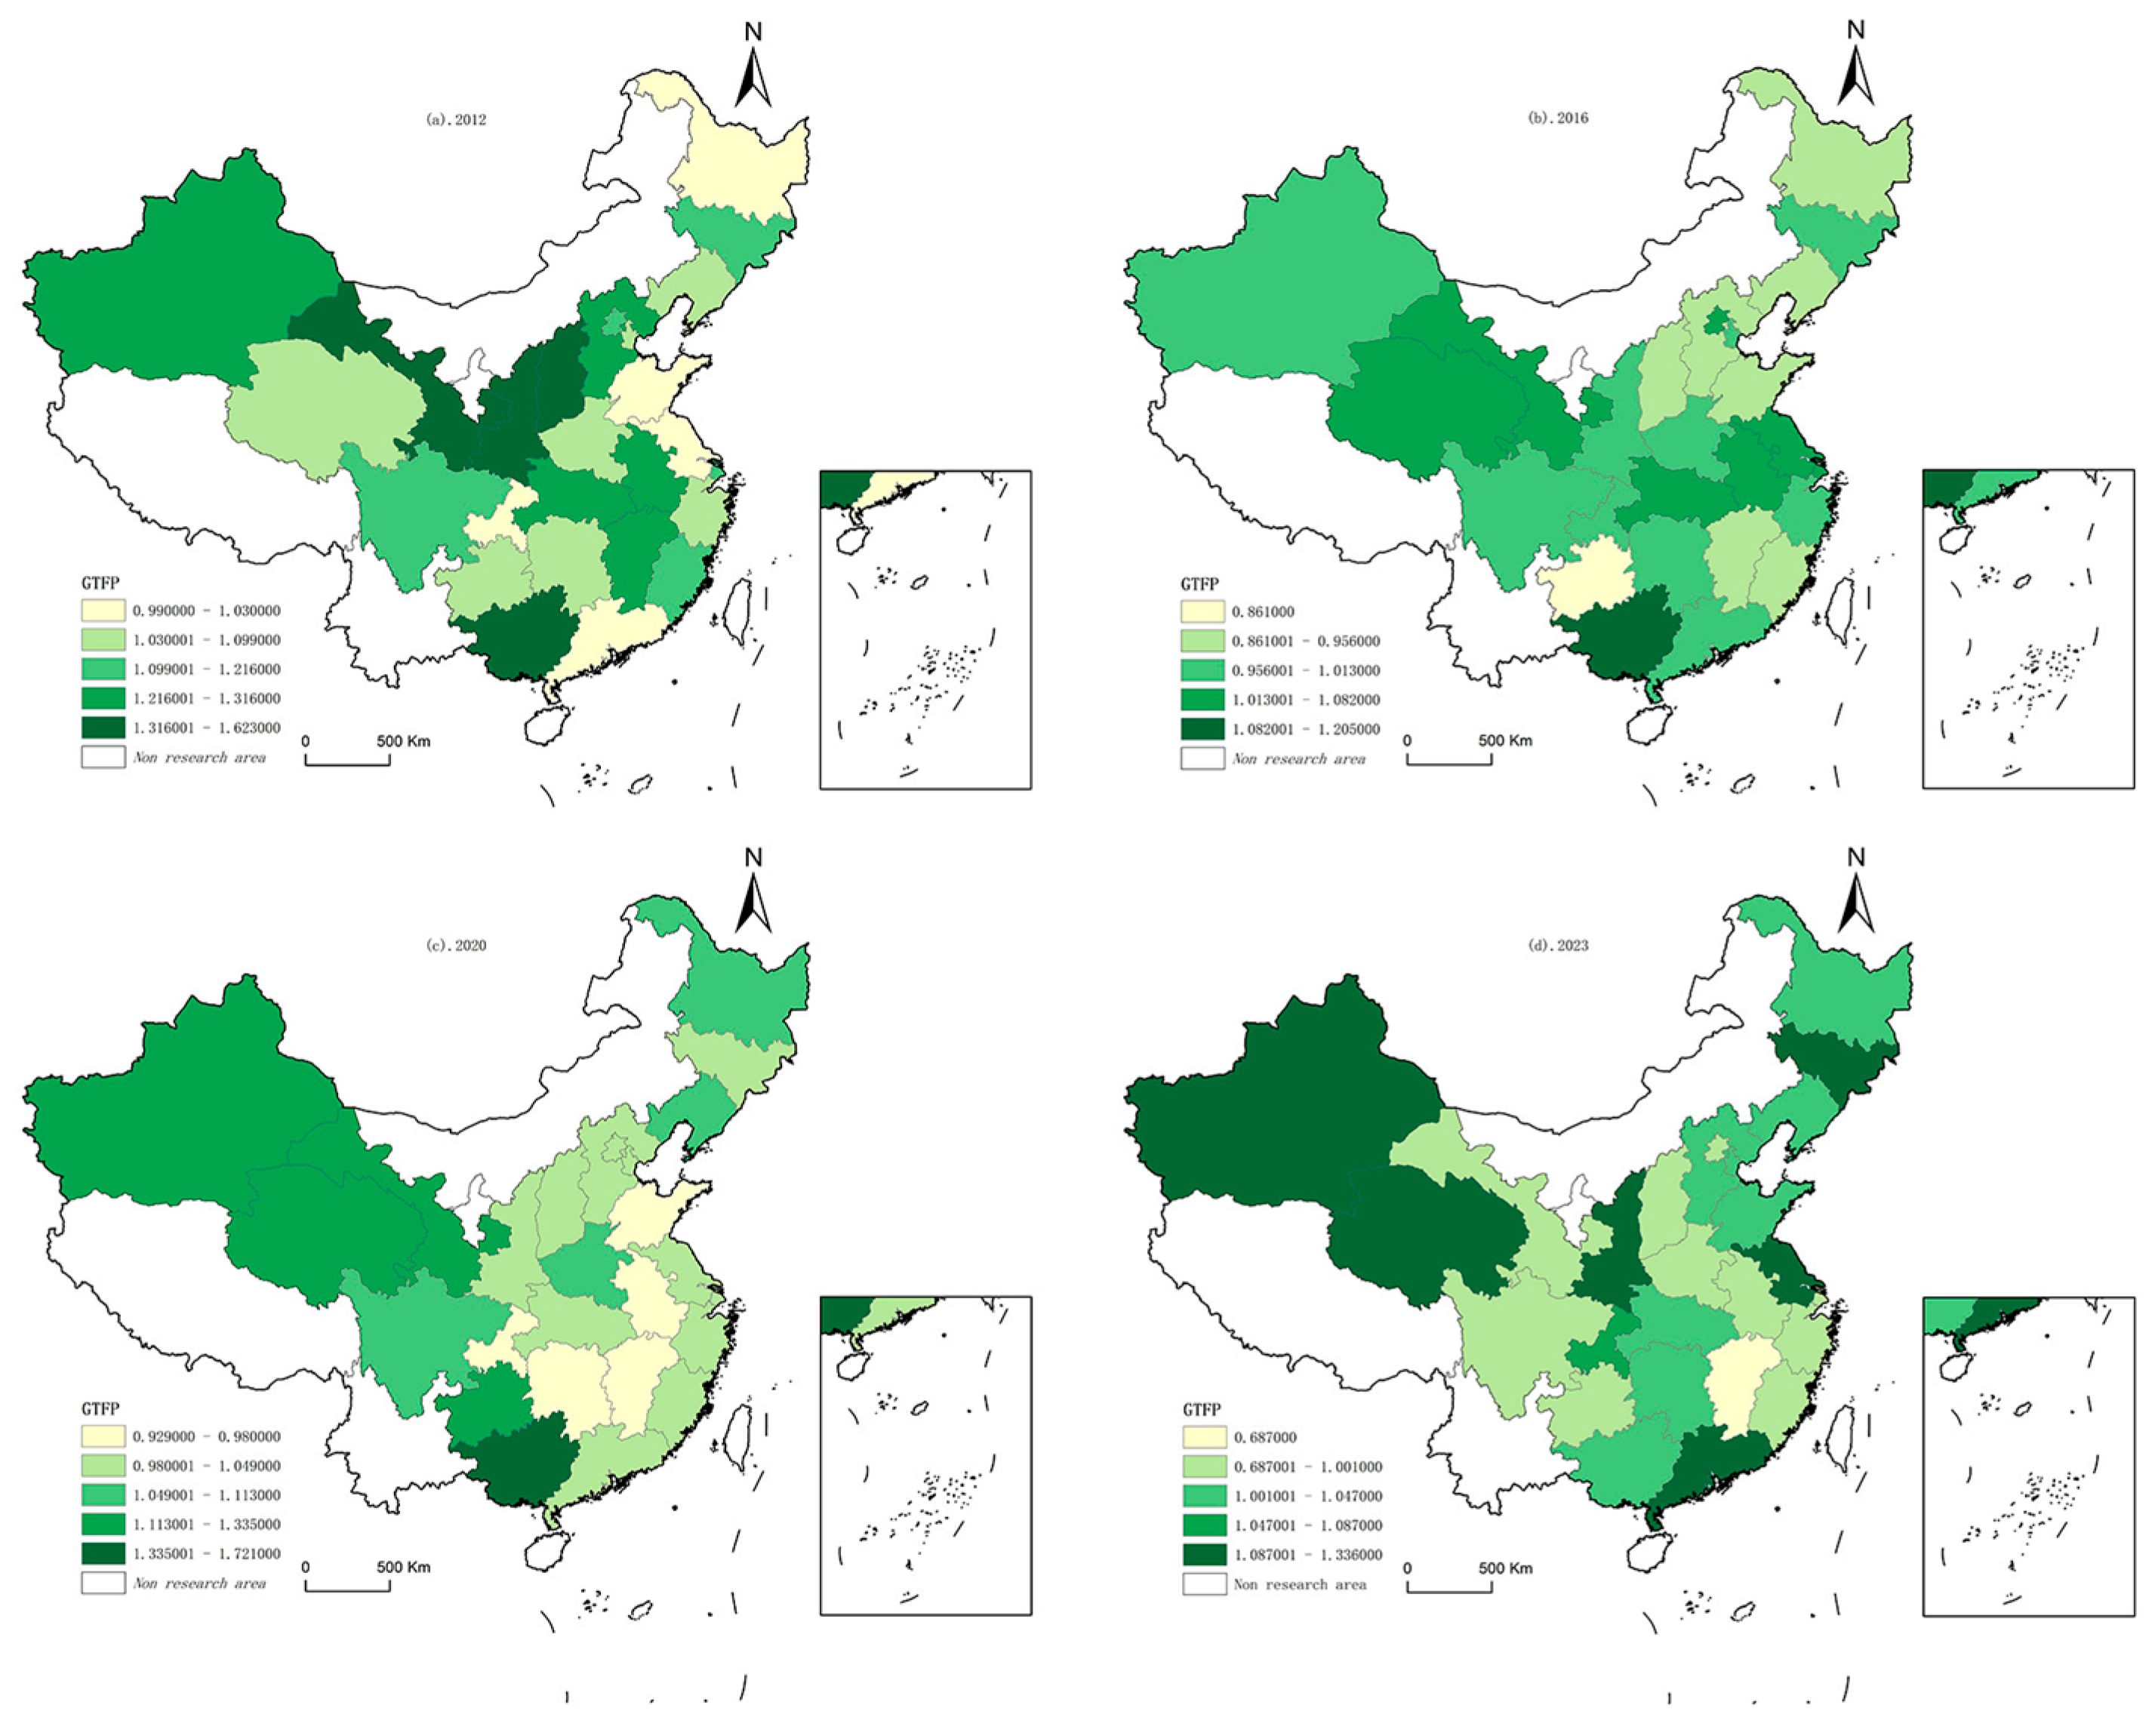
This study employs the Jenks natural breaks classification method within ArcGIS to spatially visualize the standards of high-quality green development in China for the years 2012, 2016, 2020, and 2023, as illustrated in Figure 3.
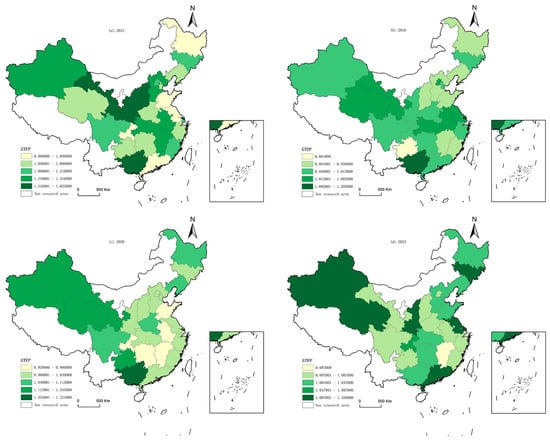
Figure 3.
Spatial-temporal distribution of high-quality green development in 2012, 2016, 2020, and 2023. (a) Spatial-temporal distribution of high-quality green development in 2012. (b) Spatial-temporal distribution of high-quality green development in 2016. (c) Spatial-temporal distribution of high-quality green development in 2020. (d) Spatial-temporal distribution of high-quality green development in 2023. Note: This map is based on the Ministry of Natural Resources of China’s standard map (Approval Number GS (2020) 4632), which has not been altered.
Among the 26 provinces studied, areas with high and medium-high levels of high-quality green development show an increasing trend. Despite rapid overall growth, significant disparities in development levels persist across provinces. This highlights the need for enhanced technological cooperation and resource sharing across regions to promote high-quality green development, overcoming administrative and geographical barriers.
4.2.3. Mediating Variables
Public environmental attention (Pea): The Theory of Planned Behavior (TPB) emphasizes that attitudes, subjective norms, and perceived behavioral control jointly drive behavioral intentions and ultimately influence actual behavior. As an explicit representation of “attitude”, public environmental concern reflects individuals’ active cognitive processing of environmental issues through search behavior, directly shaping “behavioral attitudes”. Public environmental concern is measured as the logarithm of the summed annual search indices for “environmental pollution”, “smog”, and “air quality” [57]. Green technology innovation (Gti) [58]: Green technology innovation is measured by the number of green patent applications, which accurately reflects annual innovation levels [59].
4.2.4. Control Variables
The variables of this study are shown by Table 1. The control variables are defined as follows: (1) Government intervention level (Gov): Measured as the ratio of local financial budget expenditures to GDP, reflecting its influence on economic development [60]. (2) Urbanization level (City): Measured as the urban population’s proportion of the total population, indicating regional economic advancement and coordination [61]. (3) Infrastructure development (INC): Measured as road area per capita. Infrastructure supports economic and societal progress, contributing to national security, domestic demand, and high-quality development. (4) Consumption level (COL): Measured as total retail sales. Higher consumption levels boost domestic demand, enhance market flow, optimize resource allocation, and stimulate production, improving quality of life and supporting economic growth. (5) Economic development level (gdp): Measured as the logarithm of GDP per capita, adjusted for price deflator [62]. (6) Population (pop): Measured as the logarithm of year-end population [60].

Table 1.
Descriptive statistics.
4.3. Econometric Techniques
The reference model is represented by Equation (13), where is the aggregate of the NEV industry in each province at time , and stands for high-quality green development. A group of control variables make up ; is a random disturbance term; and and stand for province and time-fixed effects, respectively.
The study also examines whether there is an indirect effect of green technology innovation and public environmental attention in the mechanism.
where is the standard of innovation in green technology and public environmental attention. The mediating effect of public environmental awareness and green technology innovation is tested by stepwise regression [63]; the following are the precise steps: firstly, the 1st equation in Equation (14) is tested, the significance of must be assessed. If is significant, subsequent tests should be conducted. Furthermore, when is significant, the parameters , , and must be examined. Complete mediation is indicated if and are significant, but is not. Partial mediation may be considered if , , and are all significant, but is significantly smaller than . The bootstrap approach should be used to check for the presence of mediation effects if neither nor is significant.
To examine the spatial spillover effect of the digital economy on high-quality green development, this study constructs a spatial Durbin model (SDM) in Equation (15), with as the spatial autoregressive coefficient and as the spatial weight matrix.
5. Results
This study employs a benchmark regression approach to construct a mediating effect model, examining the direct and indirect impacts of new energy vehicle industry clustering on high-quality green development. Heterogeneity analysis is conducted based on geographic location, government green attention, and financial development levels. Robustness of previous findings is confirmed through substitution of explanatory and explained variables, and endogeneity issues are addressed using instrumental variable techniques. Additionally, a difference-in-differences (DID) model is developed to investigate policy shocks.
5.1. Direct Effects
Table 2 provides specifics of the baseline regression results for direct impacts.
Table 2.
Direct effects.
The study confirms Hypothesis 1, demonstrating that NEV industry agglomeration significantly promotes high-quality green development, even without control variables. Furthermore, the results in Column (7) of Table 2, which include all control variables, indicate that government intervention (Gov), economic development level (gdp), and population (pop) exert positive effects on high-quality green development. Conversely, coefficients for urbanization (City), infrastructure development (INC), and consumption level (COL) are negative and fail to pass significance testing, suggesting that rapid urban expansion, accelerated infrastructure growth, and excessive consumption may generate adverse effects and constrain high-quality green development.
5.2. Mediating Effects
Table 3 reports the results of the mediation effect analysis. NEV industry agglomeration significantly promotes high-quality green development, as shown in Column (1) of Table 3. At the 1% significance level, NEV industry agglomeration has a significant effect of 0.248 on high-quality green development. In Column (2) of Table 3, the regression coefficient for NEV industry agglomeration is 1.300, significant at the 1% level, indicating its promotion of green technology innovation. In Column (3) of Table 3, the positive coefficient for green technology innovation suggests it supports high-quality green development in the regression model. Green technology innovation partially mediates the effect of NEV industry agglomeration on high-quality green development, as the coefficient decreases from 0.248 to 0.224, remaining significant at the 1% level. The mediation mechanism is as follows: NEV industry agglomeration enhances green technology innovation, which promotes high-quality green development. The indirect mediating effect is 0.0247 (1.300 × 0.019), representing 9.96% of the total effect. This indicates that 9.96% of NEV industry agglomeration’s positive effect on high-quality green development occurs through green technology innovation, supporting Hypothesis 2a and reducing environmental pressure.
Table 3.
Mediating effects.
In Column (4) of Table 3, the regression coefficient for NEV industry agglomeration is 0.139, significant at the 1% level. This indicates that NEV industry agglomeration positively affects public environmental concern at the 1% significance level. In Column (5) of Table 3, the positive coefficient for public environmental concern, after inclusion in the regression model, shows it drives high-quality green development. The coefficient for NEV industry agglomeration on high-quality green development decreases from 0.248 to 0.215, remaining significant at the 1% level, indicating partial mediation by public environmental concern. The mediation mechanism is as follows: NEV industry agglomeration enhances public environmental concern, which promotes high-quality green development. The indirect mediating effect is 0.0329 (0.139 × 0.237), representing 13.28% of the total effect. This indicates that public environmental concern mediates 13.28% of NEV industry agglomeration’s effect on high-quality green development, supporting Hypothesis 2b.
The bootstrap sampling technique assesses the strength of the mediating effects [64]. Table 4 details the bootstrap analysis results for the mediating effects.
Table 4.
Results of bootstrapping mediation regression analysis.
The confidence intervals for all indirect mediating effects exclude zero, confirming their significance. This suggests that NEV industry agglomeration promotes high-quality green development by fostering green technology innovation and enhancing public environmental concern.
5.3. Heterogeneous Effects
This study examines the effects of regional heterogeneity. The sample is stratified by three characteristics: geographical location, governmental green focus, and financial development. Provinces are classified into eastern and midwestern regions of China. Governmental green and low-carbon focus is measured by the frequency of keywords (“green,” “environmental protection,” “low-carbon,” “environment,” “protection”) in provincial government work reports. Provinces with keyword frequencies above the median are classified as high green and low-carbon focus areas, while those below are low-focus areas. Financial development is measured by the ratio of financial institution loans and deposits to GDP. Provinces above the median ratio are classified as high financial development areas, while those below are low financial development areas.
Table 5 presents the results of the heterogeneity analysis. midwestern provinces with strong green and low-carbon focus and high financial development show a significant positive effect of NEV industry agglomeration on green development. In contrast, other provinces show negligible effects, supporting Hypothesis 3. The NEV industry is primarily concentrated in midwestern provinces with strong sustainability and low-carbon focus and advanced financial development, promoting high-quality green development. This effect is likely due to these provinces’ extensive geographical areas, robust government support, preferential policies, and efficient industrial chains. Consequently, the NEV industry leverages these advantages for efficient agglomeration, reducing manufacturing costs and expanding the consumer market through economic growth. Conversely, eastern provinces, areas with low green and low-carbon focus, and provinces with low financial development show reduced NEV agglomeration and negligible green development effects compared to advanced provinces. Therefore, coordinated and balanced development across provinces must be prioritized.
Table 5.
Heterogeneous analysis.
5.4. DID: Exogenous Policy Shocks
Policy support, closely linked to NEV industry growth, may enhance high-quality green development. This study evaluates the “Made in China 2025” pilot policies to determine if the NEV industry promotes high-quality green development. A primary goal of “Made in China 2025” is to promote green development and a circular economy, with the NEV industry as a key focus. “Made in China 2025” pilot city clusters provide innovative conditions for NEV industry agglomeration, enabling a quasi-natural experiment.
In 2016, the Chinese government launched pilot initiatives. We employ a difference-in-differences (DID) analytical framework to evaluate the impact of the “Made in China 2025” pilot policy on high-quality green development. The model specification follows Jiang et al. (2021), with the following steps: firstly, provinces designated as pilot regions in 2016 are assigned a value of 1; otherwise, the value is 0 [65]. Secondly, regions identified as pilot areas from 2016 onward are coded as 1, while those prior to 2016 are coded as 0. To ensure robustness, propensity score matching difference-in-differences (PSM-DID) is also utilized. Equation (16) defines the DID model, with representing the “Made in China 2025” pilot program. Other variables conform to the previously described model specifications.
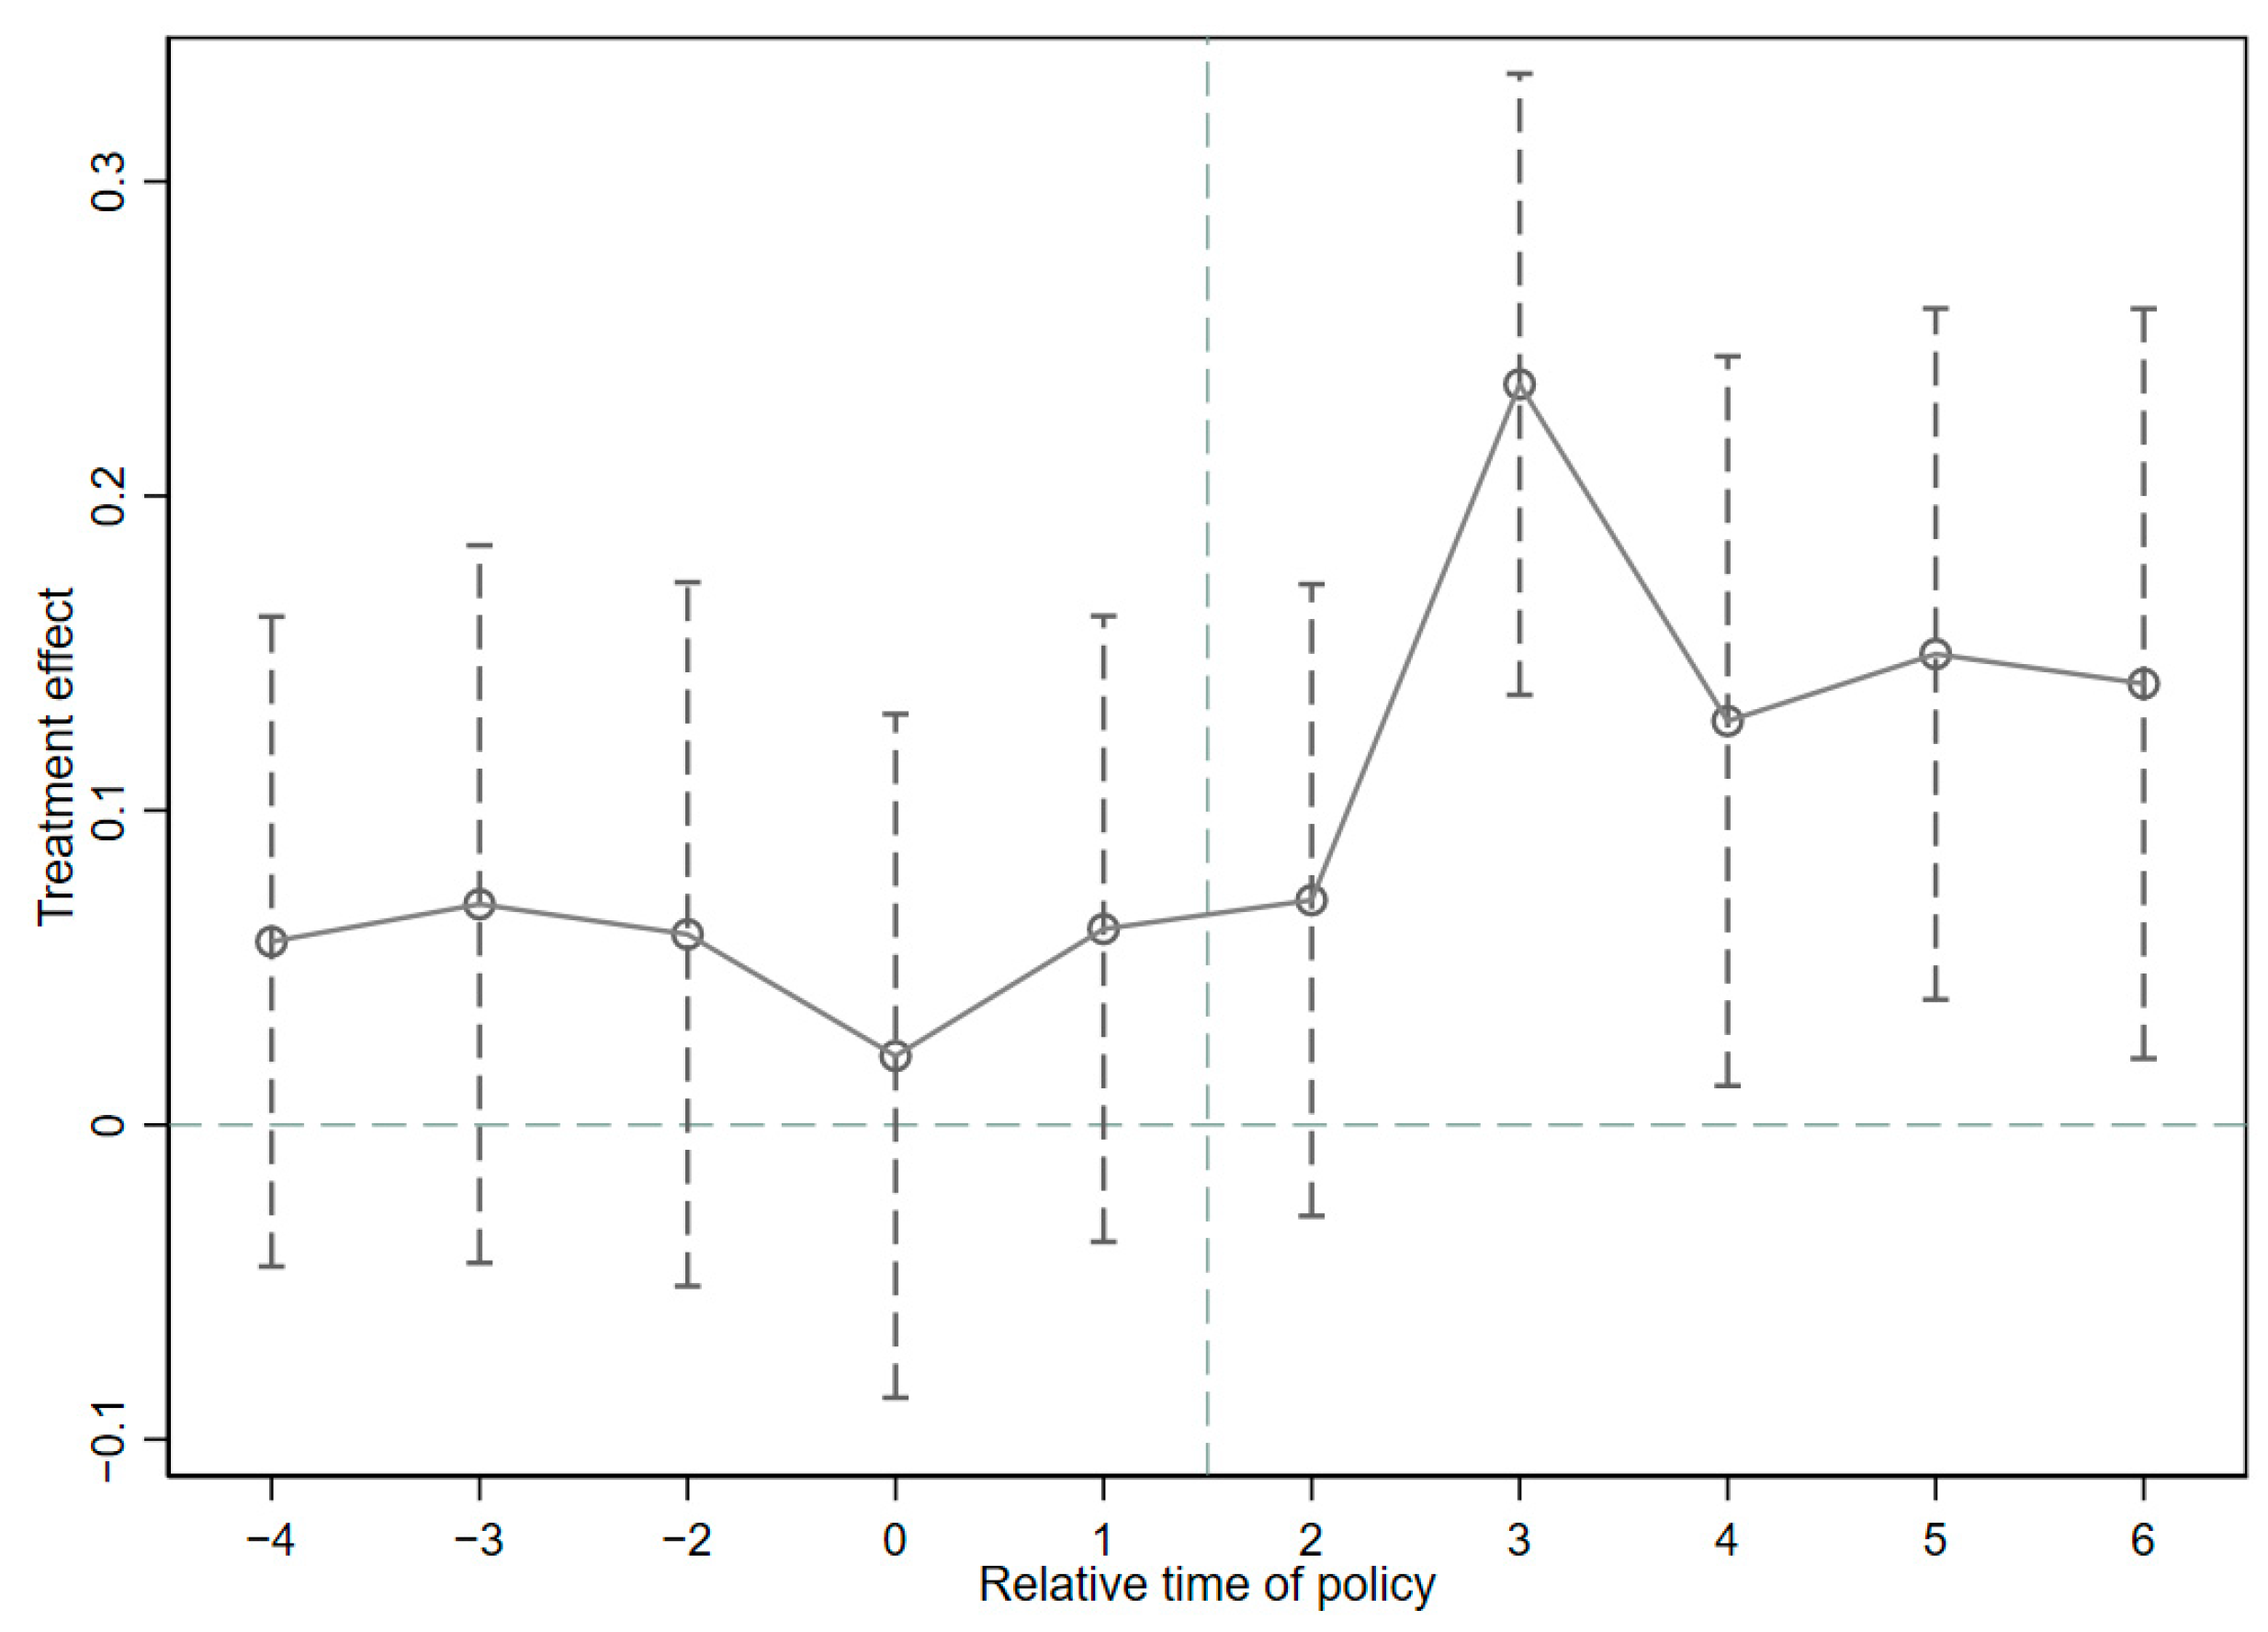
We first assess the validity of the parallel trends assumption, with the findings illustrated in Figure 4 confirming its adherence.
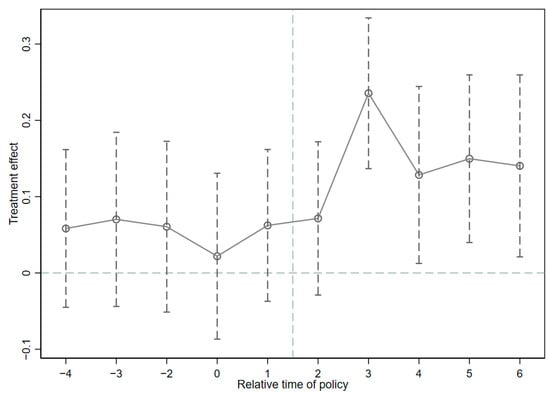
Figure 4.
Parallel trend test.
Table 6 results show that the “Made in China 2025” pilot strategy significantly promotes high-quality green development, with a coefficient of 0.106 at the 1% significance level. This finding confirms that the “Made in China 2025” pilot strategy significantly enhances high-quality green development. The PSM-DID results show that the policy coefficients are also significantly positive, addressing the issue of selection bias.
Table 6.
The effects of policy on high-quality green development.
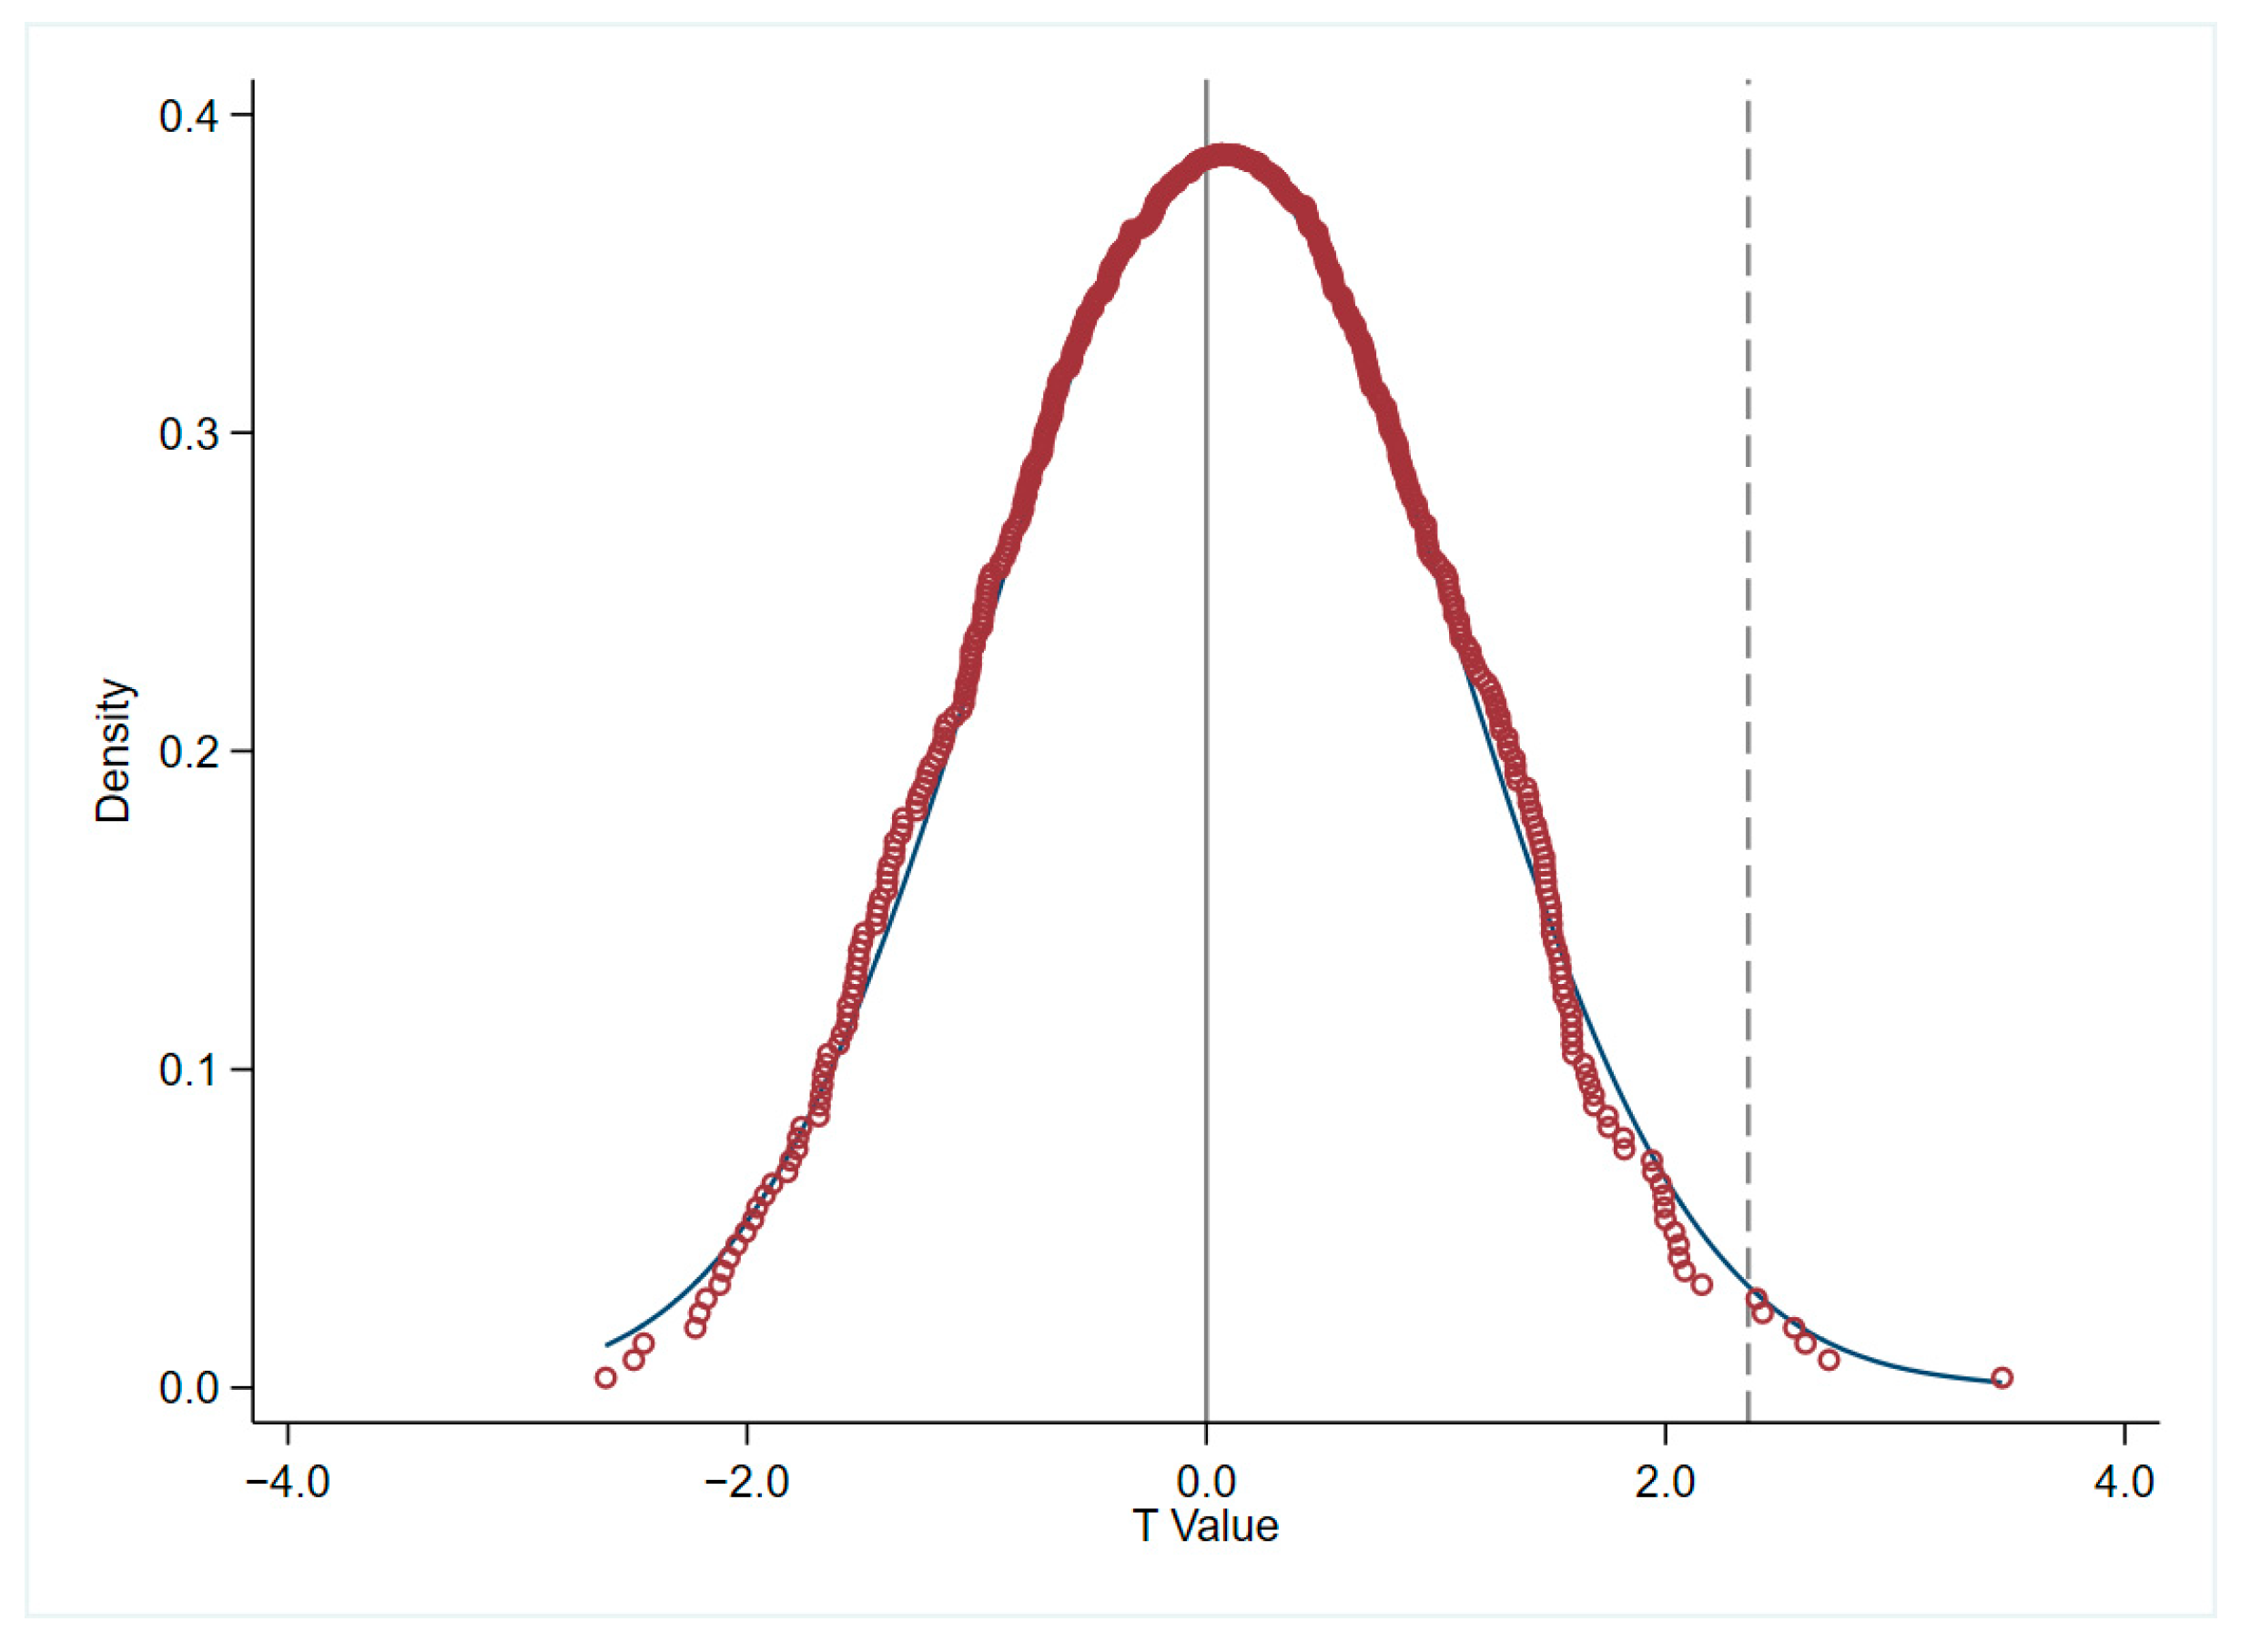
Furthermore, to address potential biases from unobserved factors, a placebo test is conducted using a randomized experiment. Specifically, the policy shock time is randomly assigned, and the experiment is repeated 500 times. The resulting estimated coefficients are then plotted as a density distribution. If the coefficient estimates are normally distributed around zero, it can be concluded that unobserved factors do not significantly influence the empirical results of this study. The robustness of the empirical data is illustrated by the density distribution of the estimated coefficients created using the placebo test, as shown in Figure 5. There is little evidence of unobserved variables influencing the outcomes since the mean of the placebo-estimated coefficients, which are generated from the random treatment, is close to zero. In light of the agglomeration of the NEV sector and its support of high-quality green development, this confirms the durability of the research findings, even when taking exogenous policy shocks into account.
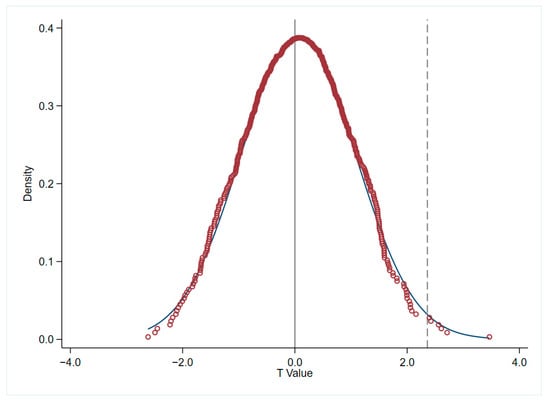
Figure 5.
Placebo test results.
5.5. Robustness Tests and Endogenous Discussion
5.5.1. Tests for Robustness
To confirm the robustness of our findings, we performed sensitivity analyses. We first used principal component analysis to measure NEV industry agglomeration as an alternative explanatory variable (Table 7, Column (1)). We then applied the SBM-ML method to measure high-quality green development as an alternative dependent variable (Table 7, Column (2)). The results show that NEV industry agglomeration significantly promotes high-quality green development. These findings are consistent with prior research, supporting our study’s hypothesis.
Table 7.
Outcomes of robustness tests.
5.5.2. The Instrumental Variable Approach
Considering that the new energy vehicle industry usually forms industrial chains in neighboring regions, we use the sum of the NEV industry agglomeration levels in neighboring provinces as an instrumental variable to satisfy the condition of strong correlation with the explanatory variables and no correlation with the explanatory variables. The estimation uses two-stage least squares (2SLS), with results presented in Table 8.
Table 8.
Endogenous test.
After IV estimation, NEV industry agglomeration significantly promotes high-quality green development, confirming the robustness of the results to endogeneity. The F-statistic greater than 10 further indicates the validity of the instrumental variable. These results reinforce the significant positive effect of NEV industry agglomeration on high-quality green development.
6. Spatial Econometrics
6.1. Spatial Spillover Effects
Before conducting geographical econometric analysis, it is crucial to undertake spatial correlation tests. The Moran’s Index in Equation (17) is used to measure the indicator of spatial autocorrelation to test the overall spatial autocorrelation of the study object, where is the total number of regions studied; is the spatial weight of the th and th regions, and the matrix formed is symmetric; and are the observed values of the variables of the ith and jth regions.
Due to the inherent influence of industrial agglomeration on gross domestic product, which induces correlation between the weight matrix and the model’s error terms, the application of economic distance-based spatial weights is inappropriate. Policy spillovers within the new energy vehicle industry predominantly occur between adjacent administrative regions rather than purely geographically proximate areas. Consequently, spatial weight matrices based on geographic distance are also unsuitable. The new energy vehicle supply chain exhibits strong spatial stickiness, with supporting enterprises typically clustering around vehicle manufacturing plants in neighboring regions. The spatial 0–1 neighbor weight matrix, serving as a logical foundation for spatial analysis, possesses indispensable theoretical validity. Therefore, this study adopts the spatial 0–1 neighbor weight matrix as the spatial weight matrix [66]. The Moran’s index for high-quality green development (GTFP), reported in Table 9, shows positive values ranging from 0.379 to 0.555, all significant at the 1% level. This indicates a significant positive spatial correlation in high-quality green development across provinces, suggesting a non-random, clustered distribution.
Table 9.
Moran’s I index of high quality green development levels.
Spatial effects are estimated using a geographic distance-based spatial weight matrix. The Moran’s index for high-quality green development (GTFP), reported in Table 9, shows positive values ranging from 0.379 to 0.555, all significant at the 1% level. This indicates a significant positive spatial correlation in high-quality green development across provinces, suggesting a non-random, clustered distribution.
We use a bi-directional fixed spatial Durbin model (SDM) for analysis [67,68], alongside SAR and SEM models in the baseline regression. The explanatory variable score is centered to create c_Score, mitigating multicollinearity in the regression.
Table 10 reports the results of spatial effect estimations for the SDM, SEM, and SAR models. The SDM model shows the highest log-likelihood value (373.384), justifying the use of the bi-directional fixed SDM model. The direct effect of NEV industry agglomeration on high-quality green development is 0.293, significant at the 1% level. This indicates that NEV industry agglomeration directly enhances high-quality green development within a province. NEV industry agglomeration likely improves resource allocation, promotes firm specialization, enhances resource utilization, and fosters green technology innovation, contributing to high-quality green development. A significantly positive spatial autocorrelation coefficient (rho) indicates that an increase in high-quality green development within a specific province promotes similar advancements in neighboring regions, thereby demonstrating a pronounced spatial spillover effect of high-quality green development. The indirect effect is negative and significant but small, possibly due to a “siphon effect” reducing high-quality green development in neighboring provinces, overshadowing the positive local effect. The new energy vehicle industry is classified as a high-technology emerging sector, wherein resource allocation, technological innovation, and skilled human capital tend to concentrate in core regions, potentially leading to regional development disparities. Therefore, governmental policy interventions, such as targeted subsidies or talent attraction initiatives in peripheral or resource-deprived areas, are essential to mitigate this siphoning effect and promote balanced regional development. A 1% increase in NEV industry agglomeration increases high-quality green development by 0.218%, with a significant overall effect of 0.218 at the 1% level, supporting partial validation Hypothesis 4.
Table 10.
Results of estimating spatial effects.
6.2. Replace Matrix Verification
In order to prove the credibility of the empirical results of this paper, this paper conducts a robustness test by the method of replacing the matrix, replacing the spatial 0–1 neighbor weight matrix with the economic distance weight matrix and the spatial geographic distance weight matrix, respectively; the regression results after replacing the matrices are shown in Table 11.
Table 11.
Replace matrix outcomes.
The regression coefficients for the spillover effect on the standard of high-quality green development across regions are markedly favorable, nearly corresponding with the results obtained from the spatial 0–1 neighbor weight matrix. This implies that there is a positive geographical spillover effect across regions’ levels of high-quality green development. The aggregation of the NEV sector within a region has been conclusively linked to a marked enhancement in the quality of sustainable development. This confirms that such industry clusters are a potent catalyst for elevating the standard of high-quality green progress, aligning with earlier projections. Therefore, the model results have strong robustness.
7. Discussion
7.1. Research Contributions
This study contributes by integrating relevant literature and elaborating on the connotations and requirements of industrial agglomeration in the NEV industry and high-quality green development, thereby enriching and refining the indicator system. Appropriate methodologies were employed for measurement and calculation. The research investigates the mediating roles of green technological innovation and public environmental concern within the effect of industry agglomeration on high-quality green development. To address potential endogeneity between industry agglomeration and green development, instrumental variable techniques are utilized, and the significance of government policies in promoting agglomeration and facilitating high-quality green development is validated through difference-in-differences analysis. Recognizing the spatial characteristics of high-quality green development, spatial econometric models and spatial weight matrices are selected to analyze the spatial spillover effects of industry clustering, with robustness confirmed via alternative spatial weight matrices. This research fills existing gaps in the measurement of industry clustering and its impact on green high-quality development, offering innovative insights from multiple perspectives and advancing the scholarly understanding of this domain. This study fills existing gaps in the measurement of industry agglomeration and its impact on green high-quality development, offering innovative insights from multiple perspectives and advancing the scholarly understanding of this domain.
7.2. Limitations and Future Research
It is essential to recognize the constraints inherent in this empirical study. Initially, the study employs a methodology that integrates theoretical assumptions with empirical validation, thereby offering avenues for expansion and further inquiry. A theoretical model that clarifies the function of NEV industrial agglomeration in promoting high-quality green development may be developed in future research projects. Second, although the majority of Chinese provinces are covered in this study, all city-level data could not be included due to the lack of complete data. In addition, due to limited access to data, it is not possible to fully understand the public awareness of the environment Baidu search index; thus, measurements on behalf of the public’s environmental concern may be subject to measurement error. The current available data are only updated until 2023, and the study will be supplemented in the future with various official statistics to enhance timeliness. Furthermore, the present study only looks at the ways that green technological innovation and public environmental concern affect high-quality green development; other research might look at other possible processes. Lastly, the findings may not be as broadly applicable due to the only emphasis on China. Using this model to investigate how NEV industry agglomeration impacts high-quality green growth in other emerging economies is an interesting and valuable research topic. Further research and analysis will be conducted in the future in terms of cross-country comparisons, micro-firm data, or new energy vehicle life cycles.
8. Conclusions
8.1. Research Findings
This study analyses the impact of NEV sector agglomeration on high-quality green development using panel data from Chinese provinces and investigates the underlying causes. The primary contribution lies in the measurement of NEV industry agglomeration and high-quality green development, constructing a detailed empirical framework to assess their relationship, thereby addressing existing research gaps. The findings confirm that the NEV industry, as an emerging sector, exhibits an upward trend in both eastern and midwestern territories of China. The mean degree of high-quality green development shows a relatively stable trend, with the western region demonstrating a higher level. Furthermore, NEV industry agglomeration is found to significantly promote high-quality green development, verifying Hypothesis 1. Further research into the mediating processes showed that innovative green technologies and public environmental concern indirectly support high-quality green development, thereby validating Hypothesis 2a and 2b. Significant heterogeneity effects were observed across different regions, with the NEV industry exhibiting greater agglomeration in the midwestern regions, areas with high green and low-carbon focus, and regions with high levels of financial development, thereby promoting high-quality green development more effectively, Hypothesis 3 is confirmed. NEV industry-related policies also exert a driving effect on high-quality green development. China’s high-quality green development has significant spatial spillover effects. An increase in the level of high-quality green development in one region will lead to an increase in the level of high-quality green development in neighboring regions, with partial validation of Hypothesis 4.
8.2. Research Implications
Firstly, regional entities must fully leverage their resource endowments to develop a locally adapted NEV industry, enhancing public environmental awareness and fostering industrial clusters with distinctive competitive advantages. Regulatory authorities should prioritize pollution control during NEV manufacturing processes and adopt a long-term strategic approach to talent acquisition by strengthening collaborations with higher education institutions and research organizations to promote technological innovation and sustainable development, thereby ensuring continuous industry momentum. Secondly, policymakers can incentivize NEV adoption through targeted subsidies, tax reductions, and supportive urban planning and traffic management measures that facilitate the establishment of a robust NEV industrial base. Additionally, government levels should recognize the critical importance of green, low-carbon development and economic–financial integration, embedding high-quality, environmentally sustainable growth as a core principle. Increased investment in scientific research and green technological innovation is essential to advance the high-tech NEV sector, driving ongoing industrial structural optimization and upgrading. Thirdly, high-quality green development exhibits spatial interconnectivity; under the new development paradigm, neighboring regions should enhance interregional cooperation, leveraging direct and spillover effects to promote coordinated green growth. Concurrently, support for less developed areas must be intensified to mitigate siphoning effects and foster balanced, inclusive regional development.
Author Contributions
Data curation, W.L.; Formal analysis, W.L.; Funding acquisition, T.X.; Methodology, W.L.; Project administration, T.X.; Software, W.L.; Supervision, T.X.; Validation, W.L.; Visualization, T.X.; Writing—original draft, W.L.; Writing—review and editing, T.X. All authors have read and agreed to the published version of the manuscript.
Funding
This research was funded by the Liaoning Provincial Social Science Planning Fund Key Project “Analysis on the Focus Change and Path Evolution of New Energy Vehicle Industry Policies”, grant number “L23AJL001”.
Data Availability Statement
The authors are willing to provide necessary data to other scholars. The original contributions presented in the study are included in the article; further inquiries can be directed to the corresponding author.
Conflicts of Interest
The authors declare no conflicts of interest.
Abbreviations
The following abbreviations are used in this manuscript:
| NEV | New energy vehicle |
| GTFP | Green total factor productivity |
| Pea | Public environmental attention |
| Gti | Green technology innovation |
| GDP | Gross Domestic Product |
| TFP | Total factor productivity |
References
- Wang, X.; Li, C.; Shang, J.; Yang, C.; Zhang, B.; Ke, X. Strategic choices of China’s new energy vehicle industry: An analysis based on ANP and SWOT. Energies 2017, 10, 537. [Google Scholar] [CrossRef]
- Qiu, L.-S.; Yang, D.-X.; Hong, K.-R.; Wu, W.-P.; Zeng, W.-K. The Prospect of China’s Renewable Automotive Industry Upon Shrinking Subsidies. Front. Energy Res. 2021, 9, 661585. [Google Scholar] [CrossRef]
- Ren, J. New energy vehicle in China for sustainable development: Analysis of success factors and strategic implications. Transp. Res. Part D Transp. Environ. 2018, 59, 268–288. [Google Scholar] [CrossRef]
- Yuan, X.; Liu, X.; Zuo, J. The development of new energy vehicles for a sustainable future: A review. Renew. Sustain. Energy Rev. 2015, 42, 298–305. [Google Scholar] [CrossRef]
- Dey, K.; Saha, S. Influence of procurement decisions in two-period green supply chain. J. Clean. Prod. 2018, 190, 388–402. [Google Scholar] [CrossRef]
- Nielsen, I.E.; Majumder, S.; Saha, S. Exploring the intervention of intermediary in a green supply chain. J. Clean. Prod. 2019, 233, 1525–1544. [Google Scholar] [CrossRef]
- Jin, G.; Shen, K.; Li, J. Interjurisdiction political competition and green total factor productivity in China: An inverted-U relationship. China Econ. Rev. 2020, 61, 101224. [Google Scholar] [CrossRef]
- Dargay, J.; Gately, D. Vehicle ownership to 2015: Implications for energy use and emissions. Energy Policy 1997, 25, 1121–1127. [Google Scholar] [CrossRef]
- Su, C.-W.; Yuan, X.; Shao, X.; Moldovan, N.-C. Explore the environmental benefits of new energy vehicles: Evidence from China. Ann. Oper. Res. 2023, 1–20. [Google Scholar] [CrossRef]
- Li, J.; Jiao, J.; Xu, Y.; Chen, C. Impact of the latent topics of policy documents on the promotion of new energy vehicles: Empirical evidence from Chinese cities. Sustain. Prod. Consum. 2021, 28, 637–647. [Google Scholar] [CrossRef]
- Zhang, W.; Zhu, L.; Liu, X.; Wang, W.; Song, H. Optimal strategies in electric vehicle battery closed-loop supply chain considering government subsidies and echelon utilization. J. Energy Storage 2024, 99, 113341. [Google Scholar] [CrossRef]
- Yang, T.; Xing, C.; Li, X. Evaluation and analysis of new-energy vehicle industry policies in the context of technical innovation in China. J. Clean. Prod. 2021, 281, 125126. [Google Scholar] [CrossRef]
- Meng, F.; Jin, X. Evaluation of the development capability of the new energy vehicle industry: An empirical study from China. Sustainability 2019, 11, 2635. [Google Scholar] [CrossRef]
- Meng, W.; Ma, M.; Li, Y.; Huang, B. New energy vehicle R&D strategy with supplier capital constraints under China’s dual credit policy. Energy Policy 2022, 168, 113099. [Google Scholar] [CrossRef]
- Wang, Y.; Bai, Y.; Quan, T.; Ran, R.; Hua, L. Influence and effect of industrial agglomeration on urban green total factor productivity—On the regulatory role of innovation agglomeration and institutional distance. Econ. Anal. Policy 2023, 78, 1158–1173. [Google Scholar] [CrossRef]
- Xu, N. Industrial Co-Agglomeration and Urban Green Total Factor Productivity: Multidimensional Mechanism and Spatial Effect. Sustainability 2024, 16, 9415. [Google Scholar] [CrossRef]
- Ge, L.; Li, C.; Sun, L.; Hu, W.; Ban, Q. The relationship between high-tech industrial agglomeration and regional innovation: A meta-analysis investigation in China. Sustainability 2023, 15, 16545. [Google Scholar] [CrossRef]
- Liang, Y.; Hao, X. Can the Agglomeration of New Energy Industries Improve Environmental Efficiency?—Evidence from China. Sustainability 2022, 14, 8961. [Google Scholar] [CrossRef]
- Han, B.; Wu, H.; Diao, Y.; Han, D. Research on the influence of the new energy industry agglomeration on the collaborative governance of pollution reduction and carbon reduction. Energy Strategy Rev. 2024, 55, 101540. [Google Scholar] [CrossRef]
- Su, Y.; Yu, Y.-q. Spatial agglomeration of new energy industries on the performance of regional pollution control through spatial econometric analysis. Sci. Total Environ. 2020, 704, 135261. [Google Scholar] [CrossRef]
- Huang, Y.; Sheng, K.; Sun, W. Influencing factors of manufacturing agglomeration in the Beijing-Tianjin-Hebei region based on enterprise big data. J. Geogr. Sci. 2022, 32, 2105–2128. [Google Scholar] [CrossRef]
- Wei, W.; Zhang, W.-L.; Wen, J.; Wang, J.-S. TFP growth in Chinese cities: The role of factor-intensity and industrial agglomeration. Econ. Model. 2020, 91, 534–549. [Google Scholar] [CrossRef]
- Pearce, D.; Markandya, A.; Barbier, E. Blueprint 1: For a Green Economy; Routledge: London, UK, 2013. [Google Scholar]
- Deakin, M.; Reid, A. Sustainable urban development: Use of the environmental assessment methods. Sustain. Cities Soc. 2014, 10, 39–48. [Google Scholar] [CrossRef]
- Yang, Q.; Wan, X.; Ma, H. Assessing green development efficiency of municipalities and provinces in China integrating models of super-efficiency DEA and malmquist index. Sustainability 2015, 7, 4492–4510. [Google Scholar] [CrossRef]
- Cao, J.; Ge, C. Research on the Impact of Technology Innovation on Quantity and Quality of Economic Growth in the Yangtze River Delta of China: A Comparative Study. Int. J. Sustain. Dev. Plan. 2021, 16, 1455–1464. [Google Scholar] [CrossRef]
- Ma, D.; Zhu, Q. Innovation in emerging economies: Research on the digital economy driving high-quality green development. J. Bus. Res. 2022, 145, 801–813. [Google Scholar] [CrossRef]
- Cheng, M.; Wang, J.; Yang, S.; Li, Q. The driving effect of technological innovation on green development: From the perspective of efficiency. Energy Policy 2024, 188, 114089. [Google Scholar] [CrossRef]
- Ji, Q.; Zhang, D. How much does financial development contribute to renewable energy growth and upgrading of energy structure in China? Energy Policy 2019, 128, 114–124. [Google Scholar] [CrossRef]
- Qiu, S.; Wang, Z.; Geng, S. How do environmental regulation and foreign investment behavior affect green productivity growth in the industrial sector? An empirical test based on Chinese provincial panel data. J. Environ. Manag. 2021, 287, 112282. [Google Scholar] [CrossRef]
- Yu, D.; Li, X.; Yu, J.; Li, H. The impact of the spatial agglomeration of foreign direct investment on green total factor productivity of Chinese cities. J. Environ. Manag. 2021, 290, 112666. [Google Scholar] [CrossRef]
- Yuan, H.; Feng, Y.; Lee, J.; Liu, H.; Li, R. The spatial threshold effect and its regional boundary of financial agglomeration on green development: A case study in China. J. Clean. Prod. 2020, 244, 118670. [Google Scholar] [CrossRef]
- Greenstone, M.; Hanna, R. Environmental regulations, air and water pollution, and infant mortality in India. Am. Econ. Rev. 2014, 104, 3038–3072. [Google Scholar] [CrossRef]
- Song, M.; Zhao, X.; Shang, Y. The impact of low-carbon city construction on ecological efficiency: Empirical evidence from quasi-natural experiments. Resour. Conserv. Recycl. 2020, 157, 104777. [Google Scholar] [CrossRef]
- Zhang, D.; Vigne, S.A. How does innovation efficiency contribute to green productivity? A financial constraint perspective. J. Clean. Prod. 2021, 280, 124000. [Google Scholar] [CrossRef]
- Wu, Y.; Song, J. Impact of New Energy Industry Agglomeration on Green Innovation Efficiency—Based on the Regulative Effect of Green Finance. Sustainability 2024, 16, 3311. [Google Scholar] [CrossRef]
- Asghari, M.; Al-e-hashem, S.M.J.M. Green vehicle routing problem: A state-of-the-art review. Int. J. Product. Econ. 2021, 231, 107899. [Google Scholar] [CrossRef]
- Deng, Y.; Ma, M.; Zhou, N.; Ma, Z.; Yan, R.; Ma, X. Chinas plug-in hybrid electric vehicle transition: An operational carbon perspective. Energy Convers. Manag. 2024, 320, 119011. [Google Scholar] [CrossRef]
- Xie, W.; Li, X. Can industrial agglomeration facilitate green development? Evidence from China. Front. Env. Sci. 2021, 9, 745465. [Google Scholar] [CrossRef]
- Guo, Y.; Xia, X.; Zhang, S.; Zhang, D. Environmental regulation, government R&D funding and green technology innovation: Evidence from China provincial data. Sustainability 2018, 10, 940. [Google Scholar] [CrossRef]
- Hong, M.; Li, Z.; Drakeford, B. Do the green credit guidelines affect corporate green technology innovation? Empirical research from China. Int. J. Environ. Res. Public Health 2021, 18, 1682. [Google Scholar] [CrossRef]
- Yue, J.; Duan, H. The Influence of New Energy Industry Agglomeration on Regional Green Innovation Performance—Evidence from China. Sustainability 2024, 16, 2029. [Google Scholar] [CrossRef]
- Zhao, J.; Shahbaz, M.; Dong, K. How does energy poverty eradication promote green growth in China? The role of technological innovation. Technol. Forecast. Soc. Change 2022, 175, 121384. [Google Scholar] [CrossRef]
- Pan, K.; He, F. Does public environmental attention improve green investment efficiency?—Based on the perspective of environmental regulation and environmental responsibility. Sustainability 2022, 14, 12861. [Google Scholar] [CrossRef]
- Xu, Y.; Yang, L.; Hossain, M.E.; Haseeb, M.; Ran, Q. Unveiling the trajectory of corporate green innovation: The roles of the public attention and government. J. Clean. Prod. 2024, 444, 141119. [Google Scholar] [CrossRef]
- Chen, J.; Zhou, Q. City size and urban labor productivity in China: New evidence from spatial city-level panel data analysis. Econ. Syst. 2017, 41, 165–178. [Google Scholar] [CrossRef]
- Wang, Y.; Li, A.; Cheng, S. Harmonious development and dynamic correlation analysis of new energy industry agglomeration innovative human capital and green economic growth. In Proceedings of the 2021 International Conference on Environmental Engineering, Agricultural Pollution and Hydraulical Studies (EEAPHS 2021)—E3S Web of Conferences, Wuhan, China, 29–30 May 2021. [Google Scholar]
- Du, J.; Zhong, Z.; Shi, Q.; Wang, L.; Liu, Y.; Ying, N. Does government environmental attention drive green total factor productivity? Evidence from China. J. Environ. Manag. 2024, 366, 121766. [Google Scholar] [CrossRef]
- Quan, T.; Quan, T. A study of the spatial mechanism of financial agglomeration affecting green low-carbon development: Evidence from china. Sustainability 2023, 15, 965. [Google Scholar] [CrossRef]
- Chen, C.; Sun, Y.; Lan, Q.; Jiang, F. Impacts of industrial agglomeration on pollution and ecological efficiency-A spatial econometric analysis based on a big panel dataset of China’s 259 cities. J. Clean. Prod. 2020, 258, 120721. [Google Scholar] [CrossRef]
- Bai, J.; Li, S.; Wang, N.; Shi, J.; Li, X. Spatial spillover effect of new energy development on economic growth in developing areas of China—An empirical test based on the spatial Dubin model. Sustainability 2020, 12, 3249. [Google Scholar] [CrossRef]
- Liu, Y. Impacts of industrial agglomeration on the energy consumption structure’s low-carbon transition process: A spatial and nonlinear perspective. PLoS ONE 2024, 19, e0307893. [Google Scholar] [CrossRef]
- Oh, D.-h. A global Malmquist-Luenberger productivity index. J. Product. Anal. 2010, 34, 183–197. [Google Scholar] [CrossRef]
- Färe, R.; Grosskopf, S.; Pasurka, J.; Carl, A. Accounting for air pollution emissions in measures of state manufacturing productivity growth. J. Reg. Sci. 2001, 41, 381–409. [Google Scholar] [CrossRef]
- Fukuyama, H.; Weber, W.L. A directional slacks-based measure of technical inefficiency. Socio-Econ. Plan. Sci. 2009, 43, 274–287. [Google Scholar] [CrossRef]
- Tone, K. A slacks-based measure of efficiency in data envelopment analysis. Eur. J. Oper. Res. 2001, 130, 498–509. [Google Scholar] [CrossRef]
- Kotyza, P.; Cabelkova, I.; Pieranski, B.; Malec, K.; Borusiak, B.; Smutka, L.; Nagy, S.; Gawel, A.; Lluch, D.B.L.P.; Kis, K. The predictive power of environmental concern, perceived behavioral control and social norms in shaping proenvironmental intentions: A multicountry study. Front. Ecol. Evol. 2024, 12, 1289139. [Google Scholar] [CrossRef]
- Wang, H.; Cui, H.; Zhao, Q. Effect of green technology innovation on green total factor productivity in China: Evidence from spatial durbin model analysis. J. Clean. Prod. 2021, 288, 125624. [Google Scholar] [CrossRef]
- Chen, A.; Chen, H. Decomposition analysis of green technology innovation from green patents in China. Math. Probl. Eng. 2021, 2021, 6672656. [Google Scholar] [CrossRef]
- Zhang, J.; Fan, J.; Mo, J. Government Intervention, Land Market, and Urban Development: Evidence from Chinese Cities. Econ. Inq. 2017, 55, 115–136. [Google Scholar] [CrossRef]
- Kim, H.; Kim, H.; Lee, D.; Seomun, G.; Woosnam, K.M. Climate gentrification and green infrastructure in the U.S. Great Lakes region: Engaging with heat exposure and adaptation policy. Habitat Int. 2025, 163, 103453. [Google Scholar] [CrossRef]
- Seker, M.; Saliola, F. A cross-country analysis of total factor productivity using micro-level data. Cent. Bank Rev. 2018, 18, 13–27. [Google Scholar] [CrossRef]
- Arrow, K.J. The economic implications of learning by doing. Rev. Econ. Stud. 1962, 29, 155–173. [Google Scholar] [CrossRef]
- Hayes, A.F. Beyond Baron and Kenny: Statistical mediation analysis in the new millennium. Commun. Monogr. 2009, 76, 408–420. [Google Scholar] [CrossRef]
- Jiang, H.; Jiang, P.; Wang, D.; Wu, J. Can smart city construction facilitate green total factor productivity? A quasi-natural experiment based on China’s pilot smart city. Sustain. Cities Soc. 2021, 69, 102809. [Google Scholar] [CrossRef]
- Gomez, L.M.B.; Filippini, M.; Heimsch, F. Regional impact of changes in disposable income on Spanish electricity demand: A spatial econometric analysis. Energy Econ. 2013, 40, S58–S66. [Google Scholar] [CrossRef]
- Lesage, J.; Pace, R.K. Introduction to Spatial Econometrics. J. R. Stat. Soc. Ser. A Stat. Soc. 2008, 174, 19–44. [Google Scholar] [CrossRef]
- Yan, W.; Tao, Z.; Juan, W.; Fang, G.; Xu, K.; Rong, Y. Spatial analysis on carbon emission abatement capacity at provincial level in China from 1997 to 2014: An empirical study based on SDM model. Atmos. Pollut. Res. 2019, 10, 97–104. [Google Scholar] [CrossRef]

Disclaimer/Publisher’s Note: The statements, opinions and data contained in all publications are solely those of the individual author(s) and contributor(s) and not of MDPI and/or the editor(s). MDPI and/or the editor(s) disclaim responsibility for any injury to people or property resulting from any ideas, methods, instructions or products referred to in the content. |
© 2025 by the authors. Published by MDPI on behalf of the World Electric Vehicle Association. Licensee MDPI, Basel, Switzerland. This article is an open access article distributed under the terms and conditions of the Creative Commons Attribution (CC BY) license (https://creativecommons.org/licenses/by/4.0/).