
Adaptive and Collaborative Hierarchical Optimization Strategies for a Multi-Microgrid System Considering EV and Storage


Abstract
1. Introduction
1.1. Literature Review
- (1)
- Concentrated on the highly disordered nature of EVs, which hinders effective EV-to-grid interaction and pronounced spatiotemporal coupling with controllable loads, it is imperative to develop a coordinated consumption-side optimization strategy to enhance the economic efficiency and operational stability at the microgrid level.
- (2)
- Concentrated on the lack of storage benefits and energy synergies within the source–grid–load–storage integrated management framework, it is imperative to devise a collaborative supply-side optimization strategy to enhance the resource utilization and economic efficiency of storage management and energy interconnection.
1.2. Contribution
- (1)
- Focusing on the microgrid integrated with EVs, a Voronoi-based adaptive genetic algorithm optimization for the Latin Hypercube is proposed to enhance the simulated realism of EV driving conditions. Additionally, the concept and recursion mechanism of the energy storage margin band are proposed to serve as the foundation for the efficient optimization of EV-to-grid interaction.
- (2)
- Building on the simulated EV storage margin band, a cooperative operation mechanism between EV-to-grid interaction and controllable load dispatch is further explored. Furthermore, an adaptive optimization method for EV storage operation and demand response is proposed to leverage the storage capabilities of EVs and tap into the potential of demand-side management.
- (3)
- A Nash-Topsis method is proposed to determine the optimal strategy from the dual objective Pareto front of the optimization results. This approach effectively improves synergy and efficiency in the multi-objective optimization process.
- (4)
- Building on the integrated management of source–grid–load–storage, a synchronous optimization mechanism for energy storage configuration and operation is further explored. Meanwhile, a dynamic optimization mechanism based on state mapping is proposed to significantly enhance the SOC and resource utilization of energy storage.
- (5)
- A collaborative optimization method for storage management and energy interconnection is proposed based on a comprehensive exploration of their synergistic operation mechanism, to effectively enhance the system’s economic efficiency and environmental sustainability.
2. Hierarchical Optimization Framework for Multi-Microgrid System
3. Improved Simulation Method and Recursion Mechanism of Energy Storage Margin Band for EV
3.1. Voronoi-Based Adaptive Genetic Algorithm Optimization for Latin Hypercube Simulation of EVs
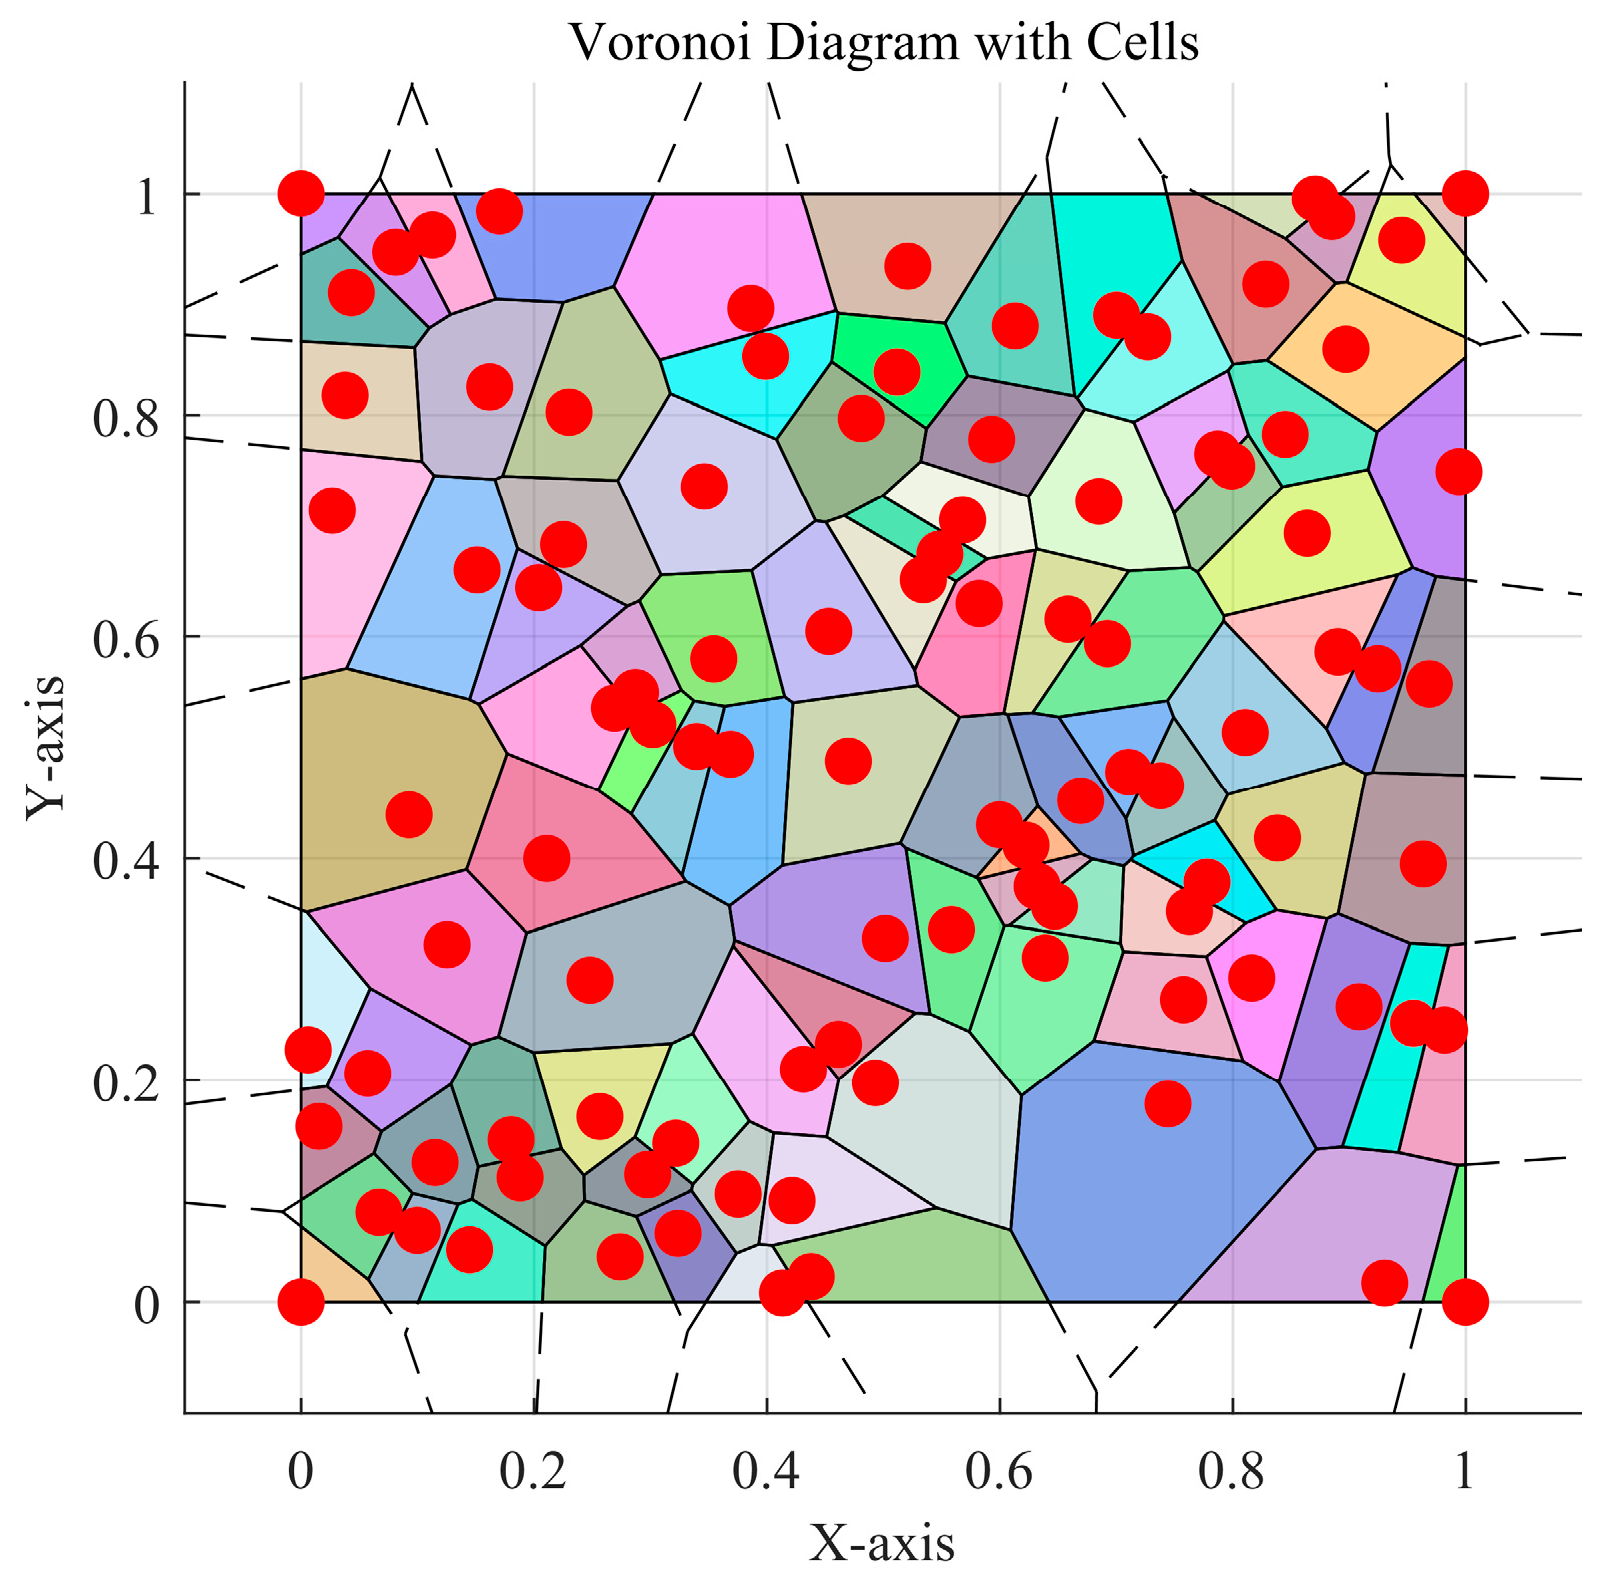
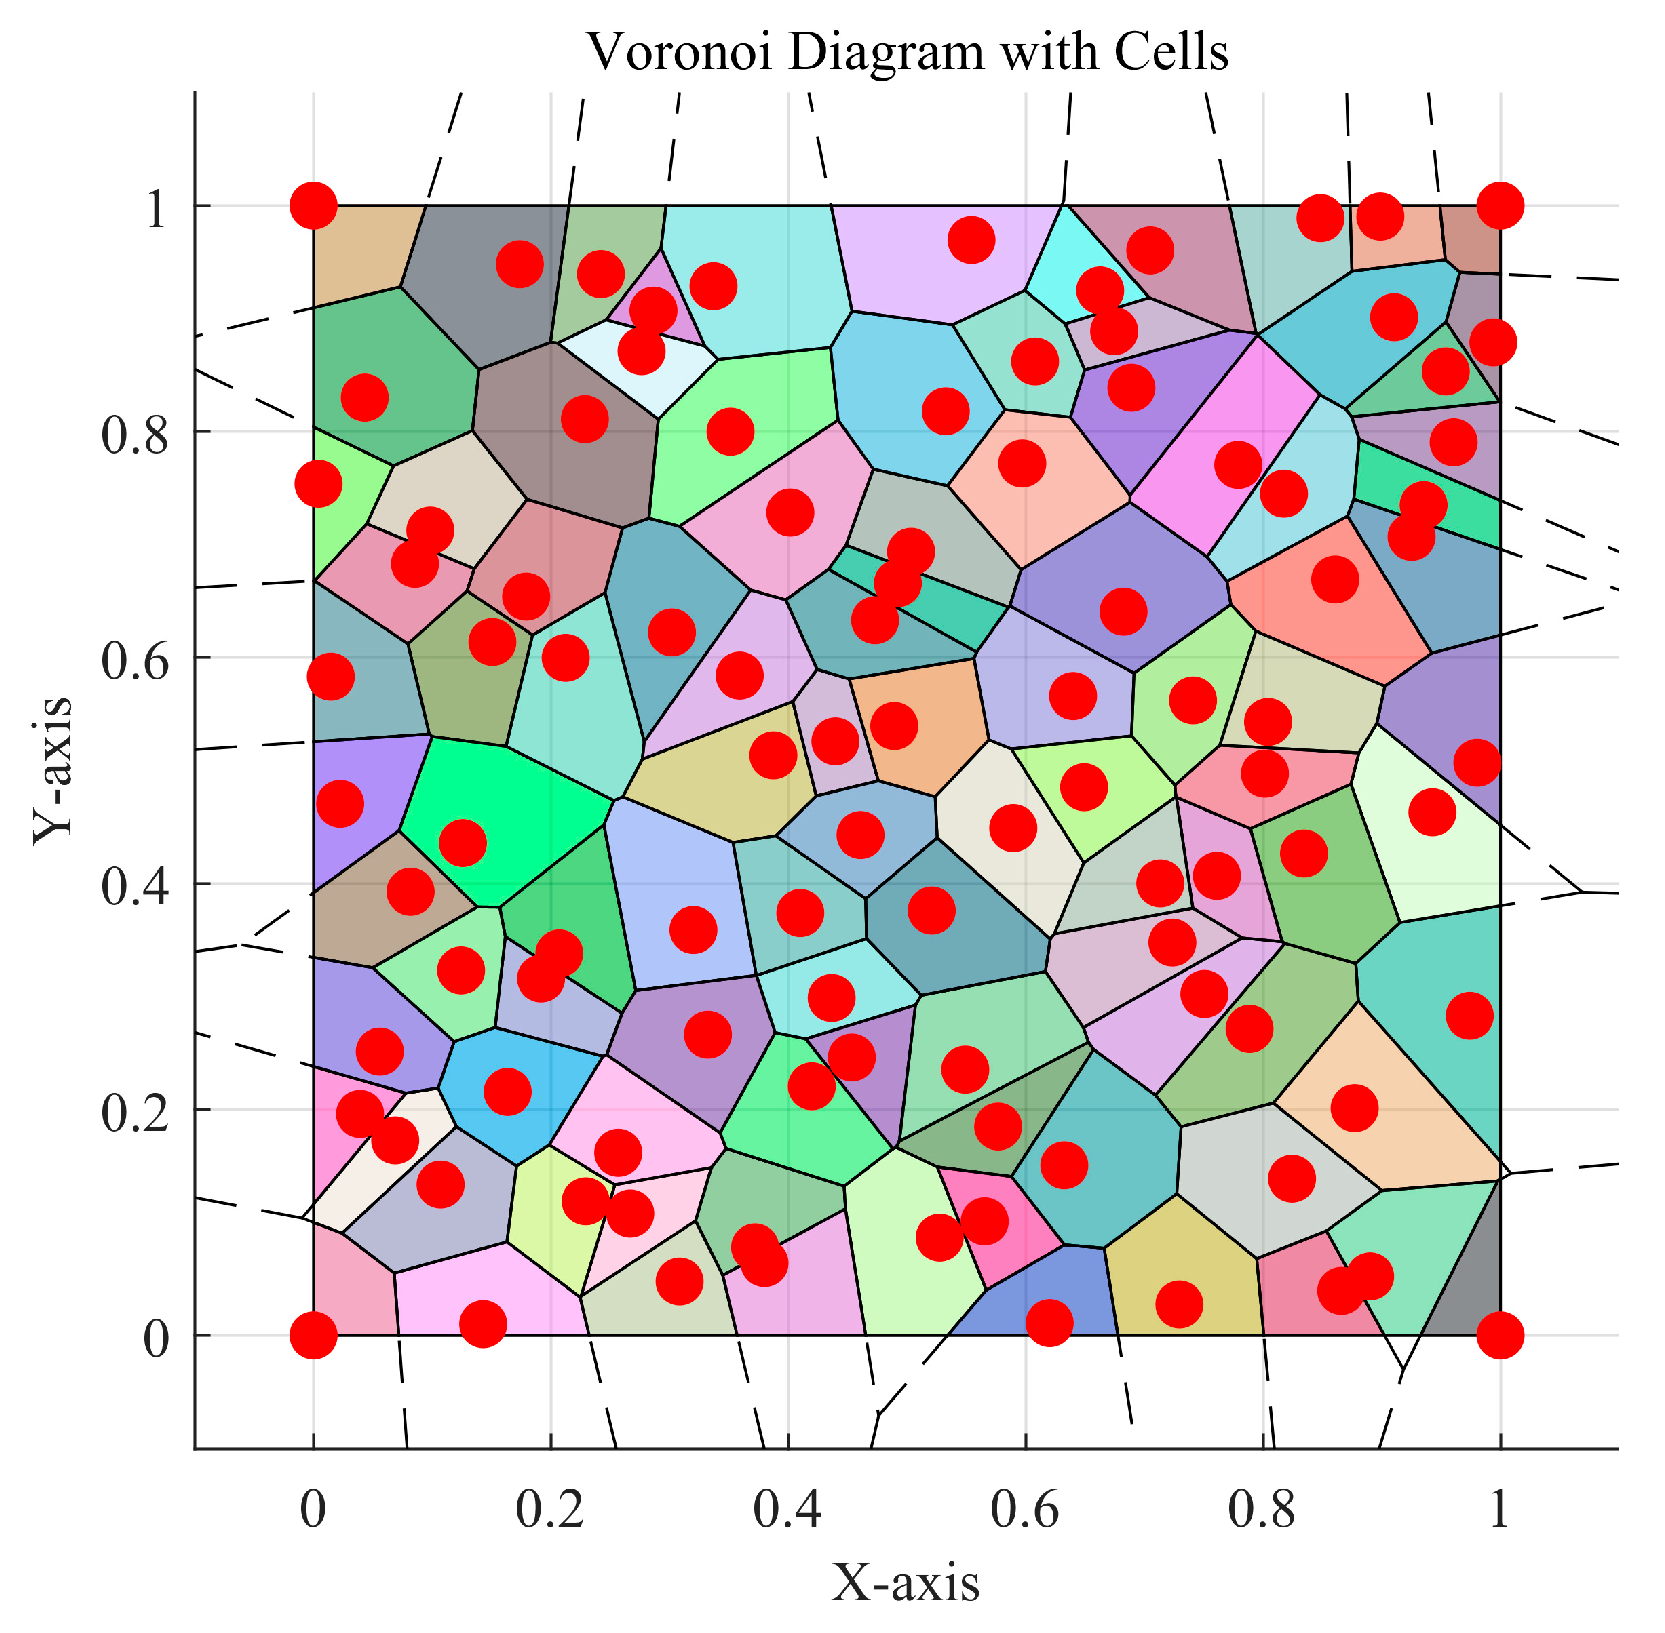
3.1.1. Theory of Voronoi Diagrams
3.1.2. Adaptive Genetic Algorithms
3.1.3. Voronoi-Based Adaptive Genetic Algorithm Optimization for Latin Hypercube
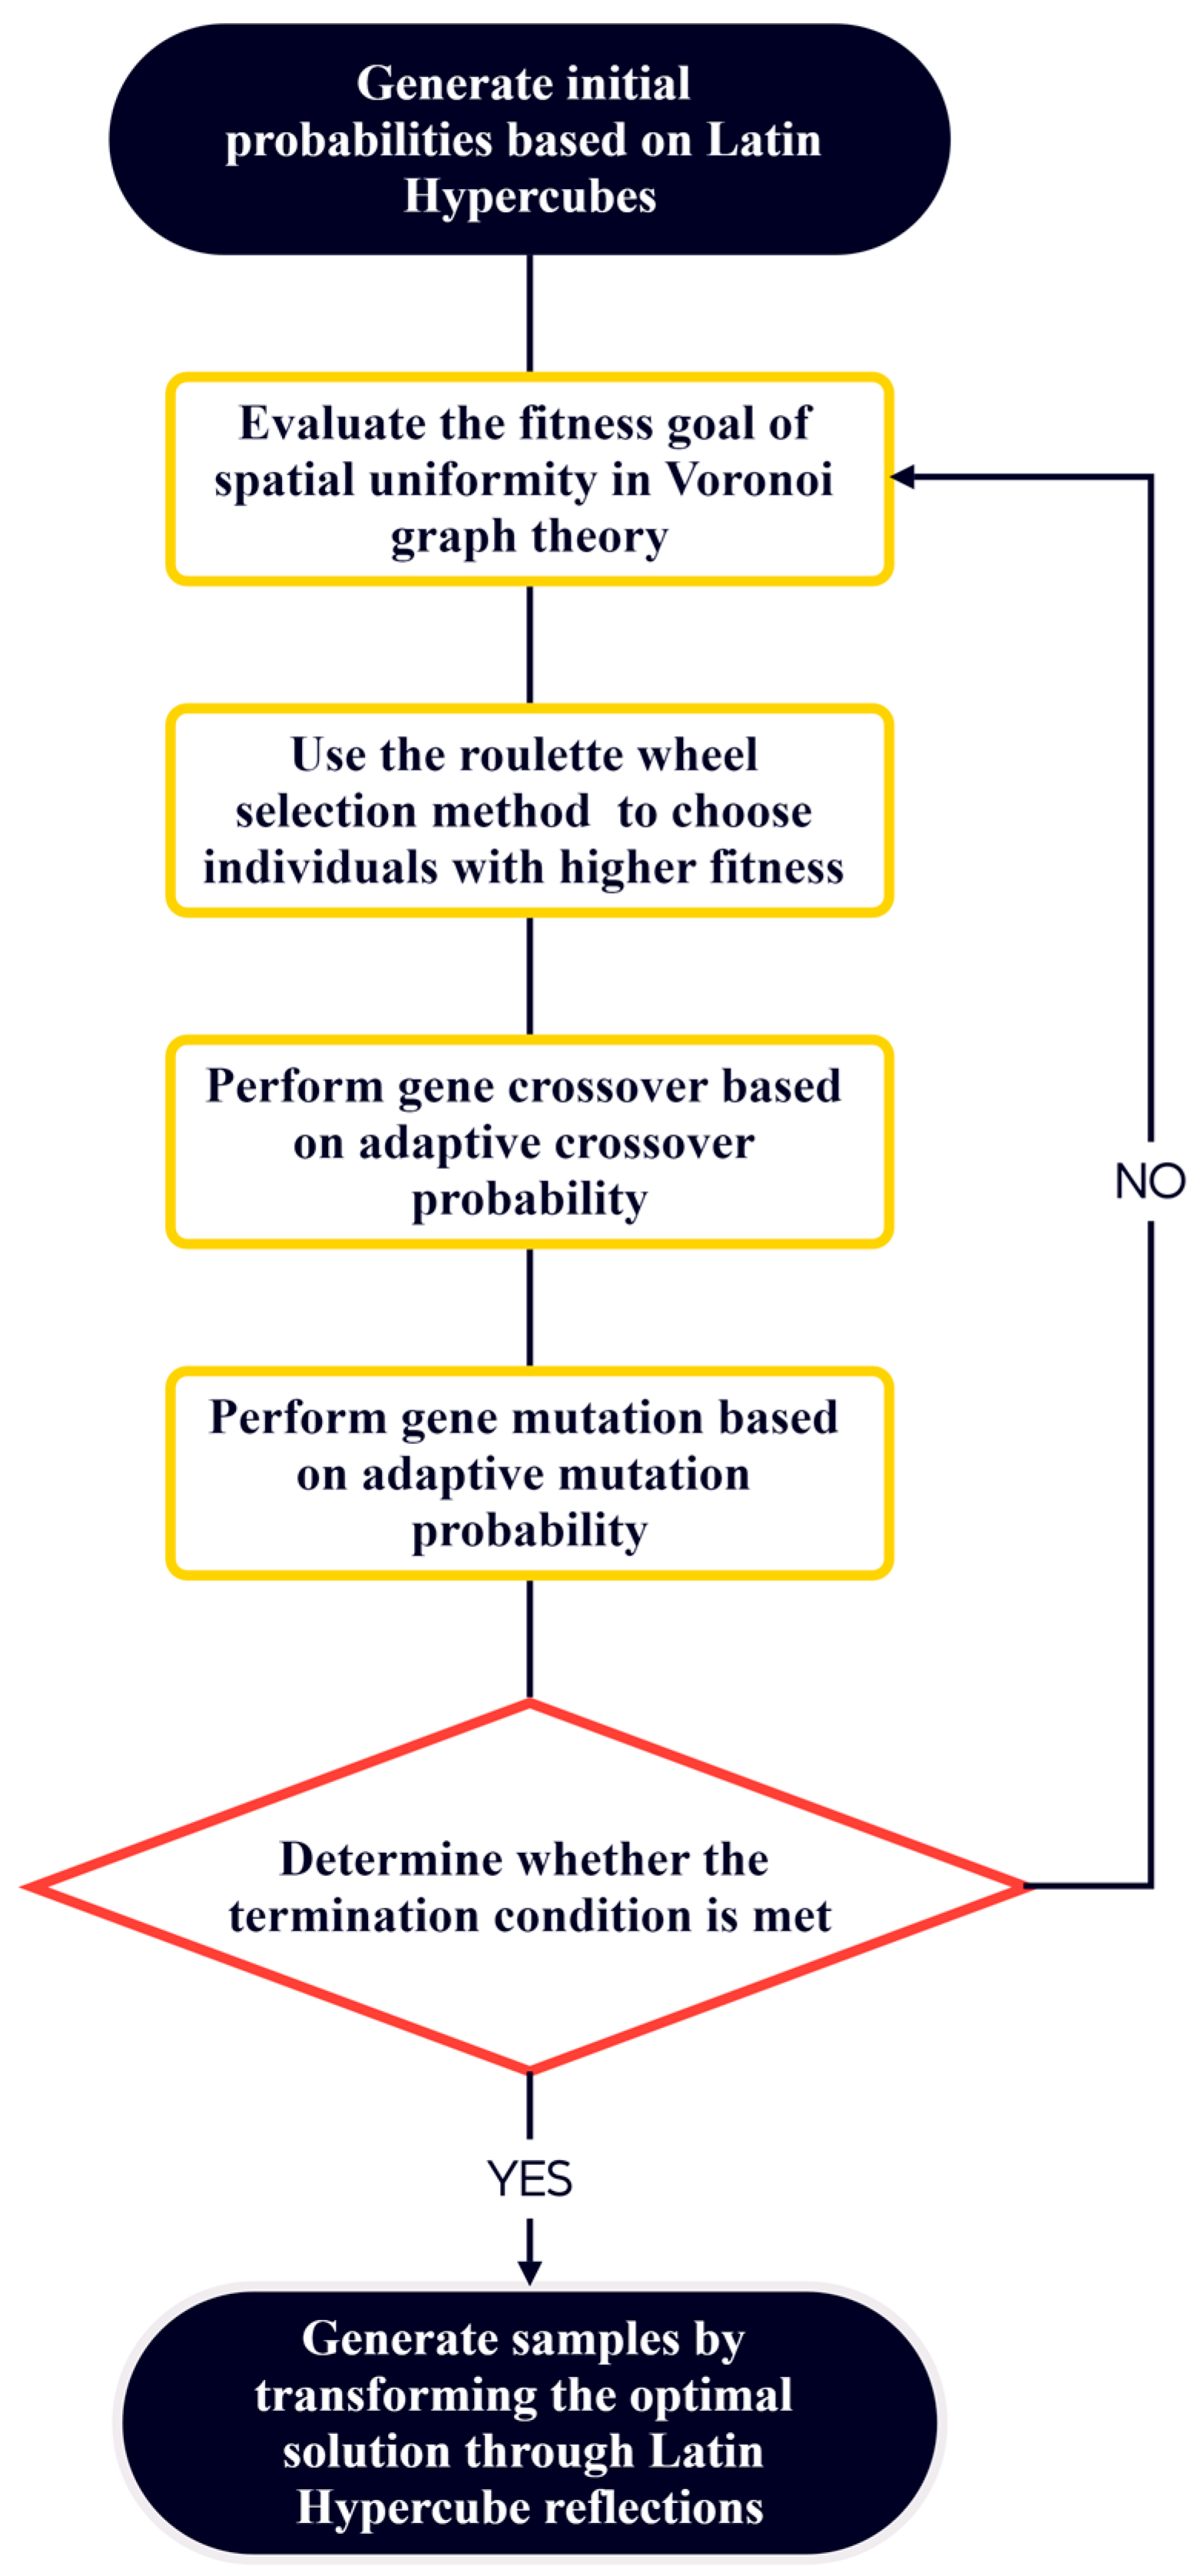
- Compute the definite integral of the probability density function of each dimension to obtain the cumulative distribution function and .
- Use the probability values of the cumulative distribution function as the sample space, dividing it into non-overlapping sub-intervals of equal size, each spaced by .
- Perform random sampling within each sample space of each dimension. For each interval, generate a random number uniformly distributed within the interval and calculate the corresponding probability value using the following formula:where is the number of samples or intervals; is the index of each interval; is a random number between 0 and 1; and denote the probability value.
- Population initialization: Construct the decision variables to define a permutation sequence, which is then applied to the sampled probability values to generate two-dimensional sample points:where and are the decision variables to be optimized; denotes the corresponding two-dimensional sample point set formed from them.
- Fitness evaluation: To assess population quality, the Voronoi diagram theory is applied to evaluate the uniformity of the spatial distribution of the probability values , obtained through random sampling, which serves as the objective for the fitness function.where denotes the area of the Voronoi polygon formed by the set of points with probability values.
- Selection: Based on the fitness function values, a roulette wheel selection method is used to choose individuals with higher fitness for the next round of evolution.
- Crossover: New individuals are generated by performing partial gene crossover on selected individuals based on the adaptive crossover probability to simulate natural gene recombination.where denotes the corresponding crossover probability; and are the current and total iteration number; and denote the initial and final crossover probability.
- Mutation: To prevent the algorithm from converging to local optima, random mutation operations are applied based on the adaptive mutation probability, enhancing the diversity of the new population.where denotes the corresponding mutation probability; and denote the initial and final mutation probability.
- Iteration and termination: The selection, crossover, and mutation processes are repeated to generate new populations until the termination conditions are met, either by reaching a predetermined number of iterations or when there is no significant improvement in fitness.
- Through reverse mapping, each final probability value is substituted into the inverse of the cumulative distribution function to obtain the corresponding data samples.where and are the final data samples; and are the inverse functions of the cumulative distribution functions; and denote the final sequences.
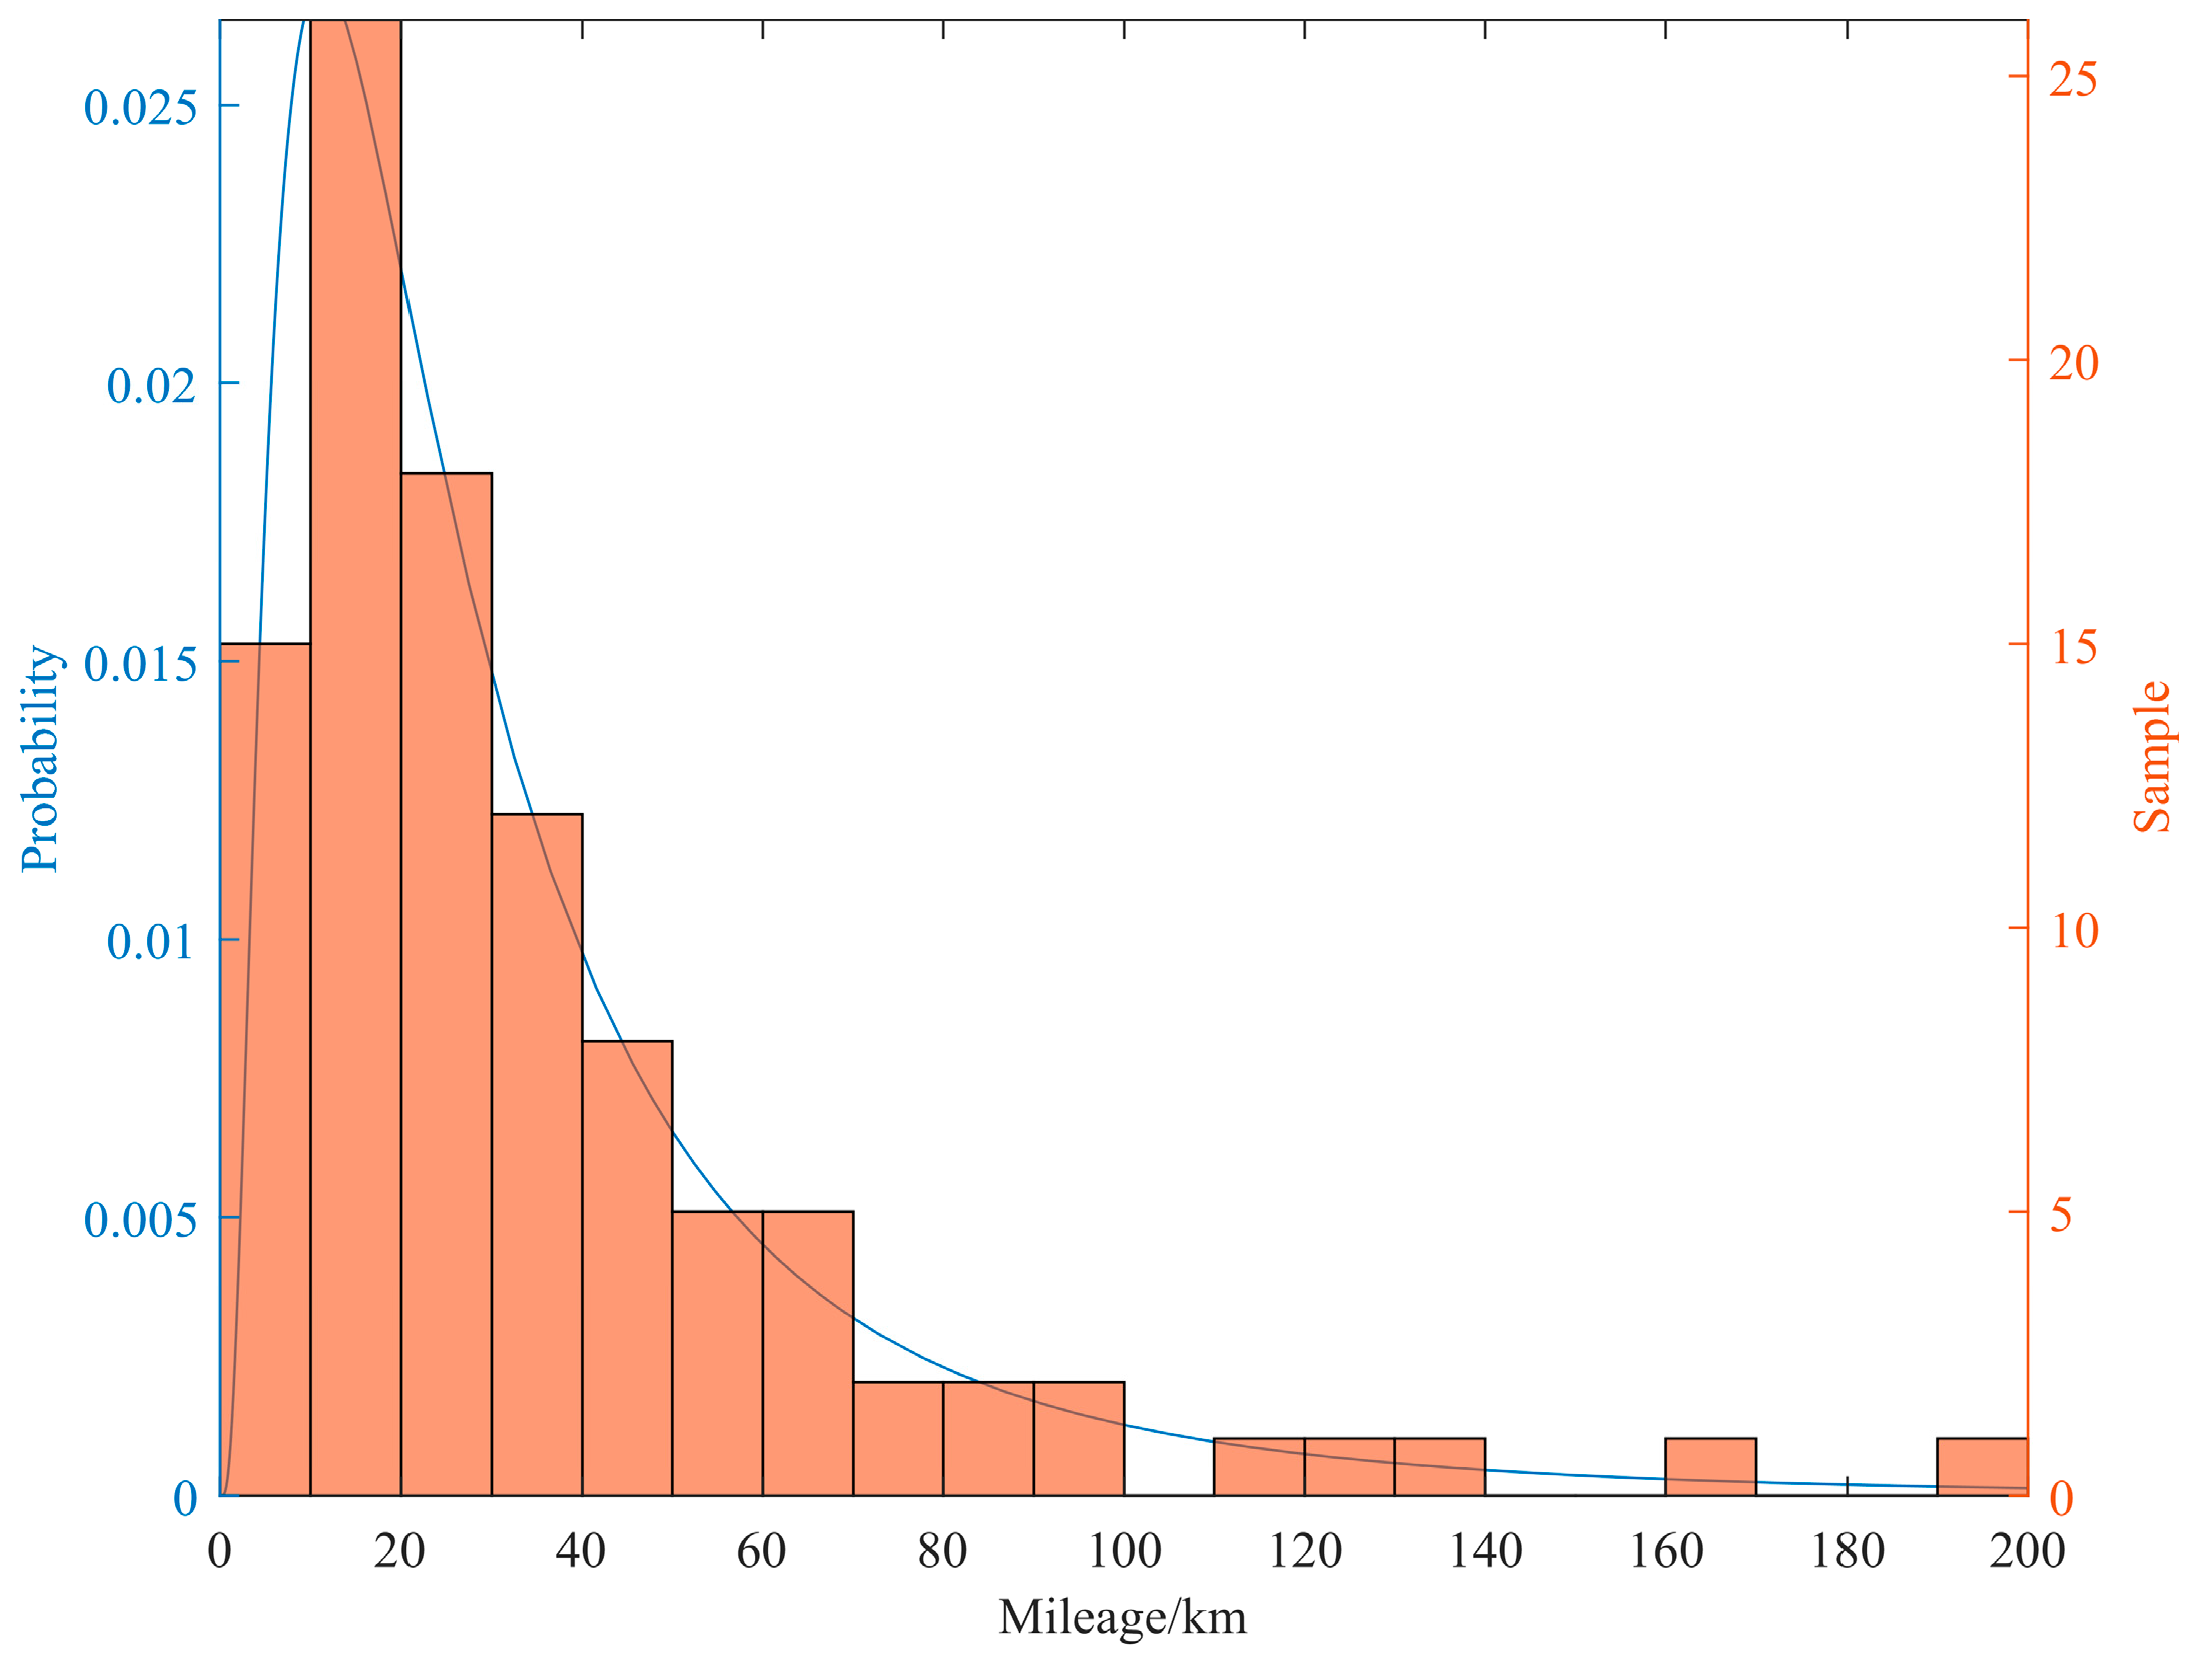
3.1.4. Analysis of Simulation Results
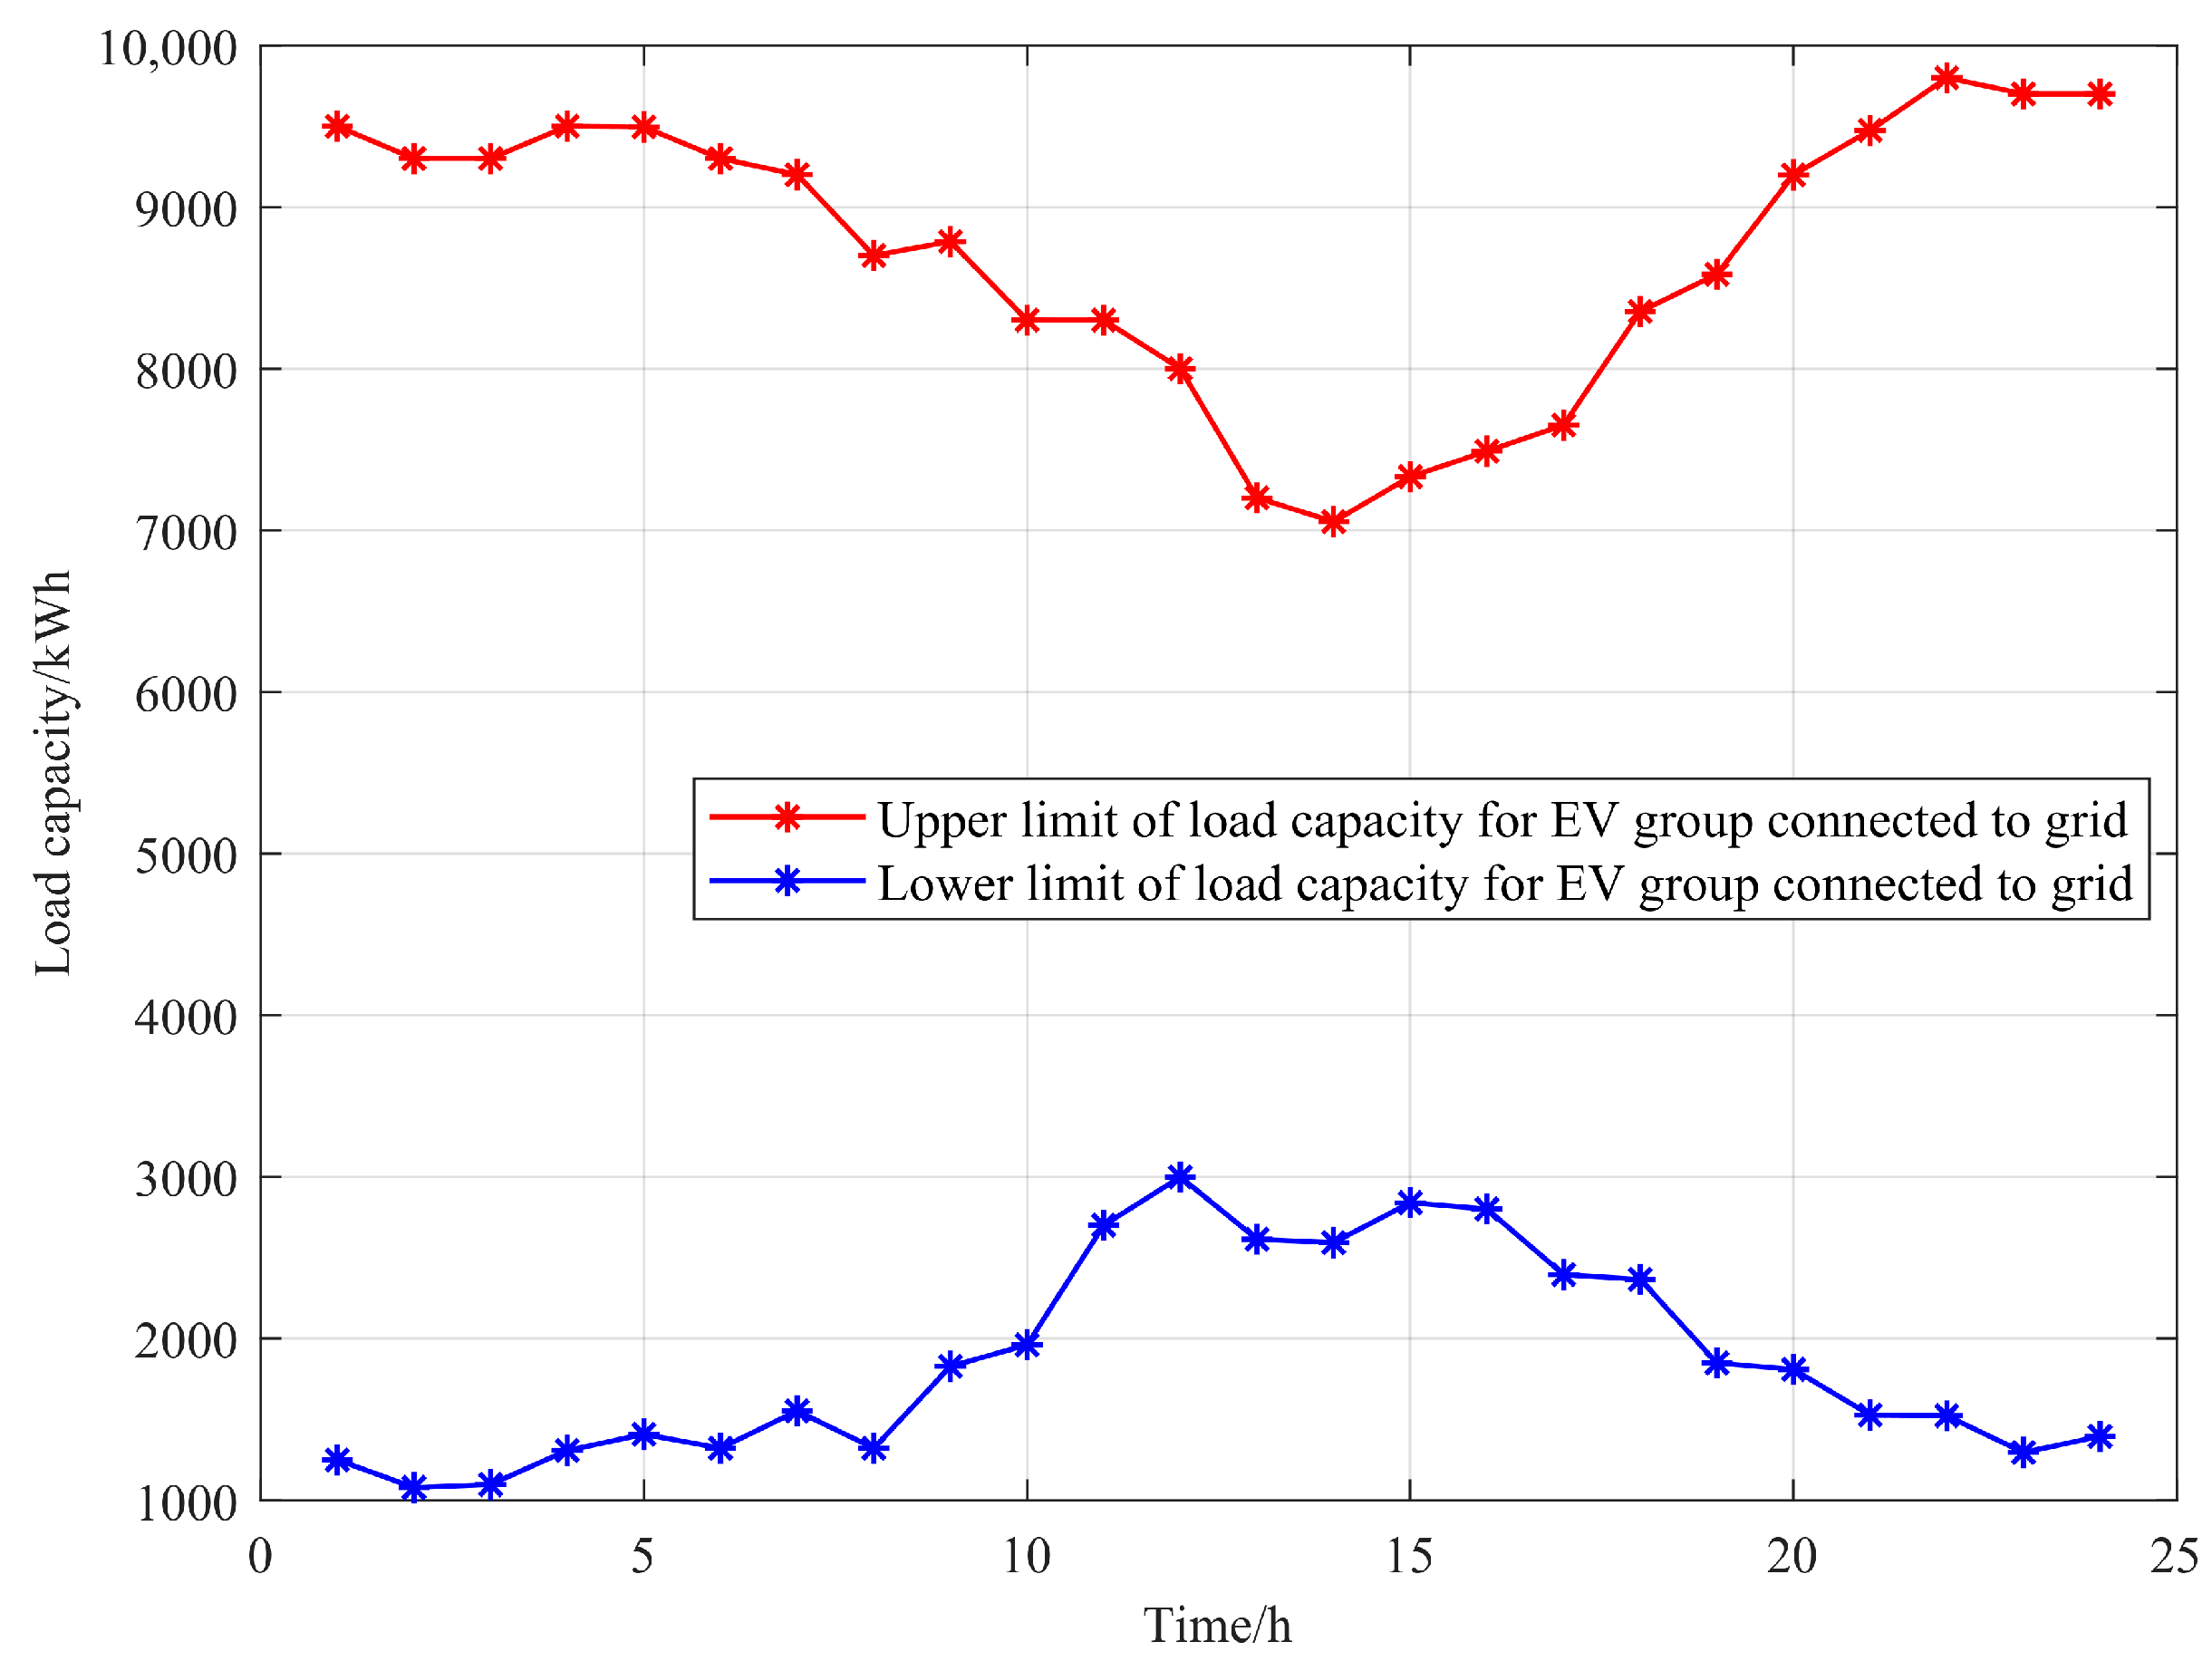
3.2. Recursion Mechanism of Energy Storage Margin Band for EV Fleet Access to the Grid
4. Adaptive Optimization for EV Storage Operation and Demand Response in a Single Microgrid
4.1. Adaptive Optimization Method for EV Storage Operation and Demand Response
4.1.1. Restrictive Condition
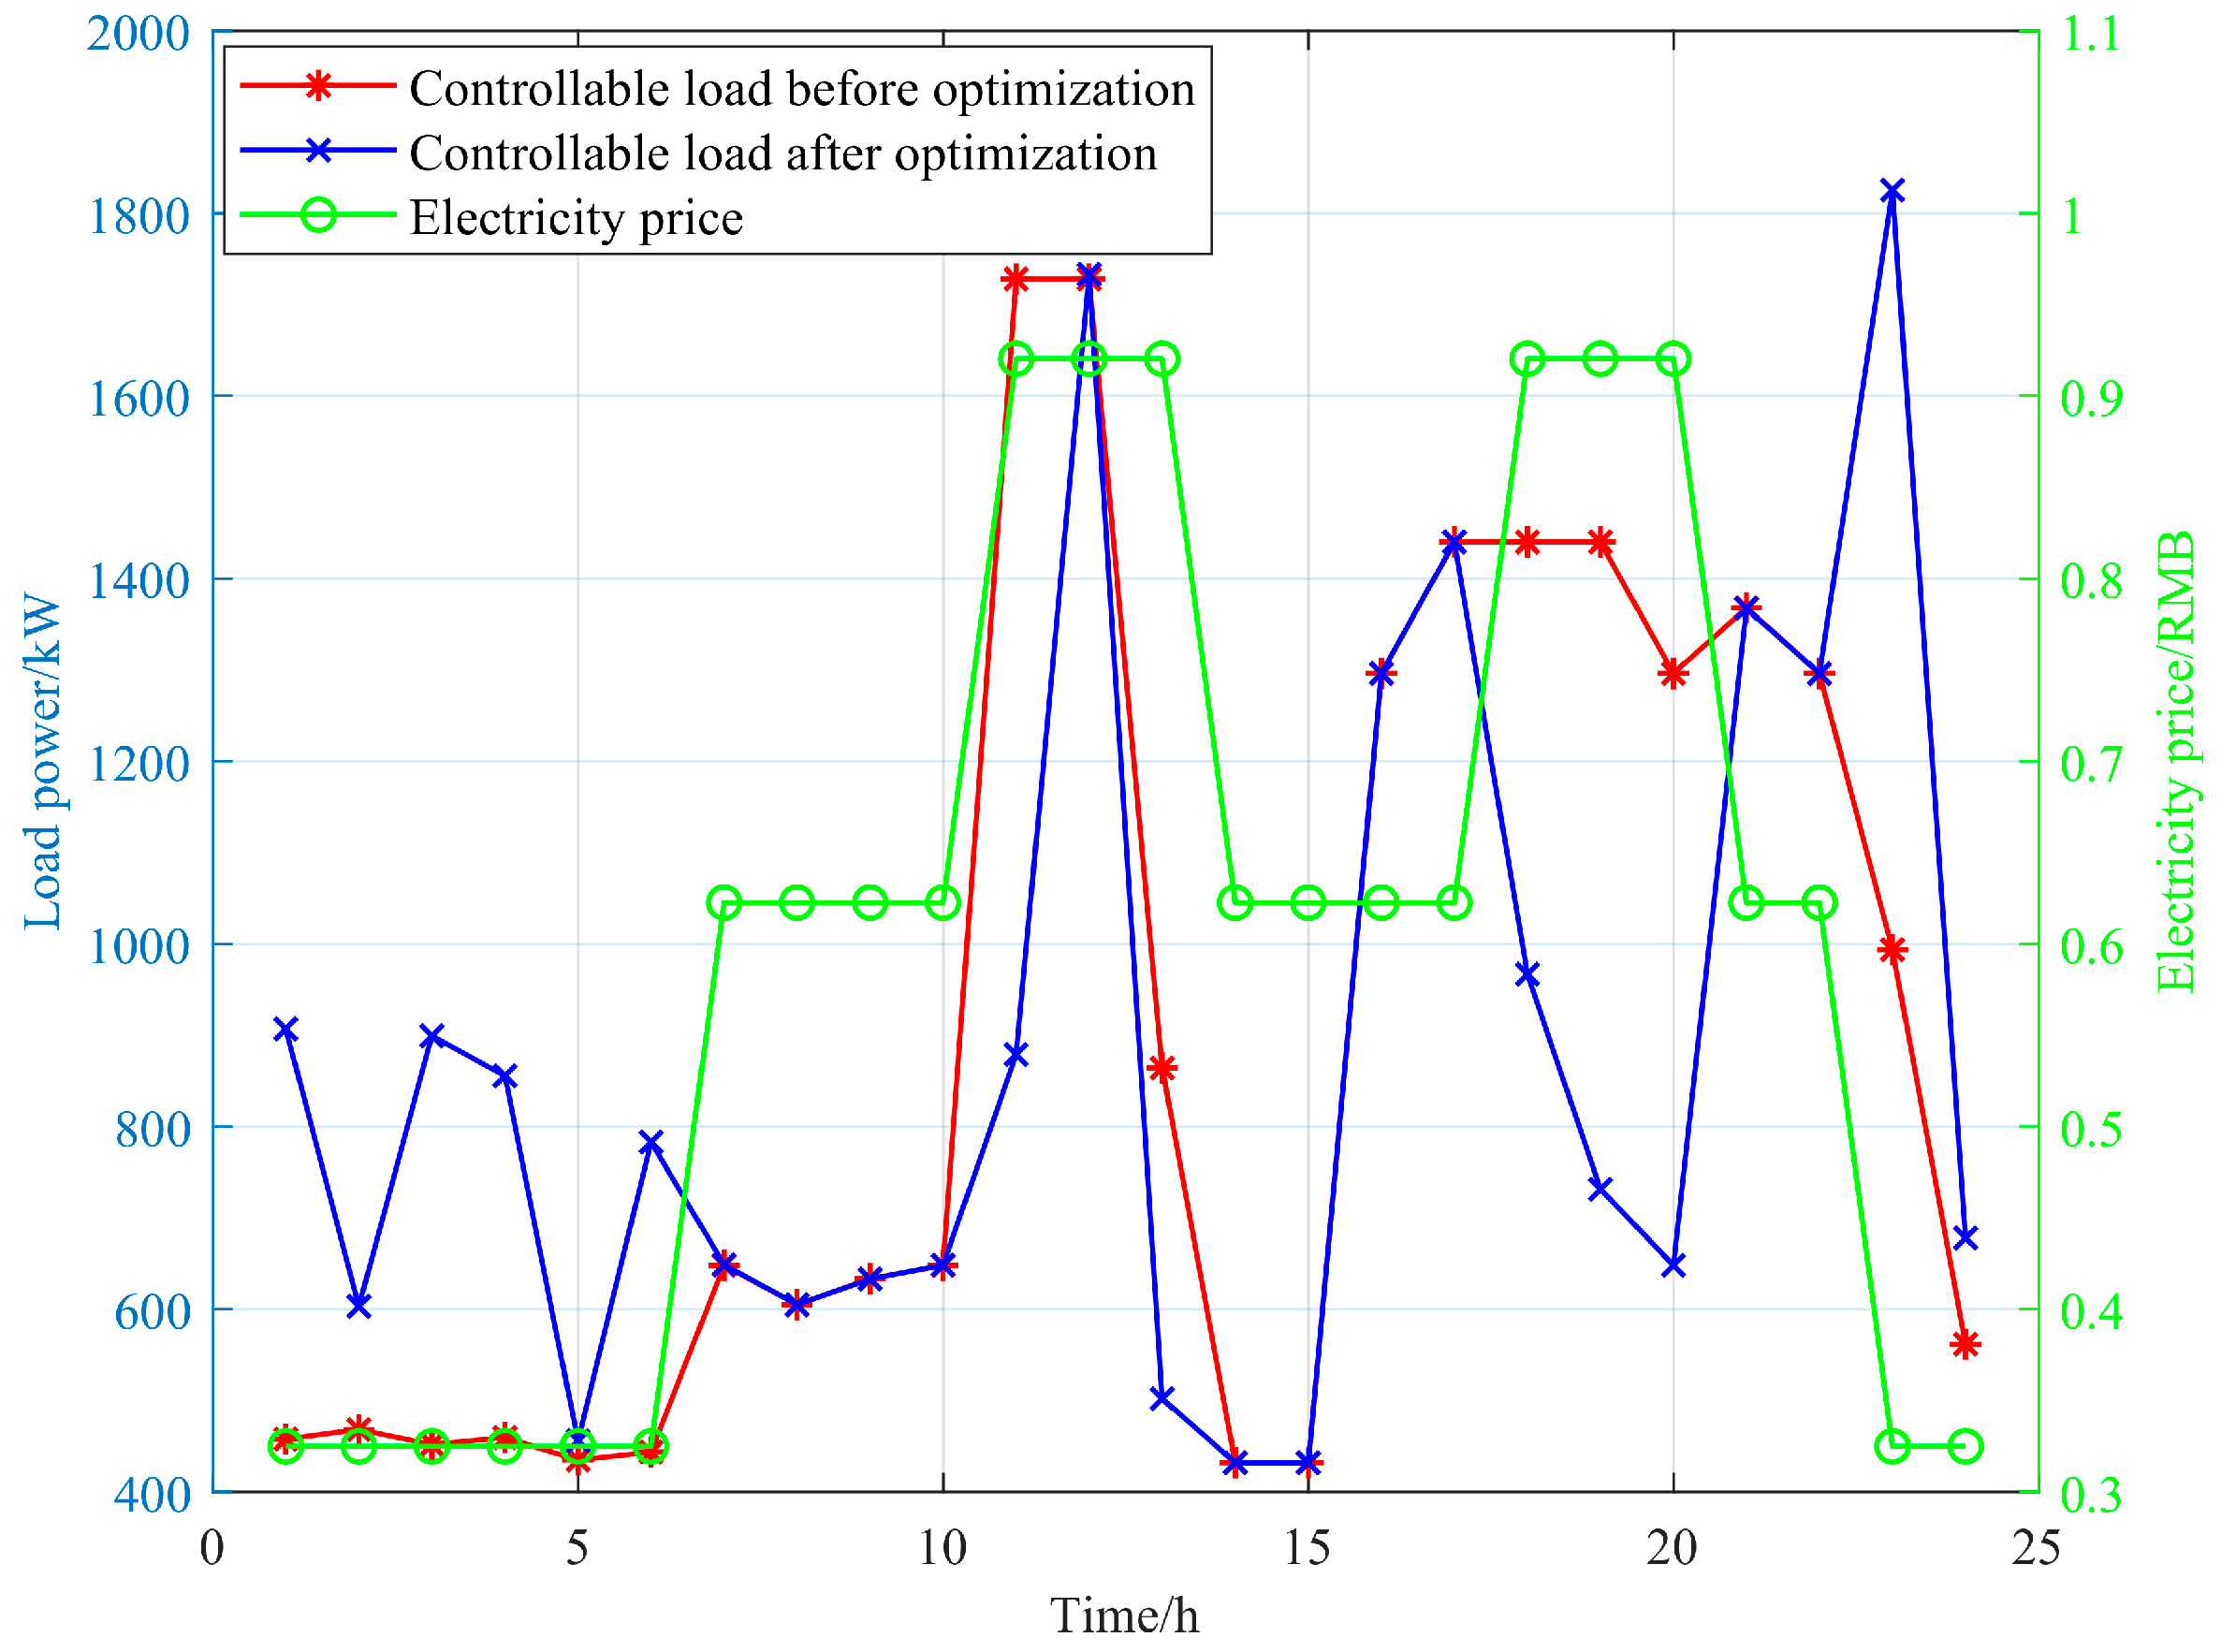
- Upper and lower bounds on controllable loads and total daily balance constraints:where and denote the controllable load before and after optimization; and denote the upper and lower limits of 0.5 and 2 times the controllable loads before optimization.
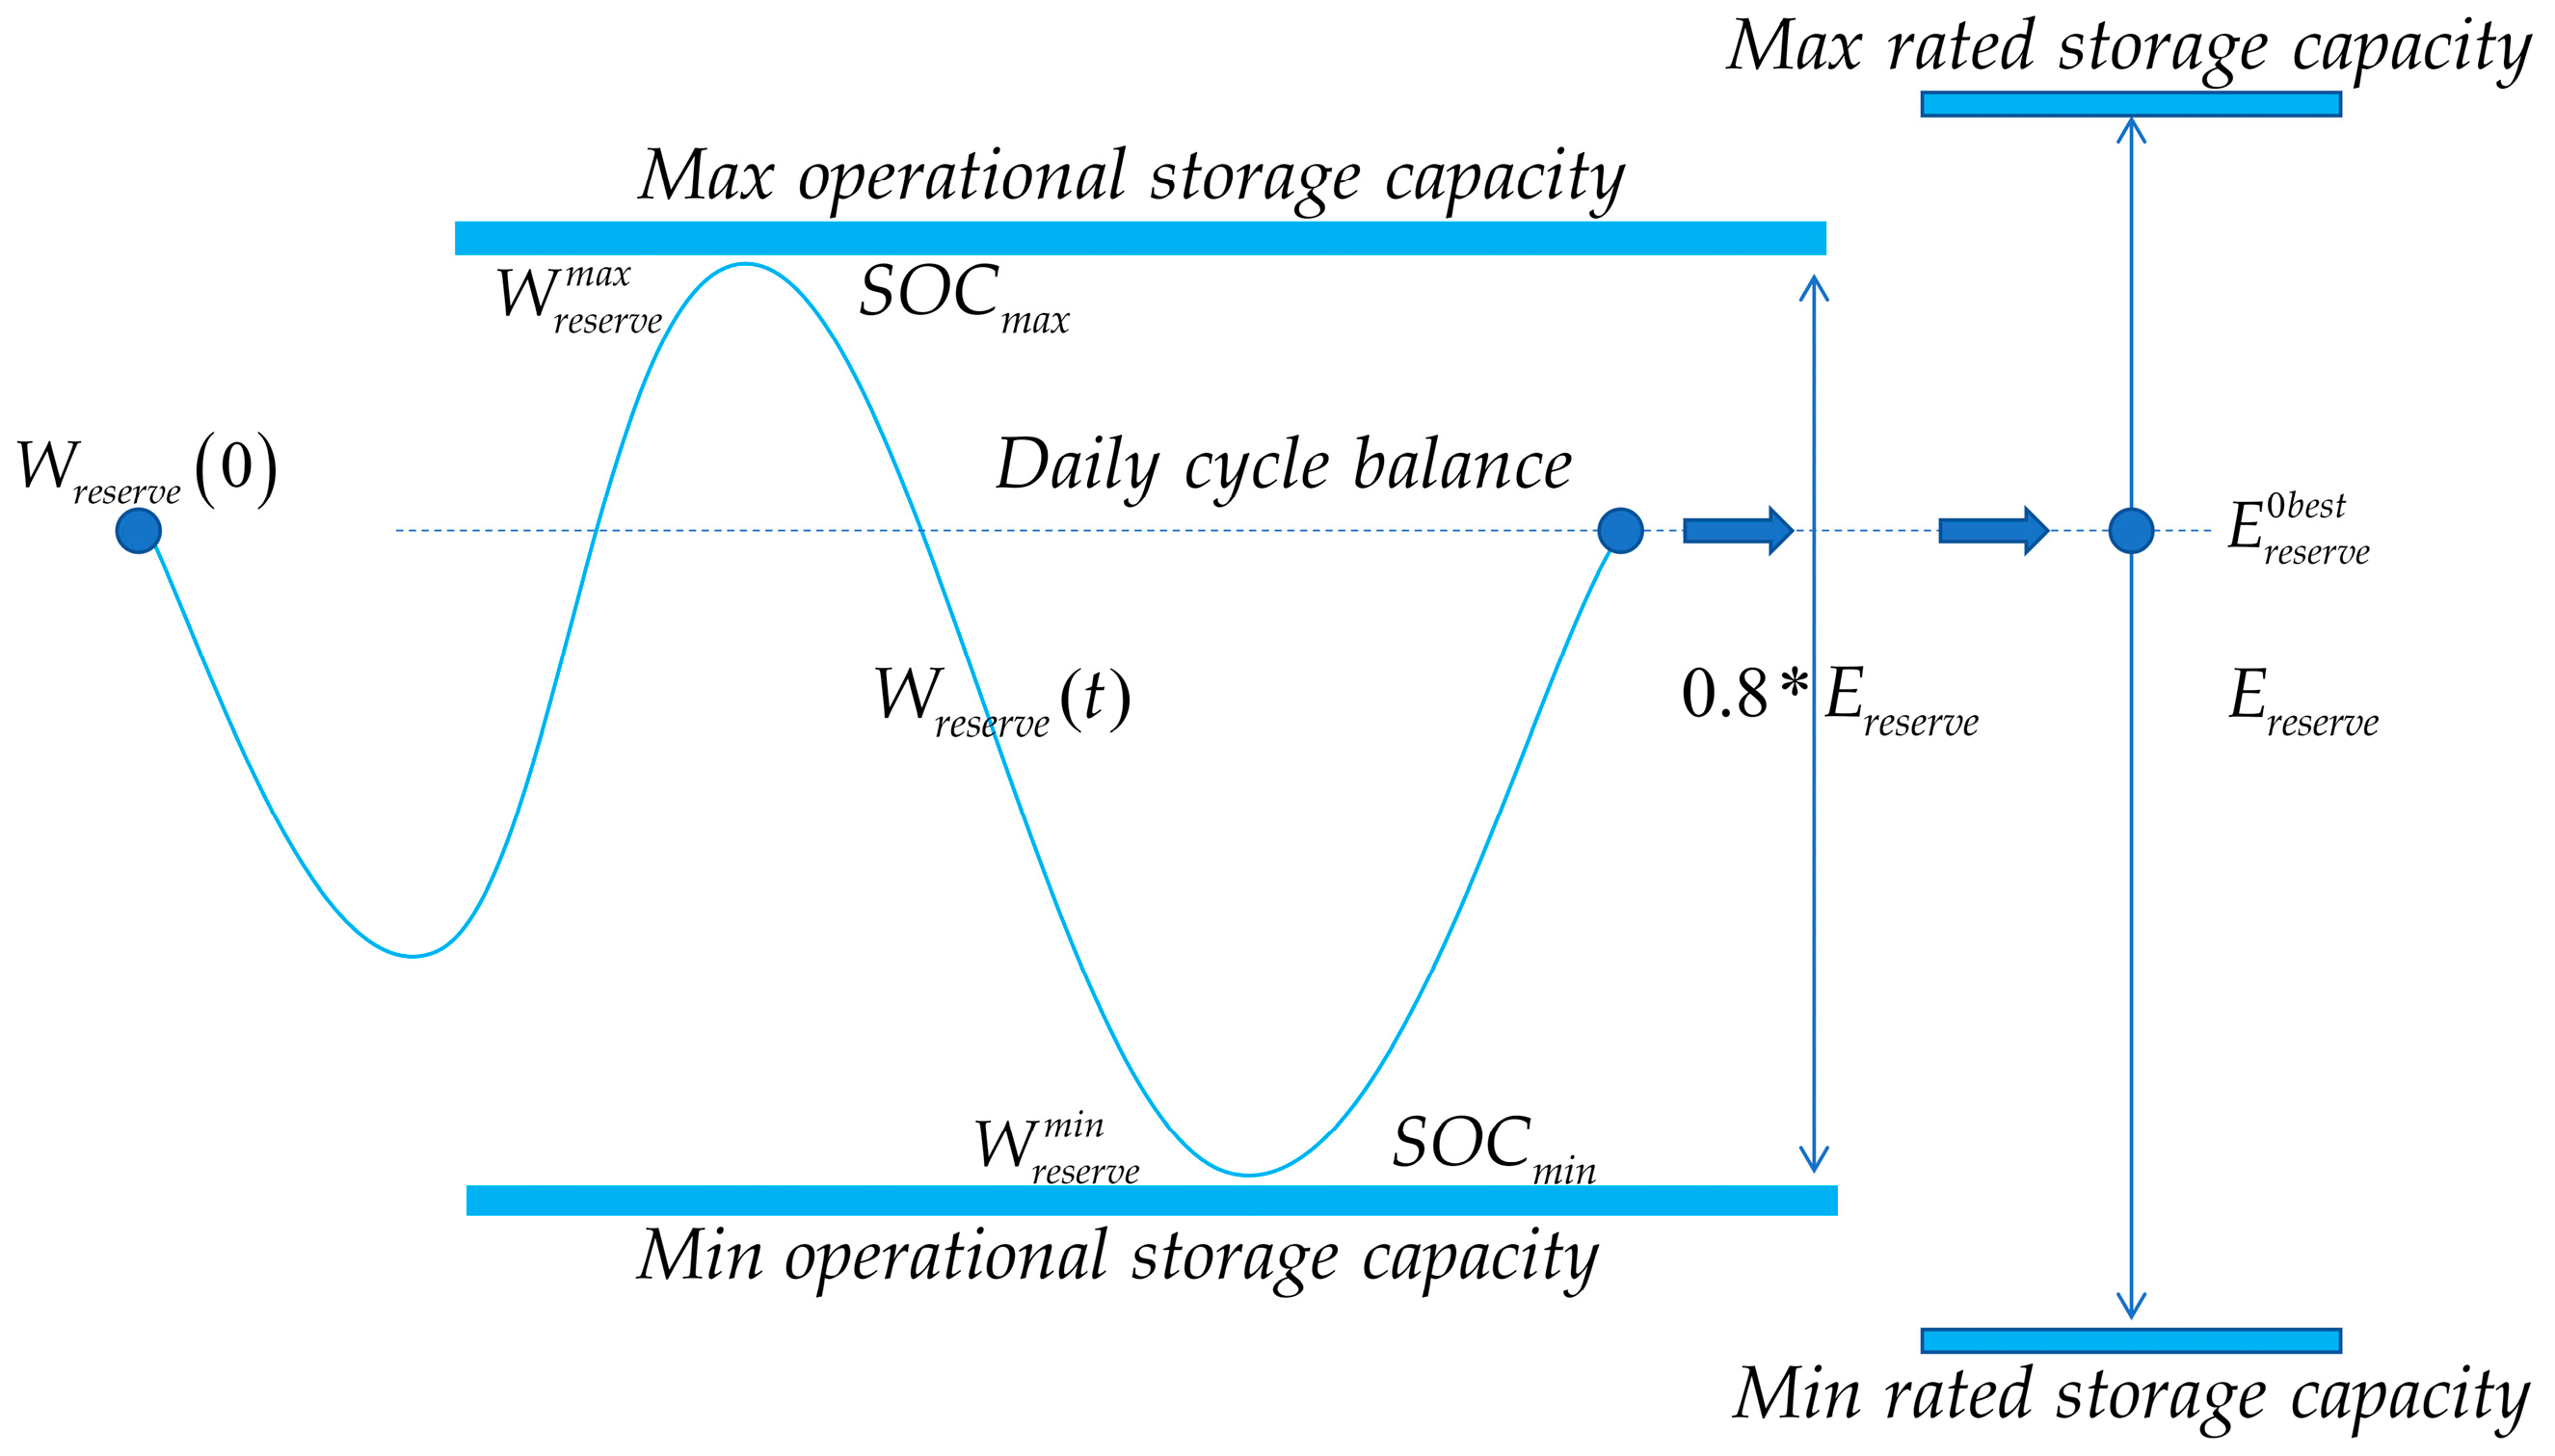
- Energy storage margin bands and daily start/end balance constraints of EV fleet:where denotes the storage surplus of the EV fleet after optimization.
- Charging and discharging power balance and upper and lower bound constraints of EV fleet:where and are the EV’s charging and discharging efficiency value of 0.9; denotes the charging or discharging power of the EV fleet; and denote the power of the EV fleet entering and leaving the grid; denotes the number of EVs connected to the grid at each time.
- Power balance constraints:where denotes the power supply from the grid to EVs and controllable loads.
4.1.2. Objective Function
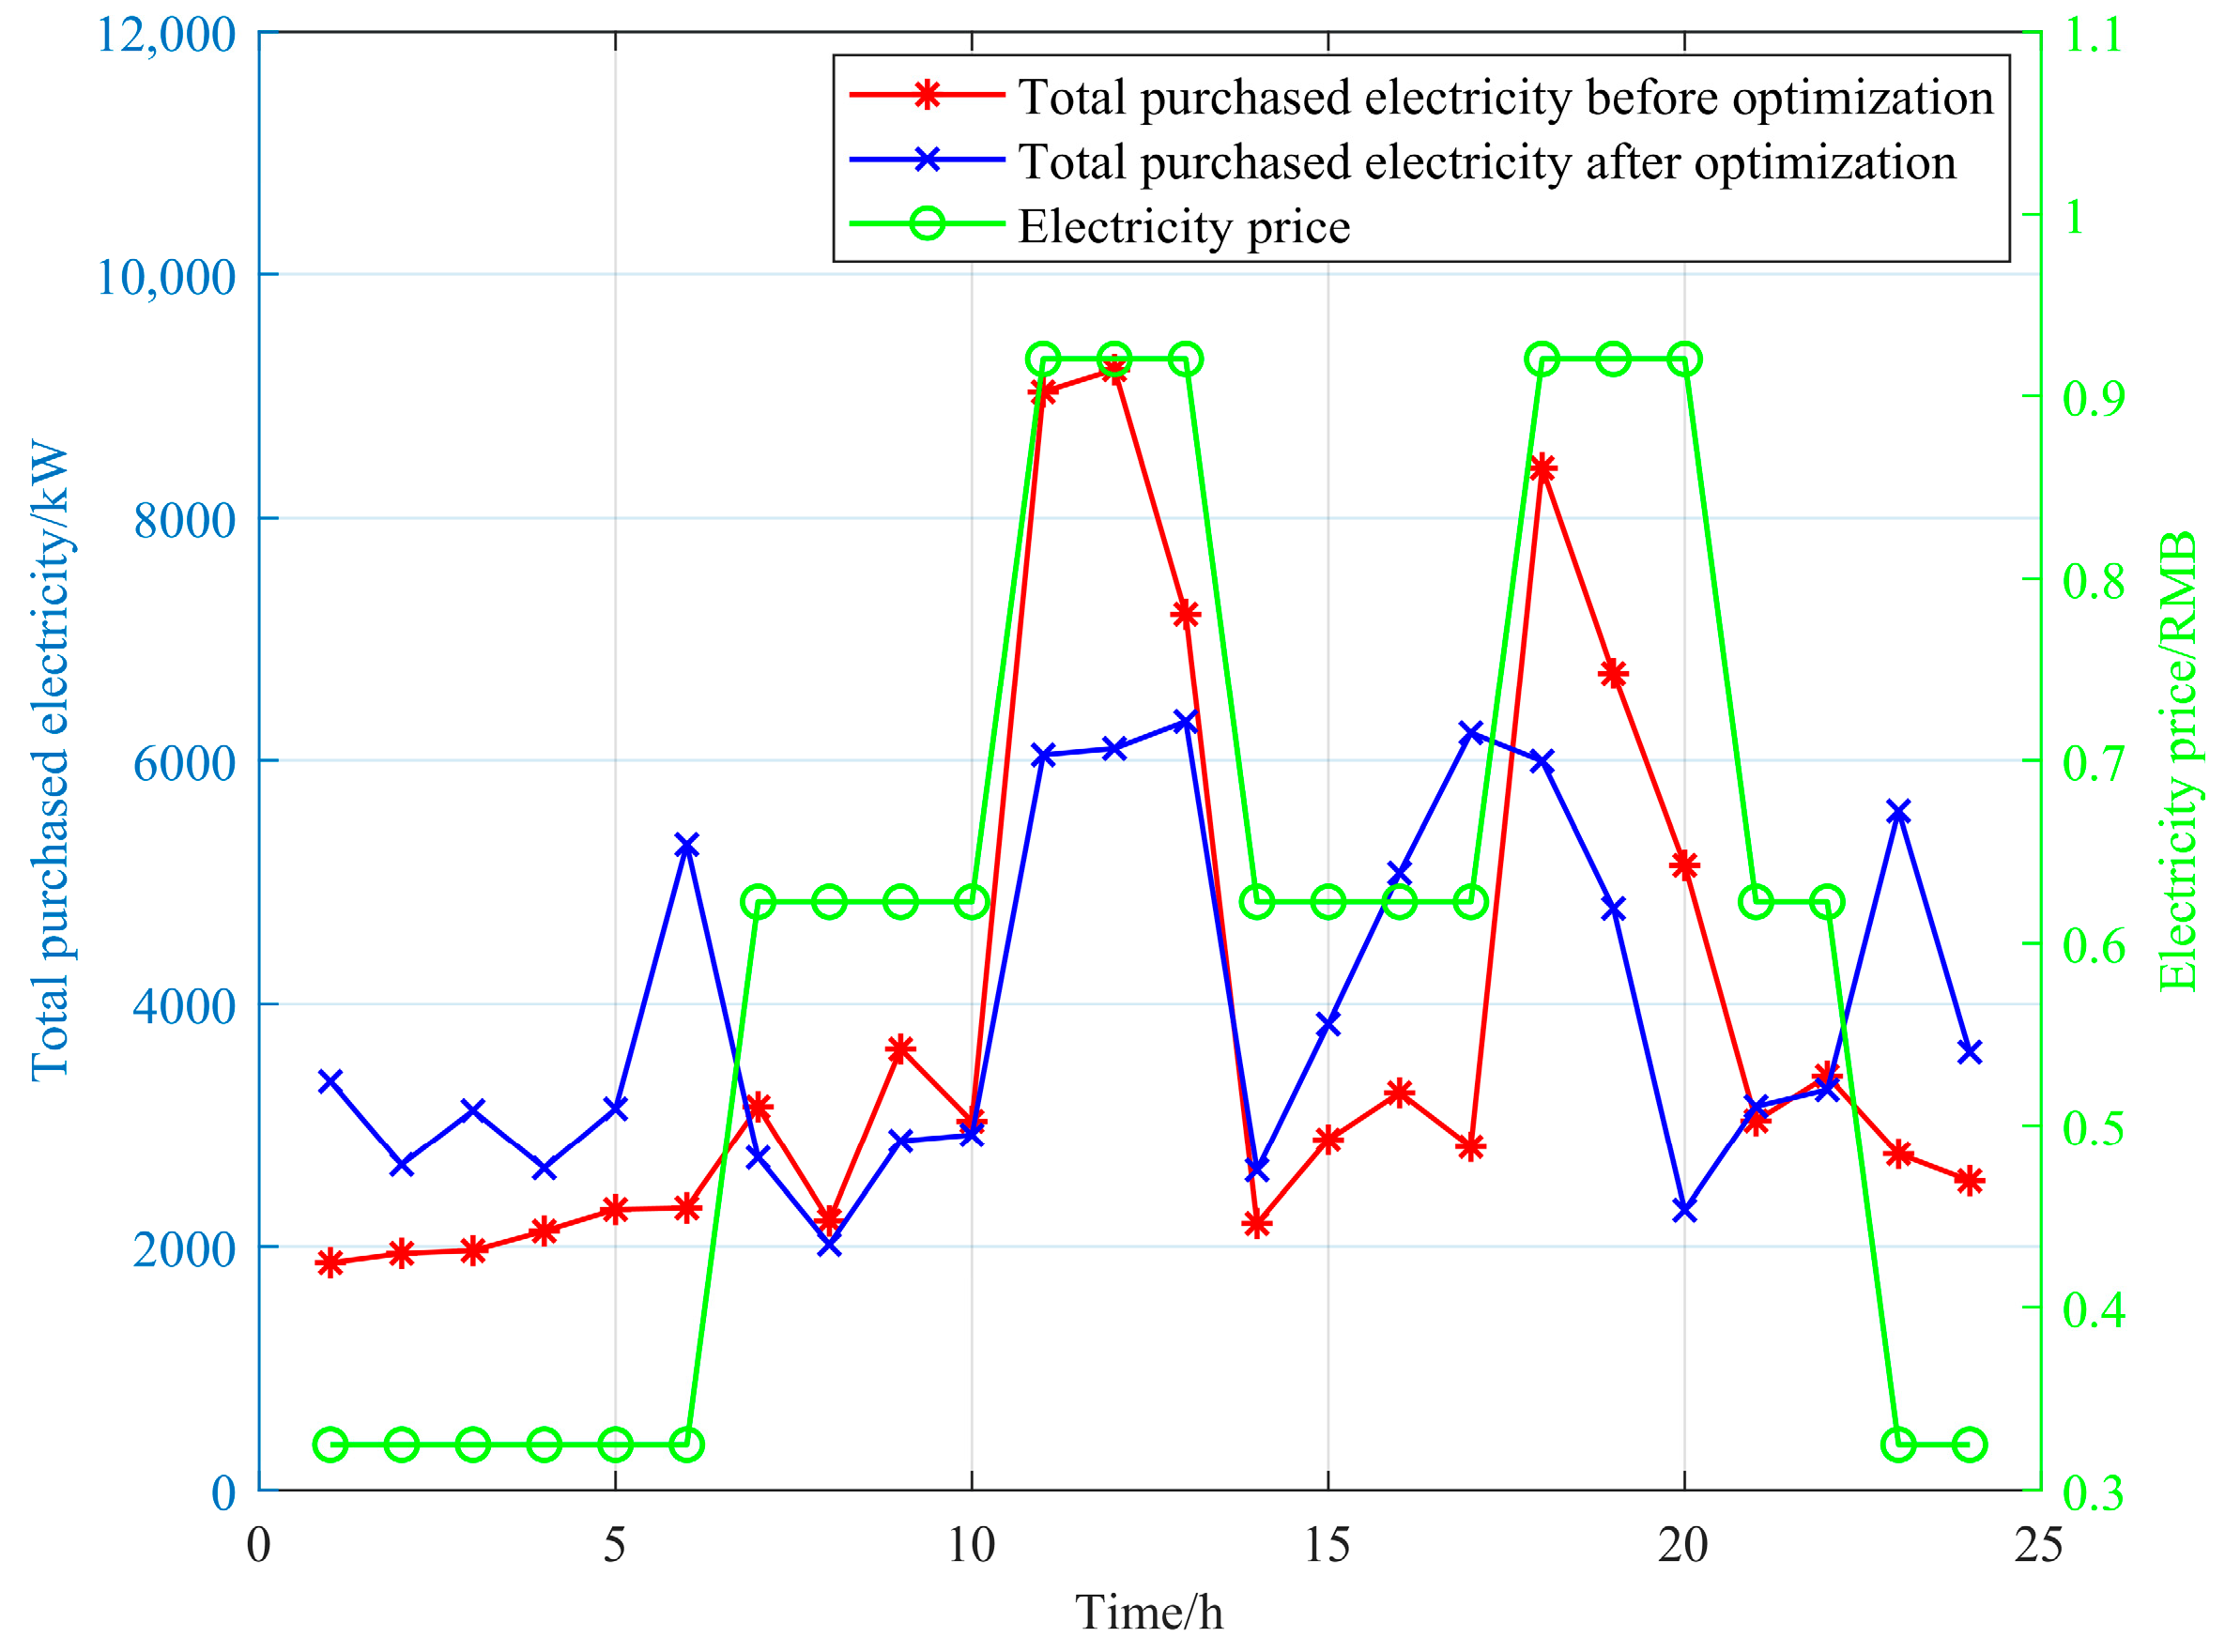
- Economy objective function: This function focuses solely on the total cost of purchased electricity for the EV and controllable load segments, ignoring the non-dispatchable fixed load factor.where is time-of-day tariffs.
- Comfort objective function: This function aims to reduce the fluctuation of controllable loads before and after dispatch while considering the user electricity demand.
4.2. CMOEA-MS Multi-Objective Optimization Algorithm
- Basic principles
- (1)
- Phase A: When most solutions are infeasible, equal priority is given to objectives and constraints, encouraging exploration across infeasible regions.
- (2)
- Phase B: Once most solutions are feasible, higher priority is given to constraints over objectives, guiding the search along feasible boundaries and refining solutions within the feasible region.
- 2.
- Key methods
- (1)
- Dynamic Fitness Assessment: The fitness evaluation is adjusted based on the phase, balancing exploration in Phase A and prioritizing feasibility in Phase B.
- (2)
- Shift-Based Density Estimation: Applied in Phase A to measure the minimum shift distance between solutions, maintaining diversity while ensuring convergence toward the feasible domain without excessively focusing on constraint satisfaction.
- (3)
- Constraint Violation Metrics: Quantifies constraint violations in both phases, guiding the selection process in Phase B to prioritize feasibility.
| Algorithm 1: Procedure of CMOEA-MS |
| 1. Initialize Population: Randomly generate an initial population and evaluate each individual’s fitness. 2. Parent Selection and Offspring Generation: Apply binary tournament selection to choose parents from the current population. Generate offspring through crossover and mutation operations; then, merge the offspring with the current population to create a new generation. 3. Feasibility Check: Calculate the proportion of feasible solutions in the population. If the proportion of feasible solutions is less than λ, proceed to Stage A; otherwise, proceed to Stage B. 4. Stage A: In this stage, density estimation and constraint violation are fitness evaluation metrics, treating goal optimization and constraint satisfaction equally. 5. Stage B: In this stage, apply the constraint dominance principle to prioritize feasible solutions, ensuring that constraints are satisfied first. 6. Following Generation Selection: If the conditions are met, select the best-adapted individuals from the current population to form the next generation. 7. Termination: If the maximum number of iterations or other termination criteria are met, end the algorithm and output the final population. Otherwise, return to step 2 to continue the process. |
4.3. Nash-Topsis Method for Solving Pareto Frontier Solutions
4.3.1. The Nash Negotiation Game
4.3.2. Nash-Topsis Method
- (1)
- The max-min normalization method is used to scale data of different magnitudes to the same range, thereby eliminating the impact of magnitude on the analysis results.where denotes the standard utility function after max-min normalization.
- (2)
- Based on the properties of the indicators, positive and negative ideal solutions are identified:where and denote the positive and negative ideal solutions; and are the set of benefit and cost indicators.
- (3)
- The Nash metrics of the scenarios versus the ideal solution are calculated:where and denote Nash metrics of the scenarios versus the ideal and non-ideal solution.
- (4)
- The relative closeness is calculated and ranked, and the optimal solution is selected:where denotes the relative closeness; denotes the optimal solution.
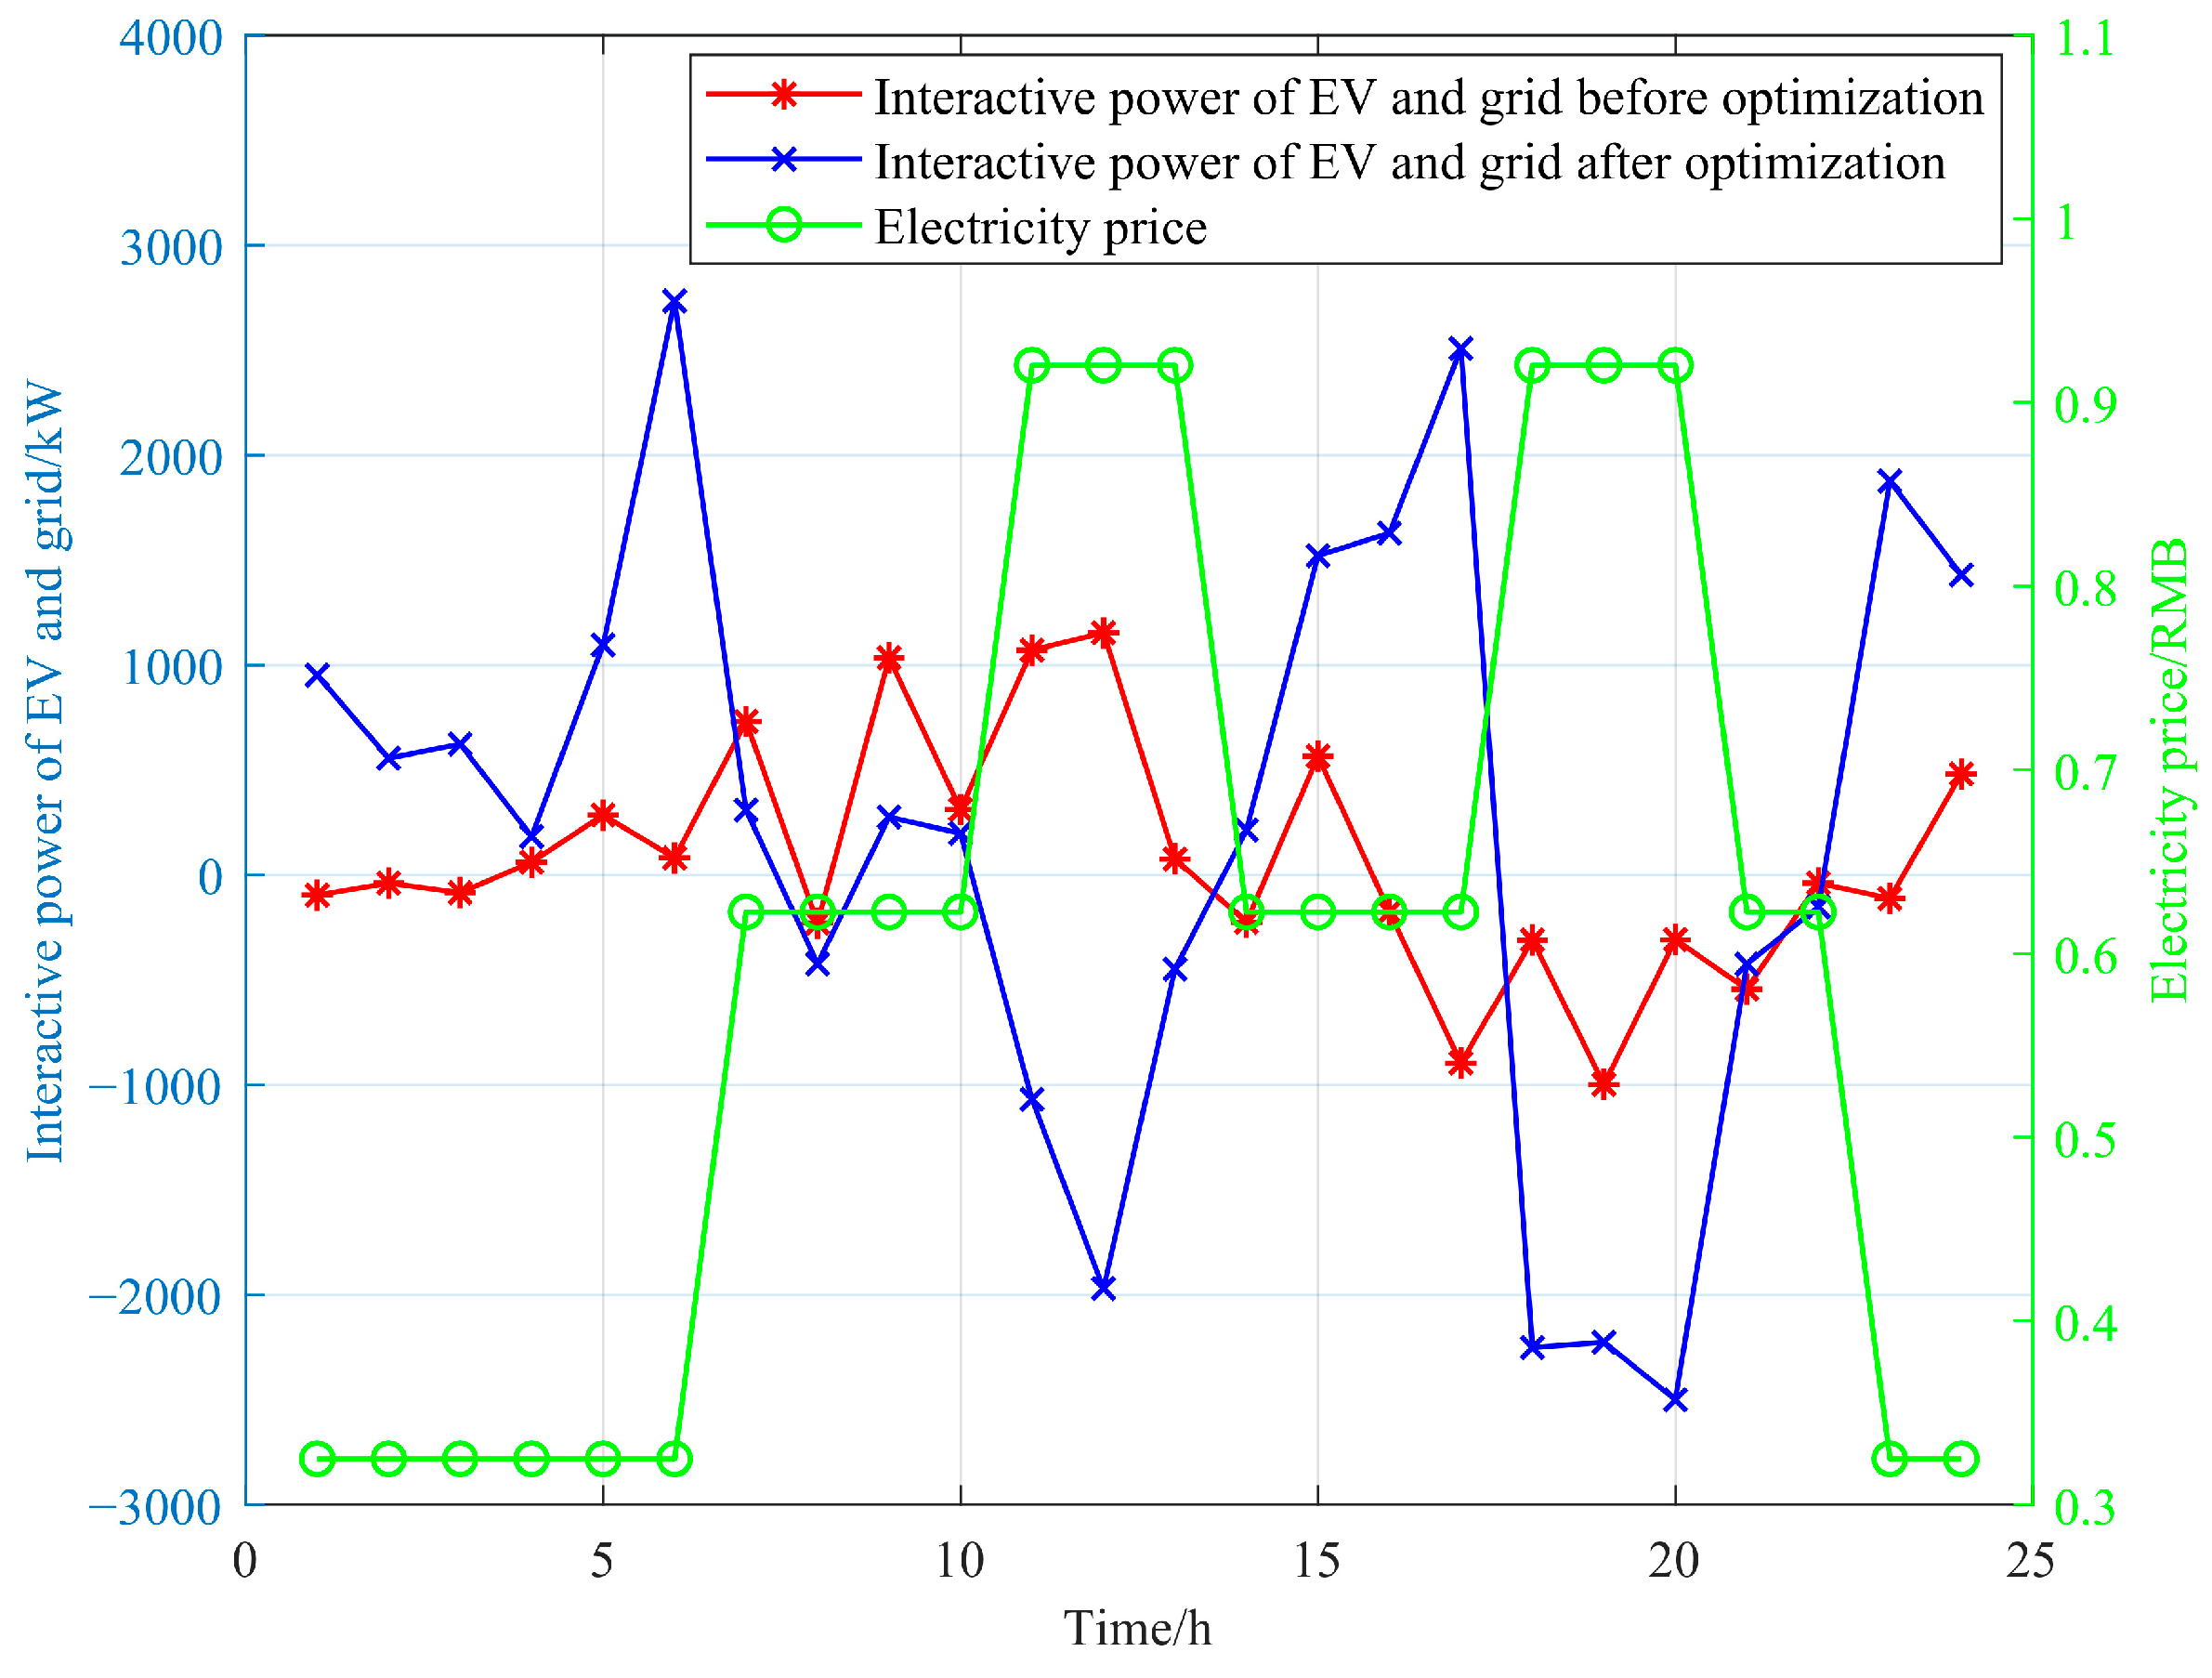
4.4. Analysis of Optimization Results from Single-Microgrid Simulation
5. Collaborative Optimization for Storage Management and Energy Interconnection in a Distributed Multi-Microgrid
5.1. Dynamic Optimization Mechanism for Energy Storage Based on State Mapping
5.2. Collaborative Optimization Method for Storage Management and Energy Interconnection
5.2.1. Restrictive Condition
- (1)
- Self-power and interacting power constraints:where denotes the interaction power supply from the storage.
- (2)
- Power supply interaction switching constraints:
- (3)
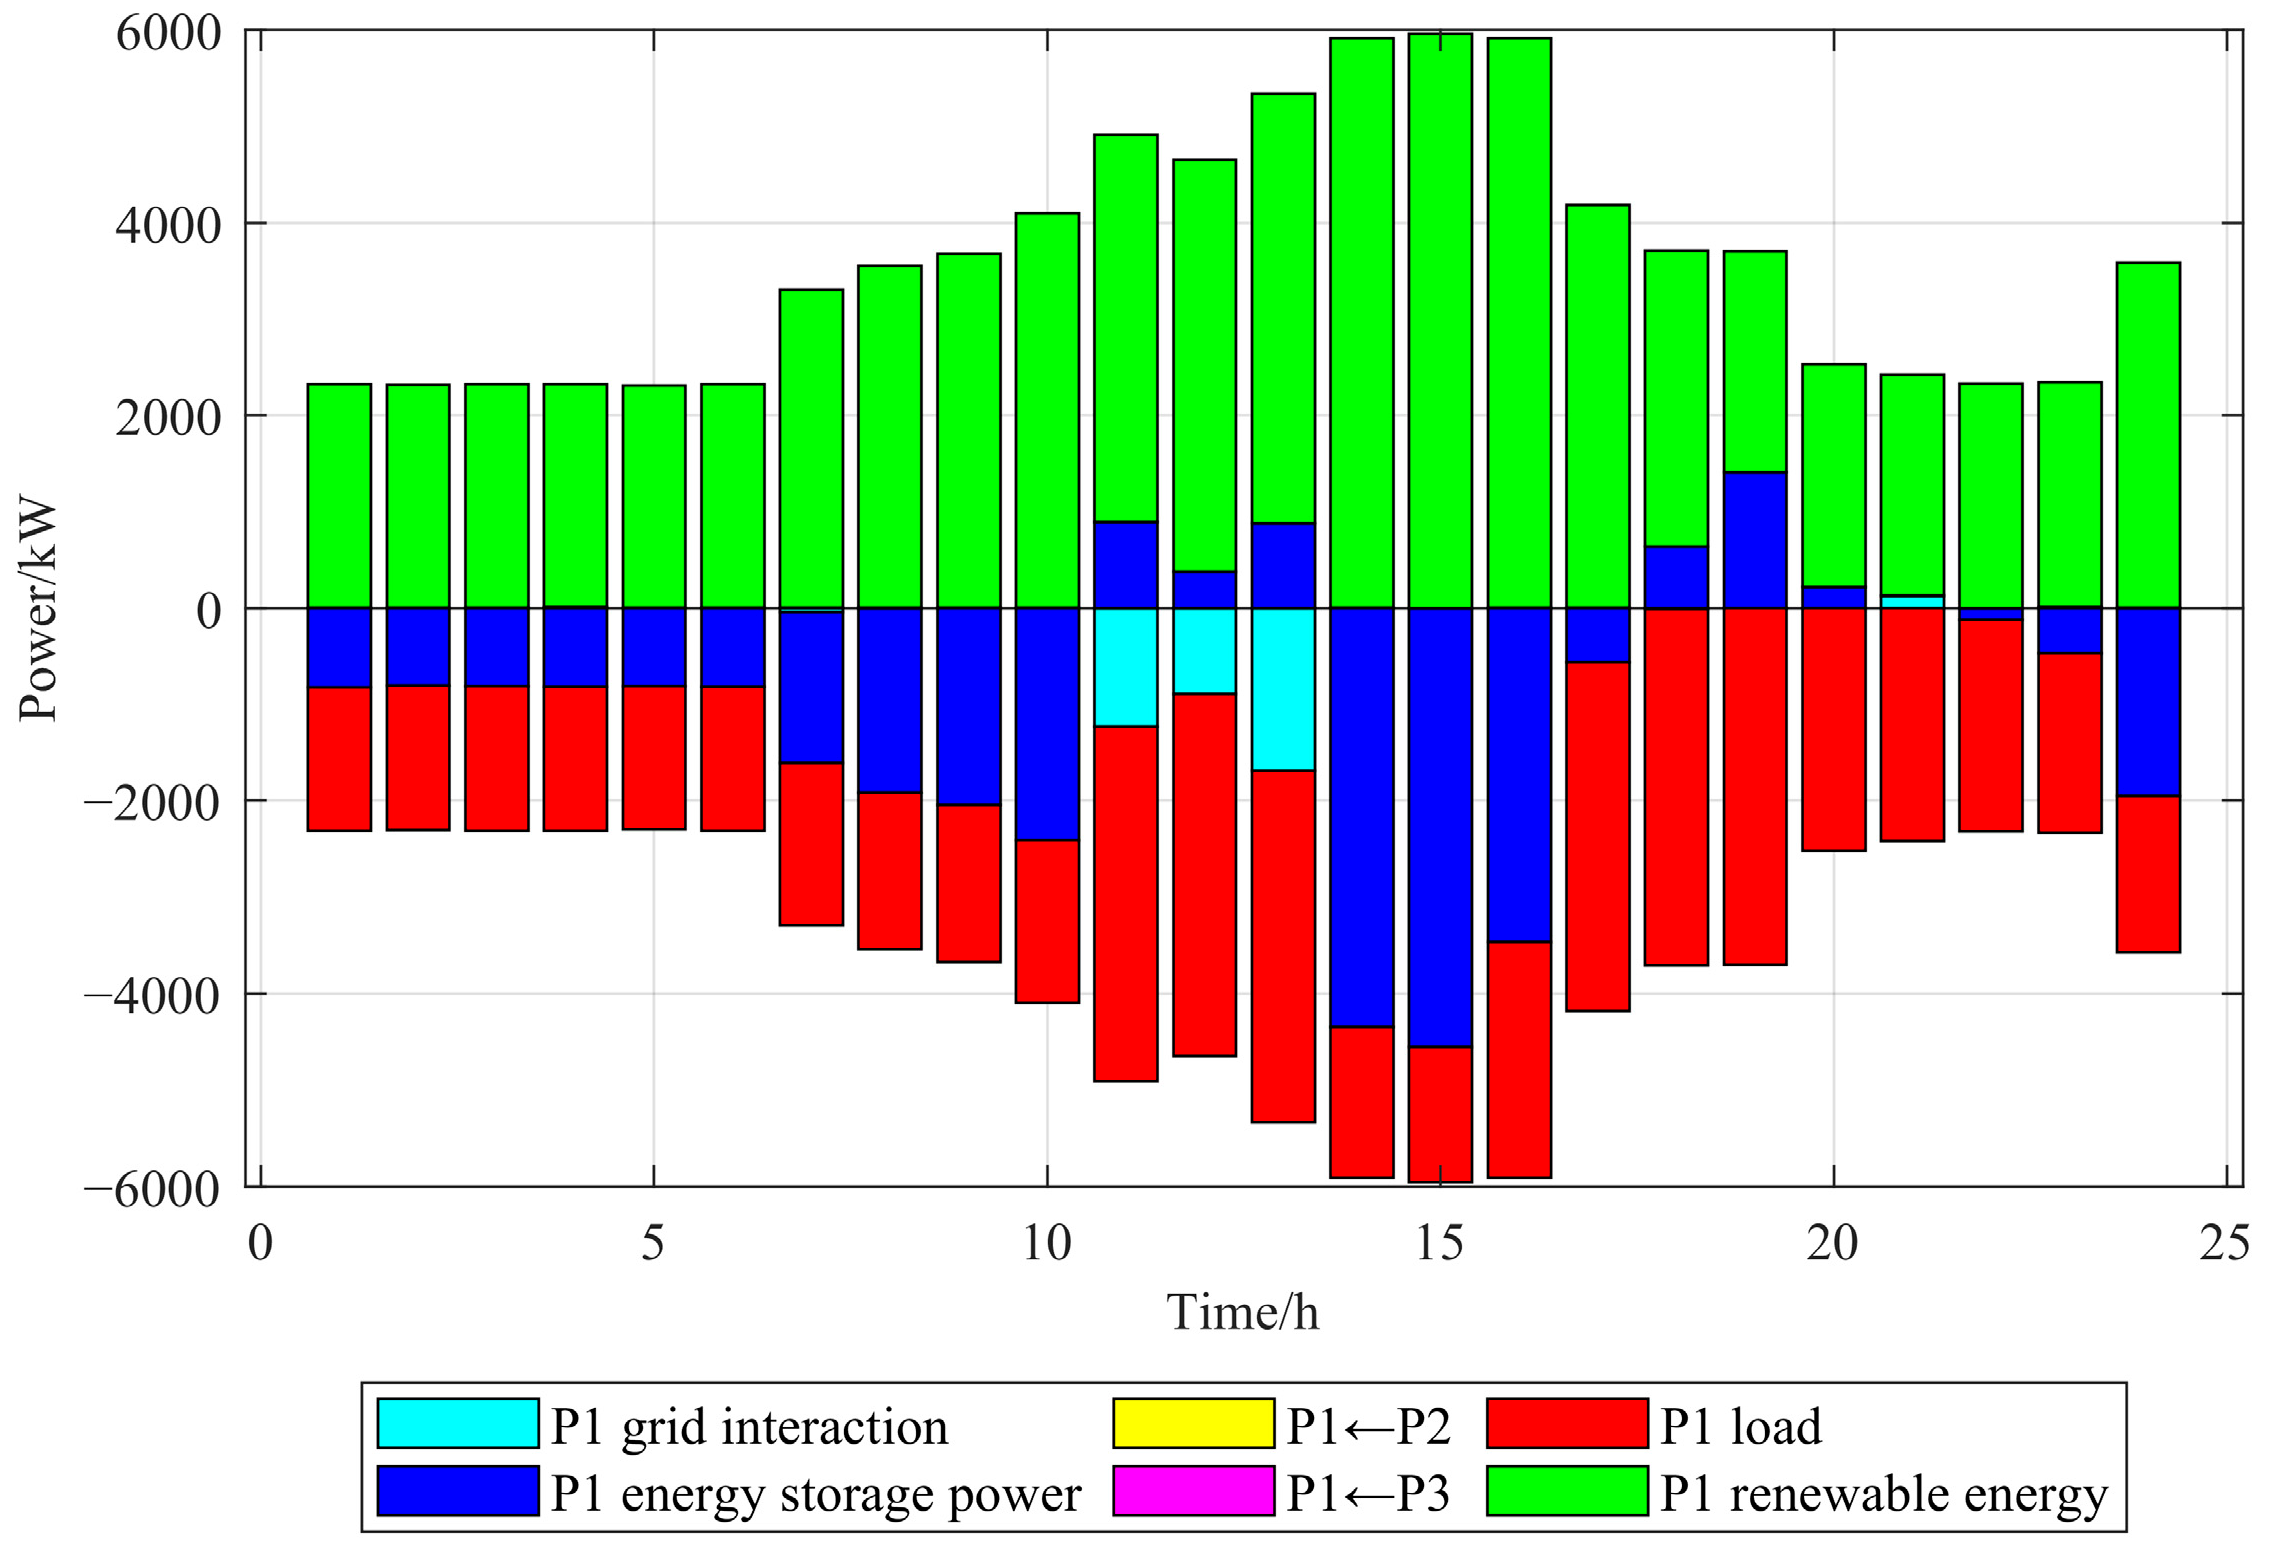
- Power balance constraints:where denotes the power purchased from the grid.
- (4)
- SOC cyclic balance constraints:
5.2.2. Objective Function
5.3. IMODE Single-Objective Optimization Algorithm
- Basic principles
- (1)
- Multi-Operator Cooperative Evolution: The initial population is partitioned into sub-populations, each evolving under a distinct DE mutation strategy, and individuals are reallocated adaptively based on the performance of their operators.
- (2)
- Dynamic Resource Strategy: The population size decreases linearly to balance exploration and exploitation, with SQP local search applied in the final 15% of evaluations to finely adjust the current best solution.
- 2.
- Key methods
- (1)
- Dynamic Multi-Operator Resource Allocation: The operators are ranked by solution quality and diversity to allocate more individuals to high-performers, while parameter self-adapting mechanisms are incorporated to minimize manual tuning.
- (2)
- Diversity Preservation and Balance: An archive strategy is employed to retain historically inferior solutions, and random binomial or exponential crossover operators prevent premature convergence, maintaining an exploration–exploitation balance.
| Algorithm 2: Procedure of IMODE |
| 1. Initial Population Generation: Generate an initial population randomly and divide it into sub-populations. 2. Sub-population Mutation: Assign each sub-population a different differential evolution (DE) mutation strategy to generate new candidate solutions. 3. Solution Evaluation: Calculate new solutions’ objective function values, compare with current individuals, and select the better solution to proceed to the next generation. 4. Adaptive Operator Adjustment: Dynamically adjust the operator allocation based on the quality and diversity ratio of the population. 5. Population Size Reduction: Gradually reduce the population size to accelerate convergence during the evolutionary process. 6. Local Optimization: Apply the SQP method to refine the optimal solution during the final 15% of the evolution process. 7. Termination: If the maximum number of function evaluations is reached or other termination criteria are met, output the optimal solution. Otherwise, continue the iteration. |
5.4. Analysis of Optimization Results from Multi-Microgrid Simulation
6. Conclusions
- (1)
- Building on the EV storage margin band within a single microgrid to facilitate EV-to-grid interaction, the lower layer explores a cooperative operation mechanism that integrates EV-to-grid interaction with controllable load dispatch. An adaptive optimization method for EV storage operation and demand response is proposed to leverage the energy storage capabilities of EVs while harnessing the potential of demand-side management. Through the dispatch of 13.4% of the controllable loads, this method accomplishes effective peak shaving and valley filling with a negligible impact on user comfort. Consequently, it achieves a 38.5% reduction in the total electricity cost associated with the user’s EVs and controllable loads, significantly improving the microgrid system’s economic efficiency and operational stability.
- (2)
- Building on the EV–load management strategy at the lower microgrid layer, the upper layer further develops a synchronous optimization mechanism for energy storage operation and configuration. A dynamic optimization mechanism based on state mapping is proposed, where the operational state of the energy storage system is mapped to the configuration objectives, enabling a simultaneous optimization solution. This method significantly enhances the SOC utilization rate of energy storage and improves the economic efficiency of the configuration, ultimately achieving optimal storage management.
- (3)
- Additionally, as the distributed interconnected structure of the multi-microgrid can maximize the dispatch potential of energy storage, a collaborative optimization method for storage management and energy interconnection is proposed based on a comprehensive exploration of their synergistic operation mechanism. By simultaneously maximizing resource utilization and economic performance, this method effectively reduces excess energy waste and enhances power resource management. Consequently, the total system operating cost is reduced by 22.1%, significantly enhancing the overall system’s resource utilization and economic performance.
Author Contributions
Funding
Data Availability Statement
Conflicts of Interest
References
- Ntombela, M.; Musasa, K.; Moloi, K. A Comprehensive Review of the Incorporation of Electric Vehicles and Renewable Energy Distributed Generation Regarding Smart Grids. World Electr. Veh. J. 2023, 14, 176. [Google Scholar] [CrossRef]
- Abbasi, A.R.; Baleanu, D. Recent developments of energy management strategies in microgrids: An updated and comprehensive review and classification. Energy Conv. Manag. 2023, 297, 117723. [Google Scholar] [CrossRef]
- Nie, Y.; Li, Z.; Zhang, J.; Gao, L.; Li, Y.; Zhou, H. Optimal Dispatch Strategy for a Multi-Microgrid Cooperative Alliance Using a Two-Stage Pricing Mechanism. IEEE Trans Sustain. Energy 2025, 16, 174–188. [Google Scholar] [CrossRef]
- Piamvilai, N.; Sirisumrannukul, S. Load Profile Simulations for Smart Charging of Electric Vehicles Considering Driving Behavior and Vehicle Performance. In Proceedings of the 2021 3rd International Conference on Smart Power Internet Energy Systems (SPIES), Shanghai, China, 25–28 September 2021; pp. 337–342. [Google Scholar] [CrossRef]
- Iordanis, I.; Koukouvinos, C.; Silou, I. Classification accuracy improvement using conditioned Latin Hypercube Sampling in Supervised Machine Learning. In Proceedings of the 2022 12th International Conference on Dependable Systems, Services and Technologies (DESSERT), Athens, Greece, 9–11 December 2022; pp. 1–5. [Google Scholar] [CrossRef]
- Li, S.; Zhao, P.; Gu, C.; Bu, S.; Li, J.; Cheng, S. Integrating Incentive Factors in the Optimization for Bidirectional Charging of Electric Vehicles. IEEE Trans. Power Syst. 2024, 39, 4105–4116. [Google Scholar] [CrossRef]
- Chatuanramtharnghaka, B.; Deb, S.; Singh, K.R.; Ustun, T.S.; Kalam, A. Reviewing Demand Response for Energy Management with Consideration of Renewable Energy Sources and Electric Vehicles. World Electr. Veh. J. 2024, 15, 412. [Google Scholar] [CrossRef]
- Kamrani, F.; Fattaheian-Dehkordi, S.; Gholami, M.; Abbaspour, A.; Fotuhi-Firuzabad, M.; Lehtonen, M. A Two-Stage Flexibility-Oriented Stochastic Energy Management Strategy for Multi-Microgrids Considering Interaction With Gas Grid. IEEE Trans. Eng. Manag. 2023, 70, 3330–3343. [Google Scholar] [CrossRef]
- Yan, D.; Li, T.; Ma, C.; Lai, L.L.; Tsang, K.F. Cost Effective Energy Management of Home Energy System with Photovoltaic-Battery and Electric Vehicle. In Proceedings of the IECON 2020 the 46th Annual Conference of the IEEE Industrial Electronics Society, Singapore, 18–21 October 2020; pp. 3611–3616. [Google Scholar] [CrossRef]
- Chen, G.; Zhang, Z. Control Strategies, Economic Benefits, and Challenges of Vehicle-to-Grid Applications: Recent Trends Research. World Electr. Veh. J. 2024, 15, 190. [Google Scholar] [CrossRef]
- Shen, Y.; Gu, C.; Ma, Z.; Yang, X.; Zhao, P. A Two-Stage Resilience Enhancement for Distribution Systems Under Hurricane Attacks. IEEE Syst. J. 2021, 15, 653–661. [Google Scholar] [CrossRef]
- Ma, T.; Pei, W.; Xiao, H.; Li, D.; Lyu, X.; Hou, K. Cooperative Operation Method for Wind-solar-hydrogen Multi-agent Energy System Based on Nash Bargaining Theory. Proc. CSEE 2021, 41, 25–39. [Google Scholar] [CrossRef]
- Zame, K.K.; Brehm, C.A.; Nitica, A.T.; Richard, C.L.; Iii, G.D.S. Smart grid and energy storage: Policy recommendations. Renew. Sust. Energ. Rev. 2018, 82, 1646–1654. [Google Scholar] [CrossRef]
- Shi, X.; Shi, X.; Dong, W.; Peng, Z.; Jia, H.; Wu, J.; Wang, Y. Research on Energy Storage Configuration Method Based on Wind and Solar Volatility. In Proceedings of the 2020 10th International Conference on Power and Energy Systems (ICPES), Chengdu, China, 25–27 December 2020; pp. 464–468. [Google Scholar] [CrossRef]
- Dou, X.; Fan, D.; Wang, J.; Zhang, Z. An Integrated Energy Storage Configuration Method for Integrated Energy Service Providers Considering Return on Investment and Medium- and Long-Term Demand Response. In Proceedings of the 2021 IEEE/IAS Industrial and Commercial Power System Asia (ICPS Asia), Chengdu, China, 18–21 July 2021; pp. 229–234. [Google Scholar] [CrossRef]
- Wan, Q.; Shi, C. Research on Distributed Optimization and Dispatch Strategy for Grid-Connected Microgrid Cluster Based on Alternating Direction Method of Multipliers. In Proceedings of the 2024 3rd International Conference on Energy, Power and Electrical Technology (ICEPET), Chengdu, China, 17–19 May 2024; pp. 611–615. [Google Scholar] [CrossRef]
- Fang, K.; Zhou, M.; Wu, Z.; Zhao, C.; Zhao, H.; Li, G. Optimal Planning and Cost-benefit Analysis of Long-duration Energy Storage for Low-carbon Electric Power System. Proc. CSEE 2023, 43, 8282–8294. [Google Scholar] [CrossRef]
- Chen, T.; Bu, S.; Liu, X.; Kang, J.; Yu, F.R.; Han, Z. Peer-to-Peer Energy Trading and Energy Conversion in Interconnected Multi-Energy Microgrids Using Multi-Agent Deep Reinforcement Learning. IEEE Trans. Smart Grid 2022, 13, 715–727. [Google Scholar] [CrossRef]
- Hamidi, M.; Raihani, A.; Bouattane, O.; Al-Olama, S.S. Analyzing Microgrid Energy Profile Behavior to Study a Shared Energy Management System Based on AI: Dubai buildings Case Study. In Proceedings of the 2023 Middle East and North Africa Solar Conference (MENA-SC), Dubai, United Arab Emirates, 15–18 November 2023; pp. 1–7. [Google Scholar] [CrossRef]
- Ge, S.; Lian, H.; Liu, H.; Guo, J.; Han, J.; Li, H. Timing Response Capability Model and Control Method of Electric Vehicle. Autom. Electr. Power Syst. 2016, 40, 33–38. [Google Scholar] [CrossRef]
- Xiao, H.; Ouyang, J.; Li, S.; Huang, Z. Application of Improved Latin Hypercube Sampling in Reliability Assessment of Generation and Transmission Systems. In Proceedings of the 2023 6th International Conference on Energy, Electrical and Power Engineering (CEEPE), Guangzhou, China, 12–14 May 2023; pp. 231–236. [Google Scholar] [CrossRef]
- Chen, S.; Li, C.; Zhuo, S. A distributed coverage algorithm for multi-UAV with average Voronoi partition. In Proceedings of the 2017 17th International Conference on Control, Automation and Systems (ICCAS), Jeju, Republic of Korea, 18–21 October 2017; pp. 1083–1086. [Google Scholar] [CrossRef]
- Abbas, A.H.; Ahmed, A.J.; Rashid, S.A. A Cross-Layer Approach MAC/NET with Updated-GA (MNUG-CLA)-Based Routing Protocol for VANET Network. World Electr. Veh. J. 2022, 13, 87. [Google Scholar] [CrossRef]
- Wu, X. Research on the Influence of Crossover Probability and Mutation Probability in GA-SVM Model. In Proceedings of the 2019 IEEE 9th International Conference on Electronics Information and Emergency Communication (ICEIEC), Beijing, China, 12–14 July 2019; pp. 1–7. [Google Scholar] [CrossRef]
- U.S. Department of Transportation. National Household Travel Survey. Available online: http://nhts.ornl.gov (accessed on 1 October 2024).
- Tian, Y.; Zhu, W.; Zhang, X.; Jin, Y. A practical tutorial on solving optimization problems via PlatEMO. Neurocomputing 2022, 518, 190–205. [Google Scholar] [CrossRef]
- Tian, Y.; Zhang, Y.; Su, Y.; Zhang, X.; Tan, K.C.; Jin, Y. Balancing Objective Optimization and Constraint Satisfaction in Constrained Evolutionary Multiobjective Optimization. IEEE Trans. Cybern. 2022, 52, 9559–9572. [Google Scholar] [CrossRef] [PubMed]
- Elhassouny, A.; Smarandache, F. Neutrosophic-simplified-TOPSIS Multi-Criteria Decision-Making using combined Simplified-TOPSIS method and Neutrosophics. In Proceedings of the 2016 IEEE International Conference on Fuzzy Systems (FUZZ-IEEE), Vancouver, BC, Canada, 24–29 July 2016; pp. 2468–2474. [Google Scholar] [CrossRef]
- Zhang, L.; Huang, R.; Wang, Z.; Tang, W.; Chen, Y. Optimal Configuration Strategy of Mobile Energy Storage in Distribution Network Considering Balance Between Resilience and Economy. Autom. Electr. Power Syst. 2020, 44, 23–31. [Google Scholar] [CrossRef]
- Han, F. Research on Energy Management Strategies Applied to Community Power Router. Master’s Thesis, Shandong University, Jinan, China, 2023. [Google Scholar]
- Ali, L.; Azim, M.I.; Bhandari, V.; Menon, A.; Tiwari, V.; Green, J.; Bizhani, H.; Muyeen, S.M. P2P as a Smarter Way of Energy Trading: A Game Theoretic Case Study for Multi-microgrids. In Proceedings of the 2022 10th International Conference on Smart Grid (icSmartGrid), Istanbul, Turkey, 27–29 June 2022; pp. 285–289. [Google Scholar] [CrossRef]
- Jiang, S.; Wen, S.; Zhu, M.; Ma, J.; Zhang, Q. Efficient Capacity Planning Method for Demand-side Energy Storage Based on Scenario Linearization Reconfiguration. Autom. Electr. Power Syst. 2024, 48, 30–37. [Google Scholar] [CrossRef]
- Sallam, K.M.; Elsayed, S.M.; Chakrabortty, R.K.; Ryan, M.J. Improved Multi-operator Differential Evolution Algorithm for Solving Unconstrained Problems. In Proceedings of the 2020 IEEE Congress on Evolutionary Computation (CEC), Glasgow, UK, 19–24 July 2020; pp. 1–8. [Google Scholar] [CrossRef]


| Parameter | Value |
|---|---|
| 0.5 kWh/km | |
| 100 kWh | |
| 10 km/h | |
| 10 kWh | |
| 30 kW |
| Parameter | Value |
|---|---|
| 0.411 CNY/kWh | |
| 0.027 CNY/kW | |
| 1 | |
| 0.9 |
| P1 Energy Storage | P2 Energy Storage | P3 Energy Storage | |
|---|---|---|---|
| Initial SOC | 52.5% | 26.5% | 21.8% |
| Max Energy Capacity/kWh | 6771.9 | 4698.8 | 12,361.6 |
| Max Charging Power/kW | 2393.3 | 1685.1 | 3953.1 |
| Max Discharging Power/kW | 2100.4 | 1673.3 | 4075.0 |
Disclaimer/Publisher’s Note: The statements, opinions and data contained in all publications are solely those of the individual author(s) and contributor(s) and not of MDPI and/or the editor(s). MDPI and/or the editor(s) disclaim responsibility for any injury to people or property resulting from any ideas, methods, instructions or products referred to in the content. |
© 2025 by the authors. Published by MDPI on behalf of the World Electric Vehicle Association. Licensee MDPI, Basel, Switzerland. This article is an open access article distributed under the terms and conditions of the Creative Commons Attribution (CC BY) license (https://creativecommons.org/licenses/by/4.0/).
Share and Cite
He, Y.; Liu, T.; Wang, Z.; Ren, Q.; Chen, A. Adaptive and Collaborative Hierarchical Optimization Strategies for a Multi-Microgrid System Considering EV and Storage. World Electr. Veh. J. 2025, 16, 363. https://doi.org/10.3390/wevj16070363
He Y, Liu T, Wang Z, Ren Q, Chen A. Adaptive and Collaborative Hierarchical Optimization Strategies for a Multi-Microgrid System Considering EV and Storage. World Electric Vehicle Journal. 2025; 16(7):363. https://doi.org/10.3390/wevj16070363
Chicago/Turabian StyleHe, Yifeng, Tong Liu, Zilong Wang, Qiqi Ren, and Alian Chen. 2025. "Adaptive and Collaborative Hierarchical Optimization Strategies for a Multi-Microgrid System Considering EV and Storage" World Electric Vehicle Journal 16, no. 7: 363. https://doi.org/10.3390/wevj16070363
APA StyleHe, Y., Liu, T., Wang, Z., Ren, Q., & Chen, A. (2025). Adaptive and Collaborative Hierarchical Optimization Strategies for a Multi-Microgrid System Considering EV and Storage. World Electric Vehicle Journal, 16(7), 363. https://doi.org/10.3390/wevj16070363