1. Introduction
In recent decades, climate change has become the focus of the development of modern society. The undoubted impact of human activity on the environment shows its negative sides more and more every day. Climate change is increasingly radical and has a negative impact on both the economy and people’s lives.
In this sense, guidelines were set a long time ago that should guide the reduction of the negative impact of humanity on the nature. The Kyoto Protocol to the United Nations Framework Convention on Climate Change (UNFCCC) was adopted in 1997. The Kyoto Protocol shares the ultimate objective to stabilize atmospheric concentrations of greenhouse gases (GHGs) at a level that will prevent dangerous interference with the climate system [
1,
2].
At the UN Climate Change Conference (COP21) held in Paris in December 2015, a legally binding international agreement on climate change, known as the Paris Agreement, was adopted. This agreement accepted the obligation to keep the increase in the average global temperature below 2 °C compared to the pre-industrial level and to make efforts to limit that increase to 1.5 °C [
3]. In recent times, the need to keep the rise in global temperatures below the limit of 1.5 °C has been particularly emphasized, because crossing this limit increases the risks of much more serious climate changes, which include more frequent and serious precipitation, heat waves and droughts. According to some estimates, in order to keep global warming below the specified limit, the emission of greenhouse gases would have to reach its peak by 2025 at the latest and decrease by 43% by 2030 [
4].
Special attention is paid to reducing CO
2 emissions. Although CO
2 is not among the most harmful greenhouse gases in terms of impact, its emission is by far the largest of all greenhouse gases. According to a report by the U.S. Environmental Protection Agency (EPA), CO
2 emissions represent 78.8% of the equivalent emissions of all greenhouse gases resulting from human activity [
5].
The effort to reduce the global emission of greenhouse gases includes all segments of human activity and all economic sectors that contribute to that emission. Among the sectors that significantly contribute to the emission of greenhouse gases is the transport sector. According to the EPA report, the transport sector accounts for 27.2% of the total equivalent emission of greenhouse gases caused by human activity [
5]. The transport sector is mostly driven by fossil fuels, and according to EPA reports, it contributes 36.2% of the total CO
2 emissions resulting from the burning of fossil fuels [
5]. It should be noted that the above data presented by the EPA [
5] refer to the equivalent emission of greenhouse gases in the USA, but the trends can also be mapped to the global level.
The presented data indicate a significant contribution of the transport sector to the total anthropogenic CO2 emissions on a global scale. Reducing or completely eliminating the dependence of the transport sector on fossil fuels would represent a significant contribution in efforts to meet the set goals related to global warming. New, more efficient and environmentally friendly technologies are needed in all segments of the transport sector. In this sense, electric drive propulsion systems have emerged as the optimal solution, especially in the road transport segment.
The production of electric vehicles is in great expansion, and electric vehicles are becoming more and more present in use. Sales of new electric vehicles are growing rapidly from year to year [
6]. According to the International Energy Agency (IEA) report, 13.9 million of new electric passenger cars (battery electric vehicles and plug-in hybrid vehicles) were sold in the world in 2023. This represents an increase of 35% compared to 2022. (10.3 million), with sales of new electric vehicles doubling compared to 2021 (6.5 million). On the European market, 3.2 million vehicles were sold in 2023, which is an increase of 20% compared to the previous year. Globally, electric cars accounted for around 18% of all cars sold in 2023. At the end of 2023, the total number of electric vehicles in the world was 40.5 million vehicles, an increase of 54% compared to 2022, 2.5 times more than 2021 and 4 times more than 2020 [
7,
8]. In the structure of the mentioned electric vehicles, about 70% are battery electric vehicles. According to the recent reports, 17.1 million new electric passenger cars and light-duty vehicles were sold in the world in 2024, which is an increase of 23% compared to the previous year [
9].
It is evident from the above data that the number of electric vehicles has been increasing rapidly in the last few years. Considering the EU regulations that, from 2035, will require zero pollutant emissions in new passenger and light-commercial vehicles (practically eliminating internal combustion engines) [
10], the number of electric vehicles will continue to grow.
The entry of electric vehicles into the market, as a completely new technology, brings with it a series of challenges and potential problems. In order to ensure a sufficient range of electric vehicles, a wide network of charging stations is needed. The branching of the network of charging stations for electric vehicles requires significant infrastructure investments, both in the construction of the stations themselves and in the expansion and strengthening of the electrical power distribution grid.
The impact of the electrification of the transport sector is the subject of intensive research. Paper [
11] provides an overview of the impact of the electrification of the transport sector on the environment, on consumers, battery technology and its sustainability, the accompanying effects of communal services and other socio-economic benefits. Challenges in implementing charging stations and EV infrastructure are studied in [
12]. The impact of electric vehicle penetration on the integration of various renewable energy sources and the costs of CO
2 emission reduction are studied in [
13]. Assessments of electric vehicles’ impact on distribution networks and necessary evolutions of the distribution grid are presented in [
14,
15,
16]. A methodology for assessing the impact of electric vehicles on the power distribution grid of one particular region’s power system is presented in [
17,
18]. The results of the analysis point to potential problems with the load and stability of the electrical power grid as early as 2030 and the need for significant investments in electrical infrastructure. Despite numerous advantages, a key concern remains whether power systems can handle the increased load from a large number of electric vehicles charging simultaneously [
7].
In light of previous considerations, an assessment of the impact of the electrification of the vehicle fleet in Bosnia and Herzegovina on the increase in total electrical energy consumption, for different scenarios of the increase in the number of electric vehicles, is carried out in this paper. The calculation of electrical energy consumption for one representative electric vehicle, according to standard driving test cycles, is performed. Based on the analysis of the total number and structure of vehicles, the total consumption of electrical energy for the segment of passenger vehicles is defined, for various scenarios of increasing the number of electric vehicles.
As a developing country and candidate for European Union membership, Bosnia and Herzegovina can be very interesting case study. The number of electric vehicles is almost negligible compared to the total number of vehicles. An upper-middle-income economy, underdeveloped network of charging stations and weak government incentives do not sufficiently encourage the electric vehicle market. On the other hand, due to its aspiration for EU membership, the country will have to follow EU regulations and adapt its domestic legislation. This will mean that all EU regulation relating to vehicle pollutant emissions and the road vehicle market will have to be quickly adopted in domestic legislation. Therefore, in the coming period, there will be an inevitable increase in the number of electric vehicles, and it is very interesting to investigate how this increase in the number of electric vehicles will affect the total electrical energy consumption in the country. There are very few published papers and little available research tackling this problem for Bosnia and Herzegovina, and it will be very useful to predict the increase in the number of electric vehicles in the near future as precisely as possible, estimate their energy consumption and investigate how this increase in the number of electric vehicles will affect the total electrical energy consumption in Bosnia and Herzegovina.
2. Methodology
In order to assess the impact of the electrification of the vehicle fleet on the country’s total electrical energy consumption, it is necessary to determine the average consumption of electrical energy of electric vehicles. In this sense, only the segment of passenger vehicles will be analysed. It is the vehicle segment that is by far the most numerous, and it accounts for 85% of all road vehicles in traffic. Also, it is the first which is undergoing mass electrification. For a typical electric vehicle, the average annual consumption of electrical energy will be determined, driving according to the standardized WLTP test cycle. Based on the analysis of the number and structure of vehicles in Bosnia and Herzegovina, for various scenarios of increasing the number of electric vehicles, an assessment of the necessary electrical energy for vehicle operation will be carried out on an annual basis.
2.1. Vehicle Model for Energy Consumption Calculation
Vehicle energy consumption, for any driving regime, can be determined from vehicle longitudinal motion equation, knowing vehicle resistance forces and propulsion system efficiencies [
19,
20,
21]. The power at the wheels (
Pwheel), required to produce desired vehicle movement, can be expressed as
where
Proll is the power needed to overcome rolling resistance,
Pgrade is the power required in case of a road gradient,
Pair is the power of aerodynamic resistance and
Paccel is power required for vehicle acceleration.
Taking into account dynamic equations for individual resistances, power at the wheel can be expressed as
where
v is the vehicle speed,
a is the vehicle acceleration,
m is the vehicle mass,
IW is the total wheels’ moment of inertia,
rd is the wheel rolling radius,
cX is the air drag coefficient,
A is the vehicle frontal area,
ρ is the air density,
fR is the rolling resistance coefficient and
θ is the road gradient.
Rolling resistance and aerodynamic resistance powers are always positive (engine consumes power to overcame resistance), but grade and acceleration resistance powers can be positive (uphill/vehicle acceleration), negative (downhill/vehicle deceleration) or zero (flat road/constant speed). So, depending on road configuration and vehicle speed regime, total wheel power can be positive (tractive power) or negative (braking power):
With electric and hybrid vehicles, braking power can be used for energy regeneration.
Taking into account electric vehicle propulsion system configuration and efficiency (traction motor, battery and other electrical system efficiency, transmission system efficiency, energy regeneration efficiency, as well as other auxiliary system power consumption), battery power output for vehicle propulsion can be calculated.
Battery power output can be expressed as
where
ηel and
ηmech are the electrical and mechanical systems’ efficiencies and
Paux is the auxiliary systems’ power consumption.
Battery power input (regenerative braking power) can be expressed as
where
k is the regenerative braking factor (percentage of total braking energy that can be regenerated). The regenerative braking factor depends on the design and control of the vehicle braking system, vehicle deceleration profile, state of the charge (SOC) of the battery, etc. [
20].
The total energy consumption of an electric vehicle, for any road configuration and vehicle speed profile, can be calculated as
It should be noted that braking power has a negative sign.
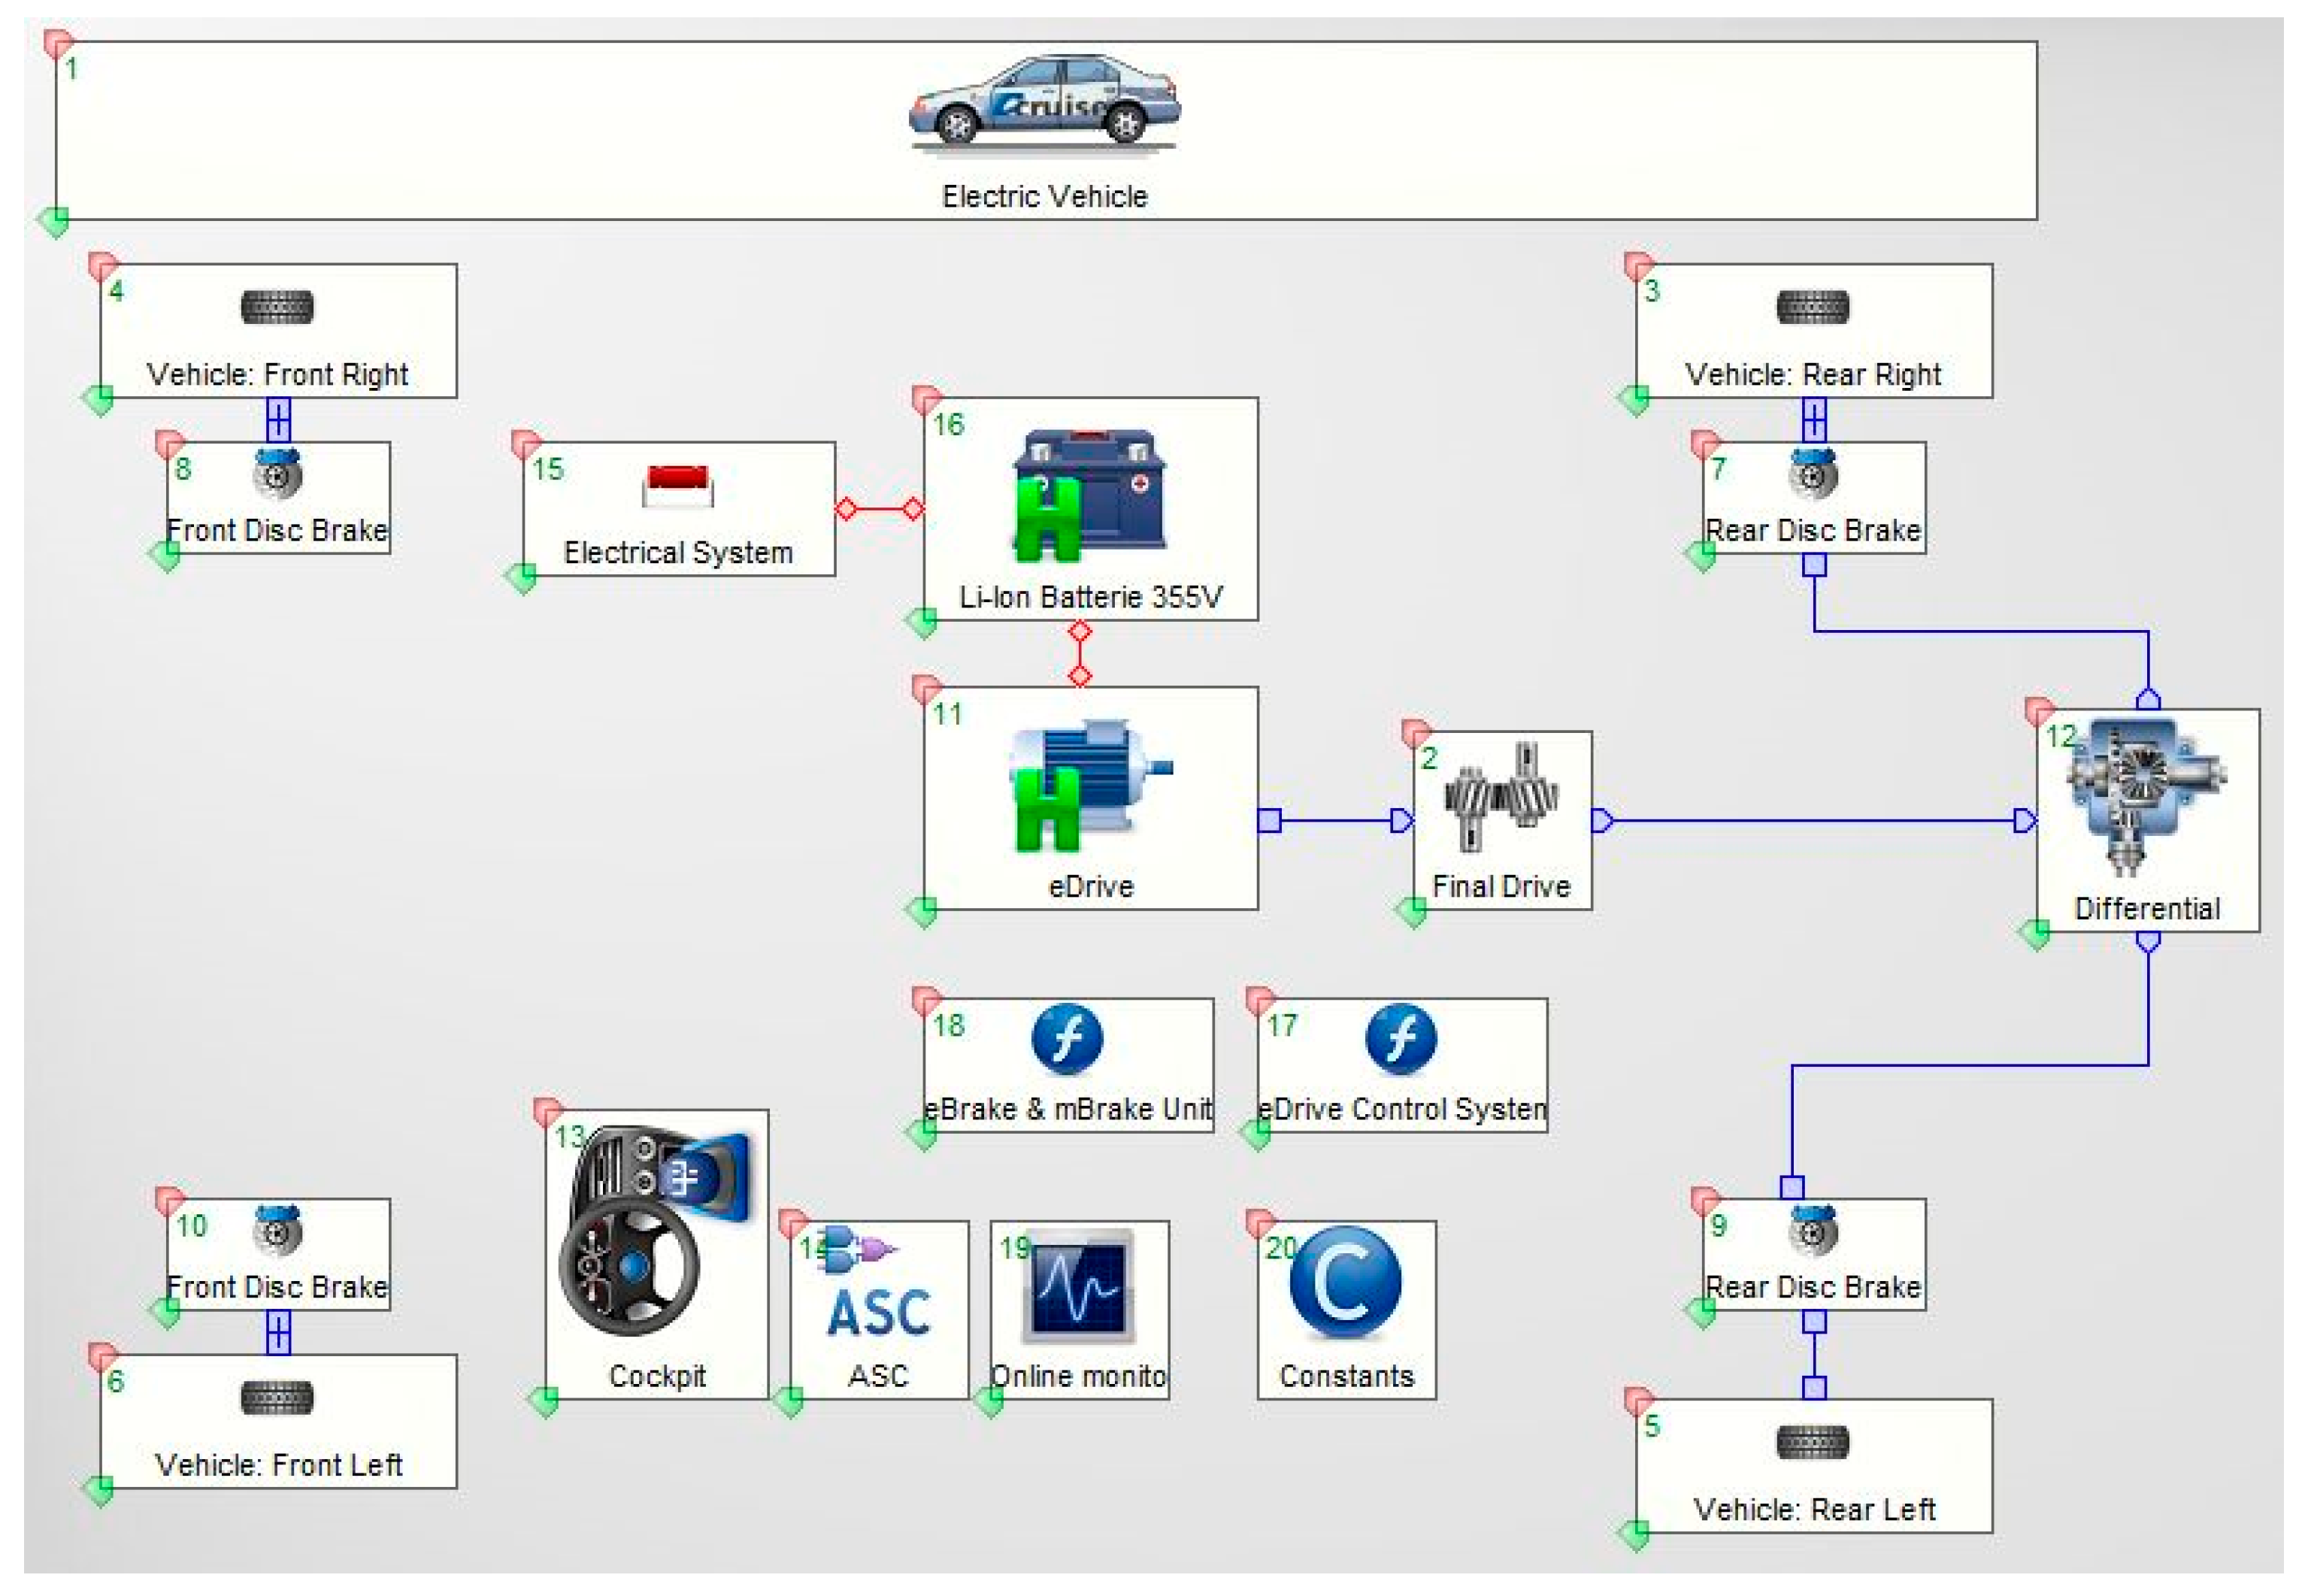
Taking into account the complex configuration of the vehicle propulsion system, the energy consumption calculation is performed using AVL Cruise simulation software, version R2020.1. AVL Cruise enables the creation of a model of an electric vehicle, with all systems that are important for the analysis of the desired vehicle driving conditions. For the purpose of this paper, a simulation model of one C-segment electric crossover SUV, driven by a permanent magnet synchronous motor and with a lithium-ion battery, is created (
Figure 1). As one of the most popular passenger car segments, with its technical features, this model is used as a representative electric vehicle (average electric vehicle model). Basic vehicle parameters for the simulation model are given in
Table 1.
Since the ultimate goal is to determine the average energy consumption of an electric vehicle, the calculation is performed for the standardized vehicle driving cycle, the worldwide harmonized light-duty test cycle (WLTC) Class 3b driving cycle [
22], shown in
Figure 2. For vehicle average annual energy consumption, it is assumed that the average annual vehicle mileage is 12,000 km [
23], the same as the average annual mileage in EU countries [
24].
The actual energy consumption for one particular vehicle driving in real-world conditions may considerably deviate from the calculated average consumption. Factors that affect energy consumption are the vehicle technical specifications (such as vehicle mass, aerodynamic characteristics, engine and transmission efficiencies); vehicle load (number of passengers, cargo mass); road profile; driving style; traffic conditions; share of urban, extra-urban and highway driving in the travelled mileage; etc. But, as mentioned before, the goal of this paper is to find the total annual electrical consumption of the vehicle fleet (consisting of a number of various vehicles driving in various driving scenarios), so the authors find it appropriate to use the WLTC as a representative average driving cycle.
2.2. Statistical Data for Vehicle Fleet and Structure Analysis
All statistical data needed for vehicle fleet structure analysis and estimation of electric vehicle number growth (such as number and structure of vehicle fleet, number of new vehicles, number of electric cars, historical trend in vehicle sales, etc.) have been collected from the Agency for Statistics of Bosnia and Herzegovina (BHAS), by its website. Data provided by the BHAS represent official statistical data in Bosnia and Herzegovina. Statistical data on the number of electric vehicles in neighbouring countries and the EU have been collected from Eurostat, by its website.
3. Number and Structure of Vehicle Fleet in Bosnia and Herzegovina
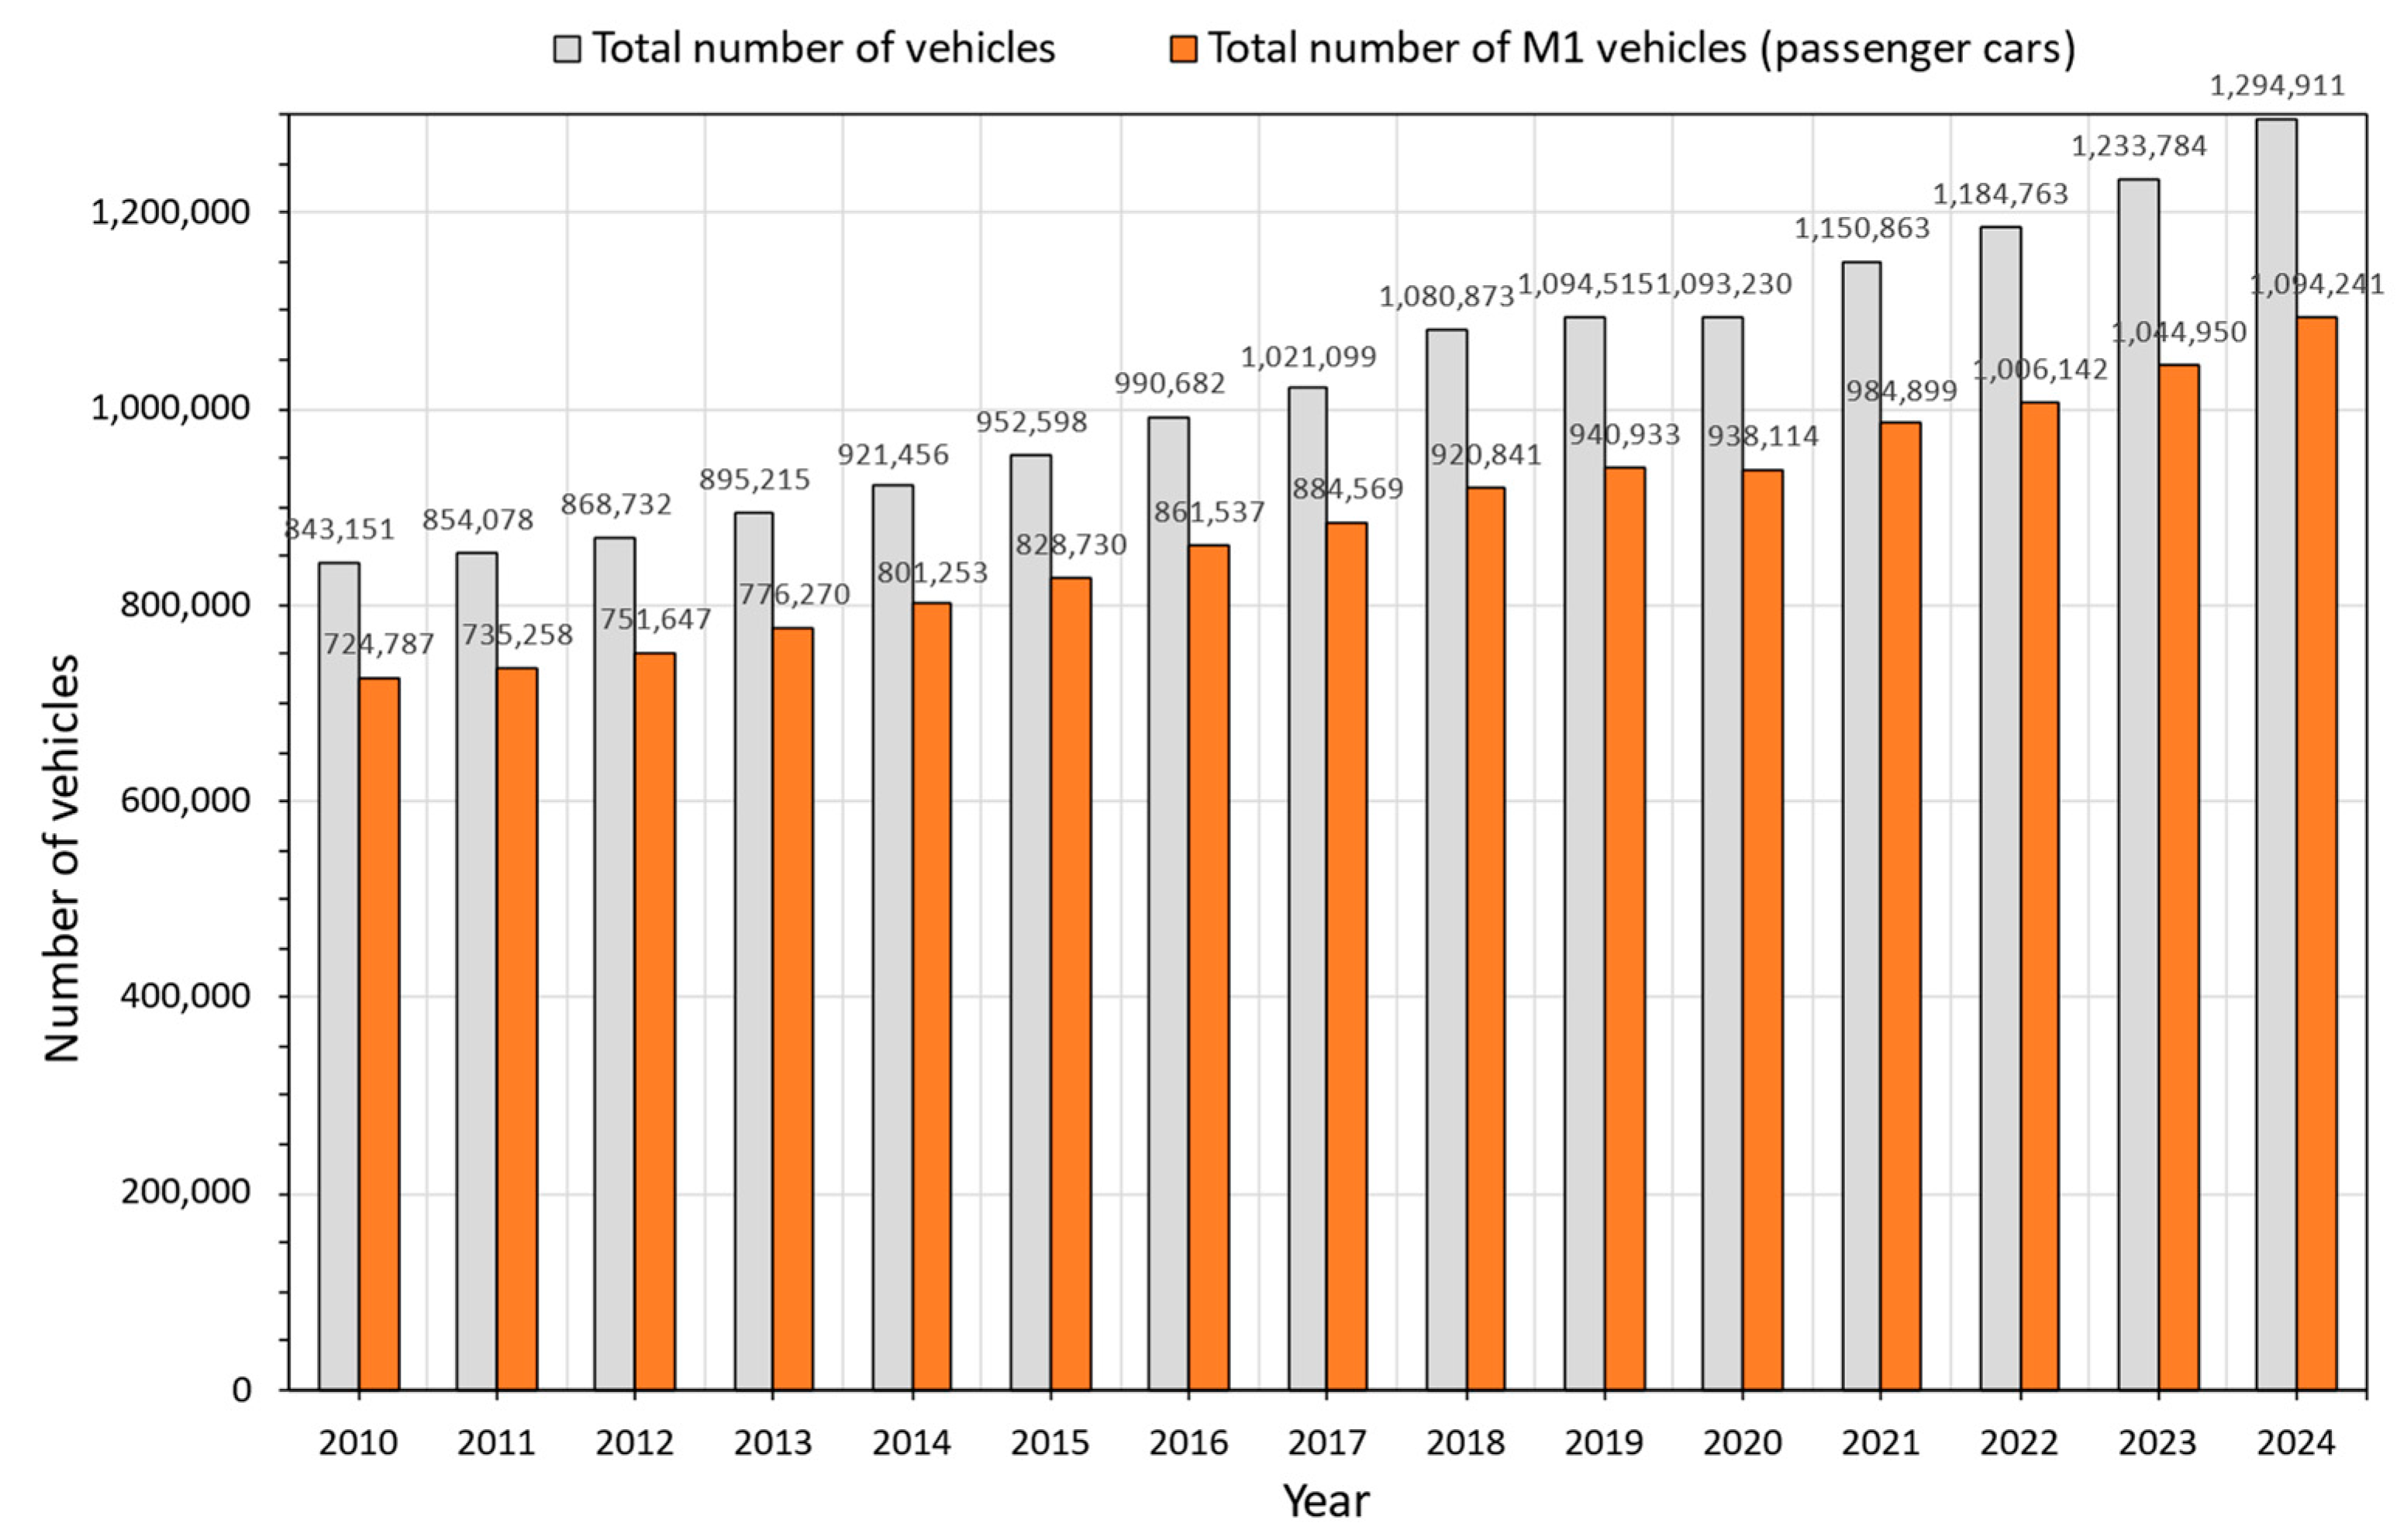
According to the Agency for Statistics of Bosnia and Herzegovina (BHAS), in 2024, the total number of registered road vehicles in Bosnia and Herzegovina was 1,294,911. Of that number, 1,094,241 were passenger cars (M1 category), which is 84.5% of the total vehicle number [
25]. The total number of passenger cars registered for the first time in 2024 was 84,928 (new vehicles and imported used vehicles). Of that number, 9215 were brand new cars [
26]. At the end of 2024, there were only 509 battery electric and 5836 hybrid electric cars [
25], which is negligible compared to the total number of passenger cars (0.58%).
The total number of vehicles in Bosnia and Herzegovina in the period 2010–2024 is shown in
Figure 3 and
Figure 4 [
27].
There is a constant increase in the number of vehicles (approximately linear), both in the total number of vehicles and in the total number of passenger cars. The increase in the number of first-time registered passenger cars has a slightly different gradient of change. The number of brand-new passenger cars is relatively small and fluctuates over time. The small total number of new cars is, in principle, a reflection of the weak overall economy of the country. The fluctuating character corresponds well with global economic trends. A significant drop in the number of new and first-time registered vehicles during the coronavirus pandemic is noticeable, which is also reflected in the stagnation of the total number of vehicles. From 2023, the vehicle market shows signs of recovery and returning to the pre-pandemic state.
The total number of battery electric and hybrid electric passenger cars in Bosnia and Herzegovina in the period 2018–2024 is given in
Table 2. For reference, it is interesting to compare the number of electric passenger cars in Bosnia and Herzegovina with neighbouring countries (Western Balkan countries—Serbia, Montenegro, North Macedonia, Albania—and EU countries—Croatia, Slovenia) and the EU average (
Table 3).
From the data presented above, it can be seen that the number of electric vehicles in Bosnia and Herzegovina is negligible compared to the total number of vehicles and significantly lower than the EU average. The same applies to neighbouring countries (Western Balkans region and Croatia). The share of electric vehicles in the new vehicle market in 2023 was only 1.5% and was 10 times lower than the EU average. The situation is similar in the region. In 2024, the share of electric vehicles in the new vehicle market was 1.9%.
Estimation of the Number of Electric Vehicles for the Period up to 2050
By analysing the above presented data and trends in the number of vehicles, certain conclusions can be drawn, and based on them, an estimate of the total number of passenger cars, as well as the number of electric vehicles for the period up to 2050, can be made. It should be noted that it is very difficult to make a realistic assessment of the increase in the number of electric vehicles in the long term, for several reasons. At this moment, the number of electric and hybrid vehicles in Bosnia and Herzegovina is very small, negligible compared to the total number of passenger cars, and there are no historical data on electric vehicle sales that could be used for prediction. The growth of the number of electric vehicles is influenced by a large number of factors, such as legal regulations (primarily dependent on political decisions) and government incentives, infrastructure conditions (dependent on the size of investments in the expansion of charging networks, as well as the entire electric distribution network), and economic trends in the market (willingness of customers to accept new technologies, economic crises that affect reduced demand or stoppages in production, etc.). For this reason, a combination of quantitative prediction methods (trend projection method, based on the historical data in the vehicle number growth) and qualitative prediction methods (judgmental prediction method, based on the knowledge and expertise of the authors in this field) is used to predict the future number of electric vehicles.
In order to estimate the number of electric vehicles in Bosnia and Herzegovina for the period up to 2050, certain assumptions will be introduced:
There is an assumption of a linear increase in the total number of passenger vehicles, based on the analysis of the vehicle number historical data (
Figure 3). The average annual growth is 3% and corresponds well to the country’s average real GDP growth rate. For each year, the number of first-time registered passenger cars is 59,500 (average number of first-time registered vehicles in the period 2010–2024), of which the number of new vehicles is 8900 (15% of total first-time registered passenger cars), and the number of imported used vehicles is 50,600. Every year, 35,000 vehicles are withdrawn from usage (the average number of vehicles decommissioned due to age, defects, traffic accidents, etc., in the period 2010–2024).
Period 2025–2035: There will be an annual increase in the share of electric vehicles in the number of new vehicle sales from 2% to 25% of, on average, 8900 new vehicle sales. For the period 2030–2035, it is assumed there will be an annual increase in the share of imported used electric vehicle sales from 0.5% to 5% of an average of 50,600 imported used vehicle sales.
Period 2036–2040: There will be an annual increase in the share of electric vehicles in the number of new vehicle sales from 30% to 50% and an annual increase in the share of electric vehicles in the number of imported used vehicle sales from 7% to 15%.
Period 2041–2050: There will be an annual increase in the share of electric vehicles in the number of new vehicle sales from 60% to 100% in 2045. From 2045, all new vehicles sold in the market will be electric. There will be an annual increase in the share of electric vehicles in the market of imported used vehicles from 18% to 50%.
The presented assumptions are valid for the case of the ban of combustion engines in the EU from 2035. Since Bosnia and Herzegovina is a candidate for EU membership, it is reasonable to assume that the government will follow EU legislation and introduce a similar ban, but with some time delay. For the purpose of this paper, it is assumed this time delay will be 10 years. Up until today, there are no government transitional plans with defined timeframes for replacing combustion engine vehicles with electric vehicles in Bosnia and Herzegovina, so the authors made this assumption based on the difference between national and EU regulations concerning vehicle type approval (approximately 10 years of delay).
The assumptions used to estimate the number of electric vehicles are based on statistical data on the number of conventional vehicles (almost all with combustion engines) in the period 2010–2024 and the number of electric vehicles in the period 2018–2024 (very small sample for any reliable analysis). As can be seen from the presented statistical data, the vehicle market in Bosnia and Herzegovina is primarily based on used vehicles (in the structure of first-time registered cars, over 85% are used cars). The market for used electric vehicles in Bosnia and Herzegovina is currently non-existent, so it is very difficult to make any forecasts. Even in EU countries, the market for used electric vehicles is not sufficiently developed and there are no defined parameters that would enable a reliable forecast. Therefore, this approach to estimating the number of vehicles can be seen as simplified and gives certain limitations in the interpretation of the obtained results.
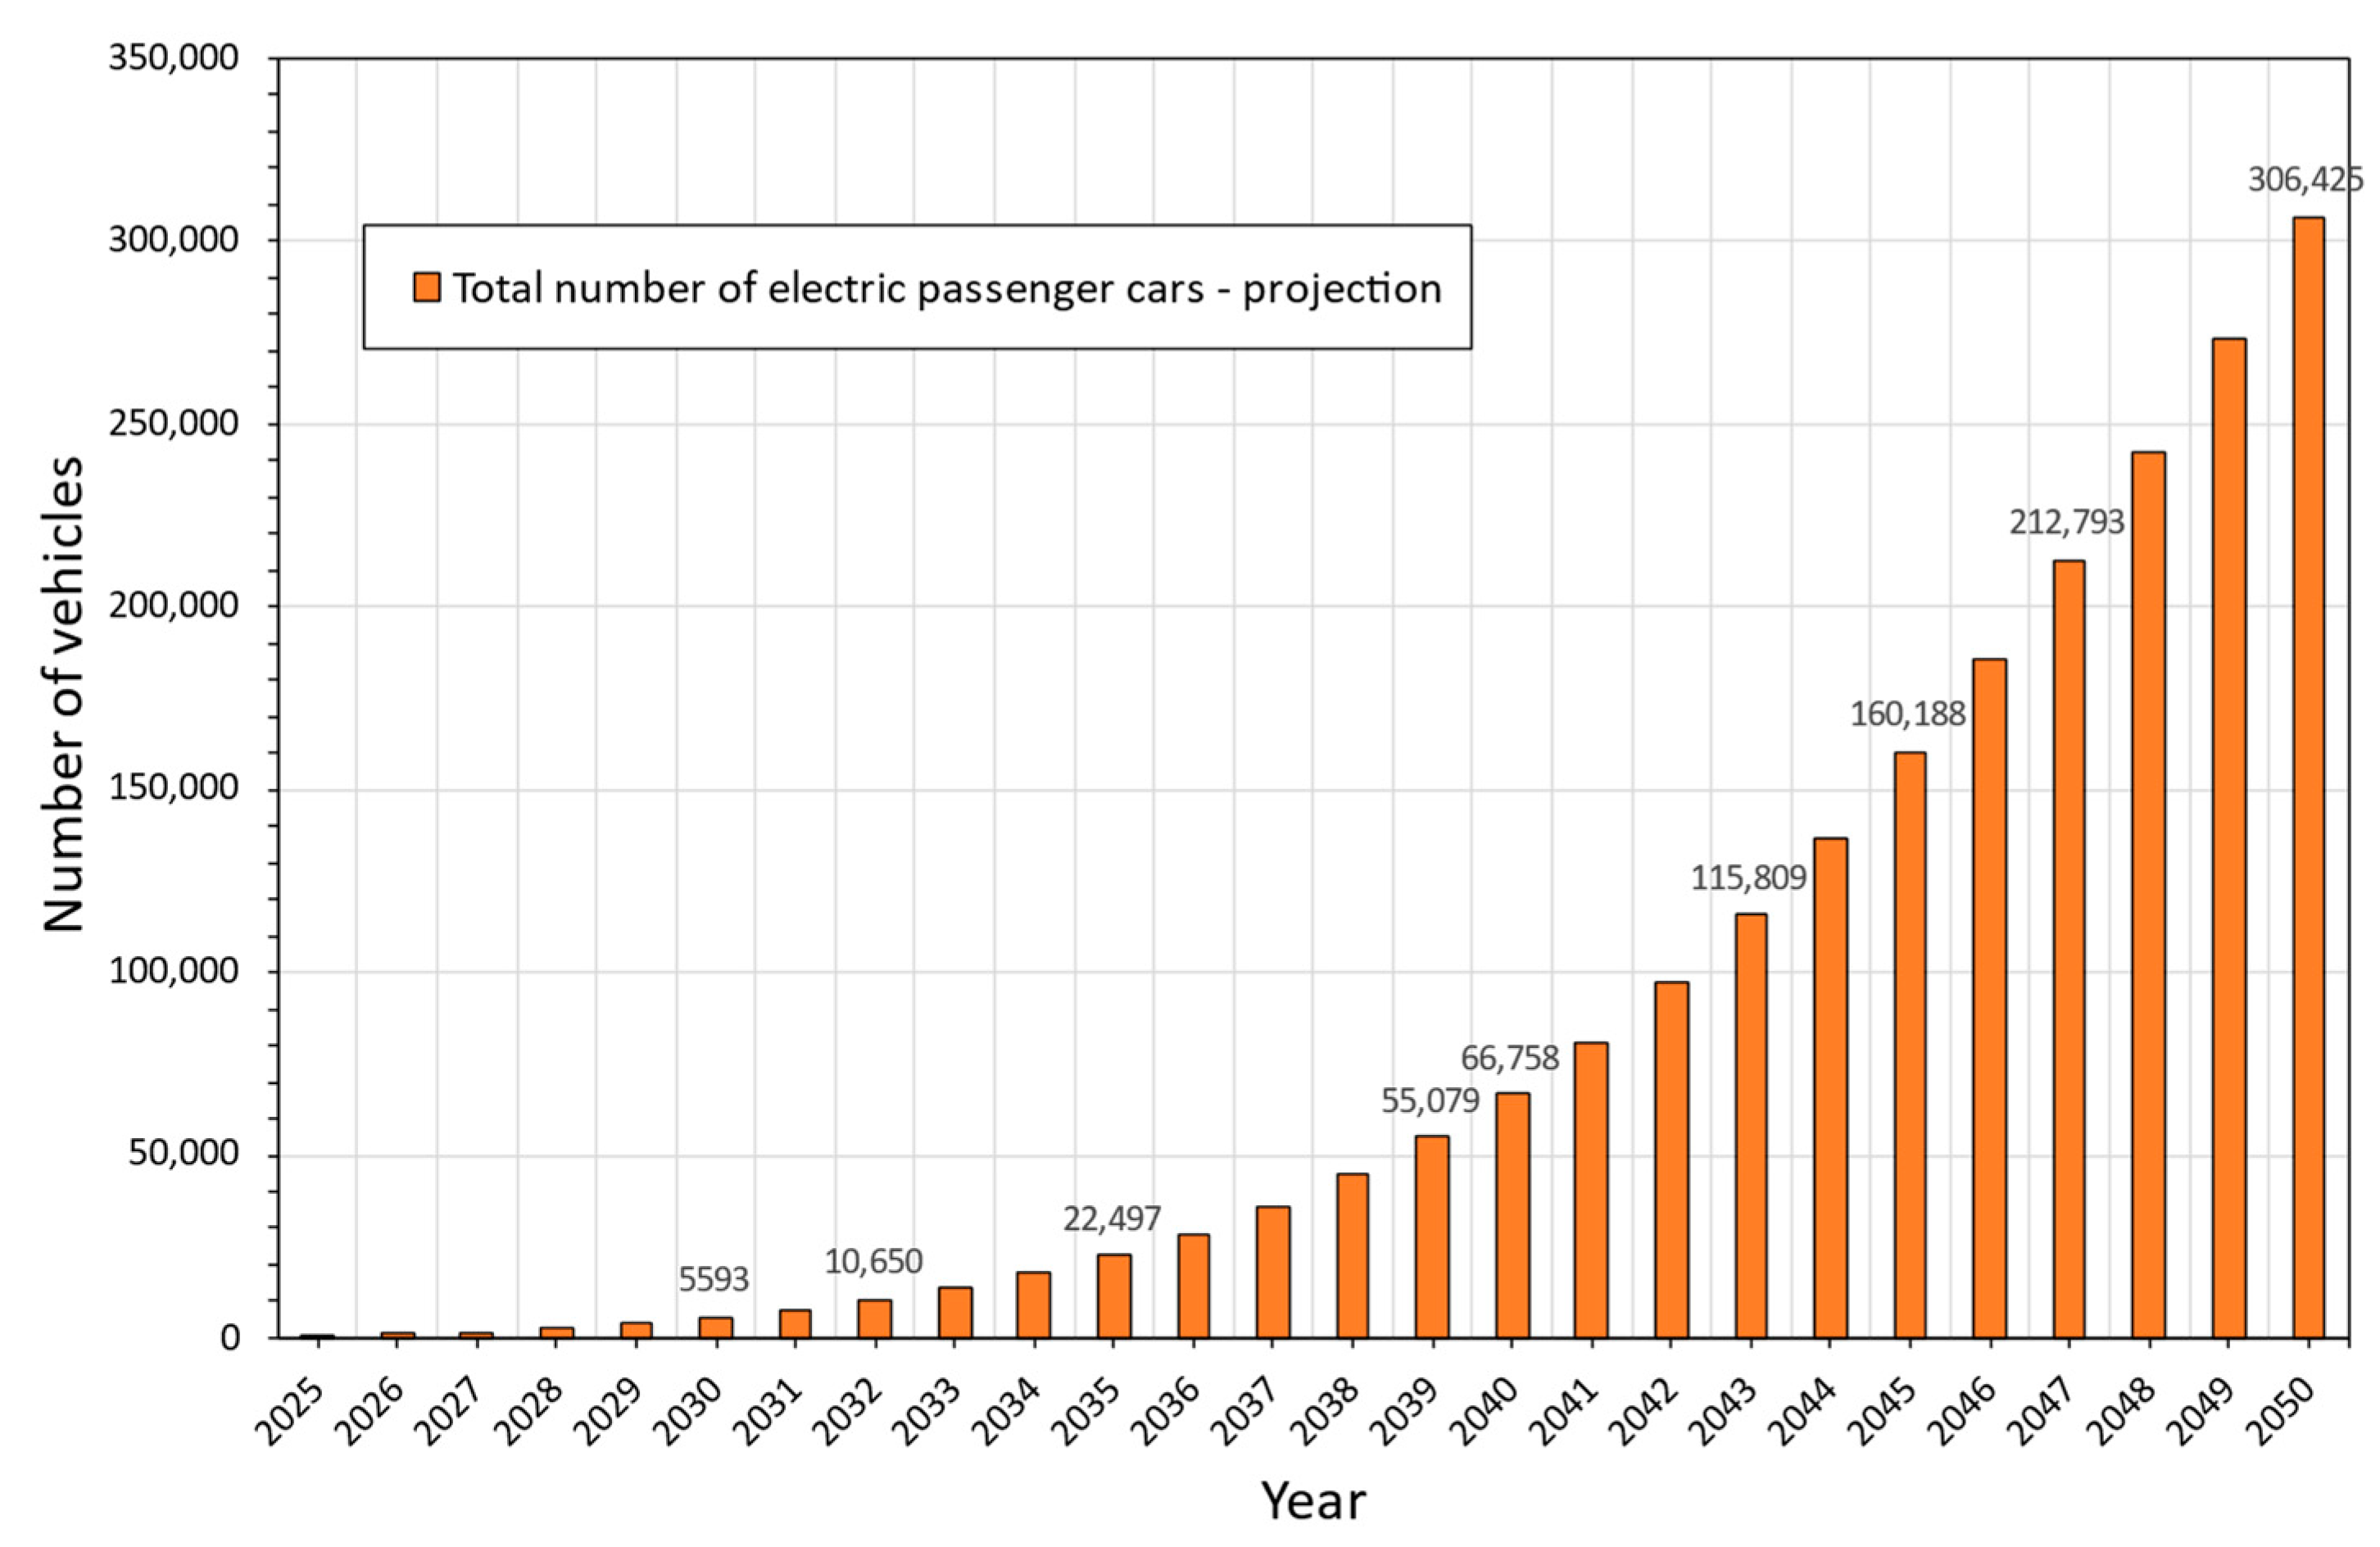
Based on the defined assumptions, a calculation is made, and the estimated number of electric passenger cars in Bosnia and Herzegovina for the period 2025–2050 is shown in
Table 4 and
Figure 5. It is estimated that a significant increase in the number of electric vehicles will occur only after 2035 and that in 2050 the number of electric vehicles will amount to 306,425. According to the same assumptions, the estimated total number of passenger vehicles in 2050 is 1,731,240. The share of electric vehicles in the total number of vehicles will be about 18%.
4. Results and Discussion
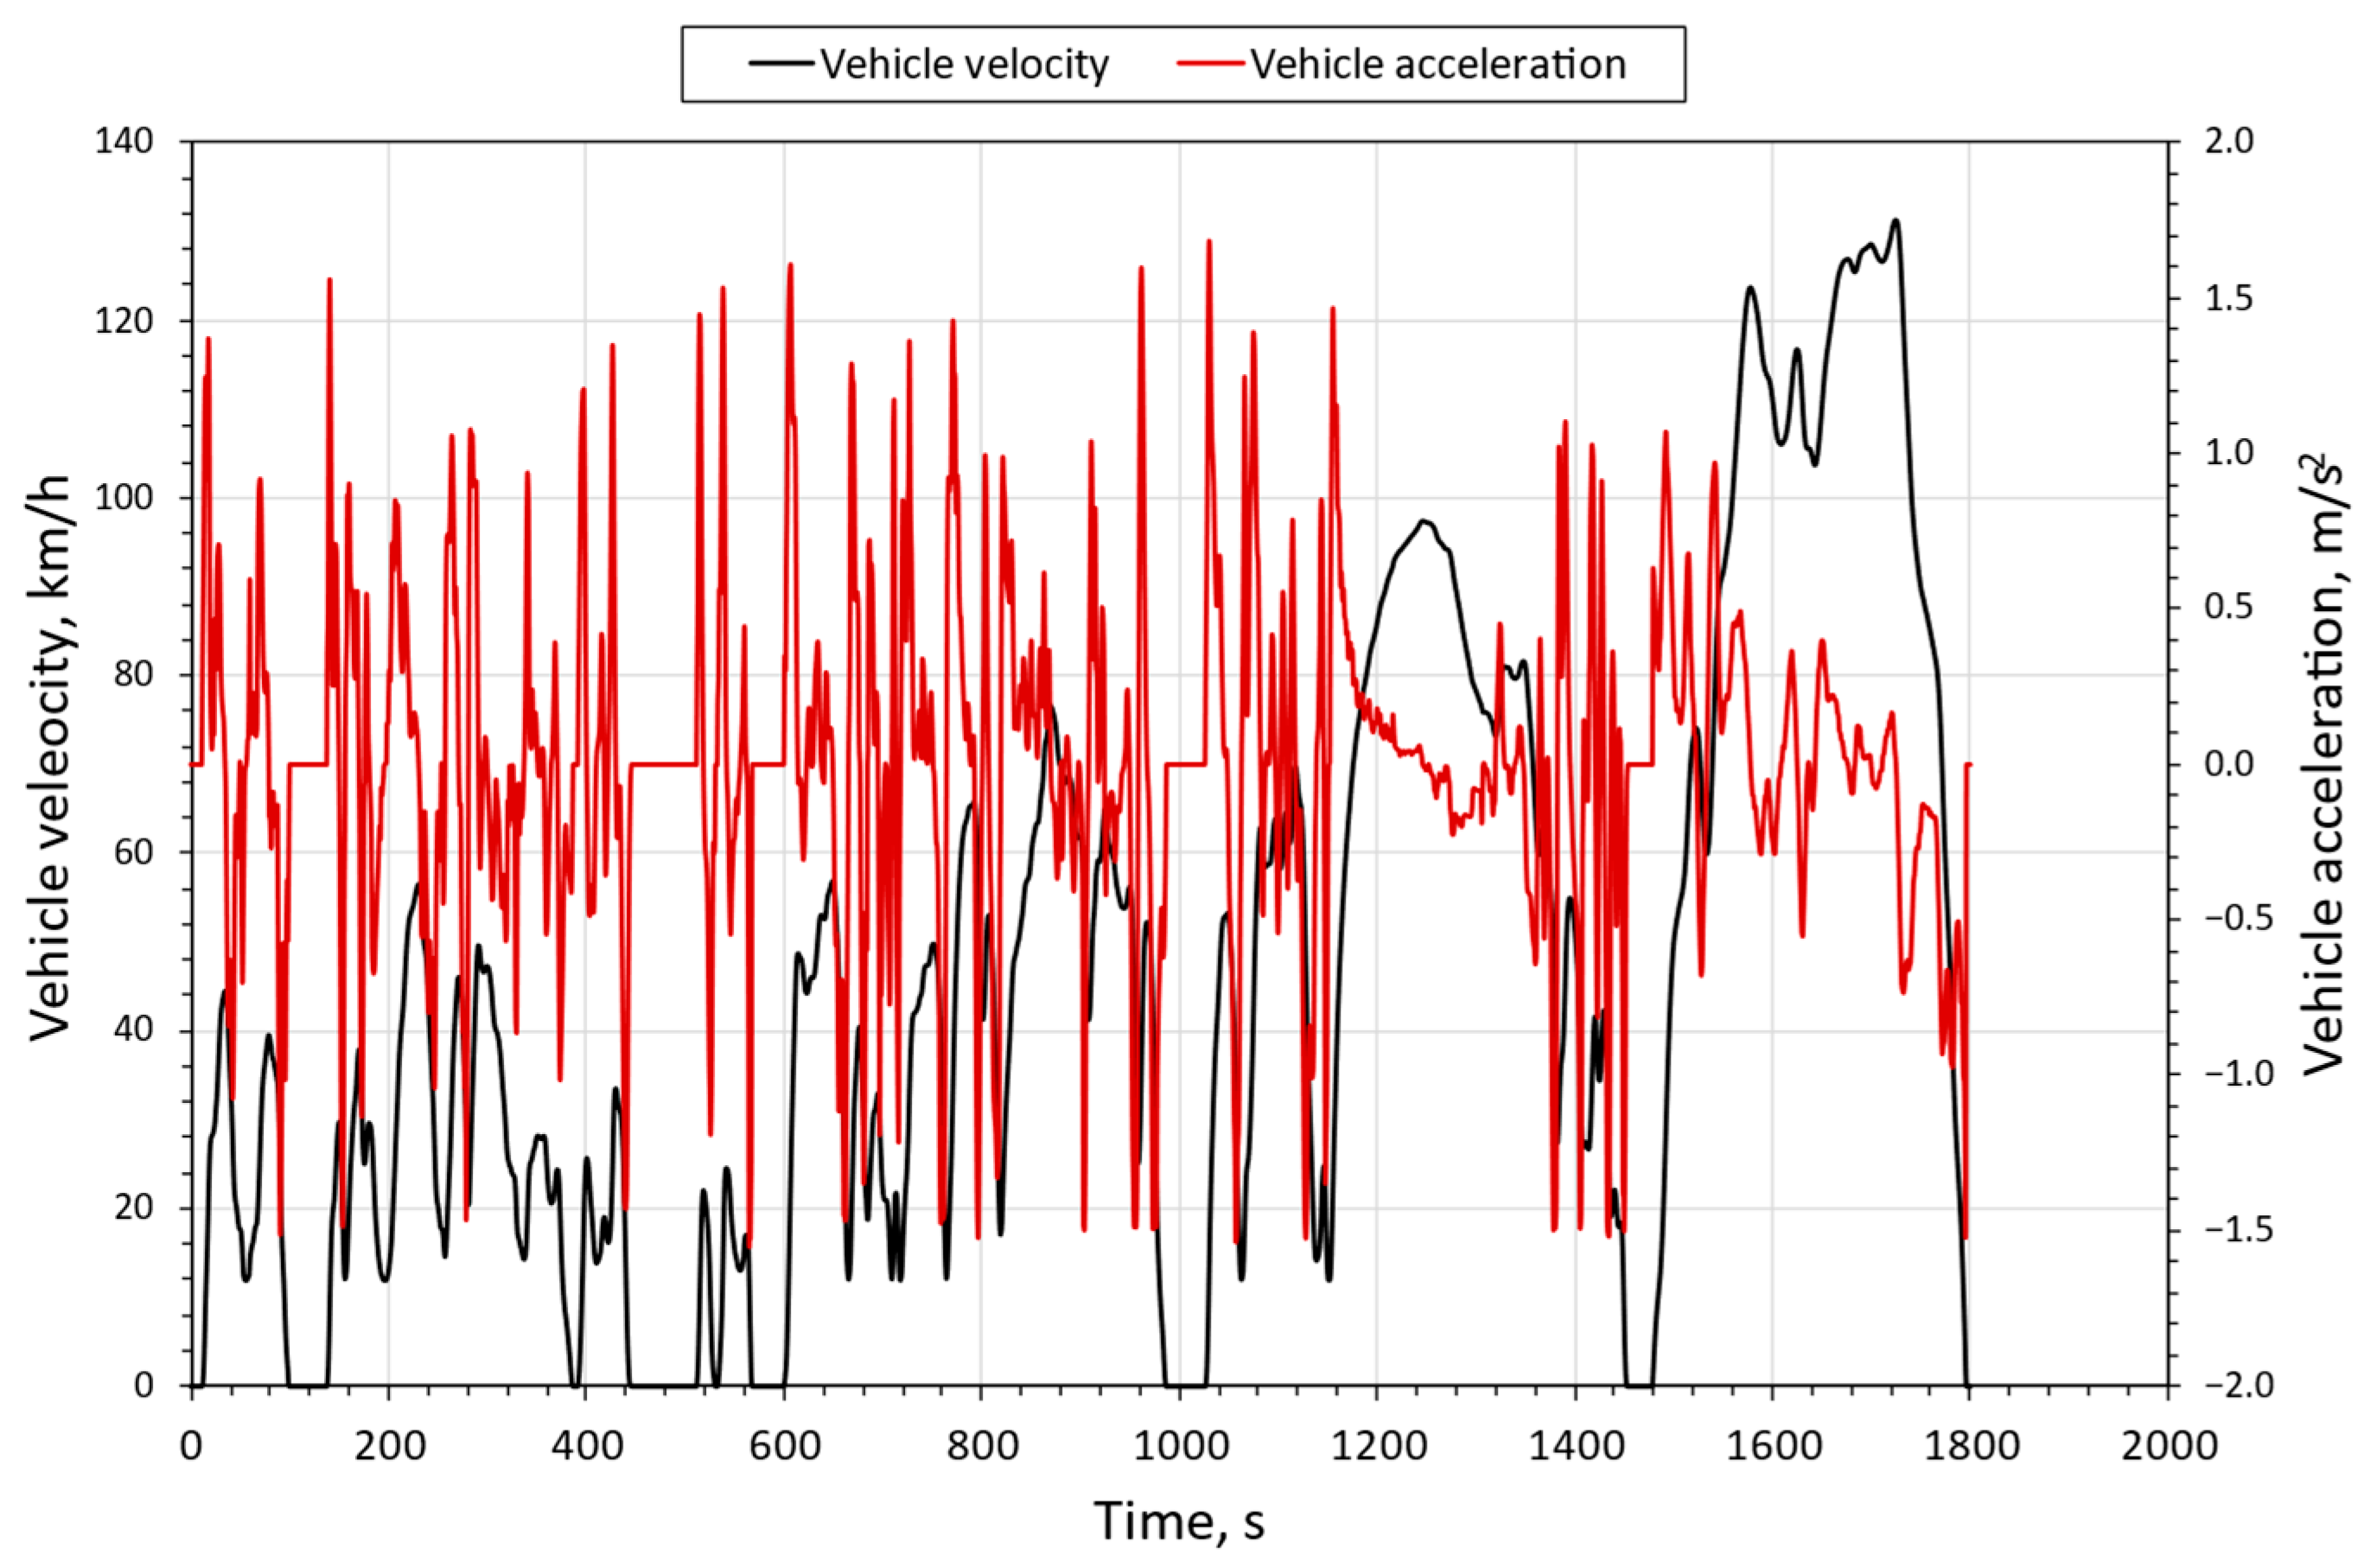
Using a vehicle model created in AVL Cruise R2020.1 simulation software, as presented in chapter 2, a simulation of electric vehicle motion according to the WLTC Class 3b driving cycle was performed. The results of the simulation are shown as follows.
Figure 6 shows the vehicle velocity and acceleration profile achieved during the simulation. It can be seen that during the simulation, the vehicle fully achieves the given driving cycle. The duration of the driving cycle is 1800 s and the distance covered is 23.266 km.
To achieve the given vehicle speed profile, the electric motor must deliver sufficient power to the wheels to overcome resistance forces acting on the vehicle—it is referred to as mechanical power. Taking into account internal power losses in the electric motor and transmission system, the required total power of the electric motor (defined by the change in electric current and voltage) is referred to as electrical power. Electric motor power (mechanical and electrical) is shown in
Figure 7.
In
Figure 7, electric motor power has positive value for power delivered to the wheels (for vehicle propulsion), and negative power is the power delivered from the wheels (regenerative braking power).
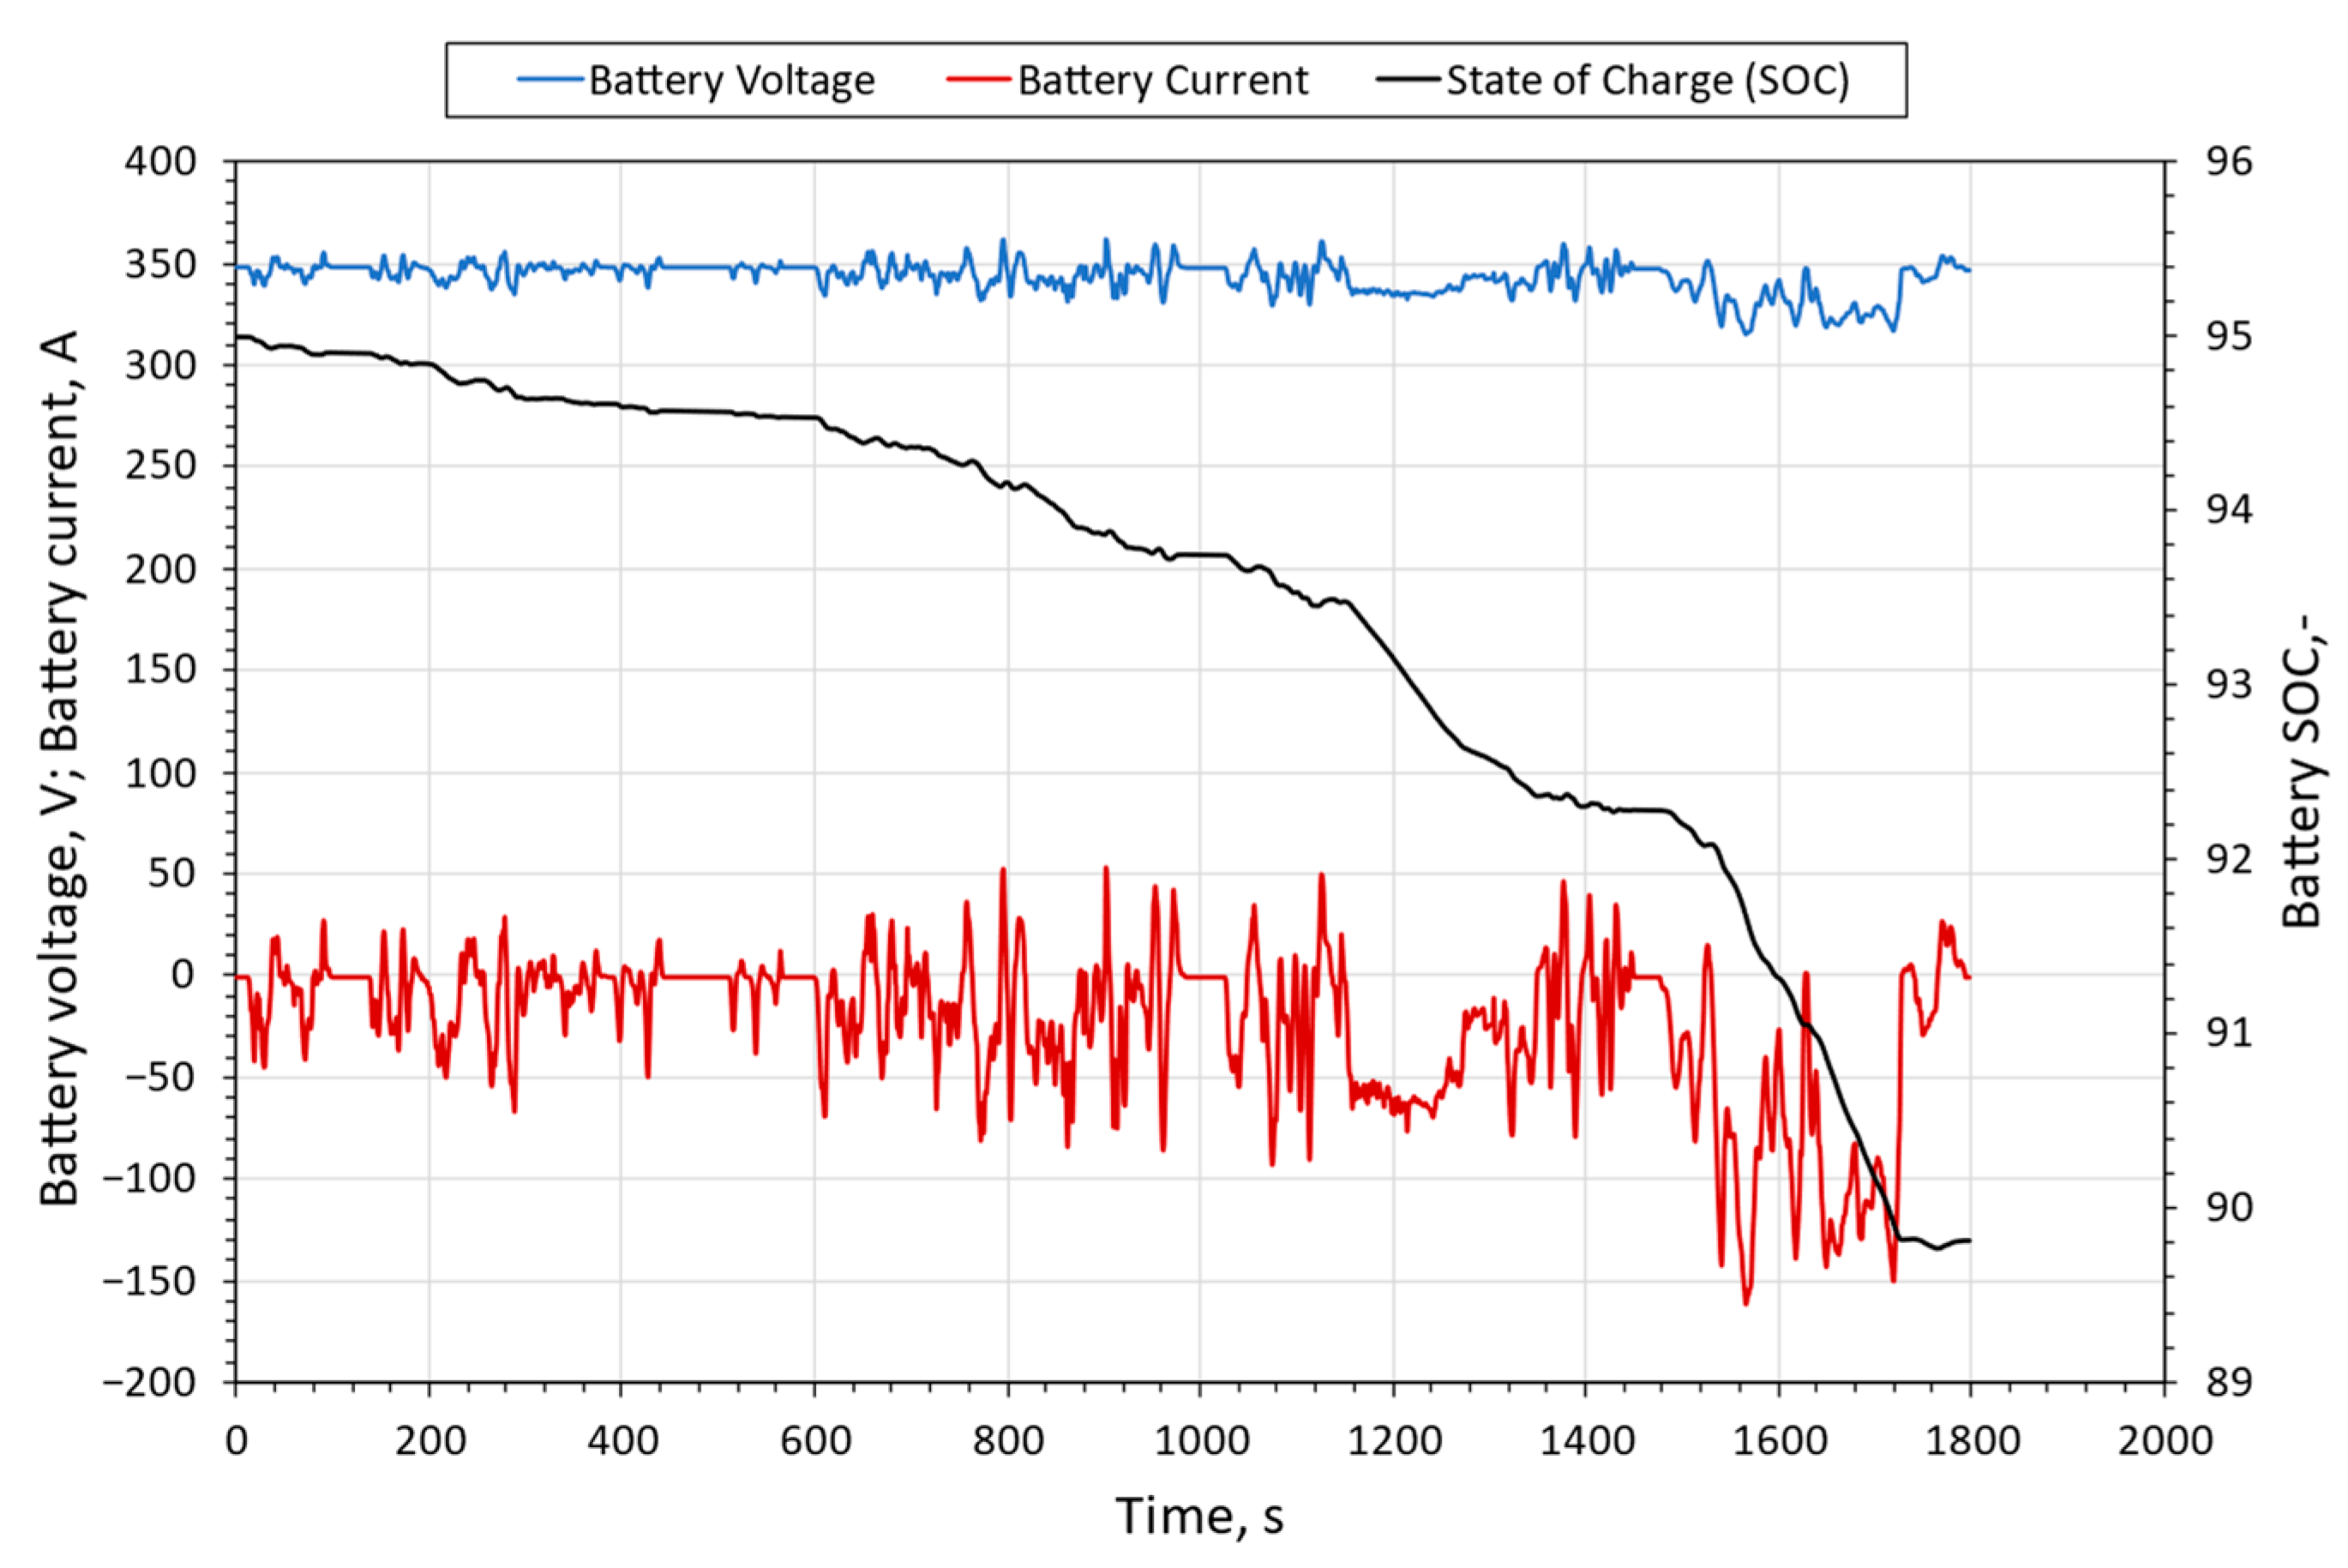
Changes in battery voltage and battery current during the driving cycle are shown in
Figure 8. These parameters, as well as battery electrical power (
Figure 9), change in accordance to road loads defined by the driving cycle. The state of charge (SOC) of the battery is also shown in
Figure 8. The initial value of the battery SOC is 95%.
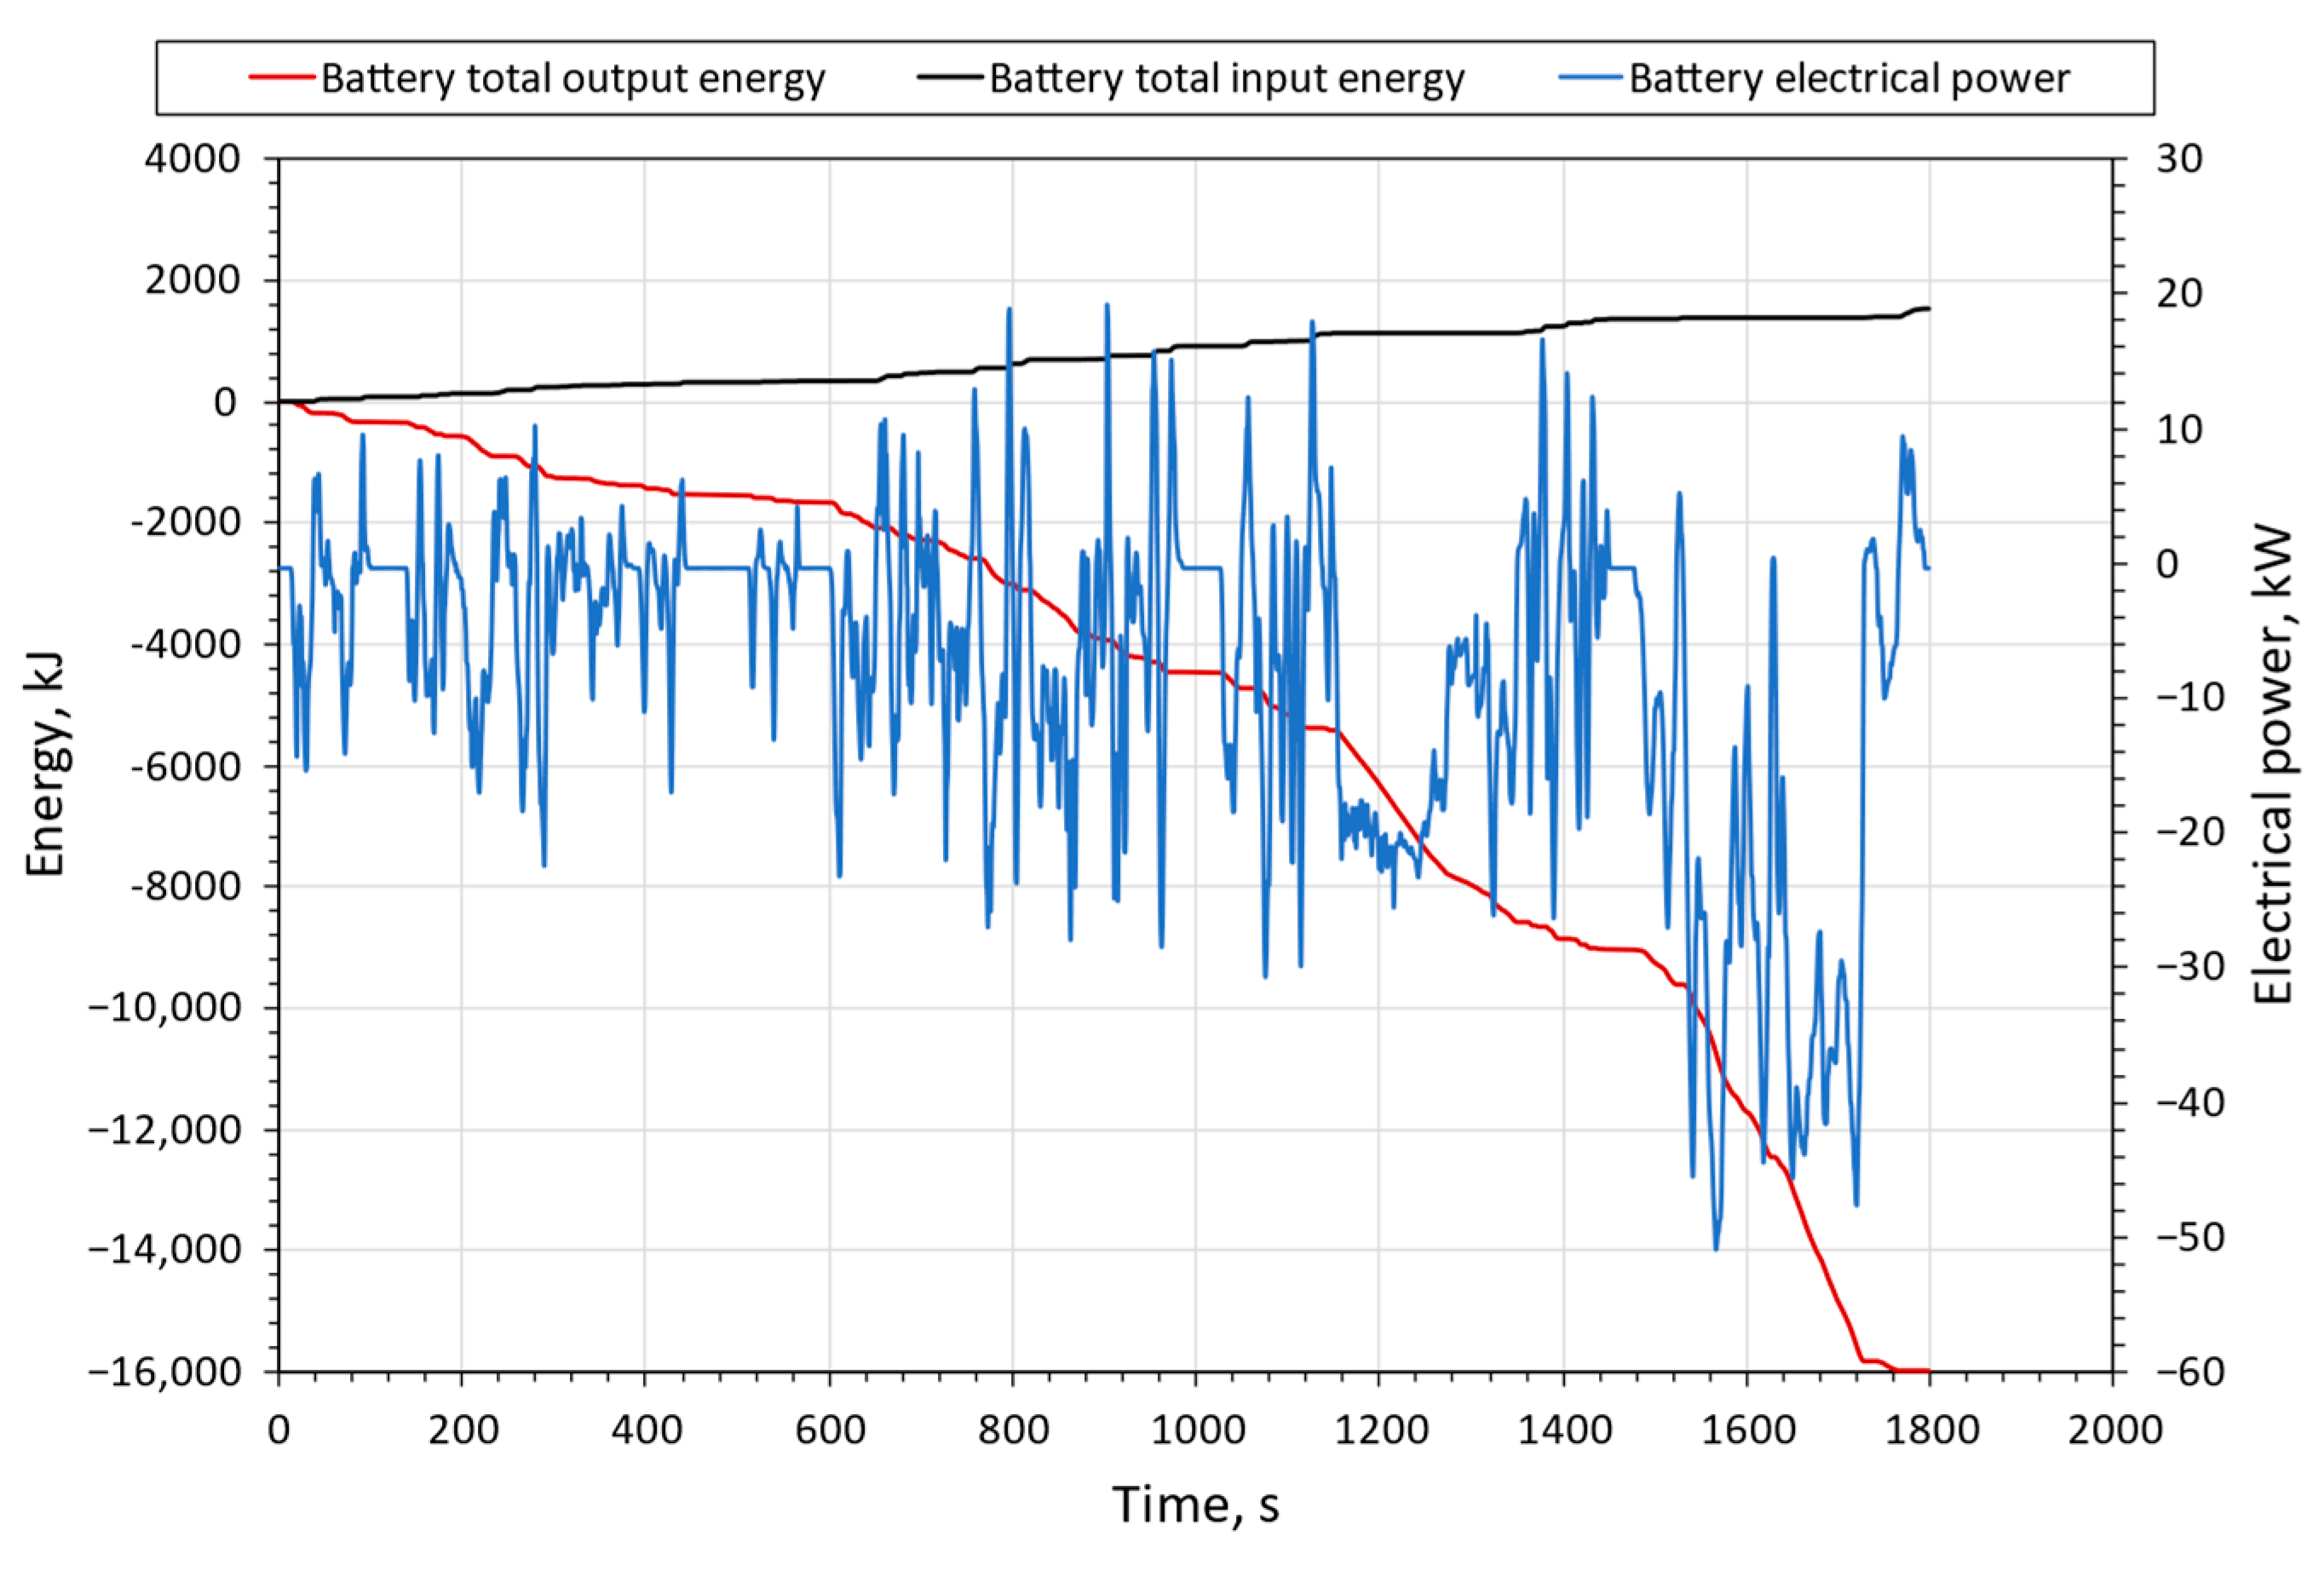
Battery electrical power is shown in
Figure 9 and correlates to electric motor electrical power (
Figure 7), taking into account battery losses. Battery total input and output energy is also shown in
Figure 9. Battery output energy represents the energy output from the battery for vehicle propulsion (15,993 kJ), whereas battery input energy represents the regenerated energy (1523 kJ). The ability for energy regeneration is one of the great advantages of electric vehicles over conventional internal combustion-powered vehicles. For the given driving cycle (defined by the WLTC Class 3b driving cycle) and for this particular vehicle, 9.5% of the total energy needed for vehicle propulsion can be regenerated.
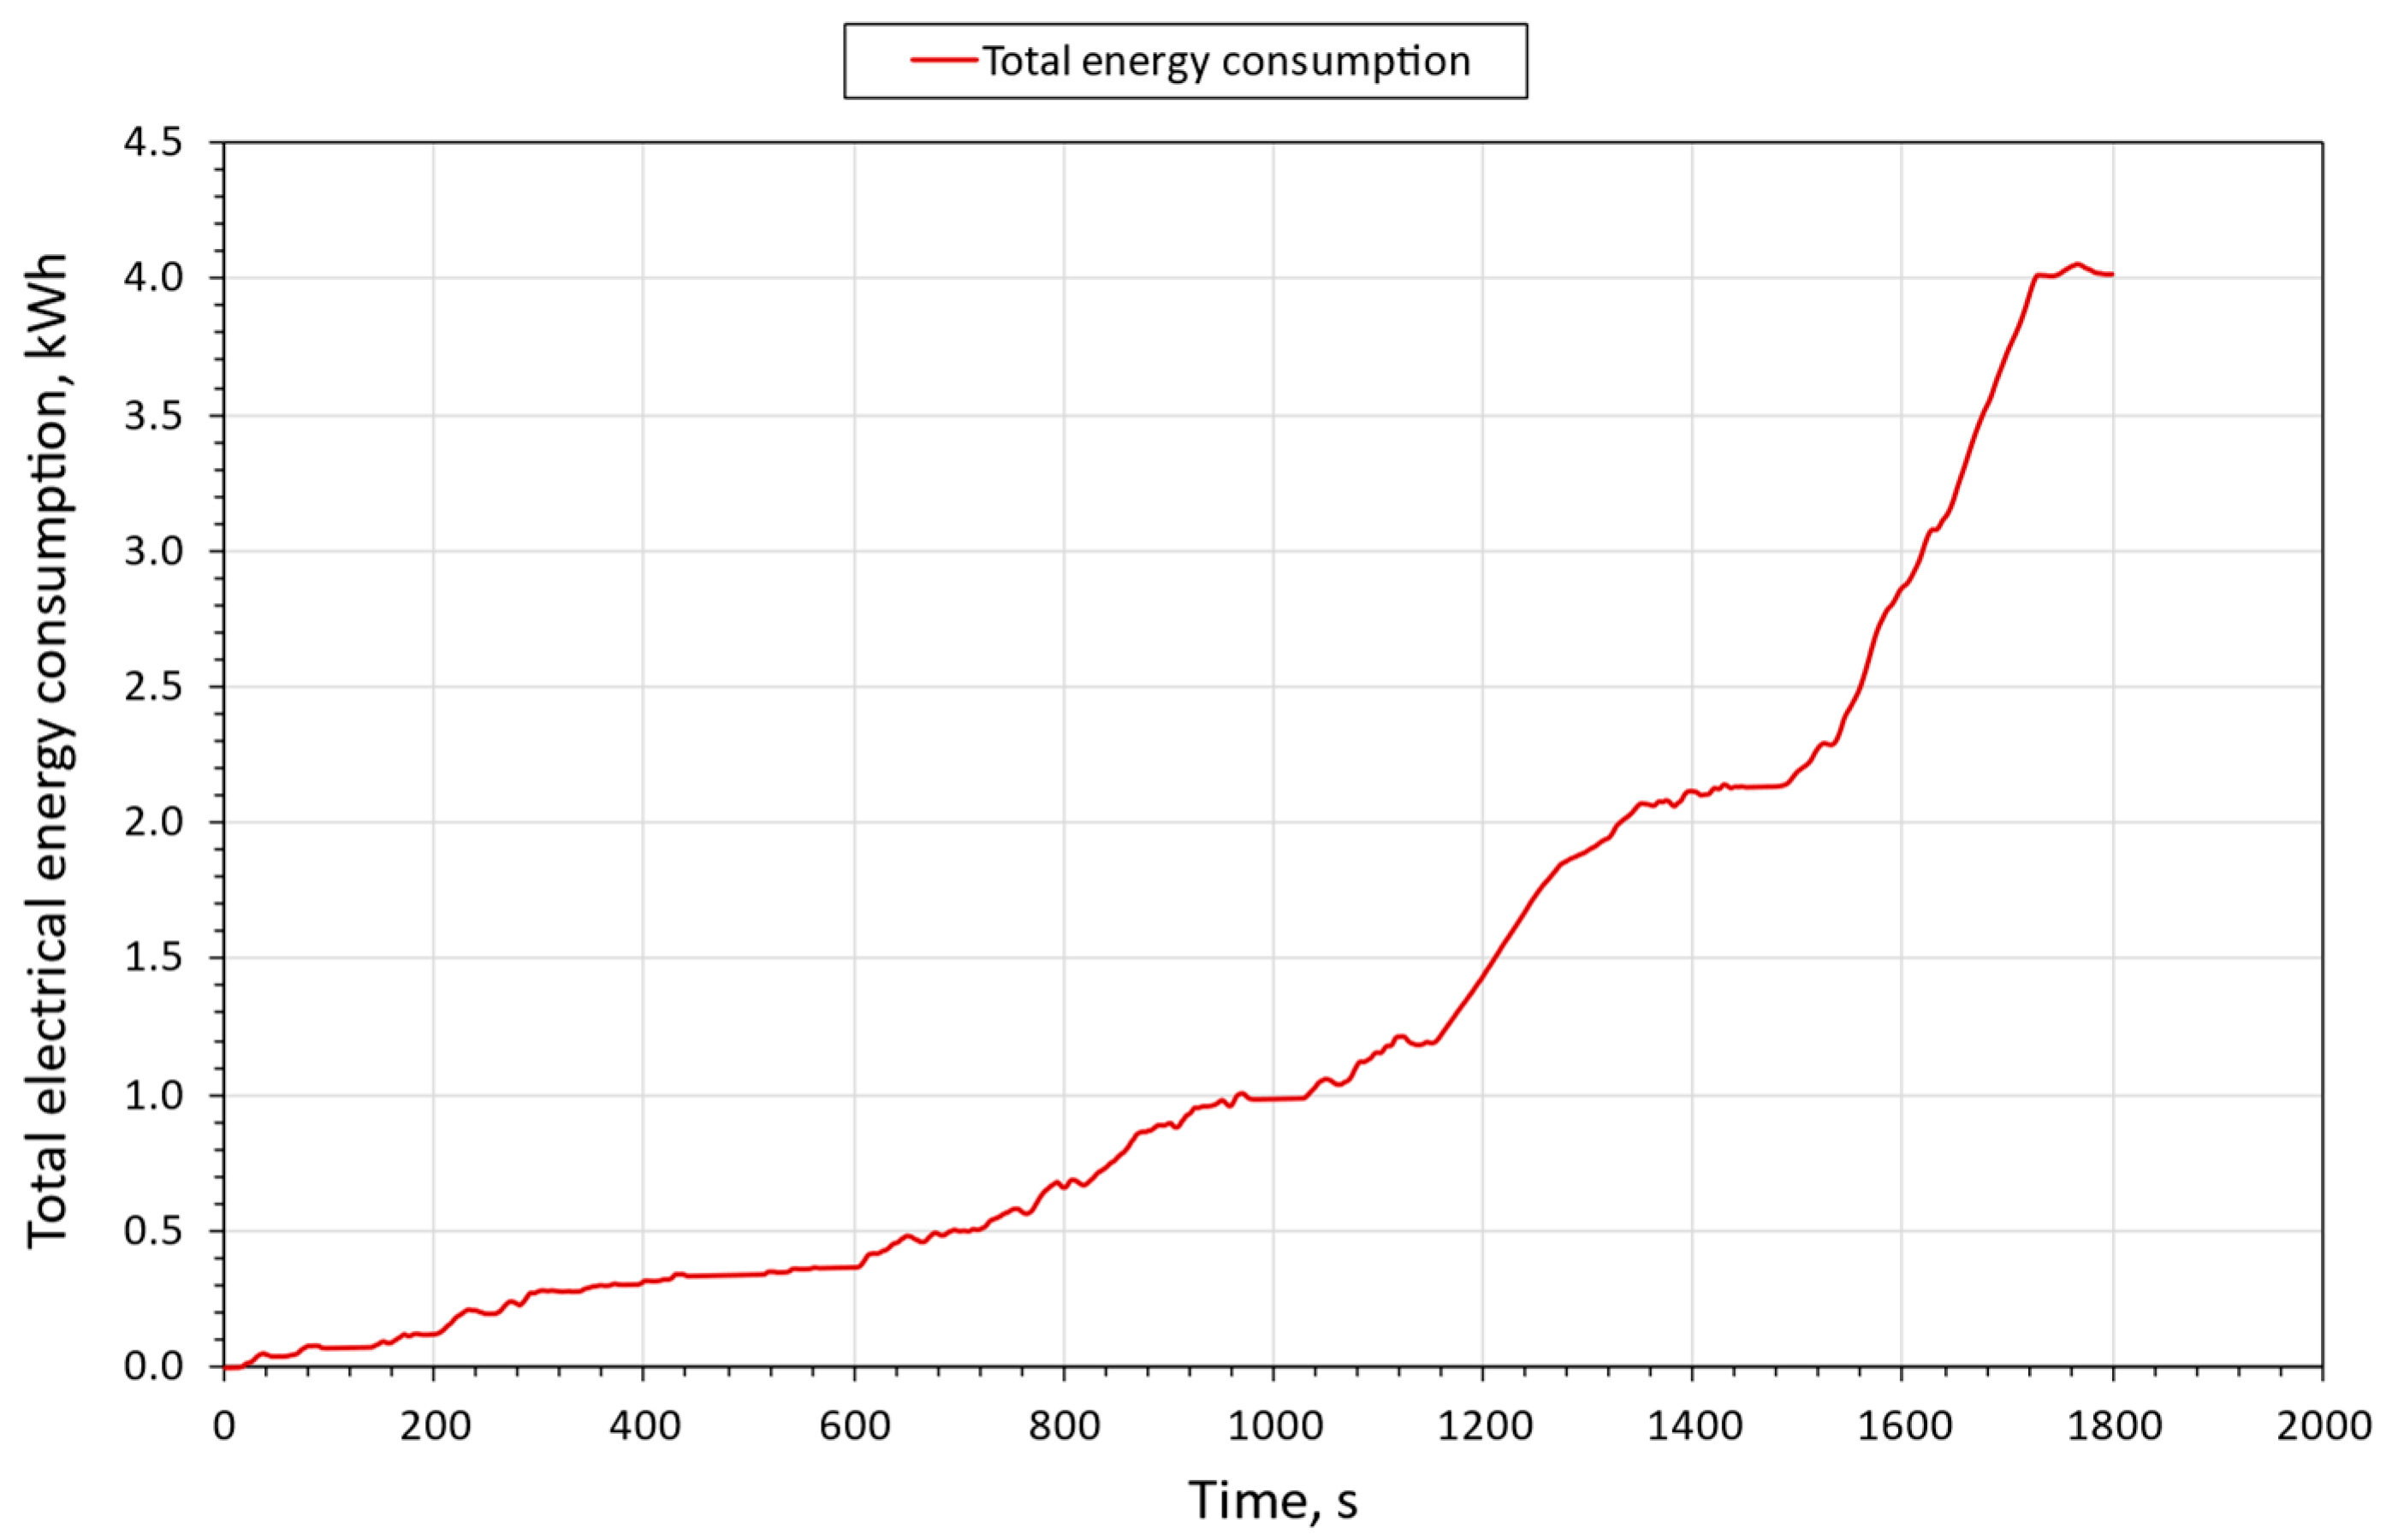
The total consumption of electric energy for this particular vehicle motion defined by the WLTC Class 3b driving cycle is 14,470 kJ (4.0194 kWh) and is shown in
Figure 10.
Taking into account the distance covered during the cycle (23.266 km), the average electrical energy consumption of the analysed electric vehicle is 0.172758 kWh per km (17.276 kWh per 100 km). This result corresponds well with the average energy consumption (WLTC) of most electric vehicles, which is in the range of 15 to 20 kWh per 100 km [
31,
32]. On an annual basis, for the 12,000 km average annual vehicle mileage, the average electrical energy consumption of one representative electric vehicle is 2073 kWh.
As already mentioned, the calculated electrical energy consumption is determined for an average electric vehicle, driving according to a standardized test cycle. The actual energy consumption for one particular vehicle may deviate from the calculated average consumption.
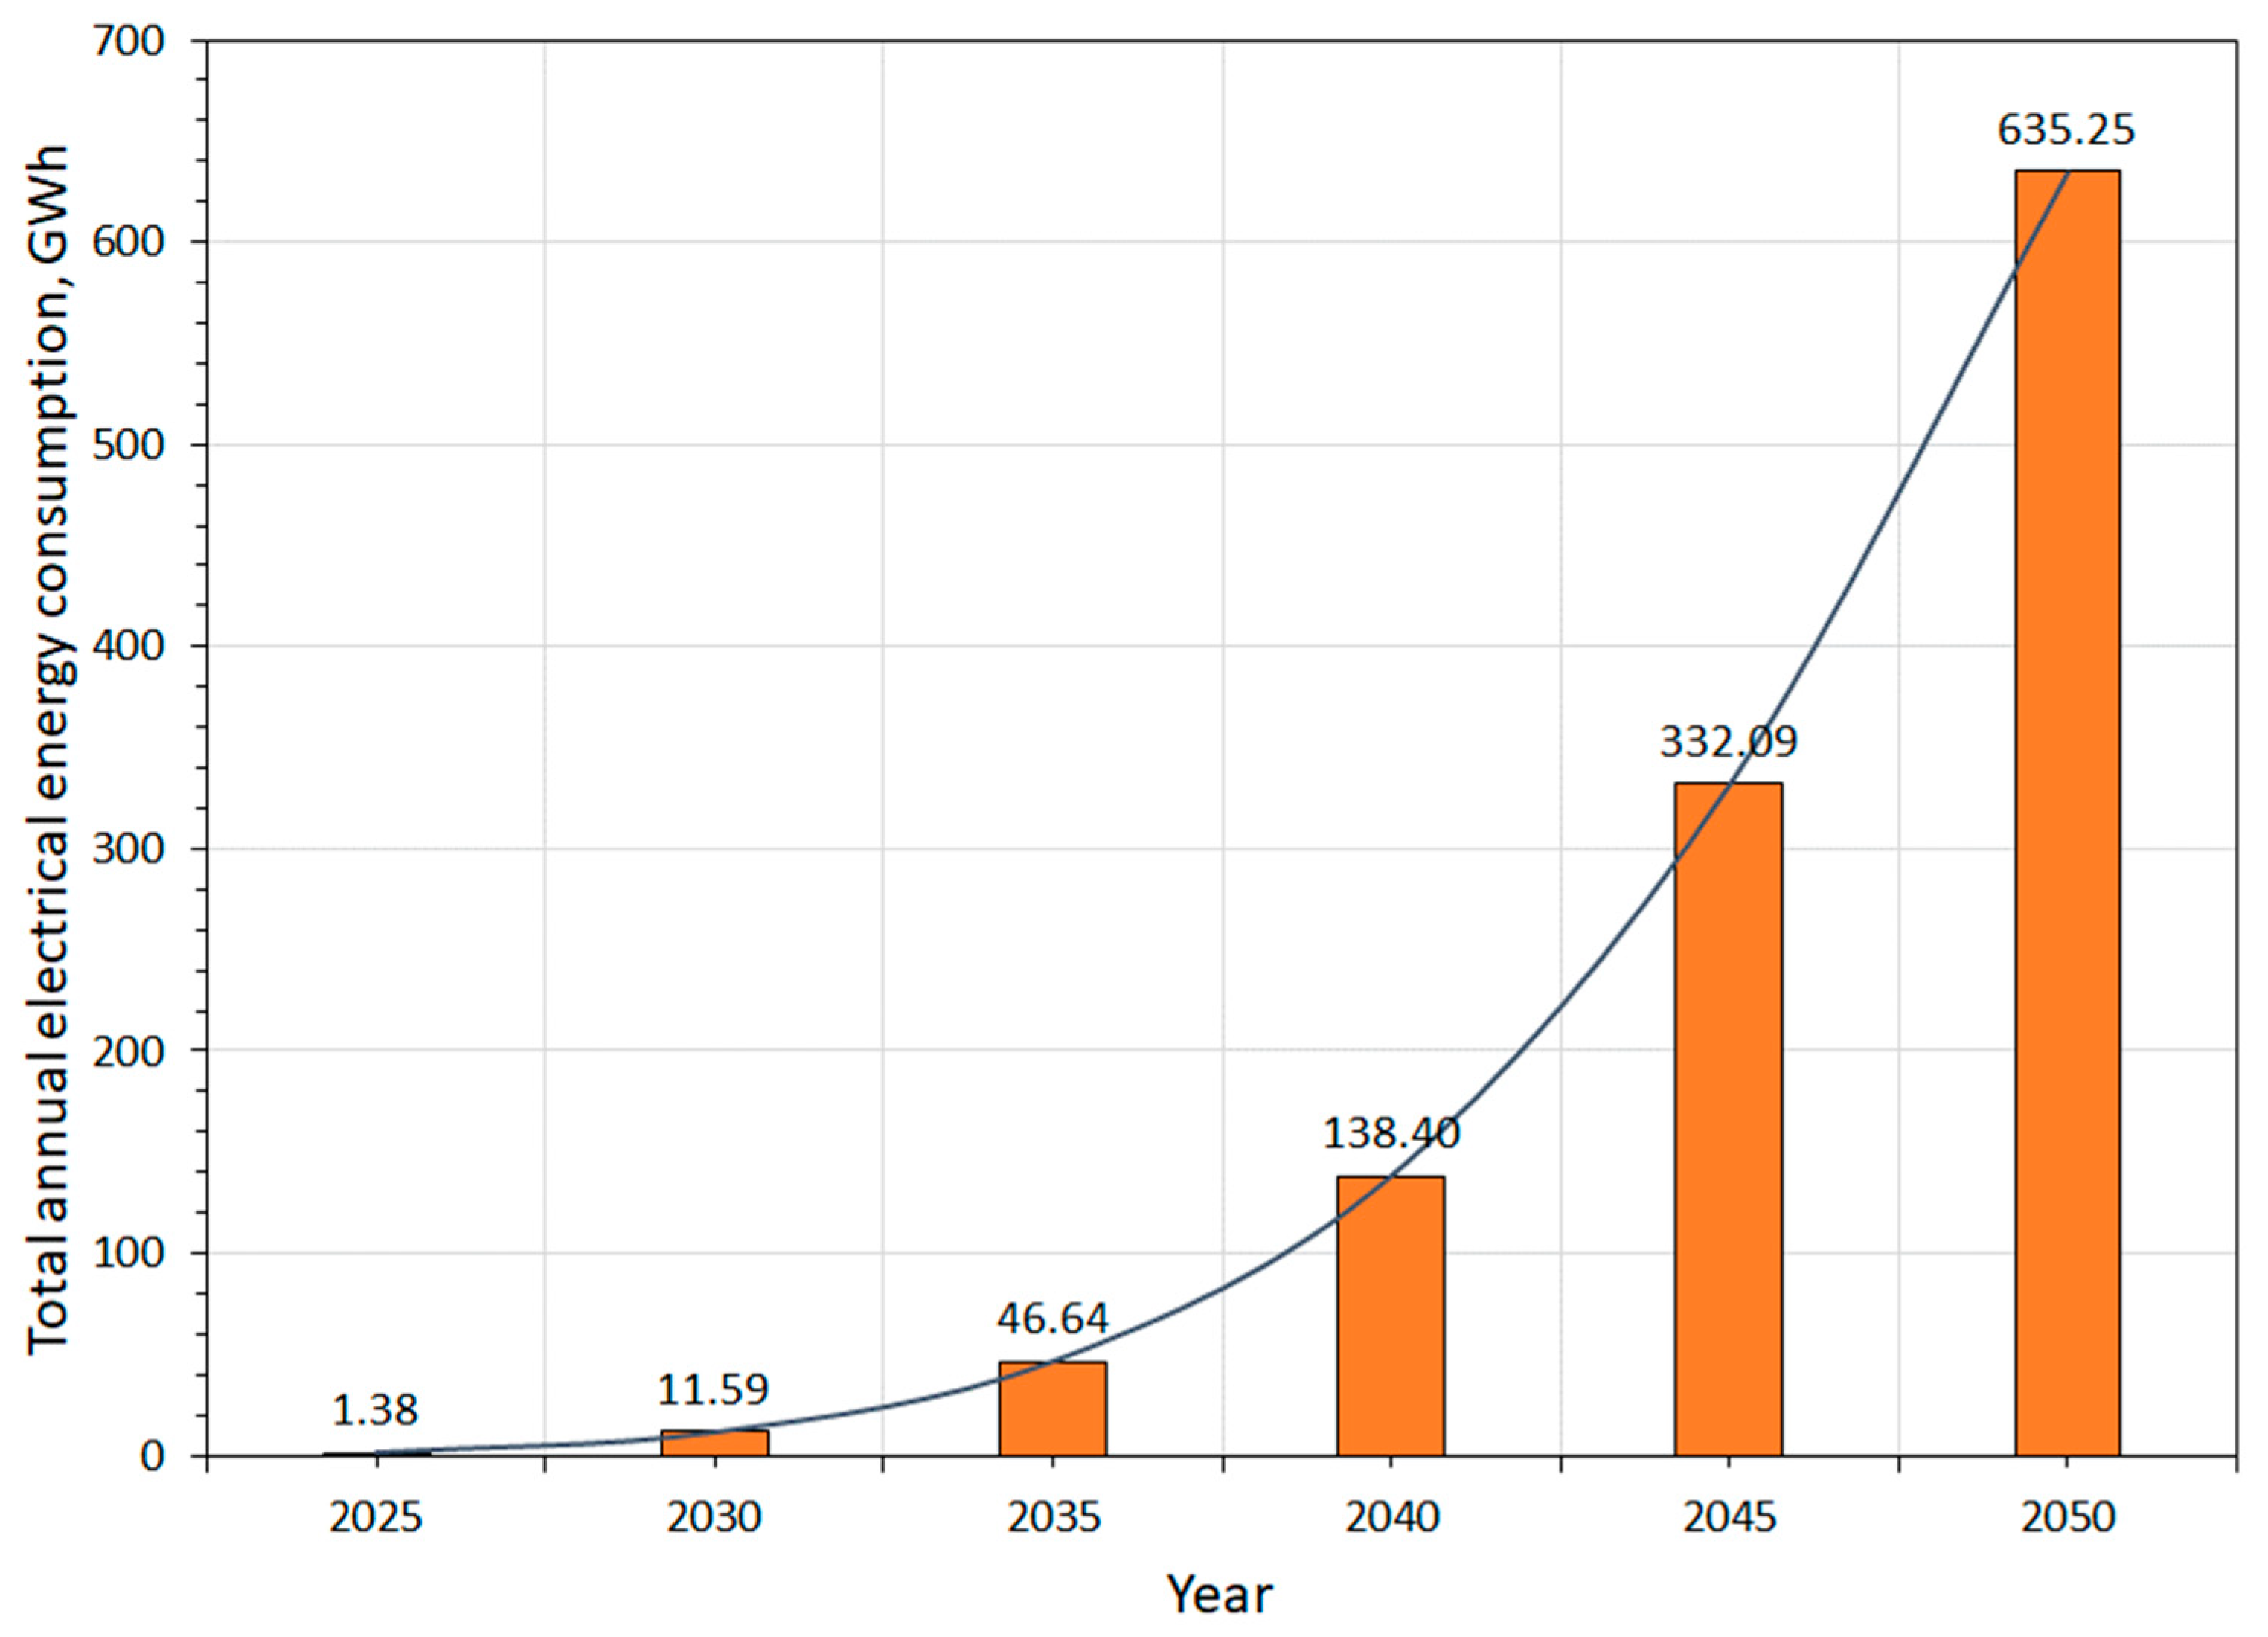
Since the average energy consumption of an electric vehicle has been calculated, based on the estimated number of electric vehicles in Bosnia and Herzegovina for the period from 2025 to 2050, it is possible to estimate the total annual electrical energy consumption by electric vehicles until 2050. This energy has to be provided by the electrical distribution network and represents additional electrical energy demands due to the electrification of the vehicle fleet. The estimated total annual electrical energy consumption by electric passenger cars in Bosnia and Herzegovina for the period 2025–2050 is shown in
Table 5 and
Figure 11.
Based on the estimated increase in the number of electric vehicles for the period from 2025 to 2050, an exponential increase in electrical energy consumption is also estimated, reaching an annual 635 GWh by 2050. For comparison, according to the Agency for Statistics of Bosnia and Herzegovina (BHAS) and State Electricity Regulatory Commission (DERK), the total annual electrical energy consumption of transport sector in 2024 (with negligible number of electric vehicles) was 63 GWh [
33,
34]. This means that, according to our estimations, the annual consumption of electrical energy of the transport sector in Bosnia and Herzegovina will increase by a factor of 10 over the next 25 years. This increase will be gradual in the initial period; an increase of 74% compared to 2024 is estimated in the next 10 years, after which there will be a sharp increase in electrical energy consumption. This means that planning for the growth and development of the electrical distribution network should already be underway to meet the increased demands for electrical power.
In order to expand the previous analysis, several more scenarios for the increase in the number of electric vehicles in Bosnia and Herzegovina and their impact on the total electrical energy consumption will be considered (
Table 6). In addition to the estimations presented in this paper (scenario 1), a slightly more optimistic scenario for the increase in the number of electric vehicles (scenario 2) presented in paper [
35] is analysed. Furthermore, for the purpose of academic discussion, two more scenarios will be taken into account: scenarios that assume that the share of electric vehicles in the total number of passenger cars in 2050 will be 50% (scenario 3) and that the number of electric vehicles (including fuel-cell cars) in 2050 will reach one million units (scenario 4) [
36]. By the opinion of the authors, the last two scenarios are highly difficult to achieve, practically unrealistic.
All scenarios estimated a significant increase in electrical energy consumption in 2050 due to growth in the number of electric vehicles. Realistic scenarios for the number of electric vehicles (scenarios 1 and 2) estimate that electrical energy consumption from electric vehicles will be 10 and 19 times higher, respectively, than the total energy consumption of the transport sector in 2024. Significantly optimistic scenarios (scenarios 3 and 4) estimate that energy consumption will be 28 and 33 times higher, respectively, than the total energy consumption of the transport sector in 2024. If this energy consumption is compared with the total electrical energy consumption of households in Bosnia and Herzegovina in 2024, which amounted to 5242 GWh [
34], a conclusion can be reached that due to the electrification of the vehicle fleet, it will be necessary to provide additional electrical power amounting to 12.1% and 22.8%, respectively, of the total household consumption in 2024 for a realistic scenario of the number of electric vehicles (scenario 1 and 2). For the other two scenarios (scenarios 3 and 4), an additional increase in electrical energy consumption is estimated to be 34.2% and 39.5%, respectively, of total household consumption in 2024.
As mentioned before, an increase in the number of electric vehicles will lead to a significant increase in total electrical energy consumption. With increasing numbers of electric vehicles comes increased demand for electrical energy, and additional sources of electrical power will be needed to meet the increased demand. To maintain the environmental benefit of electric vehicles, new power sources must be environmentally friendly. Today, most of the electrical energy produced in Bosnia and Herzegovina comes from thermal power plants. In 2024, the total electrical energy production was 14,044 GWh, of which 34.5% was hydro-power-plant-produced energy and 4.85% was solar- and wind-power-plant-produced electrical energy [
37]. Additional efforts need to be made in the future to increase electrical energy production from renewable sources, and new investments in renewable energy sources will be necessary.
5. Conclusions
This paper analyses the impact of the future electrification of the vehicle fleet in Bosnia and Herzegovina on the total electrical energy consumption, in terms of increasing demand for electrical power. Based on available statistical data, the number and structure of vehicles in Bosnia and Herzegovina in the period 2010–2024 is analysed. An approximately linear increase in the total number of passenger cars is determined, up to the current number of 1,094,241 passenger vehicles, as well as an approximately constant number of brand-new cars (9215 new cars in 2024). The number of electric and hybrid vehicles is negligible compared to the total number of passenger cars (0.58%). By using these data, and by introducing certain assumptions based on the real situation and trends in the domestic car market, the number of electric passenger cars in Bosnia and Herzegovina for the period 2025–2050 is estimated. It is estimated that in the initial period, the number of electric vehicles will increase slowly and that a significant increase in the number of electric vehicles will occur only after 2035. It is estimated that only after 2042 will the number of electric vehicles exceed 100,000 and that in 2050, the number of electric vehicles will be 306,425. The estimated total number of passenger cars in 2050 is 1,731,240, which means that the share of electric vehicles in the total number of passenger vehicles will be about 18%.
Using AVL Cruise R2020.1 simulation software, a model of one C-segment electric crossover SUV, driven by a permanent magnet synchronous motor and with a lithium-ion battery, as a representative electric vehicle, is created. A simulation of electric vehicle motion according to the WLTC Class 3b driving cycle is performed and the electrical energy consumption for the given cycle is calculated. The total consumption of electrical energy for the analysed case is 4.0194 kWh, which corresponds to an average consumption of 0.172758 kWh per km. Taking into account the average annual vehicle mileage (12,000 km), the average electrical energy consumption of one representative electric vehicle is 2073 kWh.
Based on the calculated average annual vehicle electrical energy consumption, and for the estimated number of electric vehicles in use, the total annual electrical energy consumption for the passenger car segment has been defined. Following the estimated increase in the number of electric vehicles, an exponential increase in electrical energy consumption is also estimated, reaching an annual 635 GWh in 2050. This represents a significant increase in electrical energy consumption, which is 10 times higher than the total electrical energy consumption of the transport sector in 2024, or 12.1% of the total electrical energy consumption of households in 2024. Other, much more optimistic scenarios of the increase in the number of electric vehicles and their impact on the increase in electrical energy consumption have also been analysed. In any case, the imminent electrification of the vehicle fleet will lead to a significant increase in electrical energy consumption, which will create additional loads on the electrical distribution network, as well as the need to secure new sources of electricity. Steps need to be taken now to plan and develop the electrical distribution network and new environmentally friendly energy sources, so that they can meet the increased demands of the transport sector in the future.
It is important to note that only the passenger car segment is analysed in this paper. In order to create a complete picture of the influence of vehicle fleet electrification on total electrical energy consumption, the commercial vehicle segment (light-duty and heavy-duty trucks and buses) must be included into consideration.


 ,
, 


