
A Correlational Study on Architectural Design and Thermal Distribution Patterns Using a Novel Multi-Terminal Approach in Cylindrical Li-Ion Cell-Integrated Battery Packs


Abstract
1. Introduction
2. Proposed Battery Pack Technology and Experiments
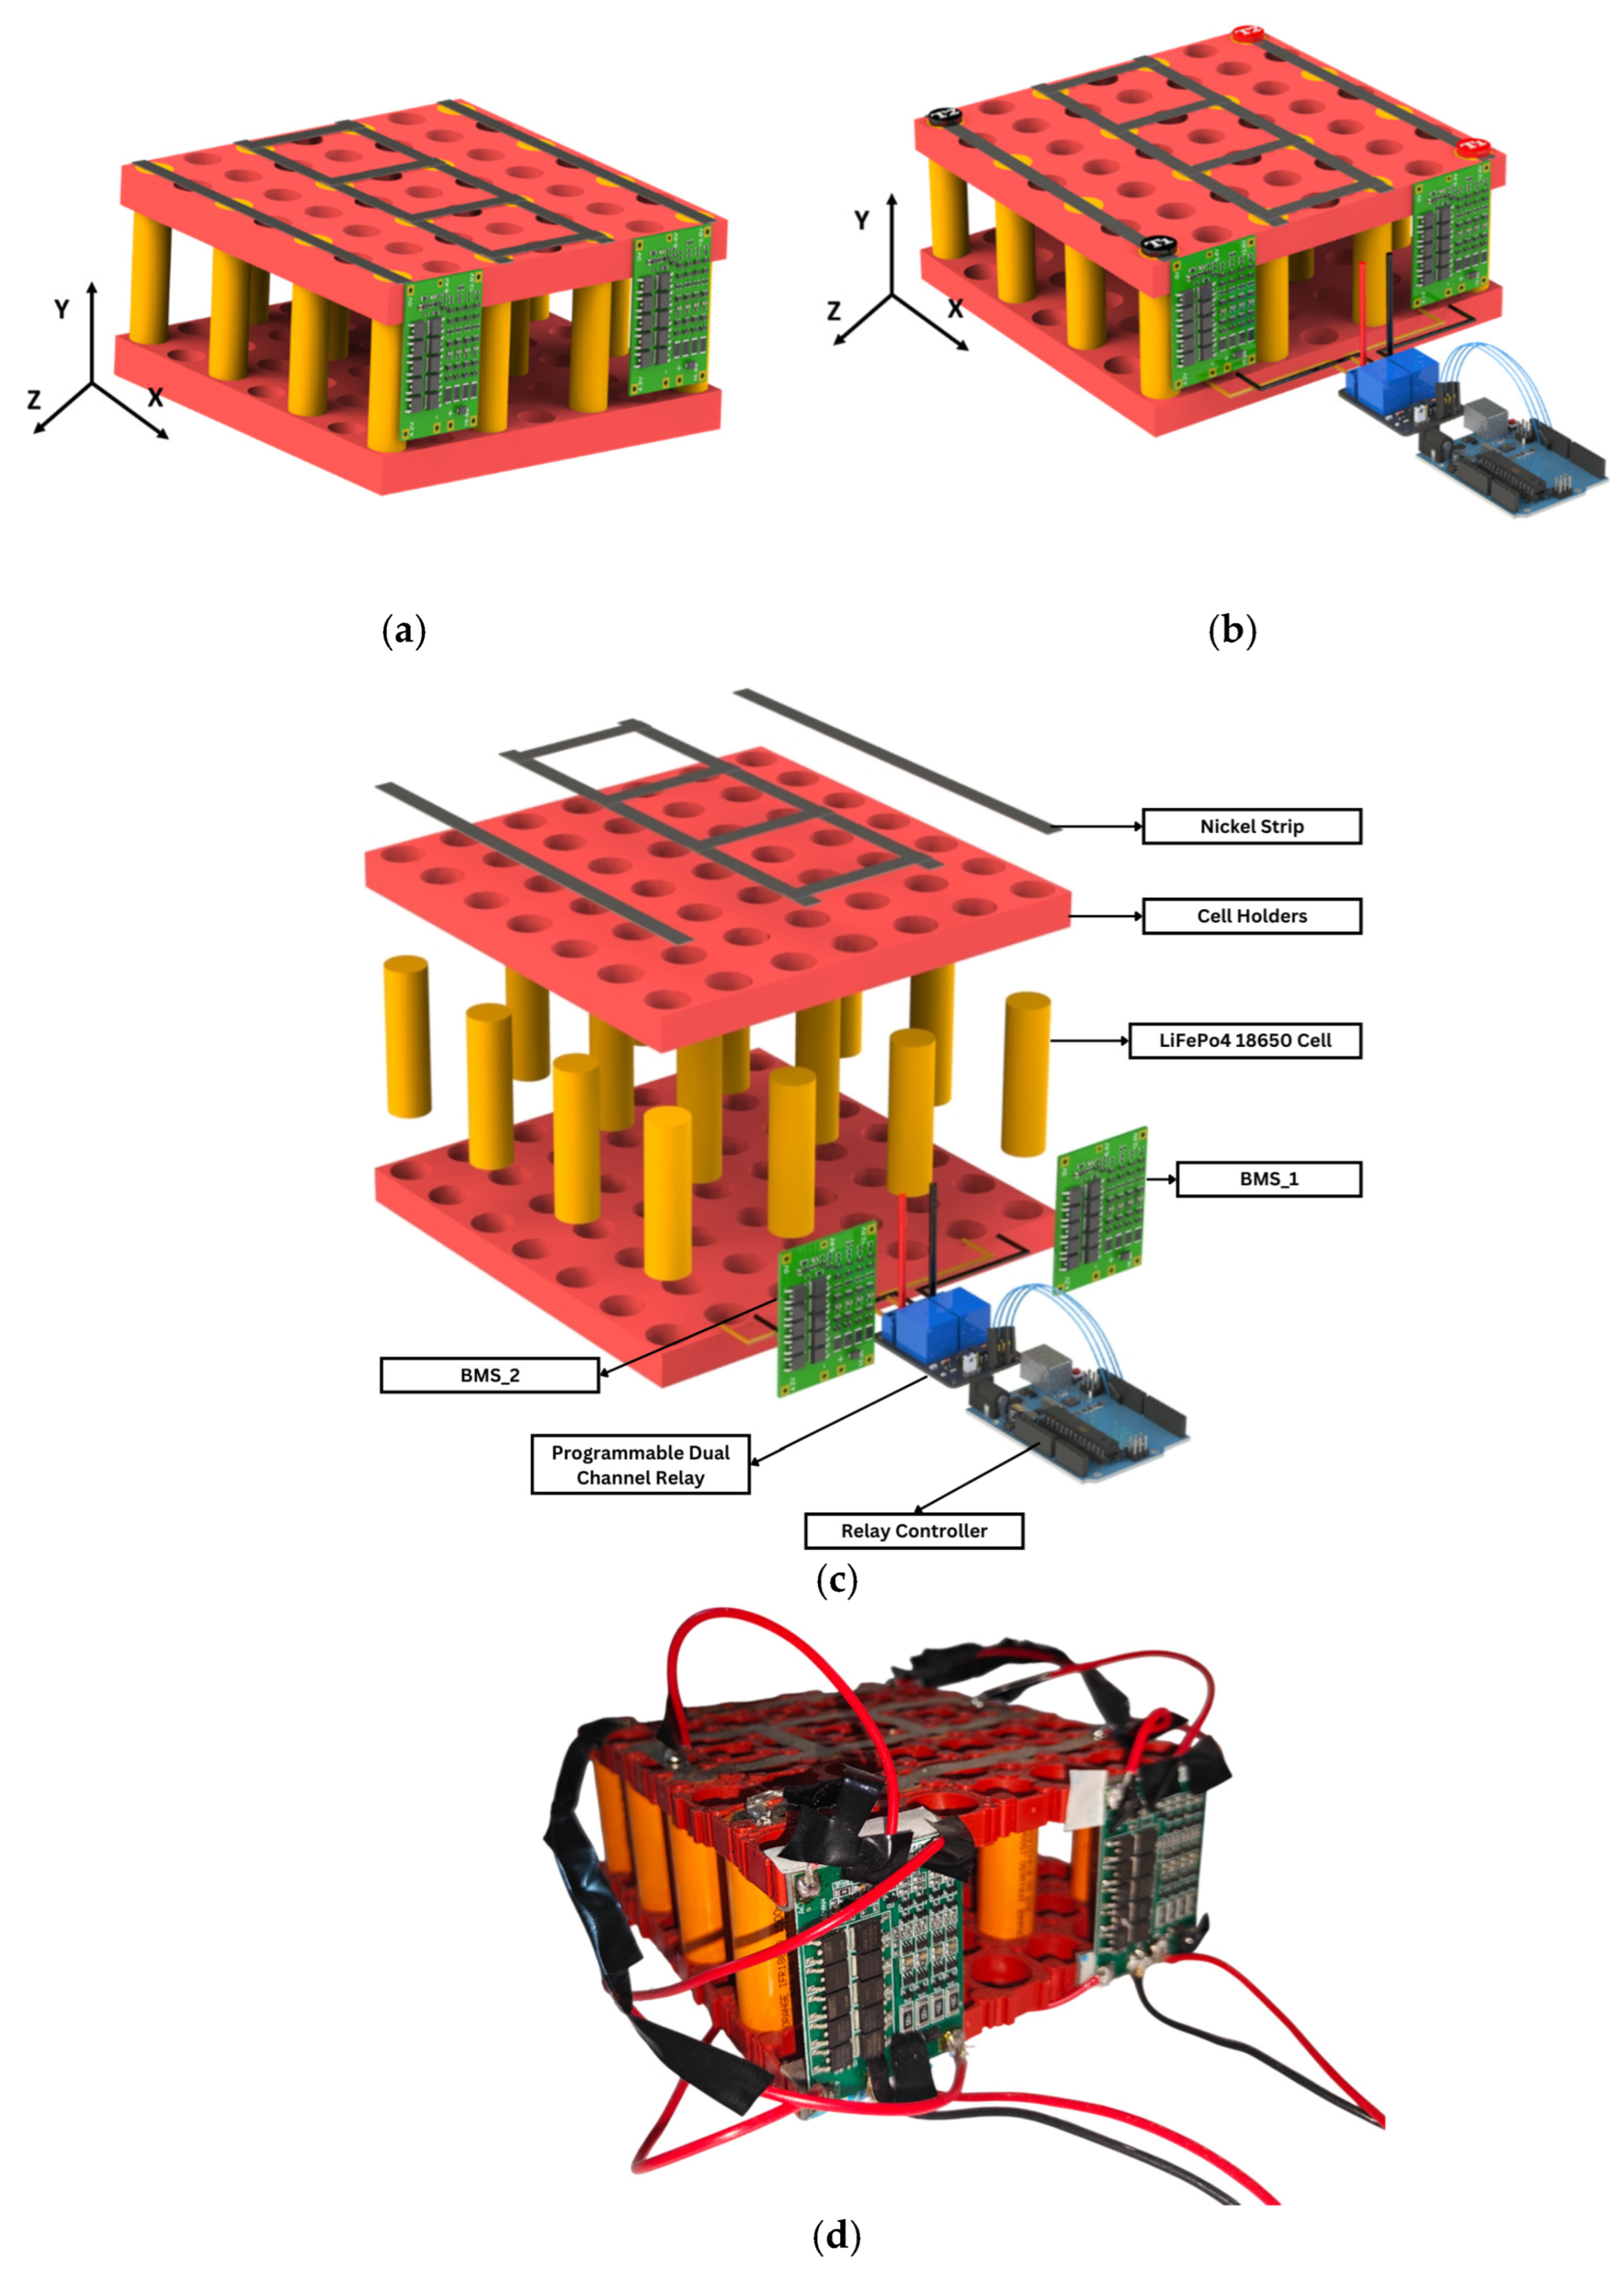
2.1. Proposed Novel Architecture of Battery Module and Battery Pack
2.2. Experimental Setup and Procedure
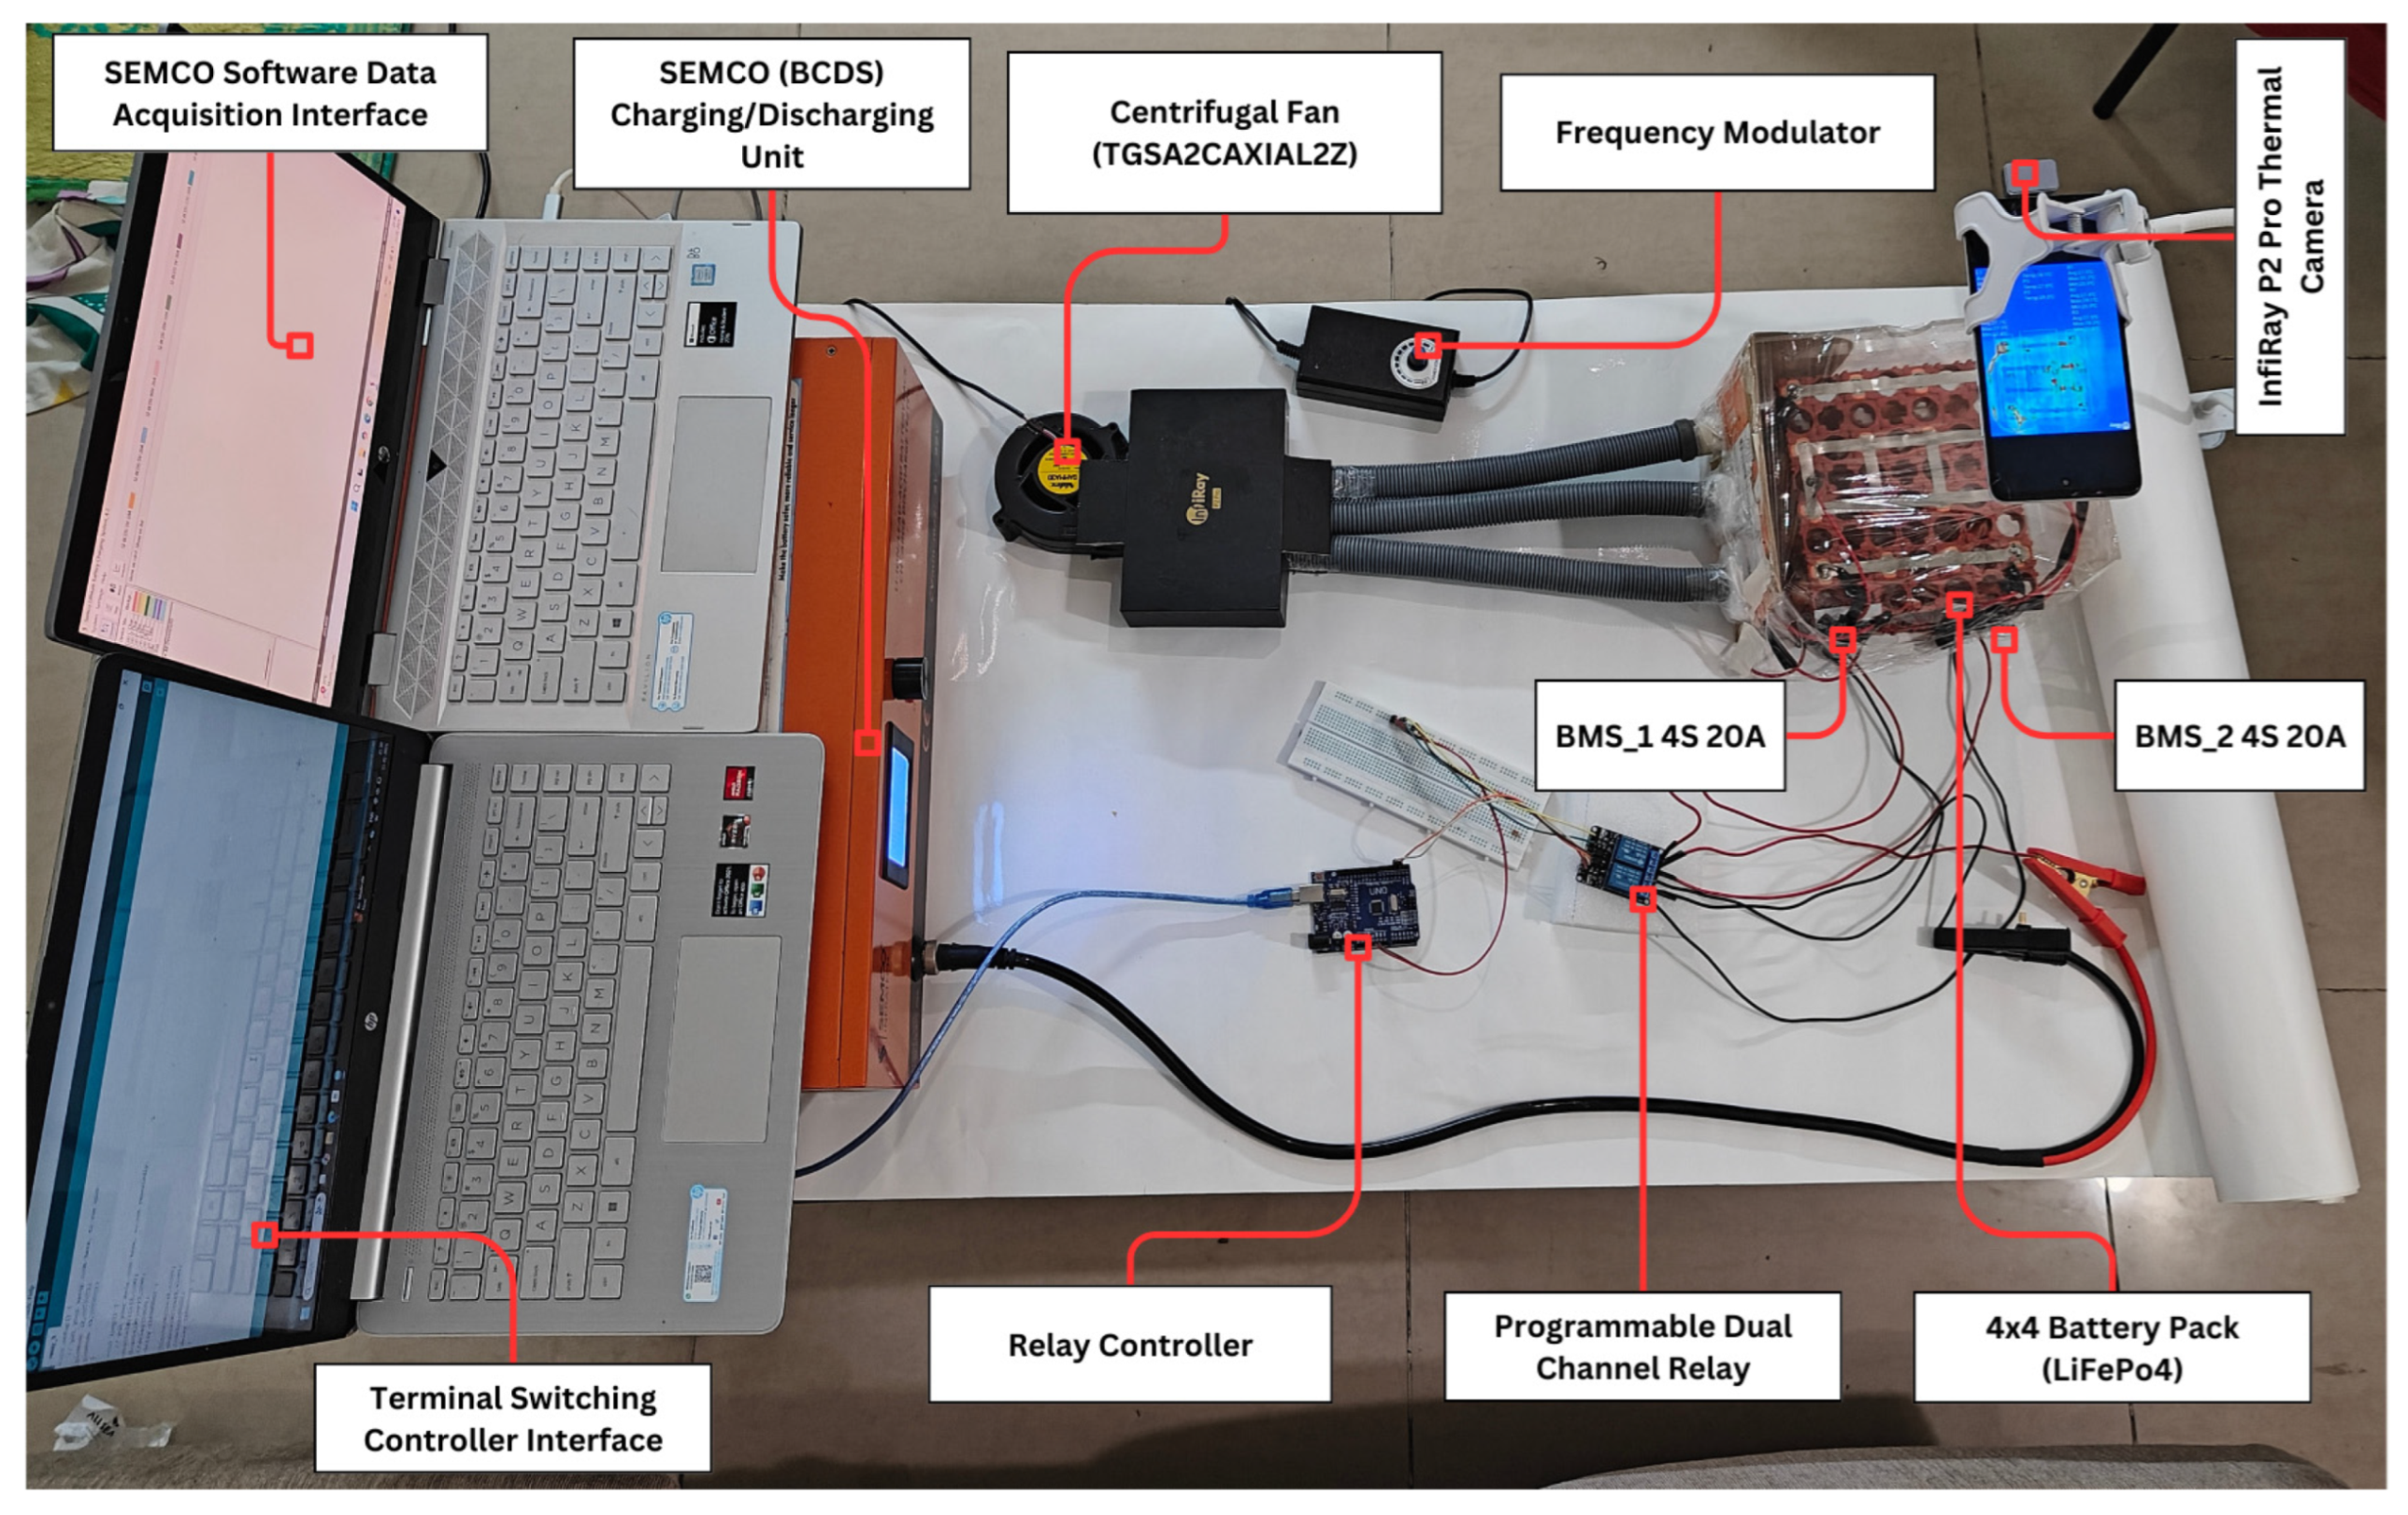
2.2.1. Experimental Setup
2.2.2. Experimental Procedure
2.3. Numerical Simulations
3. Results
3.1. Thermal Characteristics of Conventional Battery Packs Under Natural and Forced Convection for Single-Terminal Conditions (STNC/STFC)
3.2. Thermal Characteristics of Battery Packs Under Natural Convection for Multi-Terminal Conditions (MTNC)
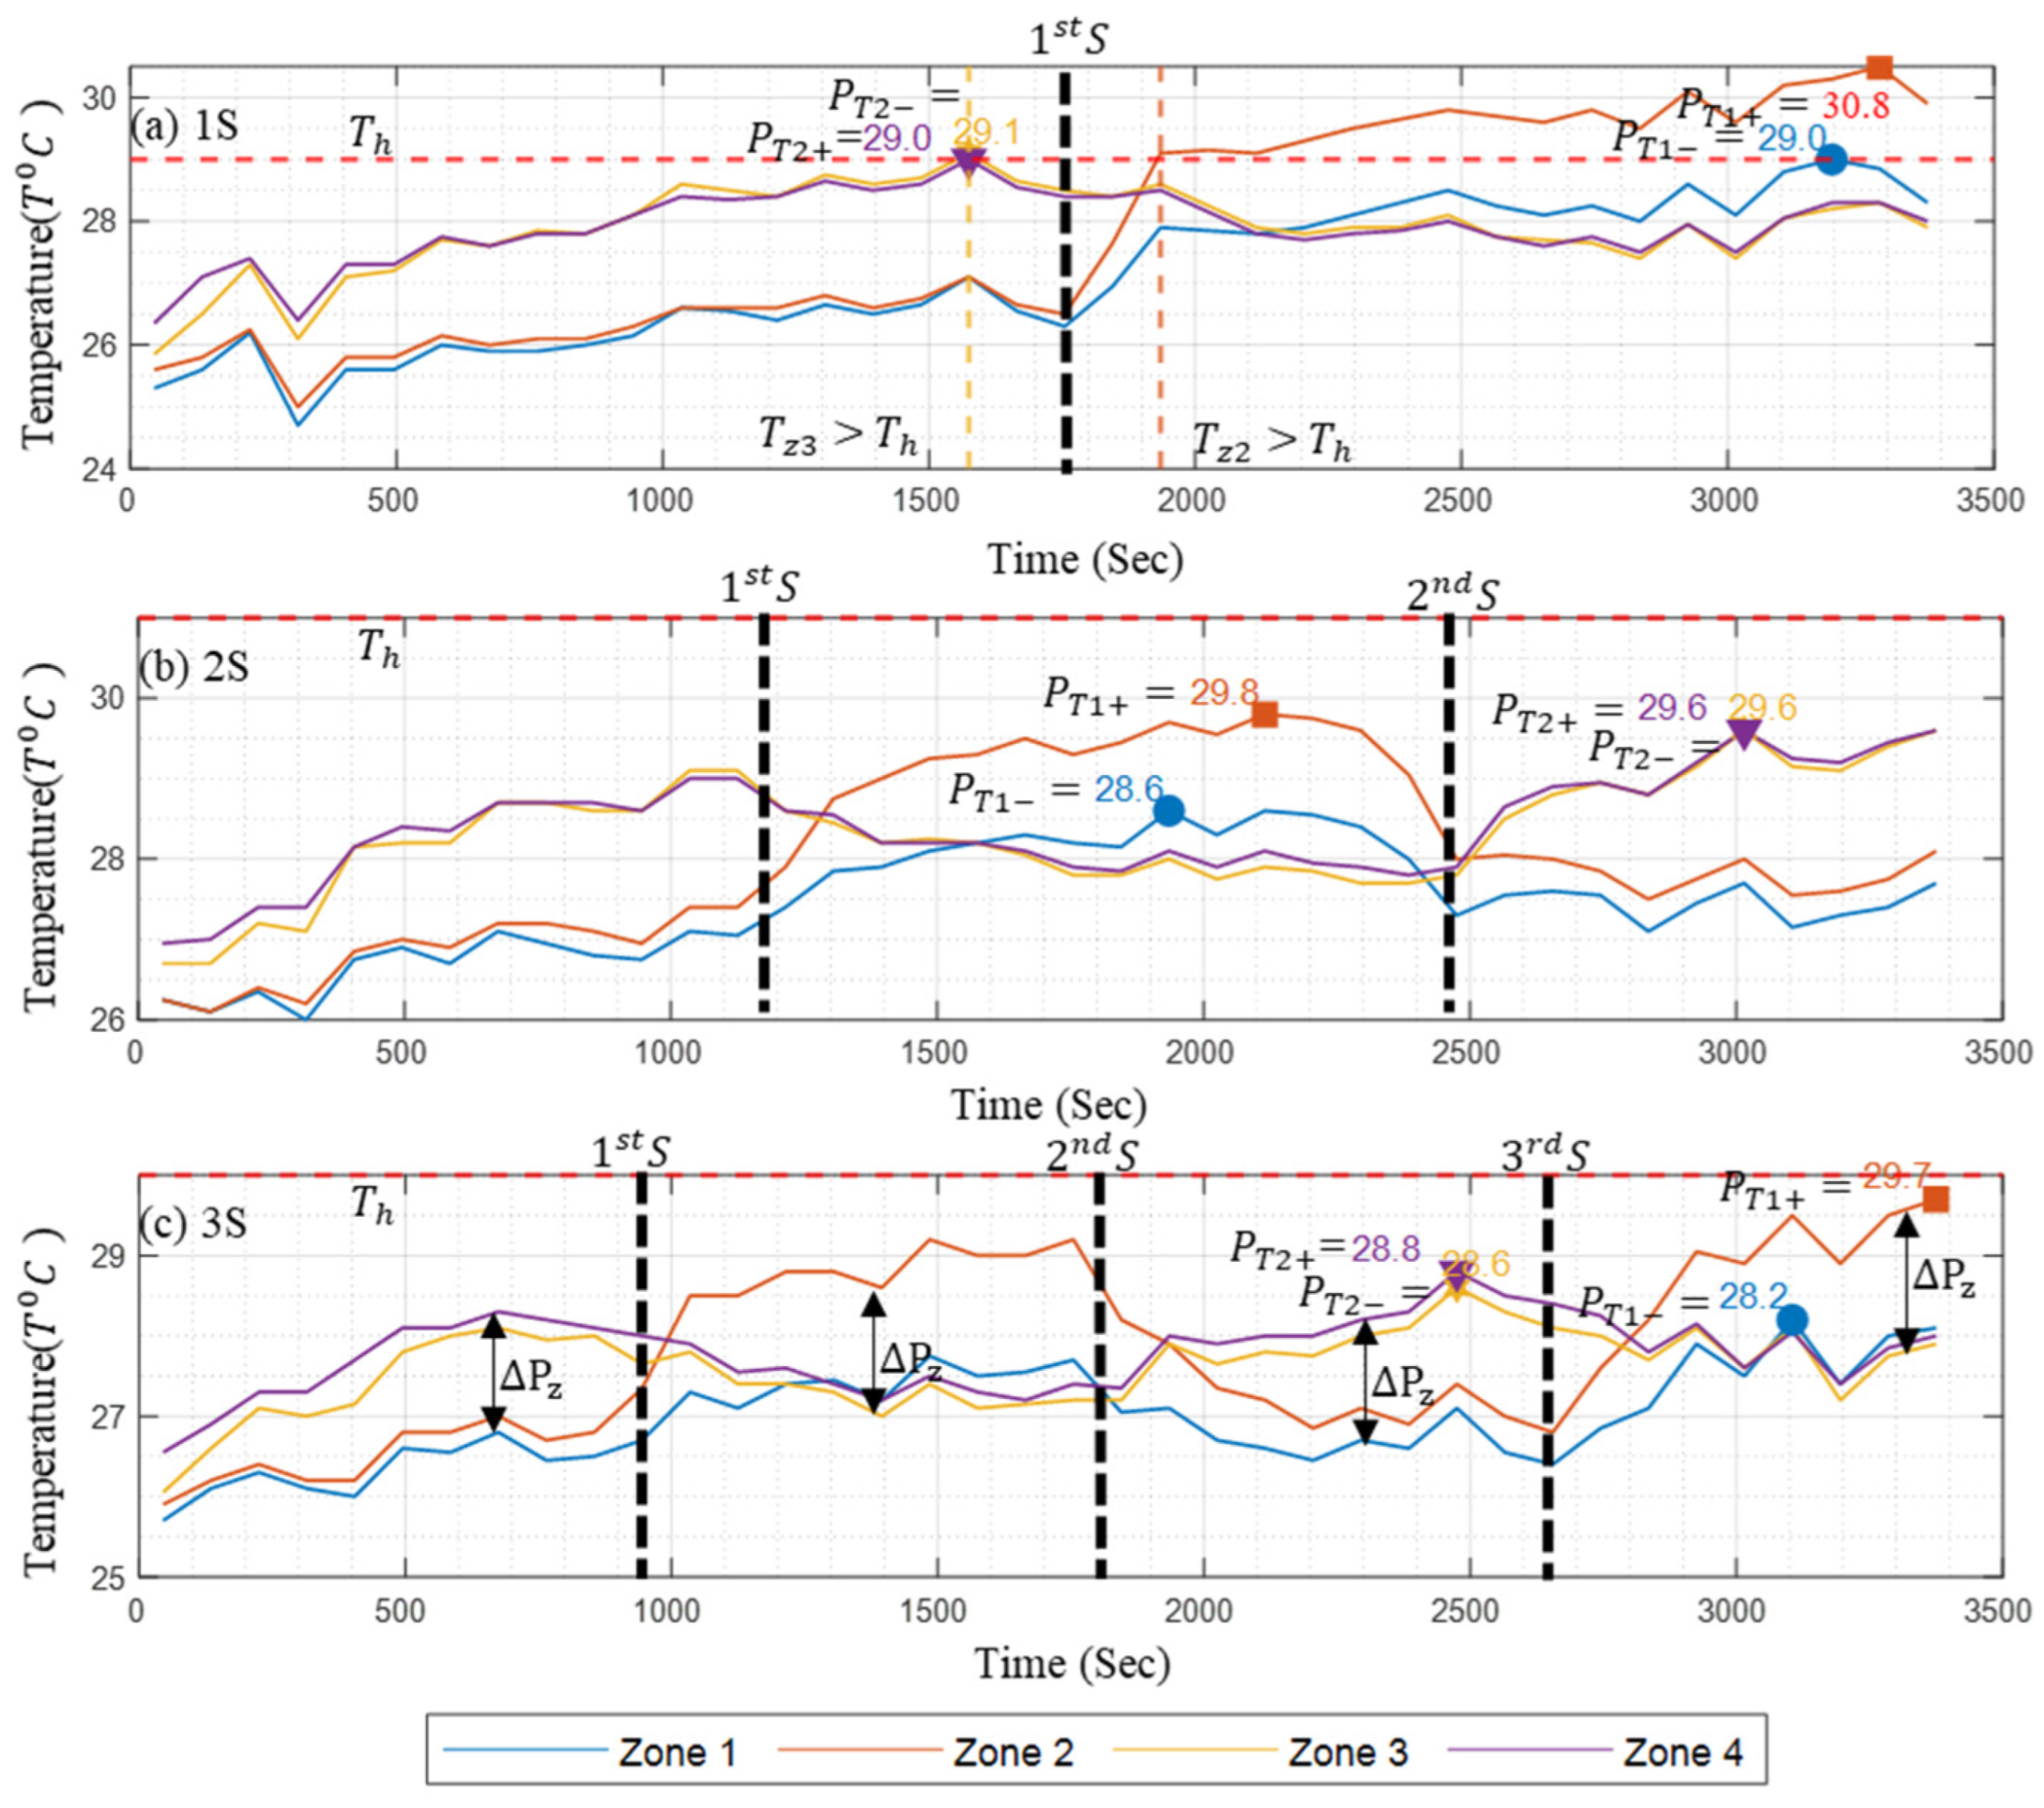
3.3. Thermal Characteristics of Battery Packs Under Forced Air-Based Convection for Multi-Terminal Conditions (MTFC)
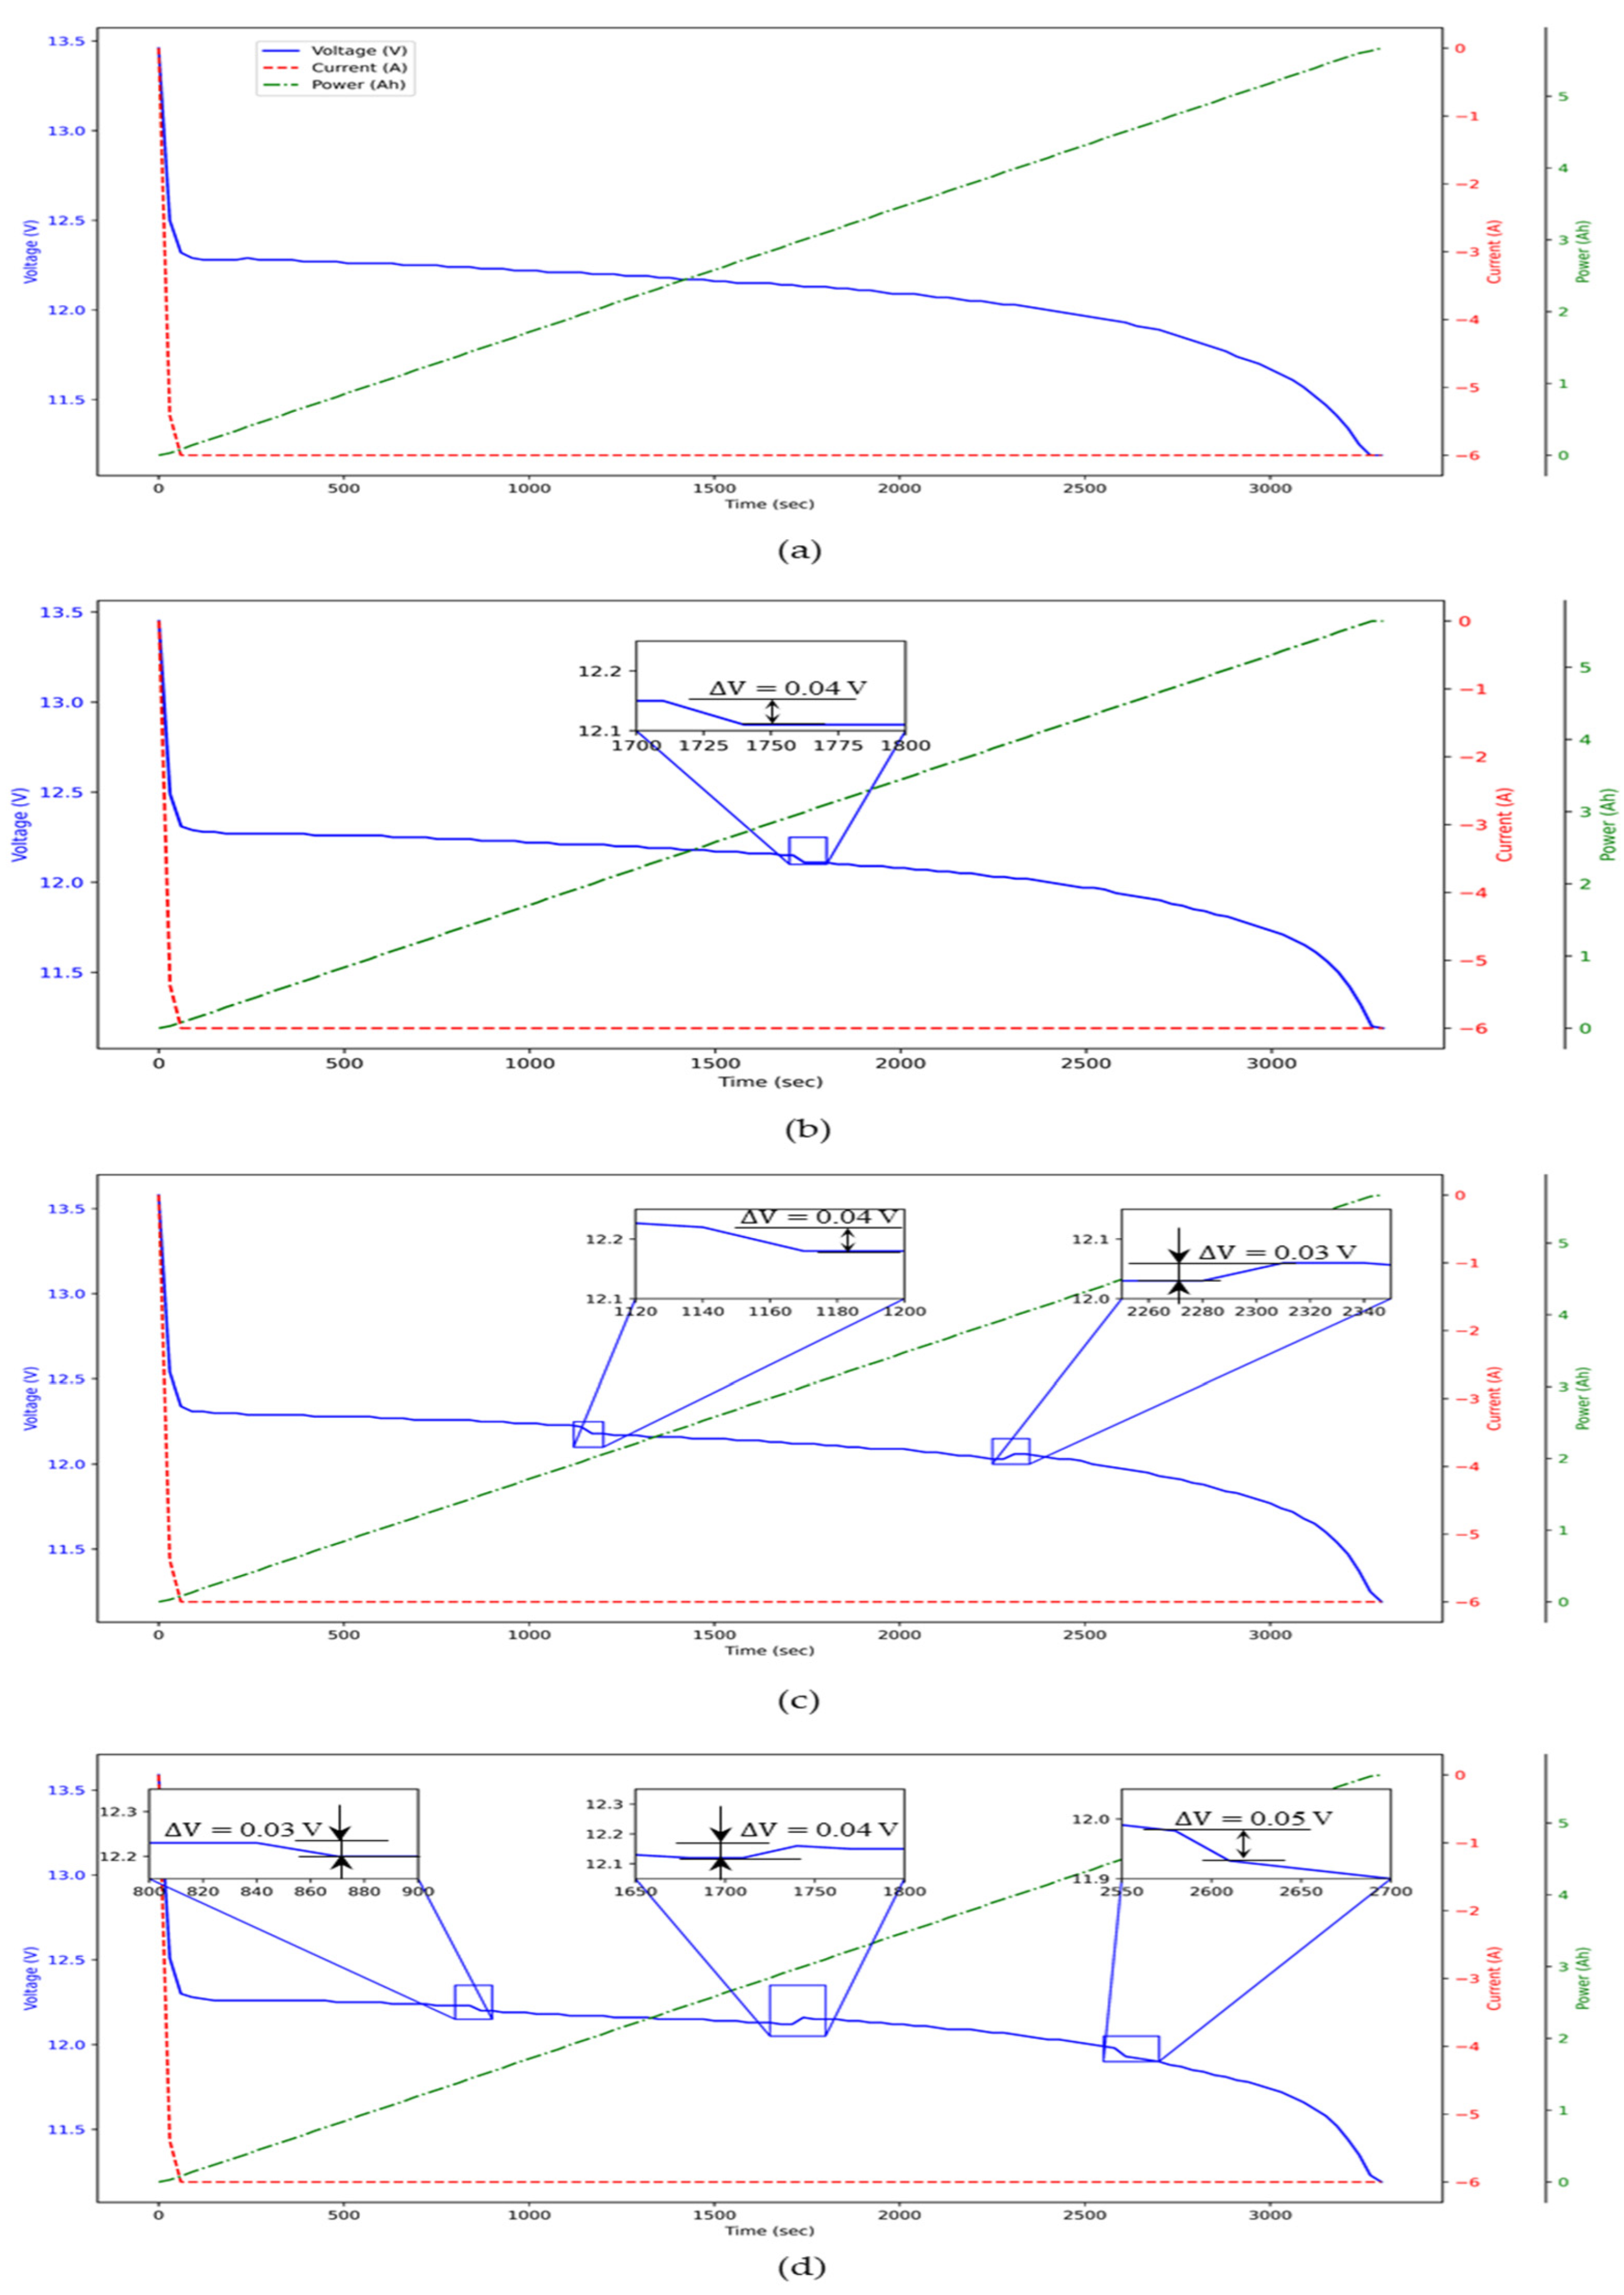
3.4. Proof of System Stability Using Voltage, Current, and Capacity
4. Discussion
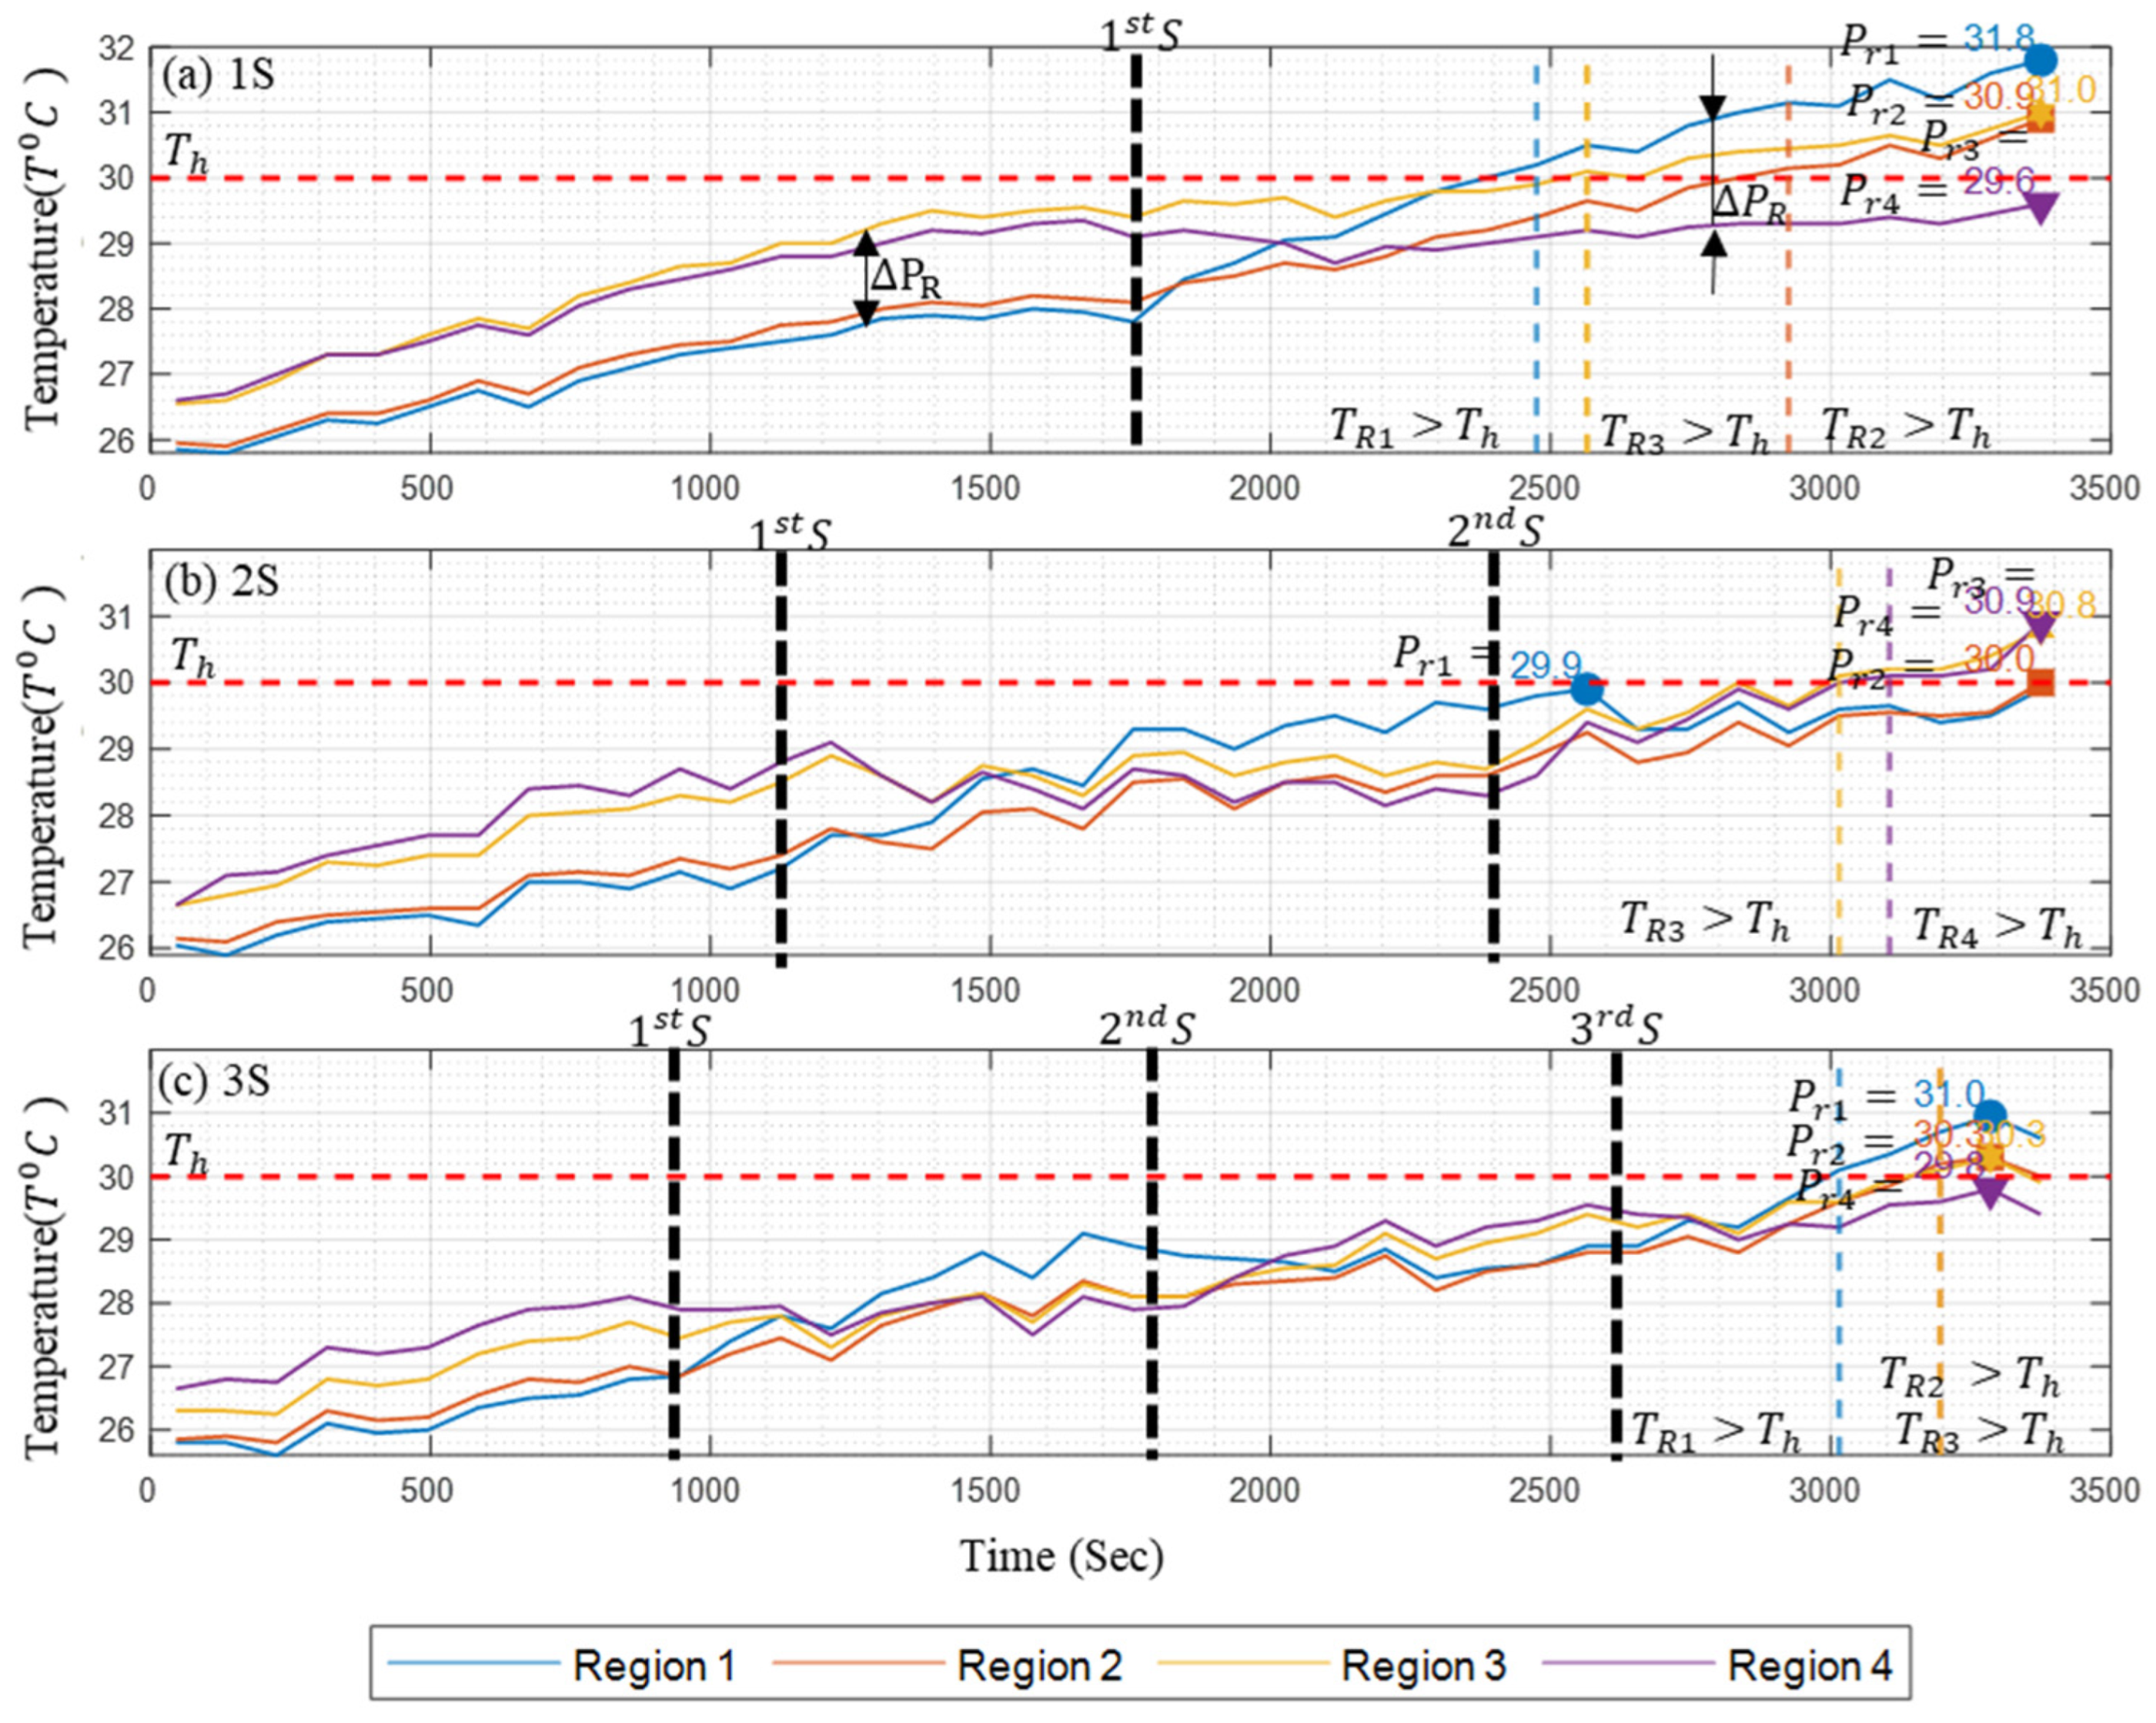
- Peak value in the battery pack module: Under the 0S switch condition, i.e., the conventional single-terminal model, a peak temperature of 36.9 °C was observed. In comparison, the multi-terminal 2S setup showed an improvement of 11.11%, while the 1S and 3S setups demonstrated improvements of 6.23% under natural cooling conditions.
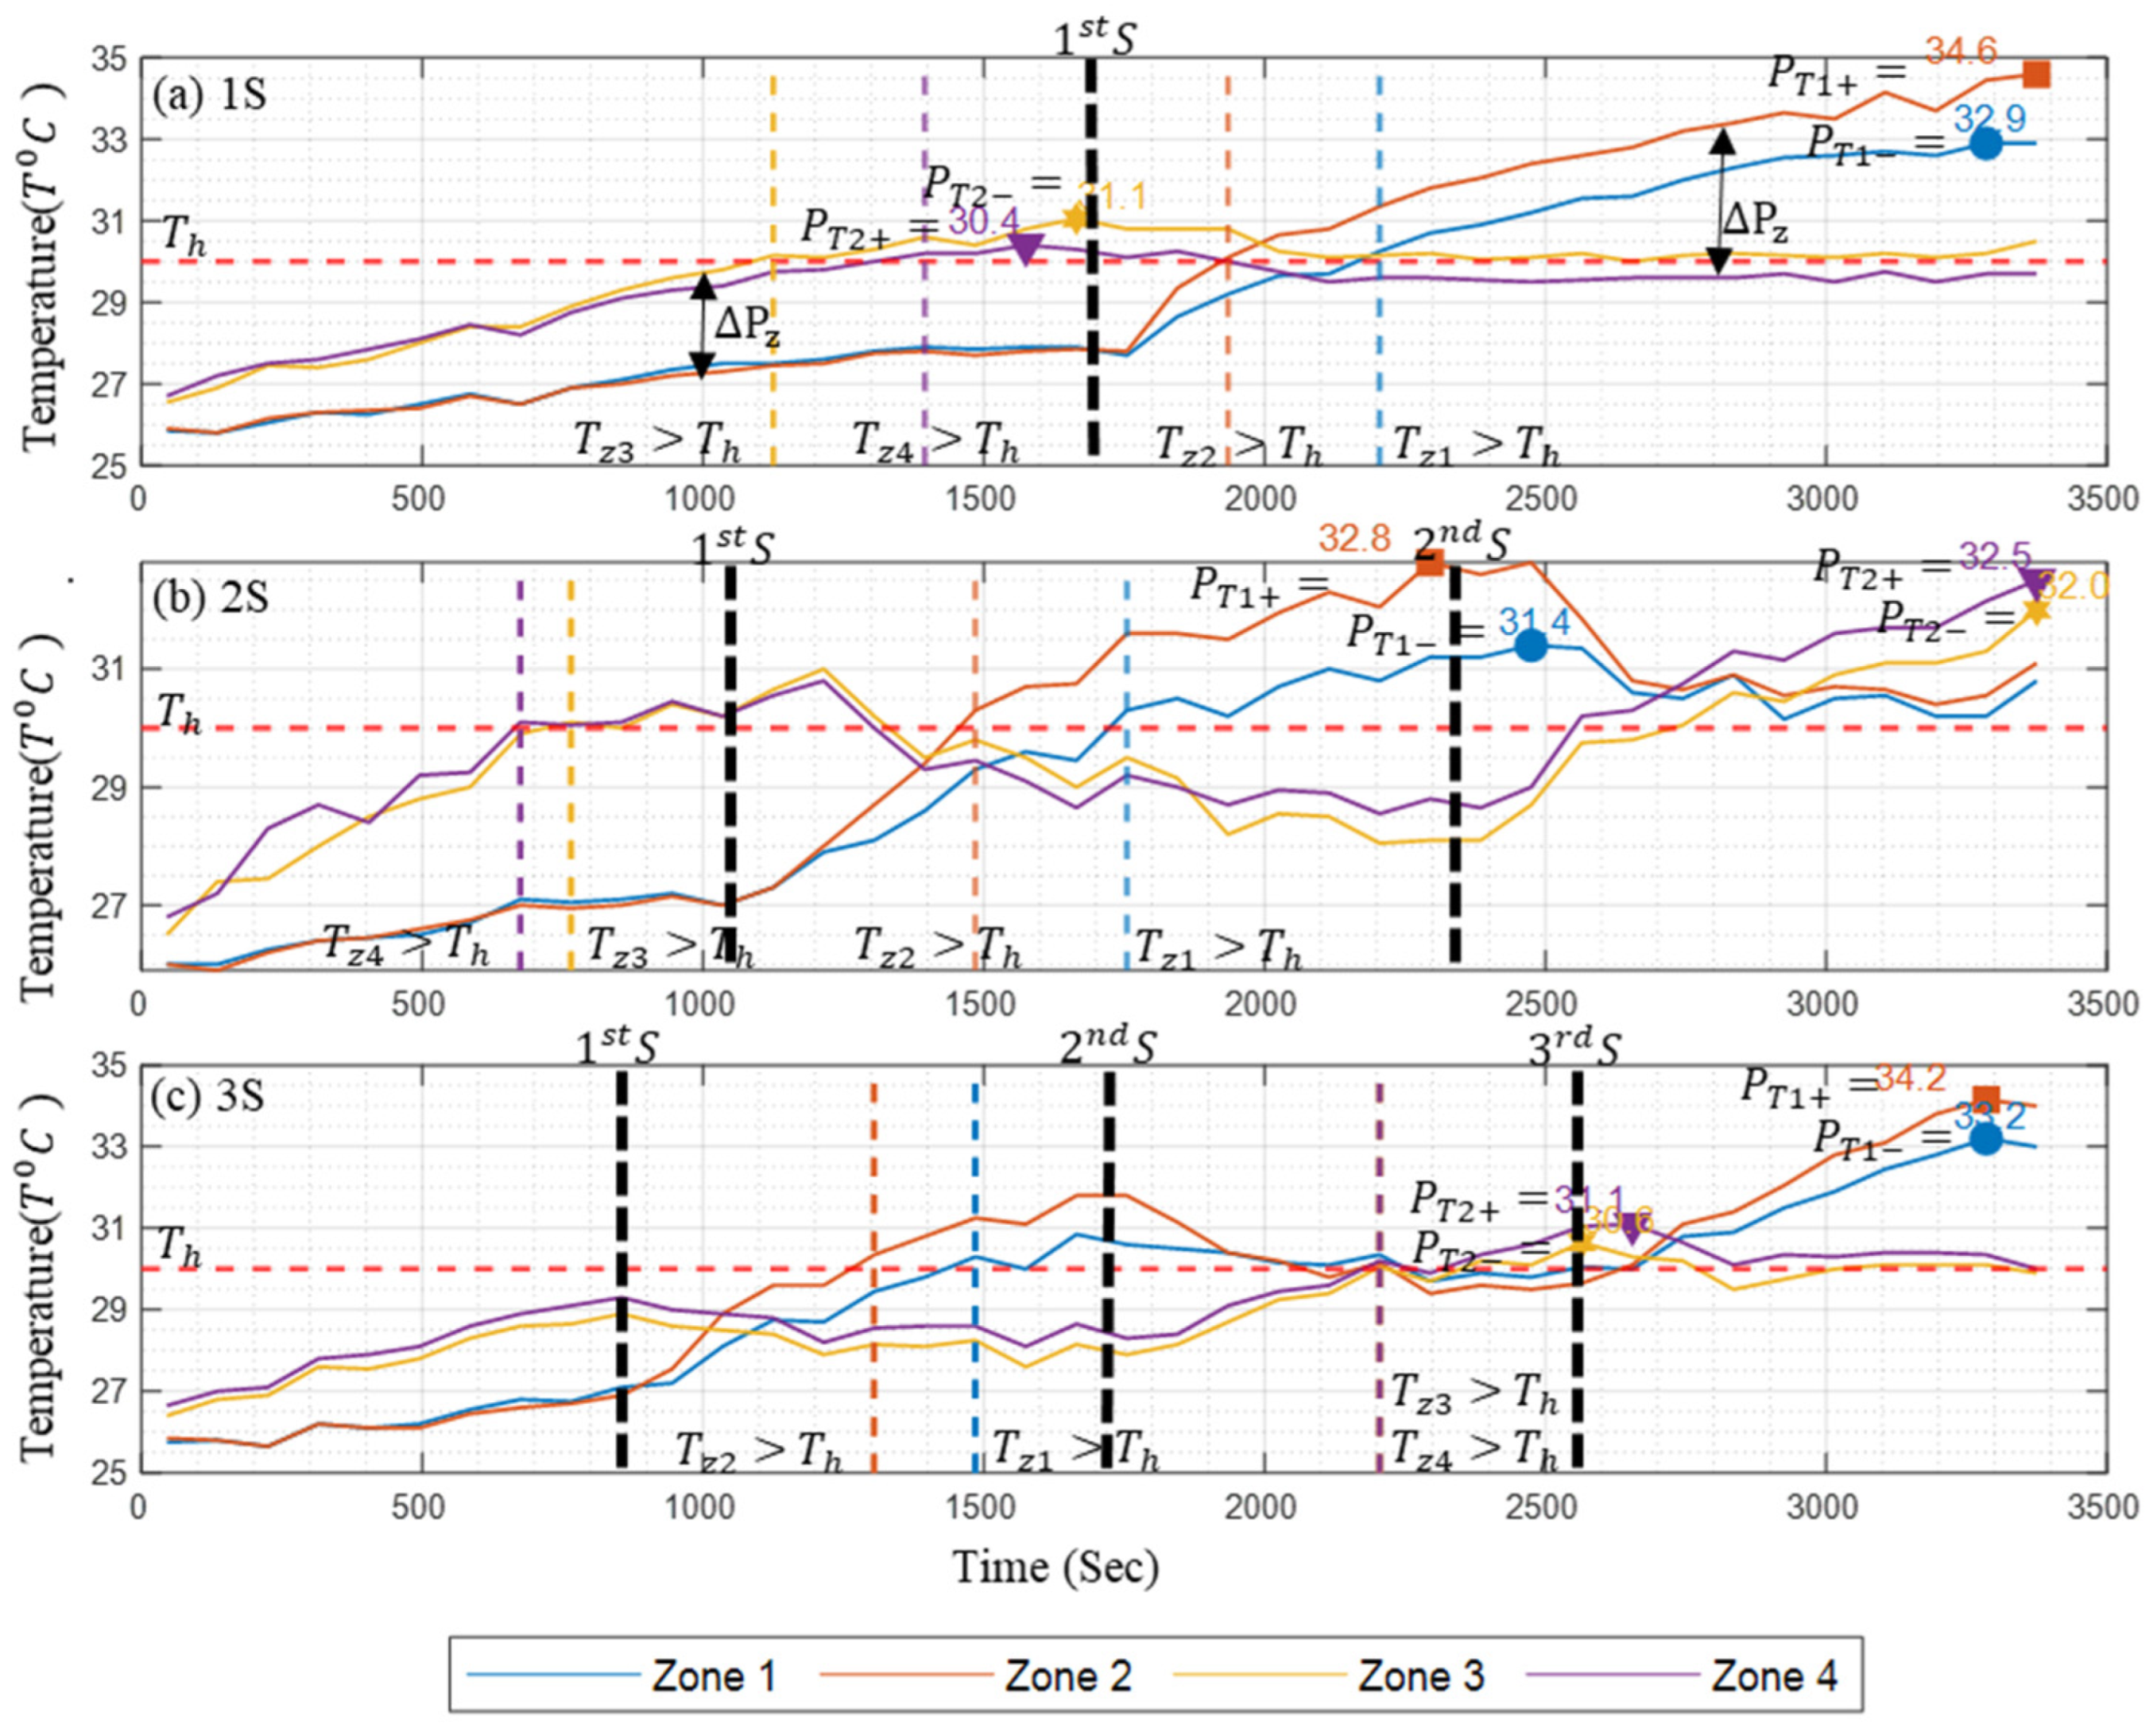
- Set threshold temperature crossover duration: In the 0S condition, the module crosses the Th at 400 s into the discharge cycle, leading to the formation of a heat spot in the pack and resulting in approximately 88.89% of the remaining discharge duration being above the desired temperature range. In contrast, under the 1S, 2S, and 3S conditions, the pack crosses Th at 1110, 700, and 1300 s, respectively. This results in approximately 69.17%, 80.56%, and 63.89% of the remaining discharge cycle duration being above the desired range, indicating a significantly better thermal performance.
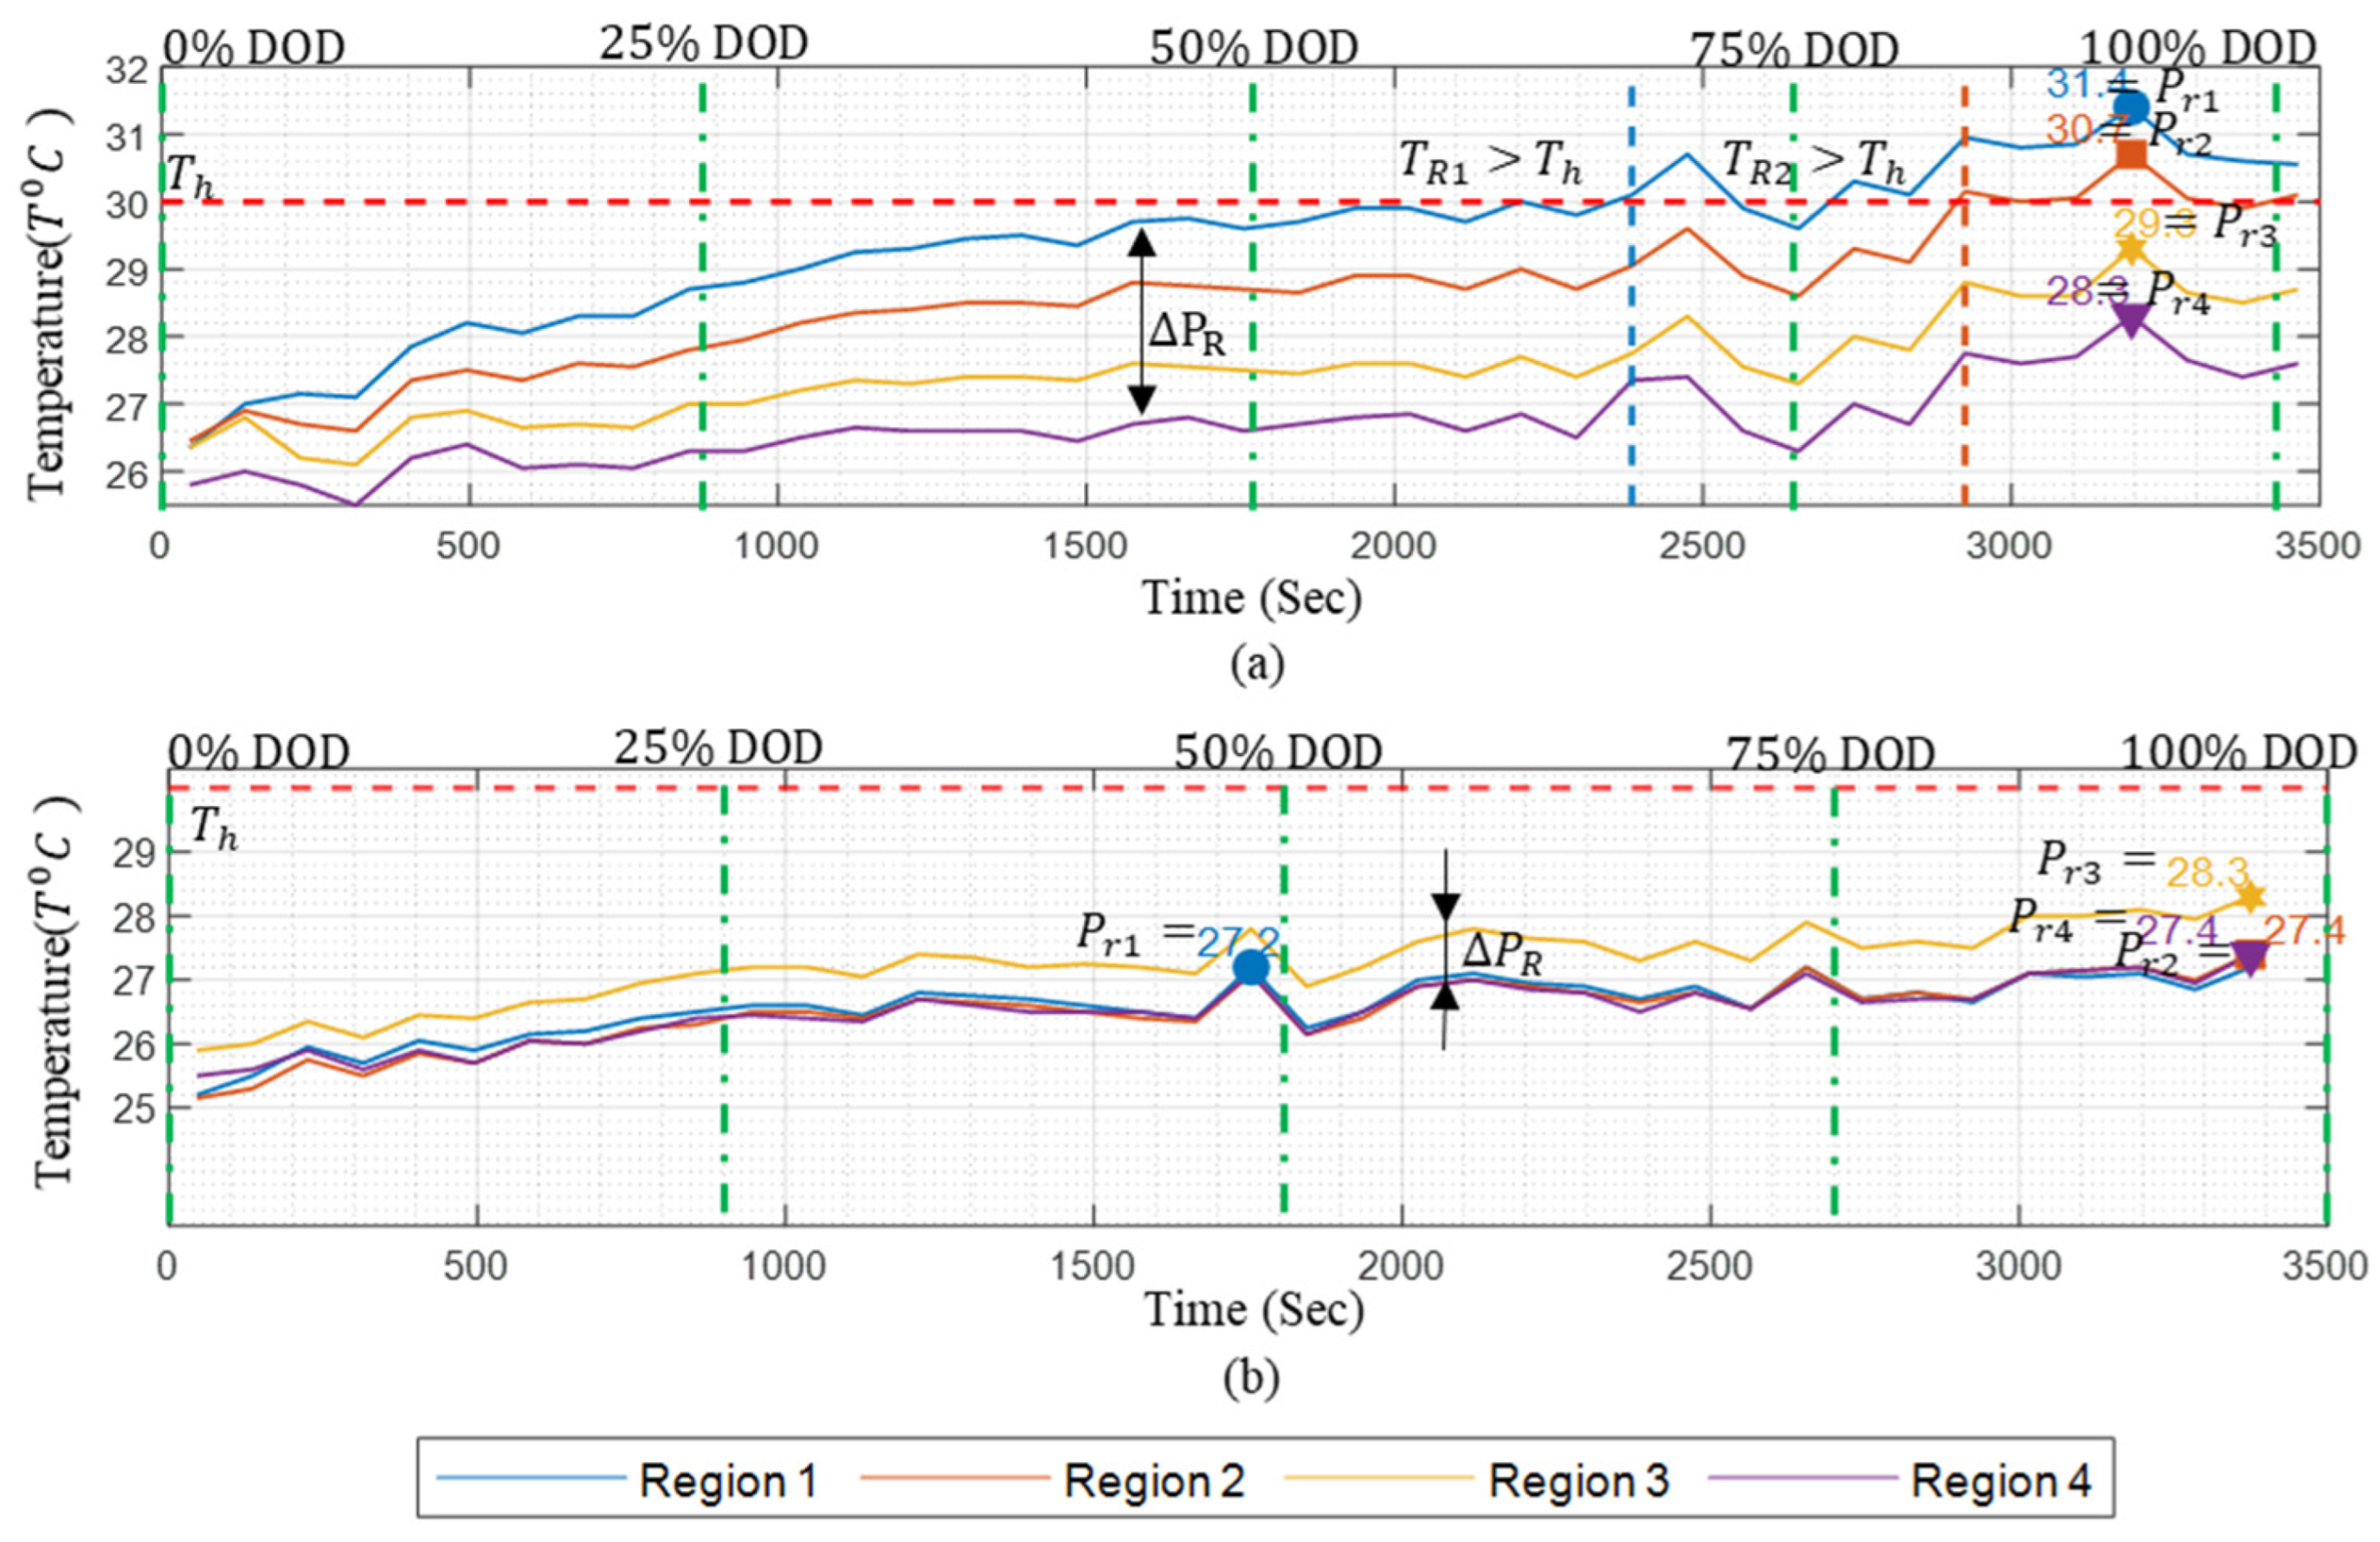
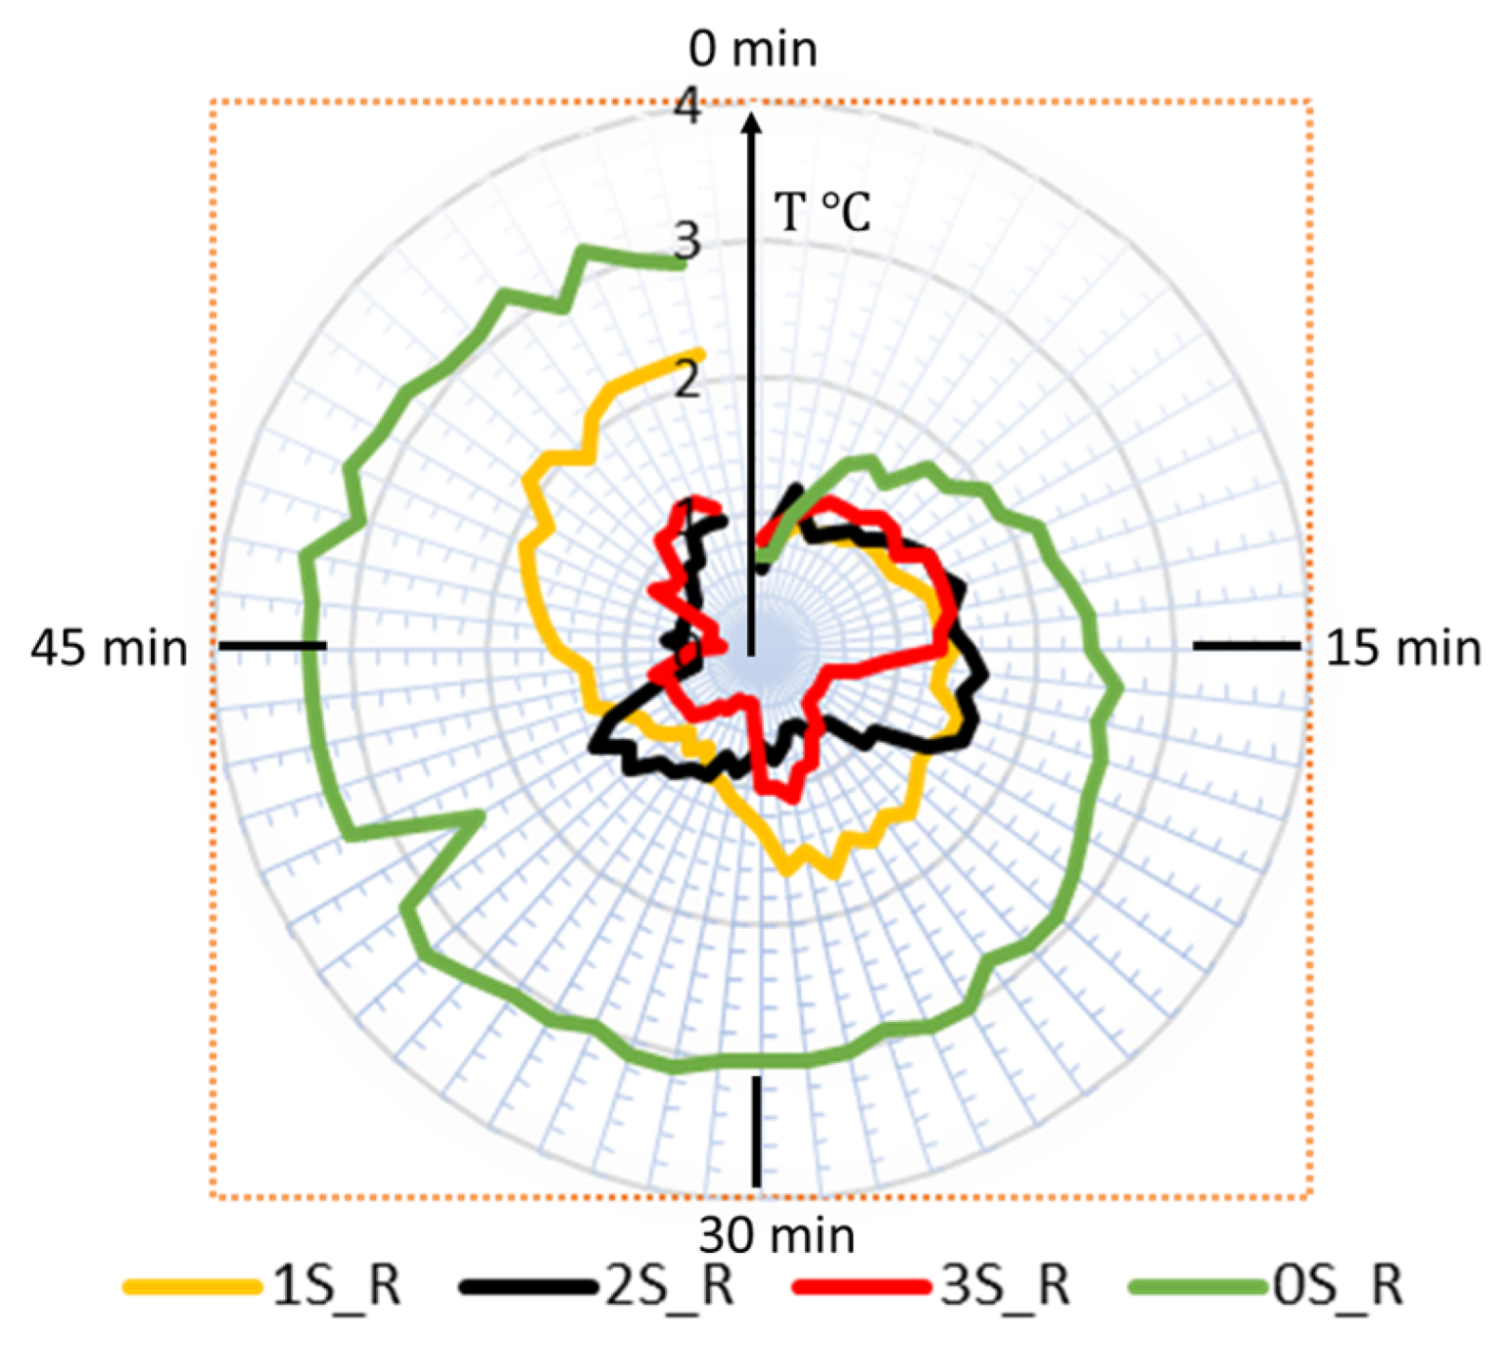
- Thermal distribution in the battery pack module: Thermal distribution was evaluated by measuring the difference between the maximum and minimum temperature values across the regions at any given time. As shown in Figure 12, the 0S_R (single-terminal approach) shows a steadily increasing temperature difference, reaching 3 °C at 50% DoD and persisting for the rest of the discharge cycle. The 1S setup demonstrates improvement, maintaining a temperature difference of less than 2 °C, which only crosses this value around 80% DoD. In the 2S and 3S setups, the temperature difference remains below 1.6 °C and 1.4 °C, respectively, indicating a superior thermal uniformity.
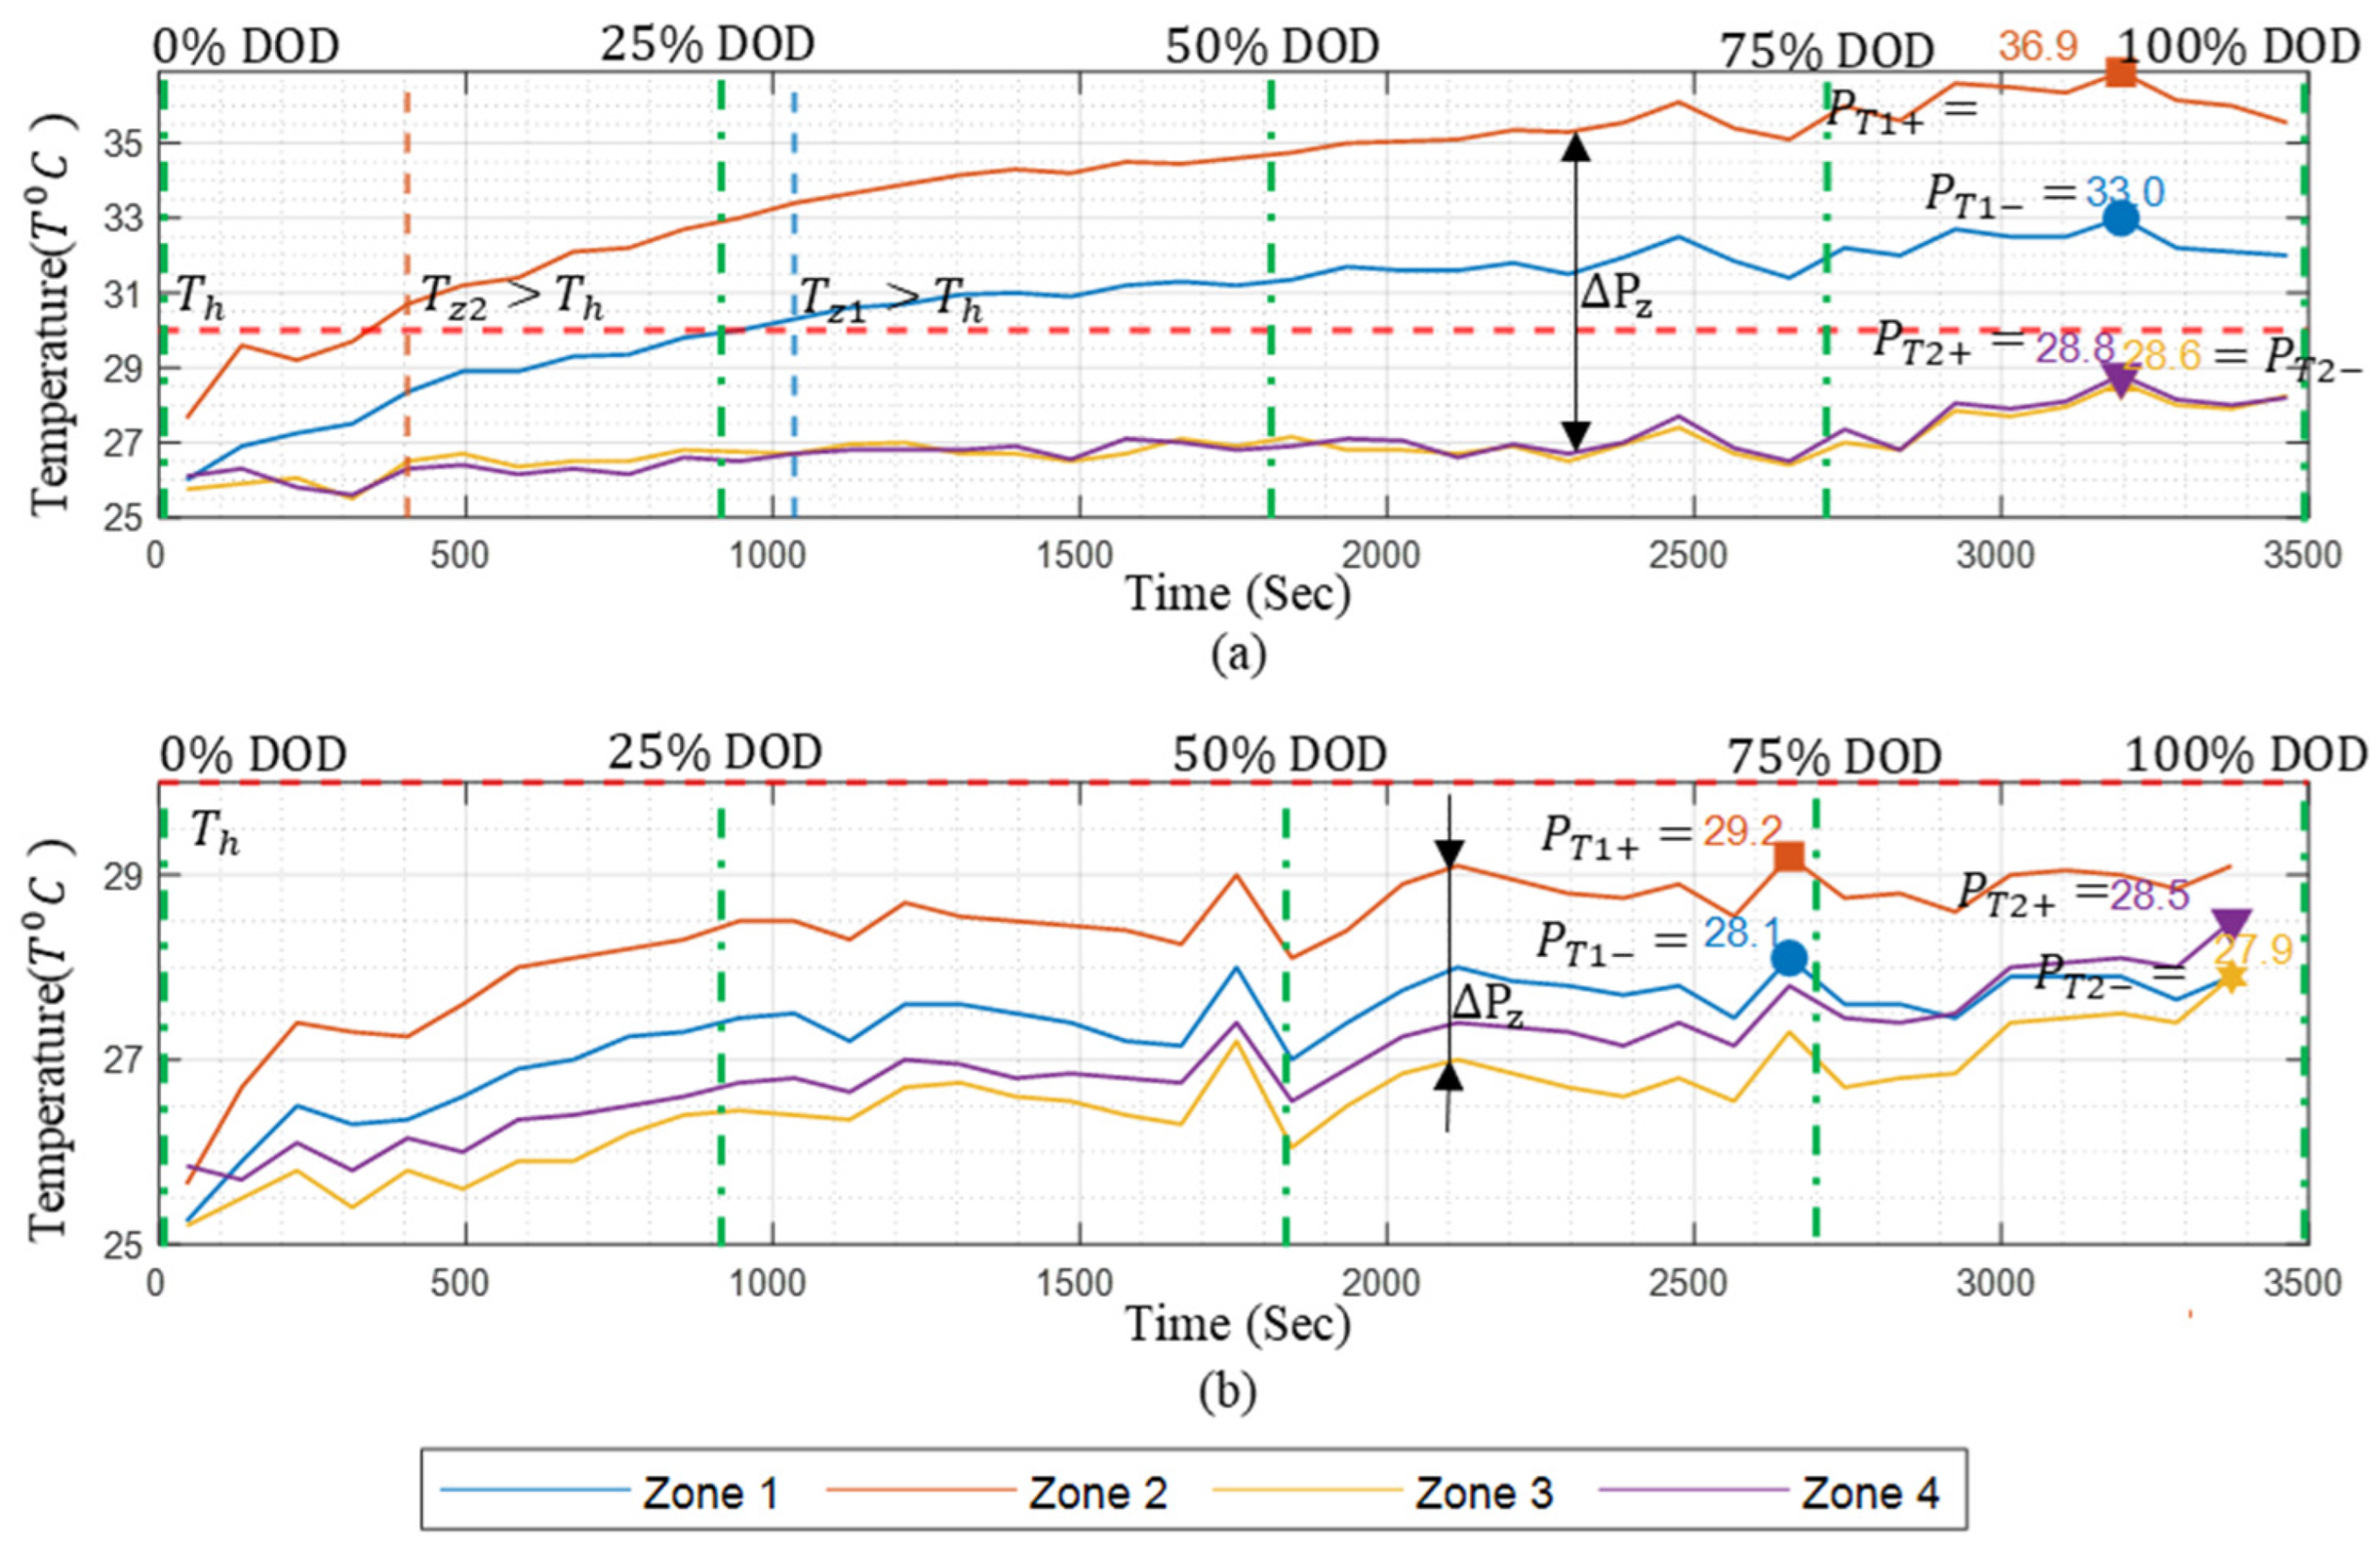
- Heat Spot Generation and Management: The heat spots were identified and categorized as zones. Figure 13 presents the temperature difference between these zones with respect to the DoD percentage. A smaller difference value indicates a better thermal distribution and a lower heat spot generation rate. In the 0S_z case, representing the natural convection-based single-terminal setup, the temperature difference between zones was as high as 9 °C, indicating significant temperature concentration in specific zones, which leads to heat spot formation. Moreover, for more than 50% DoD, the temperature difference remained above 8 °C. In contrast, for the 1S, 2S, and 3S setups, the temperature difference did not exceed 5 °C throughout the discharge cycle, resulting in lower peak temperatures in heat-prone zones and improved thermal uniformity across zones.
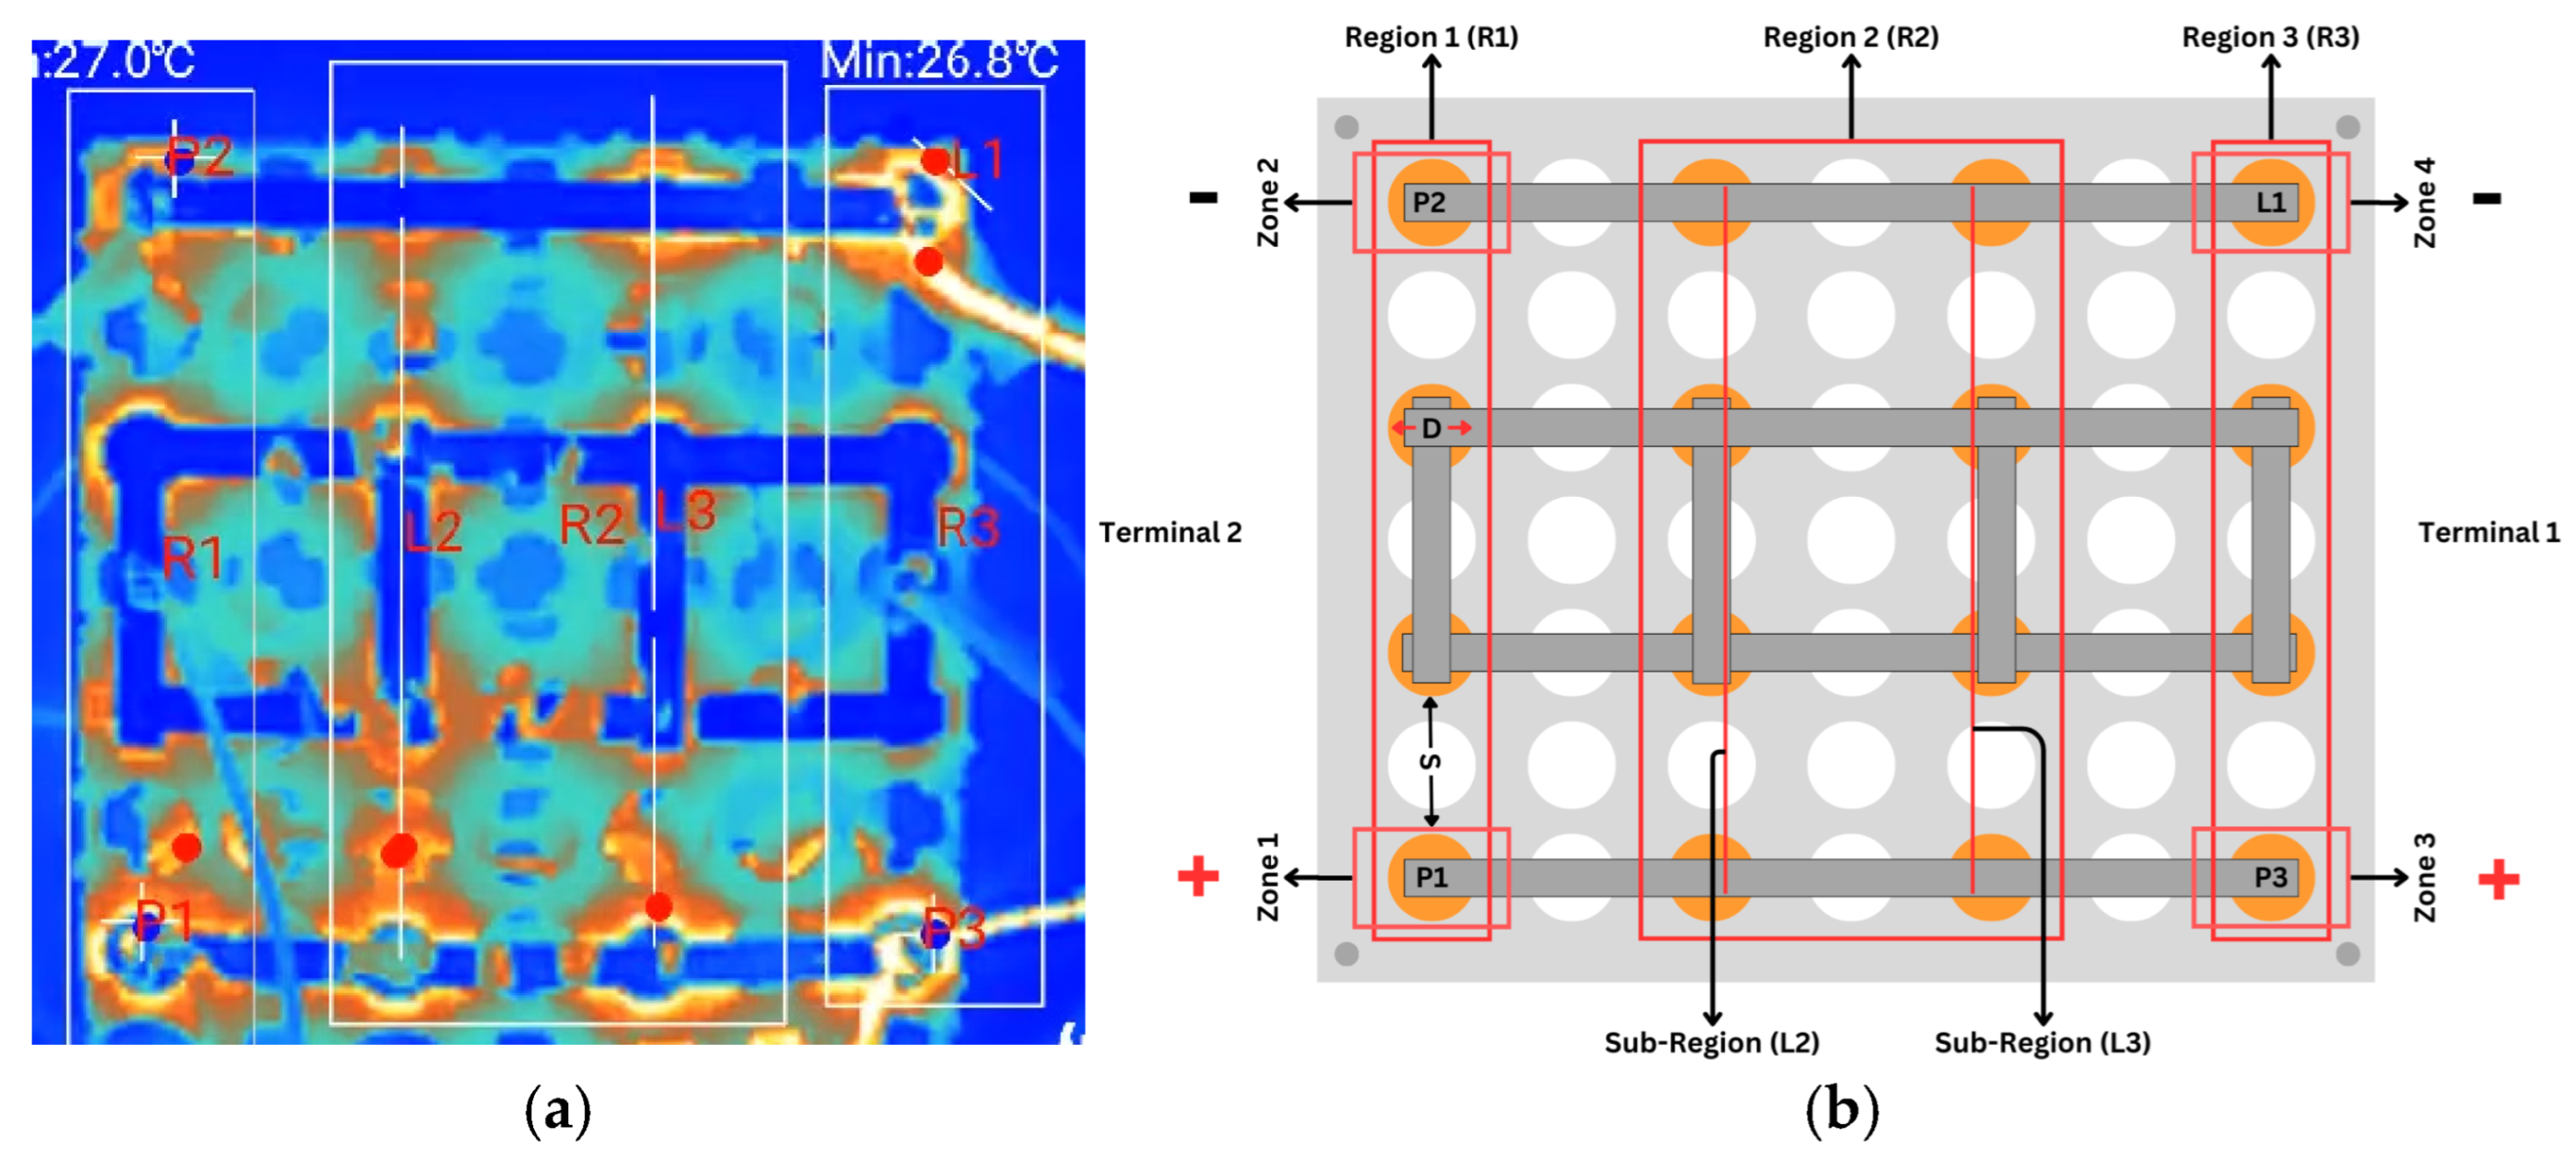
- Influence of External Air-Based Forced Convection on the Multi-Terminal Approach: In the forced air-cooling setup, for the single-terminal test case, the peak temperature in R1 was reduced from 31.4 °C (observed in the natural convection case) to 27.2 °C. The cooling system successfully maintained thermal uniformity in R1, R2, and R4. However, it failed to achieve similar cooling in R3, since R1 and R2 were positioned near the coolant inlets; R4, which was at the end of the pack, experienced a naturally lower heat accumulation. R3, being neither close to the air inlet nor the terminal region, retained the heat generated during discharge, leading to a consistently higher temperature compared to the other regions.
5. Conclusions
Author Contributions
Funding
Data Availability Statement
Conflicts of Interest
References
- Ahmadian-Elmi, M.; Zhao, P. Review of Thermal Management Strategies for Cylindrical Lithium-Ion Battery Packs. Batteries 2024, 10, 50. [Google Scholar] [CrossRef]
- Grebtsov, D.K.; Kubasov, M.K.; Bernatskii, E.R.; Beliauski, P.A.; Kokorenko, A.A.; Isokjanov, S.S.; Kazikov, S.P.; Kashin, A.M.; Itkis, D.M.; Morozova, S.M. Electric Vehicle Battery Technologies: Chemistry, Architectures, Safety, and Management Systems. World Electr. Veh. J. 2024, 15, 568. [Google Scholar] [CrossRef]
- Ji, Z.; Zhang, C. Study on the impact of battery pack arrangement on temperature uniformity distribution. Sustain. Energy Fuels 2024, 8, 4519–4532. [Google Scholar] [CrossRef]
- Murugan, M.; Elumalai, P.V.; Vijayakumar, K.; Babu, M.; Kumar, K.S.; Ganesh, M.; Kuang, L.; Prabhakar, S. A Comprehensive Review of Thermal Management Methods and Ideal System Design for Improved Electric Vehicle Battery Pack Performance and Safety. Energy Sci. Eng. 2025, 13, 1011–1036. [Google Scholar] [CrossRef]
- Zhong, Y.-N. Optimizing the structural design of computing units in autonomous driving systems and electric vehicles to enhance overall performance stability. Int. J. Adv. Appl. Sci. Res. 2024, 3, 93–98. [Google Scholar]
- Rawat, S.; Choudhury, S.; Saini, D.K.; Gupta, Y.C. Advancements and Current Developments in Integrated System Architectures of Lithium-Ion Batteries for Electric Mobility. World Electr. Veh. J. 2024, 15, 394. [Google Scholar] [CrossRef]
- Li, G. Promotion of practical technology of the thermal management system for cylindrical power battery. Energy Inform. 2024, 7, 33. [Google Scholar] [CrossRef]
- Ali, S.; Khan, M.M.; Irfan, M. Thermal Performance Enhancement of Lithium-Ion Batteries Using Phase Change Material and Fin Geometry Modification. World Electr. Veh. J. 2024, 15, 42. [Google Scholar] [CrossRef]
- Liu, L.; Park, J.; Lin, X.; Sastry, A.M.; Lu, W. A thermal-electrochemical model that gives spatial-dependent growth of solid electrolyte interphase in a Li-ion battery. J. Power Sources 2014, 268, 482–490. [Google Scholar] [CrossRef]
- Song, Z.; Yang, N.; Lin, X.; Pinto Delgado, F.; Hofmann, H.; Sun, J. Progression of Cell-to-Cell Variation within Battery Modules under Different Cooling Structures. Appl. Energy 2022, 312, 118836. [Google Scholar] [CrossRef]
- Chen, S.C.; Wan, C.C.; Wang, Y.Y. Thermal analysis of lithium-ion batteries. J. Power Sources 2005, 140, 111–124. [Google Scholar] [CrossRef]
- Forgez, C.; Do, D.V.; Friedrich, G.; Morcrette, M.; Delacourt, C. Thermal modeling of a cylindrical LiFePO4/graphite lithium-ion battery. J. Power Sources 2010, 195, 2961–2968. [Google Scholar] [CrossRef]
- Hales, A.; Marzook, M.W.; Diaz, L.B.; Patel, Y.; Offer, G. The surface cell cooling coefficient: A standard to define heat rejection from lithium ion battery pouch cells. J. Electrochem. Soc. 2020, 167, 020524. [Google Scholar] [CrossRef]
- Hales, A.; Diaz, L.B.; Marzook, M.W.; Zhao, Y.; Patel, Y.; Offer, G. The cell cooling coefficient: A standard to define heat rejection from lithium-ion batteries. J. Electrochem. Soc. 2019, 166, A2383–A2395. [Google Scholar] [CrossRef]
- Zhao, Y.; Diaz, L.B.; Patel, Y.; Zhang, T.; Offer, G.J. How to cool lithium-ion batteries: Optimising cell design using a thermally coupled model. J. Electrochem. Soc. 2019, 166, A2849–A2859. [Google Scholar] [CrossRef]
- Shahid, S.; Agelin-Chaab, M. Analysis of cooling effectiveness and temperature uniformity in a battery pack for cylindrical batteries. Energies 2017, 10, 1157. [Google Scholar] [CrossRef]
- Huang, R.; Li, Z.; Hong, W.; Wu, Q.; Yu, X. Experimental and numerical study of PCM thermophysical parameters on lithium-ion battery thermal management. Energy Rep. 2020, 6, 8–19. [Google Scholar] [CrossRef]
- Chen, D.; Jiang, J.; Kim, G.-H.; Yang, C.; Pesaran, A. Comparison of different cooling methods for lithium ion battery cells. Appl. Therm. Eng. 2016, 94, 846–854. [Google Scholar] [CrossRef]
- Liu, Y.-P.; Ouyang, C.-Z.; Jiang, Q.-B.; Liang, B. Design and parametric optimization of thermal management of lithium-ion battery module with reciprocating air-flow. J. Cent. South Univ. 2015, 22, 3970–3976. [Google Scholar] [CrossRef]
- Onda, K.; Ohshima, T.; Nakayama, M.; Fukuda, K.; Araki, T. Thermal behavior of small lithium-ion battery during rapid charge and discharge cycles. J. Power Sources 2006, 158, 535–542. [Google Scholar] [CrossRef]
- Yang, N.; Zhang, X.; Li, G.; Hua, D. Assessment of the forced air-cooling performance for cylindrical lithium-ion battery packs: A comparative analysis between aligned and staggered cell arrangements. Appl. Therm. Eng. 2015, 80, 55–65. [Google Scholar] [CrossRef]
- Bandhauer, T.M.; Garimella, S.; Fuller, T.F. A critical review of thermal issues in lithium-ion batteries. J. Electrochem. Soc. 2011, 158, R1. [Google Scholar] [CrossRef]
- Muhammad, S.; Rafique, M.U.; Li, S.; Shao, Z.; Wang, Q.; Liu, X. Reconfigurable battery systems: A survey on hardware architecture and research challenges. ACM Trans. Des. Autom. Electron. Syst. (TODAES) 2019, 24, 19. [Google Scholar] [CrossRef]
- Zhang, C.; Zhou, Y.; Kang, C.; Ci, S. A Digital Battery Energy Storage System Based on Dynamic Reconfigurable Network: A Real Case Study. IEEE Trans. Energy Convers. 2025, 1–14. [Google Scholar] [CrossRef]
- Wei, Z.; Cui, H.; Liu, X.; Li, Y.; Wang, R. Real-time reconfiguration-based all-cell flexibility and capacity maximum utilization of second-life batteries. IEEE Trans. Transp. Electrif. 2024, 11, 1035–1047. [Google Scholar] [CrossRef]
- Xu, H.; Cheng, L.; Paizulamu, D.; Zheng, H. Safety and Reliability Analysis of Reconfigurable Battery Energy Storage System. Batteries 2024, 11, 12. [Google Scholar] [CrossRef]
- Behi, H.; Karimi, D.; Behi, M.; Ghanbarpour, M.; Jaguemont, J.; Sokkeh, M.A.; Gandoman, F.H.; Berecibar, M.; Van Mierlo, J. A new concept of thermal management system in Li-ion battery using air cooling and heat pipe for electric vehicles. Appl. Therm. Eng. 2020, 174, 115280. [Google Scholar] [CrossRef]
- Kim, J.; Oh, J.; Lee, H. Review on battery thermal management system for electric vehicles. Appl. Therm. Eng. 2019, 149, 192–212. [Google Scholar] [CrossRef]
- Patel, J.R.; Rathod, M.K. Influence of battery cell spacing on thermal performance of phase change material filled lithium-ion battery pack. Energy 2024, 291, 130389. [Google Scholar] [CrossRef]
- Hwang, F.S.; Confrey, T.; Reidy, C.; Picovici, D.; Callaghan, D.; Culliton, D.; Nolan, C. Review of battery thermal management systems in electric vehicles. Renew. Sustain. Energy Rev. 2024, 192, 114171. [Google Scholar] [CrossRef]
- Kalkan, O.; Celen, A.; Bakirci, K. Experimental and numerical investigation of the LiFePO4 battery cooling by natural convection. J. Energy Storage 2021, 40, 102796. [Google Scholar] [CrossRef]
- Li, C.; Zhang, H.; Zhang, R.; Lin, Y.; Fang, H. On the characteristics analysis and tab design of an 18650-type cylindrical LiFePO4 battery. Appl. Therm. Eng. 2021, 182, 116144. [Google Scholar] [CrossRef]


| EV Drive | Test Cell | Lumped Cell | |
|---|---|---|---|
| Chemical Composition | LiFePO4 | LiFePO4 | LiFePO4 |
| Configuration | Depends on load requirement | 1S1P | 4S4P |
| Nominal discharge capacity (mAh) | 20,000–100,000+ | 1500 | 6000 |
| Nominal voltage (V) | Typically 3.2–3.3 V per cell in series | 3.2 | 12.8 |
| Standard charge (A) | 0.5–1C | 0.75 | 3.0 |
| Maximum continuous discharge (A) | 2–10C | 4.5 | 18 |
| Discharge cut-off voltage (V) | Typically 2.5–2.8 V per cell | 2.5–2.8 | 10–11.2 |
| Cell/Pack weight (g) | 20,000–100,000 | 39 | ~800 |
| Cell/Pack height (mm) | Typically, 70–200 | 65 | 95 |
| Cell diameter/pack dimensions (mm) | Varies by configuration | 18 | 200 × 200 × 90 |
| C-rate (C) | 0.5–10 | 0.5–3 | 0.5–3 |
| Battery State | C-Rate | Con-V (V) | Capacity (Ah) | Limited-V (V) | Limited- C (A) | Convection | Terminal Count | Terminal Switch Count |
|---|---|---|---|---|---|---|---|---|
| Con-C and V Charge | 1 | 14.8 | 6 | -- | 0.6 | Natural, Forced | 1, 2 | 0, 1, 2, 3 |
| Con-C Discharge | 1 | -- | 6 | 11.2 | -- | Natural, Forced | 1, 2 | 0, 1, 2, 3 |
| Terminal Switch Count | Time (min) | DOD Condition (%) |
|---|---|---|
| 0 | -- | -- |
| 1 | 30 | 50 |
| 2 | 20, 40 | 33, 66 |
| 3 | 15, 30, 45 | 25, 50, 75 |
| Parameter | Natural Convection (Enclosed Chamber) | Natural Convection (Open Chamber) | Average Speed |
|---|---|---|---|
| Velocity (m/s) | <0.5 | <1 | 3.354 |
| RPM (rpm) | NA | NA | 1600 |
| Mass Flow Rate (g/s) | NA | <1 | 19.982 |
| Power Consumed (W) | 0 | 0 | 1.044 |
| Reynolds Number | <2000 | <2000 | 6808 |
| Test Cases | 00:00 | 15:00 | 30:00 | 45:00 | 60:00 | |
|---|---|---|---|---|---|---|
| (a) 18_D_E_N_1T | 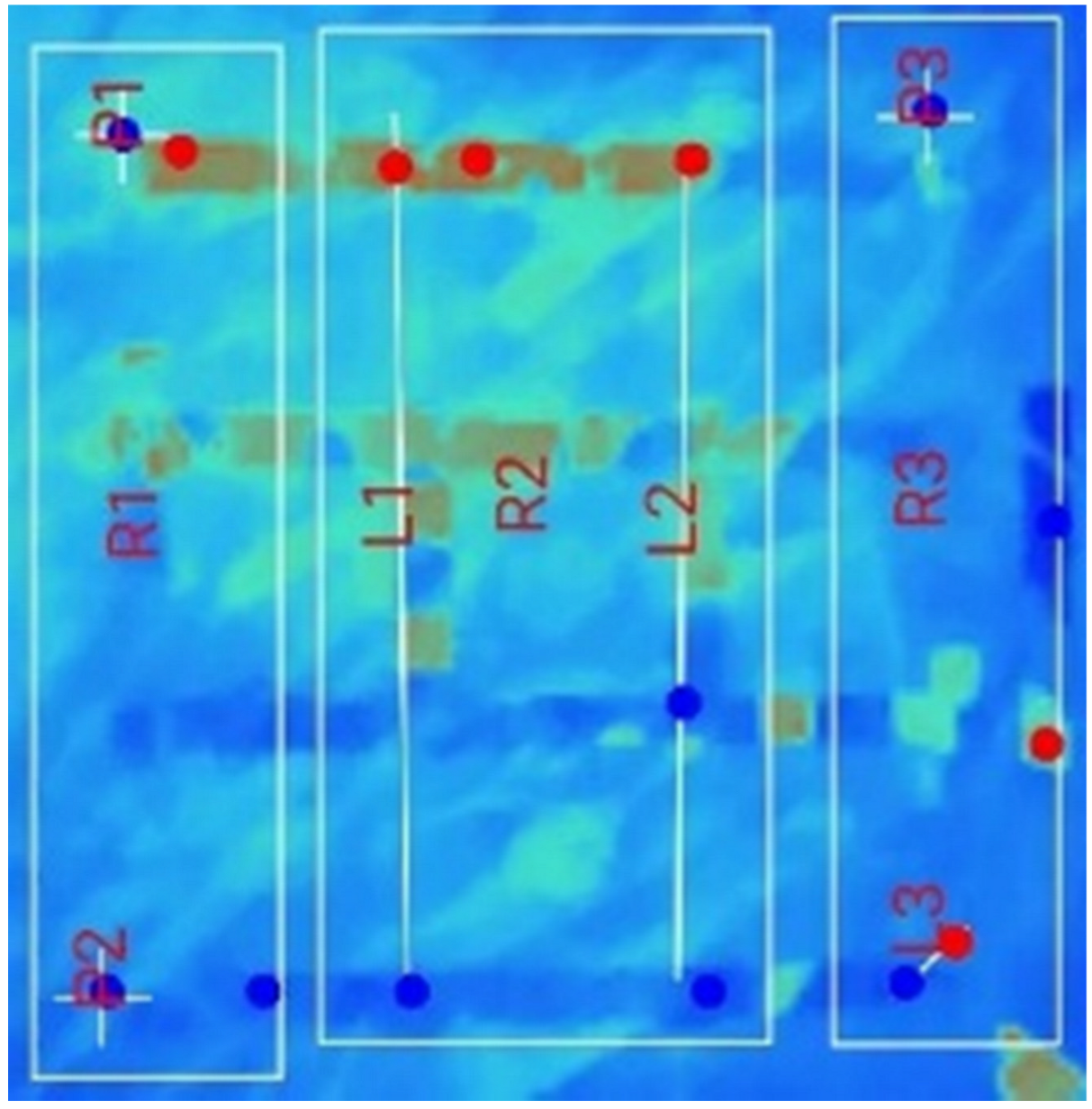 | 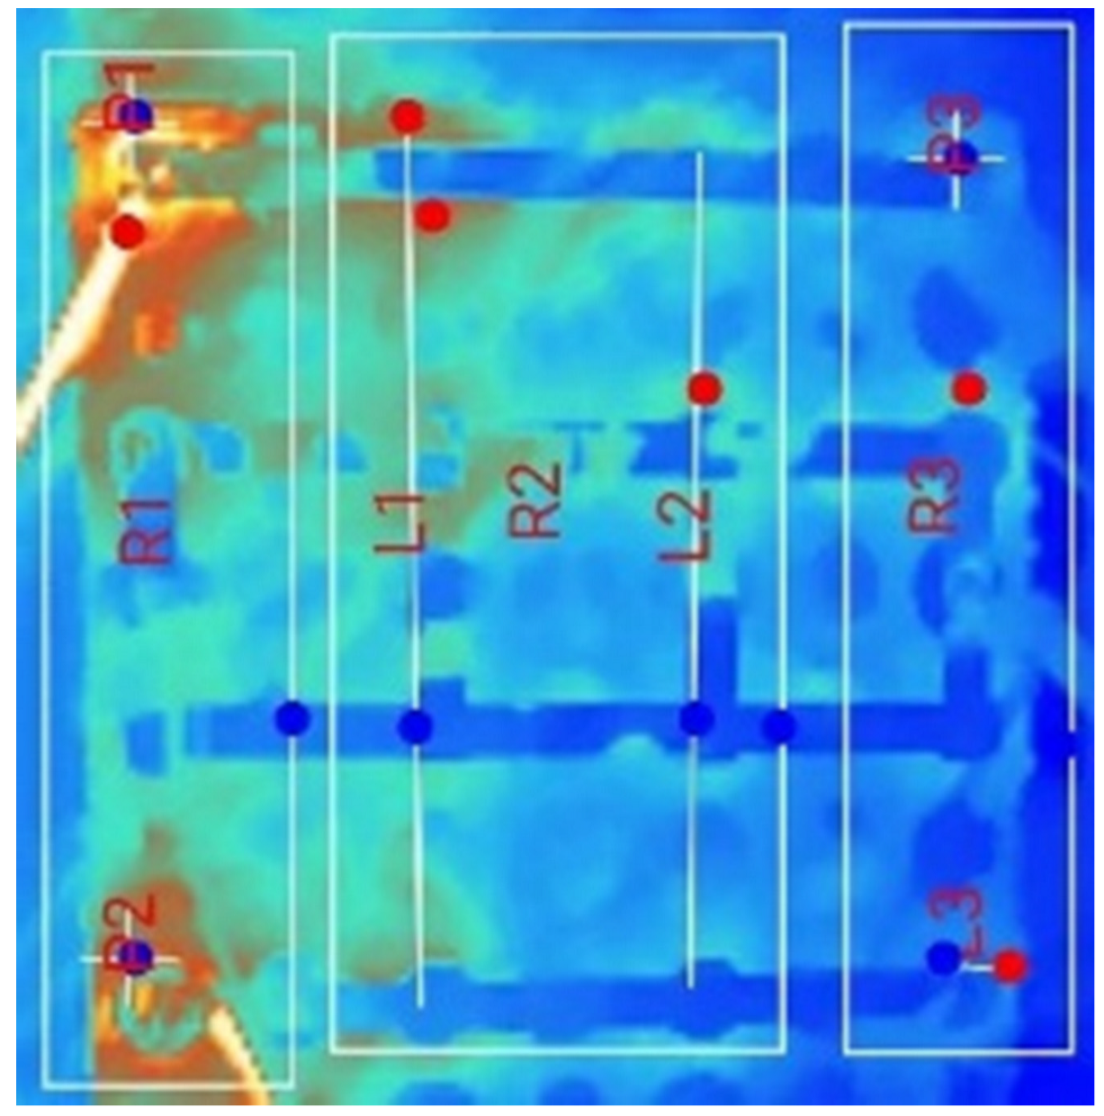 | 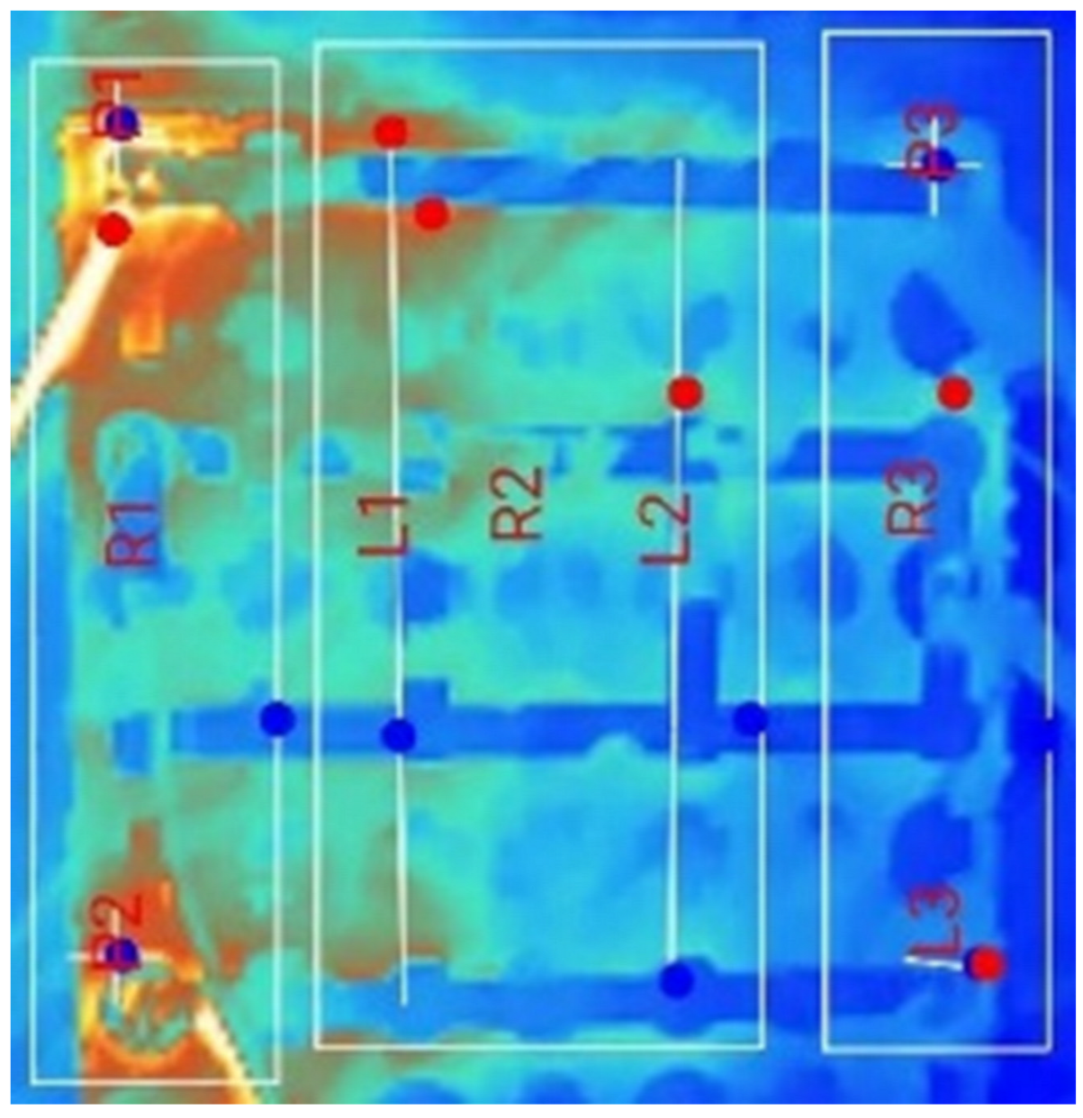 | 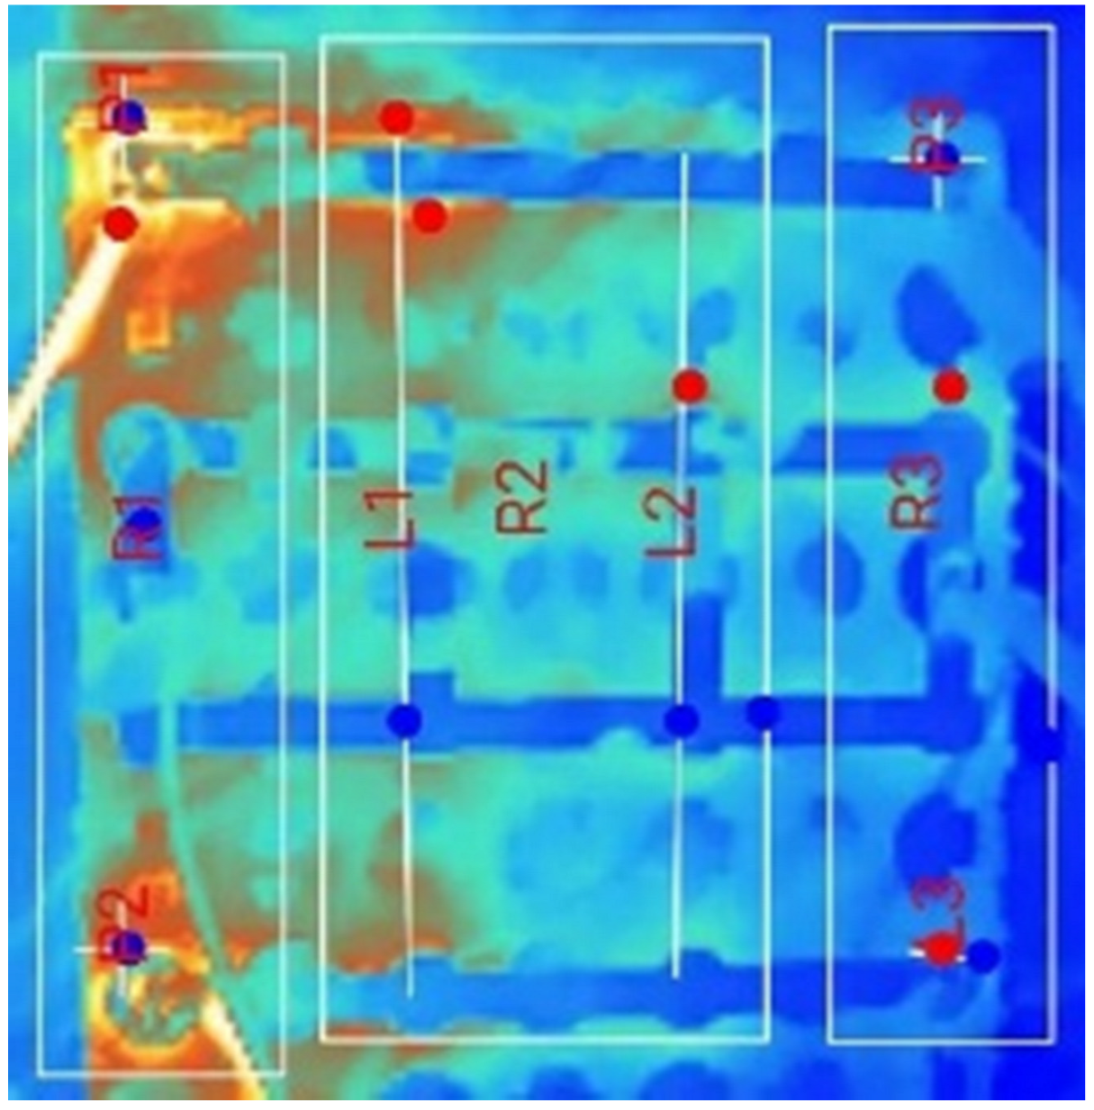 | 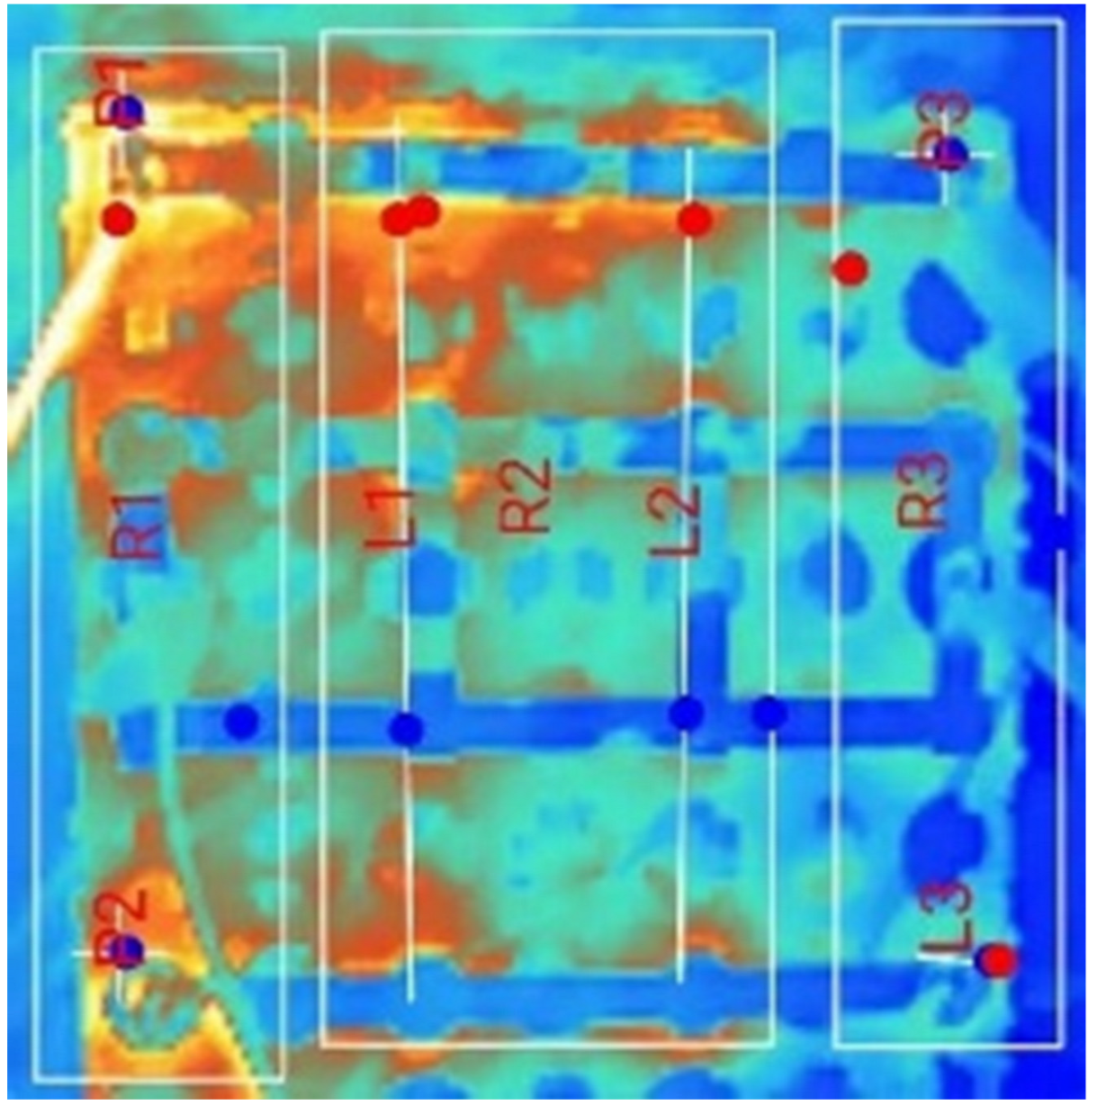 |  |
| (b) 18_D_E_F_1T_M |  |  |  | 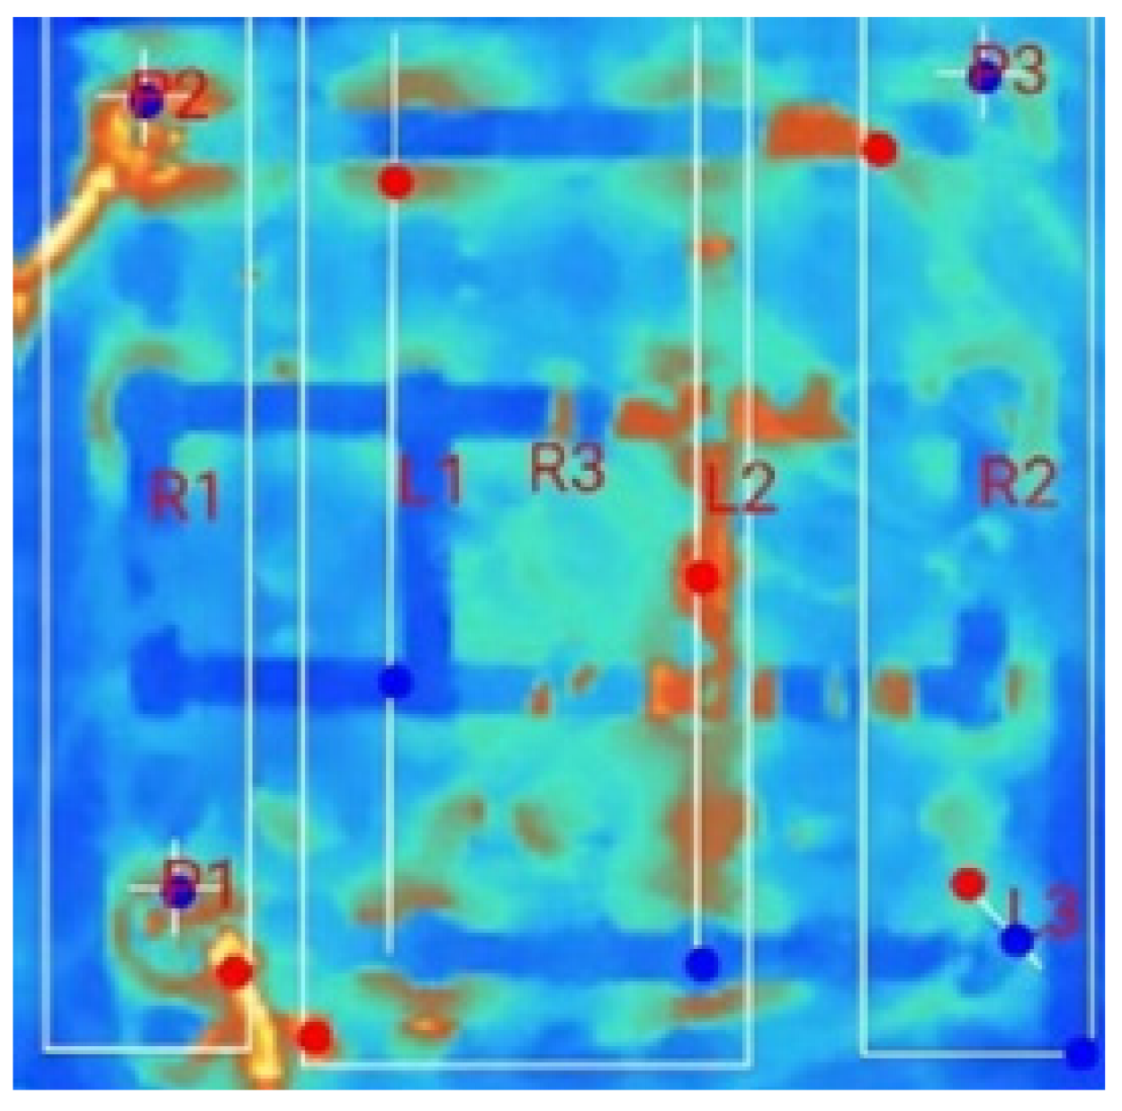 | 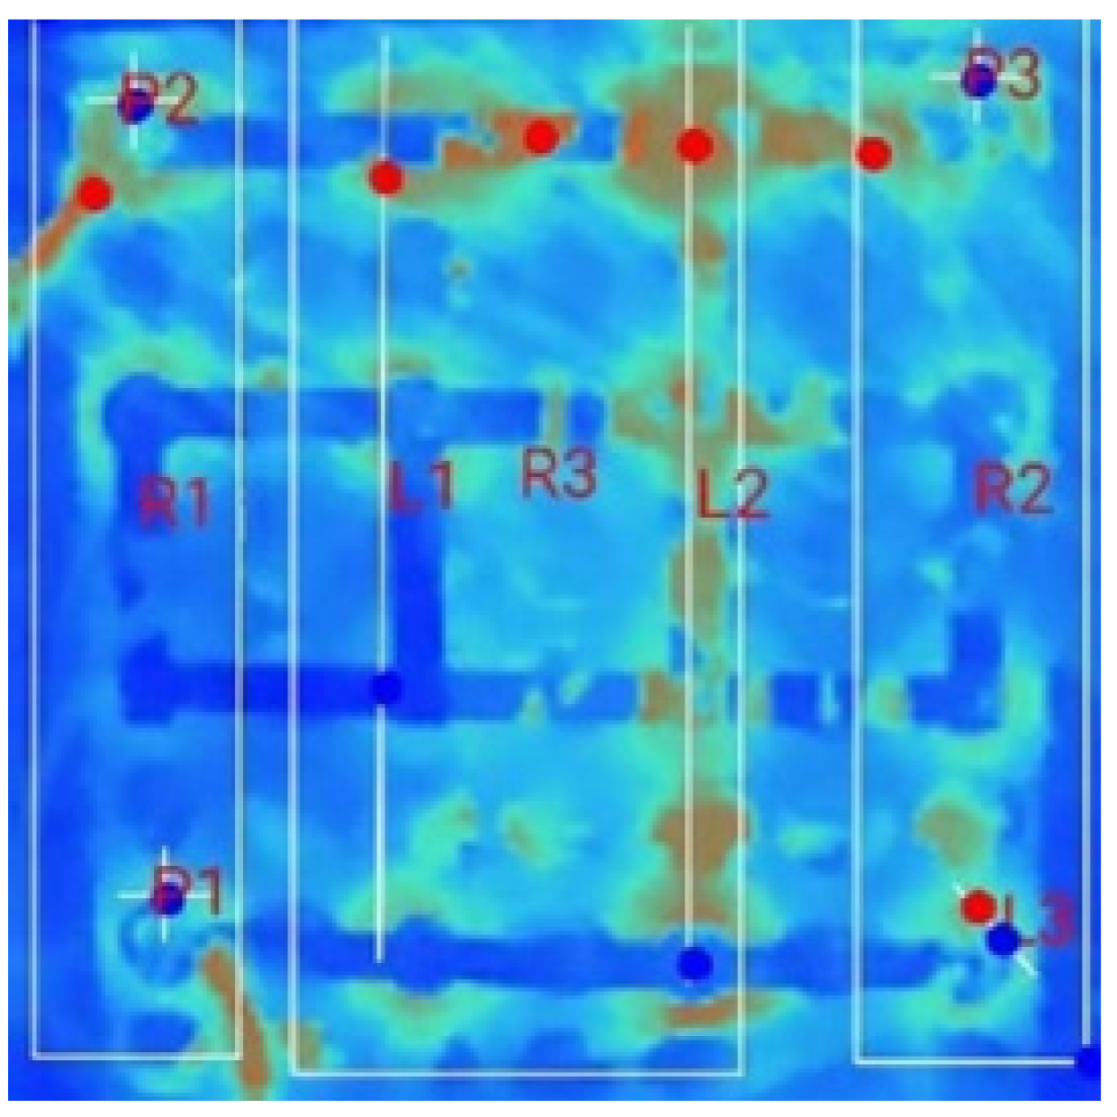 |
| Time (Mins) | ||||||
|---|---|---|---|---|---|---|
| Test Cases | 00:00 | 15:00 | 30:00 | 45:00 | 60:00 | |
| (a) 18_D_E_N_2T_1S | 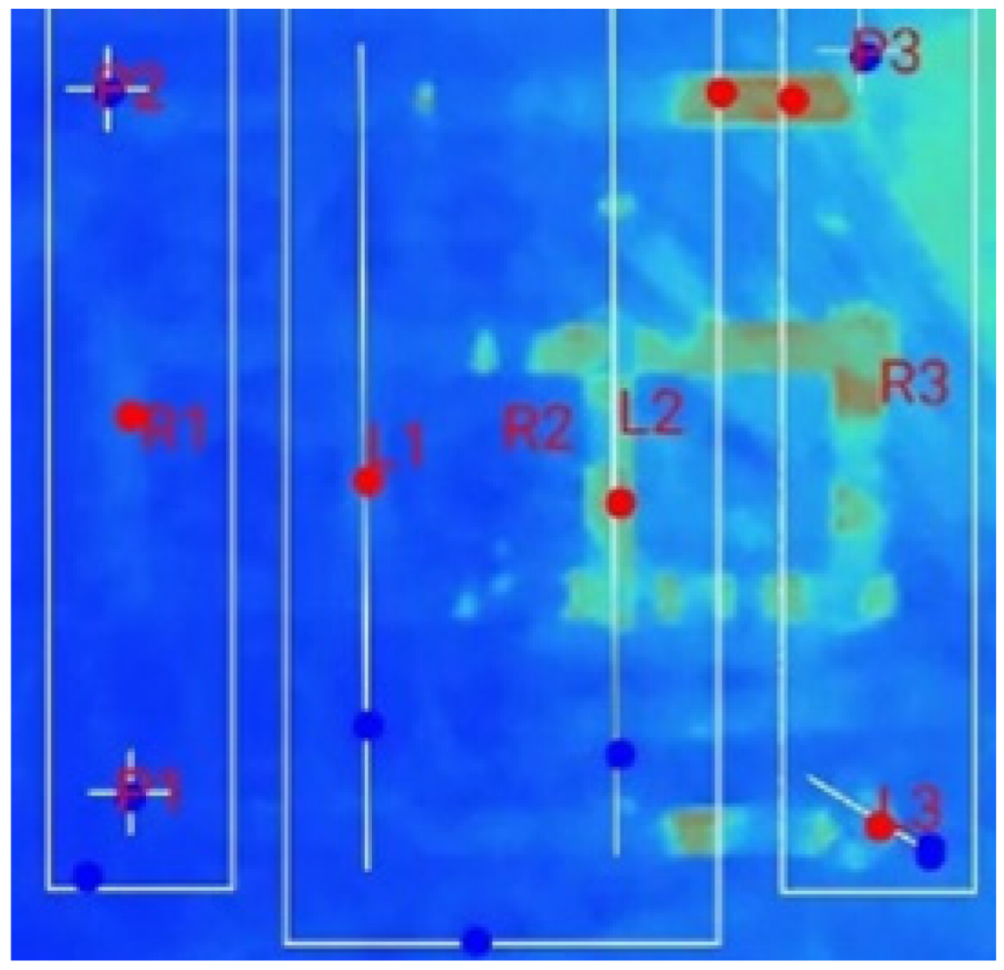 | 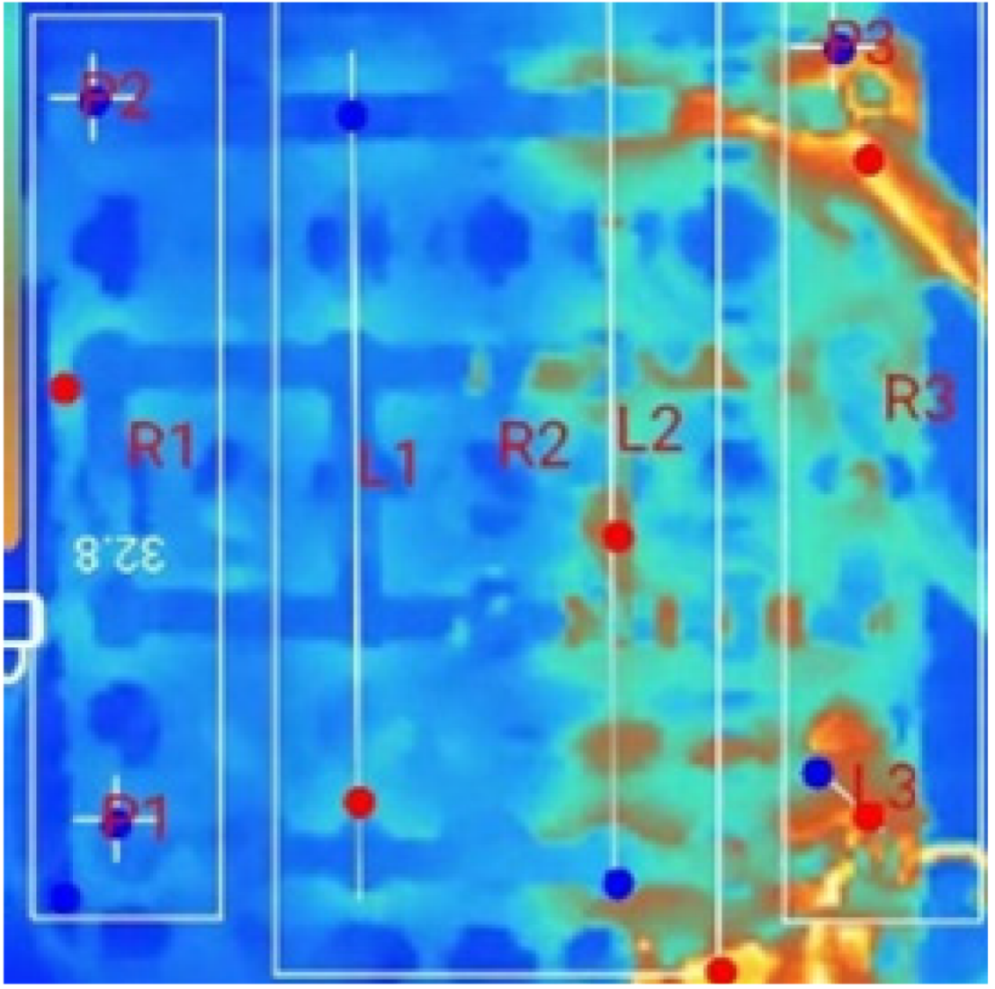 | 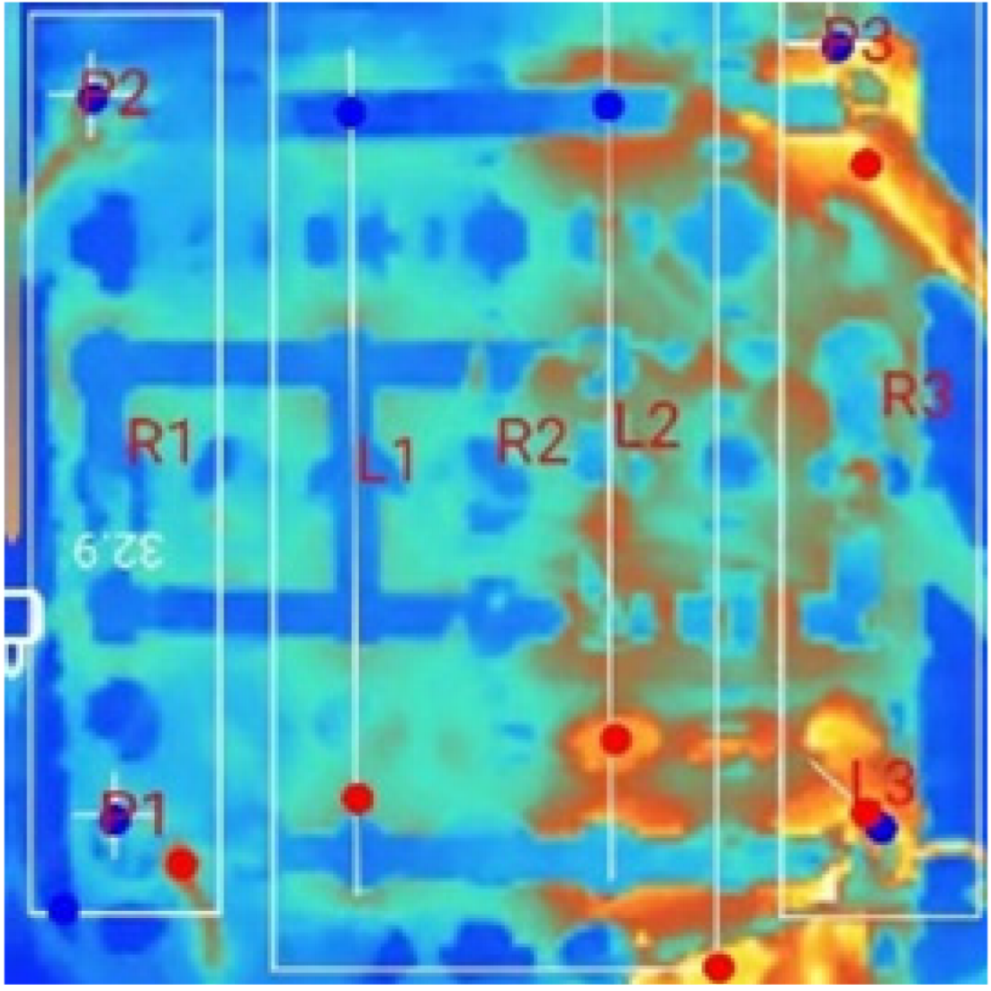 | 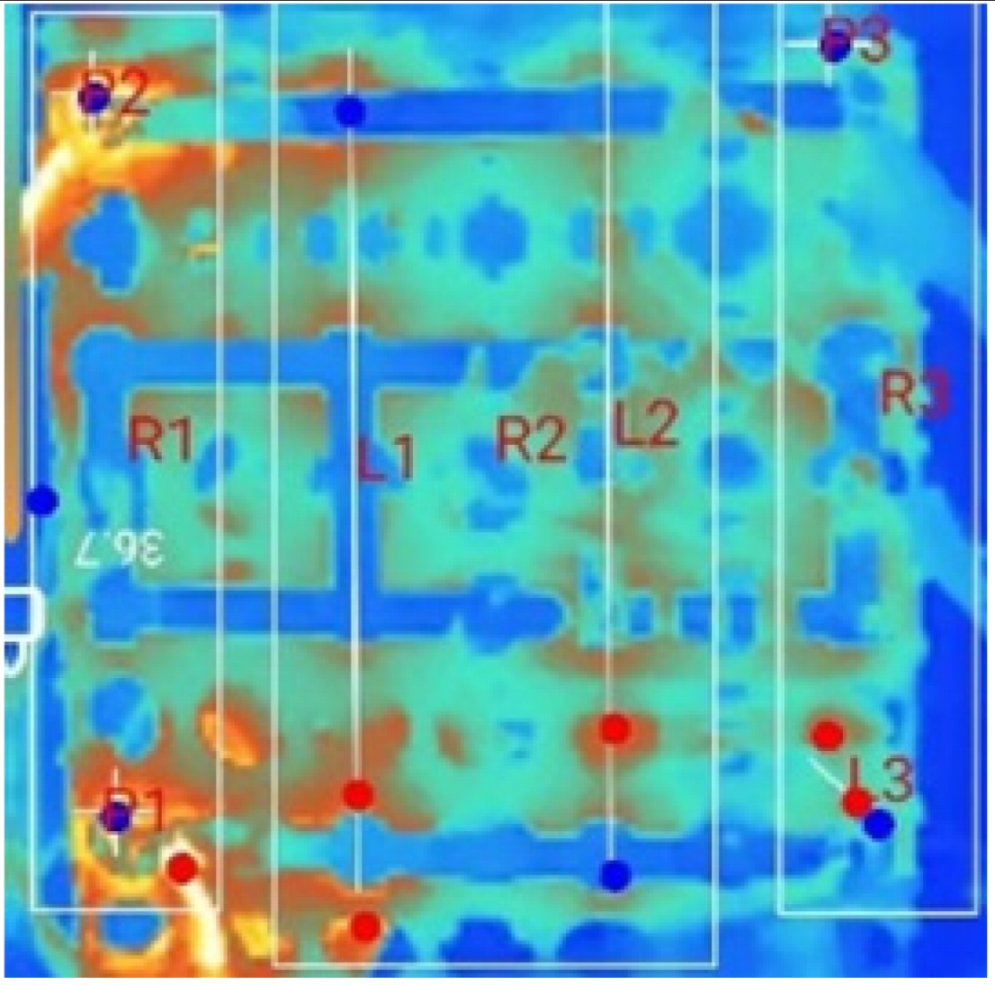 |  |  |
| (b) 18_D_E_N_2T_2S | 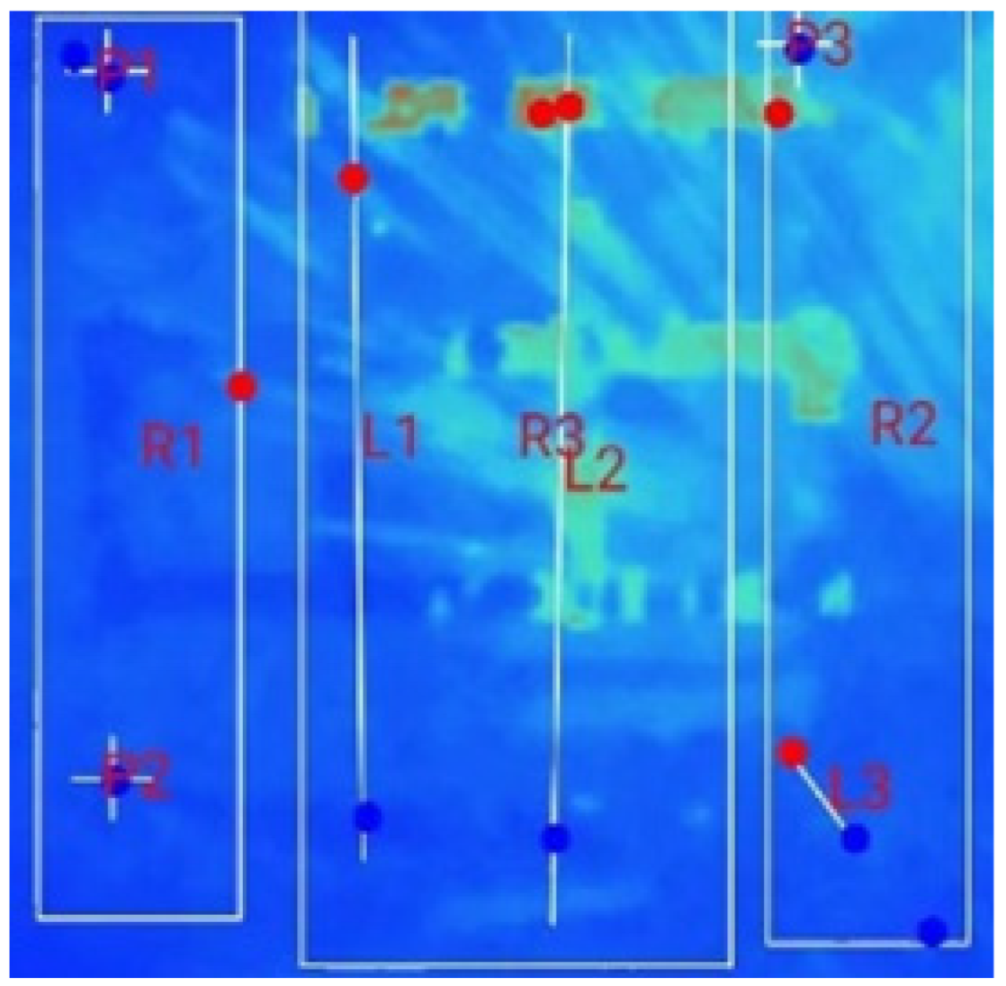 | 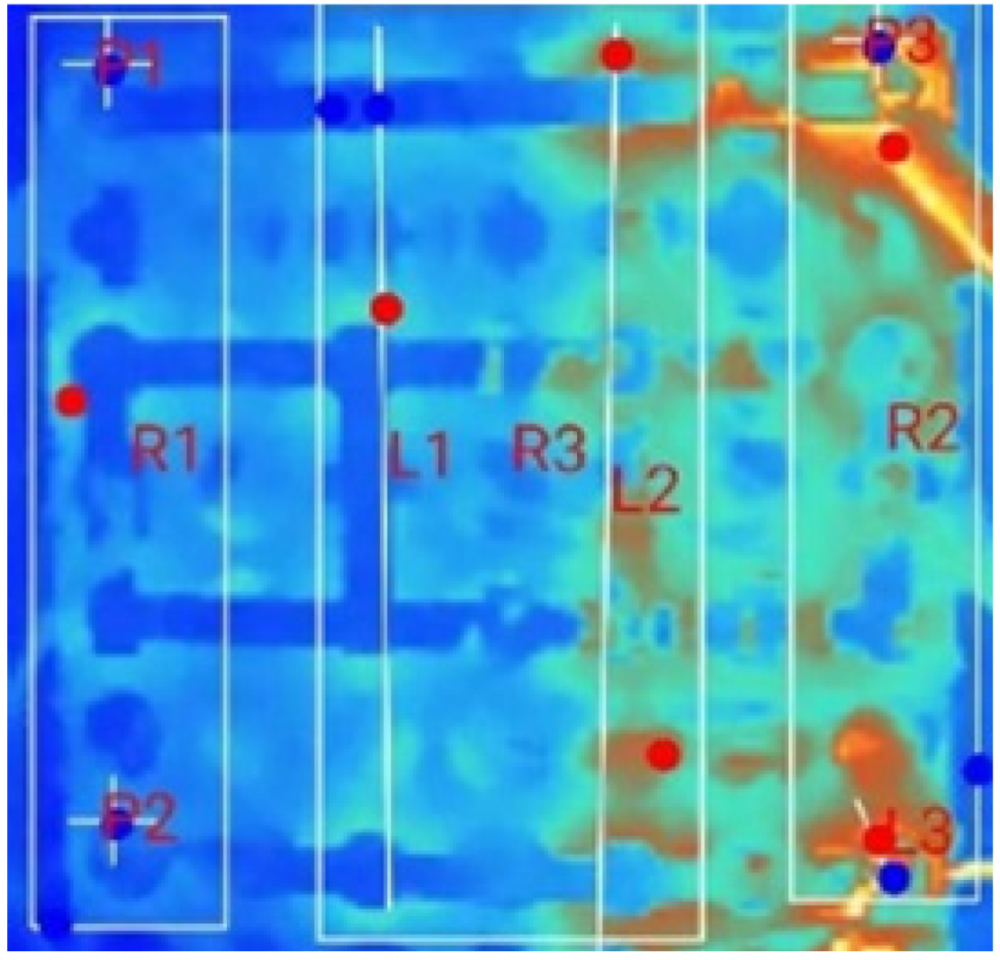 | 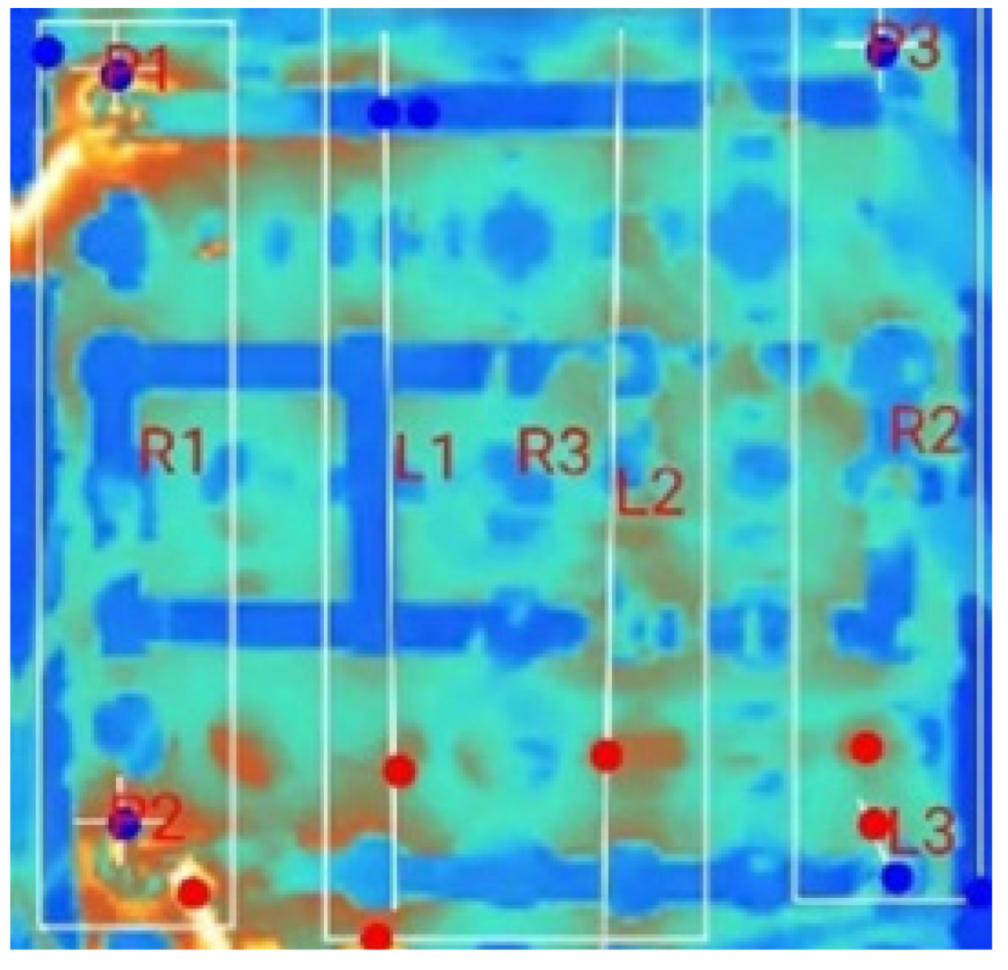 | 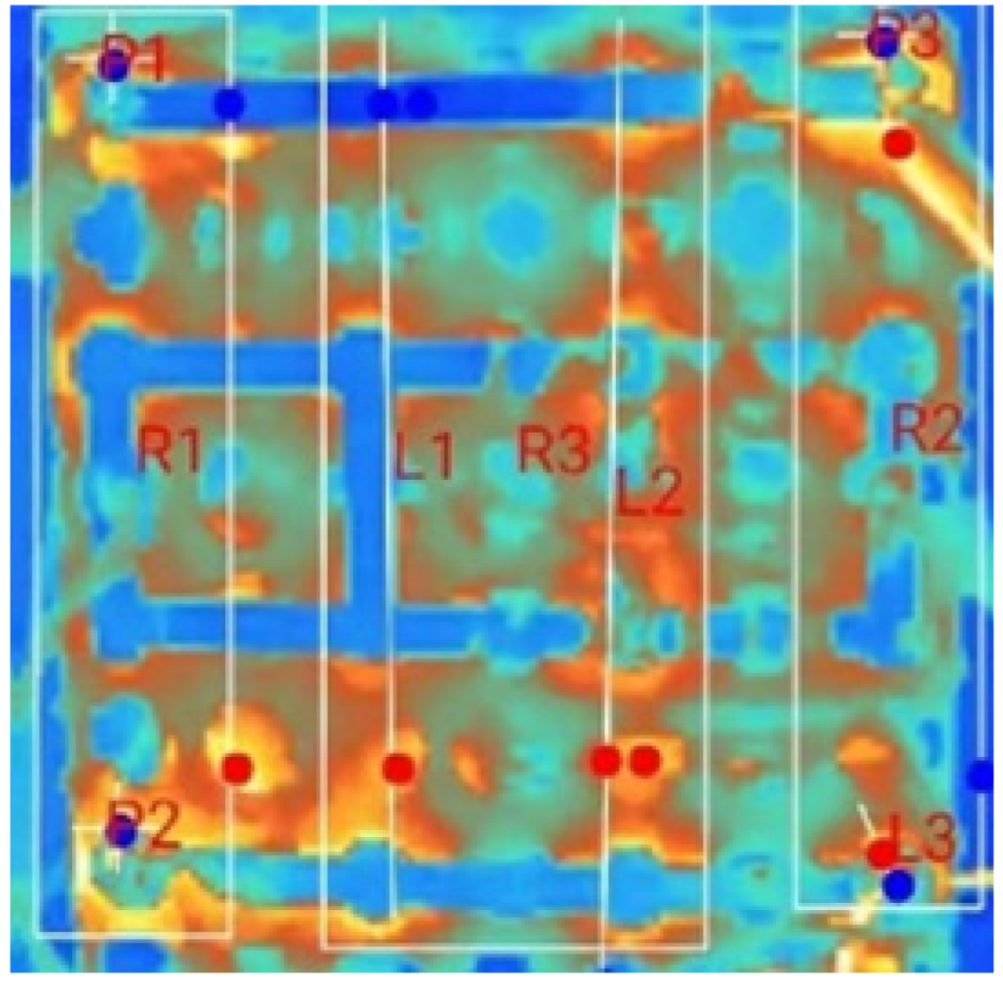 |  | |
| (c) 18_D_E_N_2T_3S | 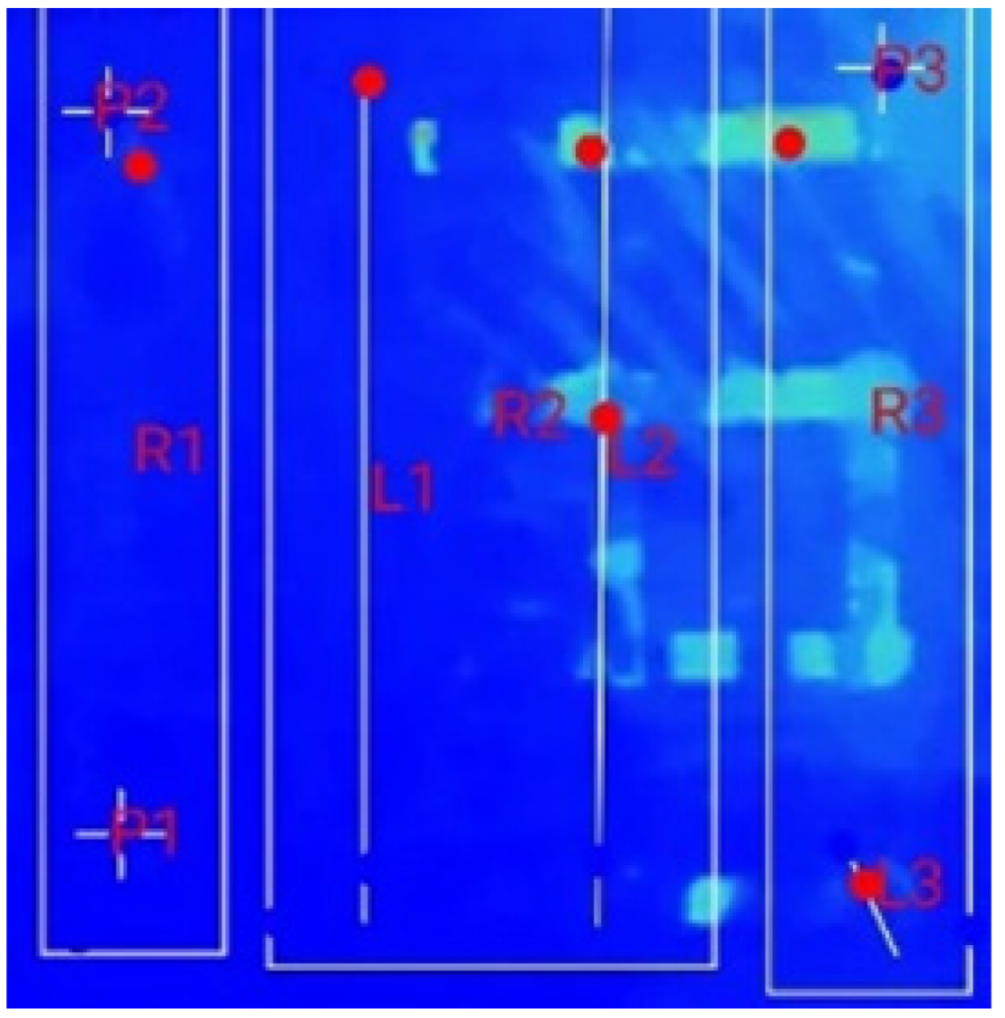 |  |  |  |  | |
| Switch Count (2S) | R1 | R2 | R3 | R4 | Pr | Pz | ||
|---|---|---|---|---|---|---|---|---|
| (°C/min) | (°C/min) | (°C/min) | (°C/min) | (°C) | (°C) | (°C) | (°C) | |
| 0 | 0.026 | 0.032 | 0.063 | 0.095 | 1.6 | 3.5 | 29.3 | 31.1 |
| 1 | 0.116 | 0.068 | 0.021 | −0.005 | 1.3 | 4.7 | 29.7 | 32.8 |
| 2 | 0.107 | 0.095 | 0.107 | 0.108 | 1 | 2.7 | 30.9 | 32.5 |
| Switch Count (3S) | R1 | R2 | R3 | R4 | Pr | Pz | ||
|---|---|---|---|---|---|---|---|---|
| (°C/min) | (°C/min) | (°C/min) | (°C/min) | (°C) | (°C) | (°C) | (°C) | |
| 0 | 0.073 | 0.087 | 0.1 | 0.107 | 1.4 | 2.5 | 28.1 | 29.4 |
| 1 | 0.107 | 0.067 | 0.027 | −0.013 | 1.1 | 3.9 | 29.4 | 32.1 |
| 2 | 0.014 | 0.05 | 0.071 | 0.093 | 0.8 | 1.5 | 29.6 | 31.1 |
| 3 | 0.15 | 0.125 | 0.108 | 0.067 | 1.2 | 4.2 | 31.1 | 34.2 |
| Time (Mins) | ||||||
|---|---|---|---|---|---|---|
| Test Cases | 00:00 | 15:00 | 30:00 | 45:00 | 60:00 | |
| (a) 18_D_E_F_M_2T_1S | 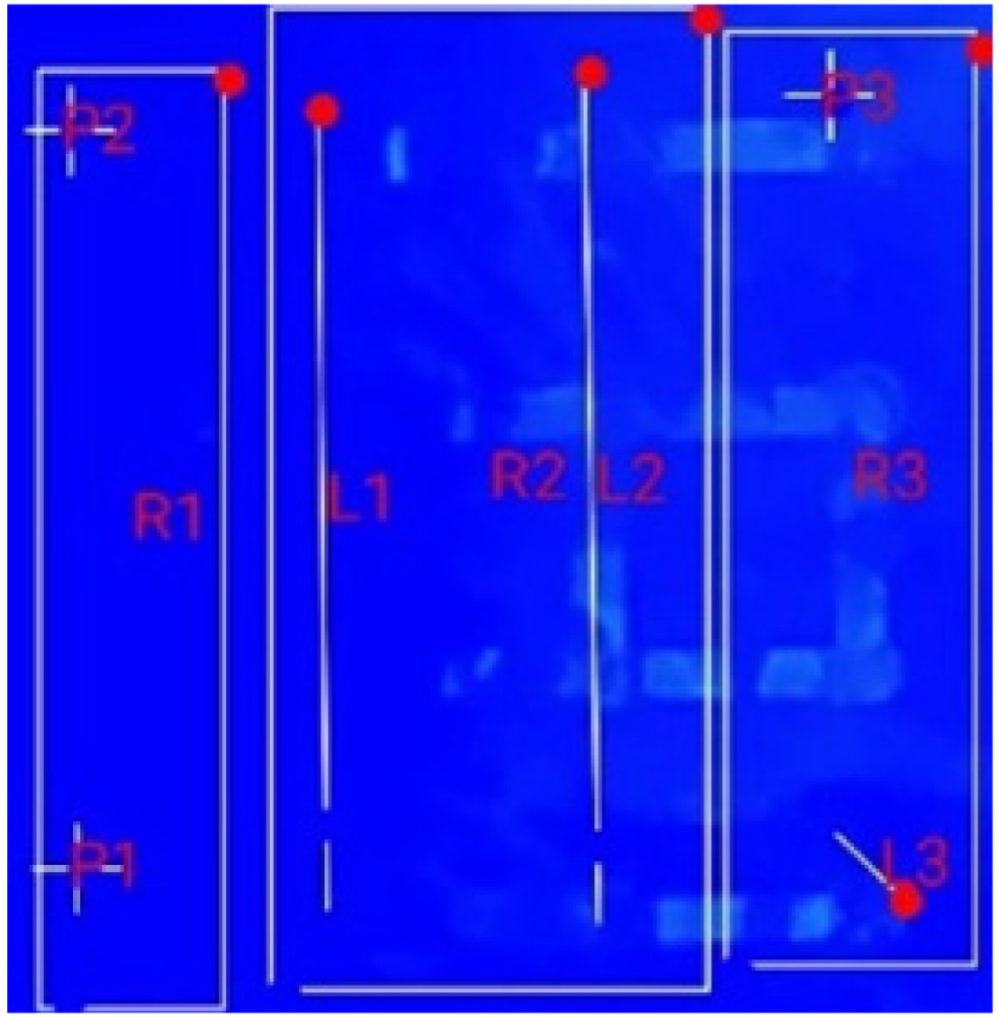 | 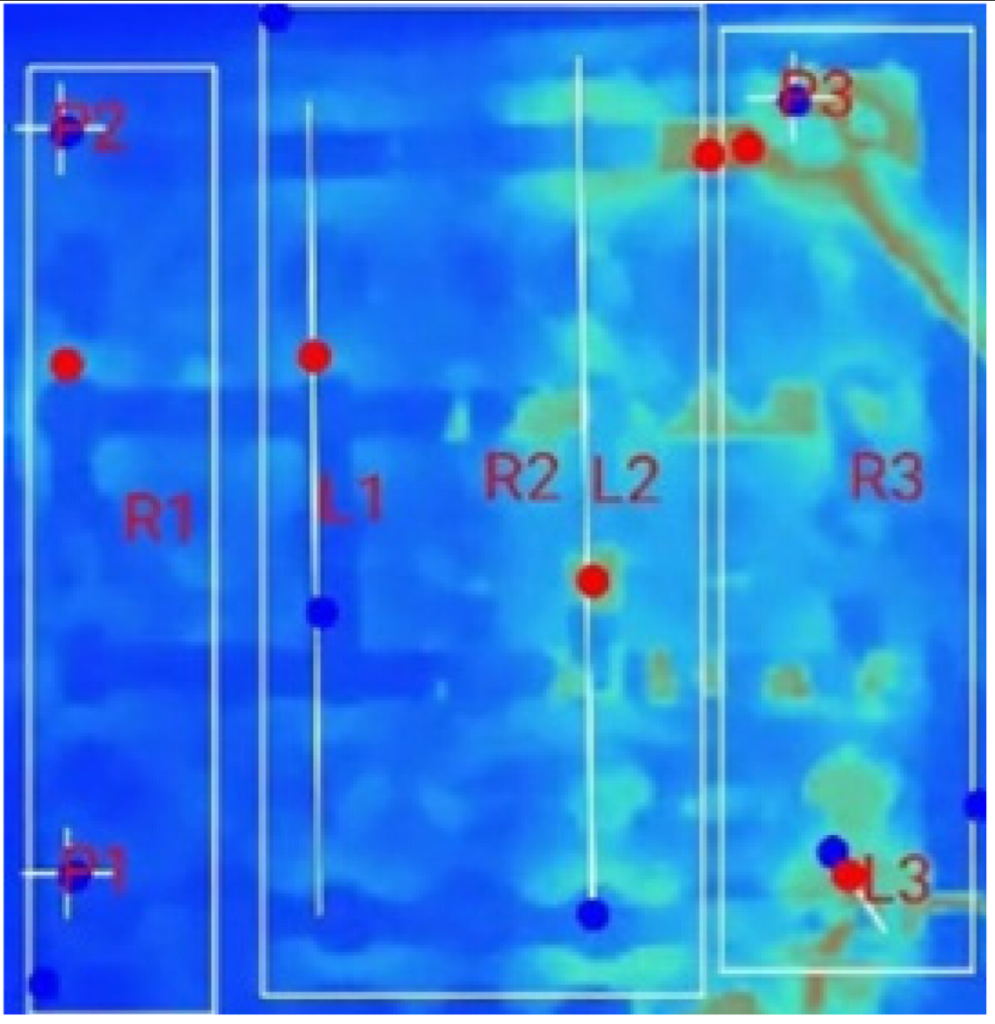 | 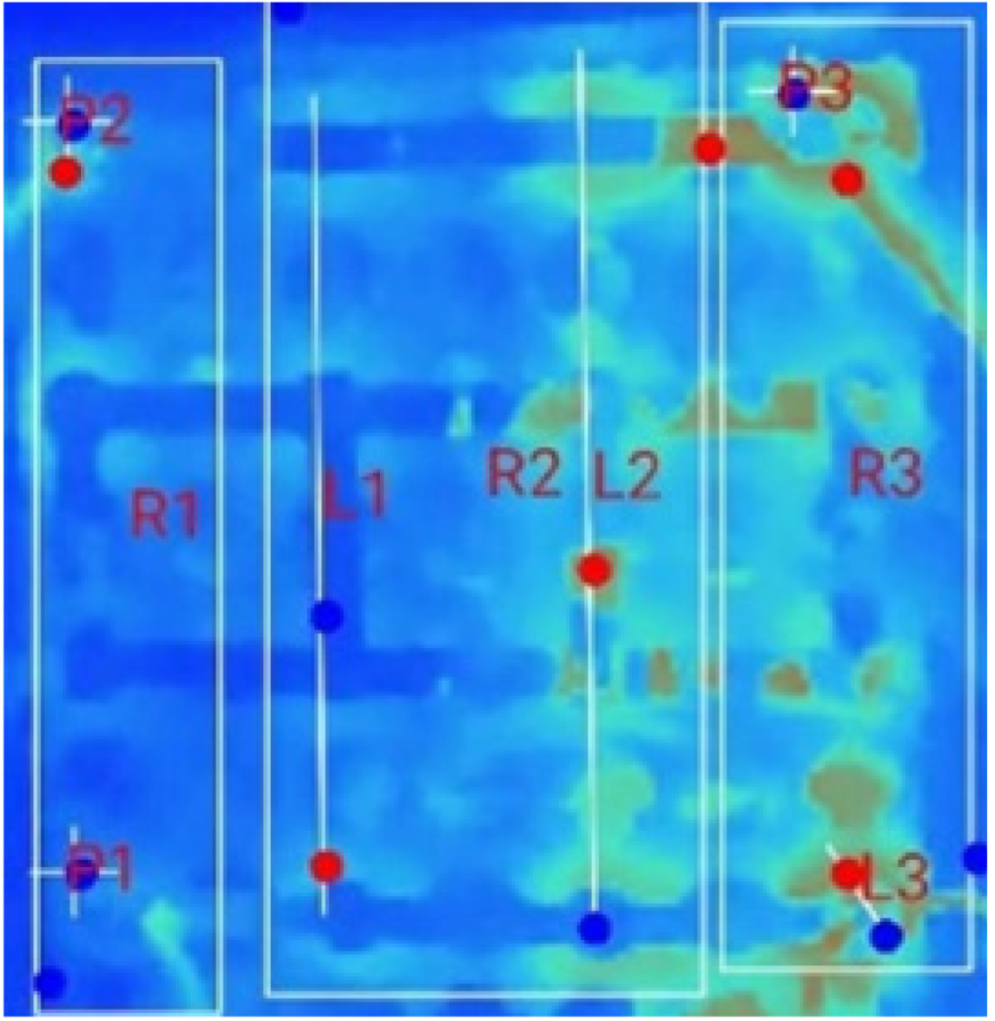 | 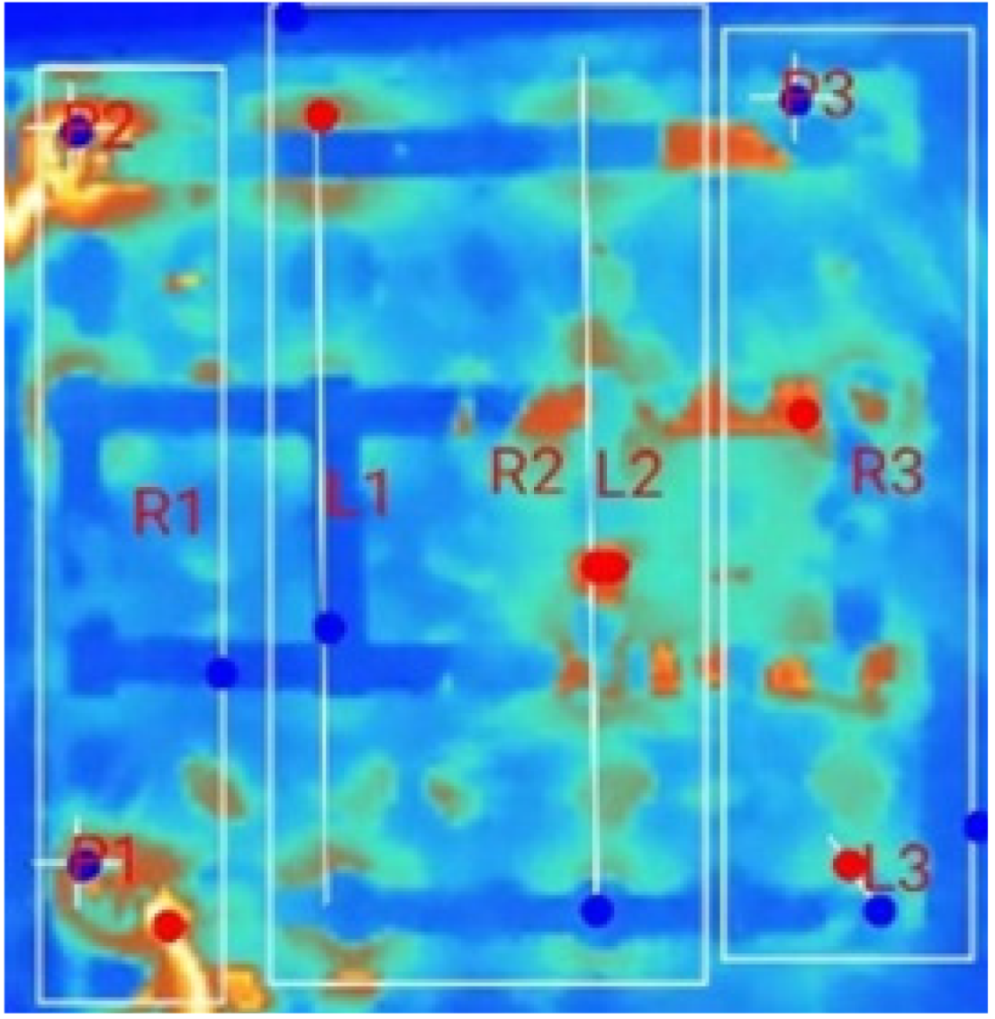 | 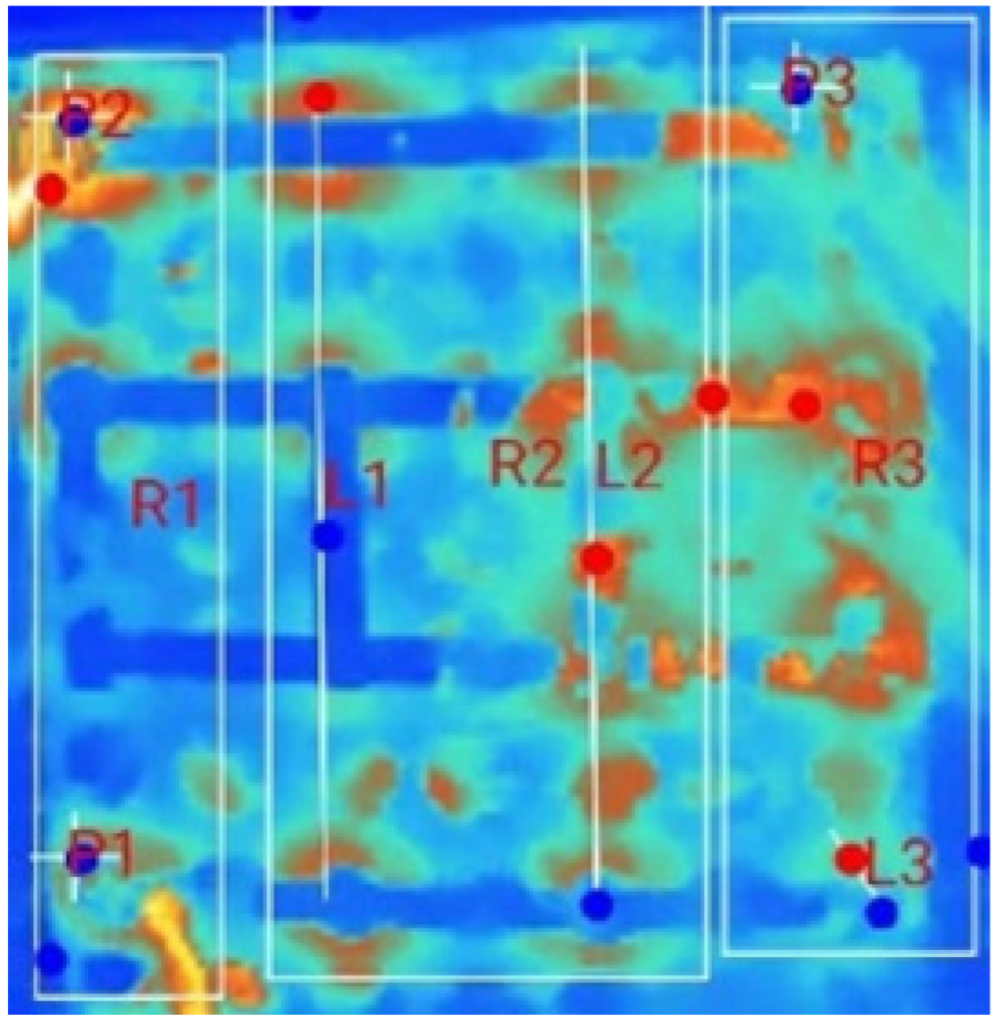 |  |
| (b) 18_D_E_F_M_2T _2S | 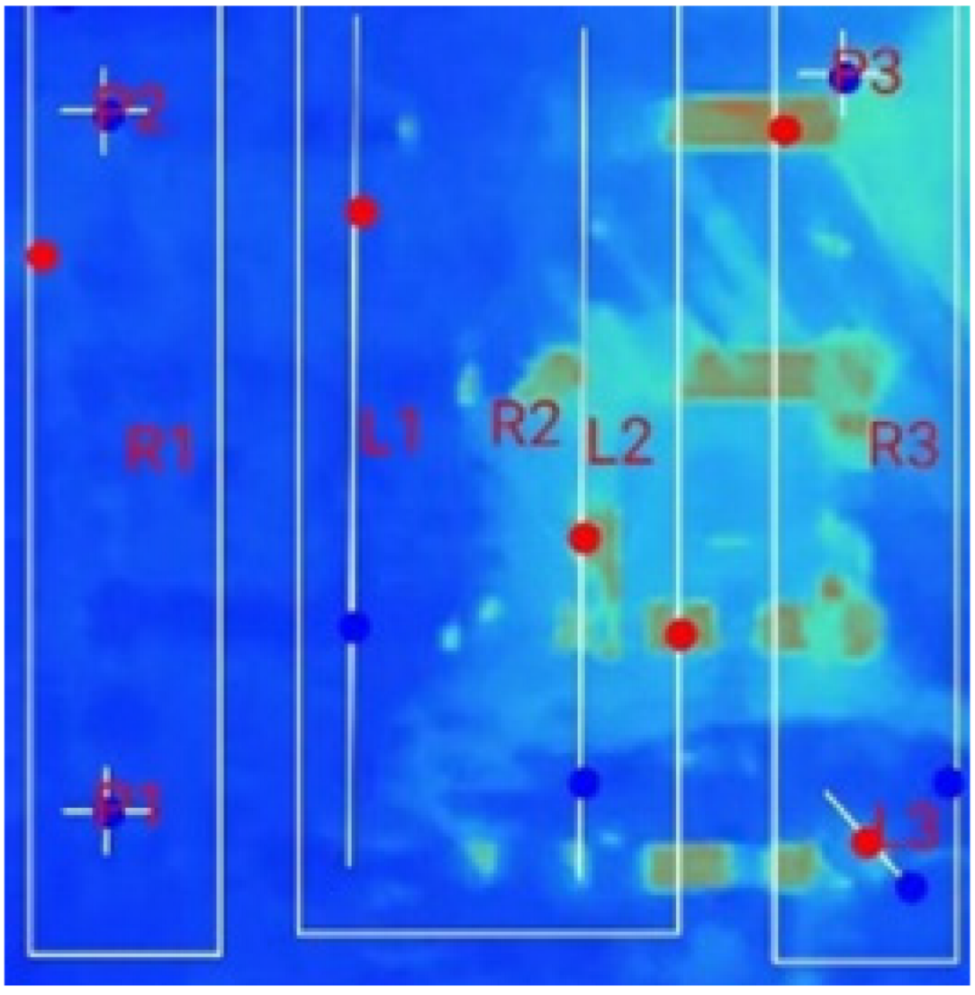 | 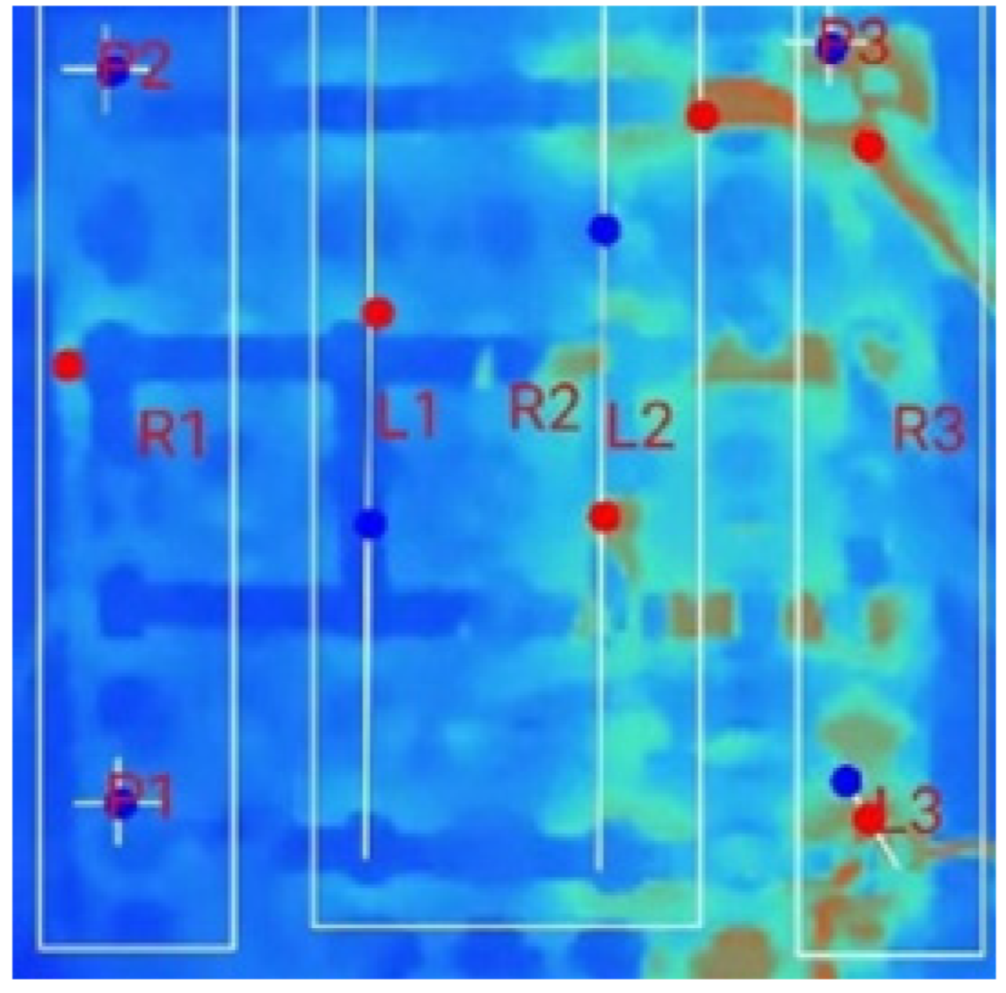 | 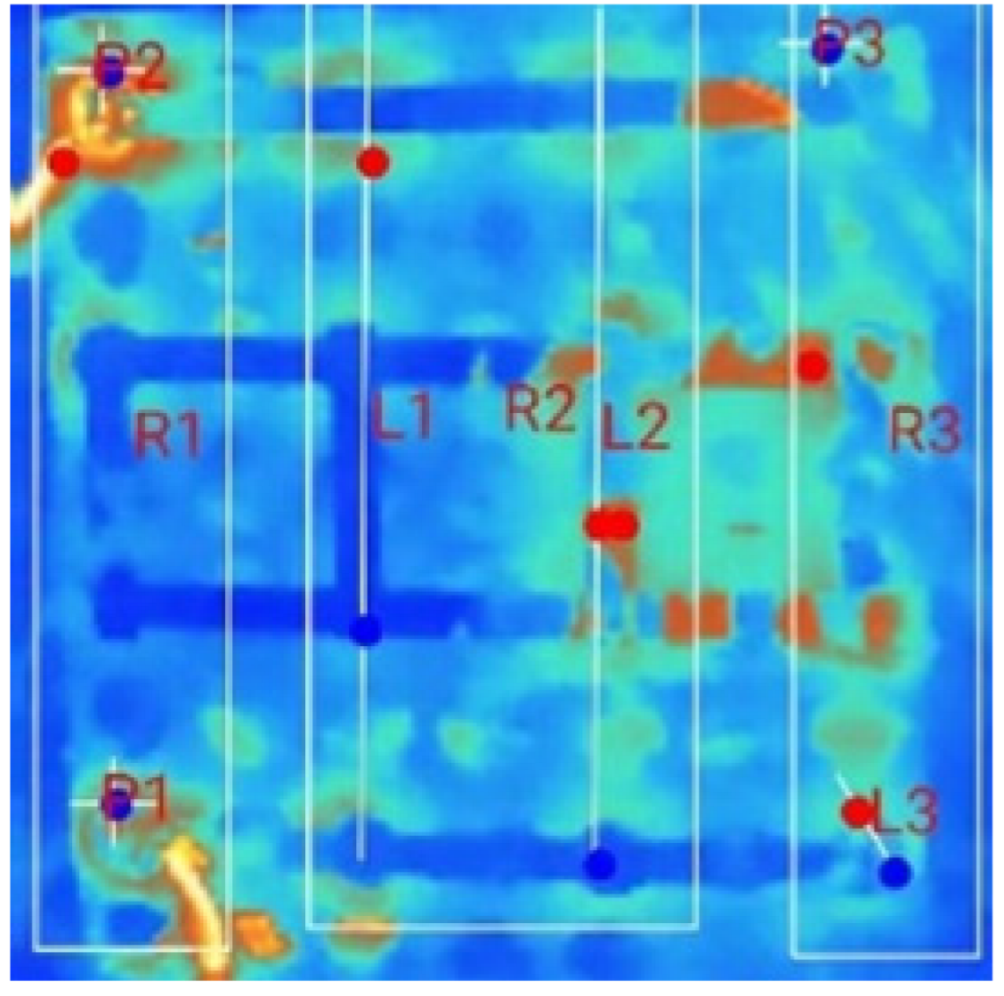 |  | 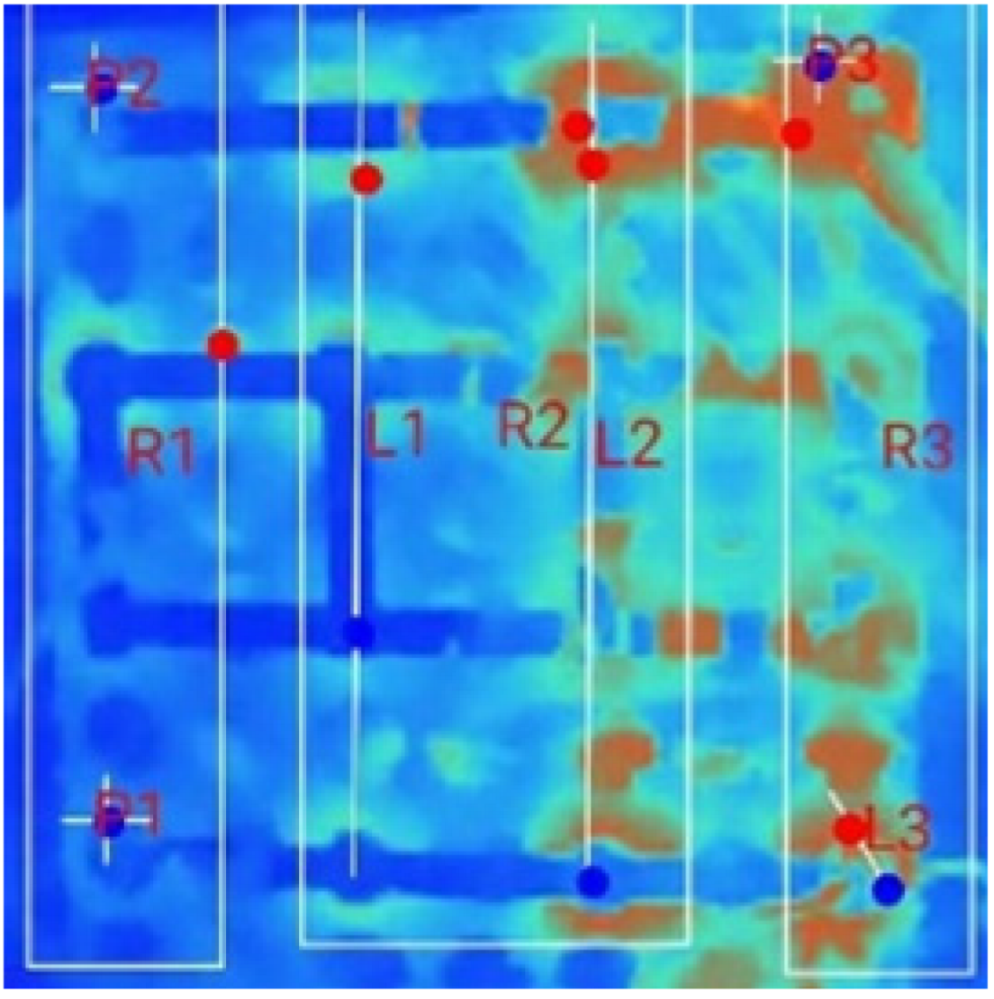 | |
| (c) 18_D_E_F_M_2T_3S | 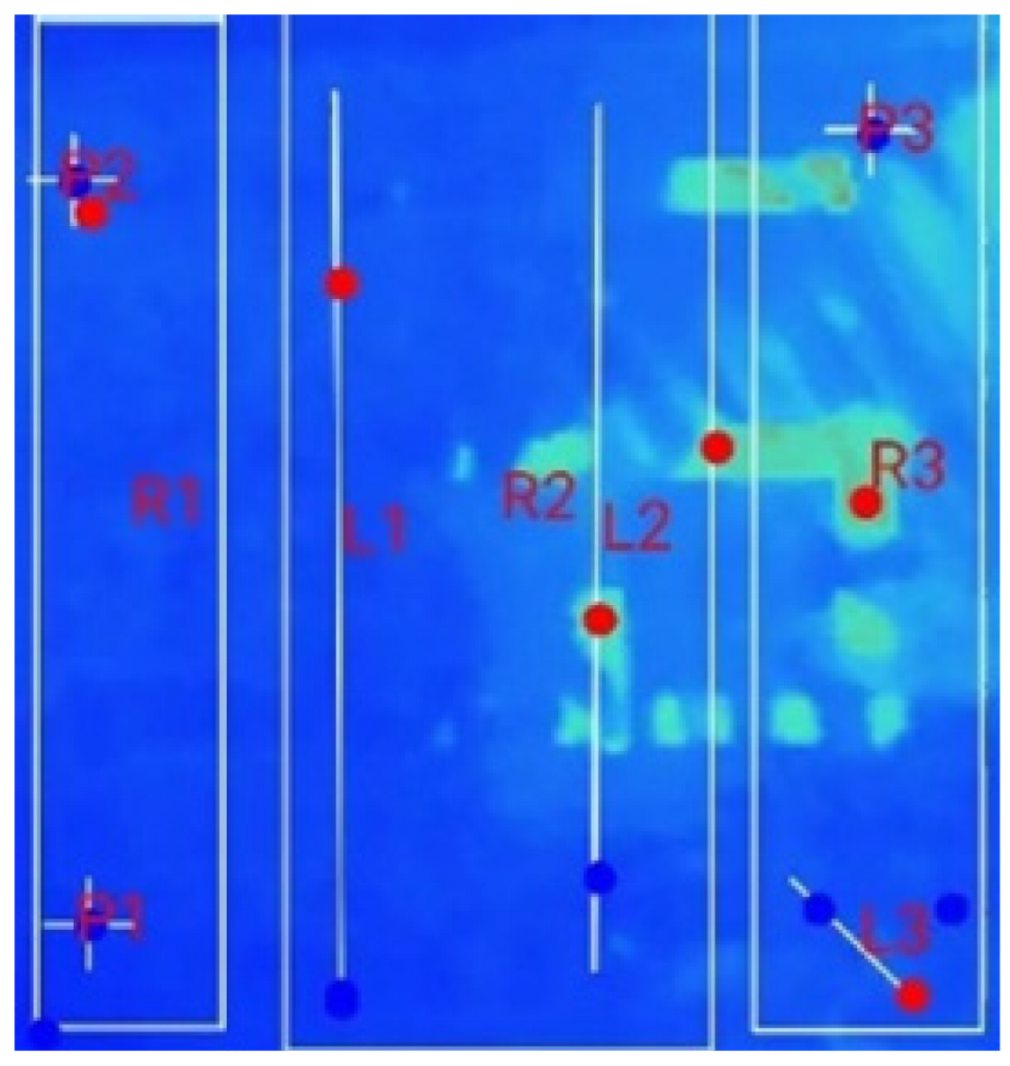 | 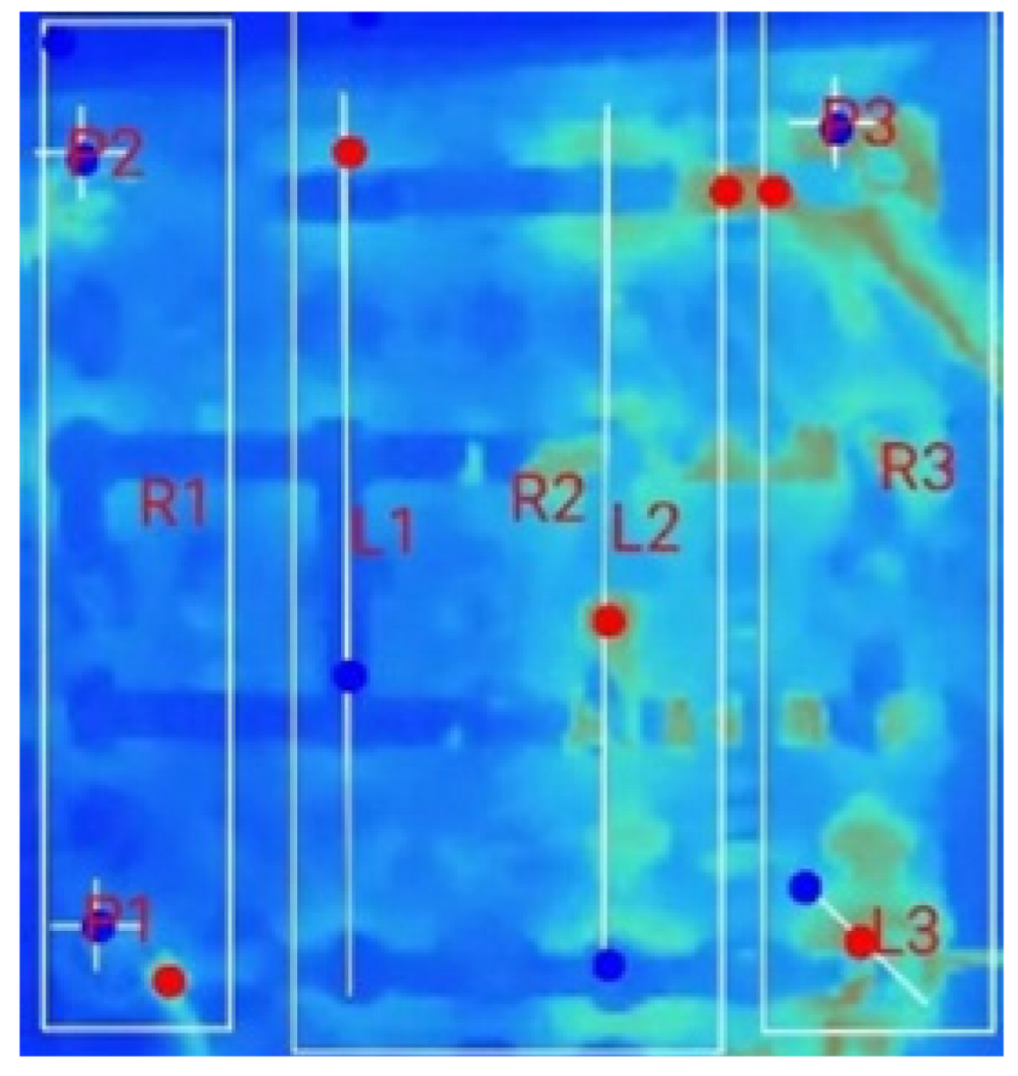 | 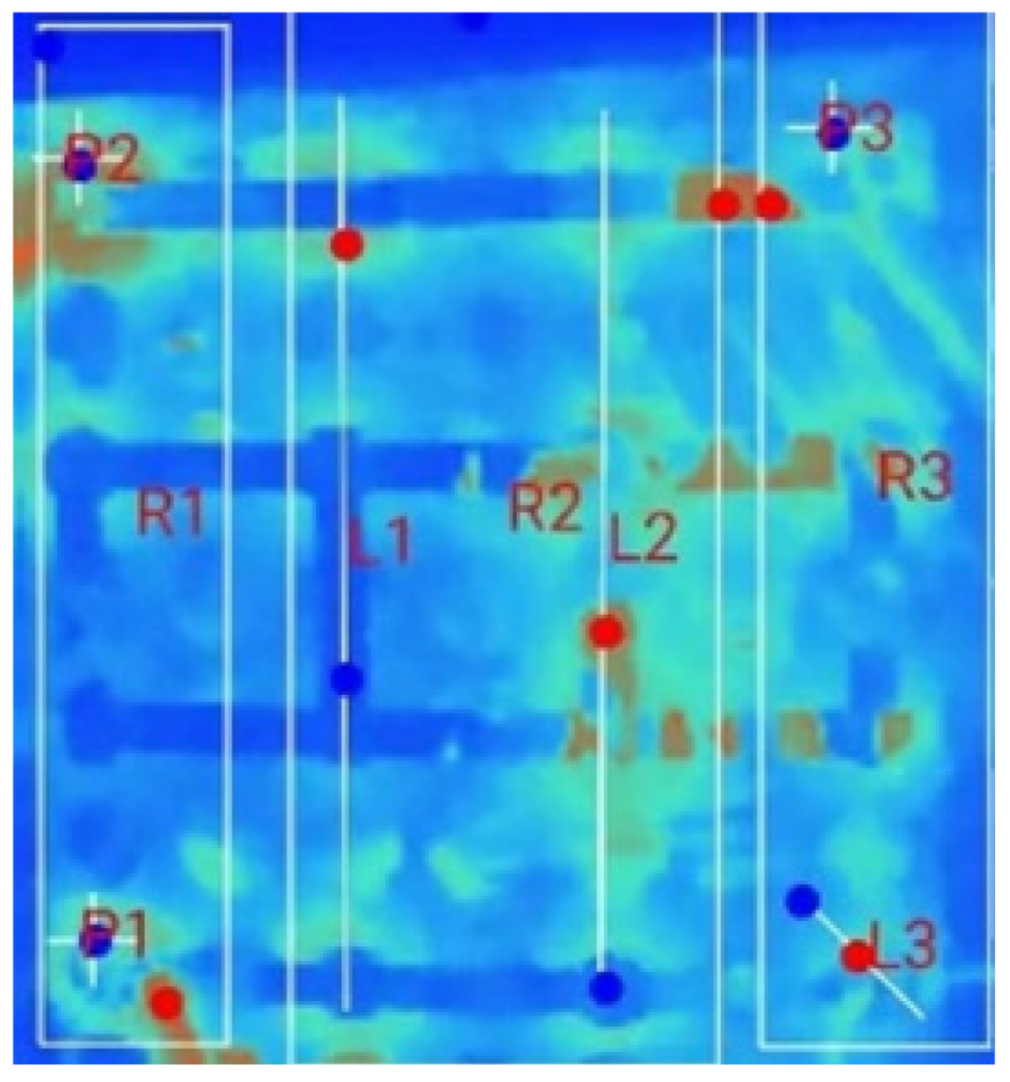 | 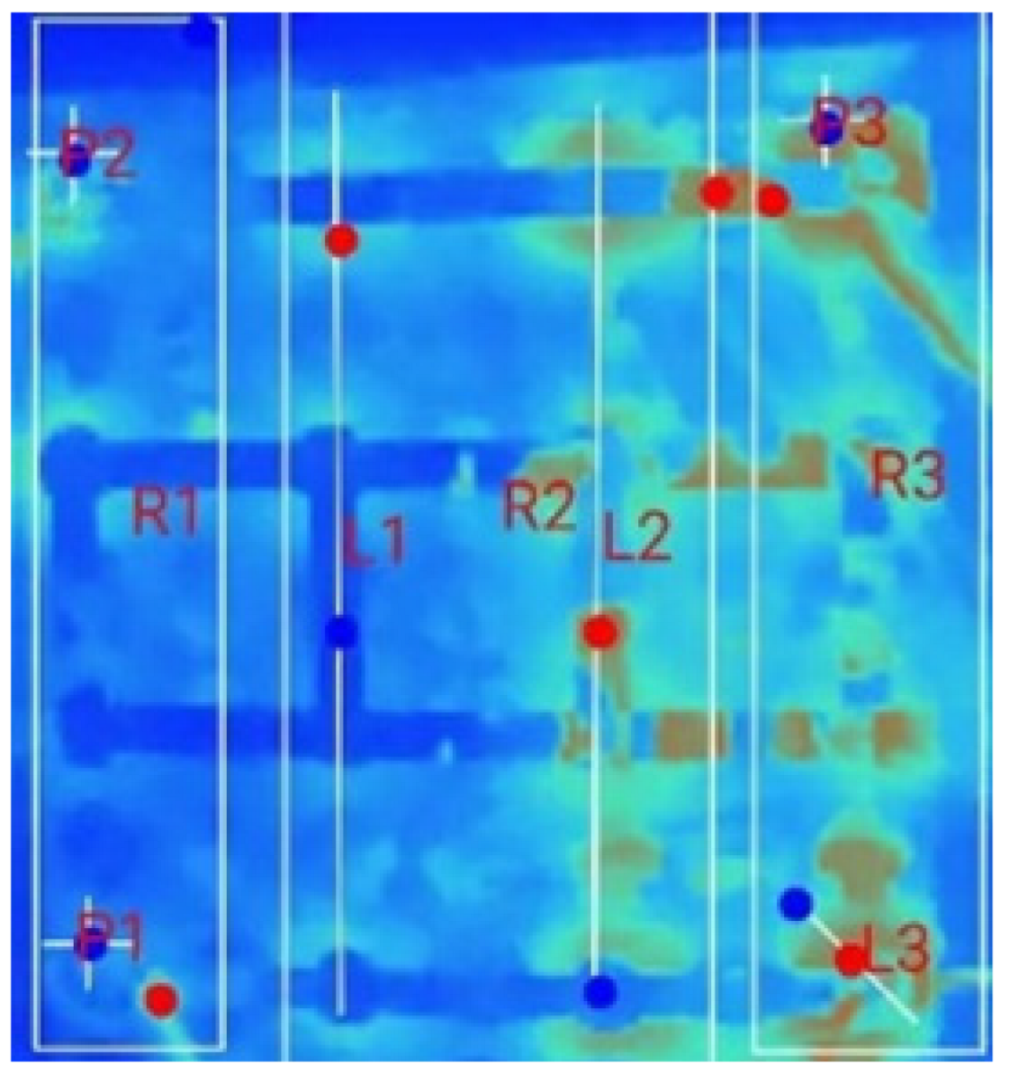 | 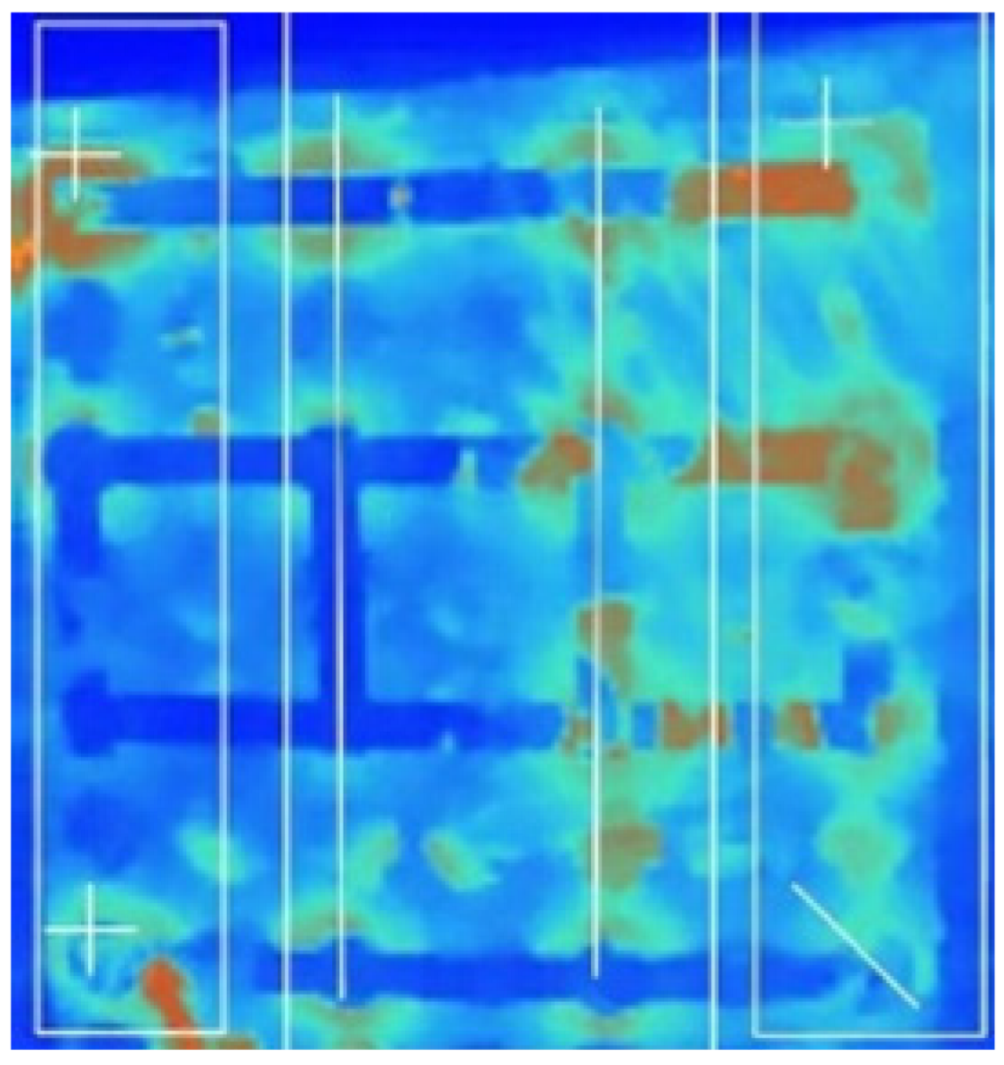 | |
| Test Case | Switch Count | R1 | R2 | R3 | R4 | Pr | Pz | ||
|---|---|---|---|---|---|---|---|---|---|
| (°C/min) | (°C/min) | (°C/min) | (°C/min) | (°C) | (°C) | (°C) | (°C) | ||
| 1S | 0 | 0.048 | 0.045 | 0.055 | 0.055 | 1 | 2.2 | 28.1 | 29.1 |
| 1 | 0.026 | 0.026 | 0.019 | 0.019 | 0.7 | 2.3 | 28.8 | 30.8 | |
| 2S | 0 | 0.06 | 0.065 | 0.07 | 0.075 | 1 | 2.1 | 28.1 | 29.1 |
| 1 | 0 | −0.005 | −0.02 | −0.035 | 0.7 | 1.9 | 28.1 | 29.8 | |
| 2 | 0 | 0.024 | 0.041 | 0.041 | 1 | 2.1 | 28.7 | 29.6 | |
| 3S | 0 | 0.073 | 0.067 | 0.093 | 0.093 | 1 | 1.6 | 27.6 | 28.3 |
| 1 | 0.05 | 0.038 | 0.031 | 0.006 | 1.2 | 1.9 | 27.9 | 29.2 | |
| 2 | 0.027 | 0.067 | 0.053 | 0.067 | 1.1 | 2 | 28.2 | 28.9 | |
| 3 | 0.118 | 0.109 | 0.1 | 0.082 | 0.9 | 1.8 | 28.6 | 29.7 |
Disclaimer/Publisher’s Note: The statements, opinions and data contained in all publications are solely those of the individual author(s) and contributor(s) and not of MDPI and/or the editor(s). MDPI and/or the editor(s) disclaim responsibility for any injury to people or property resulting from any ideas, methods, instructions or products referred to in the content. |
© 2025 by the authors. Published by MDPI on behalf of the World Electric Vehicle Association. Licensee MDPI, Basel, Switzerland. This article is an open access article distributed under the terms and conditions of the Creative Commons Attribution (CC BY) license (https://creativecommons.org/licenses/by/4.0/).
Share and Cite
D, S.; Ramar, R.; Ravichandran, S. A Correlational Study on Architectural Design and Thermal Distribution Patterns Using a Novel Multi-Terminal Approach in Cylindrical Li-Ion Cell-Integrated Battery Packs. World Electr. Veh. J. 2025, 16, 361. https://doi.org/10.3390/wevj16070361
D S, Ramar R, Ravichandran S. A Correlational Study on Architectural Design and Thermal Distribution Patterns Using a Novel Multi-Terminal Approach in Cylindrical Li-Ion Cell-Integrated Battery Packs. World Electric Vehicle Journal. 2025; 16(7):361. https://doi.org/10.3390/wevj16070361
Chicago/Turabian StyleD, Sagar, Raja Ramar, and Shama Ravichandran. 2025. "A Correlational Study on Architectural Design and Thermal Distribution Patterns Using a Novel Multi-Terminal Approach in Cylindrical Li-Ion Cell-Integrated Battery Packs" World Electric Vehicle Journal 16, no. 7: 361. https://doi.org/10.3390/wevj16070361
APA StyleD, S., Ramar, R., & Ravichandran, S. (2025). A Correlational Study on Architectural Design and Thermal Distribution Patterns Using a Novel Multi-Terminal Approach in Cylindrical Li-Ion Cell-Integrated Battery Packs. World Electric Vehicle Journal, 16(7), 361. https://doi.org/10.3390/wevj16070361