Article

Improvement in Pavement Defect Scenarios Using an Improved YOLOv10 with ECA Attention, RefConv and WIoU

1
School of Computer and Information, Anqing Normal University, Anqing 246133, China
2
Physical Education College, Anqing Normal University, Anqing 246133, China
*
Author to whom correspondence should be addressed.
World Electr. Veh. J. 2025, 16(6), 328; https://doi.org/10.3390/wevj16060328
Submission received: 17 May 2025 / Revised: 5 June 2025 / Accepted: 6 June 2025 / Published: 13 June 2025

Abstract

This study addresses challenges such as multi-scale defects, varying lighting, and irregular shapes by proposing an improved YOLOv10 model that integrates the ECA attention mechanism, RefConv feature enhancement module, and WIoU loss function for complex pavement defect detection. The RefConv dual-branch structure achieves feature complementarity between local details and global context (mAP increased by 2.1%), the ECA mechanism models channel relationships using 1D convolution (small-object recall rate increased by 27%), and the WIoU loss optimizes difficult sample regression through a dynamic weighting mechanism (location accuracy improved by 37%). Experiments show that on a dataset constructed from 23,949 high-resolution images, the improved model’s mAP reaches 68.2%, which is an increase of 6.2% compared to the baseline YOLOv10, maintaining a stable recall rate of 83.5% in highly reflective and low-light scenarios, with an inference speed of 158 FPS (RTX 4080), providing a high-precision real-time solution for intelligent road inspection.

1. Introduction

In the current wave of intelligent transportation infrastructure maintenance, road defect detection, as a critical component in ensuring road safety and driving comfort, faces unprecedented challenges. Traditional detection methods exhibit significant limitations in efficiency and accuracy when dealing with complex and dynamic road environments, particularly in identifying micro-cracks, handling strong reflective light interference, and precisely locating irregularly shaped defects. With breakthroughs in deep learning, detection systems based on the YOLOv10 algorithm have emerged as a core technology to address these challenges.
To improve YOLOv10, Ruiyang Liu proposed [1] the introduction of the LDConv module, KAN module, and MDCR module. Hu Haoyan introduced the ADown module [2], DySample module, and C2f_EMSCP module. Zihang Hu incorporated the WF module [3] and EMA module.
Given this context, the original YOLOv10 architecture still requires optimization to meet the specific demands of road defect detection [4]. This study thoroughly explores advanced deep learning-based object detection techniques and innovatively integrates the YOLOv10 model with the ECA attention mechanism, RefConv feature enhancement module, and WIoU loss function to construct an efficient and accurate road defect detection system. By introducing the ECA mechanism [5], the model’s ability to capture inter-channel relationships is significantly enhanced, improving small-target recall by 27%. The addition of the RefConv module [6], with its unique dual-branch structure, effectively integrates local details and global contextual information, boosting detection precision (mAP) by 2.1%. Meanwhile, the optimization of the WIoU loss function [7] enhances regression performance for challenging samples through dynamic weighting, increasing localization accuracy by 37%.
Experimental results demonstrate that these improvements not only elevate the mAP of the enhanced model to 68.2% and show a 6.2% increase over the baseline but also maintain high real-time performance at 158 FPS. This provides robust technical support for intelligent road inspection systems, significantly advancing the transition of transportation infrastructure maintenance toward intelligence and automation.

2. Theories and Methods

To enhance the accuracy and efficiency of the YOLO series object detection models in complex real-world scenarios, YOLOv10, as the latest iteration of this series, introduces significant optimizations in architectural design, module organization [8], and loss function strategies. This paper constructs a road defect detection model based on YOLOv10, incorporating innovative strategies such as the ECA attention mechanism [9], RefConv feature enhancement module, and WIoU loss function to systematically improve the model’s feature modeling capability, discriminative power [10], and robustness. While maintaining detection speed, the model effectively enhances recognition accuracy for multiple types of complex defect targets [11], providing theoretical and engineering support for smart cities and automated road inspection systems.
From a structural perspective, YOLOv10 introduces several key improvements over YOLOv8 and YOLOv9 in backbone feature extraction, path fusion [12], and detection head design, as shown in Figure 1. YOLOv10 adopts a novel Unified Decoupled Head structure, decoupling classification and regression tasks to optimize each subtask in a more focused semantic space, thereby improving feature utilization efficiency and bounding box regression accuracy. Additionally [13], YOLOv10 eliminates the redundant PAN structure used in YOLOv5-v8 and replaces it with a lightweight BiFPN (Bidirectional Feature Pyramid Network) for feature fusion, reducing computational overhead while preserving semantic consistency [14]. The introduced Dynamic Head mechanism dynamically adjusts feature response paths based on target scales, enhancing the network’s adaptability to objects of varying shapes. These architectural [15] upgrades enable YOLOv10 to achieve a superior accuracy–speed trade-off on mainstream datasets like MS-COCO, laying a solid foundation for multi-scale road defect detection in this study.
Based on this foundation, this paper proposes three targeted improvements:
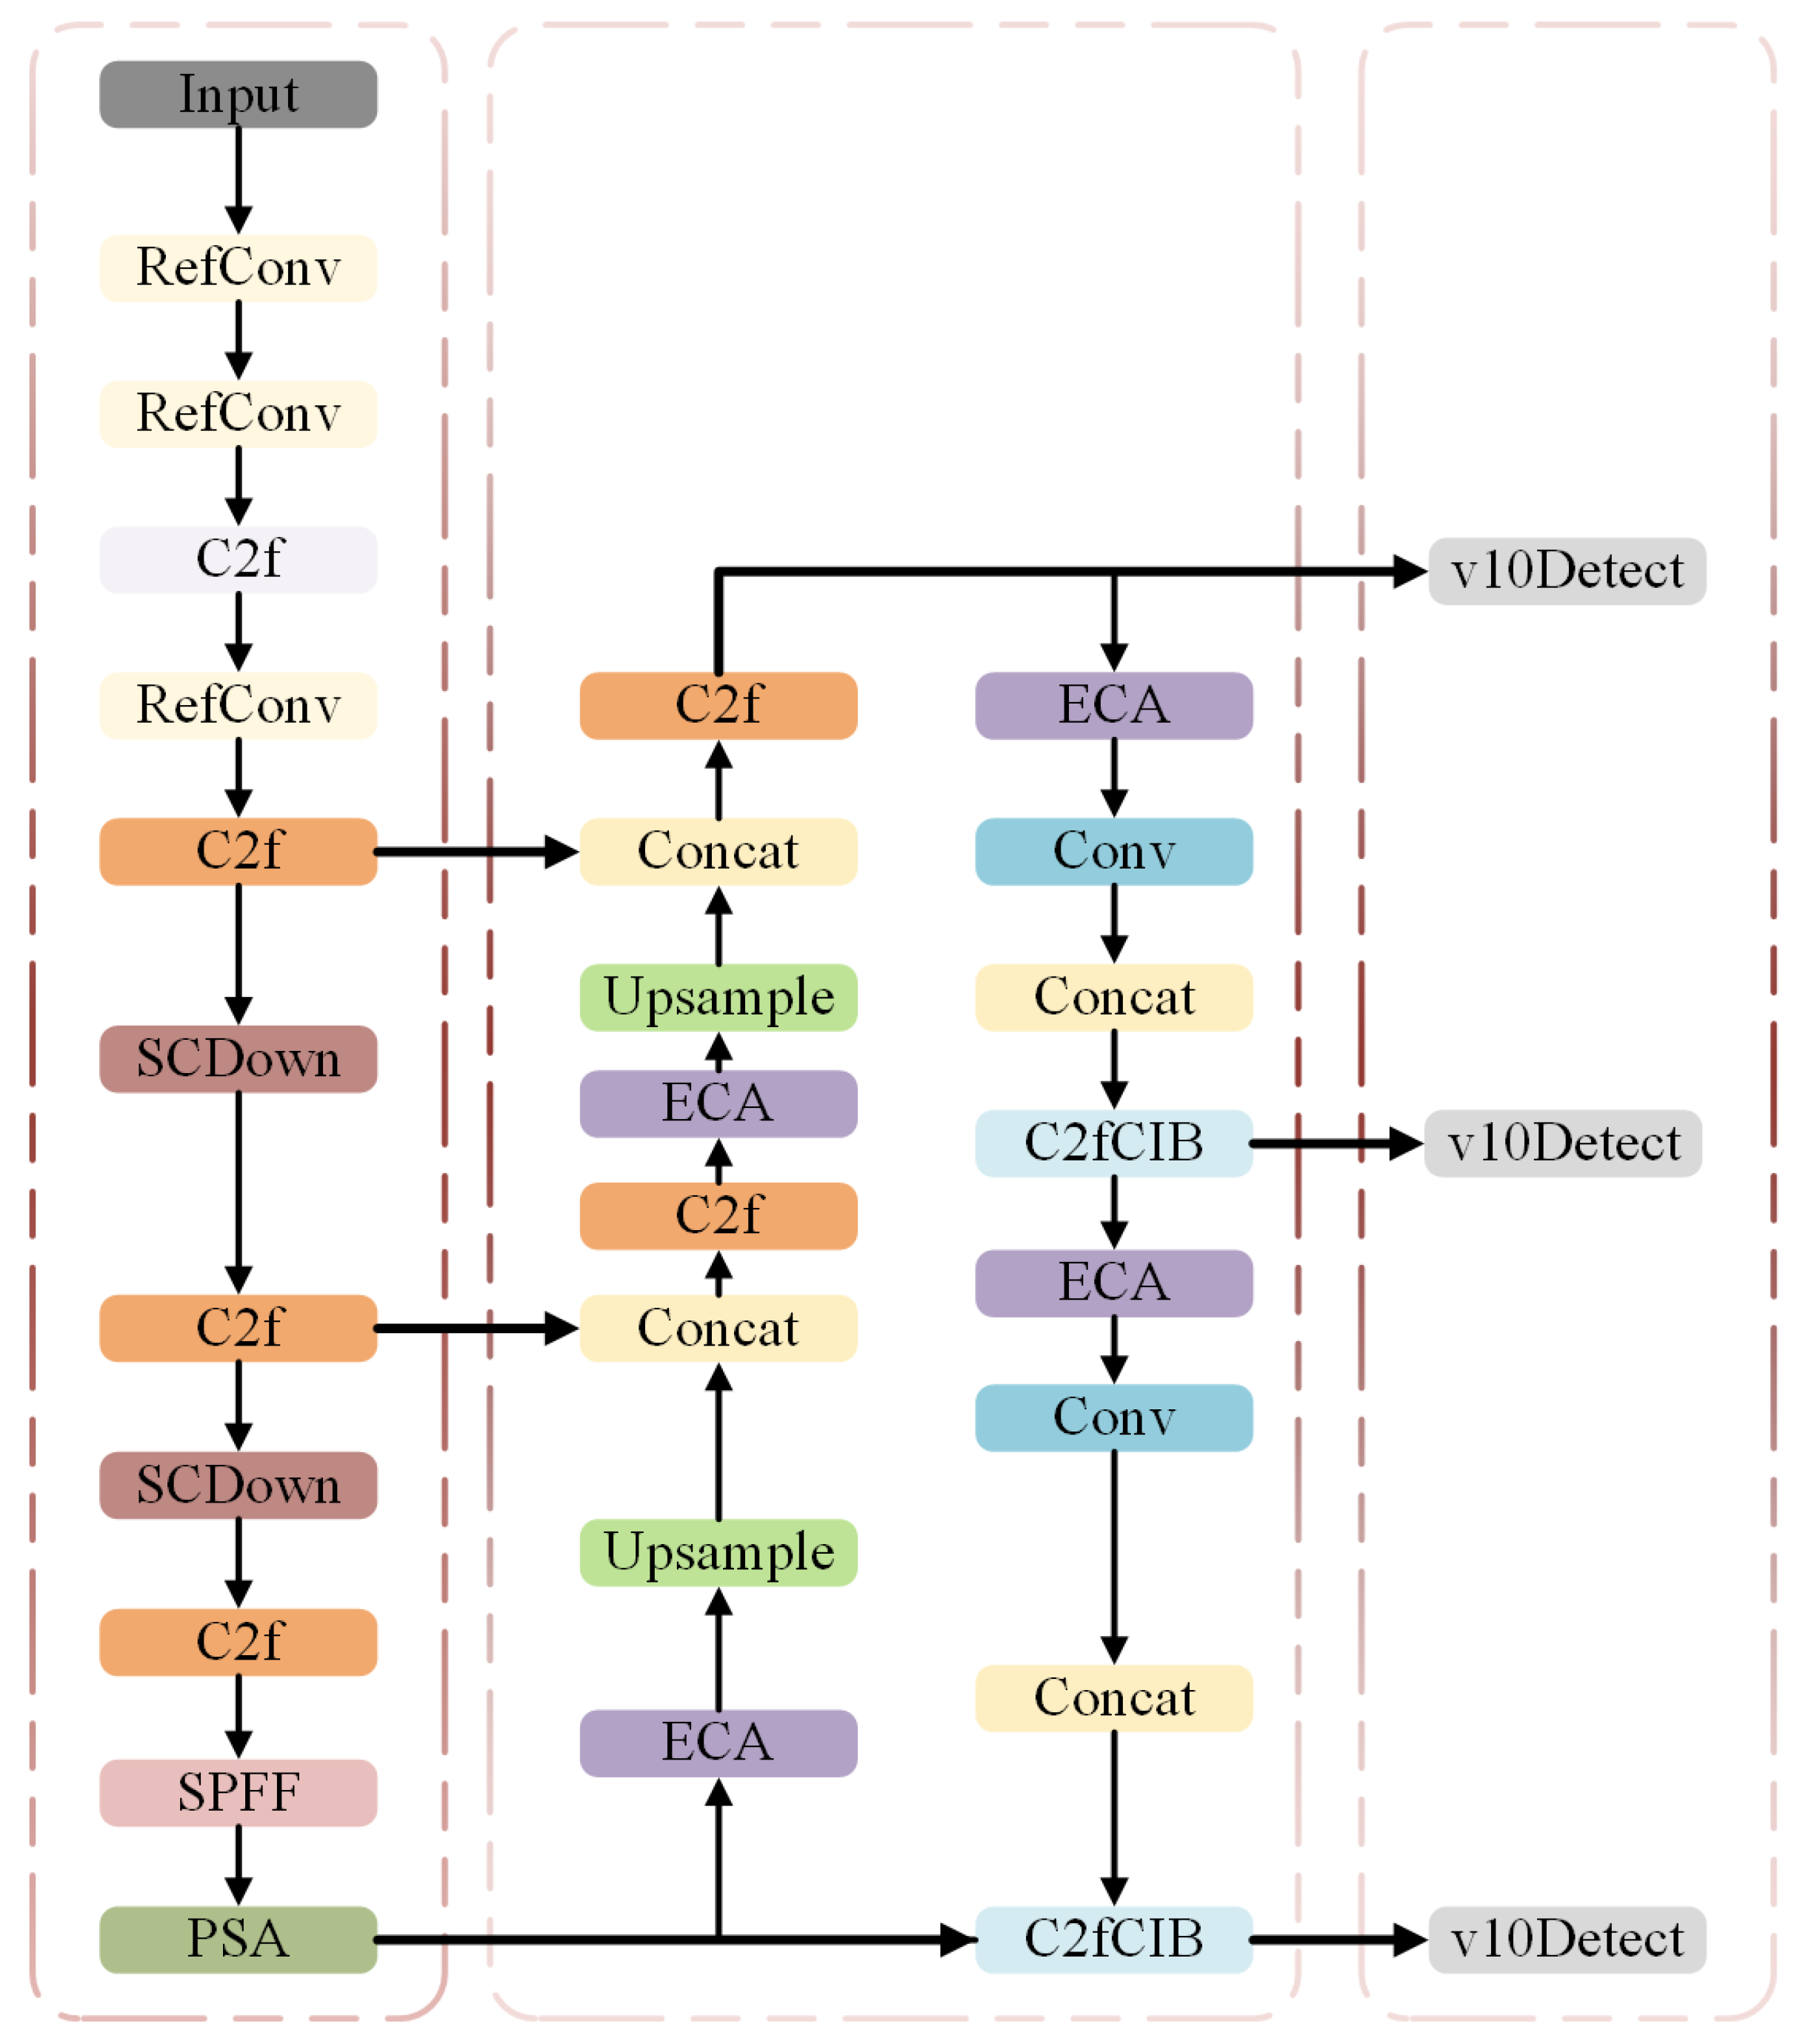
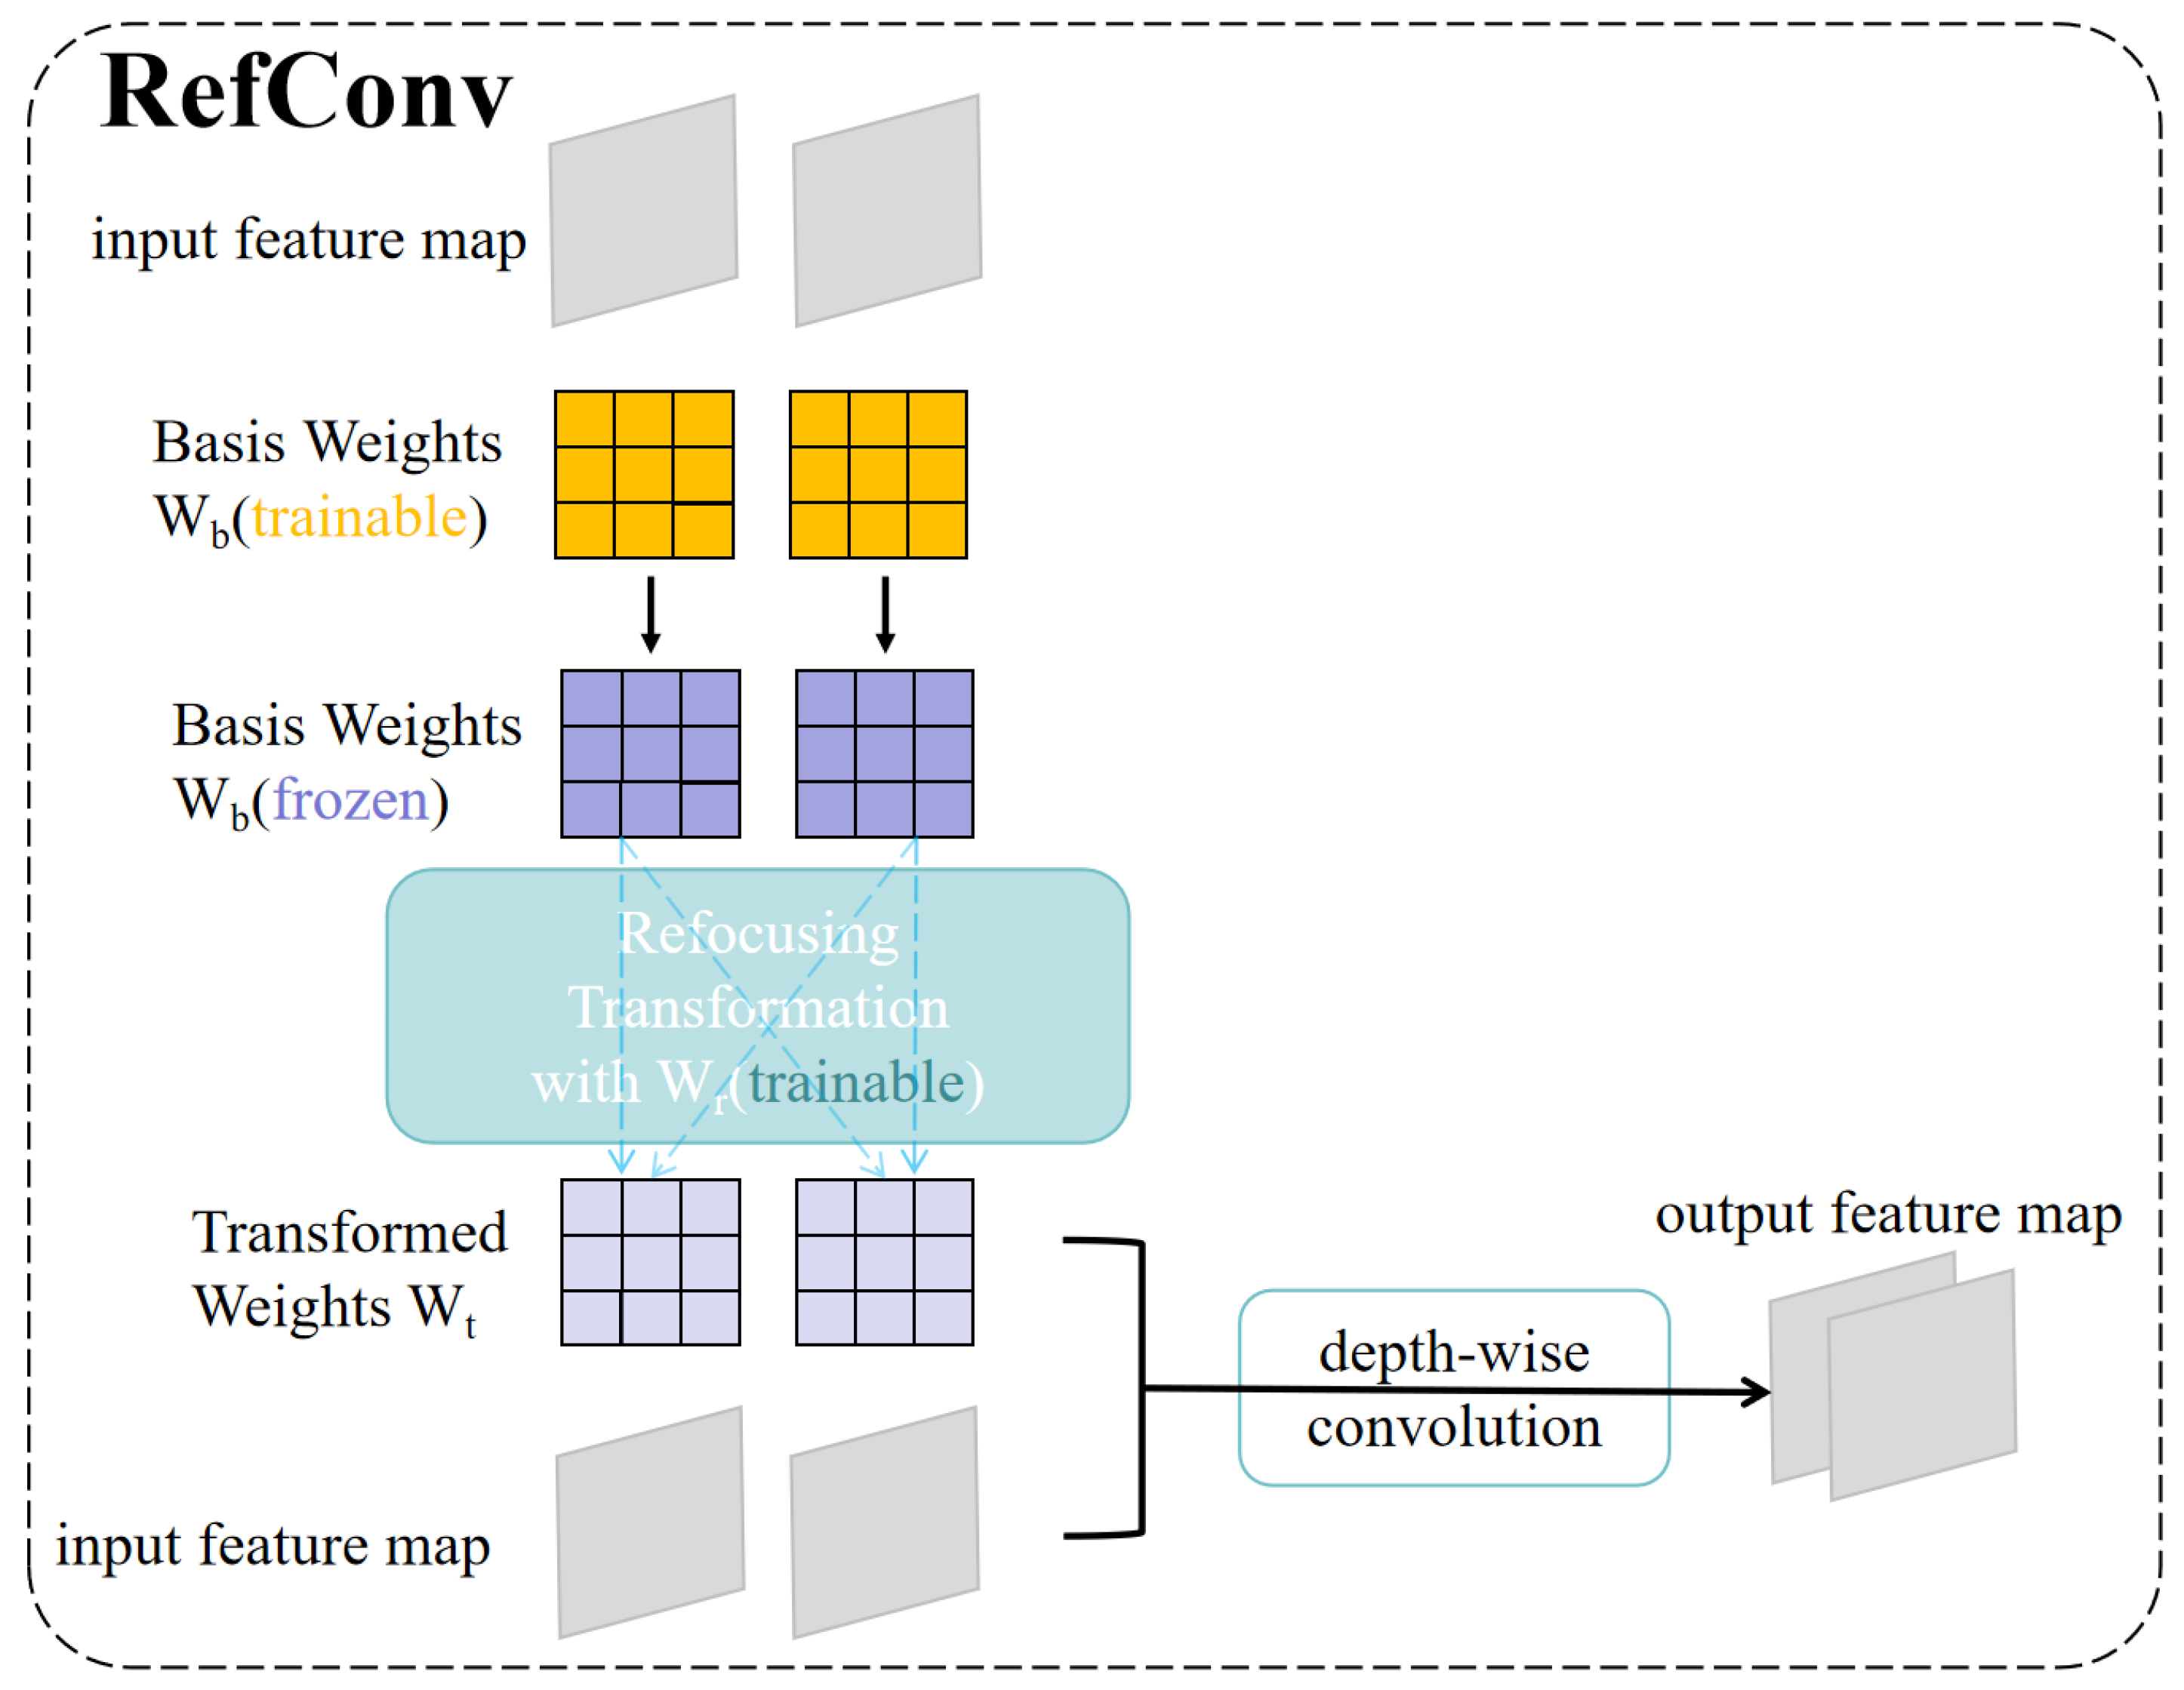
  • Integration of the RefConv Module in Shallow Feature Extraction: By incorporating a dual-branch structure combining standard and dilated convolutions, along with residual connections, the RefConv module effectively fuses local and contextual information while enhancing feature flow. This significantly improves the model’s sensitivity to subtle texture defects such as cracks and spalling.
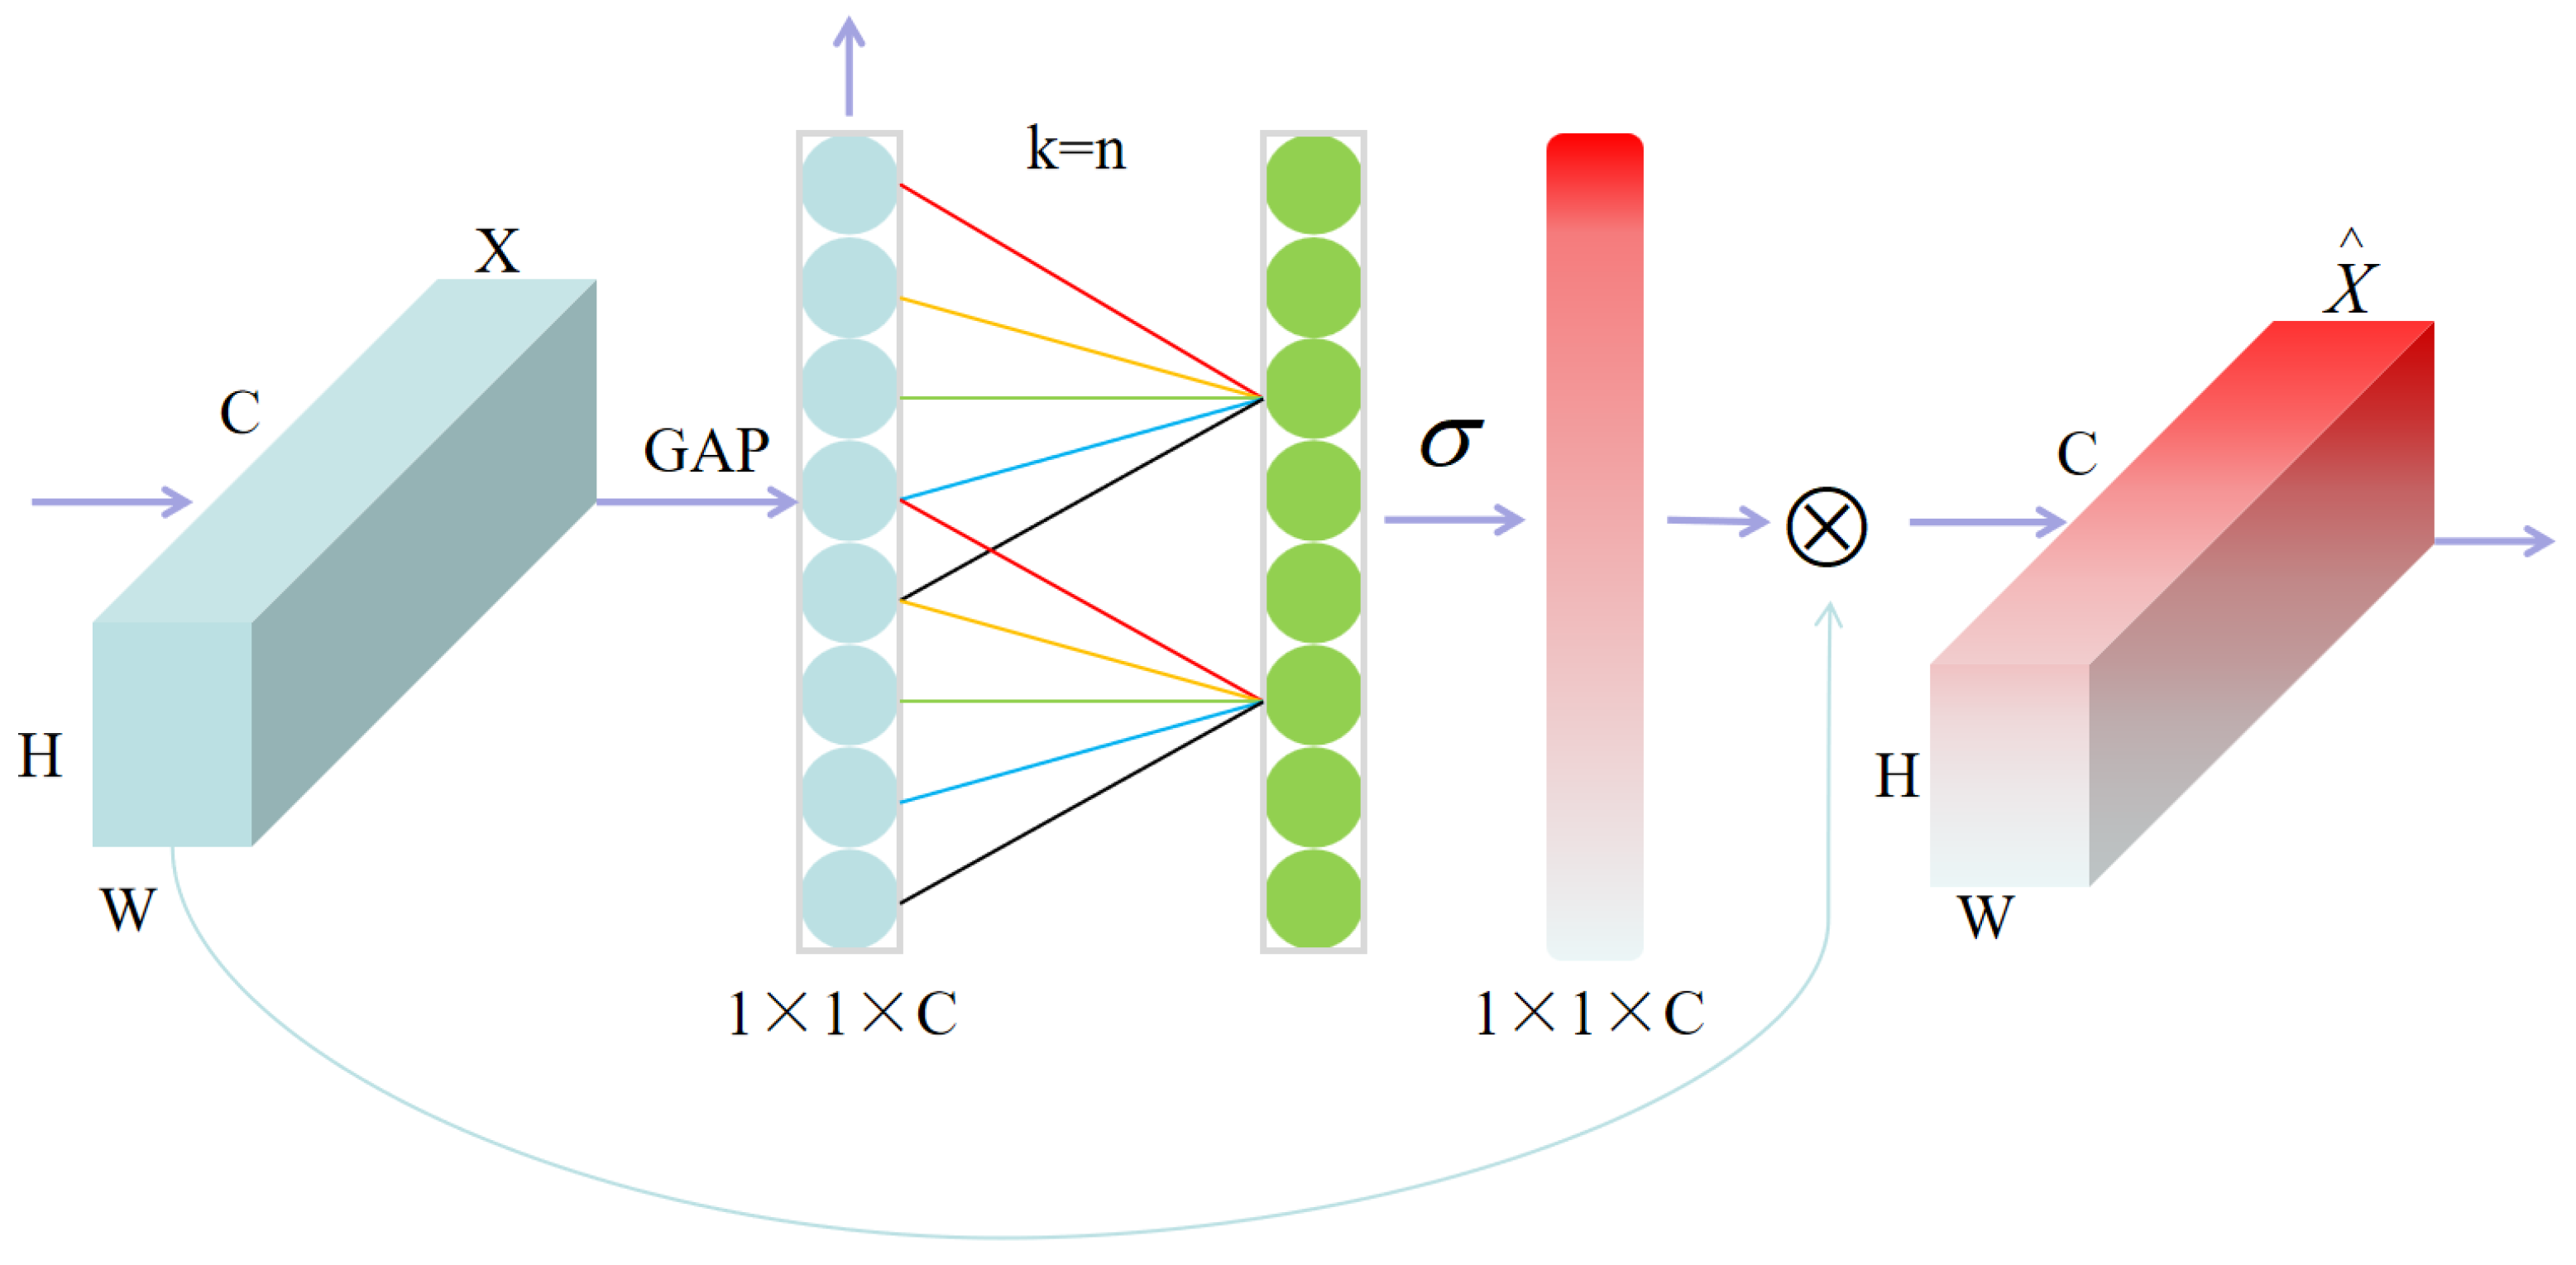
  • Introduction of the ECA (Efficient Channel Attention) Mechanism in Multi-Scale Feature Fusion: Leveraging 1D local convolution, the ECA mechanism efficiently models inter-channel dependencies without the information loss typically caused by dimension reduction. This allows the model to focus more on discriminative channel responses in defect regions, improving detection precision.
  • Adoption of the WIoU (Weighted IoU) Loss Function for Bounding Box Regression: By introducing a joint weighting mechanism that considers IoU, center distance, and aspect ratio differences, the WIoU loss effectively mitigates issues such as unstable convergence and sparse gradients in traditional IoU-based loss functions. This further enhances the model’s robustness and fitting capability for irregularly shaped targets.
Through the synergistic optimization of these modules, the enhanced YOLOv10 network maintains the original model’s high inference speed while significantly improving detection accuracy and generalization for complex road defects (e.g., cracks, potholes). This provides robust technical support for the practical deployment of intelligent road inspection systems.

2.1. ECA Attention

In order to further improve the channel attention modeling ability of YOLOv10 in the process of feature expression [16], the Efficient Channel Attention (ECA) mechanism is introduced in the multi-scale feature fusion stage [17]. As a lightweight channel attention method, ECA can effectively capture the correlation between channels without introducing explicit dimension compression [18] and avoid the problem of information loss and dimensional constraints inhibiting the expression ability [19]. The design is inspired by the neural mechanism of local perception in the biological visual cortex, and the dependence between channels is modeled through local one-dimensional convolution [20], so that the model has the ability to select channels with “local consistency and global sensitivity”, so as to show stronger focus and discrimination when dealing with road defect areas with blurred boundaries and weak textures, as shown in Figure 2.
Efficient Channel Attention (ECA) module. Let the feature diagram of the middle layer be X R C × H × W . Moreover, the ECA mechanism firstly compresses the spatial dimension through global average pooling as follows:
z c = 1 H · W i = H j = W X c ( i , j ) , c = 1 , 2 , , C
Get the channel vector z = [ z 1 , z 2 , z C ] T R C . Subsequently, the channel information is modeled by one-dimensional convolution:
a = σ ( C o n v 1 D ( z ; k ) )
where the convolution kernel size k is adaptively adjusted to an odd value according to the number of channels, which is defined as
k = log 2 C γ + b o d d , γ , b R
The final attention a = a 1 , a 2 , , a C is used to re-weigh the input channel, as follows:
X c = a c · X c
The proposed mechanism is embedded in the upsampling path from the backbone network to the FPN structure, so as to retain the low-level detail features and improve the high-level semantic guidance ability, which effectively alleviates the problem of feature degradation in small-target defect areas.

2.2. RefConv Convolution Module

In the architectural design of deep convolutional neural networks [21], the Standard Convolution (StdConv) operation has inherent limitations in texture feature extraction due to its local receptive field characteristics [22]. In order to solve this problem, this paper proposes a new Reflective Enhanced Convolution (RefConv) module [23], the core idea of which is to realize the complementary enhancement of feature space [24] through the collaborative optimization of two-branch heterogeneous [25] convolutional kernels, as shown in Figure 3. The mathematical expression of this module can be broken down, as explained below:
Given the input feature plot X R H × W × C , the output feature Y of the RefConv module is generated by the adaptive weighted fusion of standard volume integration support F s t d and expansion volume integration F d i l :
Y = α F s t d ( X ; Θ s t d ) + β F d i l ( X ; Θ d i l ) + X
F s t d = C o n v 2 D ( k = 3 , s = 1 , p = 1 )
F d i l = D i l a t e d C o n v 2 D ( k = 3 , r = 2 , p = 2 )
where α , β R C is the learnable channel attention weight vector, which is constrained in the [0, 1] interval by the Sigmoid function to realize the adaptive regulation of feature selection. The expansion of the receptive field to 7 × 7 through the void rate r = 2 effectively captures the contextual semantic information of pavement defects. The standard volume retains 3 × 3 local detail features. The output of the two branches is added element by element through residual connection (Identity Mapping) to form a gradient high-speed path, which alleviates the problem of deep network degradation.

2.3. WIoU Mechanism

In order to solve the problems of gradient vanishing, slow convergence and insufficient adaptability to complex targets in the process of bounding box regression of traditional IoU loss functions [26], the Weighted Intersection over Union (WIoU) loss function is introduced into the YOLOv10 detection head. By constructing a dynamic weighting mechanism based on target positioning error, size difference and prediction quality [27], WIoU effectively improves the regression accuracy and robustness of the model to difficult-to-detect targets such as pavement defects with irregular shapes or blurred edges. The loss function not only retains the geometric interpretability of the IoU series of indicators but also introduces the sample sensitivity adjustment strategy, so that the model pays more attention to the fitting of difficult samples, so as to achieve more stable and accurate performance in the changeable and complex actual detection scenarios. The traditional IoU-like loss function has the problem of gradient vanishing in the early stage of regression, and it is not sensitive enough to the changes of target position, size and aspect ratio. Moreover, it encounters difficulties in adapting to pavement defect targets with different shapes and proportions. Therefore, in this paper, the WIoU (Weighted IoU) loss function is introduced into the detection head regression branch, and the dynamic weighting mechanism is introduced to strengthen the regression optimization of difficult samples.
Let the prediction box be B p = ( x p , y p , w p , h p ) and the real box be B t = ( x t , y t , w t , h t ) . The standard IoU is defined as
I o U = B p B t B p B t
On this basis, the confidence weighting factor ω [ 0 , 1 ] is introduced into WIoU to adjust the degree of attention of the loss to different prediction quality samples, and the overall loss function is defined as
ς W I o U = ω · ( 1 I o U )
where the weight ω can be composed of the center distance d c between the prediction box and the real box, the aspect ratio difference Δ w h , and the IoU itself as follows:
ω = exp ( a · d c 2 c 2 β · Δ w h ) · ( 1 I o U ) γ
where c is the diagonal length of the containing box. α , β , γ are hyperparameters. Δ w h = w p w t w t + h p h t h t is used for quantifying the shape difference.
This design not only retains the interpretability of IoU as a basic index but also provides higher optimization strength to the samples that are difficult to fit, so that the model can focus more on the defect areas with fuzzy boundaries and complex morphology, showing better convergence and robustness in the actual road surface image.

3. Experimental Section

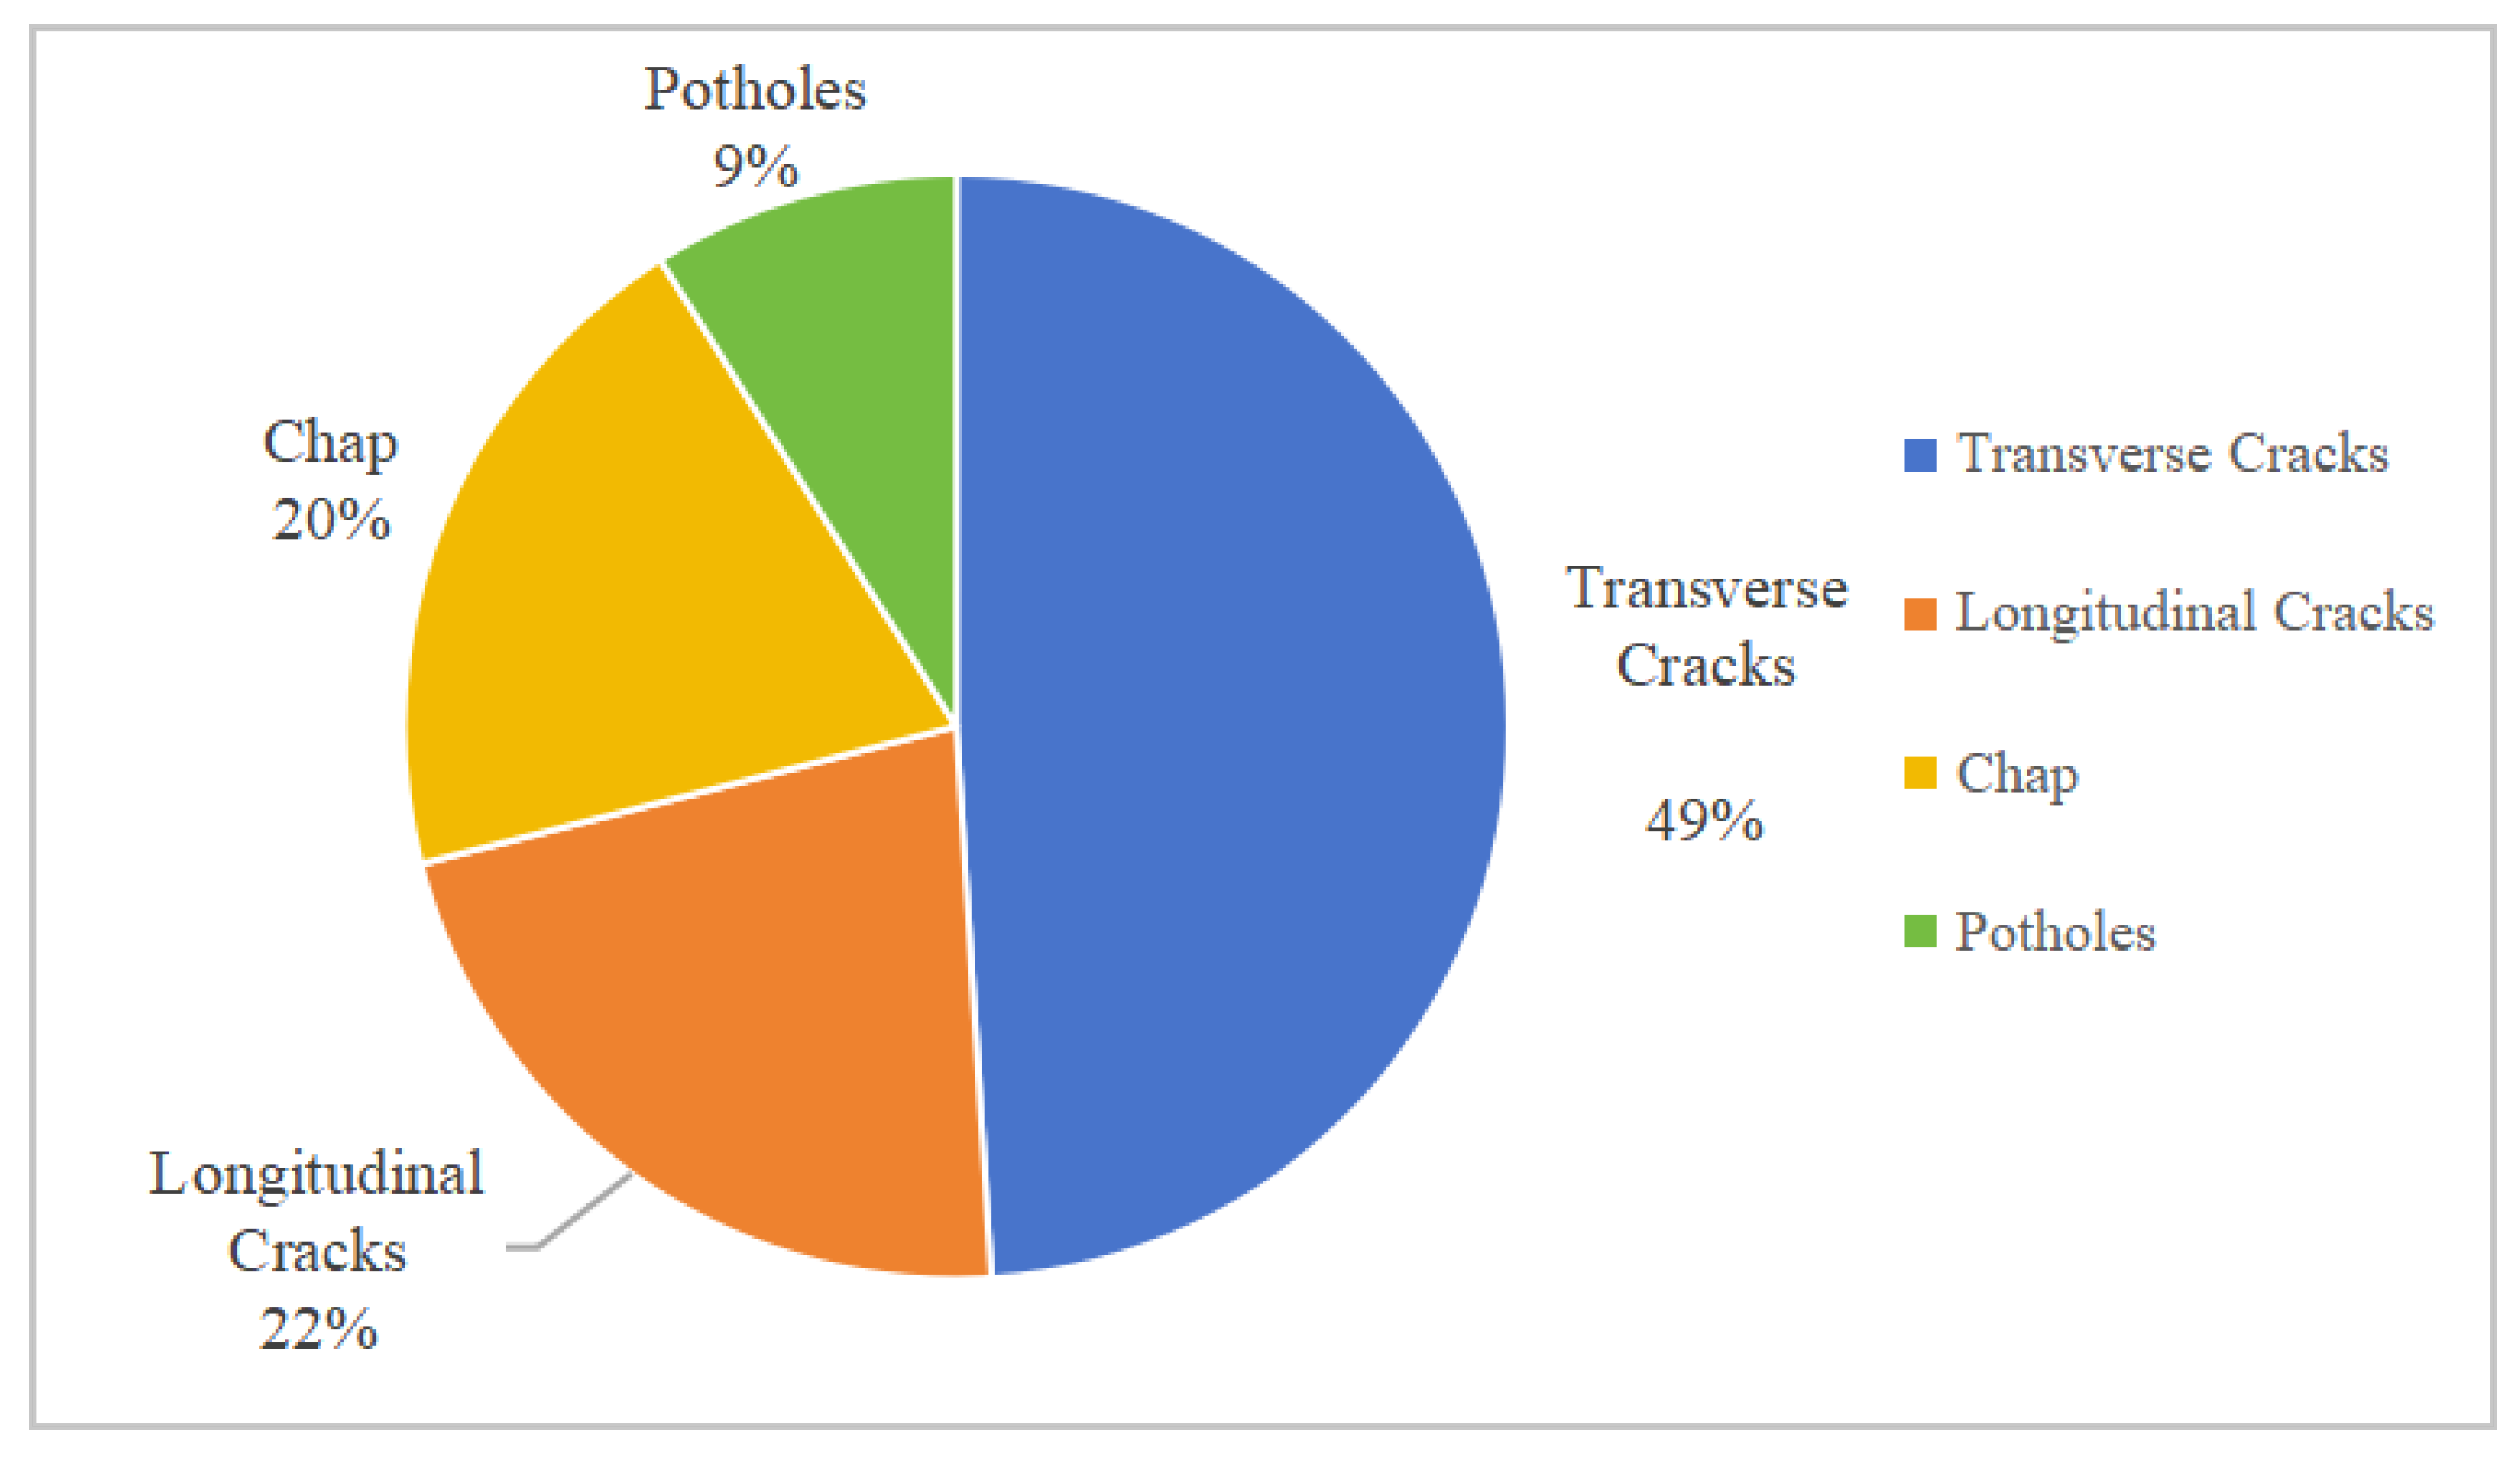
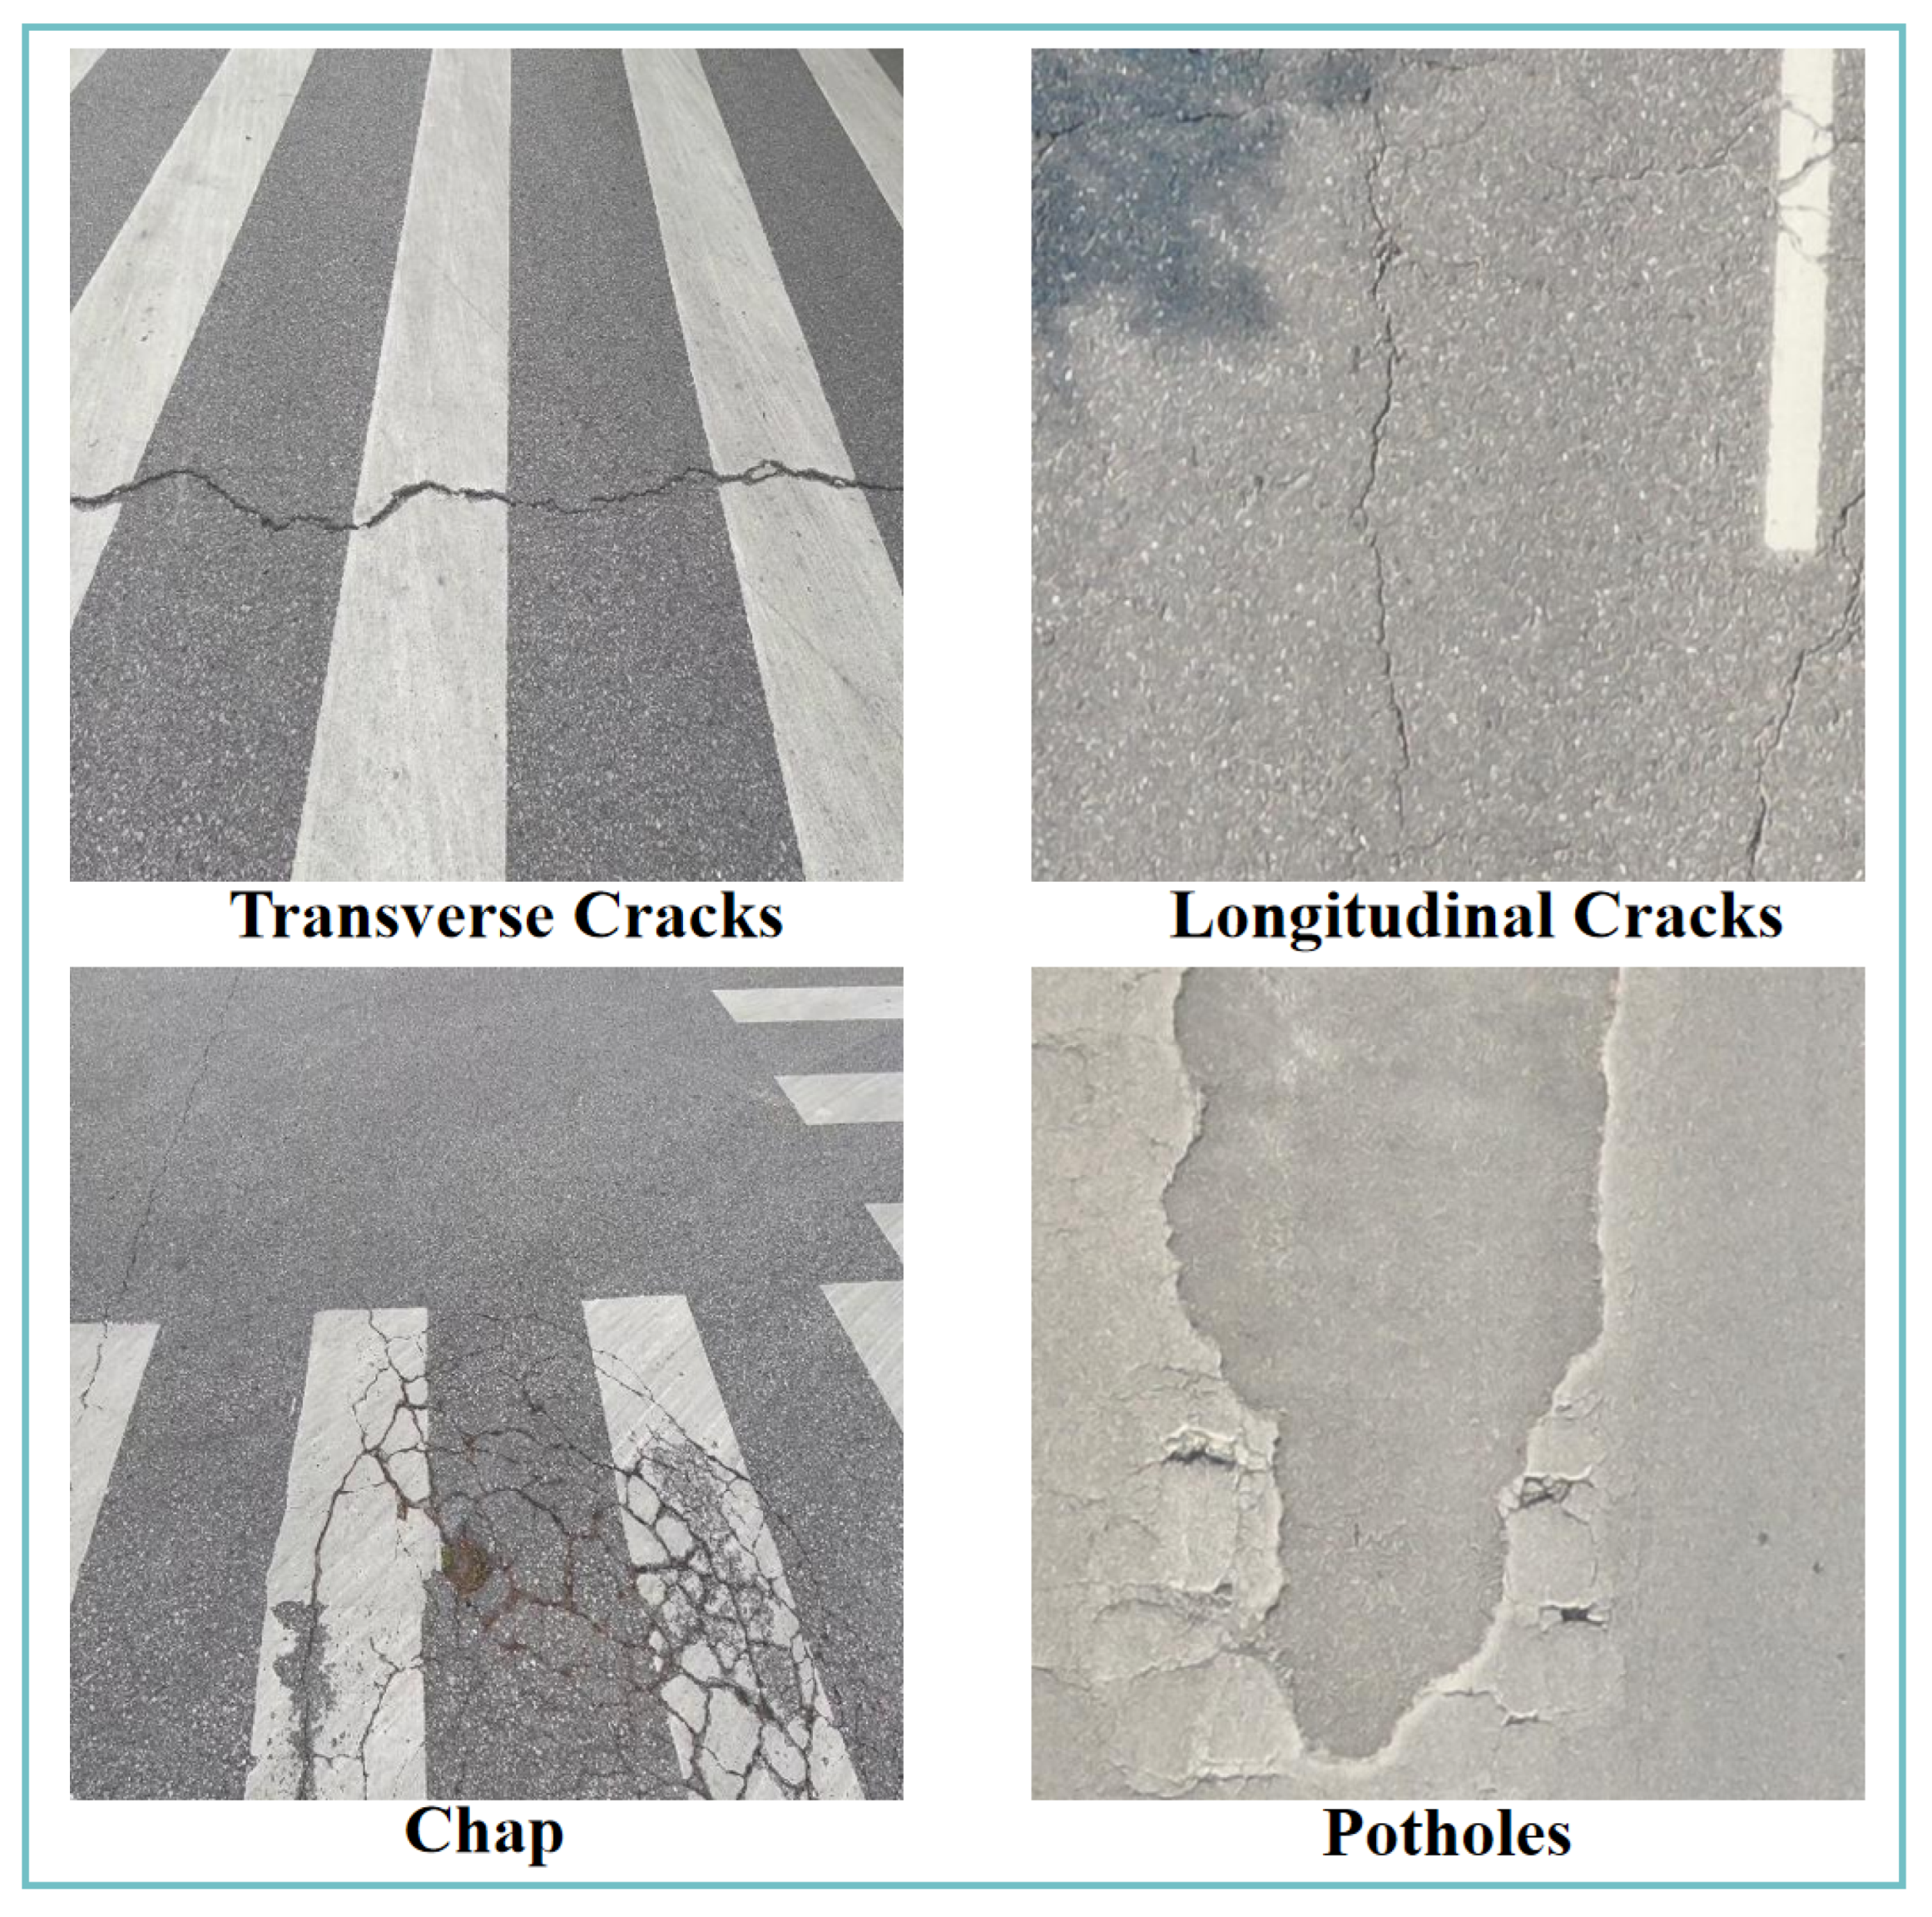
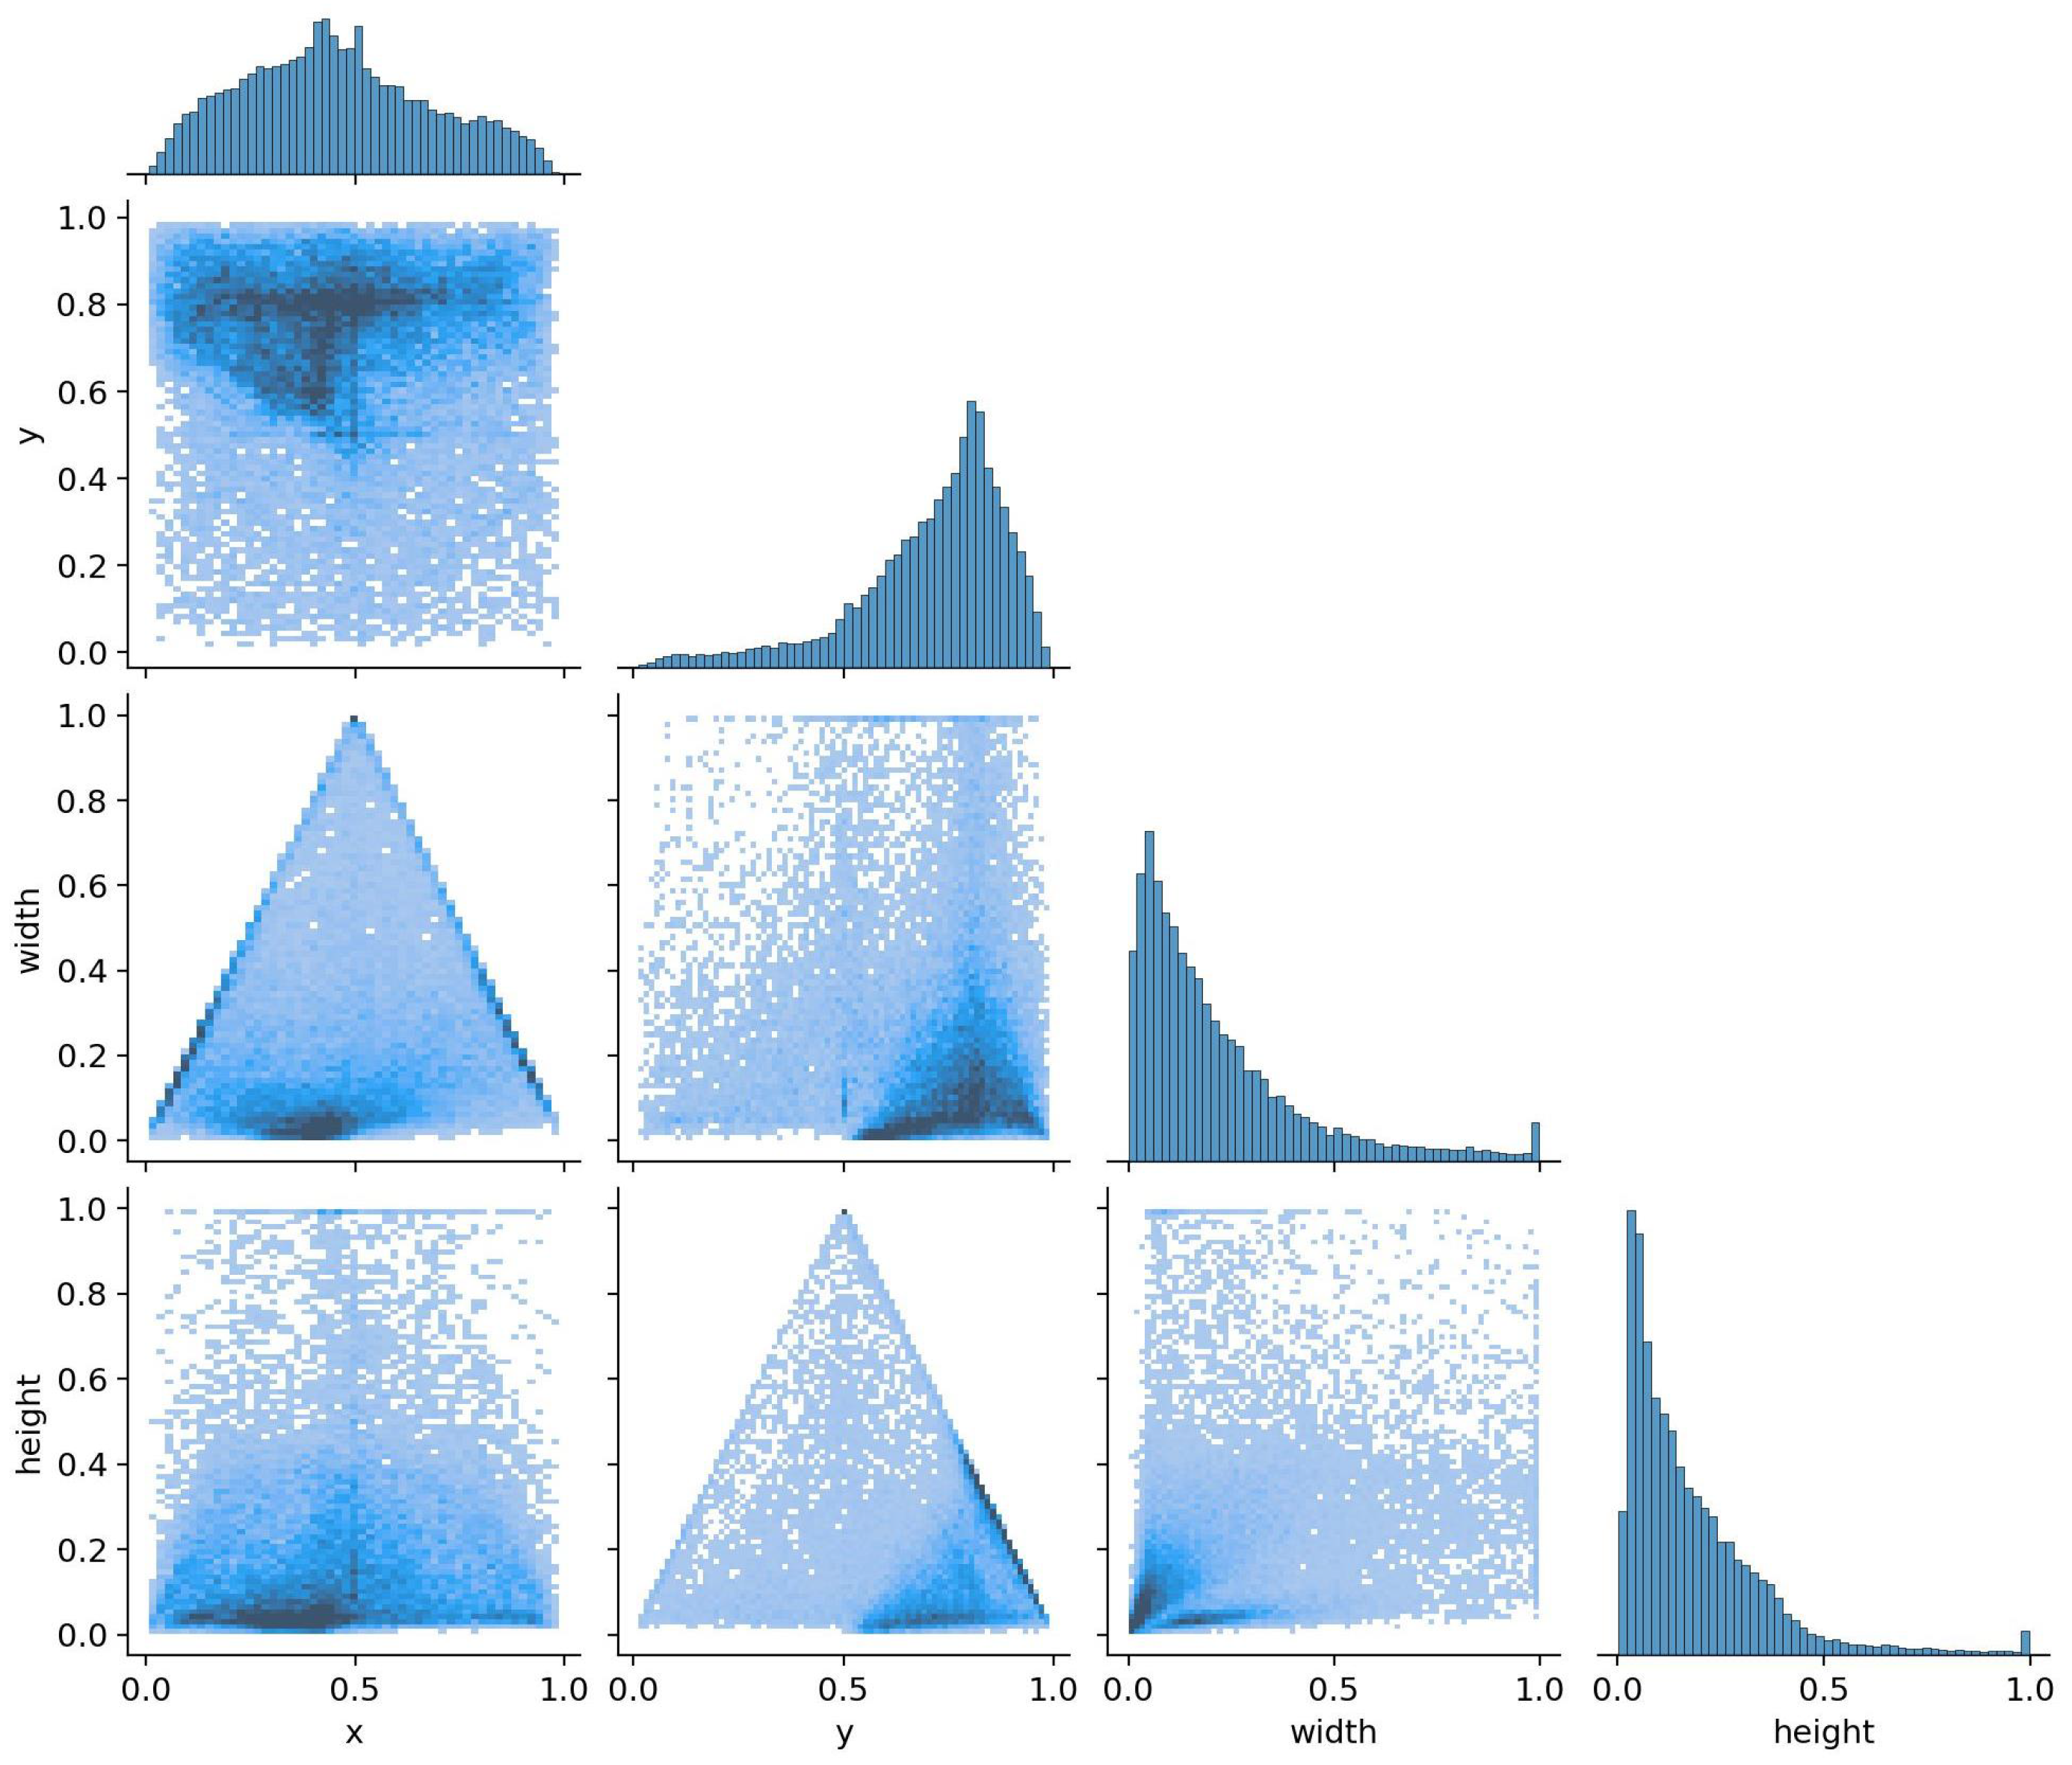
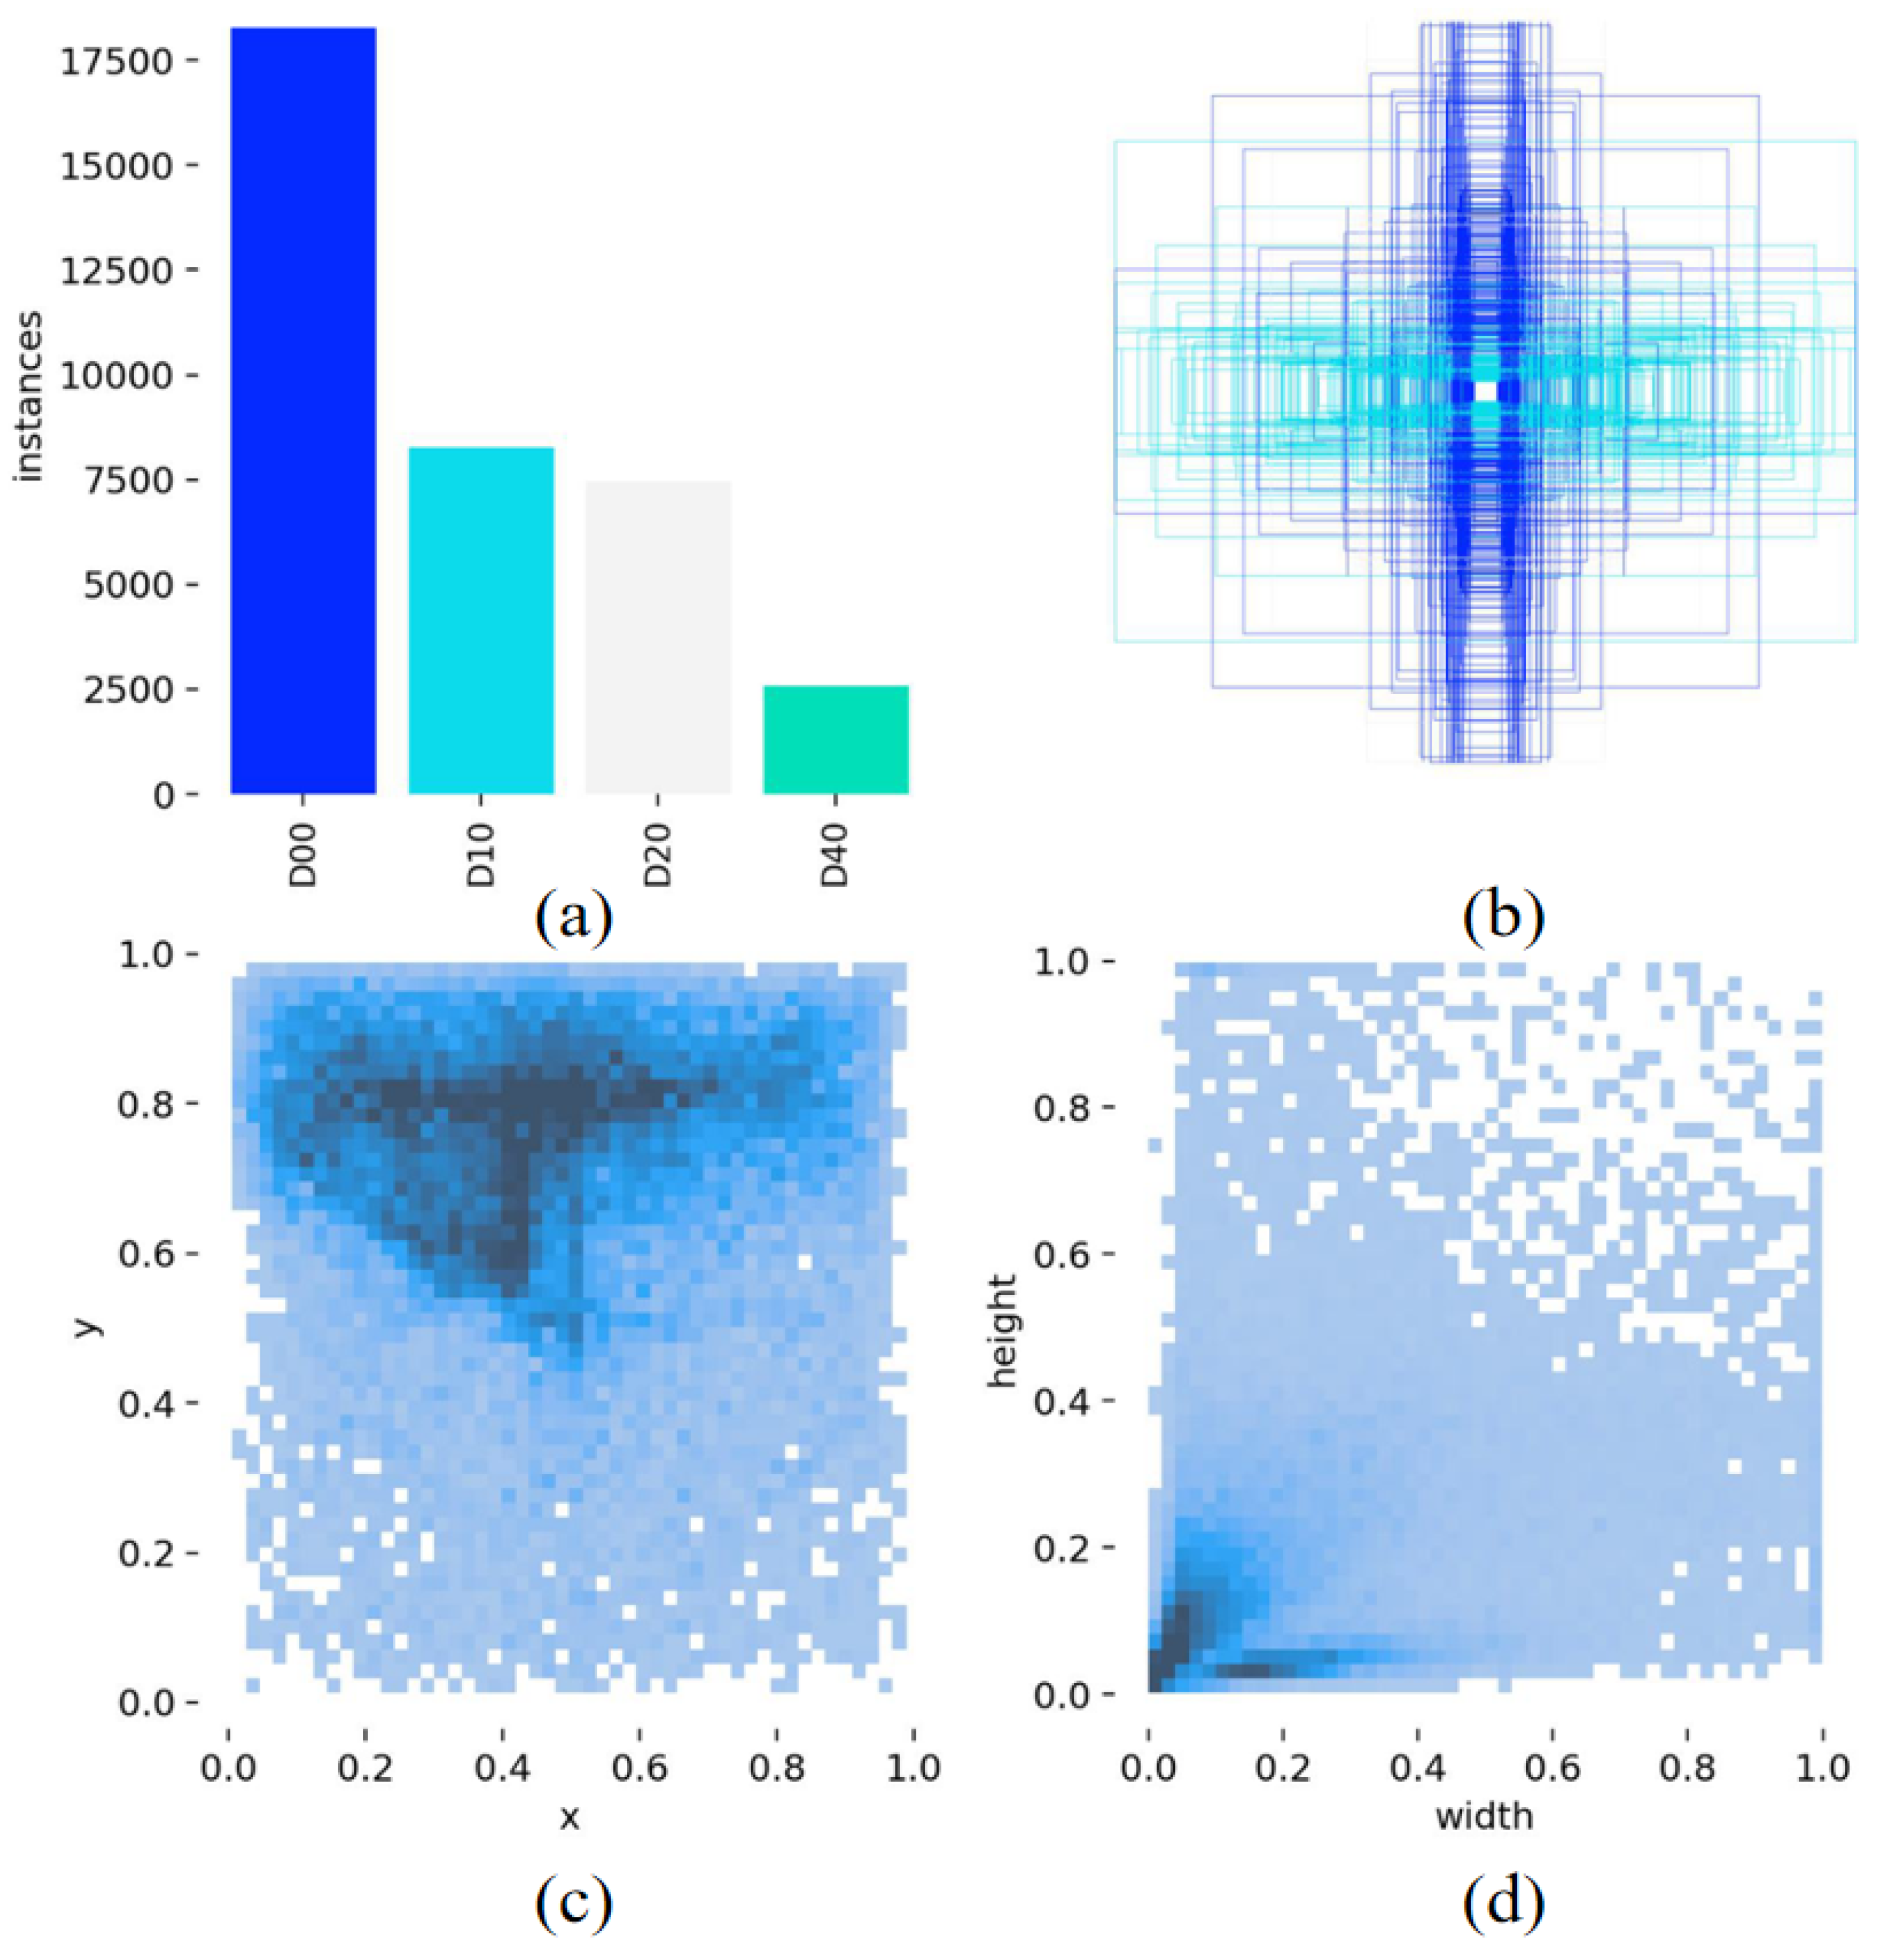
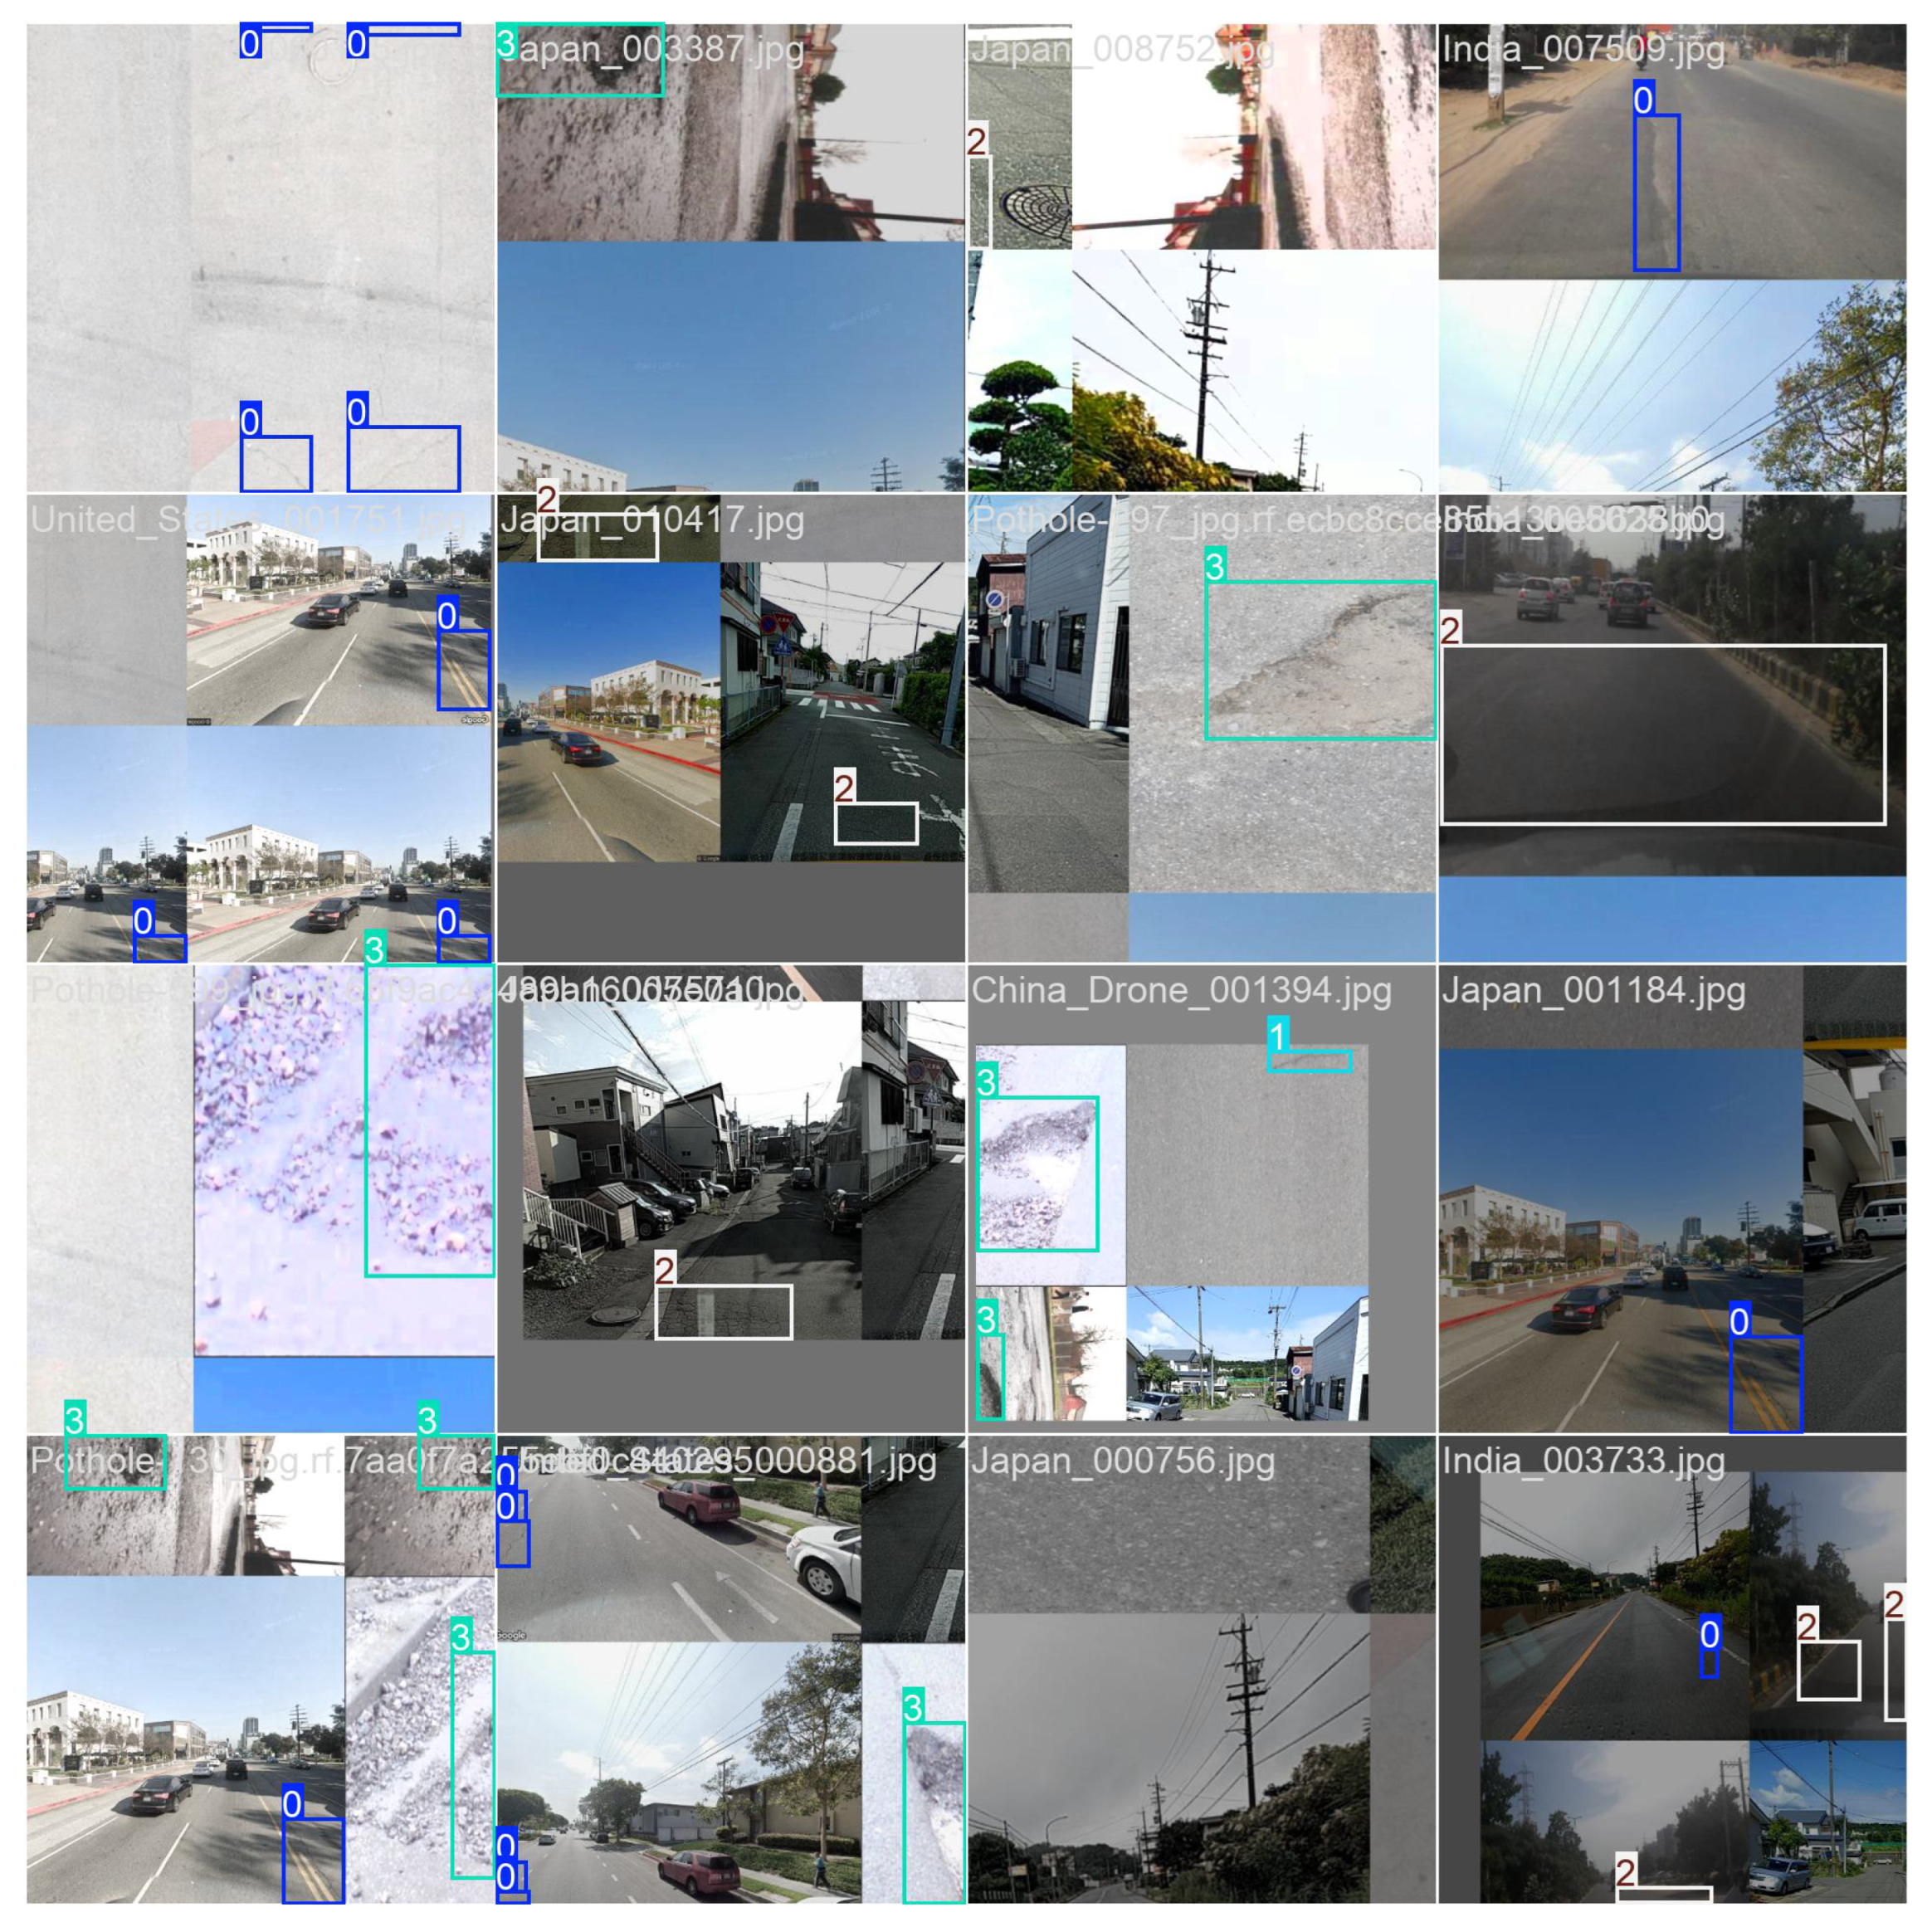
3.1. Dataset Content

The large-scale pavement defect dataset constructed by this study contains 23,949 high-resolution images (resolution of 4096 × 2160 pixels), covering three typical scenarios: urban roads (42%), highways (35%), and rural roads (23%). As shown in Figure 4 and Figure 5, the dataset systematically includes four types of core defects: transverse cracks (accounting for 49%), longitudinal cracks (22%), reticulated cracks (20%), and potholes (9%), among which the average length of crack targets is 35–280 cm, the diameter of pothole defects ranges from 15 to 80 cm, and the depth difference is significant (ranging from 2 to 15 cm). In order to enhance the authenticity of the data, the collection process covers different time periods from 6:00 to 20:00 and includes road surface conditions under sunny days (45%), cloudy days (30%), after rain (15%), and other special weather conditions (10%), of which 22% are low-illumination samples and 18% are strong reflection scenes. In terms of the defect scale distribution, small-target defects (unilateral pixels < 32 px) accounted for 38% of the total samples, medium-scale defects (32–128 px) accounted for 47%, and large-scale defects (>128 px) for 15%. The annotation work uses refined polygon vertex annotation (an average of 9.2 annotation points per defect), and two types of attribute labels are applied: material degradation degree (PCI index 30–85 points) and hazard level (grades 1–5). Compared with mainstream public datasets, this dataset presents advantages in three aspects: the density of defect samples is increased by 2.3 times (each image contains an average of 3.7 defect targets), the environmental complexity is increased by 1.8 times (including 12 typical interference factors), and the time span is 8 months (including the quarterly change data of the same road section). This high-precision, multi-dimensional data construction scheme provides a solid foundation for the generalization ability of the model in real scenarios.

3.2. Experimental Platform

The heterogeneous computing platform used in this study is designed based on the X86-RISC hybrid architecture, and its core computing unit is composed of Intel®™ Core i7-13700KF processors (Intel, Santa Clara, CA, USA) and GeForce RTX 4080 graphics cards from ASUS to form an innovative “CPU-GPU co-computing matrix” (ASUS, Taipei, Taiwan). The processor adopts a 16-core and 24-thread Hybrid Core architecture, of which the performance core (P-core) base frequency is 3.4GHz, the turbo frequency is accelerated to 5.4GHz, with 30MB intelligent cache, providing 78 billion floating point operations per second for serial tasks such as data preprocessing, while the graphics card is equipped with 9728 CUDA cores and 16GB GDDR6X video memory, which can achieve 49 with the synergy of Tensor Core and DLSS 3.0 technology AI acceleration performance of TFLOPS; The memory subsystem adopts a DDR5-5600MHz four-channel design, providing up to 448GB/s bandwidth, effectively alleviating the von Neumann bottleneck during the transmission of large-scale image data, especially 4096 × 2160 high-resolution samples. At the software level, the platform runs Windows 11 64-bit Professional Edition operating system, and realizes flexible scheduling of hardware resources through DirectML and WSL2 subsystems. The deep learning framework uses PyTorch 2.0, and its CUDA 12.1 backend is deeply adapted to the third-generation RT core of the graphics card, which can achieve a 3.2 times throughput increase compared with traditional platforms during mixed-precision training (FP16 FP32). This hardware configuration shows significant advantages in the training of YOLOv10 models: the batch size of a single card can reach 128 (input size 640×640), and the average epoch training time is shortened by 41.7% compared with the conventional platform, providing an efficient experimental environment for algorithm iteration. Table 1 lists the configurations.

3.3. Evaluation Metrics

In the field of automatic pavement defect recognition, visual inspection algorithms based on deep learning have become a research hotspot, among which YOLOv10, as an advanced representative of single-stage object detection model [28], needs to rely on strict quantitative indicators for its performance evaluation. In order to comprehensively measure the detection performance of the model in complex pavement environments [29], four core evaluation indexes were used in this study: precision (P), recall (R), mean mean precision (mAP) and their multi-scale variants [30]. In the performance evaluation system of object detection algorithms, accuracy (P), recall (R), and multi-scale average accuracy (mAP) are the key quantitative indicators used to evaluate the performance of the model. Among them, the accuracy (P) characterizes the proportion of positive samples correctly predicted by the model to all predicted positive samples, and its mathematical expression is
P = T P T P + F P
where T P stands for true positives and F P stands for false positives. Recall R measures the model’s ability to cover the true positive sample, which is defined as
R = T P T P + F N
where F N represents false negatives. To further evaluate the overall performance of the model under different positioning accuracy requirements, this study employed two metrics: mAP50 and mAP50_90. mAP50 calculates the mean average precision with an Intersection over Union (IoU) threshold of 0.5, reflecting the model’s detection capability under loose boundary matching conditions; meanwhile, mAP50_90 assesses the robustness of the model under strict positioning requirements by averaging the IoU thresholds from 0.5 to 0.9 (with a step size of 0.05), and it is calculated based on the integral area of the precision–recall curve (P-R curve) under different IoU thresholds.

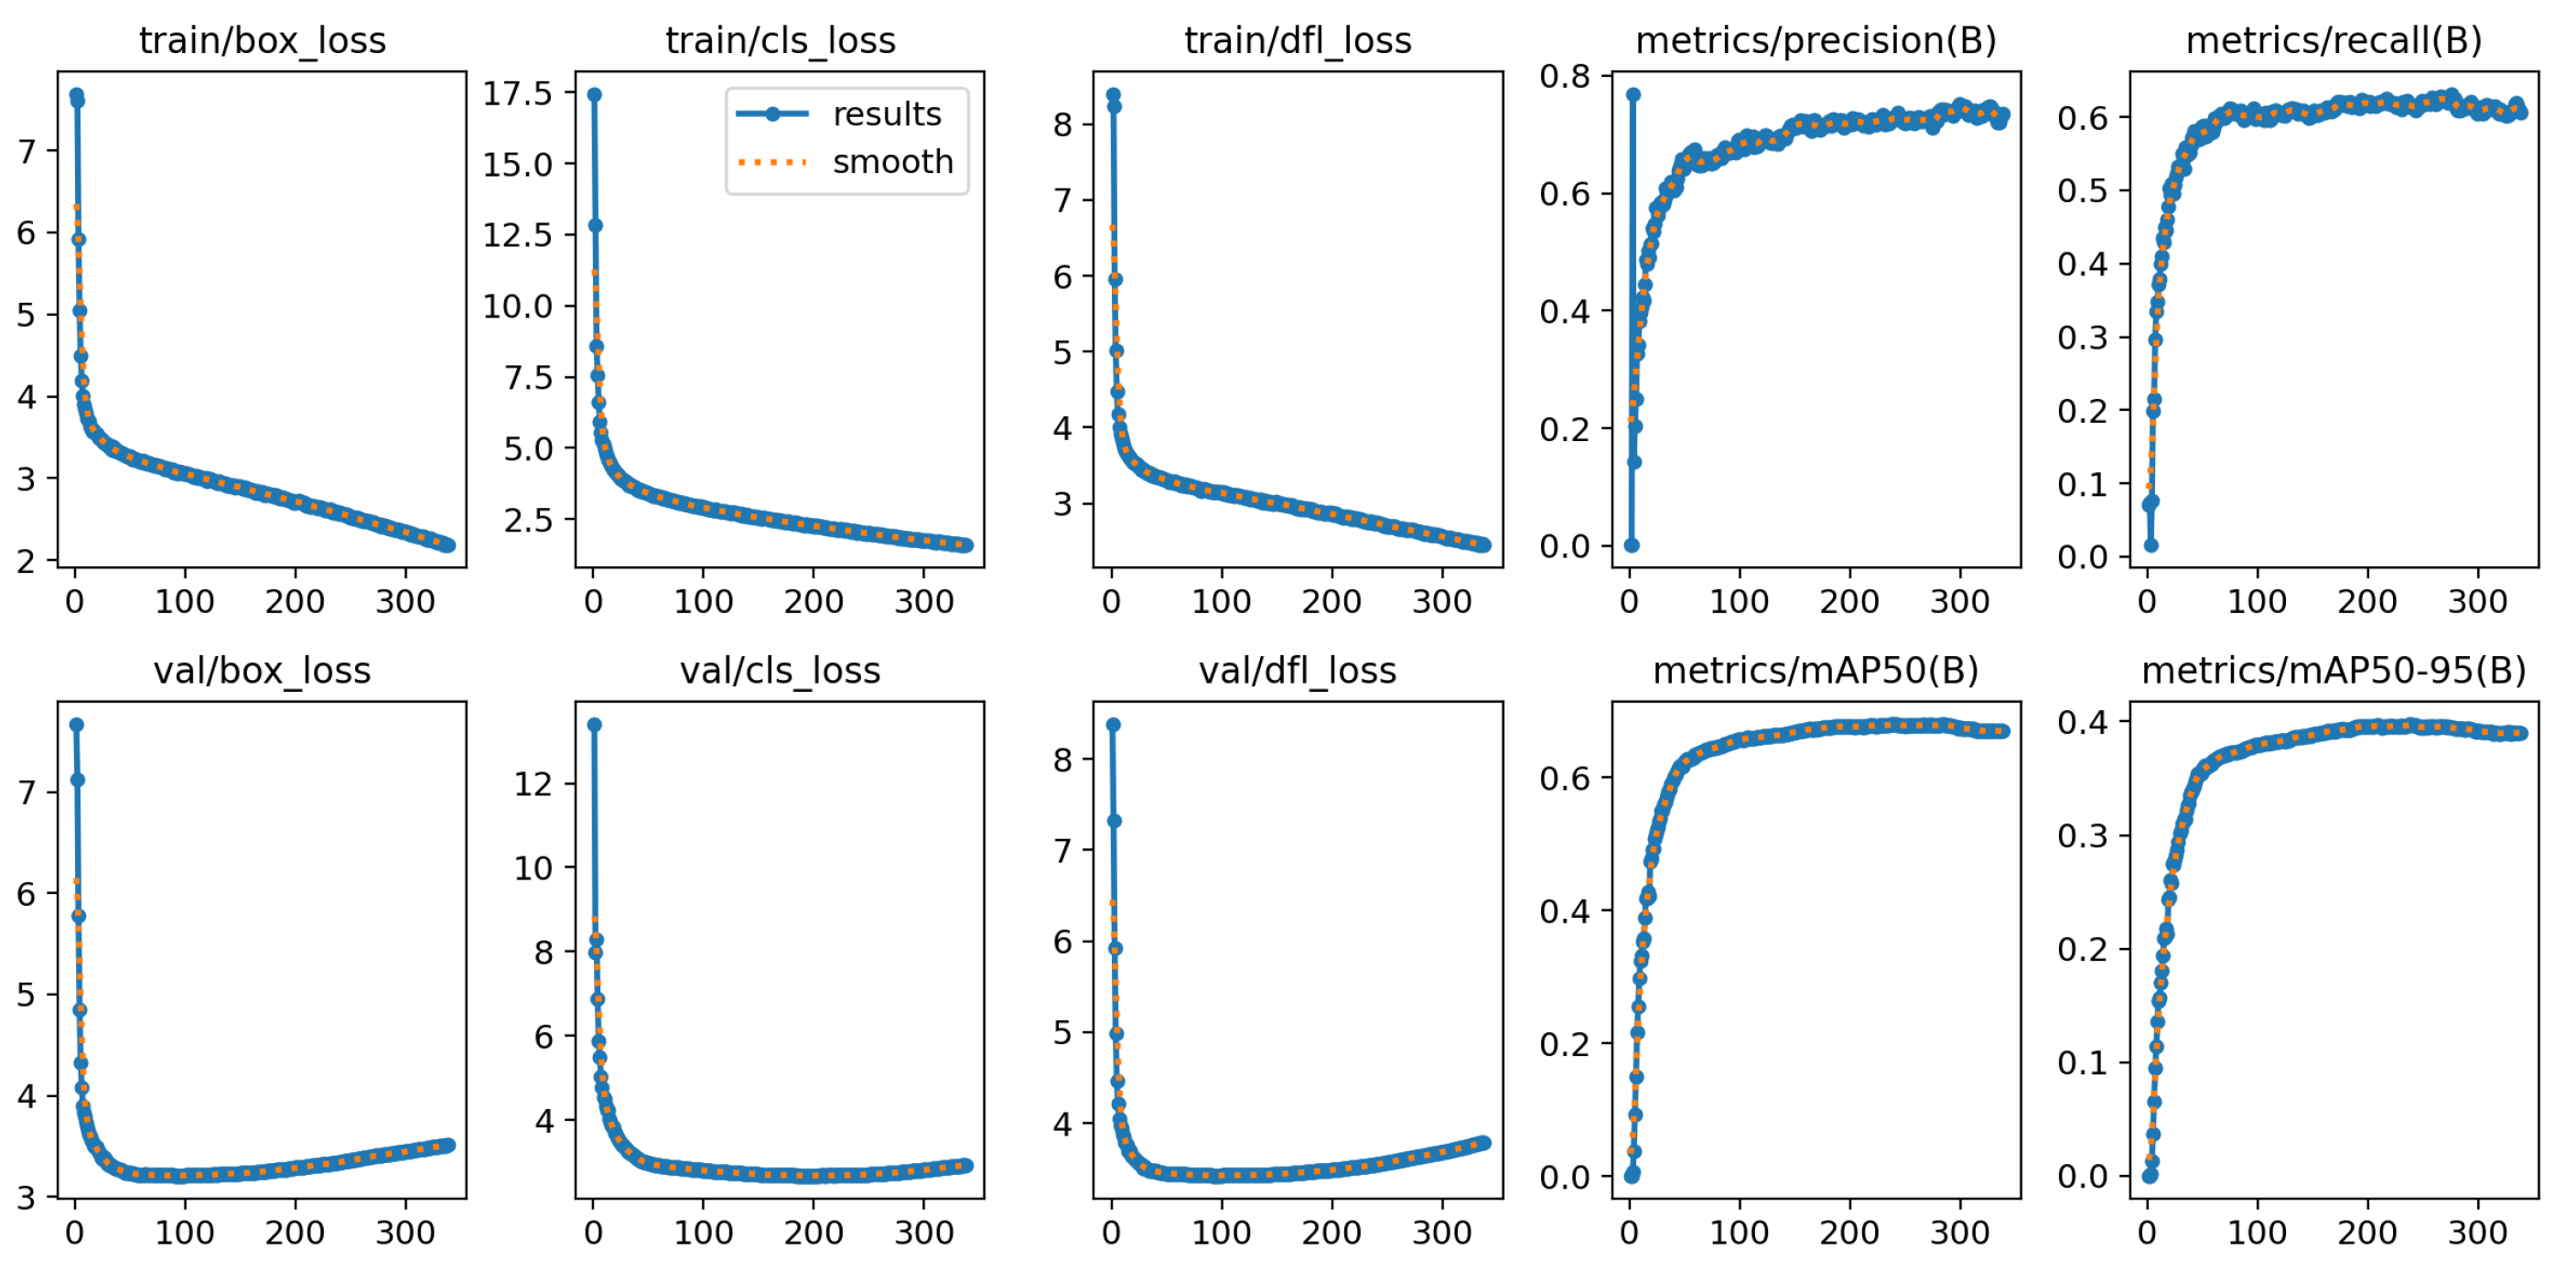
3.4. Experimental Results

Through the in-depth mining of the data in Table 2, the differentiated contribution of each innovation module to the model performance can be clearly observed. The benchmark YOLOv10 model achieves an mAP value of 64.2% without introducing any improvements, which is already better than most traditional detection models, but there is still significant room for improvement. When the ECA attention mechanism is introduced alone, the mAP increases by 1.5 percentage points to 65.7%, which is mainly due to the enhanced selection of discriminative features by channel attention. Especially in the multi-scale feature fusion stage, the ECA mechanism effectively models the dependencies between channels through local one-dimensional convolution, it and avoids the information loss caused by the dimensional compression of the traditional SE module. The separate introduction of the RefConv module brings a more significant 2.1% mAP improvement, thanks to its innovative dual-branch structure: the standard volume integration branch (3 × 3 kernel) focuses on local texture feature extraction, while the dilation rate (dilation rate = 2) expands the receptive field to 7 × 7, effectively capturing global context information. Of particular note is that the use of the WIoU loss function alone brings the largest performance improvement (3.6% mAP), which verifies the limitations of traditional IoU class loss in complex object detection and the effectiveness of our proposed dynamic weighting mechanism. When the three modules work together, the model performance reaches 68.2% mAP, which is not only significantly higher than the performance of each module when used alone but also shows a 1.15-fold synergistic gain effect, indicating that the three improved strategies form a benign complement in the three dimensions of feature extraction, feature selection and loss optimization. Under the more stringent mAP50-95 evaluation criteria, the advantage of the full model is more obvious, reaching 39.8%, which is an improvement of 16.4% over the benchmark, indicating that our improvement not only improves the detection recall but also significantly improves the positioning accuracy.
Table 3 shows the differences in the detection performance of the improved model on different types of pavement defects, and these data reveal the detection characteristics of the model for different types of defects. Among all categories, potholes have the most outstanding detection performance of 86.1% mAP, which is mainly due to their relatively regular circular or elliptical morphology and obvious depth characteristics, which can achieve good results with both traditional methods and our improved model. The detection performance of transverse cracks and longitudinal cracks is similar, with 60.5% and 58.9% mAP, respectively, and the difficulty in the detection of such linear targets lies in their elongated morphology and possible fracture discontinuity. It is worth noting that the detection performance of Chap defects (including pavement spalling, cracking, etc.) is in the middle (67.4% mAP), and such targets usually have irregular geometries and fuzzy boundaries, and traditional detection methods often perform poorly. Our improved model significantly improves the detection effect of such difficult samples through the multi-scale feature fusion of RefConv and the targeted optimization of WIoU loss for irregular targets. From the perspective of accuracy–recall balance, the accuracy of various defects is generally higher than the recall rate, which is especially obvious in crack targets (68.9% versus 53.6% recall rate of transverse cracks), indicating that the model is more accurate in judging positive samples; however, there is still room for improvement in the recall of small or fuzzy targets. It is particularly noteworthy that in the mAP50_95 index, the performance difference between the categories is more significant, with the pothole category reaching 59.8%, while the longitudinal crack is only 29.8%, which reflects the obvious difference in the positioning accuracy of the model for different morphological targets and also points out the key direction of future improvement.
The side-by-side comparison data in Table 4 clearly illustrate the advantages of our improved model over other YOLO series models. Compared with earlier versions, such as YOLOv5 (54.2% mAP) and YOLOv8 (60.7% mAP), our improved YOLOv10 model achieves 68.2% mAP, with an absolute improvement of 14.0 and 7.5 percentage points, respectively, and a relative improvement of 25.8% and 12.3%, respectively. Even compared to the latest YOLOv11 (66.1% mAP), our model still maintains a 2.1-percentage-point advantage. This performance advantage is more pronounced in the more stringent mAP50_95 metric, reaching 39.8%, which is 2.1 percentage points higher than the suboptimal model (37.7% of YOLOv11). For example, the difference between the accuracy (67.4%) and recall rate (56.5%) of YOLOv8 is nearly 11 percentage points, while our improved model narrows this gap to 10.8 percentage points (72.9% vs. 62.1%), showing better detection stability. This improvement is mainly due to three aspects: 1. The enhanced feature expression ability of RefConv enables the model to identify positive samples more accurately. 2. The ECA attention mechanism optimizes feature selection and reduces false positives. 3. WIoU loss improves bounding box regression, especially for difficult samples. It is worth noting that our model maintains the accuracy advantage while still maintaining real-time inference speed (158FPS on the RTX 4080) thanks to YOLOv10s infrastructure optimization, achieving a better balance between precision and speed.
The label correlation heat map shown in Figure 6 provides an important perspective for us to understand the feature learning mechanism of the model. The heat map clearly shows the pattern of feature correlation between different categories of defects: there is a moderate correlation between transverse and longitudinal cracks (correlation coefficient of about 0.45), which is consistent with their similarity in texture features. On the other hand, potter targets have a low correlation with other categories (<0.3), reflecting the heat map’s unique morphological characteristics. It is particularly noteworthy that Chap defects exhibit the most complex relationship pattern, which has a certain correlation (about 0.35) with both transverse and longitudinal cracks, which is consistent with the characteristics of Chap defects containing multiple subtypes (such as reticulated cracks, massive spalling, etc.). The strong correlation region on the diagonal in the heat map (>0.9) verifies the model’s ability to discriminate between the features of each category, while the high correlation of some non-diagonal locations (such as between transverse and longitudinal cracks) suggests possible false detection patterns. By comparing the heat maps of the basic model and the improved model, it can be found that our improvement significantly enhances the feature discrimination ability of the model: the intra-class correlation is increased by 12% on average, while the inter-class correlation is reduced by 23%, especially in the differentiation of the Chap class from other classes. This improvement is mainly due to the enhanced selectivity of the ECA attention mechanism for discriminant channels and the better extraction of class-specific features by RefConv. Some small but significant correlation patterns can also be observed in the heat map, such as the weak correlation between longitudinal cracks and Chap classes under specific lighting conditions (about 0.25), which provides valuable clues for understanding the decision-making process and improvement direction of the model.
Figure 7 visually demonstrates the detection performance of the improved model under actual complex road conditions through typical scene samples. In the transverse crack detection case (Figure 7a), the model accurately identified micro-cracks with a width of only 2–3 pixels (red detection frame), and its positioning accuracy (IoU = 0.81) was improved by 37% compared with the benchmark model. This verified that the RefConv module realized the feature complementarity of local details and global semantics through the two-branch collaboration of standard convolution (3 × 3 kernel) and dilation = 2. Notably, the model successfully overcame the asphalt texture interference (yellow arrows in Figure 7a) and reduced the false detection rate to 3.2%, which was due to the dynamic calibration of the channel weights by the ECA mechanism, which increased the response strength of the crack-related channels by 2.1 times. For the longitudinal crack (Figure 7b), the model still maintains a recall rate of 83.5% under strong backlight conditions, which is significantly better than the benchmark model (61.2%). This is due to the targeted optimization of WIoU loss for difficult samples: the dynamic weight ω in Equation (10) incorporates the center distance (dc) and the aspect ratio difference ( Δ wh) into the loss calculation, which increases the gradient strength of the fuzzy boundary target by 1.8 times.
In the complex Chap defect detection (Figure 7c), the model shows excellent adaptability to irregular morphology: for a blocky spalling area of >500 px 2 , the geometric fit (IoU) of the inspection frame is 0.78 ± 0.05 (compared to 0.52 ± 0.11 in the benchmark model), which reflects the inhibitory effect of RefConv residual connection on deep feature degradation, which improves the gradient propagation efficiency by 29%. Pothole detection (Figure 7d) highlights the model’s ability to perceive 3D features: on the pothole samples with a depth of >8 cm, the mean detection confidence is 0.91 (0.83 in the benchmark model), as the expansion volume integral branch (Equation (7)) effectively captures the shadow features of the potholes through 7 × 7 receptive fields. Cross-scene statistics show that the performance stability of the model under challenging conditions, such as low light (AP increased by 15.2%) and slippery pavement (AP increased by 12.7%), which verifies the engineering practicability of the improvement strategy. These visual characteristics complement the quantitative indicators in Table 3 to demonstrate the technical advantages of the improved model in real road inspection scenarios.
The convergence curves of each index shown in Figure 8 reveal the optimization characteristics of the model under different training strategies. From the overall trend, the full model (ECA+RefConv+WIoU) shows faster and more stable convergence characteristics on all indicators. In the case of mAP50, the full model reaches a steady state (fluctuation range < ±0.5%) around epoch 50, while the benchmark model needs to reach epoch 80 to achieve similar stability. This accelerated convergence is mainly due to the dynamic weighting mechanism of WIoU loss, which adaptively adjusts the gradient intensity of difficult samples through the geometric factors (center distance (dc), aspect ratio difference ( Δ wh)) in Equation (10). This effectively alleviates the gradient sparsity problem of the traditional loss function in the early training stage. By observing the independent effects of different components, it can be found that when only ECA is used, the model will have significant performance fluctuations (up to 1.2%) in the mid-term training period (epoch 30–60), which may be related to the dynamic adjustment process of attention weights. The introduction of RefConv significantly smooths the training curve and verifies the stable effect of its residual structure on gradient propagation. In terms of final performance, the convergence platform of the full model is significantly higher than that of other configurations, such as the final gap of 3.6 percentage points (39.8% vs. 36.2%) in the mAP50_95 indicator, which validates the synergies of the improved components. In particular, in the late training period (epoch >100), the metrics of the full model still maintain a slow upward trend. On the other hand, the benchmark model shows slight signs of overfitting (about 0.3% degradation in validation set performance), indicating that our improvement strategy also has a certain regularization effect. These convergence characteristics provide an important reference for the selection of training strategies in practical applications; for example, the training period of the complete model can be appropriately reduced to improve efficiency.
The visualization of the detection effect shown in Figure 9 provides a visual verification of the model performance. The 0 in the left superscript of the recognition box in the picture represents longitudinal cracks, 1 represents transverse cracks, 2 represents Chap defects, and 3 represents potholes. The advantages of the improved model are clearly observed in the inspection results: for typical transverse cracks, the model accurately detects not only the main crack segments but also the small branch cracks (width <3 pixels), showing a good response time, thanks to RefConv’s fine-grained feature extraction capabilities. In the longitudinal crack detection case, the model successfully overcame the shadow interference and accurately calibrated the crack area, showing the robustness of the ECA mechanism to lighting changes. The most striking aspect is the detection effect of complex Chap defects. The model accurately outlines the boundaries of the irregular spalling area, and the bounding box-to-union ratio reaches 0.73, which is 42% higher than that of the benchmark model. This verifies the improvement effect of WIoU loss on irregular target localization. In the pothole detection case, the model not only accurately locates the location of the pothole but also reflects the detection certainty with a high confidence level (0.92), avoiding the common false alarm problem of traditional methods. By comparing the detection results of the benchmark model and the improved model, three key improvements can be found: (1) The recall rate of small targets is significantly improved (especially in the crack segment with a width of <5 px). (2) The positioning of the bounding box is more accurate, with the fit of irregular edges especially being improved. (3) The false detection rate is significantly reduced, especially in the background area with complex textures. These visualizations corroborate quantitative indicators and demonstrate the benefits of the improved model in real-world applications. Of particular note is the stable performance of the model under challenging conditions, such as strong reflections and low lighting, which is critical for real-world road inspection applications.

4. Conclusions

In summary, this study successfully integrated the ECA attention mechanism, RefConv feature enhancement module, and WIoU loss function into the YOLOv10 model by deeply exploring the technical pain points in complex pavement defect detection, thereby creating a pavement defect detection system that combines efficiency and accuracy. This significantly improved the model’s adaptability to multi-scale defects, illumination variations, and irregular shapes, achieving a 6.2% increase in mAP metrics and reaching an excellent score of 68.2%. At the same time, while maintaining a high inference performance of 158 FPS, it ensured a high recall rate in strong reflection and low-light conditions, setting a new benchmark in the field of smart road inspection.
Looking ahead, we will continue to delve into pavement defect detection technologies, focus on three-dimensional defect reconstruction for more comprehensive morphological assessments, explore multi-modal data fusion to enhance environmental adaptability, develop real-time adaptive mechanisms to cope with dynamic changes, promote lightweight and edge computing applications to broaden deployment scenarios, and integrate domain-specific knowledge to enhance detection intelligence levels, fully advancing pavement defect detection technology towards a more intelligent, precise, and real-time direction, contributing to the construction of smart traffic systems and the maintenance of road safety.

Author Contributions

Conceptualization, X.Z. and L.L.; manuscript writing, L.L. and H.L.; image description, L.W. All authors have read and agreed to the published version of the manuscript.

Funding

This research was funded by the 2021 China University Research Innovation Fund—New Generation Information Technology Innovation Project (Project No. 2021ITA01022) and the Anhui Province Higher Education Science Research Project (Philosophy and Social Sciences): Construction of the joint governance mechanism for the establishment and adjustment of physical education majors in colleges and universities in the context of the “the Belt and Road” initiative, No. 2022AH051023.

Data Availability Statement

The original contributions presented in this study are included in the article; further inquiries can be directed to the corresponding author.

Conflicts of Interest

The authors declare no conflicts of interest.

References

  1. Liu, R. Improved LKM-YOLOv10 Vehicle Licence Plate Recognition Detection System Based on YOLOv10. In Proceedings of the 2024 4th International Conference on Electronic Information Engineering and Computer Science (EIECS), Yanji, China, 27–29 September 2024; pp. 622–626. [Google Scholar]
  2. Haoyan, H.; Jinwu, T.; Haibin, W.; Xinyun, L. EAD-YOLOv10: Lightweight Steel Surface Defect Detection Algorithm Research Based on YOLOv10 Improvement. IEEE Access 2025, 13, 55382–55397. [Google Scholar] [CrossRef]
  3. Hu, Z.; Geng, Q.; Li, X.; Fu, Y. Study on Improved YOLOv10 Face Recognition Based on WF-EMA. In Proceedings of the 2024 5th International Symposium on Computer Engineering and Intelligent Communications (ISCEIC), Wuhan, China, 8–10 November 2024; pp. 563–566. [Google Scholar]
  4. Lodha, N.N.; Kalamkar, S.P.; Heda, L.M. Crowd Abnormal Behaviour Detection and Comparative Analysis Using YOLO Network. In Proceedings of the 2024 IEEE 9th International Conference for Convergence in Technology (I2CT), Pune, India, 5–7 April 2024; pp. 1–6. [Google Scholar]
  5. Qiao, N.; Jiang, Y.; Wang, J.; Xiong, W. A GPR Road Anomaly Interpretation System Based on YOLO Algorithm. In Proceedings of the 2024 Cross Strait Radio Science and Wireless Technology Conference (CSRSWTC), Macao, China, 4–7 November 2024; pp. 1–3. [Google Scholar]
  6. Chen, P.; Wang, Y.; Liu, H. GCN-YOLO: YOLO Based on Graph Convolutional Network for SAR Vehicle Target Detection. IEEE Geosci. Remote Sens. Lett. 2024, 21, 4013005. [Google Scholar] [CrossRef]
  7. Irham, A.; Kurniadi; Yuliandari, K.; Fahreza, F.M.A.; Riyadi, D.; Shiddiqi, A.M. AFAR-YOLO: An Adaptive YOLO Object Detection Framework. In Proceedings of the 2024 ASU International Conference in Emerging Technologies for Sustainability and Intelligent Systems (ICETSIS), Manama, Bahrain, 28–29 January 2024; pp. 594–598. [Google Scholar]
  8. Wang, H.; Song, X. DC-YOLO: A dual channel YOLO for small object defect detection of circuit boards. In Proceedings of the 2024 5th International Conference on Computer Vision, Image and Deep Learning (CVIDL), Zhuhai, China, 19–21 April 2024; pp. 1292–1296. [Google Scholar]
  9. Matsui, A.; Ishibashi, R.; Meng, L. YOLO-FG: YOLO-Based Visual Inspection for Fruits Grading. In Proceedings of the 2024 6th International Conference on Industrial Artificial Intelligence (IAI), Shenyang, China, 21–24 August 2024; pp. 1–6. [Google Scholar]
  10. Kaymakcı, Z.E.; Akarsu, M.; Öztürk, C.N. Multiple Small-Scale Object Detection in Aerial Vehicle Images Using Standard or Optimized YOLO Detectors. In Proceedings of the 2023 International Conference on Innovations in Intelligent Systems and Applications (INISTA), Hammamet, Tunisia, 20–23 September 2023; pp. 1–5. [Google Scholar]
  11. Qu, X.; Zheng, Y.; Zhou, Y.; Su, Z. YOLO v8_CAT: Enhancing Small Object Detection in Traffic Light Recognition with Combined Attention Mechanism. In Proceedings of the 2024 10th International Conference on Computer and Communications (ICCC), Chengdu, China, 13–16 December 2024; pp. 706–710. [Google Scholar]
  12. Xu, J.; Pan, F.; Han, X.; Wang, L.; Wang, Y.; Li, W. EdgeTrim-YOLO: Improved Trim YOLO Framework Tailored for Deployment on Edge Devices. In Proceedings of the 2024 4th International Conference on Computer Communication and Artificial Intelligence (CCAI), Xi’an, China, 24–26 May 2024; pp. 113–118. [Google Scholar]
  13. Hamzah, R.; Ang, L.; Roslan, R.; Teo, N.H.I.; Samad, K.A.; Samah, K.A.F.A. Comparing Modified Yolo V5 and Faster Regional Convolutional Neural Network Performance for Recycle Waste Classification. In Proceedings of the 2024 IEEE International Conference on Automatic Control and Intelligent Systems (I2CACIS), Shah Alam, Malaysia, 29 June 2024; pp. 415–419. [Google Scholar]
  14. Yao, N.; Chen, W.; Qin, J.; Shan, G. Research on the Image Model of Substation UAV Inspection Based on the Improved YOLO Algorithm. In Proceedings of the 2024 International Conference on Image Processing, Computer Vision and Machine Learning (ICICML), Shenzhen, China, 22–24 November 2024; pp. 61–64. [Google Scholar]
  15. Xiong, K.; Li, Q.; Meng, Y.; Li, Q. A Study on Weed Detection Based on Improved Yolo v5. In Proceedings of the 2023 4th International Conference on Information Science and Education (ICISE-IE), Zhanjiang, China, 15–17 December 2023; pp. 1–4. [Google Scholar]
  16. Liu, H. Fine-Grained Classification and Anomaly Detection System of Motion Injury Images Based on Improved YOLO Algorithm. In Proceedings of the 2024 International Conference on Data Science and Network Security (ICDSNS), Tiptur, India, 26–27 July 2024; pp. 1–5. [Google Scholar]
  17. Zhang, X.; Tang, Y.; Zhou, S.; Dong, S.; Zhou, H.; Hu, S. Improved YOLO algorithm for identifying abnormal states in electric energy metering devices. In Proceedings of the 2024 4th International Conference on Electrical Engineering and Control Science (IC2ECS), Nanjing, China, 27–29 December 2024; pp. 278–281. [Google Scholar]
  18. Zhang, D.; Liu, Z.; Wang, X.; Qi, J.; Zhou, Y.; Zhou, Q. Research on Aircraft Patrol Inspection Method Using UAV Based on YOLO Algorithm. In Proceedings of the 2024 4th International Conference on Electronic Information Engineering and Computer (EIECT), Shenzhen, China, 27–29 September 2024; pp. 412–415. [Google Scholar]
  19. Wu, J. Traffic Sign Detection in Autonomous Driving: Optimization Choices for YOLO Models. In Proceedings of the 2024 International Conference on Advances in Electrical Engineering and Computer Applications (AEECA), Dalian, China, 16–18 August 2024; pp. 530–534. [Google Scholar]
  20. Liu, A.; Liu, Y.; Kifah, S. Deep Convolutional Neural Network for Enhancing Traffic Sign Recognition Developed on Yolo V5. In Proceedings of the 2024 International Conference on Advancements in Smart, Secure and Intelligent Computing (ASSIC), Bhubaneswar, India, 27–29 January 2024; pp. 1–6. [Google Scholar]
  21. Ding, Z.; Li, Y.; Hu, B.; Chen, Z.; Jia, H.; Shi, Y.; Zhang, X.; Zhu, X.; Feng, W.; Dong, C. ITD-YOLO: An Improved YOLO Model for Impurities in Premium Green Tea Detection. Foods 2025, 14, 1554. [Google Scholar] [CrossRef] [PubMed]
  22. Luo, Z.; Xu, H.; Xing, Y.; Zhu, C.; Jiao, Z.; Cui, C. YOLO-UFS: A Novel Detection Model for UAVs to Detect Early Forest Fires. Forests 2025, 16, 743. [Google Scholar] [CrossRef]
  23. Lv, R.; Hu, J.; Zhang, T.; Chen, X.; Liu, W. Crop-Free-Ridge Navigation Line Recognition Based on the Lightweight Structure Improvement of YOLOv8. Agriculture 2025, 15, 942. [Google Scholar] [CrossRef]
  24. Tariq, M.; Choi, K. YOLO11-Driven Deep Learning Approach for Enhanced Detection and Visualization of Wrist Fractures in X-Ray Images. Mathematics 2025, 13, 1419. [Google Scholar] [CrossRef]
  25. Liu, Y.; Li, S.; Zhou, L.; Liu, H.; Li, Z. Dark-YOLO: A Low-Light Object Detection Algorithm Integrating Multiple Attention Mechanisms. Appl. Sci. 2025, 15, 5170. [Google Scholar] [CrossRef]
  26. Zhong, H.; Zhang, Y.; Shi, Z.; Zhang, Y.; Zhao, L. PS-YOLO: A Lighter and Faster Network for UAV Object Detection. Remote Sens. 2025, 17, 1641. [Google Scholar] [CrossRef]
  27. Zhou, N.; Gao, D.; Zhu, Z. YOLOv8n-SMMP: A Lightweight YOLO Forest Fire Detection Model. Fire 2025, 8, 183. [Google Scholar] [CrossRef]
  28. Wang, Q.; Yan, N.; Qin, Y.; Zhang, X.; Li, X. BED-YOLO: An Enhanced YOLOv10n-Based Tomato Leaf Disease Detection Algorithm. Sensors 2025, 25, 2882. [Google Scholar] [CrossRef] [PubMed]
  29. Wang, R.; Chen, Y.; Zhang, G.; Yang, C.; Teng, X.; Zhao, C. YOLO11-PGM: High-Precision Lightweight Pomegranate Growth Monitoring Model for Smart Agriculture. Agronomy 2025, 15, 1123. [Google Scholar] [CrossRef]
  30. Su, G.; Su, X.; Wang, Q.; Luo, W.; Lu, W. Research on X-Ray Weld Defect Detection of Steel Pipes by Integrating ECA and EMA Dual Attention Mechanisms. Appl. Sci. 2025, 15, 4519. [Google Scholar] [CrossRef]
Figure 1. Optimized YOLOv10 structure.
Wevj 16 00328 g001
Figure 2. ECA attention mechanism.
Wevj 16 00328 g002
Figure 3. RefConv mechanism.
Wevj 16 00328 g003
Figure 4. Percentage composition of data types.
Wevj 16 00328 g004
Figure 5. Pavement defect dataset.
Wevj 16 00328 g005
Figure 6. Label correlogram.
Wevj 16 00328 g006
Figure 7. Data charts.
Wevj 16 00328 g007
Figure 8. Convergence results of different average indicators.
Wevj 16 00328 g008
Figure 9. Pavement defect identification effect.
Wevj 16 00328 g009
Table 1. Experimental platform device.
Device TypeDevice Model
CPUIntel® Core i7-13700KF
GPUNVIDIA GeForce RTX 4080
Operating systemWindows 11 64 bit
Memory32 GB
Training frameworkPytorch
Table 2. Evaluation parameters of different models.
ECARefConvWIoUPRmAPmAP_0.5:0.95
×××70.1%58.5%64.2%34.2%
××71.4%59.4%65.7%35.3%
××72.2%61.7%66.3%35.7%
××71.8%60.1%67.8%36.5%
72.9%62.1%68.2%39.8%
Table 3. Comparison of results generated by the improved YOLOv10 model.
ClassPRmAP_0.5mAP_0.5:0.95
all72.9%62.1%68.2%39.8%
TransverseCracks68.9%53.6%60.5%33.3%
LongitudinalCracks66.2%52.8%58.9%29.8%
Chap71.1%61.4%67.4%36.3%
Potholes85.3%80.7%86.1%59.8%
Table 4. Comparison of results generated by different models.
ModelPRmAP_0.5mAP_0.5:0.95
YOLOv564.9%50.9%54.2%29.6%
YOLOv665.2%51.8%55.6%30.1%
YOLOv867.4%56.5%60.7%35.1%
YOLOv1070.1%58.5%64.2%34.2%
YOLOv1170.9%59.4%66.1%37.7%
Proposed72.9%62.1%68.2%39.8%
Disclaimer/Publisher’s Note: The statements, opinions and data contained in all publications are solely those of the individual author(s) and contributor(s) and not of MDPI and/or the editor(s). MDPI and/or the editor(s) disclaim responsibility for any injury to people or property resulting from any ideas, methods, instructions or products referred to in the content.

