Article

Research on Electric Vehicle Charging Load Forecasting Method Based on Improved LSTM Neural Network

1
School of Electrical Engineering, Shanghai Jiao Tong University, Shanghai 200240, China
2
Global Energy Interconnection and Development Cooperation, Beijing 100031, China
*
Author to whom correspondence should be addressed.
World Electr. Veh. J. 2025, 16(5), 265; https://doi.org/10.3390/wevj16050265
Submission received: 27 December 2024 / Revised: 22 January 2025 / Accepted: 24 January 2025 / Published: 13 May 2025

Abstract

Targeting the problem whereby electric vehicle charging loads have large temporal randomness, which affects the accuracy of load prediction, an electric vehicle charging load prediction method based on an improved long short-term memory (LSTM) neural network is investigated. The similarity of EV charging load curves is calculated and the data related to EV charging loads are clustered according to the similarity using a spectral clustering algorithm. The principal component analysis method is used to extract the principal components from the clustering results of EV load data. The LSTM neural network takes the main components of EV charging load as inputs, updates the state of the storage unit through the activation function, introduces an attention mechanism to improve the structure of the network, and outputs the prediction results of the EV charging load through the operation of the input gate, forgetting gate, and output gate. The experimental results show that this method can accurately predict the hourly and daily charging loads of electric vehicles and provide support for their orderly charging of electric vehicles.

1. Introduction

The popularity of electric vehicles is increasing, and predicting their charging load has become an urgent issue in the power system [1]. Electric vehicles are favored and charging loads are affected by a variety of factors such as sleep schedules [2], weather, temperature, season, and driving patterns. Electric vehicle charging loads have highly random fluctuations and are driven by multiple factors [3]. Electric vehicle charging load forecasting focuses on the short term and is often based on daily load curve forecasting [4]. Accurately predicting the daily load of electric vehicles assists in optimizing scheduling decisions [5]. The charging power of EVs is large and random, and large-scale integration into the power grid will significantly affect their operation [6]. The accurate measurement of EV charging load is crucial for power system stability, dispatch optimization, and energy efficiency improvement.
In recent years, researchers have focused on electric vehicle load forecasting. Arivalahan et al. [7] optimized the capacity allocation of charging stations through the artificial transgender longicorn algorithm to improve charging efficiency. Through capacity prediction and scheduling, a better balance between energy supply and demand can be achieved and energy waste can be reduced. However, the stability of wind and photovoltaic energy is affected by weather conditions. The change in wind speed and sunlight leads to energy instability, and charging stations need to integrate wind, solar, and photovoltaic power to solve the problem of energy scheduling. Unterluggauer et al. [8] used multiple regression to predict the short-term load of tram charging stations, but the load changes were nonlinear and the regression model struggled to capture the true situation, which affected the accuracy. Multivariate assumptions are independent, but reality is often correlated, leading to model bias. Mazzi et al. [9] used a micro neural network to estimate the charging state of electric vehicle batteries in real time and accurately, which helps to avoid overcharging and prolong their lifespan. However, due to the limited power consumption and high battery life of microcontrollers, the accuracy is reduced. Arun et al. [10] applied hybrid collaborative methods to electric vehicle charging scheduling, utilizing Lévy flight theory to optimize resource allocation. However, this required tedious parameter adjustments, making it difficult to ensure optimal scheduling results. In addition, the practical application of electric vehicle charging scheduling is faced with sudden situations such as charging station equipment failure and communication network delay. When the algorithm encounters uncertain factors, its stability is poor, which affects the charging scheduling effect of electric vehicles. Taking Lanzhou City as an example, Li et al. [11] proposed a new model to achieve accurate balanced regional electric vehicle charging load prediction with dynamic road networks. A road vehicle grid integration model was constructed to establish the actual road network topology structure in the city. Particle swarm optimization (PSO) was used to optimize the backpropagation (BP) neural network to predicte future regional electric vehicle ownership. In addition, by introducing a real-time unit mileage power consumption model for electric vehicles and using M/M/c queue theory to determine charging waiting time, the Monte Carlo (MC) model was improved to obtain accurate spatial and temporal predictions of regional short-term charging loads. However, changes in charging behavior, traffic patterns, and other factors over time can lead to the emergence of optimal solutions in particle swarm optimization, making it difficult for the model to accurately predict events. Mekkaoui et al. [12] proposed an attention-based recursive convolutional neural network model (LA-RCNN) aimed at predicting electric vehicle charging load using multivariate time series inputs, including meteorological data and the number of connected users. The proposed model combines multiplication Luong attention to identify temporal dependencies and correlations. It predicts the national charging load by considering the charging status and the number of plug-in electric vehicles connected to each charging station. However, the attention mechanism cannot capture all variables that affect the charging load, especially non-time series factors, which can affect the prediction results. Tang et al. [13] proposed a novel ultra-short-term load forecasting method for the regional electric vehicle charging load based on the usage of charging piles. They defined the utilization level of all charging stations based on their usage frequency, and then constructed them based on the collected electric vehicle charging transaction data on site. Combining these usage levels with historical charging load values, a long short-term memory (LSTM) neural network is used to construct an electric vehicle charging load prediction model. However, if there is a bias in historical data, the learning performance of the LSTM model will be affected, leading to inaccurate predictions. Huang et al. [14] proposed a meta prototype for the probabilistic prediction of charging load at electric vehicle charging stations. In order to enable ProbFormer to quickly adapt to unseen environments, it is further extended to the meta learning-based prediction framework MetaProbFormer. Extensive experiments were conducted on real-world datasets for point prediction and probability prediction. However, there is overfitting in the model of the transformer, which can affect point prediction and probability prediction.
In the prediction of electric vehicle charging load, LSTM neural network can fully utilize the temporal information in historical charging data to learn and remember long-term dependencies and patterns in the load sequence. LSTM is a special circular neural network architecture, which controls the flow of information by introducing cells, input gates, forget gates, and output gates. At the same time, LSTM also has the ability to handle the influence of multiple factors and can incorporate various external factors such as weather, season, holidays, etc., into the prediction model, thereby improving the robustness and accuracy of the prediction model. LSTM solves the problem of the long-term dependence of sequence data through gate units. The study of the electric vehicle charging load prediction method based on improved LSTM introduces the attention mechanism to improve generalization ability. The aim is to develop a more accurate and comprehensive electric vehicle charging and discharging load prediction method by improving the LSTM neural network model. This method will fully consider various factors influencing the electric vehicle charging load and utilize the superior ability of LSTM neural network to achieve the accurate prediction of electric vehicle charging load. The research results can not only provide important references for optimizing the operation and planning of the power grid, but also promote the healthy development of the electric vehicle industry, facilitating the transformation and sustainable development of the energy structure.

2. Electric Vehicle Charging Load Prediction Methods

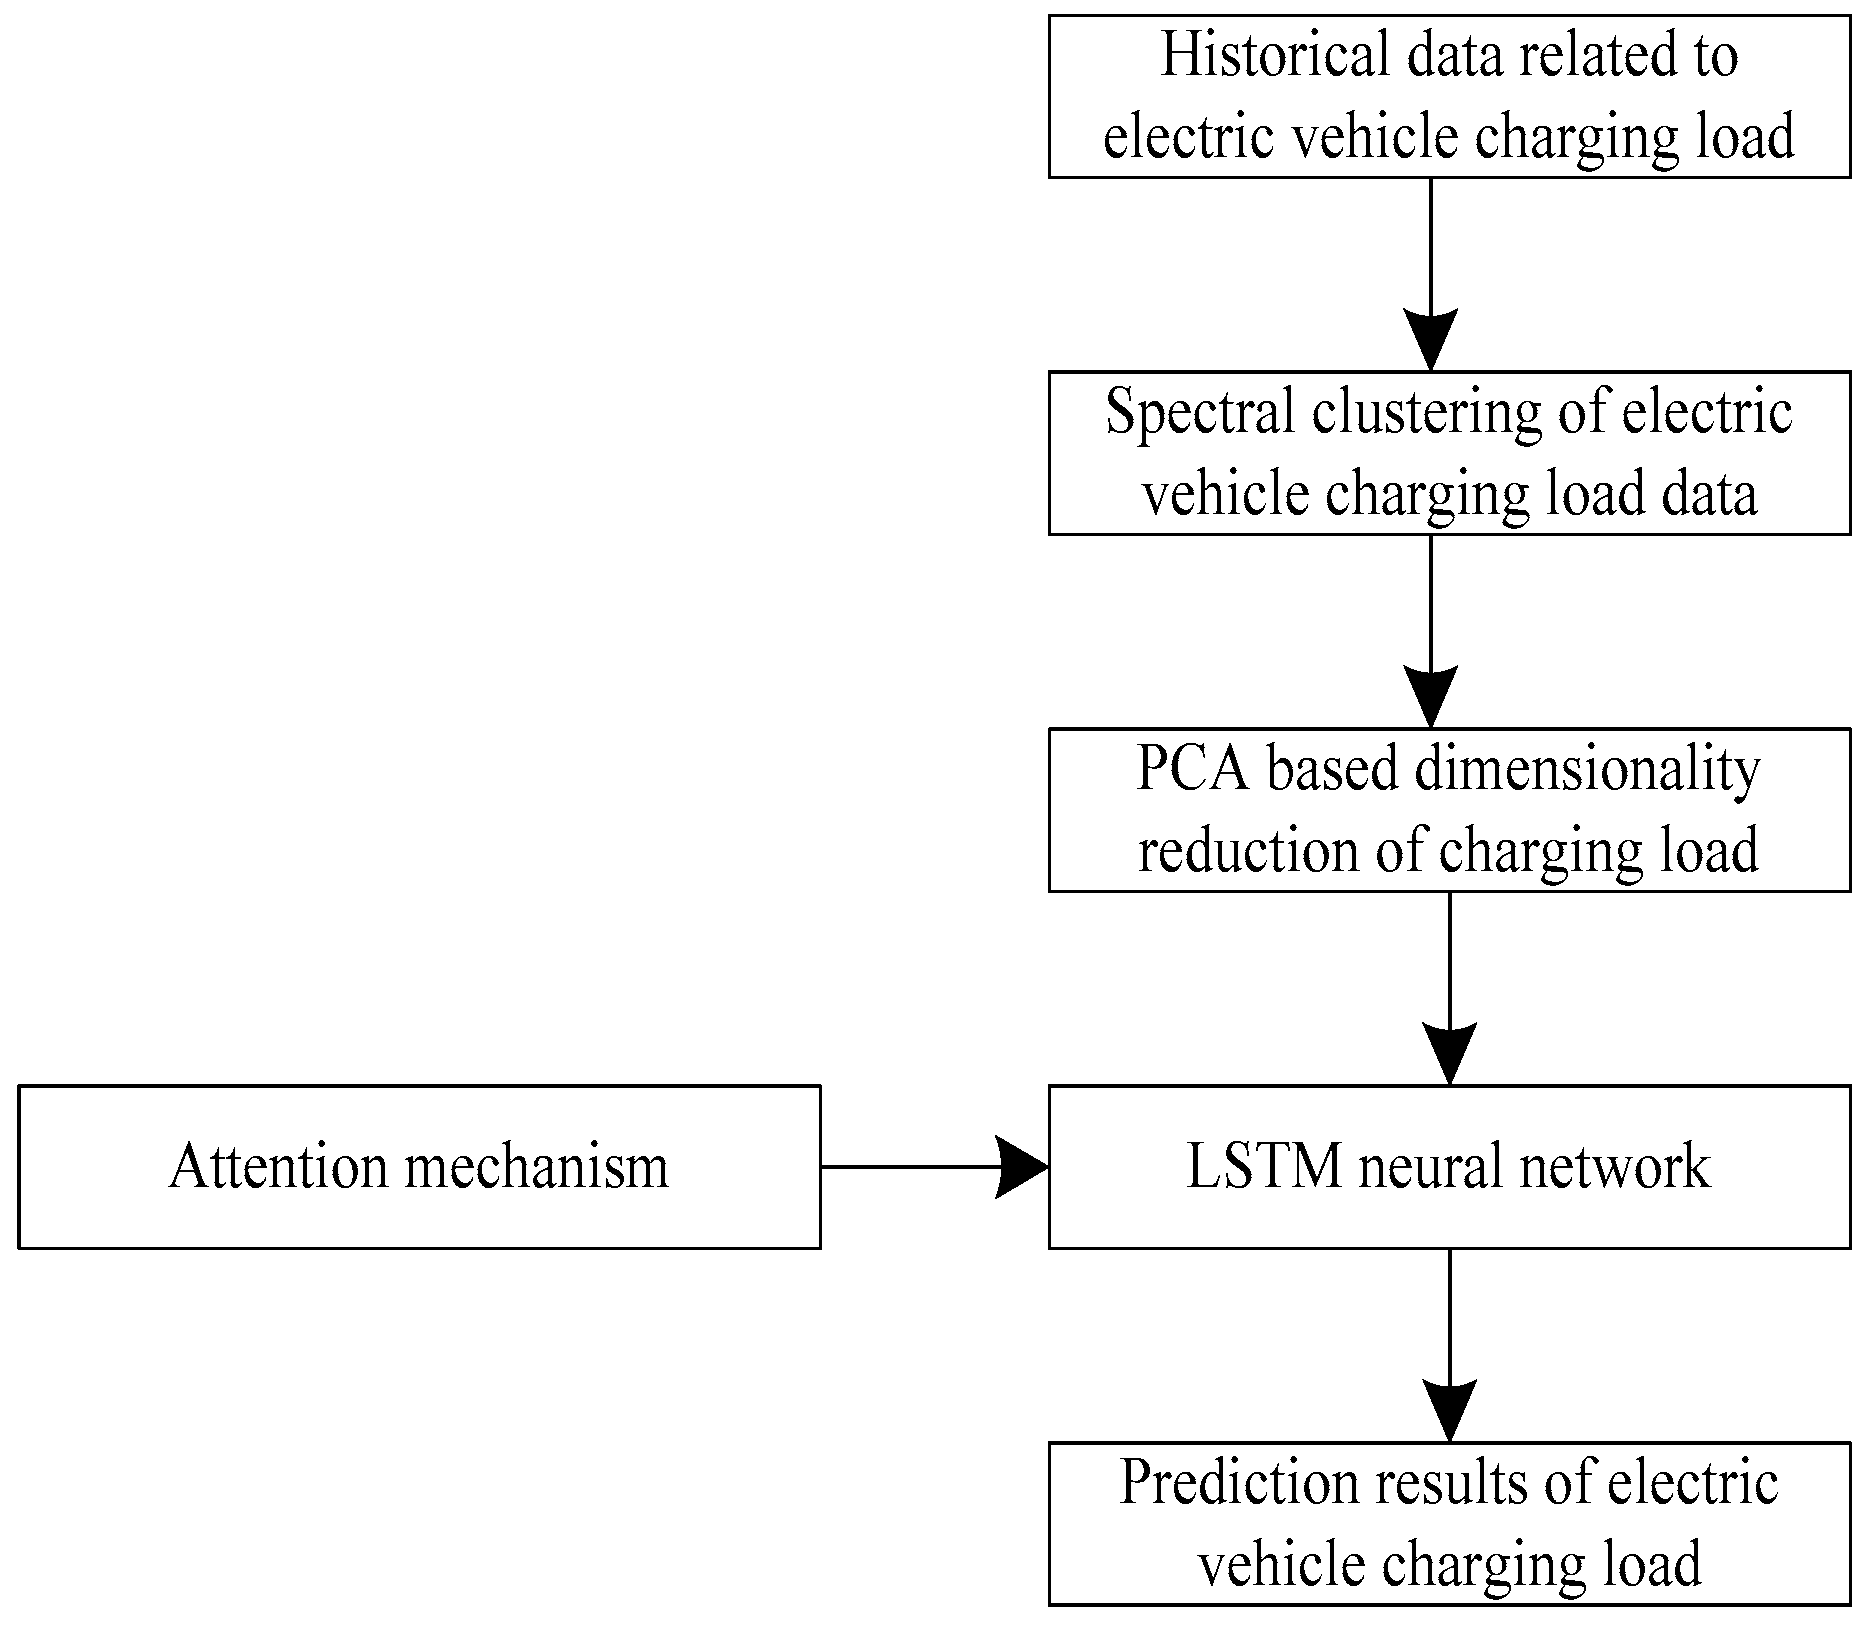
2.1. Overall Architecture for EV Charging Load Forecasting

The overall architecture of the improved LSTM neural network for electric vehicle charging load prediction is shown in Figure 1.
After preprocessing the charging load data of electric vehicles, clustering was performed using a spectral clustering algorithm, and principal component analysis was used to determine the key components. Subsequently, the improved LSTM network predicts the charging load and obtains the final predicted values.

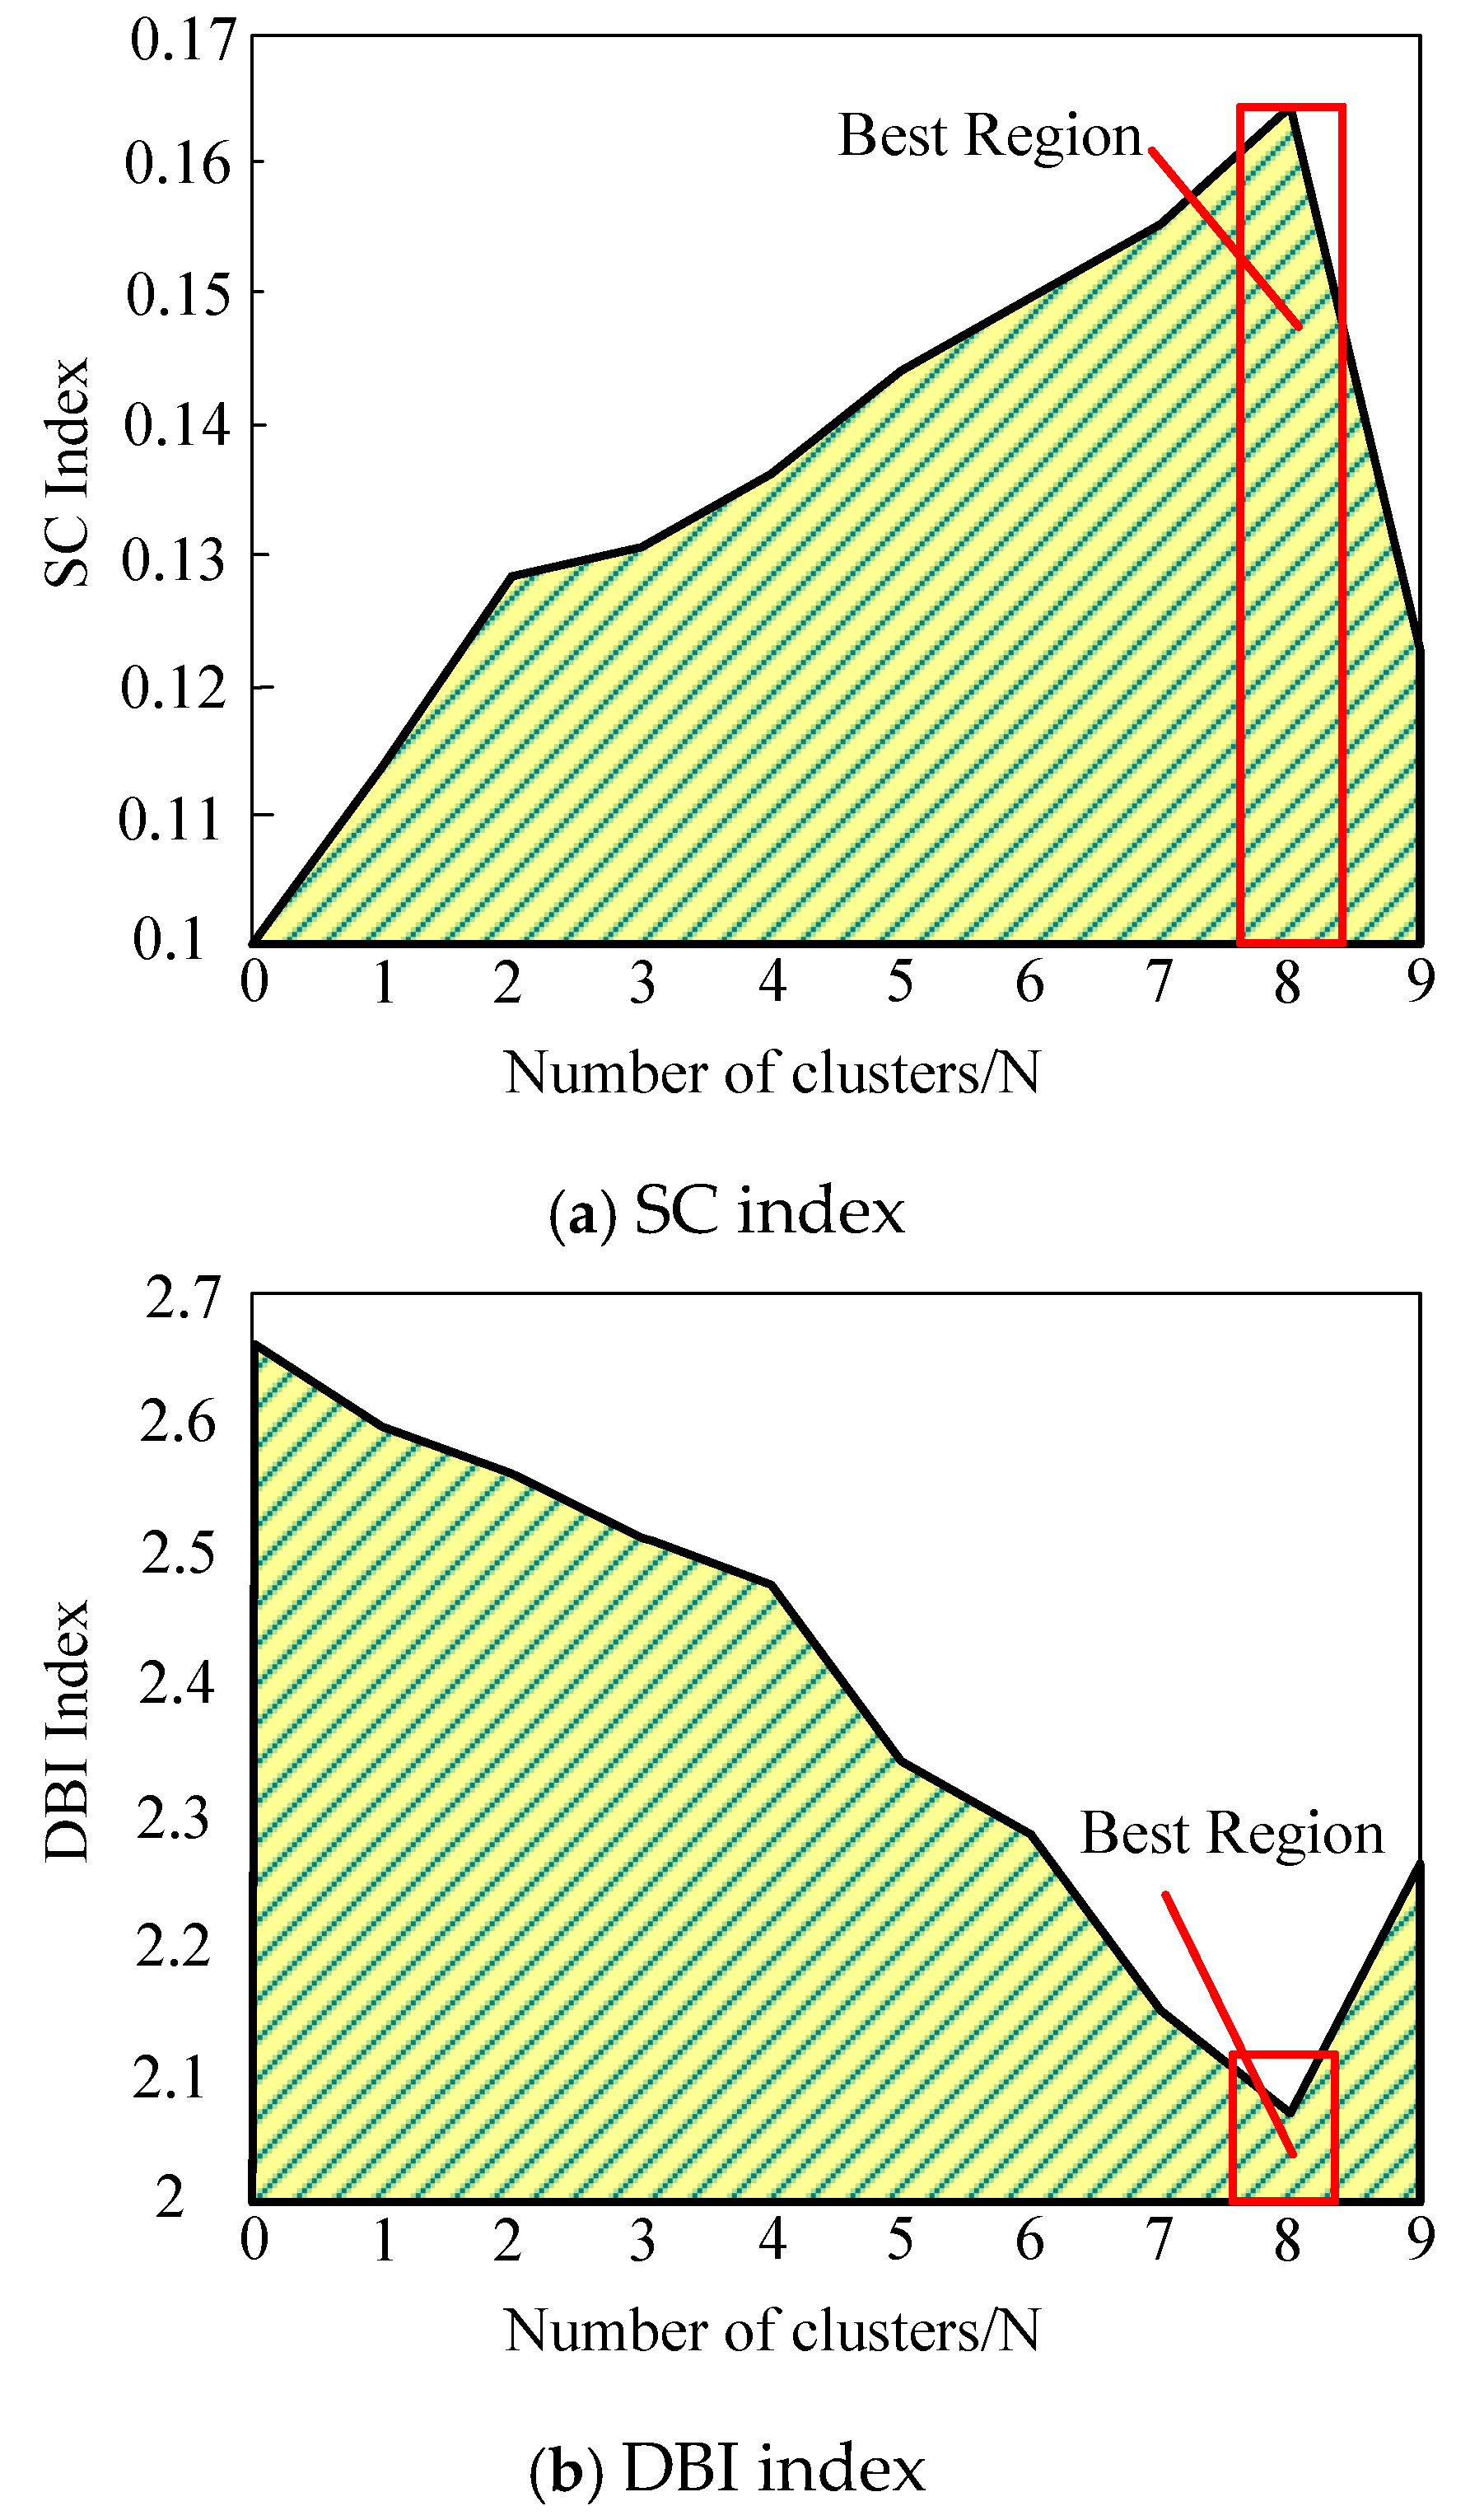
2.2. Clustering of Electric Vehicle Charging Load Data Based on Spectral Clustering Algorithm

Using spectral clustering algorithm to cluster electric vehicle charging load data [15], based on similarity mapping, they are then transformed via graph partitioning [16]. The preprocessed data are represented as vertices and the similarity is represented as weights. Regions are partitioned by maximizing the similarity within subgraphs and minimizing the similarity between subgraphs. Charging load curves are classified based on load data similarity metrics [17].
Using Euclidean distance to measure the similarity of charging load data for electric vehicles, it is found to follow this rule: the farther the distance, the greater the difference [18,19]. The distance between the daily charging load curve i and j is calculated based on the following equation:
d i j = t = 1 T x i t x j t 2
Equation (1) calculates the Euclidean distance d i j between the charging load curves of electric vehicles i and j . T stands for time period, t stands for time point, x i t stands for the charging amount of the i th car at time t , and x j t stands for the charging amount of the j th car at time t .
Constructing a similarity matrix D based on Euclidean distance, the clustering steps for electric vehicle charging load data are as follows:
(1) Input matrix X , containing n × T -dimensional electric vehicle charging load data and cluster number K = K 0 .
(2) Based on the scale of n × n and the symmetry of D , construct a degree matrix S , where s i is expressed as follows:
s i = j = 1 n d i j
(3) The Laplacian matrix L is constructed as follows:
L = S D
(4) The expression for standardized processing for the Laplace matrix L is as follows:
L = S 1 2 × L × S 1 2
(5) Take the electric vehicle charging load data before the K smallest eigenvalues [20] to form a new matrix V n × k , constituting the electric vehicle charging load eigenvector space.
(6) Using K-means clustering algorithm, the feature vector space of electric vehicle charging load V n × k clustering, obtain K results of the delineation of the clusters of B k = r 1 , r 2 , , r u . Among them, B k is the set of daily charging load curves in cluster k , r u is the charging load curve in cluster u , and u is the number of clusters with charging load configuration files.
(7) Check the termination conditions of the cluster. If they are not met, repeat steps (4)–(7) until they are met [21]. Output the number of clusters, specification control (SC), Davis–Budding Index (DBI), and load profiles for each cluster. SC is a method or process that ensures that a product, process, or system conforms to predetermined specifications and standards, and its near-horizon clustering works well enough to be used in evaluating the performance of clustering algorithms. DBI measures the quality of clusters based on similarity between clusters and compactness within clusters and is used in evaluating the level of separation between classes. DBI is a method or procedure for ensuring that a product, process, or system conforms to predetermined specifications and standards. The degree of separation between the classes is assessed.
The smaller the value, the farther the different classes are apart, and the better the clustering effect [22]. The SC or DBI change in two adjacent clusters is set to be less than the threshold as the termination condition of the cluster.
(8) Implement K = K + 1 , adjust the number of clusters K to be less than K max , and repeat until K = K max . Select the optimal SC/DBI index K to determine the number of clusters and load distribution.
The clustering results serve as inputs for the dimensionality reduction of electric vehicle charging load data.

2.3. Dimensionality Reduction Processing of Electric Vehicle Charging Load Data Based on Principal Component Analysis

Principal component analysis (PCA) is used to perform a dimensionality reduction for electric vehicle charging data, to screen key indicators, and to improve the accuracy of charging load forecasting. PCA is a dimensionality reduction technique for unsupervised learning. It transforms the original high-dimensional data into a new set of orthogonal variables, that is, principal components, through linear transformation. The main idea of PCA is to map m dimensional features to the k dimension ( k < m ), containing the original numerous characteristic factors with certain correlations [23], which are re-linearly combined into several new mutually unrelated composite factors (i.e., principal components). Additionally, we aim as far as possible to reflect the information of these original characteristic factors [24]. Using the clustering results X of electric vehicle charging loads, containing m factors, each of these factors has n observations to obtain the original data matrix A .
A brief description of steps taken to reduce the charging load data of electric vehicles is given.
(1) We sought to standardize the m factors in the clustering results of the charging load of electric vehicles (EVs). EV refers to a car powered by electricity. Its power source is the electric energy stored in the on-board battery, and the electric energy is converted into mechanical energy by the motor to power the vehicle. The standardized factor variables were obtained as follows:
y j = x j μ j z j
In Equation (5), μ j and z j are mean and standard deviation and they are expressed as follows:
μ j = 1 n i = 1 n x i j
z j = 1 n 1 i = 1 n x i j μ j 2
(2) Based on the use of thee standardized data matrix Y to obtain the matrix R = r i j m × m of correlation coefficients, where the expression for r i j is as follows:
r i j = t = 1 n y t i y t j n 1
(3) Using the standard orthogonalized eigenvectors, r i , composed of m , new vectors of charging load factors are as follows:
F 1 = r 11 y 1 + r 21 y 2 + + r m 1 y m F 2 = r 12 y 1 + r 22 y 2 + + r m 2 y m F m = r 1 m y 1 + r 2 m y 2 + + r m m y m
In Equation (9), F 1 , F 2 , and F m are the m principal components before the EV charging load.
(4) The formula for calculating the contributions and cumulative contributions of each principal component is as follows:
F j = λ j t = 1 m λ t
Ψ i = t = 1 i λ t t = 1 m λ t × 100 %
F j is the contribution of the j component, Ψ i is the cumulative contribution of the i component, and λ i is the eigenvalue of the R matrix.
The eigenvalue factors with a cumulative contribution rate of 85–95% are the main components of EV charging load prediction, and the PCA results are used as inputs for LSTM to predict the EV charging load.

2.4. Charging Load Prediction Based on Improved LSTM Neural Network

The charging and discharging effects, ranges, and loads of electric vehicles vary in different environments. Turning on the air conditioner at low temperatures increases the charging power. Based on the load characteristics, the PCA results are fed into LSTM to predict the EV charging load.

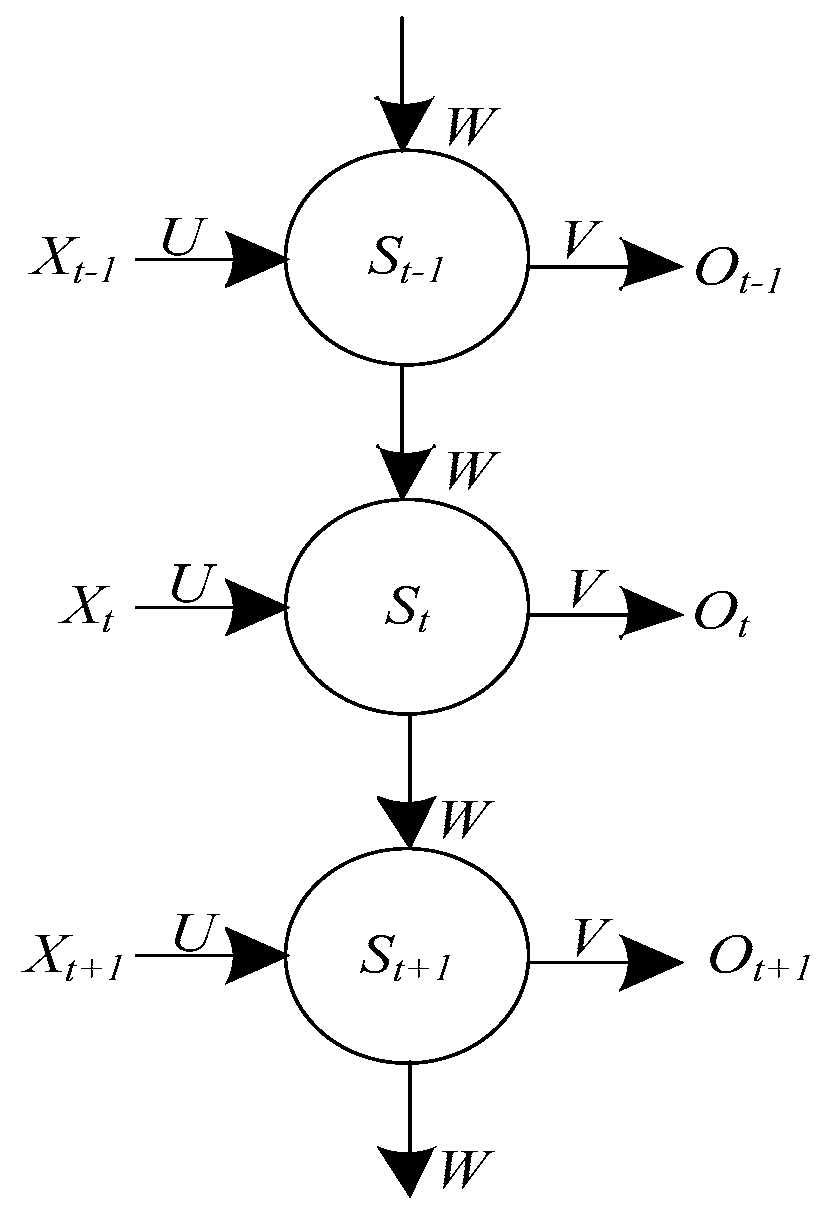
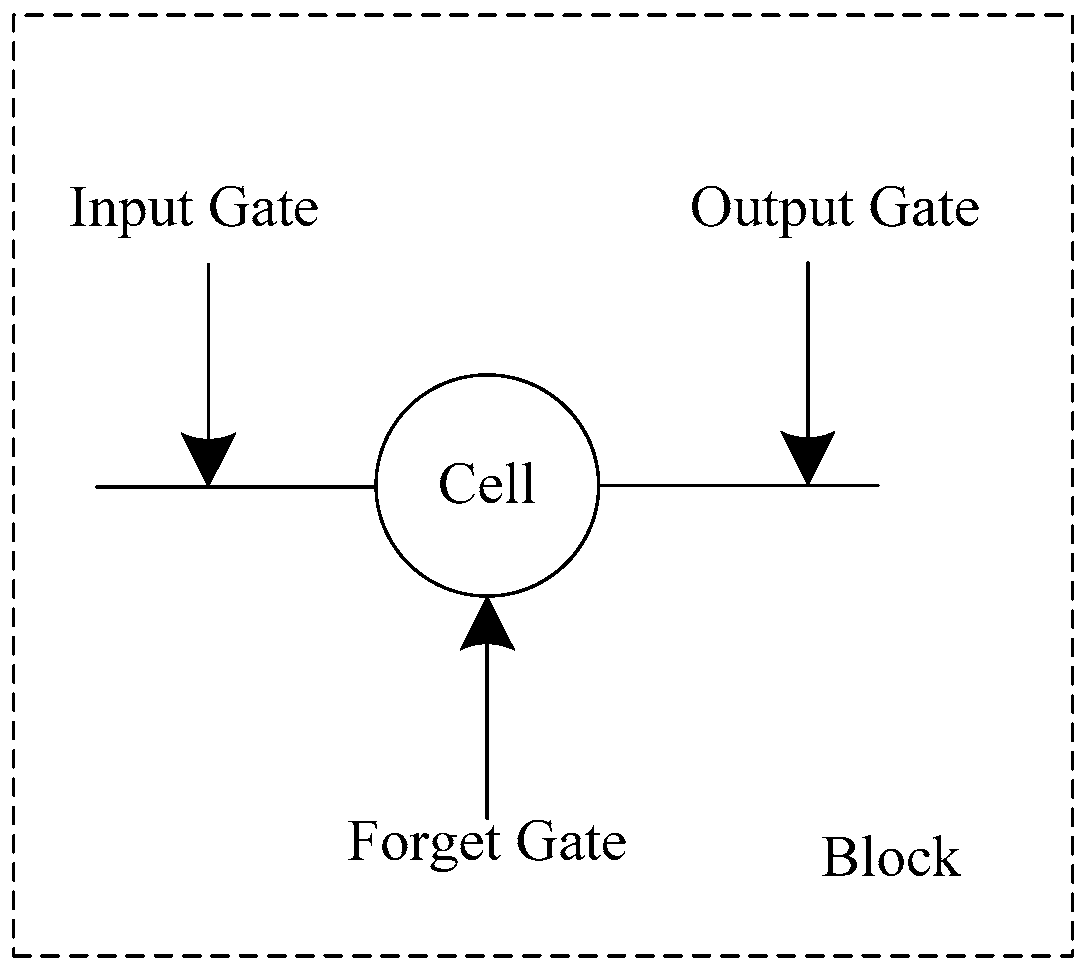
2.4.1. LSTM Neural Network for Electric Vehicle Charging Load Prediction

LSTM is a special case of a recurrent neural network (RNN), characterized by the correlation of hidden layer units and the presence of “memory”, with input occurring before correlation. An RNN is a kind of neural network used specially for processing sequence data. The structure is shown in Figure 2.
Figure 2 shows the RNN structure, with U , V , and W as weights, X as input, O as output, and S as the hidden state. Sharing weights reduces the training time. However, RNNs are limited by “gradient vanishing”, and LSTM solves this problem through unique storage units (Figure 3), consisting of input, hidden, and output layers.
The LSTM unit contains storage elements, and the state c t changes over time t . By performing input, forget, and output gate operations and using sigmoid/Tanh functions to read and modify, state management is achieved.
LSTM workflow: The unit receives external (current state x t , previous hidden state h t 1 ) and internal (storage unit c t 1 state) information through three gates at each time. The gate logic determines the activation state, and the input gate undergoes nonlinear transformation and forgetting gate processing to update the state of storage unit c t . Finally, the c t state is controlled by nonlinearity and output gates to output h t . When this method is used for charging load prediction, variable calculation follows.
i t = σ W x i x t W h i h t 1 + W c i c t 1 + b i
f t = σ W x f x t W h f h t 1 + W c f c t 1 + b f
c t = f t c t 1 + tanh W x c x t W h c h t 1 + b c
o t = σ W x o x t W h o h t 1 + W c o c t + b o
h t = o t tanh c t
In the above equation, W x c , W x i , W x o , and W c f connect input electric vehicle charging load data x t of the weight matrix; the W h i , W h f , W h c , and W h o are connecting the hidden layer output signals h t of the weight matrix; W c i , W c f , and W c o are matrices connecting neuron activation and gate functions; b i . b f , b c , b o are biases; σ is sigmoid activation, and tanh is tanh activation.
Train LSTM to predict charging load: extend LSTM into a deep network in time series, train it using a backpropagation algorithm, and pay attention to the cross-layer correlation of the loss function.

2.4.2. Improvement of LSTM Neural Network Based on Attention Mechanism
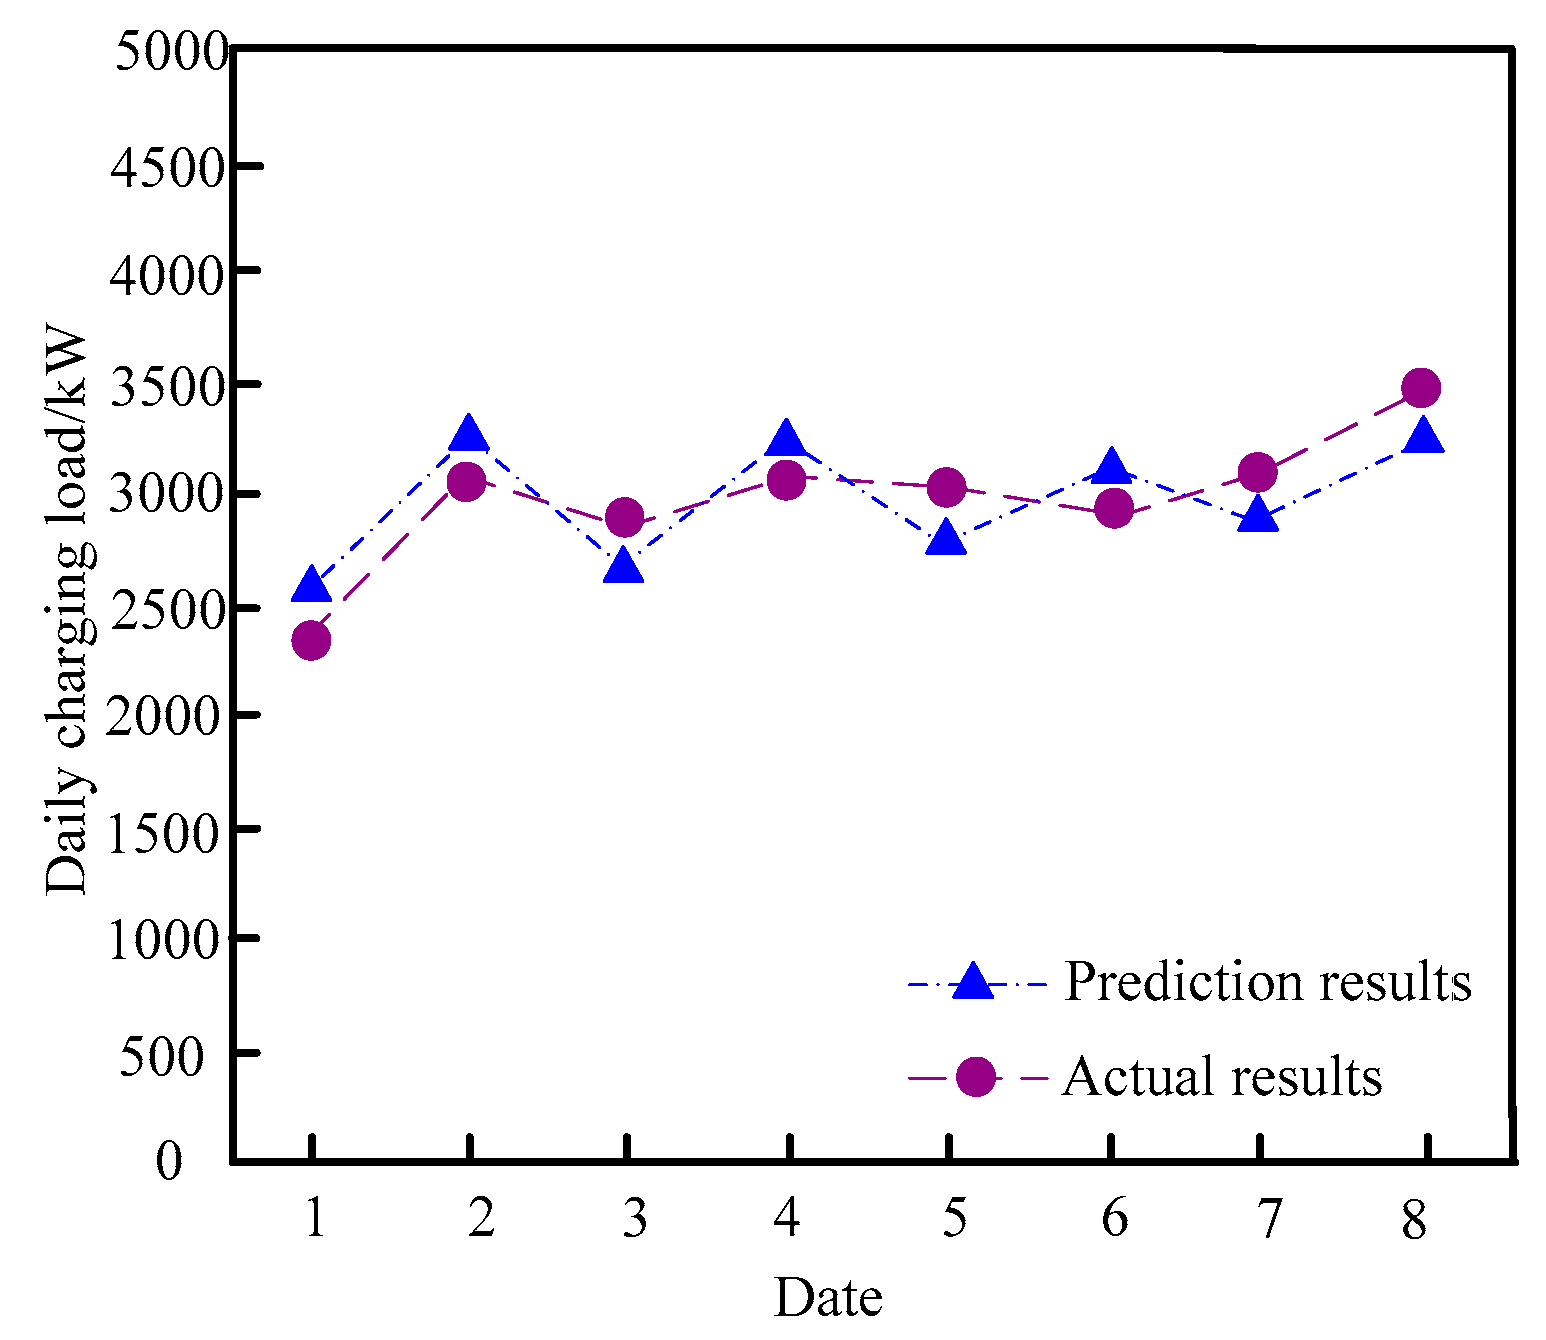
LSTM gate control with increasing parameters, especially at deep levels, requires multiple data computations to prevent gradient explosion. The attention mechanism (AM) improves LSTM to improve accuracy and reduce complexity by focusing on key data weighting. AM is a technique that automatically focuses on the important parts of the data as it is processed in deep learning, allowing the model to assign different attentional weights to different locations or elements, thus focusing on key information. Different features have varying importance in the sequence, and AM analysis is crucial for optimizing charging load prediction. Use [ x 0 , x 1 , , x n ] , where n + 1 represents the input data for the group of electric vehicle charging loads and x i represents a group of electric vehicles’ charging load input information. Considering the computing resources of the LSTM neural network, it is not necessary to input all electric vehicle charging load information into the LSTM neural network, but only need to select some of the information from [ x 0 , x 1 , , x n ] that is more relevant to EV charging load forecasting.
After adding an attention layer to LSTM, calculate the attention distribution of the charging load input. The probability distribution is as follows.
e t = u tanh w h t + b
In Equation (17), b denotes the bias factor, u . w is the weight coefficient of the LSTM layer.
The expression for the attentional weights of the input data for EV charging loads is as follows:
a t = exp e t i = 1 t e i
When the time is t , the output expression of attention layer is as follows:
y ^ = S i g m o i d w a x t + b a
In Equation (19), w a and b a represent the weights and biases of the attention layer.
AM is introduced to set the attention layer as an input to the LSTM and to select key charge load information for the forgetting gate. The prediction results are obtained by the forgetting gate and output gate. AM activity information is assessed while considering both short-term and long-term memory. The attentional mechanism improves the accuracy of LSTM in predicting EV charging loads. By automatically assigning attentional weights to critical information and ignoring non-critical parts, it improves the transparency and interpretability of the model and combines the advantages of both techniques to optimize the prediction performance.

3. Results

Using data from 1564 charging stations in a certain region in November 2022 as a sample, a crawler was used to obtain weather and date information for the same period, and the charging details of 185 vehicles were recorded. The parameter settings for charging stations and charging piles are shown in Table 1. Figure 4 shows the structure of charging stations within the study area to validate the effectiveness of the electric vehicle charging load forecasting method.
Collect historical charging load samples for 20 min, as shown in Table 2, to verify the performance of the electric vehicle charging load prediction method.
The historical load in Table 2 is the actual charging load accumulated according to the corresponding date and moment point and acts as the historical load value of the load point.
In order to further validate the agreement between the predicted and actual values obtained by the proposed method, a Wilcoxon signed-rank test was performed on the experimental results of our method. Mean Absolute Error (MAE) and Mean Square Error (MSE) were selected for evaluation. MAE is a measure of the error between the predicted and actual values and it represents the mean of the absolute value of the difference between the predicted and true values. MSE is a measure of the error between the predicted and actual values and it calculates the mean of the square of the difference between the predicted and true values. The results obtained are shown in Table 3.
In Table 3, the specific values of MAE and MSE are calculated based on the performance of the model on the test set. The smaller these values, the better the predictive performance of the model. From Table 4, it can be seen that the p-value of the Wilcoxon signed-rank test result is very small (0.0003), which strongly supports the hypothesis that there is a significant difference between the predicted error distribution and the actual error distribution, thus verifying the high consistency between the model’s predicted values and the actual values.
Using the coefficient of determination R 2 to evaluate the performance of charging load forecasting, the formula is as follows:
R 2 = 1 i = 1 n p i y ¯ i = 1 n y i y ¯
In Equation (20), y i is the true load, y ¯ is the true set mean, and p i is the predicted load.
The determination coefficient statistics for predicting charging load are shown in Figure 5.
Figure 5 shows that the prediction method has a coefficient of determination greater than 0.9, verifying its high accuracy. It is necessary to improve LSTM to capture temporal characteristics and bidirectional dependencies, enhance the effectiveness of attention mechanisms, and support research on ordered charging strategies.
Clustering electric vehicle charging load data, SC and DBI indices vary with the number of clusters, as shown in Figure 6.
Figure 6 shows that when the number of clusters is 8, the SC index is the highest and the DBI index is the lowest, and so the number of key electric vehicle load clusters is set to 8.
It is necessary to perform PCA on the clustering results of charging loads to determine key predictive indicators, as shown in Table 4.
PCA reveals that key features—date, category, time period, temperature, rainfall, and historical load—have a significant impact on the forecasting of EV charging loads, providing a basis for optimizing the forecast. This is because the attention mechanism first analyzes and evaluates the input data. It will calculate the importance weights for each time step or feature of the forecasting task based on the characteristics of and historical information about the data. The attention mechanism highlights these key factors, allowing the LSTM network to focus on processing, avoiding irrelevant information interference, accurately capturing the core factors affecting the charging load, and improving the quality of the input data.
The PCA results were fed into an improved LSTM to predict the hourly charging load of electric vehicles, as shown in Figure 7.
In order to further verify the effectiveness of the proposed method, the methods in reference [7,8] were selected as comparative methods, with the accuracy of daily charging load prediction as the evaluation index. The results obtained are shown in Figure 8.
Based on Figure 7 and Figure 8, this method accurately predicts the charging load of electric vehicles at different time periods and dates. The results strongly match the actual situation and this analysis verifies the method’s efficiency. This is due to the fact that the method proposed in this paper introduces an attention mechanism in the LSTM network structure, which enables the model to dynamically adjust the importance of inputs at different time steps during the prediction process. This helps the model to pay more attention to the time steps that have a significant impact on the prediction results, thus improving the accuracy of the prediction. Thus, improved LSTM can capture long-term dependencies and improve prediction performance.
In order to comprehensively evaluate the effectiveness of the proposed electric vehicle charging load prediction method based on an improved LSTM neural network, comparative experiments were conducted. The method proposed in this paper is used to compare the predicted results in the artificial transgender longicorn algorithm and the long short-term memory method with the actual values. The experimental results are shown in Figure 9.
As shown in Figure 9, the expected trends of all methods are basically consistent with the actual results, but the predicted results of our method are closer to the actual results. This is because the attention mechanism can dynamically assign weights according to the importance of the input data, which makes the model pay more attention to the time steps and features that have an important impact on the charging load in the prediction process. In EV charging load forecasting, different time points and factors have different impacts on the load. The method in this paper achieves better performance in EV charging load prediction, and the prediction results are closer to the actual values, providing a more effective solution for EV charging load prediction.

4. Conclusions

In this article, we overview the improvement of LSTM to enhance the accuracy of EV charging load prediction by utilizing its temporal processing advantages to capture long-term dependencies and cyclic patterns, to address new load challenges, and to integrate the effects of multiple factors. The LSTM network itself is designed to process time series data, and its internal structures (e.g., forgetting gates, input gates, and output gates) can capture long-term dependencies in the data. With improvements, its ability to process complex time series data can be further enhanced and the dynamics of charging load over time can be better modeled. The charging load of EVs has its unique characteristics. For example, the charging behavior is affected by various factors (e.g., weather, temperature, season, sleep, etc.) and exhibits a certain degree of periodicity and stochasticity. The improved LSTM network can more accurately simulate the variation pattern of the actual charging load by integrating multiple influencing factors and using them as input features. By introducing multiple input features, high prediction accuracy can be maintained, even in the case of data loss, noise interference, or anomalies, thus improving the robustness of the prediction results. The real-time performance of charging load prediction is crucial for power system scheduling and planning. The improved LSTM network can improve computational efficiency and meet the real-time requirements in practical applications by optimizing the algorithm structure and parameters while ensuring prediction accuracy. Highly accurate charging load prediction results can provide strong support for optimal scheduling and the planning of the power system. By accurately predicting the future charging demand, resource allocation and scheduling plans can be formulated in advance to ensure the stable operation and efficient utilization of the power grid.
In summary, the advantages of improving LSTM in electric vehicle charging load prediction mainly lie in its enhanced time series processing capability, its adaptability to new load types, its improved prediction robustness, its ability to meet real-time requirements, and its support for optimized scheduling and planning.

Author Contributions

Writing—original draft preparation, C.W.; conceptualization, C.W.; resources, C.W.; methodology, Y.W.; supervision, F.S.; writing—review and editing, F.S. and Y.W. All authors have read and agreed to the published version of the manuscript.

Funding

This research received no external funding.

Institutional Review Board Statement

Not applicable.

Informed Consent Statement

Not applicable.

Data Availability Statement

All datasets generated for this study are included within the article.

Conflicts of Interest

The author declares that there are no competing interests regarding the publication of this paper.

References

  1. Srihari, N.; Sanjeeb, M. Grid connected electric vehicle charging and discharging rate management with balance grid load. Electr. Eng. 2023, 105, 575–592. [Google Scholar]
  2. Gao, X.; Carne, G.D.; Andresen, M.; Bruske, S.; Liserre, M. Voltage-dependent load levelling approach by means of electric vehicle fast charging stations. IEEE Trans. Transp. Electrif. 2021, 7, 1099–1111. [Google Scholar] [CrossRef]
  3. Krol, A.; Sierpinski, G. Application of a genetic algorithm with a fuzzy objective function for optimized siting of electric vehicle charging devices in urban road networks. IEEE Trans. Intell. Transp. Syst. 2021, 23, 8680–8691. [Google Scholar] [CrossRef]
  4. Zishan, A.A.; Haji, M.M.; Ardakanian, O. Adaptive congestion control for electric vehicle charging in the smart grid. IEEE Trans. Smart Grid 2021, 12, 2439–2449. [Google Scholar] [CrossRef]
  5. Liikkanen, J.; Moilanen, S.; Kosonen, A.; Ruuskanen, V.; Ahola, J. Cost-effective optimization for electric vehicle charging in a prosumer household. Sol. Energy 2024, 267, 112122. [Google Scholar] [CrossRef]
  6. Zhang, M.; Zhang, D.R.; Xie, C.; Zeng, H.D. Bi-Level Programming Model of Electric Vehicle Charging Station Considering Road Network Structure. Comput. Simul. 2022, 39, 173–177. [Google Scholar]
  7. Arivalahan, R.; Balaji, S. An optimization framework for capacity allocation and energy management of fast electric vehicle charging stations-wind photovoltaic energy using artificial transgender longicorn algorithm. Int. J. Energy Res. 2022, 46, 14827–14844. [Google Scholar] [CrossRef]
  8. Unterluggauer, T.; Rauma, K.; Jrventausta, P.; Rehtanz, C. Short-term load forecasting at electric vehicle charging sites using a multivariate multi-step long short-term memory: A case study from Finland. IET Electr. Syst. Transp. 2021, 11, 405–419. [Google Scholar] [CrossRef]
  9. Mazzi, Y.; Sassi, H.B.; Gaga, A.; Errahimi, F. State of charge estimation of an electric vehicle’s battery using tiny neural network embedded on small microcontroller units. Int. J. Energy Res. 2022, 46, 8102–8119. [Google Scholar] [CrossRef]
  10. Arun, K.K.; Rao, S. A hybrid cooperative method with lévy flights for electric vehicle charge scheduling. IEEE Trans. Intell. Transp. Syst. 2022, 23, 14306–14321. [Google Scholar]
  11. Li, H.T.; Tang, M.N.; Mu, Y.F.; Wang, Y.H.; Yang, T.; Wang, H.J. Achieving accurate and balanced regional electric vehicle charging load forecasting with a dynamic road network: A case study of Lanzhou City. Appl. Intell. 2024, 54, 9230–9252. [Google Scholar] [CrossRef]
  12. Mekkaoui, D.E.; Midoun, M.A.; Shen, Y. LA-RCNN: Luong attention-recurrent-convolutional neural network for EV charging load prediction. Appl. Intell. 2024, 54, 4352–4369. [Google Scholar] [CrossRef]
  13. Tang, J.R.; Ge, G.H.; Liu, J.C.; Yang, H.H. A Novel Ultra Short-Term Load Forecasting Method for Regional Electric Vehicle Charging Load Using Charging Pile Usage Degree. Energy Eng. 2023, 120, 1107–1132. [Google Scholar] [CrossRef]
  14. Huang, X.S.; Wu, D.; Boulet, B. MetaProbformer for Charging Load Probabilistic Forecasting of Electric Vehicle Charging Stations. IEEE Trans. Intell. Transp. Syst. 2023, 24, 10445–10455. [Google Scholar] [CrossRef]
  15. Elghanam, E.; Hassan, M.; Osman, A.; Kabalan, H. Design and performance analysis of misalignment tolerant charging coils for wireless electric vehicle charging systems. World Electr. Veh. J. 2021, 12, 89. [Google Scholar] [CrossRef]
  16. Khezri, R.; Razmi, P.; Mahmoudi, A.; Bidram, A.; Khooban, M.H. Machine learning-based sizing of a renewable-battery system for grid-connected homes with fast-charging electric vehicle. IEEE Trans. Sustain. Energy 2023, 14, 837–848. [Google Scholar] [CrossRef]
  17. Dcruz, H.J.; Baskaran, K. A novel non-isolated three-port bidirectional dc-dc converter for off-grid solar powered charging for electric and hydrogen vehicle using stm32 microcontroller. Int. J. Heavy Veh. Syst. 2022, 29, 281–304. [Google Scholar] [CrossRef]
  18. Xia, F.; Chen, H.; Shahidehpour, M.; Gan, W.; Yan, M.; Chen, L. Distributed expansion planning of electric vehicle dynamic wireless charging system in coupled power-traffic networks. IEEE Trans. Smart Grid 2021, 12, 3326–3338. [Google Scholar] [CrossRef]
  19. Koundinya Sistla Pavan Venkat Sai, N.; Shivkumar, V.; Krishnan, N.; Sharma, G.; Senjyu, T. Voltage stability analysis of distribution systems in presence of electric vehicle charging stations with coordinated charging scheme. Int. Trans. Electr. Energy Syst. 2021, 31, e13248. [Google Scholar] [CrossRef]
  20. Madahi, S.S.K.; Nafisi, H.; Abyaneh, H.A.; Marzband, M. Co-optimization of energy losses and transformer operating costs based on smart charging algorithm for plug-in electric vehicle parking lots. IEEE Trans. Transp. Electrif. 2021, 7, 527–541. [Google Scholar] [CrossRef]
  21. Memarzadeh, G.; Keynia, F. Short-term electricity load and price forecasting by a new optimal lstm-nn based prediction algorithm. Electr. Power Syst. Res. 2021, 192, 106995. [Google Scholar] [CrossRef]
  22. Subbiah, S.; Chinnappan, J. Deep learning based short term load forecasting with hybrid feature selection. Electr. Power Syst. Res. 2022, 210, 108065. [Google Scholar] [CrossRef]
  23. Tajalli, S.Z.; Kavousi-Fard, A.; Mardaneh, M.; Khosravi, A.; Razavi-Far, R. Uncertainty-aware management of smart grids using cloud-based lstm-prediction interval. IEEE Trans. Cybern. 2021, 52, 9964–9977. [Google Scholar] [CrossRef] [PubMed]
  24. Serrano-Guerrero, X.; Marco Briceo-León Clairand, J.M.; Guillermo, E. A new interval prediction methodology for short-term electric load forecasting based on pattern recognition. Appl. Energy 2021, 297, 117173. [Google Scholar] [CrossRef]
Figure 1. Overall architecture of electric vehicle charging load prediction.
Wevj 16 00265 g001
Figure 2. Structure diagram of recurrent neural network.
Wevj 16 00265 g002
Figure 3. Memory unit structure of LSTM neural network.
Wevj 16 00265 g003
Figure 4. Charging structure diagram of charging station.
Wevj 16 00265 g004
Figure 5. Statistical results of charging load determination coefficient.
Wevj 16 00265 g005
Figure 6. Clustering performance with different numbers of clusters.
Wevj 16 00265 g006
Figure 7. Hourly charging load prediction results of electric vehicles.
Wevj 16 00265 g007
Figure 8. Prediction results of daily charging load for electric vehicles.
Wevj 16 00265 g008
Figure 9. Comparison of predicted results and actual values using different methods.
Wevj 16 00265 g009
Table 1. Lists the parameter settings for charging stations and charging stations.
Indicator NameResult
Input voltage 220 V
Output power5 KW
Frequency60 Hz
Permissible voltage fluctuation range±13%
Waterproof levelIP67
Voltage withstand2 kV
Insulation resistance 500 MΩ
Table 2. Historical sample of electric vehicle charging load.
Load Point NumberNumber of Time PeriodsTemperature/°CHistorical Load/kW
1315.11052.6
2214.81154.5
3412.51345.2
4213.51325.4
5314.51425.1
6413.61254.5
7511.81524.3
8212.61105.3
9113.41045.6
10315.11246.5
Table 3. Wilcoxon signed-rank test.
Error MetricNumerical Value
MAE1.42 kWh
MSE3.56 kWh2
Wilcoxon signed-rank test results0.0003
Table 4. Principal component analysis results.
NumberNameCharacteristic ValueContribution Rate/%Accumulated Contribution Rate/%
1Date of load point3.85446.5846.58
2Category of date2.16518.5565.13
3The time period to which the load point belongs1.28510.8575.98
4Load point temperature1.0548.5884.56
5Load point rainfall0.8547.6792.23
6Historical load0.6456.2598.48
Disclaimer/Publisher’s Note: The statements, opinions and data contained in all publications are solely those of the individual author(s) and contributor(s) and not of MDPI and/or the editor(s). MDPI and/or the editor(s) disclaim responsibility for any injury to people or property resulting from any ideas, methods, instructions or products referred to in the content.

