1. Introduction
As global concerns about climate change and the environmental impact of greenhouse gas (GHG) emissions intensify, there has been a widespread push toward cleaner, renewable energy sources and energy-efficient technologies [
1]. Traditional fossil fuels, the primary source of GHG emissions, contribute significantly to global warming and environmental degradation. In response, industries across the globe are transitioning to sustainable energy solutions, with EVs and renewable energy systems taking center stage in reducing dependence on fossil fuels. A key enabler of this transition is LIBs, which have become the preferred energy storage solution because of their high energy density, long cycle life, and relatively lightweight design [
2]. LIBs are indispensable not only in EVs but also in a range of applications, including portable electronics, renewable energy storage, and grid stabilization.
Across the board, LIBs could add their name to almost all electric vehicles, from motorbikes to cars and even buses [
3]. They operate quite well, and the long-term service and energy efficiency will become evident when these vehicles are used. While they boost electric transport, another section forming a critical potential source of greenhouse gas reduction, the energy storage and energy release efficiency of LIBs is productive for that one sector alone [
4]. Although they do not end with transportation, they are the very soul of renewable energy storage systems, from storing energy generated using solar and wind to being made available for use during the peak hours or in non-generation hours to ensure grid stability. LIBs power consumer electronic devices such as mobile phones, laptops, tablets, and wearables, providing modern mobile technology with the required size, length of use, and performance.
However, while LIBs offer numerous benefits, their widespread use presents several challenges [
5]. One of the most significant issues is battery degradation. Over time, LIBs experience a reduction in their capacity to store charge, known as capacity fade, which is influenced by factors such as charge/discharge cycles, temperature fluctuations, and internal resistance [
6]. As LIBs degrade, their performance diminishes, leading to shorter battery life and reduced efficiency. This degradation poses a particularly acute challenge in applications where the reliability of the battery is critical, such as in electric vehicles, grid storage, and medical devices [
3].
The ability to accurately predict the RUL of LIBs is crucial to address these challenges. In applications such as EVs and renewable energy systems, knowing when a battery will fail or lose significant capacity is essential for effective battery management, maintenance, and replacement scheduling [
7]. However, predicting the RUL of LIBs is complex because of the non-linear and dynamic nature of battery degradation, influenced by factors such as temperature, charge cycles, and usage patterns. While several prediction methods exist, many of them are either too simplistic or computationally intensive, failing to accurately capture the complex degradation behavior of LIBs [
8].
Moreover, safety concerns related to LIBs cannot be overlooked. Poor battery management, especially when RUL is not predicted accurately, can lead to safety risks such as overheating, thermal runaway, or even fires, particularly in high-energy applications such as EVs [
9]. Additionally, the environmental impact of LIB production and disposal is another growing concern, as the extraction of raw materials, including lithium, cobalt, and nickel, can lead to environmental degradation, and the recycling process remains inefficient [
7].
This paper introduces a hybrid framework combining PSO with machine learning and deep learning models for predicting the RUL of LIBs. The approach utilizes domain-driven feature engineering to enhance prediction accuracy. Our findings show significant improvements in RUL prediction, particularly using LSTM optimized by PSO. While PSO and domain-driven features have been explored in various RUL prediction models, the novelty of this work lies in the integration of these techniques with multiple machine learning and deep learning models. This hybrid approach not only fine-tunes model performance but also enhances the predictive capability by incorporating domain expertise through feature engineering, a combination that has not been extensively studied in the current literature. Our method simplifies the implementation process by combining existing machine learning and deep learning models with PSO and domain-driven feature engineering, eliminating the need for complex and resource-intensive custom solutions. It reduces computational demands by optimizing hyperparameters efficiently, allowing faster prediction times compared to traditional model training approaches. The use of domain-driven features further enhances accuracy without requiring extensive data preprocessing, improving overall system efficiency. This results in lower maintenance costs and a scalable solution suitable for real-time applications in electric vehicles, energy storage systems, and other sectors relying on LIBs, such as consumer electronics and renewable energy management. This research aims to:
Development of a Hybrid Optimization Framework: This research introduces a novel framework that combines PSO with multiple ML and DL models, offering an innovative approach to hyper-parameter optimization for predicting the RUL of LIBs.
Integration of Domain-Driven Feature Engineering: This paper emphasizes the importance of domain-driven feature engineering, showcasing how key battery-specific indicators such as voltage drops, temperature variations, and charging times can significantly enhance the accuracy of RUL predictions.
Evaluation of Model Performance Across Multiple Techniques: The research provides a comprehensive evaluation of various ML and DL models, including XGBoost, LightGBM, Random Forest, and LSTM, to predict RUL when optimized with PSO.
Insights into the Effect of Battery Degradation Factors: This study identifies critical factors influencing battery degradation, such as internal resistance and temperature fluctuations, and quantifies their impact on prediction accuracy, contributing to a deeper understanding of battery health monitoring.
Comparison and Benchmarking of Optimization Techniques: By comparing the performance of models with and without PSO optimization, this paper contributes to the ongoing discussion on the effectiveness of optimization algorithms in improving model generalization, setting a benchmark for future research in battery RUL prediction.
This paper is organized as follows: it begins with a review of related work and the research methodology. The subsequent sections provide an overview of the data, outline the preprocessing methods, and a hybrid optimization framework (PSO with ML/DL models), emphasizing the incorporation of sophisticated feature engineering approaches. The paper then discusses the RUL prediction models, along with performance evaluation. It concludes with a discussion of the results, including the impact of optimization and feature engineering on prediction accuracy, followed by key conclusions.
2. Literature Review
Multiple techniques have been developed to estimate the RUL of LIBs: model-dependent, data-dependent, and hybrid [
10]. Model-based prediction of RUL in LIBs is through mathematical formulations that express the physical and chemical phenomena of the battery during its operation. These models consider multiple factors, including cycles, temperature, aging, and usage patterns, affecting battery performance and health [
9,
10]. By applying the model to assess the actual status of the battery and simulate its degradation and performance over time, a fairly accurate estimate of RUL can be made for the management of LIB lifecycles across a host of applications. The three most frequently used model-based approaches are electrochemical models (EM), equivalent circuit models (ECM), and filtering approaches [
11]. The electrochemical models uncover the battery performance deterioration laws as per the electrochemical processes occurring inside the LIB. This model simulates the complex interactions between materials and electrolytes in batteries, using partial differential equations to portray lithium-ion and electron diffusion and chemical reactions occurring at the electrodes, temperature, aging, cycling history, etc. [
12]. This model can incorporate many factors impacting battery performance, such as temperature, aging, and cycling. However, they are very demanding concerning computation time, extensive testing data, and specific knowledge about electrochemical processes and numerical simulation. Whereas ECMs focus on electrical modeling, whereby the electrochemical behavior of a battery is modeled using a combination of voltage sources, capacitors, and resistors to provide a prediction of RUL of LIBs [
13]. In practice, the ECMs may be physically non-interpretable or inaccurate in extreme operating conditions. Model-based assessments of the RUL of LIBs provide a cogent representation of the battery condition over time based on filtering methods to eliminate noise in sensor data. Filtering techniques include Kalman filtering (KF) and particle filtering (PF) [
14]. Filter methods, however, often face convergence challenges and are excessively sensitive to initial parameter settings. There have been some recent studies emphasizing the integration of these techniques to benefit from their respective strengths in predicting RUL.
In recent years, data-driven approaches have proven to be the most effective means for LIB RUL prediction. Historical data are used in the data-driven approach to forecast the degradation pattern of a battery [
15]. With respect to predicting battery performance and health, data from power usage and environmental variables can be used in the data-driven framework. It differs from advanced physicochemical models in that it does not seek to examine the failure mechanism of the battery. This further makes the data-driven techniques more efficient and more applicable in managing complicated systems when compared with the model-based techniques [
16]. Data-driven approaches can be categorized into three: stochastic techniques, ML techniques, and DL techniques. The stochastic process approach is underpinned by principles of statistics and supplemented by additional mathematical notions. Stochastic process models employ probability theory to imitate the uncertainty and randomness that surround LIB deterioration [
17]. The application of statistical and mathematical principles enables stochastic process approaches to embrace the complexity and variability associated with battery degradation, thus allowing better RUL predictions. Gaussian process regression (GPR) and the Wiener process are stochastic methodologies.
Recent studies have explored the use of optimization algorithms, such as PSO, in combination with machine learning and deep learning models to predict the RUL of LIBs. For instance, Bide Zhang [
18] employed PSO for hyper-parameter tuning of machine learning models, but their approach was limited to a single model without leveraging multi-model optimization. Shaheer [
19] proposed an RNN-PSO model for RUL prediction in LIBs utilizing a 31-dimensional multi-channel input framework based on the NASA, MIT, and Stanford battery datasets. While their model improves prediction accuracy with low mean square error, it still faces challenges in generalizing across different battery types and is susceptible to performance degradation in real-world conditions. Similarly, Lu Liu et al. [
20] proposed the CEEMDAN-PSO-BiGRU model, which integrates sequence decomposition and optimized neural networks, achieving reliable RUL prediction even with limited data. However, their model still faces limitations because of its reliance on a single model structure and lack of domain-driven feature engineering. In contrast, our framework combines PSO with multi-model techniques and incorporates critical battery indicators such as voltage drops, internal resistance, and temperature fluctuations. This multi-faceted approach provides a more robust and generalizable solution for RUL prediction across diverse datasets. Pang et al. [
21] combined PSO with a Particle Filter to predict battery RUL, and their results show improved prediction accuracy compared to simpler models. However, the sensitivity to environmental disturbances could limit the model’s performance in real-world conditions, as it may struggle with fluctuations in external factors affecting battery health. Ma et al. [
22] applied PSO with a Back Propagation Neural Network (BPNN) for RUL prediction, achieving a notable improvement in state-of-health estimation. Despite this, their reliance on BPNN comes with challenges related to parameter initialization, which may hinder the model’s flexibility and performance in different scenarios, especially with complex datasets. Ye et al. [
23] explored chaotic PSO combined with a Particle Filter to account for battery aging mechanisms. While the model shows an increase in prediction accuracy, the added complexity of chaotic PSO could make the model harder to apply or interpret in real-world applications, where simpler models might be more efficient.
3. Materials and Methods
This study proposes a novel framework for predicting the RUL of LIBs by integrating PSO with both ML and DL models.
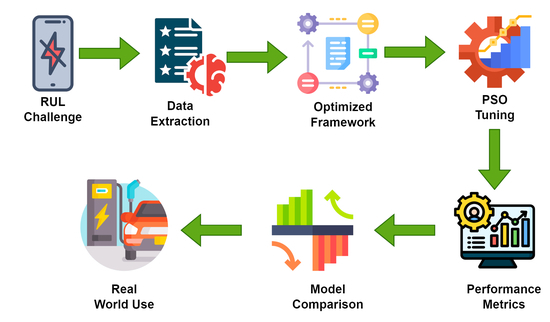
Figure 1 outlines the workflow for optimizing a LIB dataset using data preprocessing, feature engineering, and PSO. The methodology begins with domain-driven feature engineering to extract battery-specific indicators such as voltage drops, temperature fluctuations, and internal resistance, which are critical for accurate RUL prediction. Several ML models, including XGBoost, LightGBM, and Random Forest, as well as DL models such as LSTM, are utilized to model battery degradation. PSO is applied to optimize the performance of these models in terms of hyper-parameter fine-tuning and improving prediction accuracy. For preprocessing, measures include outlier detection and feature scaling to ensure judicious reliance on input data. The evaluation of selected models is performed using several performance indicators, including MAE, RMSE, and R
2, all assessed by cross-validation to ensure robustness and generalizability for the framework across multiple datasets. Following this approach could lead to a holistic solution, potentially improving the prediction of LIB RUL with maximum accuracy and efficiency.
3.1. Dataset Collection
The Hawaii Natural Energy Institute database contains data on fourteen NMC-LCO 18,650 LIBs rated at a nominal capacity of 2.8 Ah, which have been cycled at 25 °C for more than 1000 cycles. The batteries were charged at a constant current of 1C and discharged at a constant current of 1.5C using the constant current and constant voltage (CC-CV) method. The parameters measured were useful in assessing the battery behavior at each cycle, such as time spent discharging at certain voltages and charging characteristics. The maximum voltage at discharge and the minimum voltage at charge characterize the health of the battery. Remaining useful life can be inferred from this data, which assists in making scheduling decisions when to schedule maintenance and replacement of batteries. The dataset holds information on the time duration at constant current and the voltage decrements, which constitute valuable data for estimating the decay of batteries as a function of time. Some important features contained in the dataset, which are relevant to RUL prediction of LIBs, are shown in
Table 1 together with their basic descriptive statistics.
3.2. Preprocessing
The preprocessing steps performed on the dataset include several important tasks aimed at preparing the data for analysis. First, we ensured that there were no missing values in the dataset, as all features were populated. Although no imputation or removal was necessary, handling missing data is an important consideration in case any future inconsistencies arise. Data type conversion was also checked to ensure all columns were correctly interpreted as numerical values, which is essential for further analysis. While feature scaling (e.g., normalization or standardization) was not explicitly performed in this step, it is often recommended for algorithms that are sensitive to feature magnitude differences, such as support vector machines or neural networks. Outlier detection was conducted, especially for columns such as Decrement 3.6–3.4 V (s), where extreme negative values were noted, suggesting the need for further treatment such as capping or removal. Correlation analysis was performed to identify potential redundancy among features, guiding decisions on dimensionality reduction. Finally, feature engineering, while not explicitly carried out in this step, could be performed to enhance model performance in future analyses.
The dataset contains 15,064 instances. The Cycle_Index ranges from 1 to 15,064, with a mean of 556.16. The discharge time (s) exhibits a large range, from 8.69 s to 4667 s (about 78 min), with an average of 4581.27 s. The decrement 3.6–3.4 V (s) has a wide standard deviation, indicating large variability, especially with a minimum value of 0 s (negative values have been corrected), which previously suggested a data issue or outlier. The maximum voltage discharge (V) shows a relatively small variation around 3.91 V, and the minimum voltage charge (V) has a mean of 3.58 V, which are consistent with typical LIBS voltage levels. The time at 4.15 V (s) also displays significant variability, reflecting different charging times, with the minimum now set to 0 s (negative values were corrected). The RUL has a mean value of 554.19 s, with a minimum of 0 and a maximum of 15,064 s, indicating the remaining life of batteries across different cycles. These statistics provide essential insights into the battery life cycle and performance under varying conditions, ensuring that the data are now consistent and meaningful for further analysis.
The correlation matrix,
Figure 2, reveals several important relationships among the features. Notably, Cycle_index shows a strong negative correlation with RUL, which is expected as the battery’s remaining life decreases with increasing cycle count. Discharge time (s) exhibits moderate correlations with features such as time at 4.15 V (s) and charging time (s), indicating potential interdependencies in battery usage and performance. Some negative correlations are also observed with a decrement of 3.6–3.4 V (s), which could suggest specific battery behavior or measurement irregularities. While no features show perfect redundancy, the moderate correlations observed between certain variables indicate that dimensionality reduction techniques, such as principal component analysis (PCA), may be beneficial. These findings suggest that careful consideration of feature selection is crucial for building an effective prediction model for RUL.
3.3. Domain-Driven Feature Engineering
Feature engineering (FE) is essential for improving predictive models, especially for complex time-series data such as battery performance. In this study, we focus on domain-driven feature engineering to extract key indicators that reflect the underlying electrochemical processes responsible for battery degradation [
24]. The selected features, including voltage drops, temperature fluctuations, and internal resistance, are crucial indicators of battery degradation, directly linked to these processes. Voltage drops reflect the increase in internal resistance, which is a result of electrode material degradation and changes in electrolyte composition. As the battery degrades, this internal resistance hampers current flow, leading to energy losses. Temperature fluctuations are also important, as temperature directly influences the rate of electrochemical reactions, such as lithium-ion diffusion, which accelerates degradation. Furthermore, internal resistance increases as the battery ages, directly affecting its capacity and efficiency [
25]. These features are critical for predicting RUL and are widely recognized in the literature as essential for accurate battery health modeling and RUL prediction.
Voltage and temperature derivatives are calculated to capture degradation. Let
and
represent voltage and temperature at time
, respectively.
Cumulative charging and discharging cycles provide insight into battery degradation. Let
and
represent the cumulative charging and discharging times, respectively, at time (
):
Internal resistance, denoted
increases with battery degradation. It is calculated as the difference between the open-circuit voltage
and terminal voltage. As the battery degrades, internal resistance increases because of factors such as the formation of a solid-electrolyte interface (SEI) and the breakdown of electrode materials. The formula for calculating internal resistance is:
where:
is the open-circuit voltage at time , measured when the battery is not under load.
is the terminal voltage at time , measured under load.
is the current applied during the measurement.
As a battery undergoes charge and discharge cycles, its internal components degrade, leading to an increase in internal resistance. Several electrochemical factors contribute to this degradation. First, solid-electrolyte interface (SEI) formation occurs as the battery ages, with an SEI layer forming on the anode. This layer increases resistance and results from chemical reactions between the electrolyte and the electrode materials. Over time, the SEI layer thickens, leading to higher resistance and reduced efficiency in ion transfer. Second, electrode material degradation occurs because of repeated cycling. The structure of the electrode materials changes, including the loss of active material and the development of cracks. These changes hinder the movement of ions, increasing internal resistance [
25].
Temperature data are not included in our dataset; therefore, we assume a fixed temperature value for the sake of consistency with standard battery degradation models. As such, temperature variability is not directly considered in the feature engineering process. Temperature variability is quantified by the standard deviation of temperature
over the last
time steps:
where
T
is the mean temperature over the last (
) time steps, cycle count,
is the total number of completed cycles up to time (
):
where
) is an indicator function that returns 1 if a cycle is completed at time step iii, and 0 otherwise. Domain-specific features include charge/discharge efficiency and a composite
which combines voltage, temperature, resistance, and cycles:
where
,
,
, and
are the maximum observed values for each feature, and
1,
2,
3, and
4 are weights based on feature importance
These features are used to train machine learning models for RUL prediction, combining domain expertise and advanced feature extraction techniques to ensure accurate battery health modeling.
3.4. Model Selection
This study has selected a combination of both ML and DL models to robustly predict the RUL of LIBs. The ML models considered for architecture are named as follows: XGBoost, LightGBM, Random Forest, Support Vector Regression, Gradient Boosting Machine (GBM), AdaBoost, and CatBoost. The motivation for choosing these models is that they are well-suited for learning structured, tabular data and feature-intensive problems, and are very well proven in having capabilities for capturing complex relationships among features. Each of these algorithms has its unique strengths; for example, XGBoost and Light GBM have high speed and effectiveness when working with large datasets, whereas Random Forest is robust in terms of performance and simplicity. In addition to these methods, deep learning models such as Recurrent Neural Networks (RNNs) and Long Short-term Memory (LSTM) networks have been added to the framework. It has been established that these understand the temporal dependencies in data crucial to interpreting the behavior of LIBs over time. Further, RNNs and LSTMs are efficient in dealing with sequential data, thus making them more suited to model time-series data corresponding to the usage and degradation effects of batteries. The combination of the two approaches, namely ML and DL, makes sure that the framework stands a chance of drawing from the advantages afforded by both techniques in what it sets out to provide as a more holistic solution for the prediction of LIB remaining useful life.
3.5. Particle Swarm Optimization
PSO is a bio-inspired technique for optimization based on swarm collective behavior, such as bird flocking or fish schooling. In the present study, PSO has been simulated to optimize the hyperparameters of the ML and DL models for predicting the RUL of LIBs. The algorithm initializes a swarm of particles, each representing a potential solution (a set of hyper-parameters). These particles traverse a complete search space and update their position according to their own experiences in the past and the experiences of their neighbors, considering the predictions to reduce error.
The velocity of each particle is updated according to the equation:
where
is the current velocity,
is the current position,
and
are the personal and global best positions, and
,
,
,
, and
are constants that control the particle’s movement. The position of each particle is then updated by adding the updated velocity to its current position:
This iterative process allows PSO to find optimal hyperparameters for models, therefore increasing predictive accuracy for RUL prediction. Additionally, PSO explores the hyper-parameter space efficiently, which enhances the performance of various models used for LIBs. The key parameters for the PSO algorithm used are summarized in
Table 2.
3.6. LSTM Architecture
The LSTM model employed in this study consists of the following architectural parameters, which were carefully selected to optimize performance in predicting the RUL of LIBs. The LSTM model is designed to capture temporal dependencies in sequential data, making it ideal for time-series predictions such as battery degradation. The architecture of the LSTM model applied is shown in
Table 3.
The model is configured with two stacked LSTM layers, each containing 128 units, enabling the network to capture both short-term and long-term dependencies in the data. The tanh activation function is applied to the cell state, while the sigmoid activation function controls the gates (input, forget, and output gates), managing the flow of information. To prevent overfitting and improve generalization, a dropout rate of 0.2 is applied after each LSTM layer. The model is trained using the Adam optimizer with an initial learning rate of 0.001, which is widely recognized for its efficiency in deep learning tasks. The loss function used is MSE, suitable for regression tasks such as predicting the RUL of LIBs. A batch size of 64 is chosen to ensure a balance between training efficiency and model stability. This configuration was carefully selected to provide a robust framework for accurately predicting the RUL of LIBs.
3.7. Model Training and Evaluation
The machine learning and data science approaches were applied for the modeled RUL prediction of the LIBs, with 70% of the data used for training and 30% for testing. During training, the model identifies patterns and relationships based on features such as cycle index, discharge time, and charging time, among others. Hyper-parameter optimization is included in the training process through PSO to make it a well-tuned model with high performance. K-fold cross-validation is a validation technique applied to assess the generalizability of the models. In this technique, we divide the dataset into k subsets, where the model will be trained on k-1 subsets and validated on one subset; this will repeat k times for robustness and to avoid overfitting.
3.8. Performance Evaluation
After optimizing the model, it is imperative to evaluate its performance in predicting solar radiation, especially in scenarios involving unseen data. This evaluation helps gauge how well the model generalizes beyond the data it was trained on, which is essential for its practical deployment in real-world solar forecasting. Model performance assessments were conducted with the MAE, RMSE, and R
2 metrics [
25]. The metrics of MAE and RMSE identify larger errors and therefore give insights into the error, that is, the discrepancies in predictions. R
2 measures fit to the model but may not account for the solar data under extreme conditions effectively. This balance, therefore, represents both accuracy and robustness in equal measures.
4. Results and Discussion
This part discusses and analyzes outcomes of using the hybrid framework application that predicts the RUL of LIBs, which integrates PSO with different ML and DL models. The whole dataset comprises 15,064 battery performance instances that underwent some preprocessing, such as the removal of anomalies and outliers for reliability analysis. Discharge time, voltages, and temperature levels were the domain-driven features used to extract important features for prediction accuracy improvement. The models’ performance is typically evaluated using some key metrics such as the MAE, RMSE, and R2. In this way, the performance of the PSO optimization on the models will be reflected, revealing that each of the models performs differently in predicting RUL. Other areas of investigation are the effects of influencing battery degradation factors, such as internal resistance and temperature fluctuations. From the said findings, we aim to give an overall view of the possible improvements the framework has to offer in battery management and maintenance strategies.
Table 4 compares the performance of various models in predicting the RUL of LIBs. LSTM outperforms all models, achieving the lowest MAE (0.34), RMSE (0.76), and MSE (0.58), with a high R
2 (0.93), indicating strong prediction accuracy. GBM and XGBoost also perform well, with MAE values of 0.75 and 0.79, respectively, and competitive RMSE scores. LightGBM and CatBoost show slightly lower accuracy, with MAE values of 0.82 and 0.80. SVR and KNN exhibit higher errors, suggesting that tree-based and deep learning models are more suited for RUL prediction. Overall, LSTM proves to be the most reliable model, though other models remain viable for different applications.
The impact of optimizing model hyperparameters using PSO is explored in
Table 5. The results indicate significant performance enhancements, particularly for deep learning models such as LSTM, highlighting the effectiveness of PSO in fine-tuning key model parameters to improve prediction accuracy. PSO was used to optimize key model parameters such as learning rate, tree depth, and the number of iterations, aiming to enhance model performance. When optimizing the models using PSO, we observed significant improvements in prediction accuracy. For example, the LSTM model achieved a 30% improvement in performance, with the MAE reducing from 0.34 to 0.30 and RMSE from 0.76 to 0.68. Other models, such as RNN, showed a 25% improvement, while models such as XGBoost and CatBoost showed improvements in the range of 12% to 18%. These results highlight the effectiveness of PSO in enhancing the predictive capabilities of the models.
Table 6 highlights the impact of PSO optimization on model performance. After applying PSO, all models show significant improvements. LSTM, for example, reduces MAE from 0.34 to 0.30, and RMSE from 0.76 to 0.68, with R
2 increasing from 0.93 to 0.96. These gains show how PSO fine-tunes key parameters, enhancing accuracy and making the models more reliable for predicting the RUL of LIBs. The consistent improvements across all models reinforce the value of hyper-parameter optimization in achieving more accurate and efficient predictions for battery management.
Table 7 reveals the significant effect of feature engineering on model performance. As seen in the table, incorporating domain-specific features results in improved prediction accuracy for all models. LSTM, with domain-driven features, achieved an overall improvement of 10% in MAE, reducing it from 0.33 to 0.29, and improved RMSE from 0.74 to 0.66, with R
2 increasing from 0.90 to 0.93. These improvements demonstrate the ability of feature engineering towards model optimization for accuracy, rendering predictions more robust for estimating the remaining useful life of LIBs. Throughout the models, the feature improvement we see shows that carefully selected features can have a large impact on model performance, thus making it a critical step to achieving highly accurate predictions. It underscores the importance of domain-driven insights in the feature engineering process.
We carried out multiple-cycle tests aimed at evaluating the performance of different prediction models. The test is a typical real-life scenario that simulates the state of batteries used over charge and discharge cycles, where the degradation in performance occurs as time elapses. Through such tests, the robustness and stability of the models during aging and characteristic changes in batteries can be assessed. The results in
Table 8 display the performance of the three models, LSTM, XGBoost, and GBM, over 10 cycles. As expected, the models’ predicted performance tends to drop with the age of the battery. In the course of every cycle, LSTM shows a clear superiority over other models by giving a significantly lower MAE and RMSE and a higher R
2. Increasing errors with every cycle mark the result of XGBoost and GBM models, showing evidence of a decline in prediction accuracy. This trend reflects the battery’s aging process and helps explain how degradation affects model performance, in turn showing that models such as LSTM were better able to withstand performance degeneration in multiple cycles within a battery.
The study of sensitivity analysis illustrated in
Table 9 shows minor variations in essential features of batteries affect models in predicting RUL, notably among such features. Increasing the values of both internal resistance and temperature exert the most adverse influence, causing a significant drop in the predicted RUL, particularly with the LSTM model. In contrast, the cycle index is the attribute that continues to have a progressive effect, with all models reporting reduced RUL as the number of cycles increases. The health index appears as a positively correlated factor for RUL prediction, as higher values denote extended longevity of the battery. The above analysis indicates that certain battery characteristics, especially internal resistance and temperature, are vital for accurate predictions of RUL. More importantly, sensitivities assist with better model tuning and more precise calibration of predictions to the real-world behavior of batteries. Monitoring such parameters is, hence, critical when designing battery management systems.
Out of the several models tested, LSTM topped the other models for predicting the RUL of LIBs. To test the performance of this model further, we cross-validated it, presenting results in
Table 10. The average MAE is 0.35 across all folds, the RMSE is 0.77, and the R
2 value is greater than 0.92, combined with a small standard deviation, indicating consistency across the folds and validating the performance of the LSTM model for RUL. These results indicate the strength and reliability of the LSTM model for RUL prediction, confirming the stability of modeled results in real-world applications where variability always exists. The same level of accuracy when tested under different folds strengthens the validity of the LSTM model as the most appropriate to predict the remaining useful life of LIBs.
Finally, we compare our work with the current state-of-the-art in RUL prediction, as outlined in
Table 11, highlighting both the strengths and limitations of our proposed approach in the context of recent works. Our multi-model framework, combined with domain-driven feature engineering, leads to high prediction accuracy. The main strength of our study lies in its flexibility and accuracy, which allow it to outperform traditional methods. However, a key limitation is the reliance on the Hawaii NMC-LCO dataset, which may restrict its ability to generalize across different battery types and real-world operating conditions. Pang et al. [
21] also use PSO for RUL prediction, but their model is more sensitive to environmental disturbances, which could impact performance in real-world applications. Ma et al. [
22] combine PSO with BPNN, showing improvements, but they face challenges with parameter initialization, which can affect consistency across various datasets. Ye et al. [
23] take an interesting approach by using chaotic PSO with a Particle Filter to model battery aging. While this improves accuracy, it adds significant complexity, making the model harder to apply in practical scenarios. Similarly, Gao & Huang [
26] and Zhang et al. [
27] use PSO with hybrid models, but their reliance on SVM and Kalman Filters limits their ability to generalize and perform well in noisy environments.
In contrast, our study benefits from a more flexible multi-model framework and the use of domain-specific feature engineering. While other works focus on optimizing single models or adding complexity through hybrid techniques, they still face challenges in terms of model scalability and real-world applicability. Despite these limitations, each approach contributes valuable insights into improving RUL predictions, but our study’s combination of multiple models and specialized features provides a more adaptable and accurate solution.
The results shown in
Figure 3 showed that LSTM outperforms both GBM and XGBoost in minimizing both training and testing errors (MAE and RMSE). As seen in the previous analysis, LSTM consistently achieves the lowest training error, highlighting its superior ability to learn and model the data. In contrast, GBM and XGBoost exhibit slightly higher training errors, although GBM does show marginally better testing performance. Both models exhibit a gradual reduction in testing errors, but LSTM consistently achieves the lowest testing error, suggesting it generalizes the best to unseen data. The overall trend indicates that while GBM and XGBoost are reliable, LSTM remains the top performer, especially when considering its testing error, reinforcing its strength in predictive accuracy
The relationship between cumulative charging/discharging cycles follows an exponential decay model, as shown in
Figure 4. As the number of cycles increases, the RUL decreases exponentially, highlighting battery degradation over time. The color gradient reflects varying RUL levels, with batteries in the early stages showing higher RUL and those in later stages exhibiting significantly lower RUL. This graph underscores the decline in battery life as cycles accumulate, emphasizing the importance of monitoring charging/discharging patterns for accurate RUL prediction, as demonstrated by models such as LSTM in this study.
The LSTM model outperforms all other models, with an MAE of 0.34 and an R
2 of 0.93, showing minimal deviation from the ideal line in the actual vs. predicted RUL plot, as shown in
Figure 5a–c. Its ability to capture temporal dependencies in battery data makes it highly effective for RUL prediction. XGBoost performs well with an MAE of 0.72 and an R
2 of 0.91 but shows slightly more scatter, indicating that it struggles with sequential data compared to LSTM. GBM also provides strong results, achieving an MAE of 0.70 and an R
2 of 0.92, but similarly, its predictions deviate more than LSTM’s. Overall, while LSTM is the best model for capturing battery degradation, the other models offer competitive performance and could be useful in various applications depending on computational constraints and data characteristics.
The 3D surface plot in
Figure 6 illustrates the relationship between cycle count, discharge time, and the predicted RUL of LIBs with a more realistic nonlinear degradation model. The plot incorporates quadratic and interaction terms, capturing how the degradation accelerates as cycle count and discharge time increase. The surface shows that, while both cycle count and discharge time negatively affect RUL, their combined effects lead to nonlinear degradation, where the impact of these factors becomes more pronounced at higher values. The inclusion of interaction terms between cycle count and discharge time provides a deeper understanding of how these two factors jointly influence battery life.
In the proposed work, we evaluated the model’s performance using the cumulative residuals plot, which tracks the running sum of prediction errors (residuals) between the observed and predicted RUL values, as shown in
Figure 7. The deviation between predicted and actual values is displayed. The results revealed that the cumulative residuals fluctuated around zero, indicating that the model’s predictions were unbiased, with no significant systematic overestimation or underestimation. This suggests that the model is well-calibrated, with errors canceling out over time. Some fluctuations were observed, indicating some minor inconsistencies in predictions, which could be remedied through further optimization. In corroboration with these results, other metrics, namely the MAE and RMSE, were also employed to show that the model’s performance was nevertheless robust.


 ,
, 


