Article

Study on Frequency-Response Optimization of Electric Vehicle Participation in Energy Storage Considering the Strong Uncertainty Model

1
Department of Electrical Engineering, Chongqing Three Gorges University, Chongqing 404000, China
2
Research and Development Department, Chongqing Andaocheng Automotive Technology Co., Ltd., Chongqing 404100, China
*
Author to whom correspondence should be addressed.
World Electr. Veh. J. 2025, 16(1), 35; https://doi.org/10.3390/wevj16010035
Submission received: 5 December 2024 / Revised: 7 January 2025 / Accepted: 8 January 2025 / Published: 11 January 2025

Abstract

:
Due to numerous distributed power sources connecting to the grid, which results in strong grid volatility and diminished power quality, the traditional energy storage configuration is limited in terms of flexibility and economy. Based on this, integrating electric vehicles (EVs) into the distribution network as energy storage devices has emerged as a promising development direction. This paper proposes a frequency-response optimization study considering the strong uncertainty model of EVs. First, from the perspective of temporal-spatial characteristics, energy storage resources, and users’ willingness to respond, the strong uncertainty model of EVs is constructed by fitting the trip chain and the access probability of their participation in energy storage. Second, the frequency optimization model is integrated and constructed according to the response capability of a single EV. Finally, examples and scenarios are analyzed to verify that the maximum and minimum frequency offsets are reduced by 69.41% and 66.69%, respectively, which significantly reduces frequency fluctuations and stabilizes the output of EV clusters.

1. Introduction

Electric vehicle (EV) ownership is increasing quickly in the context of the clean and low-carbon transformation of the global energy structure. Meanwhile, as distributed energy storage resources, EV clusters are increasingly plentiful. EV clusters that rely on vehicle-to-grid technology can store additional electricity from the grid and deliver frequency management services to enhance the quality of the grid’s power supply [1]. The characteristics with which EVs interact with the power grid to cut peaks, fill valleys, reduce carbon emissions, and save energy have been gradually enhanced [2]. Nonetheless, there are significant uncertainties in temporal-spatial characteristics, energy storage resources, and demand responses for EVs in the face of production operations and emergencies. The production operations of EV users encompass the mobility and economic activities in which EVs participate. For instance, users who work during the week and go to scenic locations on the weekends reflect completely different EV travel and charging times. Furthermore, EV users may abruptly alter their travel plans and charging intentions due to unforeseen circumstances like receiving abrupt instructions to return to the company for overtime on rest days, experiencing traffic jams while traveling, and stores suspending operations and opting to go home. Consequently, in the face of these significant uncertainties, the problem of how to transform individual uncertainty into group regularity, so that EVs can participate in improving the quality of the grid’s power supply and reduce frequency fluctuations after connecting to the grid, still needs to be optimized.
Regarding EV scheduling technology, the current literature concentrates on the evaluation of the frequency-response capability [3] and the EV cluster model [4,5]. The primary issue that needs to be addressed is how to categorize and combine EVs. An EV equivalent circuit model was constructed to participate in the simultaneous optimization of power grid frequency by various power production systems by assessing the load characteristics of EV batteries [6,7]. The authors of [8] classified EV clusters based on vehicle types and developed models to participate in the V2G dispatching of power grids, but the approach did not cover all vehicle types. Despite the fact that the approach enabled easier modeling of the available capacity of EVs, it glossed over how EV users’ travel times, locations, and traffic conditions vary over time. The charging time for multiple EVs was probabilistically modeled by implementing a functional formula based on users’ driving characteristics [9]. The integration of EV power at different times helped the system adjust to the varying needs of users for charging. But before allocating it, this categorization system had to collate user demand feedback. None of the above approaches take into account the flexibility of user requirements and responses. In addition, the regulated power’s upper and lower bounds are set by the EV’s frequency-response capability. The queuing network was utilized to gather real-time vehicle status information for EV charging and discharging capacity calculations [10]. The Monte Carlo method was employed to model the trip behavior of EVs, compute the state of charge (SOC) at different EV periods, and ascertain whether EVs could be deployed as energy storage [11,12]. Nevertheless, these methods had low real evaluation accuracy due to the vast number of parameter assumptions required. The authors of [13] trained a historical database using a cloud storage system to analyze and evaluate the frequency-response capability of EV clusters. However, the authenticity of the predicted data after training cannot be guaranteed.
Sag control is a regularly employed technique in frequency optimization in current investigations. Without making allowances for the unpredictability of EV power, the authors of [14] assumed a constant sag coefficient to modify EV frequency response consistently. The authors of [15] selected the segment sag coefficient for EV charging and discharging states and assigned different values across distinct intervals, which did not take response flexibility into account. With respect to EV charging and discharging demand and real-time input, ref. [16] adaptively modulated the sag power optimized for EV frequency. Nevertheless, the predicted value of the SOC cannot be directly amended.
Based on this, regarding the issue of EVs joining the power grid as a new energy storage resource to participate in frequency regulation, this paper innovates the EV strong uncertainty model and frequency optimization strategy, aiming to improve EV response flexibility more accurately and ensure power grid stability. This paper adds the user’s willingness to respond while combining the spatiotemporal aspects of EVs with the load characteristics to incorporate the EV strong uncertainty model. Moreover, a control strategy for frequency optimization with EVs’ strong uncertainties is proposed. To improve the probability model’s accuracy, the strategy classifies EV clusters based on their trip-chain characteristics. It then performs power distribution by flexibly adjusting the sag coefficient based on the statistical access probability, confirming the effectiveness of EV participation in energy storage in reducing power grid frequency fluctuations and stabilizing the output.

2. Strong Uncertainty Model

2.1. Strong Uncertainty Factors

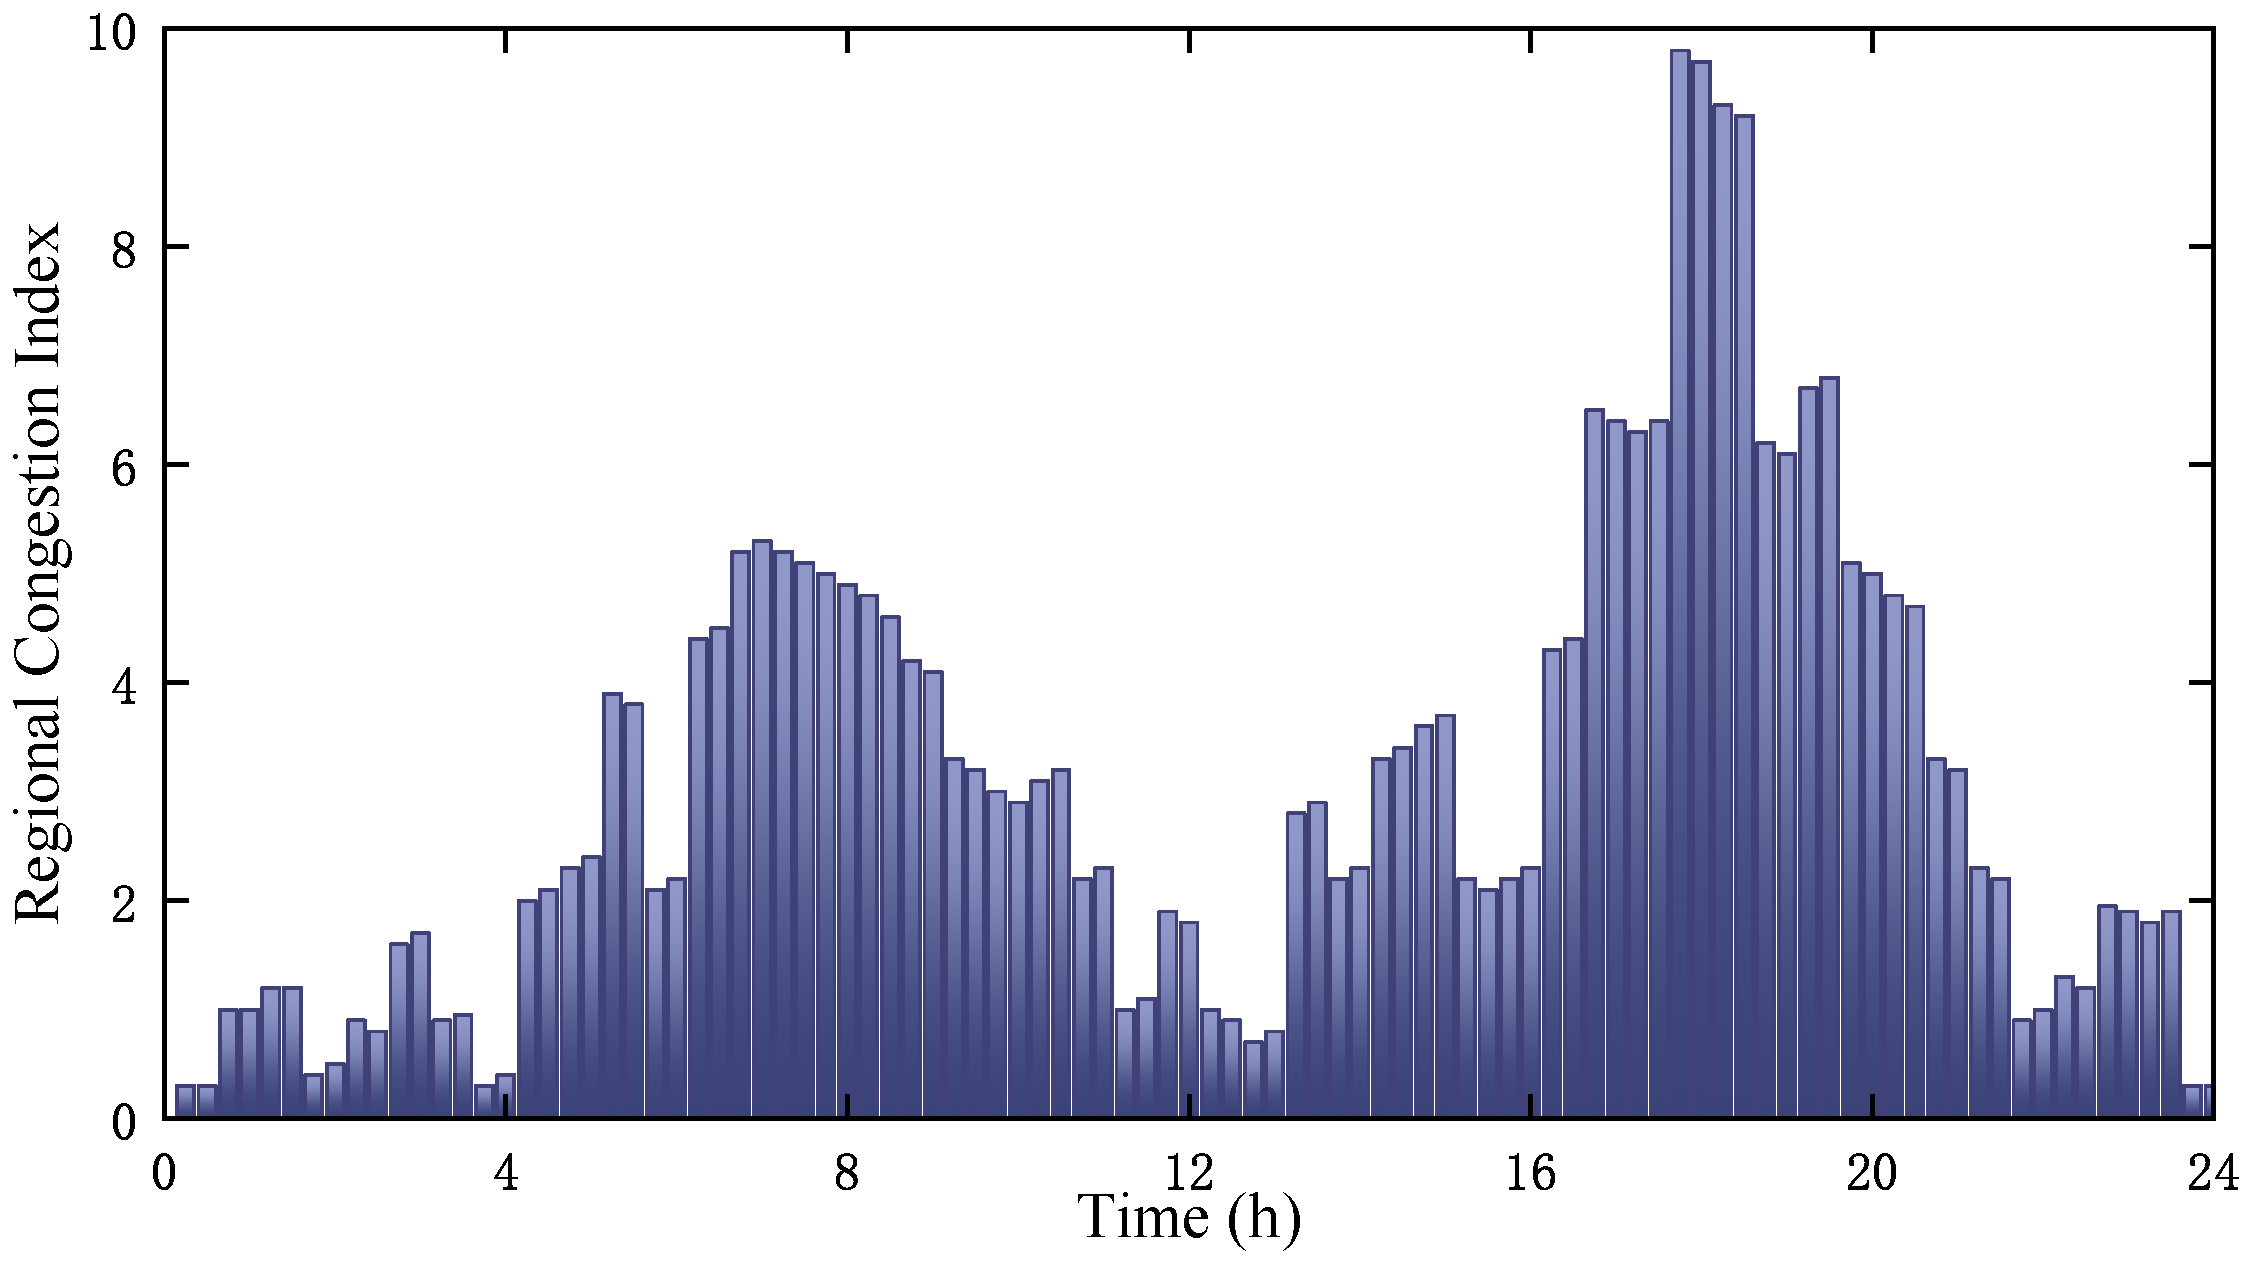
2.1.1. Temporal-Spatial Characteristics

Statistics from the National Highway Traffic Safety Administration show that, although EVs have strong dynamic variations in spatial and temporal distribution, they can use functions to convert individual strong uncertainties into collective regularity [17]. Common distribution rules for EVs’ first trip time, driving time, and residence time in various areas are selected based on previous studies [18,19]. Among them, the representative places for residence time are the residential area (R), working area (W), commercial area (C), and scenic spot (S). Table 1 displays the distribution rules and parameter values of characteristic quantities.
Driving speed is one of the key factors contributing to the uncertainty of EVs’ temporal-spatial characteristics. Therefore, the overall road traffic situation is quantitatively evaluated from the aspects of time, space, and intensity by studying the traffic index [20]. The regional traffic index, based on the traffic congestion situation for one day, is shown in Table 2, and the distribution of the index is shown in Figure 1.
It is apparent that EV users encounter heavy congestion on the road during peak hours from 17:00 to 19:00. Simultaneously, EVs’ driving time and battery power consumption can be altered, which, in turn, affects EV users’ demand and the time of access to the grid for energy storage.

2.1.2. Energy Storage Resources

The number of EVs connected to the grid determines the energy storage resources required to optimize the frequency in the grid. Hence, it is necessary to estimate the state of charge (SOC) of an EV’s battery after the trip in order to ascertain whether it requires a grid connection for charging ot discharging. The SOC upon arrival at the destination is
S O C m + 1 , i = S O C m , i β m , i D m , i E m , i B c , i
where S O C m + 1 , i represents the SOC after the ith EV reaches the m + 1 th destination. S O C m , i is the SOC after the ith EV reaches the mth destination. So, the ith EV’s initial SOC is S O C 1 , i . When the ith EV reaches the mth destination, D m , i represents the distance traveled, E m , i represents the power consumption per kilometer, and B c , i represents the battery capacity. β i represents the coefficient of power consumption.
From a physical perspective, temperature and speed are two important components that influence EV power consumption. The EV range varies by about 50% when traffic congestion levels are taken into account [21]. The following equation illustrates the superimposed temperature effect [22]:
β m , i = 1.12 0.01 T c , i · 1.64 0.5 S t , i , T c , i < 15   C 1 · 1.5 0.5 S t , i , 15   C T c , i 20   C 0.63 + 0.02 T c , i · 1.58 0.5 S t , i , T c , i > 20   C
where S t , i is the velocity influence coefficient at time t, the value of which is shown in Table 2. T c , i represents the current temperature at which the EV operates.

2.1.3. Users’ Willingness to Respond

The willingness of users to respond refers to the enthusiasm and readiness of EV users to join the grid and participate in energy storage. Users’ original willingness is to charge after the SOC drops to the minimum level, which only satisfies their initial charging needs. This behavior does not include adjusting grid frequency through flexible charging and discharging. Consequently, increasing users’ active willingness enhances the degree of user response frequency optimization in accordance with EVs’ temporal-spatial characteristics and energy storage resources. A user’s willingness to respond is demonstrated in Equation (3):
U i = U 0 , i , S O C m , i S O C i m i n γ · U a , i c h a , S O C i m i n < S O C m , i S O C i s e t γ · U a , i c h a + U a , i d i s 2 , S O C i s e t < S O C m , i S O C i m a x γ · U a , i d i s , S O C m , i S O C i m a x
where U i is the ith EV user’s willingness to respond. U 0 , i is the ith EV user’s original willingness. U a , i c h a and U a , i d i s represent the ith EV user’s active willingness to charge and discharge, respectively. γ is the users’ coefficient of active willingness response, which represents the percentage of users who engage in active responding. S O C i m i n and S O C i m a x represent the ith EV’s minimum and maximum SOC values, respectively. S O C i s e t represents the ith EV’s expected discharging value of the SOC.
In Equation (3), the EV user’s original willingness indicates that the user decides to charge right away when the SOC is less than the range anxiety value, that is, the minimum charging value. At this point,
U 0 , i = 1
The EV user’s active willingness to charge and discharge means that the user actively chooses to charge in advance when the SOC is higher than S O C i m i n but lower than S O C i m a x by determining whether it can reach the destination of the next stage. Similarly, the user also can actively choose to discharge based on the power supply subsidy when the SOC is higher than S O C i s e t . These are correlated with the SOC after arriving at the current destination, the SOC after arriving at the next destination, the residence time, and the driving time to the next destination:
U a , i c h a = U a , i d i s = 1 · S O C m , i S O C m + 1 , i S O C m , i + t d t p + t d
If the SOC consumption of an EV is relatively large during the driving process between the mth destination and the m + 1 th destination, or the residence time is relatively large compared to the total of the residence time and the driving time, the user’s active willingness to choose charging and discharging in advance will increase, thereby enhancing the EV’s responsiveness when connected to the grid.

2.2. Access Probability
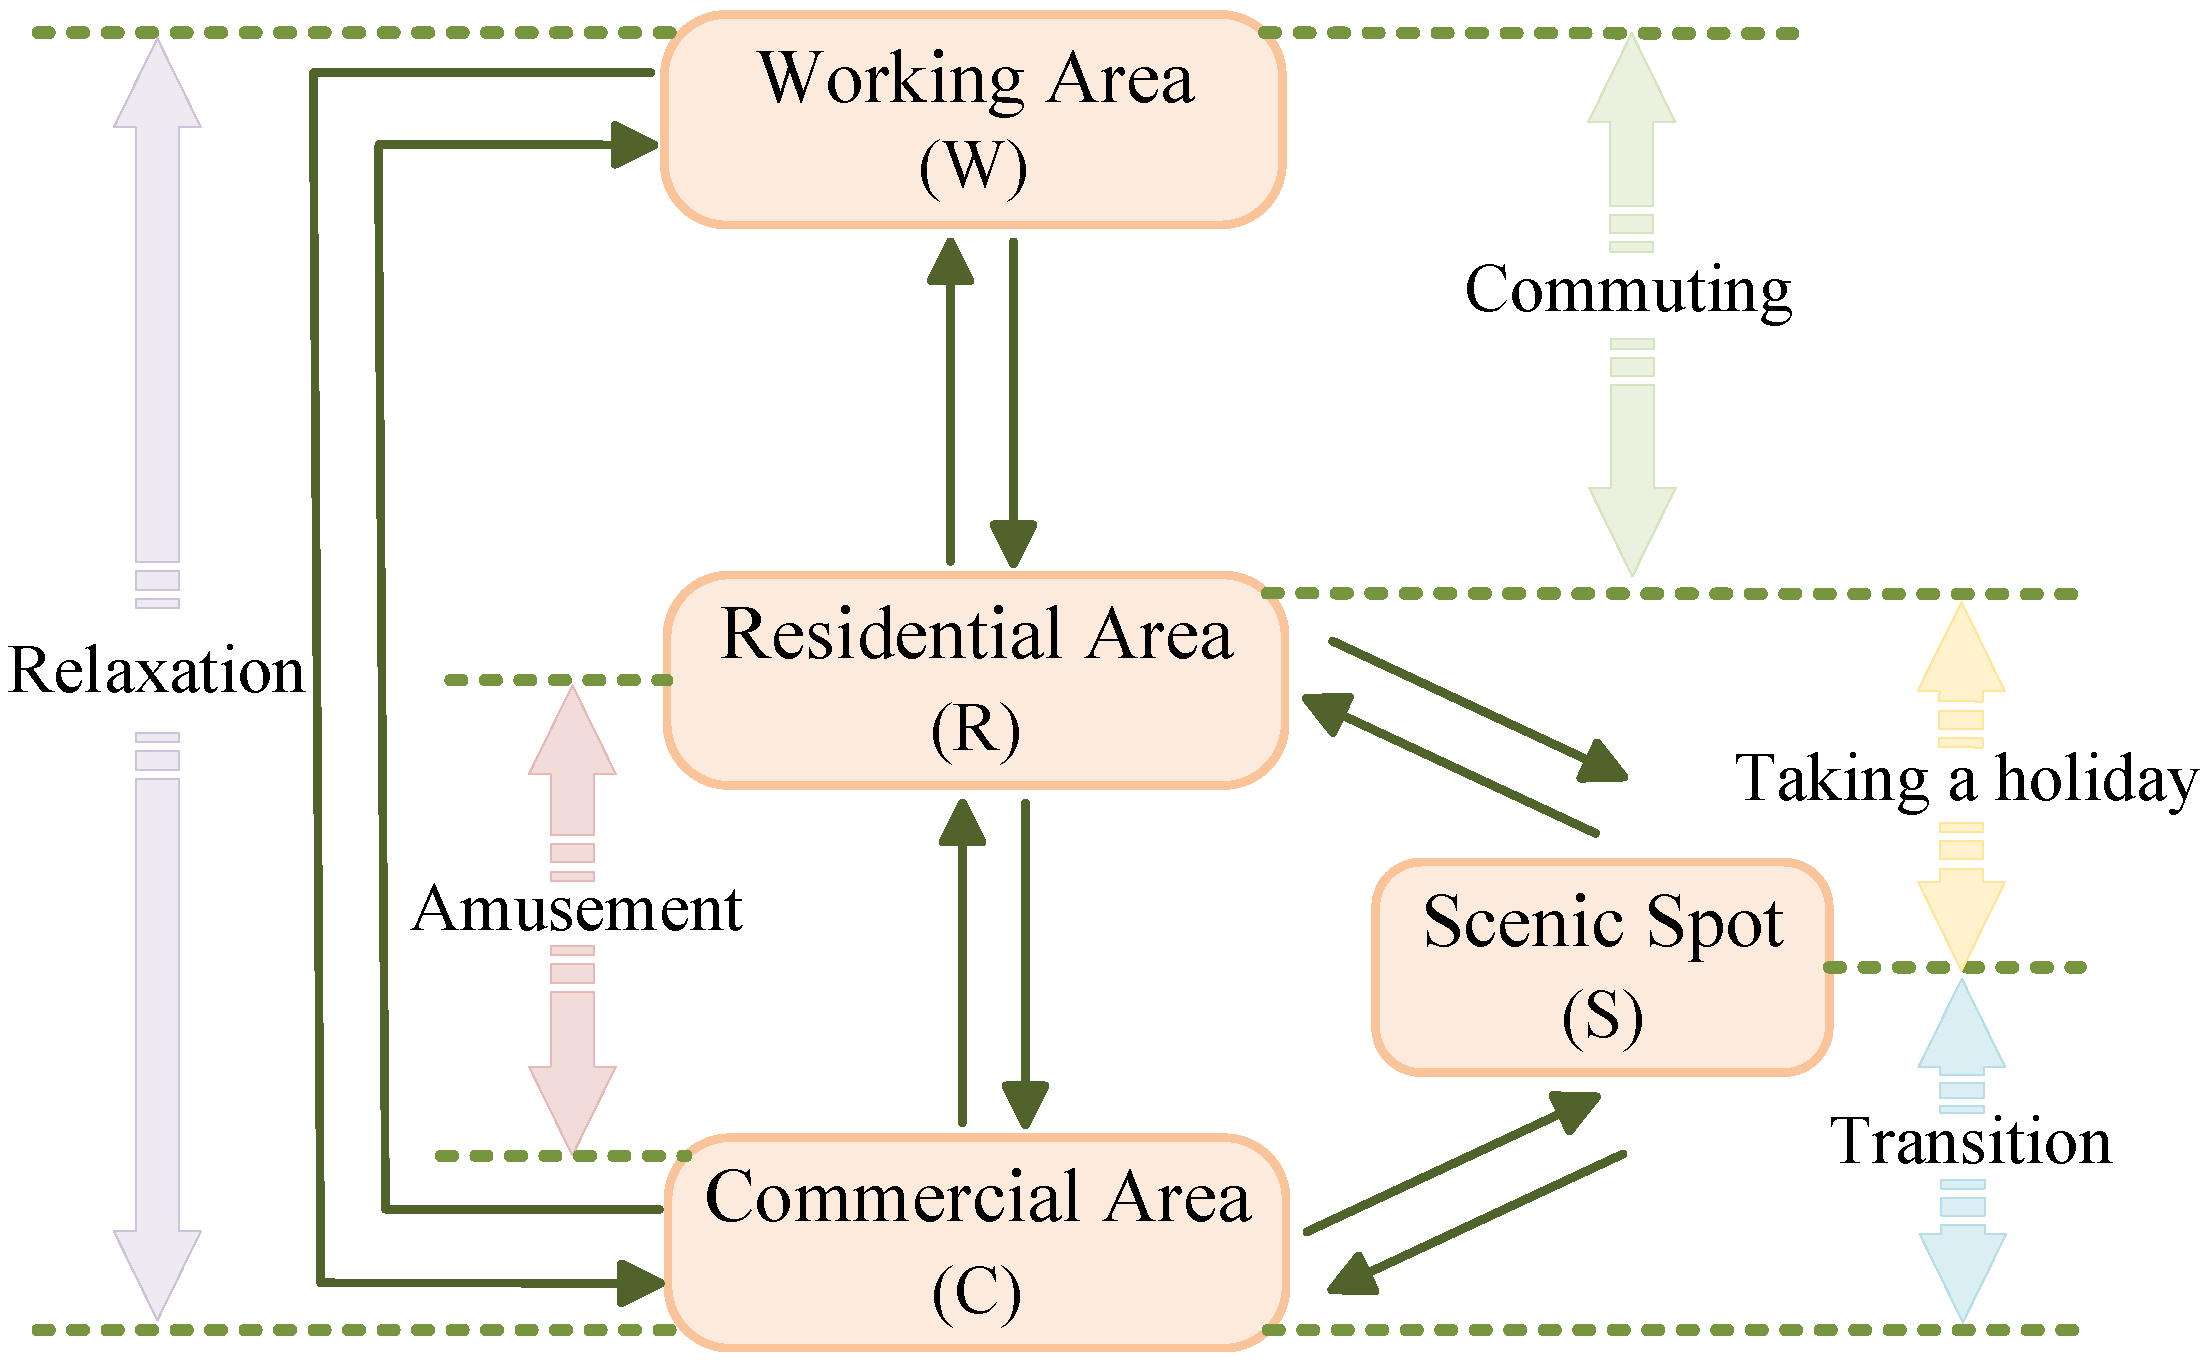
As claimed by the sampling of EV clusters’ strong uncertainty factors, the starting time and duration of EVs accessing the grid to participate in energy storage are expressed as probabilities, defining the “access probability” [23]. EVs’ access probability p i t can be expressed as
p i t = lim n 1 n N t = lim n 1 n i = 1 n ξ i t
where p i t represents the EVs’ access probability during time period t. N t represents the number of EVs accessing the grid during time period t. n is the number of samples. ξ i t indicates the access state of the ith EV during time period t. ξ i t = 0 means the EV is not connected, while ξ i t = 1 means the EV is connected.
According to the definition of mathematical expectation, Equation (6) can also be expressed as
p i t = E ξ i t
The expectation of EVs’ access probability during the time period is equal to the expectation of the actual access state at that time. So,
E S t = i p i t E S i t
where E S t indicates the expectation of EV clusters’ access states during time period t. E S i t depicts the expectation of the ith EV’s access state during time period t.
The access probability can determine whether the EV is accessing the power grid to participate in energy storage, which directly reduces the EV’s strong uncertainty to a one-dimensional uncertainty, effectively decreasing the scheduling difficulty.

2.3. Trip Chain

Based on the specific purpose of the trip, a trip chain is formed. It describes the EV’s transfer state, the starting point of the trip, and the destination within one day. According to the rules for private car trips, the average number of trips for one day is 3.03 [24]. In light of the representative areas above, this paper chooses a trip-chain structure with three transfer states and establishes four transfer places, as seen in Figure 2.
Since the transition probability is different for each state, the matrix A m ( m = 1 ,   2 ,   3 ) is used to represent the transition probability of every place in the mth transfer state:
A m = a d 1     d 1 , m a d j     d 1 , m a d 1     d j , m a d j     d j , m , ( m = 1 ,   2 ,   3 ;   j = 1 ,   2 ,   3 ,   4 )
where d 1 is the residential area, d 2 is the working area, d 3 is the commercial area, and d 4 is the scenic spot. a d 1     d j , m represents the transition probability of place d 1 to place d j in the mth transfer state.
The initial transfer place is the residential area. Considering that EV users in the scenic spot may not be able to return home on time within a day, the last transfer state for one day can only be set to the residential area or scenic spot. The transition probability for each place is shown in Table 3.
As a result, the proportion of all trip chains can be obtained:
T = m = 1 3 A m × 100 %
Excluding the EV’s original charging demand due to a low SOC, the user can voluntarily choose whether to stay in the place to participate in energy storage to respond to frequency fluctuations.

3. Frequency Optimization Model

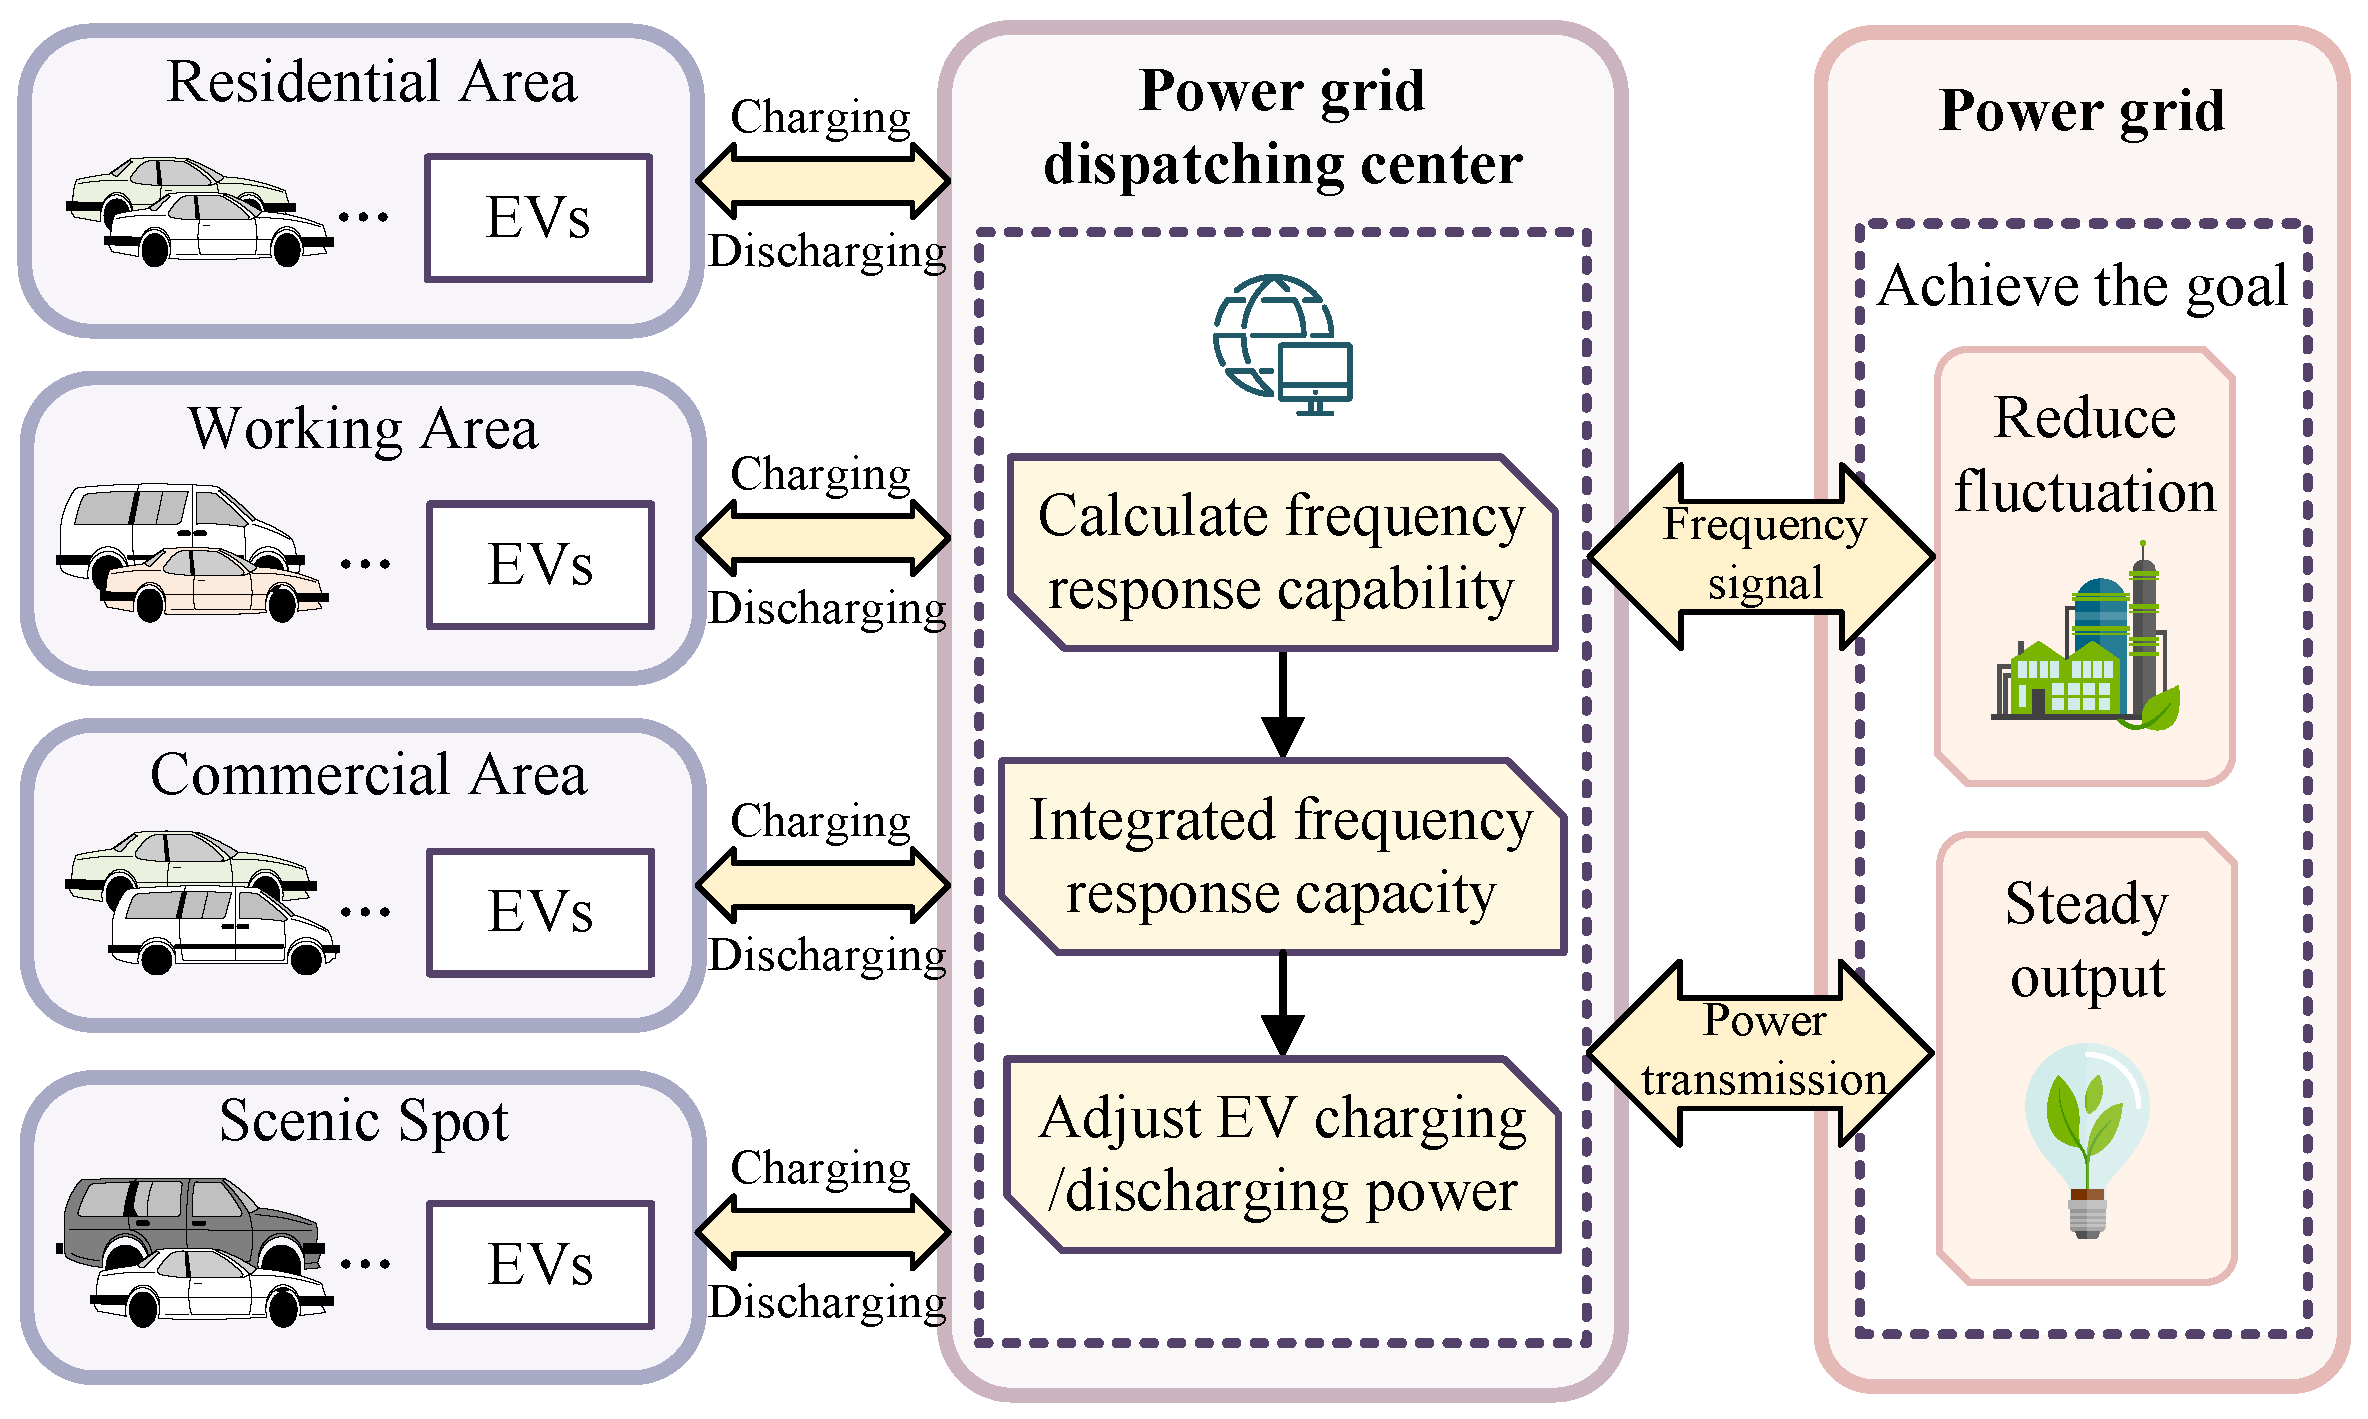
3.1. EV Participation in the Energy Storage Framework

The power grid dispatching center integrates the EV frequency-response capacity according to the EV strong uncertainty model to regulate the EV power within the capacity range, reduce frequency fluctuations in the power grid, and stabilize the output of the power generation system and the EV cluster. The overall framework of EV participation in power grid energy storage proposed in this paper is shown in Figure 3.
The frequency-response capability of an EV in each period of the four areas is more accurately predicted by the EV strong uncertainty model. A user’s demand corresponds to the length of time the EV is connected to the grid so the power grid dispatching center can integrate and control the EV’s capacity to participate in energy storage. When the power generation system experiences load disturbances during the generation period, the power grid dispatching center controls the EV output using the sag coefficient according to the frequency offset signal from the power grid within the EV’s response capacity range during the period so the power and fluctuations are equally offset. If an EV user is less willing to respond during this period, the EV’s frequency-response capability cannot fully offset frequency fluctuations. In future studies, EV scheduling could be considered through pricing incentives and other policies to allow EVs to change their access times to the network and better eliminate frequency fluctuations.

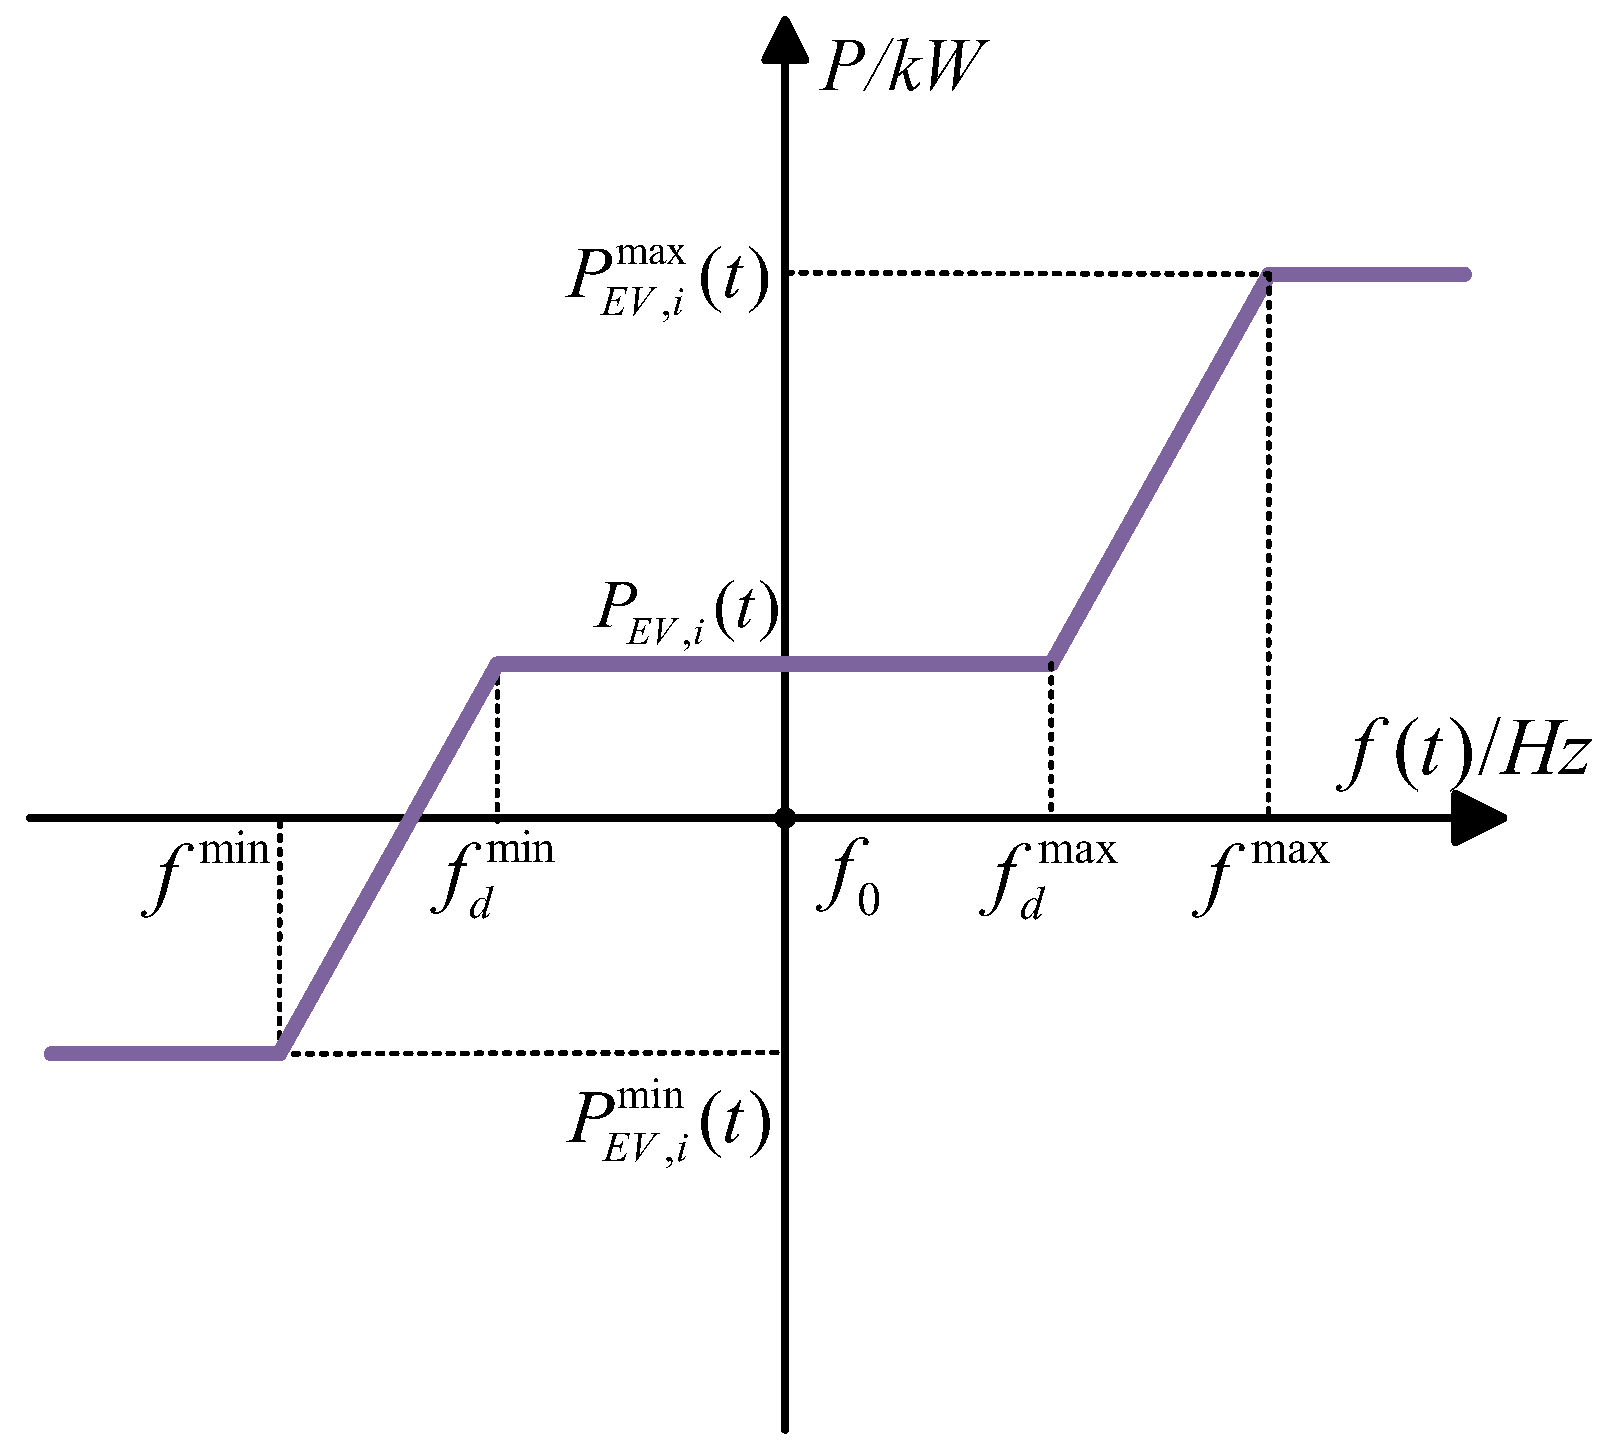
3.2. EVs’ Frequency-Response Capability

EVs access the power grid as energy storage resources, in which case their capabilities of adjusting the frequency of the power grid have a controllable range depending on EV states and external factors. The figure below displays the ith EV’s frequency-response capability at that time.
In Figure 4, P E V , i t is the charging or discharging power of a single EV, which is constrained by the maximum charging power P E V , i m a x t and the maximum discharging power P E V , i m i n t . The system frequency at that time is given by f t . The rated frequency of the power system is denoted by f 0 . f m a x and f m i n are the upper and lower limits of the system frequency adjustment range. Set the upper and lower limits of the regulatory dead zone f d m a x and f d m i n , in which EVs do not respond to frequency fluctuations, for the sake of reducing the damage to battery performance and life.

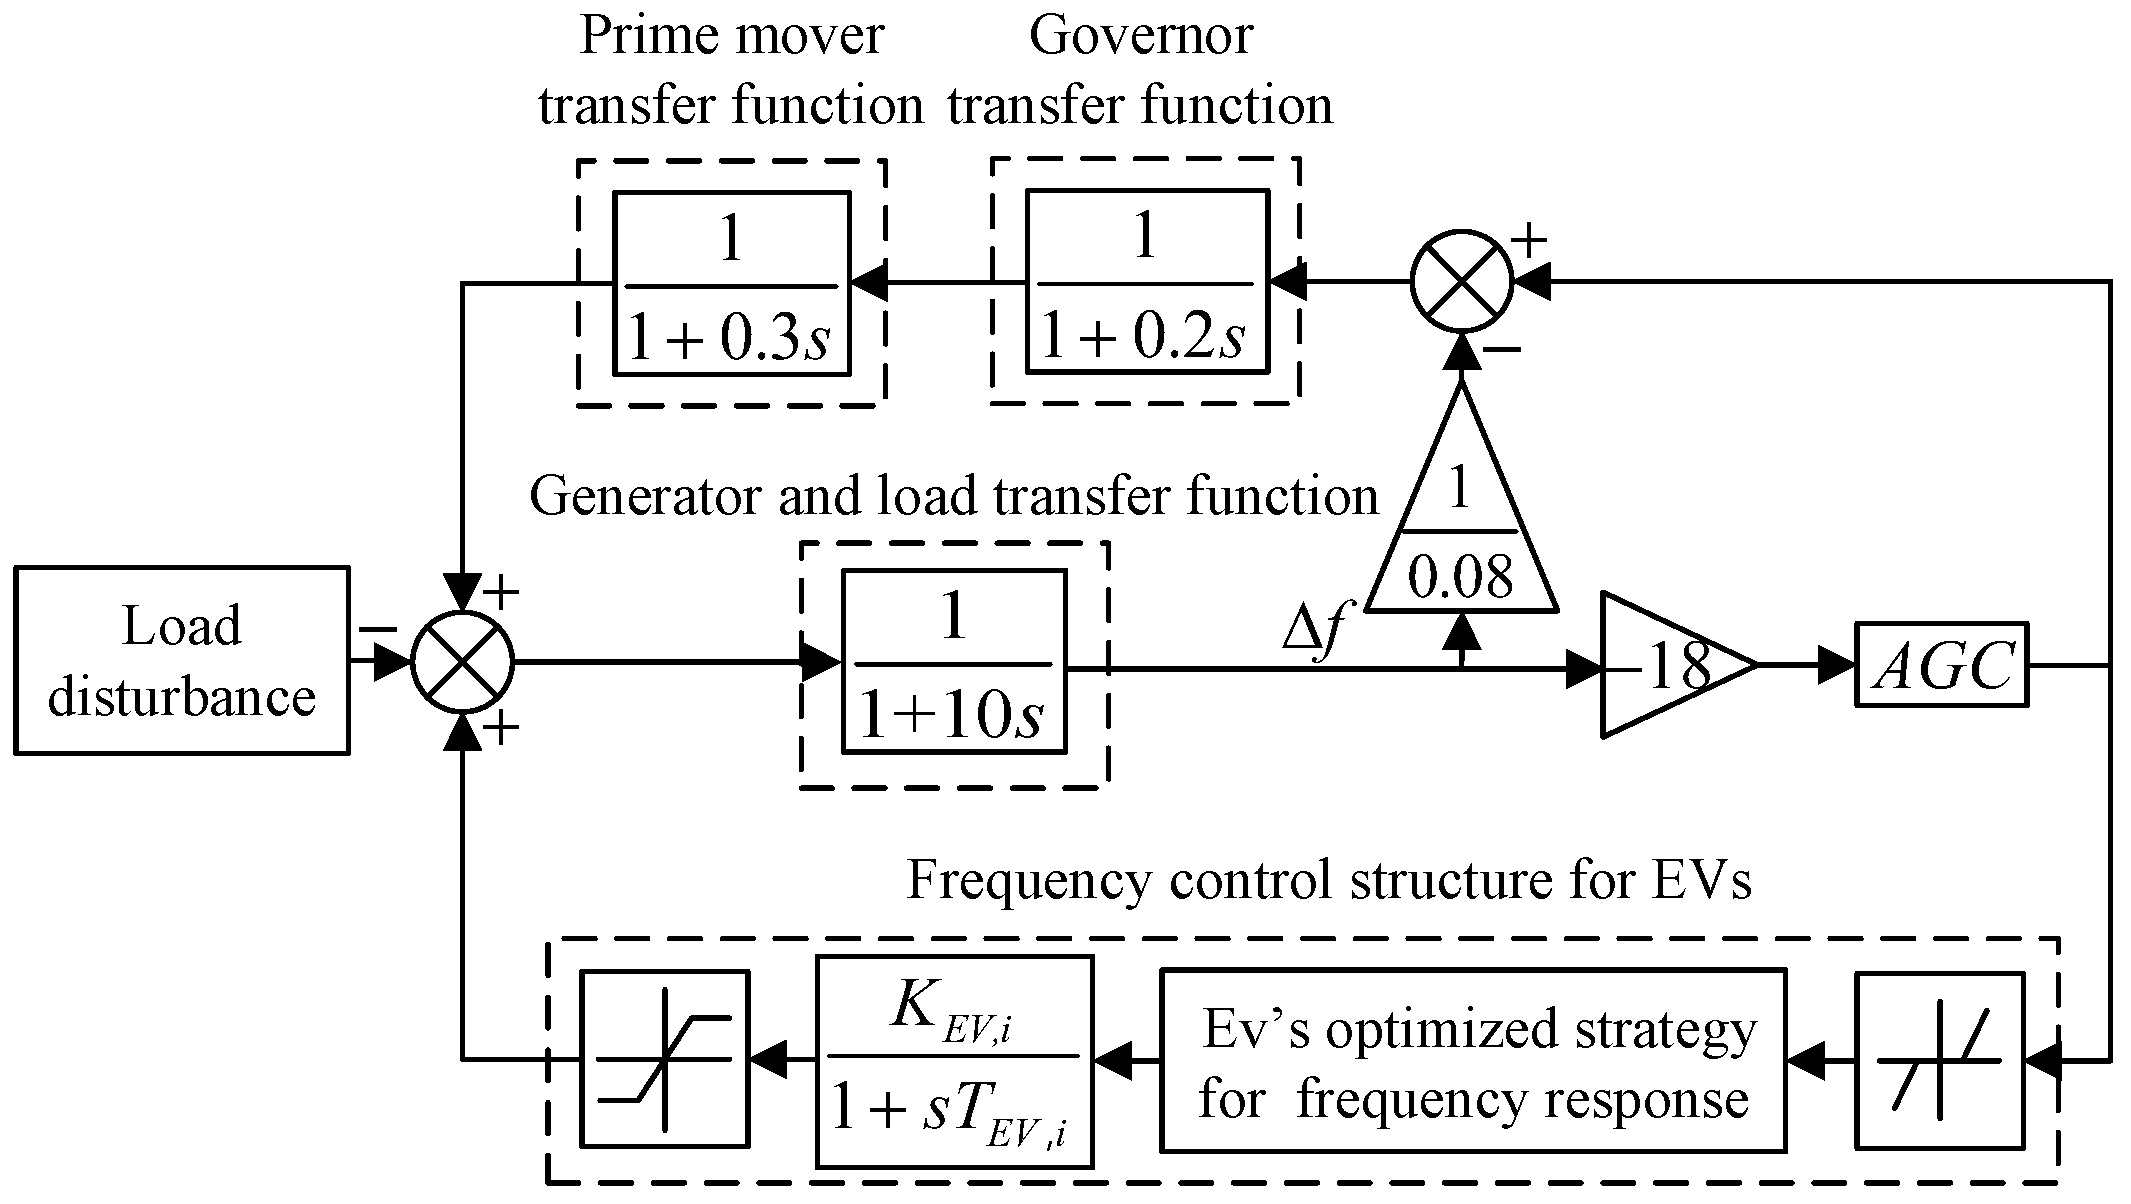
3.3. The Control Structure for Frequency Response

The EV charging and discharging characteristic model for frequency response is comparable to the model of a distributed power supply [25]. After the system frequency exceeds the regulatory dead zone, the EV’s charging and discharging power for frequency response is adjusted using the sag control coefficient of the EV’s frequency K E V , i :
K E V , i = P E V , i m a x η i P E V , i f m a x f d m a x ,   f d m a x < f < f m a x P E V , i m i n η i P E V , i f d m i n f m i n ,   f m i n < f < f d m i n
where P E V , i is affected by the EV’s SOC and the user’s charging willingness after arriving at the location, which should be evaluated and updated regularly based on the SOC and the time of access to the grid. η i is the efficiency of charging or discharging. According to the work in [26], η i is set as random sampling in the range of [0.94, 0.98]. f is the system frequency.
Consequently, integrate the total adjustment power of the EVs for frequency response as follows:
Δ P E V ( t ) = i = 1 n Δ P E V , i ( t )
where Δ P E V , i ( t ) refers to the ith EV’s charging and discharging power for frequency response. Δ P E V ( t ) refers to the total adjustment power of EVs for frequency response.
Combined with the strong uncertainty model of the EV cluster, the power grid frequency control is optimized, and the optimized strategy is shown in Figure 5. The optimization steps are as follows:
  • The Monte Carlo method is used to extract the transfer state, trip time, driving time, and residence time of a single EV in one day. Calculate separately the SOC after arriving at each location.
  • If S O C m , i > S O C i m i n , it indicates that the SOC of the EV has a surplus, allowing it to participate in energy storage. Then, continue to assess the user’s willingness to respond. Otherwise, it only meets the user’s original charging requirements and does not participate in frequency optimization after forced charging to satisfy the travel task’s needs.
  • If U i 1 , it means that users are willing to accept power grid regulation while participating in energy storage. The power grid dispatching center receives the signal of the frequency offset Δ f for EV output control. Otherwise, it only meets the user’s original charging requirements and they do not participate in frequency optimization.
  • The grid dispatching center controls the time when the EV accesses the grid. If Δ f > 0 , the frequency is increased so the EV absorbs the excess active power of the grid by charging. If Δ f < 0 , the frequency is lowered so the EV provides active power for the grid by discharging. At the same time, the EV power is kept within the maximum charging power P E V , i m a x t and the maximum discharging power P E V , i m i n t . If the limit is exceeded, the power distribution is re-adjusted.
  • According to the number of EV clusters accessing each site, the power for frequency response from all EVs is integrated to form the total adjustment power of the EV clusters.

4. Analysis and Application of Examples

4.1. Introduction of Examples

This paper adopts a traditional simulation model of a power system in MATLAB/Simulink. The transfer functions and parameters of the generator, prime mover, and governor are shown in Figure 6. Automatic generation control (AGC) is used to control the output of generation and adjust the distribution of response power between EV clusters and conventional units. The characteristic quantities of the temporal-spatial characteristics of EV clusters have been described above. In addition, the specific parameters of EV energy storage resources, which are summarized as actual data, are shown in Table 4 [27].
In Table 4, U(a, b) means that the parameter follows a uniform distribution within the range [a, b].
In order to verify the optimization effect of the participation of EV clusters in energy storage for frequency fluctuations, 19:00 was selected as the initial time in the simulation when a large number of EVs were accessing the grid. Two types of load disturbances were set [28,29]. The first type was a step load disturbance, which occurred at 5 s with a power drop of 0.3 pu, and the simulation time was 50 s. The second type was a shock load disturbance, which caused a 0.3 pu power drop from 10 s to 20 s and a −0.3 pu power surge from 50 s to 60 s. The simulation time was 100 s. There were 5000 EVs in the area.
Three strategies were set up: (1) the traditional optimization of the power grid for frequency response without the participation of EV clusters, (2) this paper’s optimized strategy, where the coefficient of users’ active willingness γ = 30 % , and (3) this paper’s optimized strategy, where γ = 70 % . Comparisons of the power grid’s frequency offsets under the two disturbances are shown in Figure 7 and Figure 8, respectively.
For a more focused contrast, three indices—rise time, overshoot, and setting time—were adopted for analysis. Among them, the frequency offset under the shock load disturbance was selected for the most complete image within 100 s of simulation time for the index evaluation, as shown in Table 5.
Combining Table 5 with Figure 7 and Figure 8, it can be observed that, under the step load disturbance, the ordinary generator set in strategy 1 was unable to modify its power to withstand external interference, leading to noticeable frequency oscillations and an overshoot of 0.01531 pu. In addition, the frequency recovery time was too long, with the setting time being 26 s. By flexibly regulating the EV charging and discharging powers to restore frequency stability, strategy 2 considerably minimized the oscillation amplitude and reduced the overshoot to 0.0018 pu. In comparison to strategy 1, strategy 2 shortened the rise time, frequency offset, and setting time by 83.73%, 88.24%, and 65.38%, respectively. In line with strategy 2, strategy 3 raised the percentage of users’ active willingness to respond. The enlarged diagram in Figure 7 reveals that the EV response speed increased slightly and the overshot decreased to 0.00174 pu in strategy 3, which resulted in year-over-year reductions of 1.96%, 0.39%, and 3.85% for the rise time, frequency offset, and setting time, respectively.
Simultaneously, under the shock load disturbance, the frequency of the grid in strategy 1 fluctuated once again before stabilizing, with the absolute value of the offsets being close to 0.015 pu. Since different regions had varying EV outputs at different intervals, strategy 2 allowed for the rapid adjustment of each offset, with the absolute value of the offsets adjustable within 0.006 pu. Compared to strategy 1, the reductions in the rise time, frequency offset, and setting time in strategy 2 were 75.00%, 78.07%, and 63.63%, respectively. In contrast to strategy 2, EVs in strategy 3 had a faster output speed, reduced oscillation amplitudes in the waveform, and absolute values of the offsets below 0.005 pu, where the rise time, frequency offset, and setting time were reduced by 4.58%, 2.88%, and 4.55%, respectively, year over year.
It is evident that under diverse load disturbances, it is feasible to significantly reduce the amplitude of the frequency fluctuations, accelerate the stabilized time, and enhance the quality of the electrical supply by utilizing EVs’ energy storage capabilities in the grid’s frequency-response optimization. Furthermore, the frequency-response time is faster and the range of fluctuations is narrower with the increasing percentage of EV users’ responsiveness. While EV users’ charging needs are being met, the response capabilities of EV clusters can be more accurately assessed depending on how responsively they participate in frequency optimization, which effectively improves the power grid reliability and encourages the construction of a low-carbon and clean power grid.

4.2. Analysis of Scenario Application

With the aim of analyzing the reliability of the power grid when EV clusters are participating in energy storage in a practical application, two scenarios were set up: (1) the traditional optimization of the power grid for frequency response without the participation of EV clusters, and (2) this paper’s optimized study, where the coefficient of users’ active willingness γ = 70 % and the number of EVs was 5000. The random dynamic load disturbance existing in the system was simulated using a white noise model [30], which was obtained by superimposing the base and edge components and applying a high-pass filter and a low-pass filter to remove the load disturbance component beyond frequency control. The simulation time was set from 0:00 to 24:00 for 24 h. In this scenario, the rated frequency was 50 Hz. The load disturbance curve generated by the model is shown in Figure 9. The system frequency curves for the two scenarios are shown in Figure 10.
As seen in Figure 10, the system’s frequency fluctuations in scenario 1 were controlled within a range of ±0.13 Hz, in which large load disturbances produced greater apparent oscillations and a wider range of overall fluctuations. The frequency fluctuations in scenario 2 were noticeably less than those in scenario 1 and were regulated within a range of ±0.04 Hz. When the system exhibited consistent and discernible frequency fluctuations, EVs in various locations swiftly reduced these fluctuations by responding in accordance with their own state responses, lowering the maximum frequency offset by roughly 69.41% and the minimum value by roughly 66.69%, resulting in a very narrow range of fluctuations in which the system frequency remained stable. This demonstrates that EV clusters participating in energy storage for frequency response can purposefully and efficiently reduce frequency fluctuations caused by load disruptions at various times.
In accordance with the trip chain, the output of the EV clusters for frequency response at four locations under scenario 2 is shown in Figure 11.
It can be seen that EVs in the residential area exhibited reduced travel demand between 0:00–6:00 and 18:00–24:00. In these instances, the proportion of EVs engaged in energy storage was higher, and their frequency-response capabilities were more advanced. The large number of EVs simultaneously adjusted the bidirectional power of charging or discharging, so the output power for frequency optimization was greater. Around 8:00 and 19:00, there was an abundance of EVs in the working area, and most of them had an excess SOC to engage in energy storage. Thus, there was plenty of EV discharge power at this time. Due to entertainment and other factors, a certain number of EVs in the commercial area participated in energy storage from 3:00 to 12:00. Hence, the EV output power was larger during this period. In addition, the more dispersed and flexible EV output power at the scenic spot was a result of the more scattered EV customers visiting this location. In summary, the proposed study has the potential to not only significantly optimize the frequency fluctuations of the power grid but also effectively assess the accuracy of users’ travel times based on the EV clusters’ outputs at various locations.
Assuming that the varying active willingness responses of EV users will impact the power grid’s frequency optimization effect, various ratios of the coefficients of users’ active willingness, γ , were established, and the system frequency fluctuations were monitored, as shown in Figure 12.
As illustrated in Figure 12, regardless of user responsiveness, the power grid’s frequency fluctuations are controlled within an extremely restricted range following the participation of EV clusters in energy storage. It is more evident that the degree of EV users’ active willingness increases and the frequency fluctuations decrease during the periods from 0:00 to 4:00 and 17:00 to 20:00. Due to the fact that the base number of EVs in the 0:00–4:00 period is small, users’ active willingness increases and the number of EVs participating in frequency optimization also increases, so frequency regulation is more effective. The number of EVs participating in the period from 17:00 to 20:00 is large, and their frequency-response capabilities change greatly with changes in users’ active willingness, so the optimization effect on frequency is more obvious.

5. Conclusions

This work presents an optimization study on the frequency response of EVs participating in energy storage while taking into account the strong uncertainty model. First, the trip chain and the access probability of engaging in energy storage are used to create a strong uncertainty model of EVs that accounts for the temporal-spatial characteristics, energy storage resources, and users’ willingness to respond. In addition, the EV output is modified using a two-layer frequency optimization strategy employing sag control in accordance with the estimated EV frequency-response capabilities. Finally, using examples and scenario applications, the optimization and regulation implications of EVs on the power grid’s frequency fluctuations are examined. The following conclusions are drawn:
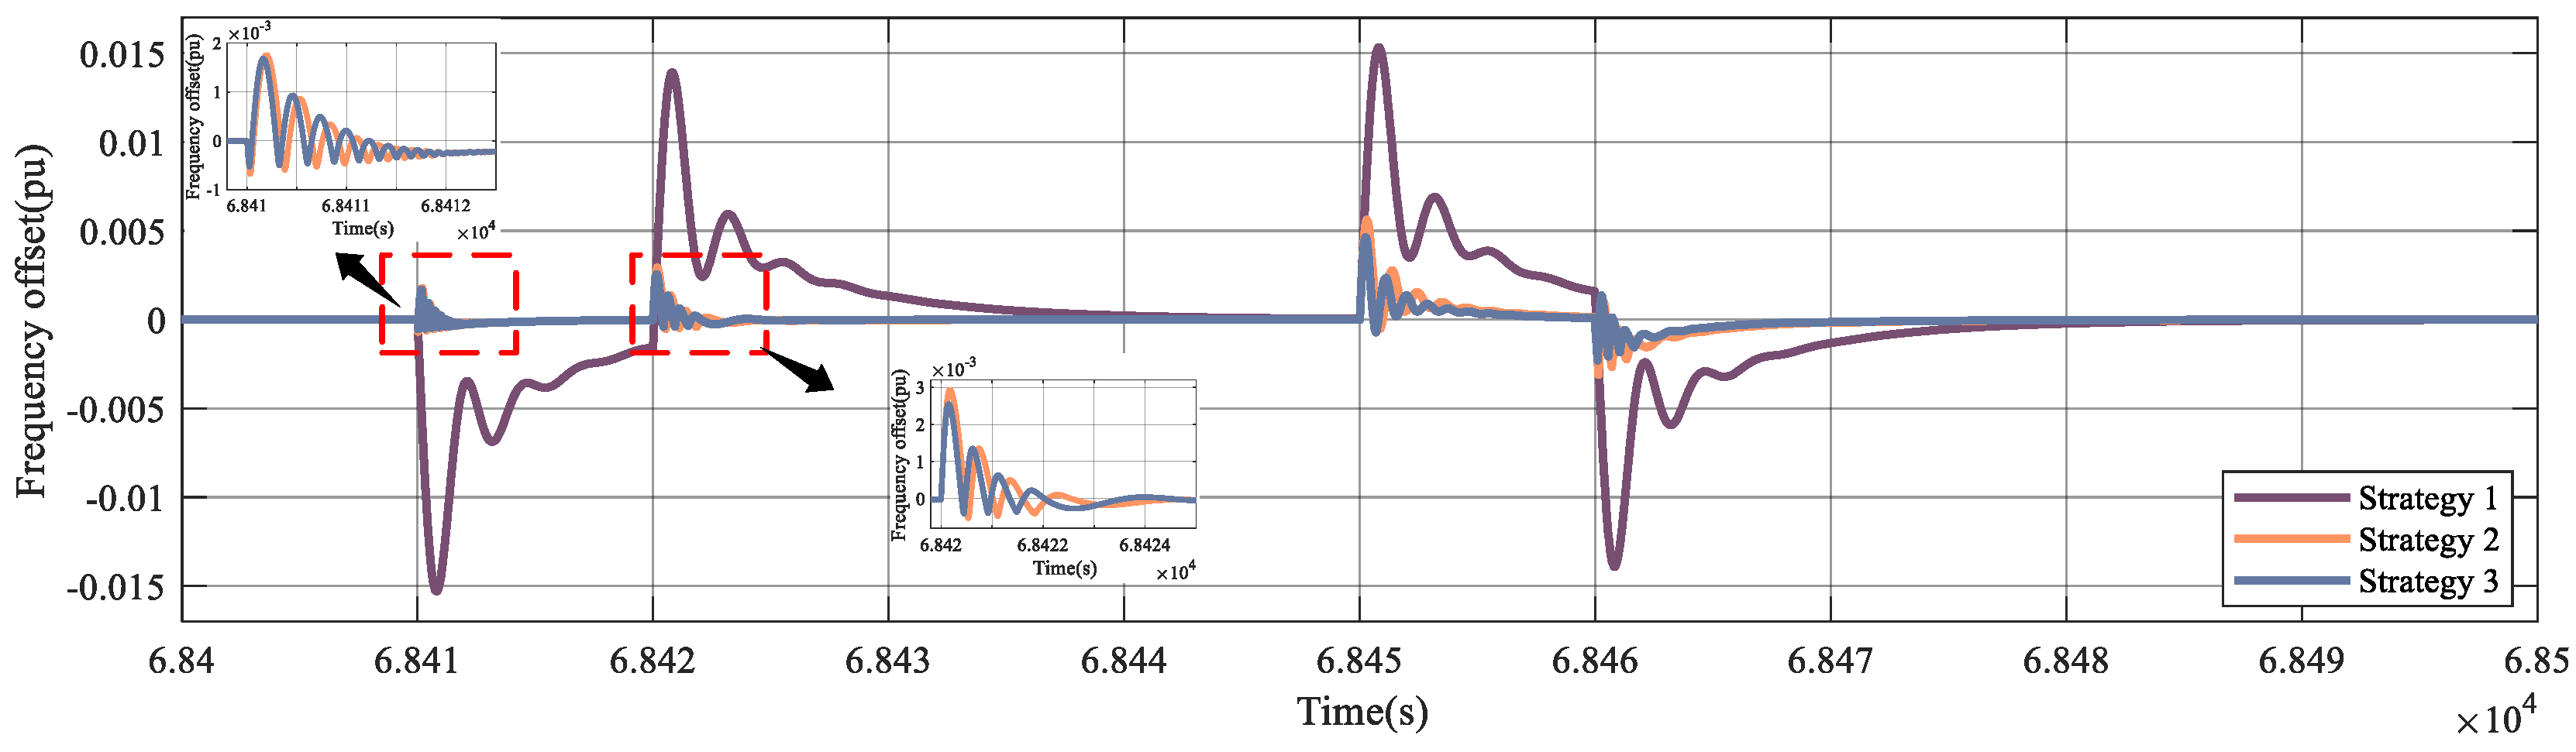
  • Under various load disturbances, the model can dramatically lower the amplitude of the frequency fluctuations and shorten their correction times. In the scenario application, it is verified that the model substantially decreases the maximum frequency offset by 69.41% and the minimum frequency offset by 66.69%. This enhances the grid’s power supply quality, encourages the sale of electricity, and advances the creation of clean, low-carbon power systems.
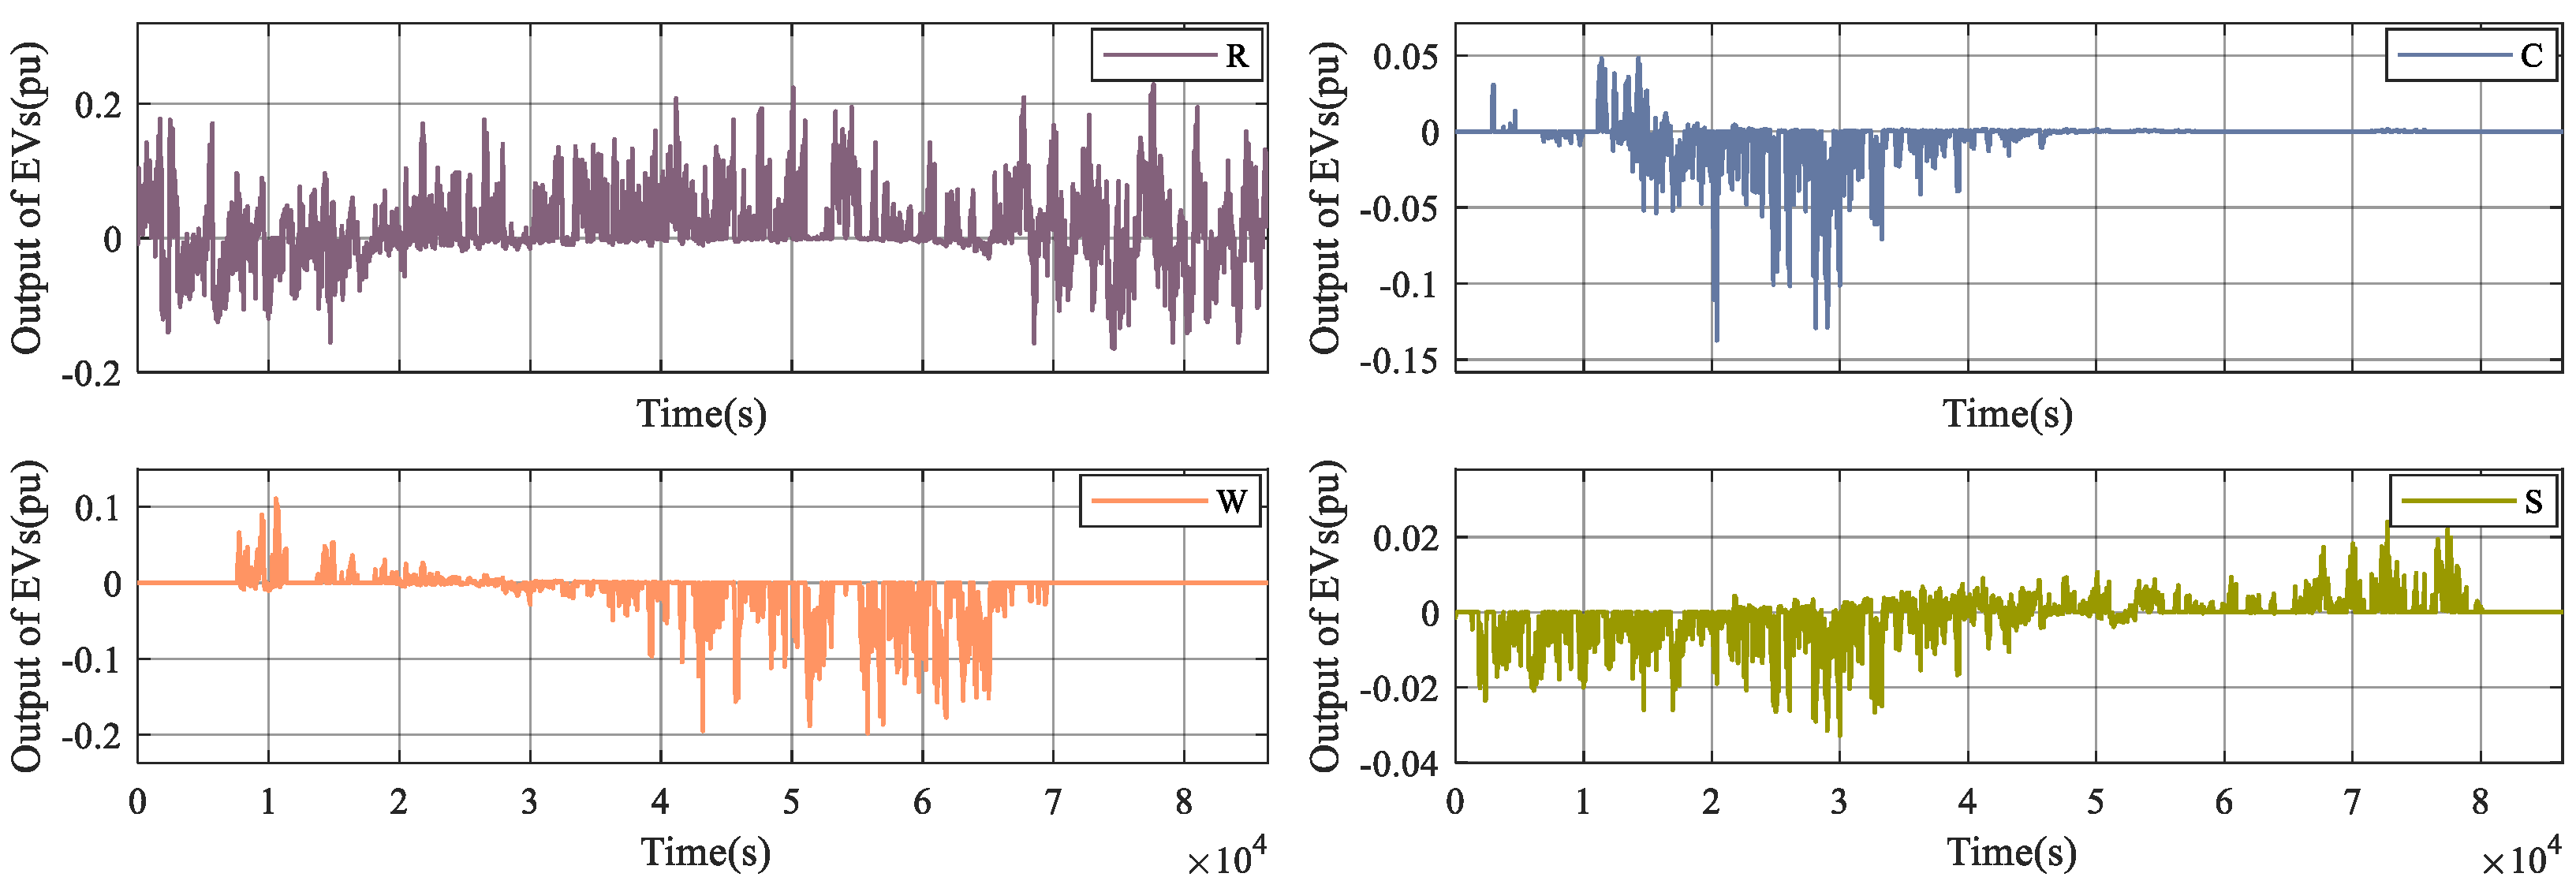
  • EVs in various locations can optimize the frequency fluctuations of the power grid according to their own response capabilities in different time periods, and the output of EVs in residential areas is most evident under the travel rules.
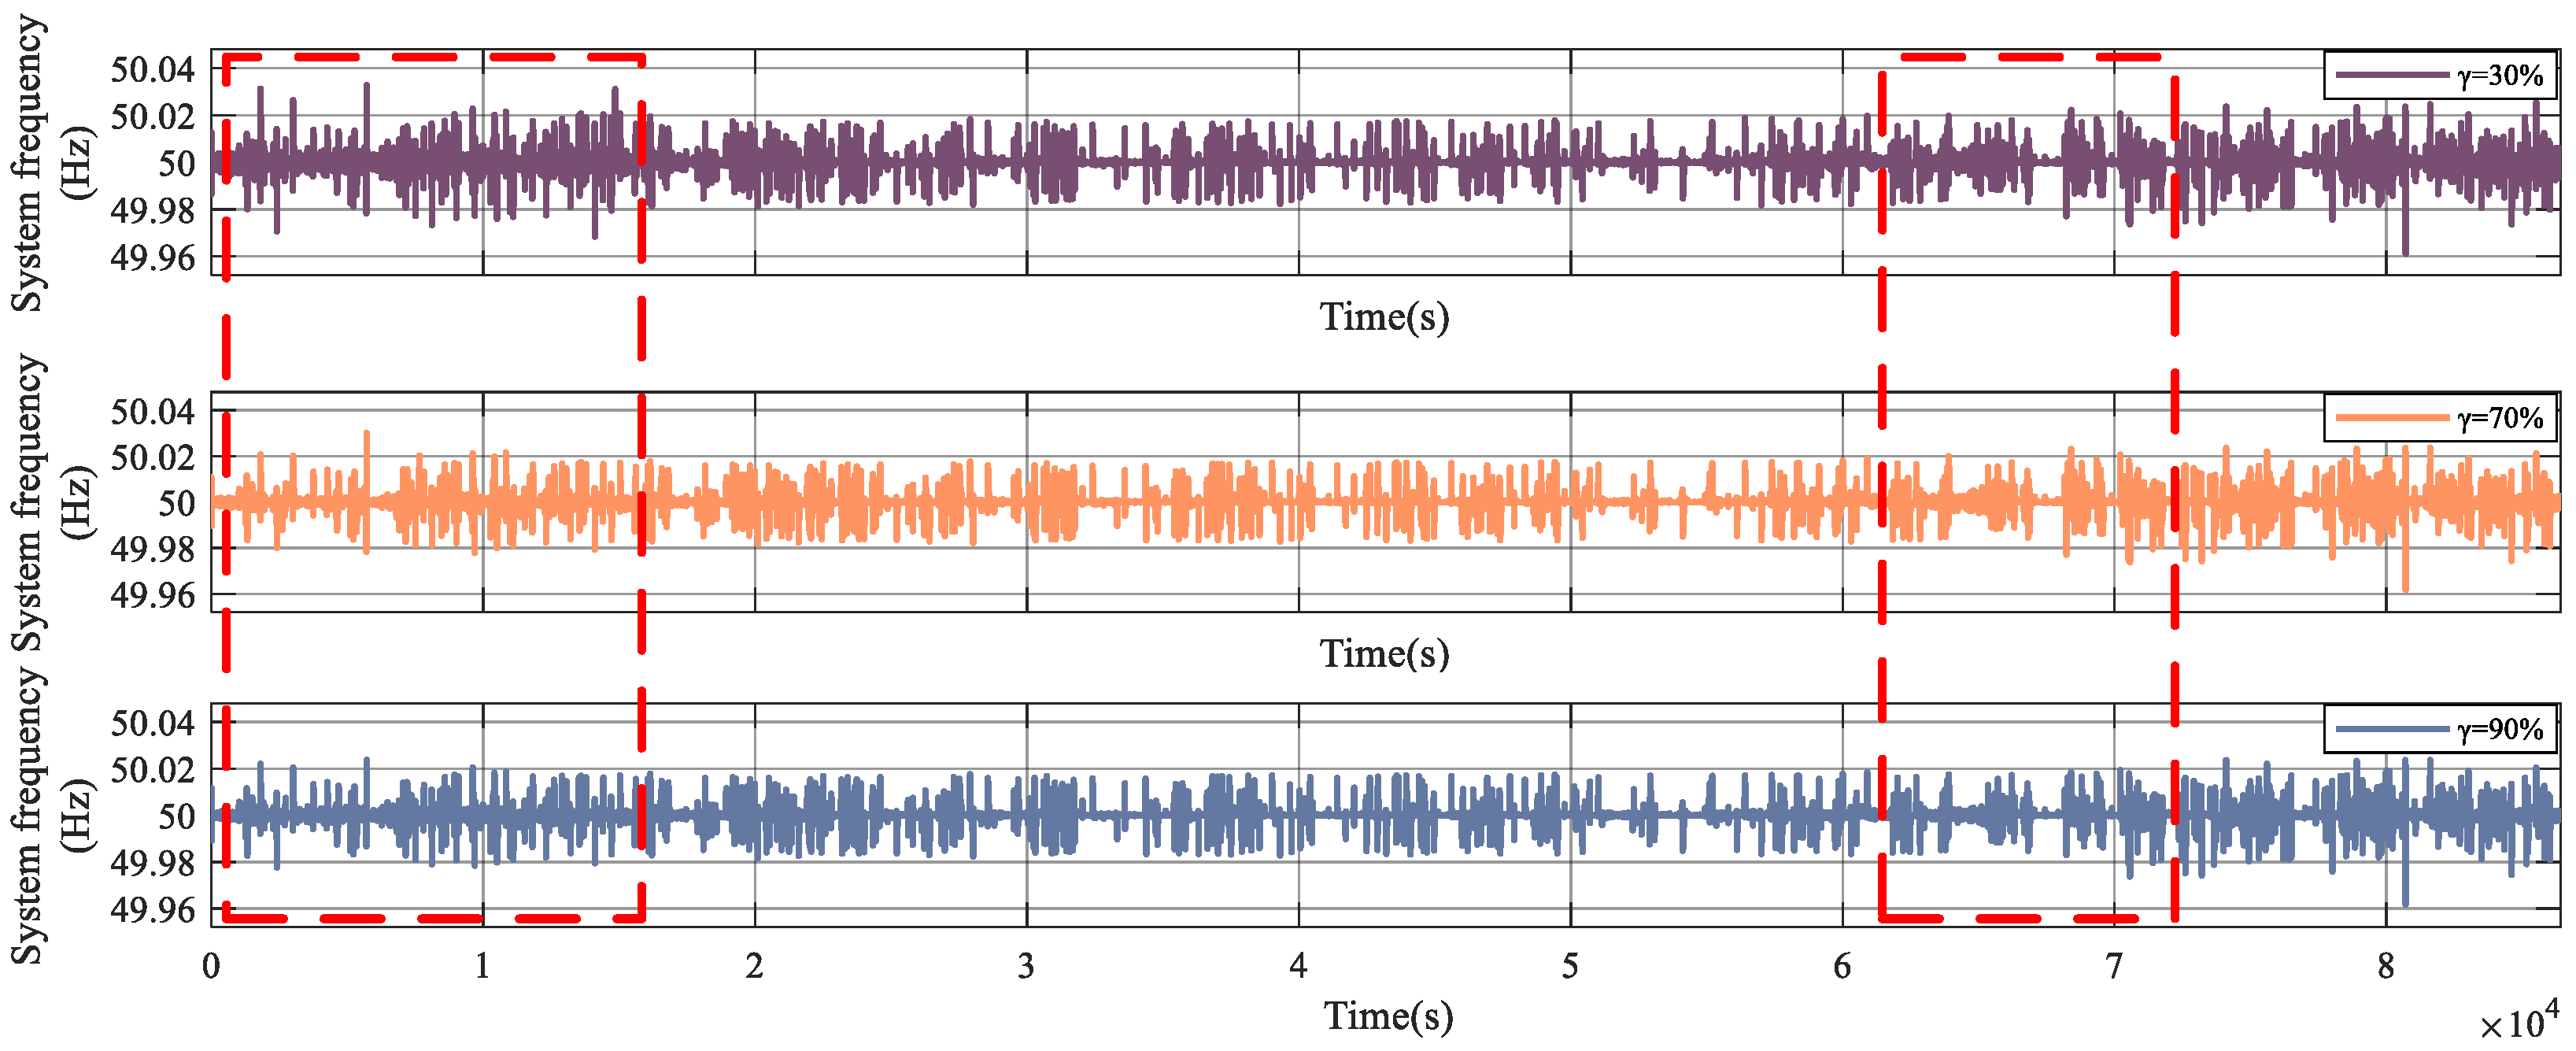
  • When a larger proportion of users are willing to respond actively, the system frequency is more stable and the frequency adjustments are more effective.
Nevertheless, the spatial rationality of the driving route is not further taken into account in this paper when establishing the EV model. Even when user demand and frequency response are constant, there are still situations where the frequency-response capability is insufficient to fully compensate for frequency fluctuations. In order to achieve more thorough spatial scheduling, more advanced methods, such as machine learning algorithms, will be used in future research, considering the integration of traffic flow and route optimization into the model and comparing it with other existing methods. Policies like price incentives also need to be implemented to modify the times that EVs can access the grid.

Author Contributions

Conceptualization, L.C. and C.Y.; methodology, C.Y.; software, C.Y.; validation, L.C., C.Y. and J.L.; formal analysis, C.Y.; resources, J.Y.; data curation, C.Y. and Y.L.; writing—original draft preparation, C.Y.; writing—review and editing, L.C. and C.Y.; visualization, C.Y.; supervision, X.Z.; project administration, L.C.; funding acquisition, J.Y. All authors have read and agreed to the published version of the manuscript.

Funding

This research was funded by the Natural Science Foundation of Chongqing Municipality, China (CSTB2022NSCQ-MSX1675, 2023NSCQ-LMX0027); the Science and Technology Project of Wanzhou District, China (wzstc-20230108); and the Postgraduate Research and Innovation Project of Chongqing Three Gorges University (YJSKY24007).

Data Availability Statement

The original contributions presented in this study are included in the article, further inquiries can be directed to the corresponding author.

Conflicts of Interest

Xiaojiang Zou is an employee of Chongqing Andaocheng Automotive Technology Co., Ltd. The paper reflects the views of the scientists, and not the company.

References

  1. Dahmane, Y.; Chenouard, R.; Ghanes, M.; Ruiz, M. Optimal Electric Vehicle Fleet Charging Management with a Frequency Regulation Service. World Electr. Veh. J. 2023, 14, 152. [Google Scholar] [CrossRef]
  2. Yue, Y.; Xin, A.; Zhang, J.; Liu, Y. Orderly Charging and Discharging Group Scheduling Strategy for Electric Vehicles. Appl. Sci. 2023, 13, 13156. [Google Scholar] [CrossRef]
  3. Kushwaha, P.; Prakash, V.; Yamujala, S.; Bhakar, R. Fast frequency response constrained electric vehicle scheduling for low inertia power systems. J. Energy Storage 2023, 62, 106944. [Google Scholar] [CrossRef]
  4. Zhou, K.; Cheng, L.; Lu, X.; Wen, L. Scheduling model of electric vehicles charging considering inconvenience and dynamic electricity prices. Appl. Energy 2020, 276, 115455. [Google Scholar] [CrossRef]
  5. Thorat, R.; Bhatt, P. Electric vehicle participation for optimized load frequency control in a multi-area restructured power system. Int. J. Model. Simul. 2024, 1–14. [Google Scholar] [CrossRef]
  6. Jan, M.; Xin, A.; Abdelbaky, M.; Rehman, H.; Iqbal, S. Adaptive and fuzzy PI controllers design for frequency regulation of isolated microgrid integrated with electric vehicles. IEEE Access 2020, 8, 87621–87632. [Google Scholar] [CrossRef]
  7. Vishnoi, S.; Nikolovski, S.; Raju, M.; Kirar, M.; Rana, A.; Kumar, P. Frequency stabilization in an interconnected micro-grid using smell agent optimization algorithm-tuned classical controllers considering electric vehicles and wind turbines. Energies 2023, 16, 2913. [Google Scholar] [CrossRef]
  8. Yao, E.; Liu, T.; Lu, T.; Yang, Y. Optimization of electric vehicle scheduling with multiple vehicle types in public transport. Sustain. Cities Soc. 2020, 52, 101862. [Google Scholar] [CrossRef]
  9. Liu, T.; Wang, P.; Peng, Q.; Zhang, M.; Wang, T.; Meng, J. Operation-Area-Constrained Adaptive Primary Frequency Support Strategy for Electric Vehicle Clusters. J. Mod. Power Syst. Clean Energy 2023, 11, 1982–1994. [Google Scholar] [CrossRef]
  10. Qi, Y.; Huang, Q.; Yang, L.; Zhou, C.; Pan, C. Status update frequency optimization for In-vehicle LAN route based on deep Q-learning. Results Control Optim. 2022, 8, 100163. [Google Scholar] [CrossRef]
  11. Angelim, J.; Affonso, C. Effects of long-range electric vehicles on distribution system using probabilistic analysis. Int. J. Electr. Power Energy Syst. 2023, 147, 108868. [Google Scholar] [CrossRef]
  12. Niu, M.; Zhang, G.; Xiao, R.; Li, J. Frequency Security Assessment of Power System Under Random Excitation Based on the Time Beyond Security Range. In Proceedings of the 2023 5th Asia Energy and Electrical Engineering Symposium (AEEES), Chengdu, China, 23–26 March 2023; pp. 743–748. [Google Scholar]
  13. Ding, L.; Yang, J.; Ke, S.; Shi, X.; Fan, P.; Wang, H. A V2G power response model based on the prediction, evaluation, and correction of charging stations real-time frequency regulation capability. IET Gener. Transm. Distrib. 2024, 19, e13347. [Google Scholar] [CrossRef]
  14. Muhssin, M.; Obaid, Z.; Al-Anbarri, K.; Cipcigan, L.; Ajaweed, M. Local dynamic frequency response using domestic electric vehicles. Int. J. Electr. Power Energy Syst. 2021, 130, 106920. [Google Scholar] [CrossRef]
  15. Yang, Z.; Yang, F.; Hu, W.; Zhang, Z.; Zhou, X. Delay compensation control strategy for electric vehicle participating in frequency regulation based on MPC algorithm. Electronics 2022, 11, 2341. [Google Scholar] [CrossRef]
  16. Ahmad, P.; Choudhary, N.; Singh, N.; Singh, A. Primary frequency control by fuzzy-based participation controller for plug-in electric vehicles. Smart Sci. 2023, 11, 447–459. [Google Scholar] [CrossRef]
  17. Li, Z.; Ma, C. A temporal–spatial charging coordination scheme incorporating probability of EV charging availability. Appl. Energy 2022, 325, 119838. [Google Scholar] [CrossRef]
  18. Li, X.; Jenn, A. An integrated optimization platform for spatial-temporal modeling of electric vehicle charging infrastructure. Transp. Res. Part D Transp. Environ. 2022, 104, 103177. [Google Scholar] [CrossRef]
  19. Ge, X.; Shi, L.; Fu, Y.; Muyeen, S.; Zhang, Z.; He, H. Data-driven spatial-temporal prediction of electric vehicle load profile considering charging behavior. Electr. Power Syst. Res. 2020, 187, 106469. [Google Scholar] [CrossRef]
  20. Ma, C.; Zhou, J.; Xu, X.; Xu, J. Evolution regularity mining and gating control method of urban recurrent traffic congestion: A literature review. Swarm Evol. Comput. 2020, 2020, 5261580. [Google Scholar] [CrossRef]
  21. Shankar, R.; Marco, J. Method for estimating the energy consumption of electric vehicles and plug-in hybrid electric vehicles under real-world driving conditions. IET Intell. Transp. Syst. 2013, 7, 138–150. [Google Scholar] [CrossRef]
  22. Mangipinto, A.; Lombardi, F.; Sanvito, F.; Pavičević, M.; Quoilin, S.; Colombo, E. Impact of mass-scale deployment of electric vehicles and benefits of smart charging across all European countries. Appl. Energy 2022, 312, 118676. [Google Scholar] [CrossRef]
  23. Cai, L.; Zhang, Q.; Dai, N.; Xu, Q.; Gao, L.; Shang, B.; Xiang, L.; Chen, H. Optimization of Control Strategy for Orderly Charging of Electric Vehicles in Mountainous Cities. World Electr. Veh. J. 2022, 13, 195. [Google Scholar] [CrossRef]
  24. Molloy, J.; Schatzmann, T.; Schoeman, B.; Tchervenkov, C.; Hintermann, B.; Axhausen, K. Observed impacts of the Covid-19 first wave on travel behaviour in Switzerland based on a large GPS panel. Transp. Policy 2021, 104, 43–51. [Google Scholar] [CrossRef]
  25. Liu, X.; Qiao, S.; Liu, Z. A survey on load frequency control of multi-area power systems: Recent challenges and Strategies. Energies 2023, 16, 2323. [Google Scholar] [CrossRef]
  26. Correia, A.; Moura, P.; Almeida, A. Technical and Economic Assessment of Battery Storage and Vehicle-to-Grid Systems in Building Microgrids. Energies 2022, 15, 8905. [Google Scholar] [CrossRef]
  27. Shangguan, X.; Zhang, C.; He, Y.; Jin, L.; Jiang, L.; Spencer, J. Robust load frequency control for power system considering transmission delay and sampling period. IEEE Trans. Ind. Inform. 2020, 17, 5292–5303. [Google Scholar] [CrossRef]
  28. Guo, J. Application of a novel adaptive sliding mode control method to the load frequency control. Eur. J. Control 2021, 57, 172–178. [Google Scholar] [CrossRef]
  29. Li, B.; Chen, F.; Jiang, P.; Ren, J.; Liu, J.; Song, Z. Study on structure evolution features of different rank coals under shock load. Coal Sci. Technol. 2021, 49, 217–227. [Google Scholar]
  30. Kang, S.; Liu, T.; Liu, H.; Hu, Y.; Hou, X. Dynamic analysis and optimal control of stochastic information cross-dissemination and variation model with random parametric perturbations. PLoS ONE 2024, 19, e0303300. [Google Scholar] [CrossRef]
Figure 1. Distribution of regional traffic index.
Wevj 16 00035 g001
Figure 2. The structure of the trip chain.
Wevj 16 00035 g002
Figure 3. The overall framework of EV participation in the power grid.
Wevj 16 00035 g003
Figure 4. The frequency-response capability of an EV.
Wevj 16 00035 g004
Figure 5. The strategy for frequency optimization of EV clusters.
Wevj 16 00035 g005
Figure 6. Optimization model of EVs participating in energy storage for frequency response.
Wevj 16 00035 g006
Figure 7. Comparison of frequency offsets under step load disturbances.
Wevj 16 00035 g007
Figure 8. Comparison of frequency offsets under shock load disturbances.
Wevj 16 00035 g008
Figure 9. Load disturbance curve.
Wevj 16 00035 g009
Figure 10. System frequency curves.
Wevj 16 00035 g010
Figure 11. The output of EV clusters for frequency response in four locations.
Wevj 16 00035 g011
Figure 12. Comparison of system frequency curves under various coefficients of users’ active willingness.
Wevj 16 00035 g012
Table 1. Distribution rules and parameter values of characteristic quantities.
Characteristic QuantityCommon Distribution RuleParameter Value
First trip time t s Normal distributionN(8.04,1.74)
Driving time t d Logarithmic normal distributionLN(1.04,0.74)
Residence time of R t p , 1 Weibull distributionW(195.789,1.153)
Residence time of W t p , 2 Generalized extreme value distributionGEV(438.45,164.51,−0.234)
Residence time of C/S t p , 3 Generalized extreme value distributionGEV(68.52,41.76,0.657)
Table 2. Regional traffic index.
Traffic IndexCongestion ConditionCoefficient of Velocity Influence
[0,2]Unblocked1
[2,4]Basic unblocked0.67
[4,6]Light congestion0.56
[6,8]Moderate congestion0.5
[8,10]Heavy congestion0.28
Table 3. Transition probability for each place.
Transfer StateState 1State 2State 3
Transition probability A 1 = 0 0.7 0.25 0.05 A 2 = 0 0.5 0.5 0.4 0 0 0.4 0.1 0 0.4 0 0.5 0 0.1 0.1 0 A 3 = 0 0.9 0.9 0.8 0 0 0 0 0 0 0 0 0 0.1 0.1 0.2
Table 4. The parameters for EV energy storage resources.
ParameterValueParameterValue
B c , i / kW · h U(30,85) S O C 1 , i U(0.7,0.9)
E m , i / kW · h U(0.11,0.21) S O C i m a x 0.9
P E V , i m a x / kW 10 S O C i m i n 0.2
P E V , i m i n / kW 7 S O C i s e t 0.7
T E V , i / s 0.35 η i U(0.94,0.98)
Table 5. The indices of the frequency offsets.
Kind of Load DisturbanceStrategyRise Time/sOvershoot/puSetting Time/s
Step load disturbance10.510.0153126
20.0830.001809
30.0730.001748
Shock load disturbance10.480.0139122
20.120.003058
30.0980.002657
Disclaimer/Publisher’s Note: The statements, opinions and data contained in all publications are solely those of the individual author(s) and contributor(s) and not of MDPI and/or the editor(s). MDPI and/or the editor(s) disclaim responsibility for any injury to people or property resulting from any ideas, methods, instructions or products referred to in the content.

