Article

Simple Method for Determining Loss Parameters of Electric Cars

Department of Electrical Engineering, Wismar University of Applied Sciences, 23966 Wismar, Germany
*
Author to whom correspondence should be addressed.
World Electr. Veh. J. 2024, 15(7), 298; https://doi.org/10.3390/wevj15070298
Submission received: 29 May 2024 / Revised: 21 June 2024 / Accepted: 1 July 2024 / Published: 3 July 2024

Abstract

:
Manufacturers of electric cars provide their vehicles with many technical data that are important for the user. This includes information on dimensions, mass, performance, consumption, battery capacity, range, payload, etc. However, some interesting parameters are usually withheld from the end user. These parameters include, for example, the loss in the energy flow from the battery to the driving wheels or the rolling resistance of the vehicle. However, since these loss parameters have a significant influence on the vehicle’s consumption, it is of interest to know them. This article presents a method for determining these two parameters. The basis for this are simple driving tests that can be carried out by anyone on public roads.

1. Introduction

1.1. Context

The distribution of electric vehicles has risen significantly within the last few years. In particular, the increasing range of common electric cars has led to an enhanced interest in the last 10 years.
One fact that has also pushed the distribution has certainly been the regulation passed by the EU that no petrol or diesel vehicles may be sold from 2035 onwards [1]. The reason for this intense law is to reach the goal of zero emissions of cars. Due to that, people need to change from cars with combustion engines to cars that do not emit CO2 in the near future anyway. Even though this rule does not affect existing cars, the infrastructure (e.g., petrol stations and workshops with spare parts) will also become more rare, making it increasingly inconvenient to keep having an emission-emitting car. In order to promote the spread of electrically powered vehicles in advance, various measures have been taken. In addition to government measures, such as a financial subsidy, an exemption from motor vehicle tax, or a subsidy for the home wallbox, institutions in the private sector, such as some stores, are supporting the distribution by providing free charging options.
With increasing popularity of electrically powered vehicles and rising costs for providers of free charging options, these hardly exist anymore. At the same time, the electricity costs are, among other things, due to the increased demand at a high level so the owner of the electric vehicle is also confronted with high ongoing energy costs. In addition, there is still an inadequate charging infrastructure in many areas and the charging time for the batteries is much longer compared to the refueling time of vehicles with combustion engines.
To increase the driving range, a larger battery can be used or the losses of the vehicle may be reduced. A larger battery would cause much higher purchasing costs of the car and, in addition, the increasing weight of the car will lead to risen energy costs. Therefore, the aim should be to reduce the losses, which means efficiency is to be increased.

1.2. Literature Review

Studies concerning energy efficiency have been investigated, for example, in [2,3]. In [2], a deeper view of the technology of an electric car was conducted and components like the DC–AC converter (from battery to engine) were examined. Also, the engine itself and the assembly of the windings were considered, as well as single electric components like different types of capacitors or transistors. Therefore, this study focused more on influences on the efficiency of electric cars and potential improvements from the view of the manufacturer. In [3], the efficiency of different electric car motors has been researched by using simulation models. Due to that, this paper also affected manufacturers of electric cars and researchers more because the usual owner will not optimize or change the motor itself. Aside from that, simulation tools and the knowledge of how to use them would be necessary for considering the different influences on efficiency.
Further studies regarding the range and the influence of different components on it have been accomplished in [4,5]. In [4], the general influences on the total efficiency, such as weight, aerodynamics, rolling resistance, or the characteristics of the motor, were examined. The driving style of the person executing the tests was also taken into account. The simulation tool used here was “Matlab”. Real measurement data and test drives were used for the investigations here. Similar studies were also carried out in [5]. Different influences on the range of a vehicle were also analyzed here. The calculations and modeling were carried out here using the “AVL Cruise software” simulation tool. Both papers show options for increasing the range. Some of these can be implemented by the user (e.g., by driving more slowly) while others are linked to unchangeable vehicle characteristics (e.g., the installed battery size).
The determination of efficiency characteristics, such as the rolling resistance of electric cars, is crucial since one of the most important parameters for passenger cars is energy consumption. Therefore, research efforts for examining the rolling resistance of tires for electric vehicles have been intensified in [6,7]. The rolling resistance has a significant influence on the range of electric vehicles. This factor can be adjusted by the user through the choice of tires (dimension and manufacturer), the type (summer, winter, or all-season tires), and also the selected pressure. In [6], the importance and high influence of vehicle tires on the range was explained. The rolling resistance, taking into account the gradient and the surface condition of the road, was determined in [7]. Here, the rolling resistance was calculated using recursive algorithms and the use of various filters. Aside from that, knowledge of the losses in the drive train is necessary, which requires the use of a roller dynamometer.
The work of [8] dealt with the determination of the rolling resistance force F r but also with the determination of the air drag resistance F d . Similar to [7], the “Vehicle longitudinal dynamic model” was used here, in which the two resistance forces together with the downhill force F grad and the acceleration force F acc represent the total force F total acting on the vehicle:
F total M · ω v = F r m · g · c r · cos α + F d 1 2 · ρ · A · c d · v 2 + F grad m · g · sin α + F acc m · a
The individual forces are, in turn, made up of the quantities shown in Equation (1) ( M : motor torque; ω : motor speed; v : vehicle speed; m : total vehicle mass; g : acceleration due to gravity; c r : rolling resistance coefficient; α : inclination angle of the road; ρ : density of air; A : projected frontal area of the vehicle; c d : drag coefficient and a : acceleration of the vehicle). Various estimation algorithms (recursive least squares filters, Kalman filters, and neural networks) are used to determine the unknown variables. Matlab is used for the modeling and a Can-BUS-OBD module with the associated “OBDWiz” software is also applied for the experimental investigation. In [9], Matlab was also used to determine vehicle parameters and, similar to [8], the objective here was to determine the rolling friction coefficient and the drag coefficient.
The influences of various parameters on consumption and, thus, efficiency were also simulated with Matlab in [10]. Here, in the literature research, different rolling resistance coefficients and drag coefficients were presented depending on the vehicle type and the ground conditions. Among other things, the model established a direct relation between the drag coefficient and the energy consumption, which also allows us to make an indication about efficiency.

1.3. Statement of the Problem

In the previous subchapter, different papers have been presented that deal with the determination of loss parameters of electric cars. These methods are based on elaborate driving data acquisition methods and complex algorithms of software tools like artificial neural networks to determine loss parameters. Especially, the simulation tool Matlab has been used a lot in the different elaborations. For experimental studies of the previous examinations, data have been collected from the literature or additional car components, like an OBD controller or even a dynamometer, have been applied.
The results of the various works have all been appropriate and consistent but they all have one thing in common: they require additional advanced tools. Matlab is a standard simulation tool used in many of these elaborations but it is usually not available for the common driver of an electric vehicle. Aside from owning the software, deeper knowledge and skills are necessary to use the software and to understand and evaluate the results. Additional experimental equipment also requires deeper knowledge about what is the right tool and how to apply it correctly. Furthermore, practical equipment often comes with high costs and is often not convenient to use.

1.4. Approach

The method described in this paper has been kept as simple as possible to enable anyone to perform the investigation. The approach is based on simple driving data that can be collected on public roads without the need for special equipment. Furthermore, the calculations needed to be conducted for this method can be executed with any simple spreadsheet program like “Excel”.
This study is not about optimizing the power electronics used in the vehicle or the drive train, which the user usually cannot influence, but rather about an approach that makes the effect of feasible optimizations measurable. A reduction in ongoing electricity costs and a decrease in the charging time or frequency of charging cycles can be achieved by driving in an energy-saving manner.
At first, it is required to determine the actual efficiency in order to quantitatively identify possible optimization approaches. All that is necessary for that is to determine the vehicle’s consumption at different speeds and also the ambient temperature to find out the air pressure. It is also necessary to conduct the tests in similar environmental conditions. This means that the tests should be conducted at similar ambient temperatures (to keep the impact of the heating or cooling control of the battery as constant as possible). The system and battery should be in a steady state to avoid wrong results due to additional energy consumption by the thermal control of the battery. Aside from that, all tests should be conducted in dry conditions, especially since water on the road has to be displaced by the wheels otherwise, therefore resulting in a higher energy consumption. Since it is usually not possible to pick the same route for all different speeds, it must be taken into account that the road surface of all chosen routes should be similar to achieve a constant rolling resistance coefficient. For avoiding height differences, the tests should be conducted in both directions and average values should be applied. Finally, to avoid further wrong outcomes within the air drag resistance, it is best to conduct the tests on windless days.
Using the mathematical model based on a least squares method, a mathematical function can then be defined that determines the dependency between vehicle speed and energy consumption using a spreadsheet program. The course of this function is very similar to the course of the function that reveals the total power consumption of the vehicle in dependence on speed (third-degree polynomial). Thus, by adapting the function of power consumption to the recorded energy consumption values, the prefactors can be determined using a coefficient comparison. The coefficients contain the desired parameters (efficiency and rolling resistance). However, knowledge of the drag coefficient and the projected frontal area of the vehicle is necessary for this process, whereas these vehicle parameters are usually provided by the manufacturer or can be ascertained elsewhere. Regarding this, apart from small variation possibilities, such as the attachment of a spoiler, there is only little room for adjustments.
With the data determined, a user can check the influence of rolling resistance and there are several possibilities to influence it positively. On the one hand, a series of measurements could be carried out at different tire pressures in order to find the best compromise between consumption and comfort for the user. Also, the comparison of, e.g., all-season to summer and winter tires, can be accomplished in this way. Knowing the degree of efficiency allows even more investigation variables. The determined consumption data already show the influence of speed on this. In addition, the impact on the efficiency of different driving modes or the interior temperature and much more can be researched.
In the following chapters, the procedure of determining the vehicle parameters is presented and then confirmed by using a series of tests and achieving plausible results.

2. Materials and Methods

2.1. Vehicle Energy Considerations

The movement of a vehicle on actual roads under real environmental conditions is only possible with a finite energy requirement. If the energy requirement is related to a specific distance traveled, this results in the vehicle’s energy consumption. In most regions, it is common practice to specify energy consumption for a distance of 100 km. For vehicles with combustion engines, the energy is usually only stated indirectly in liters of the corresponding fuel type. If necessary, the energy requirement can be calculated using the calorimetric value of the fuel. For electric vehicles, however, it is common to directly specify the energy W in kWh. This means that the instant consumption C can be defined according to Equation (2) and stated in kWh/100 km:
C = d W d s
The energy requirement of a vehicle depends on a variety of parameters and can basically be divided into three categories. The first category includes all energy losses in the drive train, which are determined by the energy conversions in the vehicle. The energy provided by the vehicle’s energy storage goes through a series of conversion and transmission stages all the way to the driving wheels, which are associated with energy losses. Electric vehicles often use a transmission with only one gear. However, there are also vehicle manufacturers who use transmissions with multiple gears. The energy losses of transmissions with multiple gears are typically not constant. This aspect should be taken into account when considering losses. In electric vehicles, chemical energy is converted into electrical energy in the vehicle battery. The discharging of the vehicle battery already generates heat. This heat loss is caused by the internal resistance of the battery. The internal resistance of the battery determines the energy loss and is dependent on temperature. The vehicle motor driving the wheels converts the electrical energy into mechanical energy. This, in turn, leads to conversion losses. The power of the motor is finally controlled by power electronic components, which also have a finite degree of efficiency. The energy losses of the drive train depend, in total, on the power drawn and are therefore influenced by the driving operation.
A second category includes the energy required to operate all of the vehicle’s electrics and electronics. All control modules, displays, auxiliary units, vehicle lighting, power steering, vehicle air conditioning, and the infotainment system must be supplied with energy for operation. Temperature control of the vehicle battery also requires a significant amount of energy and can be assigned to this category. However, with the exception of power steering, the energy requirement of the second category is hardly dependent on driving, and also occurs when the vehicle is stationary.
The third category includes the energy for the actual movement of the vehicle. This energy is determined exclusively by driving and can be divided into two parts. The first part is reversible and is necessary for accelerating the vehicle or overcoming height differences. This energy component is stored or released again in the form of potential energy (differences in height) or kinetic energy (speed). The second part, on the other hand, is irreversible and is determined by the driving resistance. The driving resistance includes the rolling resistance and the air drag of the vehicle. The energy required to overcome driving resistance depends on the design properties of the vehicle, the weather conditions, and the condition of the road.

2.2. Energy Flow Modeling of Electric Vehicles

To drive at a certain constant speed v , a corresponding drive power P w is required so that the vehicle’s wheels transfer to the road. This wheel performance is defined by the air drag F d and the rolling resistance F r according to Equation (3):
P w = F d + F r · v
According to Equation (4), the force to overcome the air drag F d depends on the vehicle speed v , the wind speed v wind , the air density ρ , the air resistance coefficient c d , and the projected frontal area of the vehicle A :
F d = v + v wind 2 · ρ 2 · c d · A
Equation (5) defines the force to overcome the rolling resistance F r . This depends on the total vehicle mass m , the acceleration due to gravity g , the rolling resistance coefficient c r , and the inclination angle α of the road:
F r = m · g · c r · cos α + sin α
Since c r is influenced by the cosine function of the road inclination angle, moderate road gradients have almost no influence on the resulting force. Even a very steep road with a gradient of 20% (corresponding angle 11.3°) results in a deviation of only 2%. Therefore, the cos α factor may also be replaced by Factor 1 without losing noticeable accuracy. After inserting all variables, Equation (6) determines the drive power:
P w = ( ρ 2 · c d · A · v + v wind 2 air   drag   force + m · g · c r · cos α + sin α rolling   resistance   force ) · v
The drive power P w must be provided by the vehicle’s battery. As already explained above, the flow of energy from the battery to the wheels is not free of losses. Therefore, the battery power P b is greater than the drive power. However, it is difficult to record individual losses from the battery, power electronics, and motor, taking into account all influencing parameters and their dependencies. Therefore, the losses in the energy flow are only taken into account by the global efficiency η . This efficiency therefore represents an average for the losses in the entire energy flow and across all operating states of the vehicle. Finally, the power consumption of the entire vehicle energy supply, also described above, must be taken into account for the overall performance. This also occurs when the vehicle is stationary and is also constant for fixed settings and under constant ambient conditions. It is taken into account additively with the standby power P s . Equation (7) shows the relation:
P b = P w η + P s
After substituting Equation (6) into Equation (7), the complete relation for the battery power is obtained according to Equation (8):
P b = ρ · c d · A · v + v wind 2 2 · η + m · g · c r · cos α + sin α η · v + P s
For the simplified application of Equation (8), the wind speed v wind and the inclination angle of the road α are each set to zero. This is permissible if the test drives are carried out on a calm and plane road.
Under these conditions, a simplified cubic function of the driving speed v with the three parameters a, b, and c, according to Equation (9), is obtained for the battery power:
P b = ρ · c d · A 2 · η a · v 3 + m · g · c r η b · v + P s c
If the functional parameters a , b , and c can be determined using the collection of driving data and mathematical methods, then the desired loss values for efficiency and rolling resistance can be determined.
Consumption values and driving speeds are available as data for every electric vehicle. The relation according to Equation (2) applies to the instant consumption. If the energy in this equation is expressed using the battery power, Equation (10) will be obtained:
C = d W b d s = P b · d t d s = P b v
Solving the equation for battery power yields the simple relationship of Equation (11):
P b = C · v
This makes it possible to determine the vehicle’s battery performance directly from the product of consumption and driving speed. To determine the functional parameters, all that is required is the collection of consumption values at various constant driving speeds.

2.3. Procedure of Driving Data Collection

An electric vehicle from Volkswagen was used for the tests. Figure 1 shows a picture of the vehicle. Table 1 lists the technical data of the vehicle relevant to the tests.
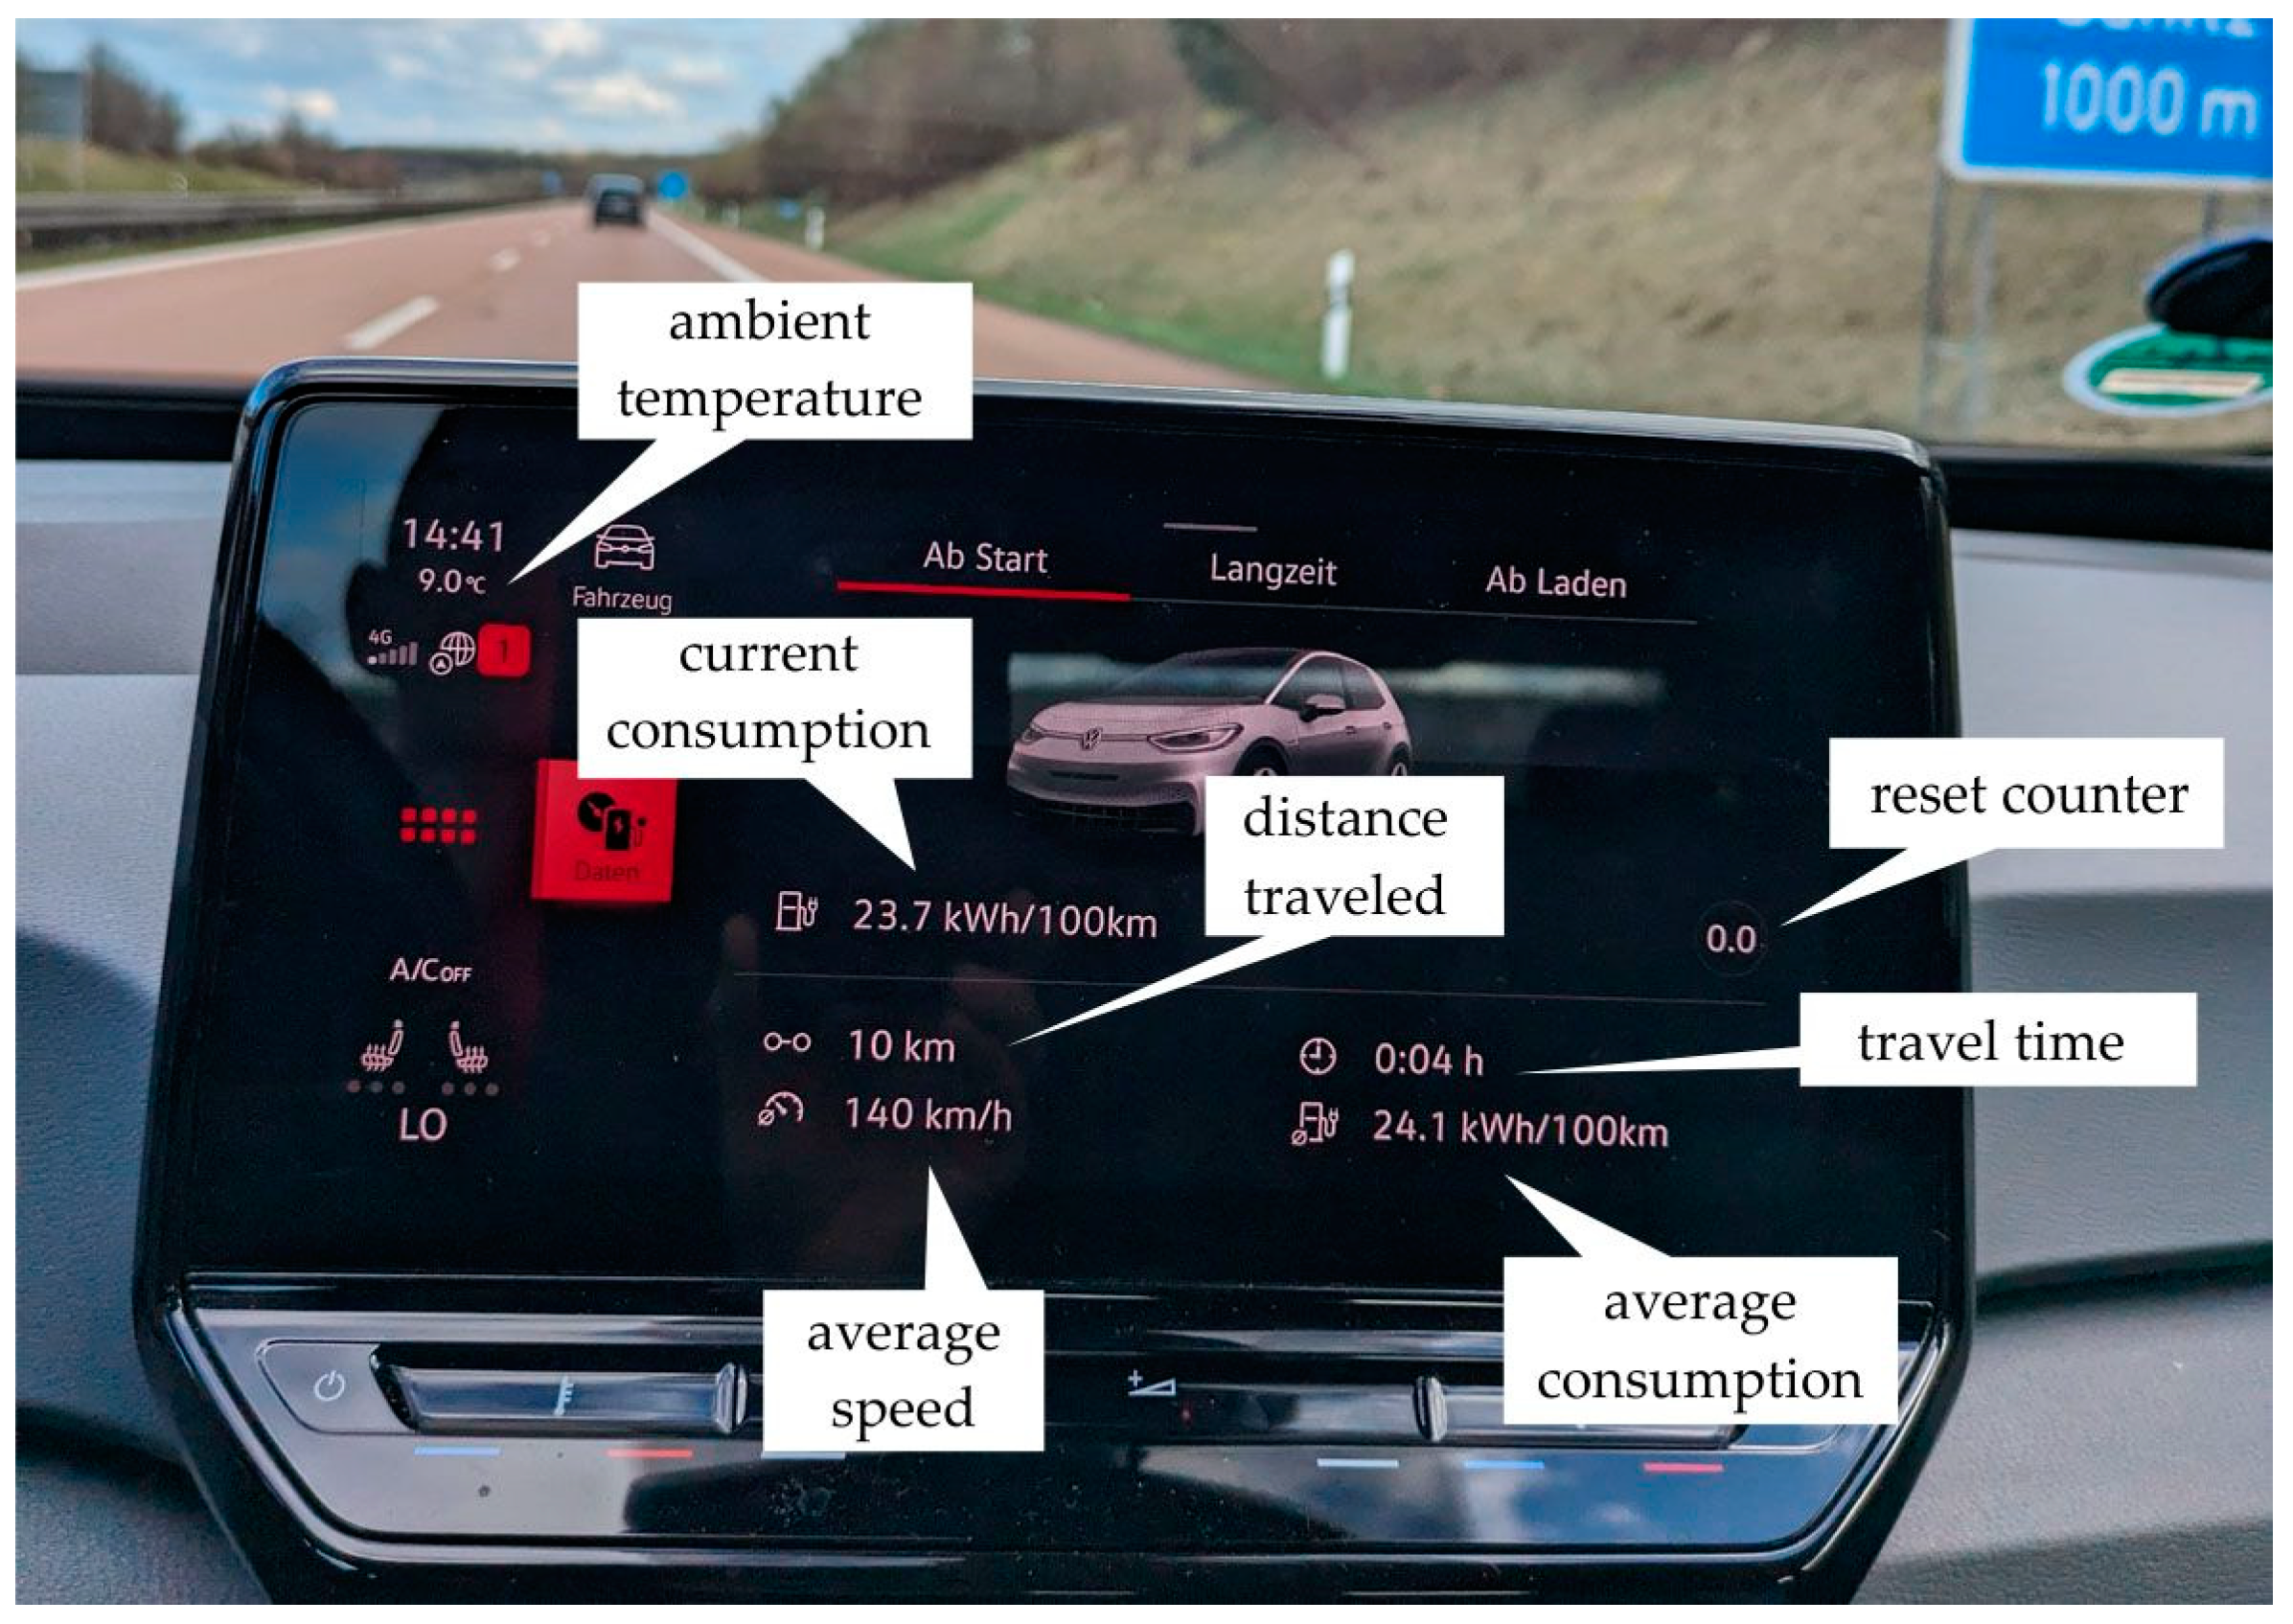
For the test drives, the values for consumption, average speed, and ambient temperature displayed after a trip at a constant driving speed were collected. The counter for the driving data was reset for each measurement run. Figure 2 shows the display screen of the vehicle with the relevant driving data while driving.
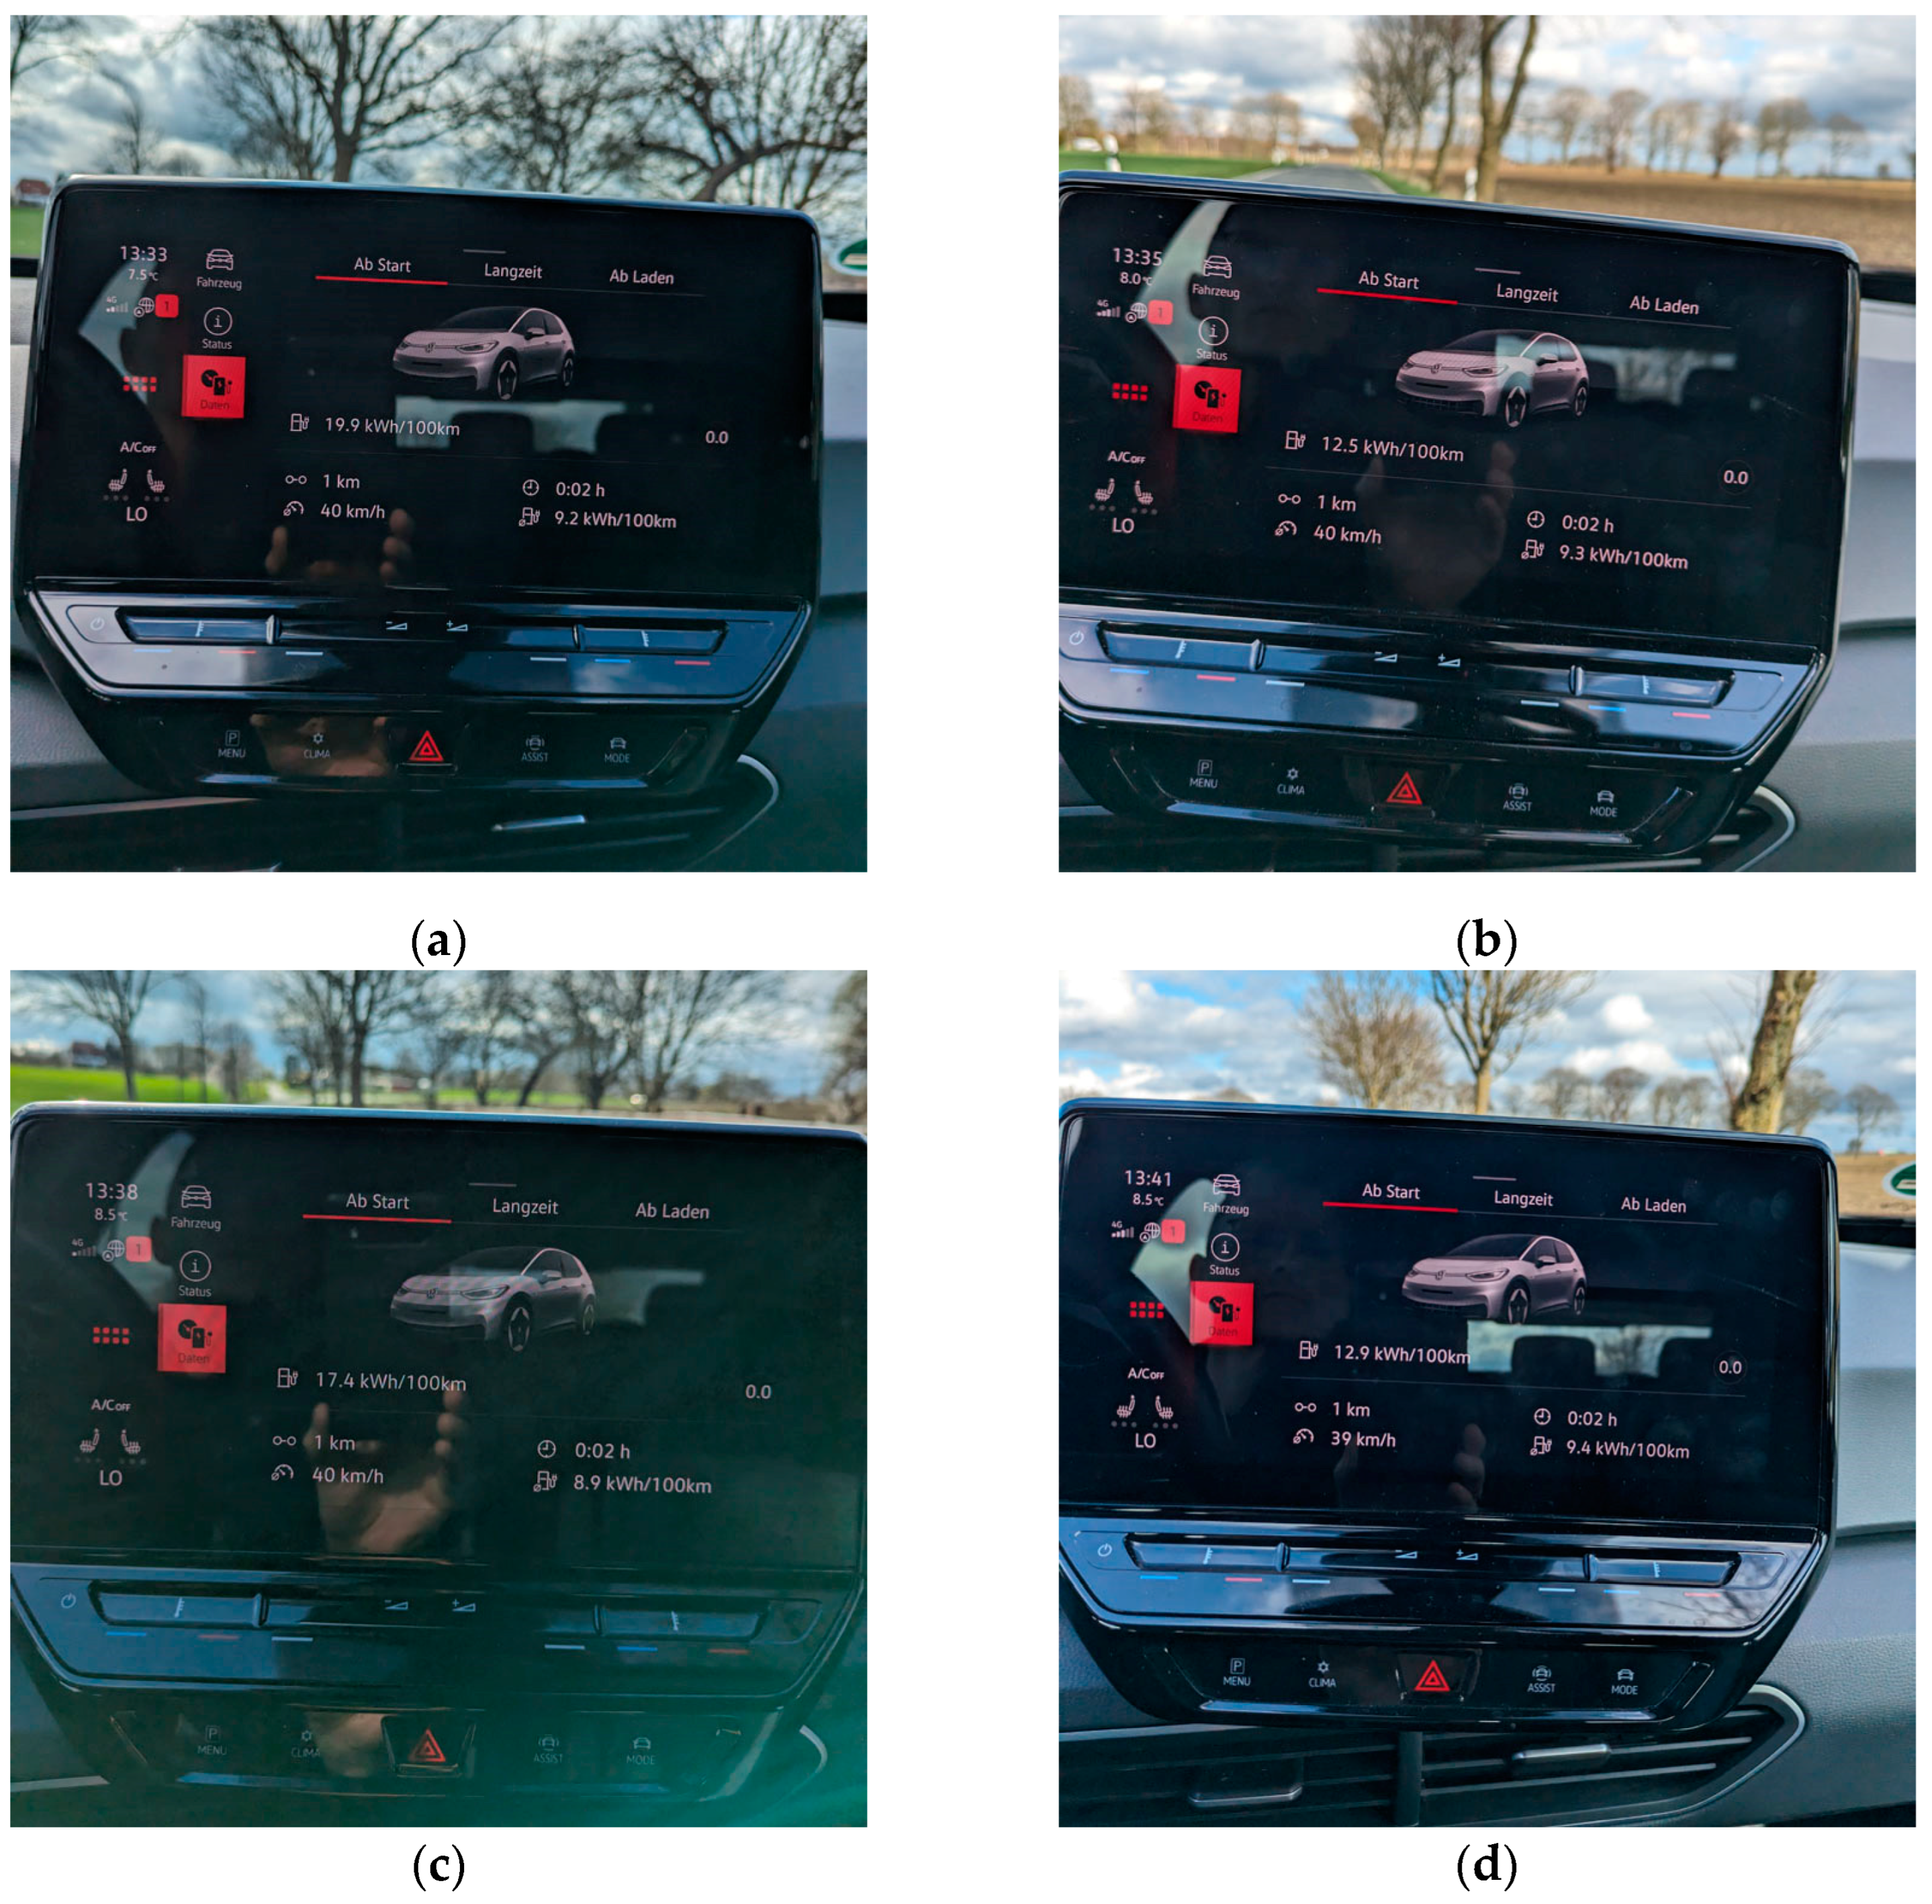
The vehicle’s instant consumption naturally fluctuates greatly while driving, which is why average values were used for consumption. Since these consumption values must also be determined as independently as possible of the influencing factors of the function, in accordance with Equations (8) or (9), the test drives should be carried out in a narrow time window and under constant ambient conditions. Furthermore, the roads used for the test drives should be sufficiently plane and have a comparable road surface. The test drives in this experiment were carried out on asphalt roads. This means that the values for driving resistance in particular are not easily comparable with other road surfaces. Under real road and traffic conditions, it is not possible to keep all influencing factors perfectly constant. However, not all factors have the same influence on the results. For example, the actual fluctuation in air density during the drives has little influence on the results. Differences in altitude on the road and wind conditions, on the other hand, have a greater influence. For this reason, the test drives were designed as driving cycles. Each driving cycle consists of an outward and corresponding return run on the same route. Furthermore, two or more driving cycles were carried out for each speed in order to compensate for fluctuations. Although the differences do not compensate for each other in every respect due to the non-linear power curve, this method can provide sufficiently accurate results for small fluctuations. The vehicle’s automatic speed control function (ACC) was used to maintain a constant driving speed. The individual measurements were carried out in such a way that the vehicle was first brought to a constant speed and then the measurement was started by resetting the driving data counter. This means that the average values do not contain any braking or acceleration processes that would significantly change the measured values. The average values displayed for consumption, speed, and ambient temperature were read from the values of the individual drives and average values were immediately formed from all drives at the same speed. Figure 3 shows an example of the display values for the target speed of 40 km/h, which resulted from two driving cycles on the same route. It should be noted that the adjusted target speeds generally differ from the average values actually displayed. This is due to the vehicle-specific calculation method.

2.4. Mathematical Determination of the Parameters of the Power Function

The power function introduced with Equation (9) gets its shape by the parameters a , b , and c . The parameter c determines the intersection with the power axis and, therefore, directly represents the power consumption of the vehicle when it is at a standstill. In the first step, the parameter c of the function was therefore determined by reading the power consumption of the vehicle when it is at a standstill. In order to keep this value constant during the test drives, the vehicle air conditioning was switched off. Since all drives were carried out during the day, the headlights were also switched off. Figure 4 shows the display at a standstill. The vehicle shows a consumption value of 0.3 kWh/h. This corresponds to a power consumption of 0.3 kW. This means that the parameter c has now been found out.
In the second step, the remaining function parameters a (cubic parameter) and b (linear parameter) are determined. A suitable mathematical method for this is the Gaussian least squares method. With this method, the parameters a and b are determined in such a way that a minimum of the sum of the squared deviations between the measured power values and the corresponding power values from the power function determines the results. With the individual pairs of values ( v i , P i ) for speed and battery power, this leads to Equation (12):
i P i a · v i 3 + b · v i + P s 2 Min !
To determine the functional minimum, Equation (12) must first be partially differentiated according to the parameters a and b and then set to zero. This leads to Equations (13) and (14):
a : 2 i P i a · v i 3 + b · v i + P s · v i 3 = 0
b : 2 i P i a · v i 3 + b · v i + P s · v i = 0
After multiplying and rearranging, the system of equations results according to Equation (15):
i P i · v i 3 P s · i v i 3 i P i · v i P s · i v i = i v i 6 i v i 4 i v i 4 i v i 2 · a b
The system of equations can be solved using Cramer’s rule. Up next, parameter a is calculated by Equation (16) and parameter b is calculated according to Equation (17):
a = i P i · v i 3 P s · i v i 3 · i v i 2 i P i · v i P s · i v i · i v i 4 i v i 6 · i v i 2 i v i 4 2
b = i P i · v i P s · i v i · i v i 6 i P i · v i 3 P s · i v i 3 · i v i 4 i v i 6 · i v i 2 i v i 4 2

3. Results

3.1. Driving Results

The driving data for consumption were determined according to the procedure described above for a range from walking speed up to 150 km/h. Table 2 lists the results. The battery power is calculated for obtaining the rolling resistance coefficient and the table also contains the air density concerning the respective ambient temperature.
The air density depends on temperature and pressure and was calculated according to Equation (18):
ρ = p T · R s
The base atmospheric pressure with a value of 1013.25 hPa was used for the air pressure p . The value of the specific gas constant R s is 287.058 J/(kg K).
The parameters a and b were then calculated from the data in Table 2 according to Equations (16) and (17). Table 3 shows the results for all three functional parameters.
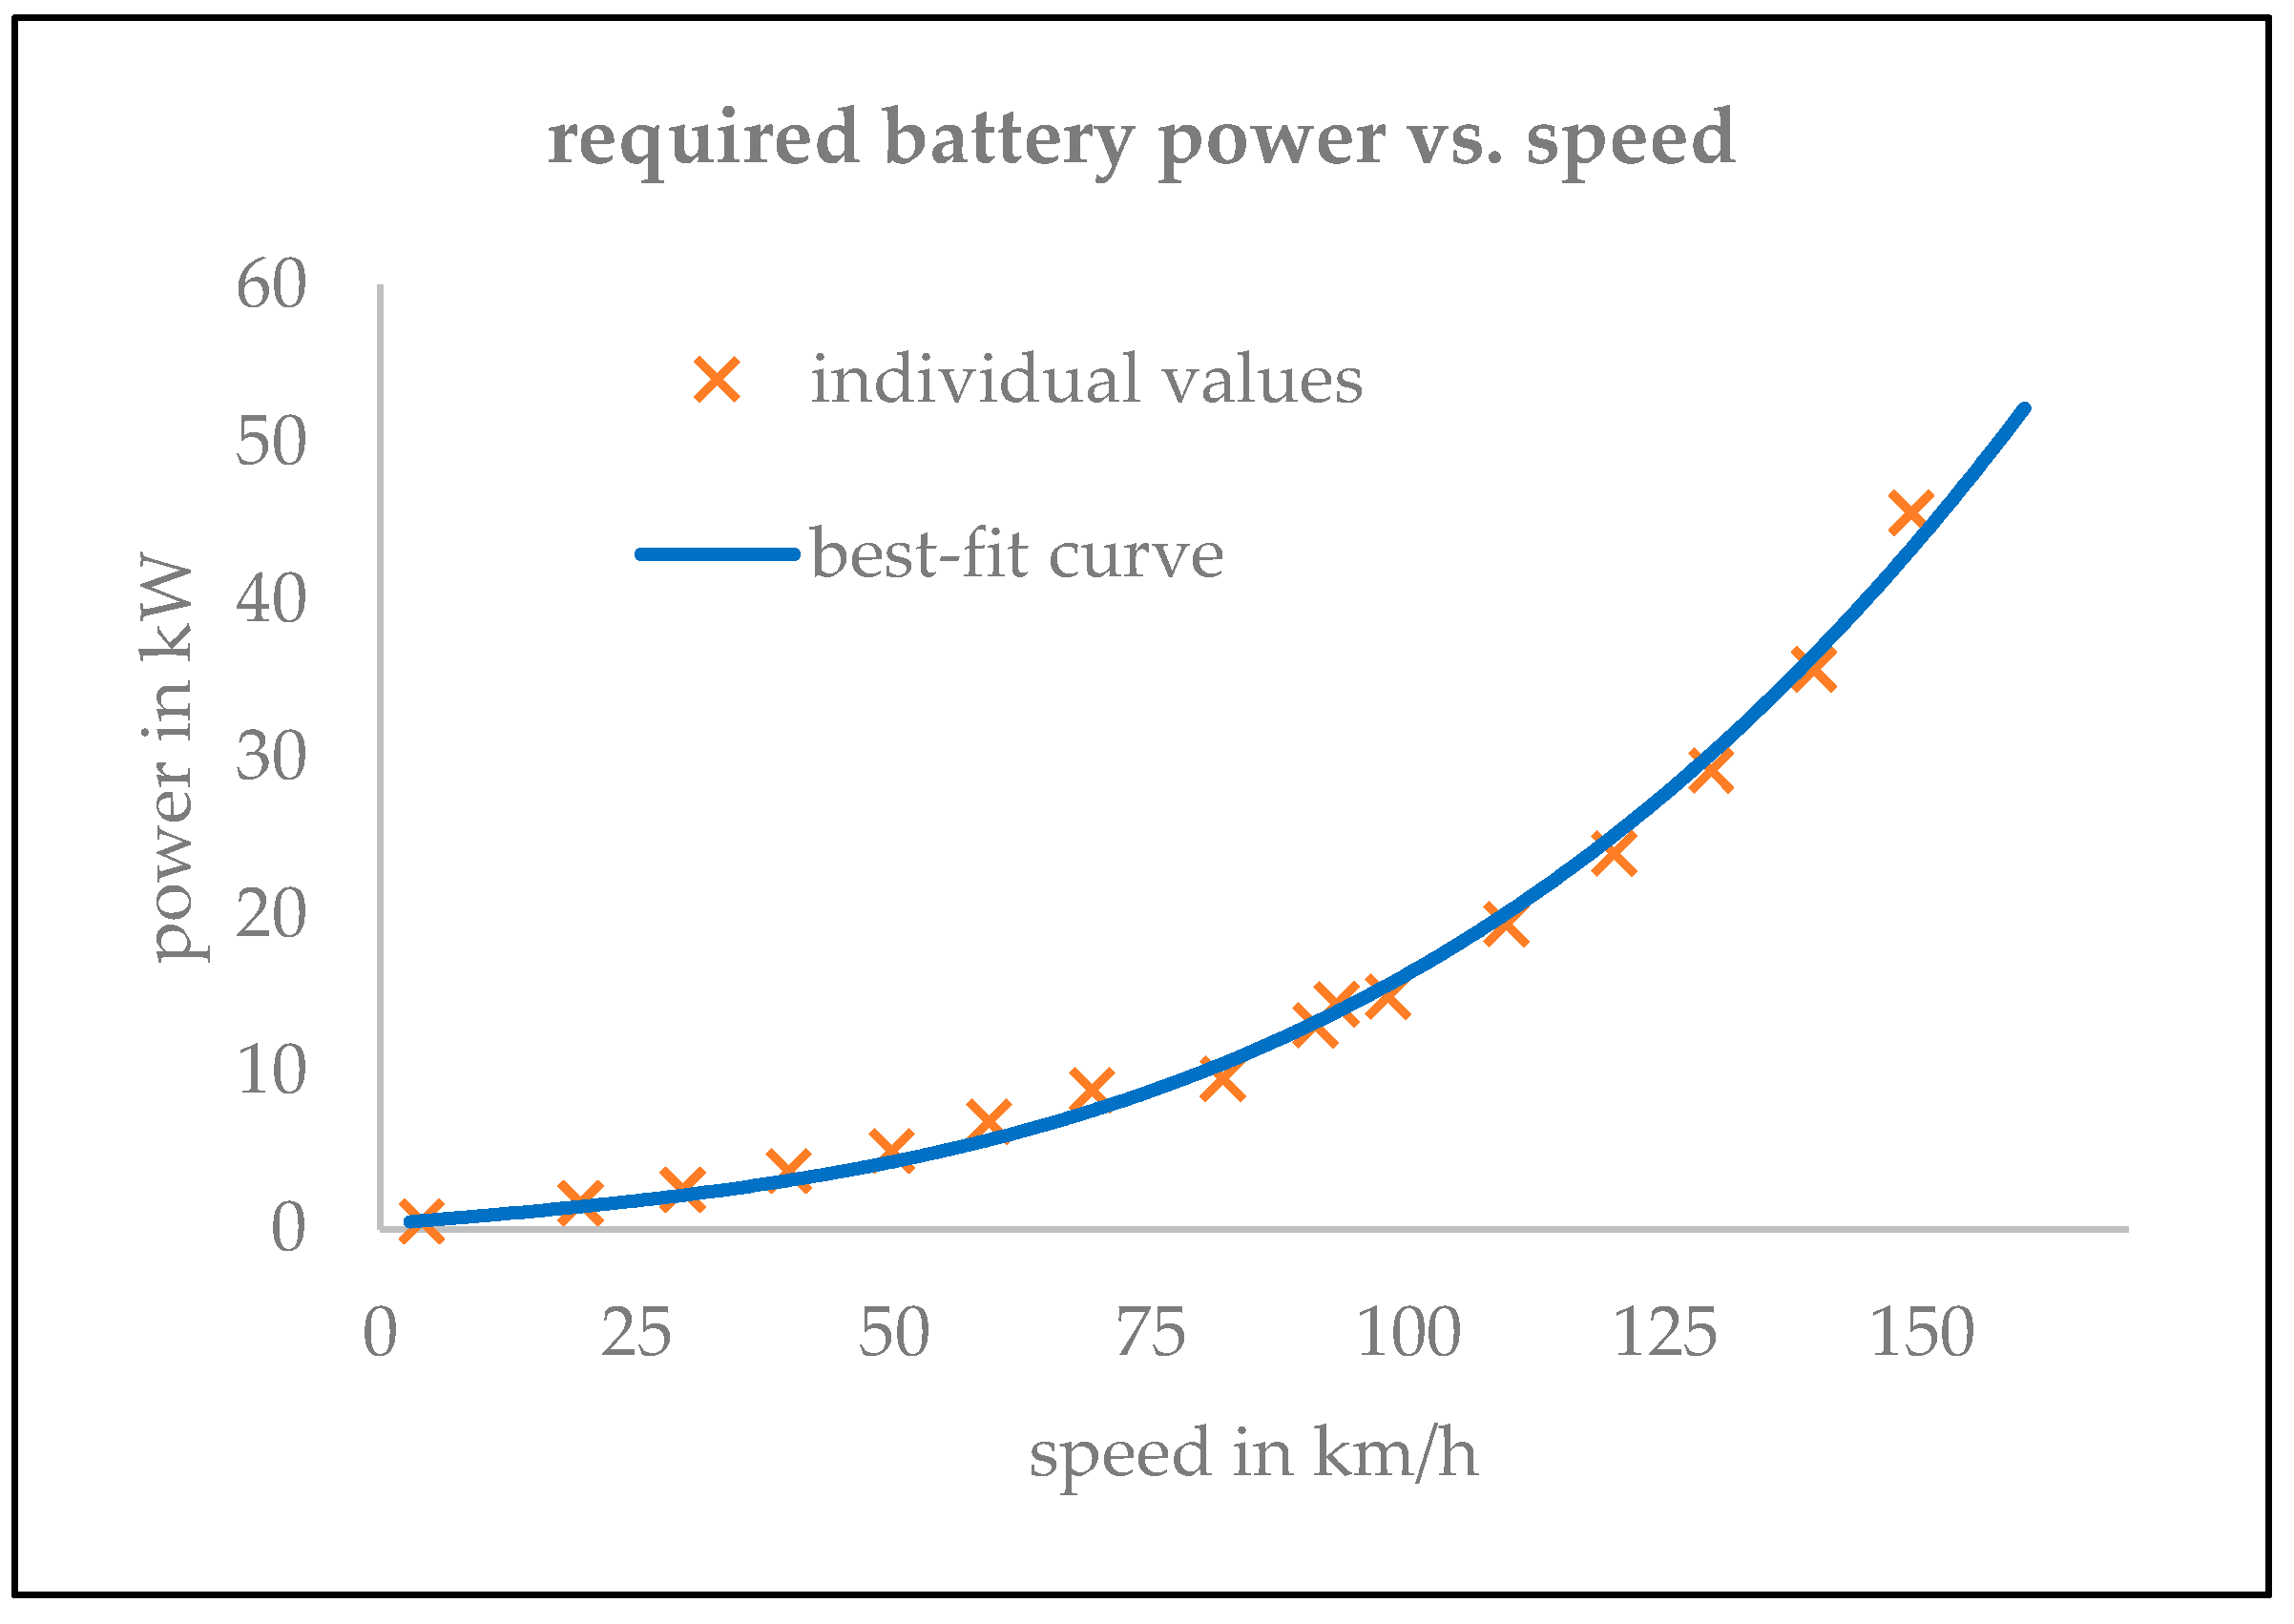
By this approach, the air drag force (parameter a ) is directly determined without using any technically complicated method that other authors have used, such as [11]. With the help of the determined parameters, the functional equation for the battery power can now be displayed together with the individual values from Table 2 in a diagram (see Figure 5).

3.2. Determination of Vehicle Loss Parameters

The parameter a of the power function of Equation (9) contains the values for air density, projected vehicle frontal area, drag coefficient, and efficiency. The efficiency can therefore be calculated directly using Equation (19) in a first step:
η = ρ · c d · A 2 · a
The value of the air density used for Equation (19) was calculated from the average of the ambient temperatures according to Table 2. The remaining vehicle data were used according to Table 1 and Table 3. Table 4 lists all the used parameters.
For the efficiency, a value was calculated according to Equation (19) and using the values from Table 4:
η 80 % .
This value is an average for the speed range under consideration and represents the total losses in the energy flow from the battery to the driving wheels.
In the second step, the parameter b of the power function can be determined. According to Equation (9), the parameter b corresponds to the rolling resistance of the vehicle, which is influenced by the efficiency. After inserting Equation (19), the relation shown in Equation (20) results for the rolling resistance:
F r = b · η = b a · ρ · c d · A 2
Using the values from Table 3 and Table 4, the rolling resistance of the vehicle can be obtained with a value of:
F r 150   N
If the values for vehicle mass and acceleration due to gravity continue to be used in accordance with Equation (9), the rolling resistance coefficient results in accordance with Equation (21):
c r = F r m · g = b a · ρ · c d · A 2 · m · g
By using the values from Table 3 and Table 4 again, a factor of:
c r 0.008
is obtained for the rolling resistance coefficient. It is therefore determined without using any additional devices, like a trailer, which has been applied in [12].

3.3. Consumption Considerations

By knowing the parameters a , b , and c of the functional equation for the battery power, the functional equation of the consumption can be calculated from the relation of Equation (10). To do this, Equation (9) must be divided by the driving speed. This results in the functional relation for consumption as a function of driving speed according to Equation (22):
C = a · v 2 + b + c v
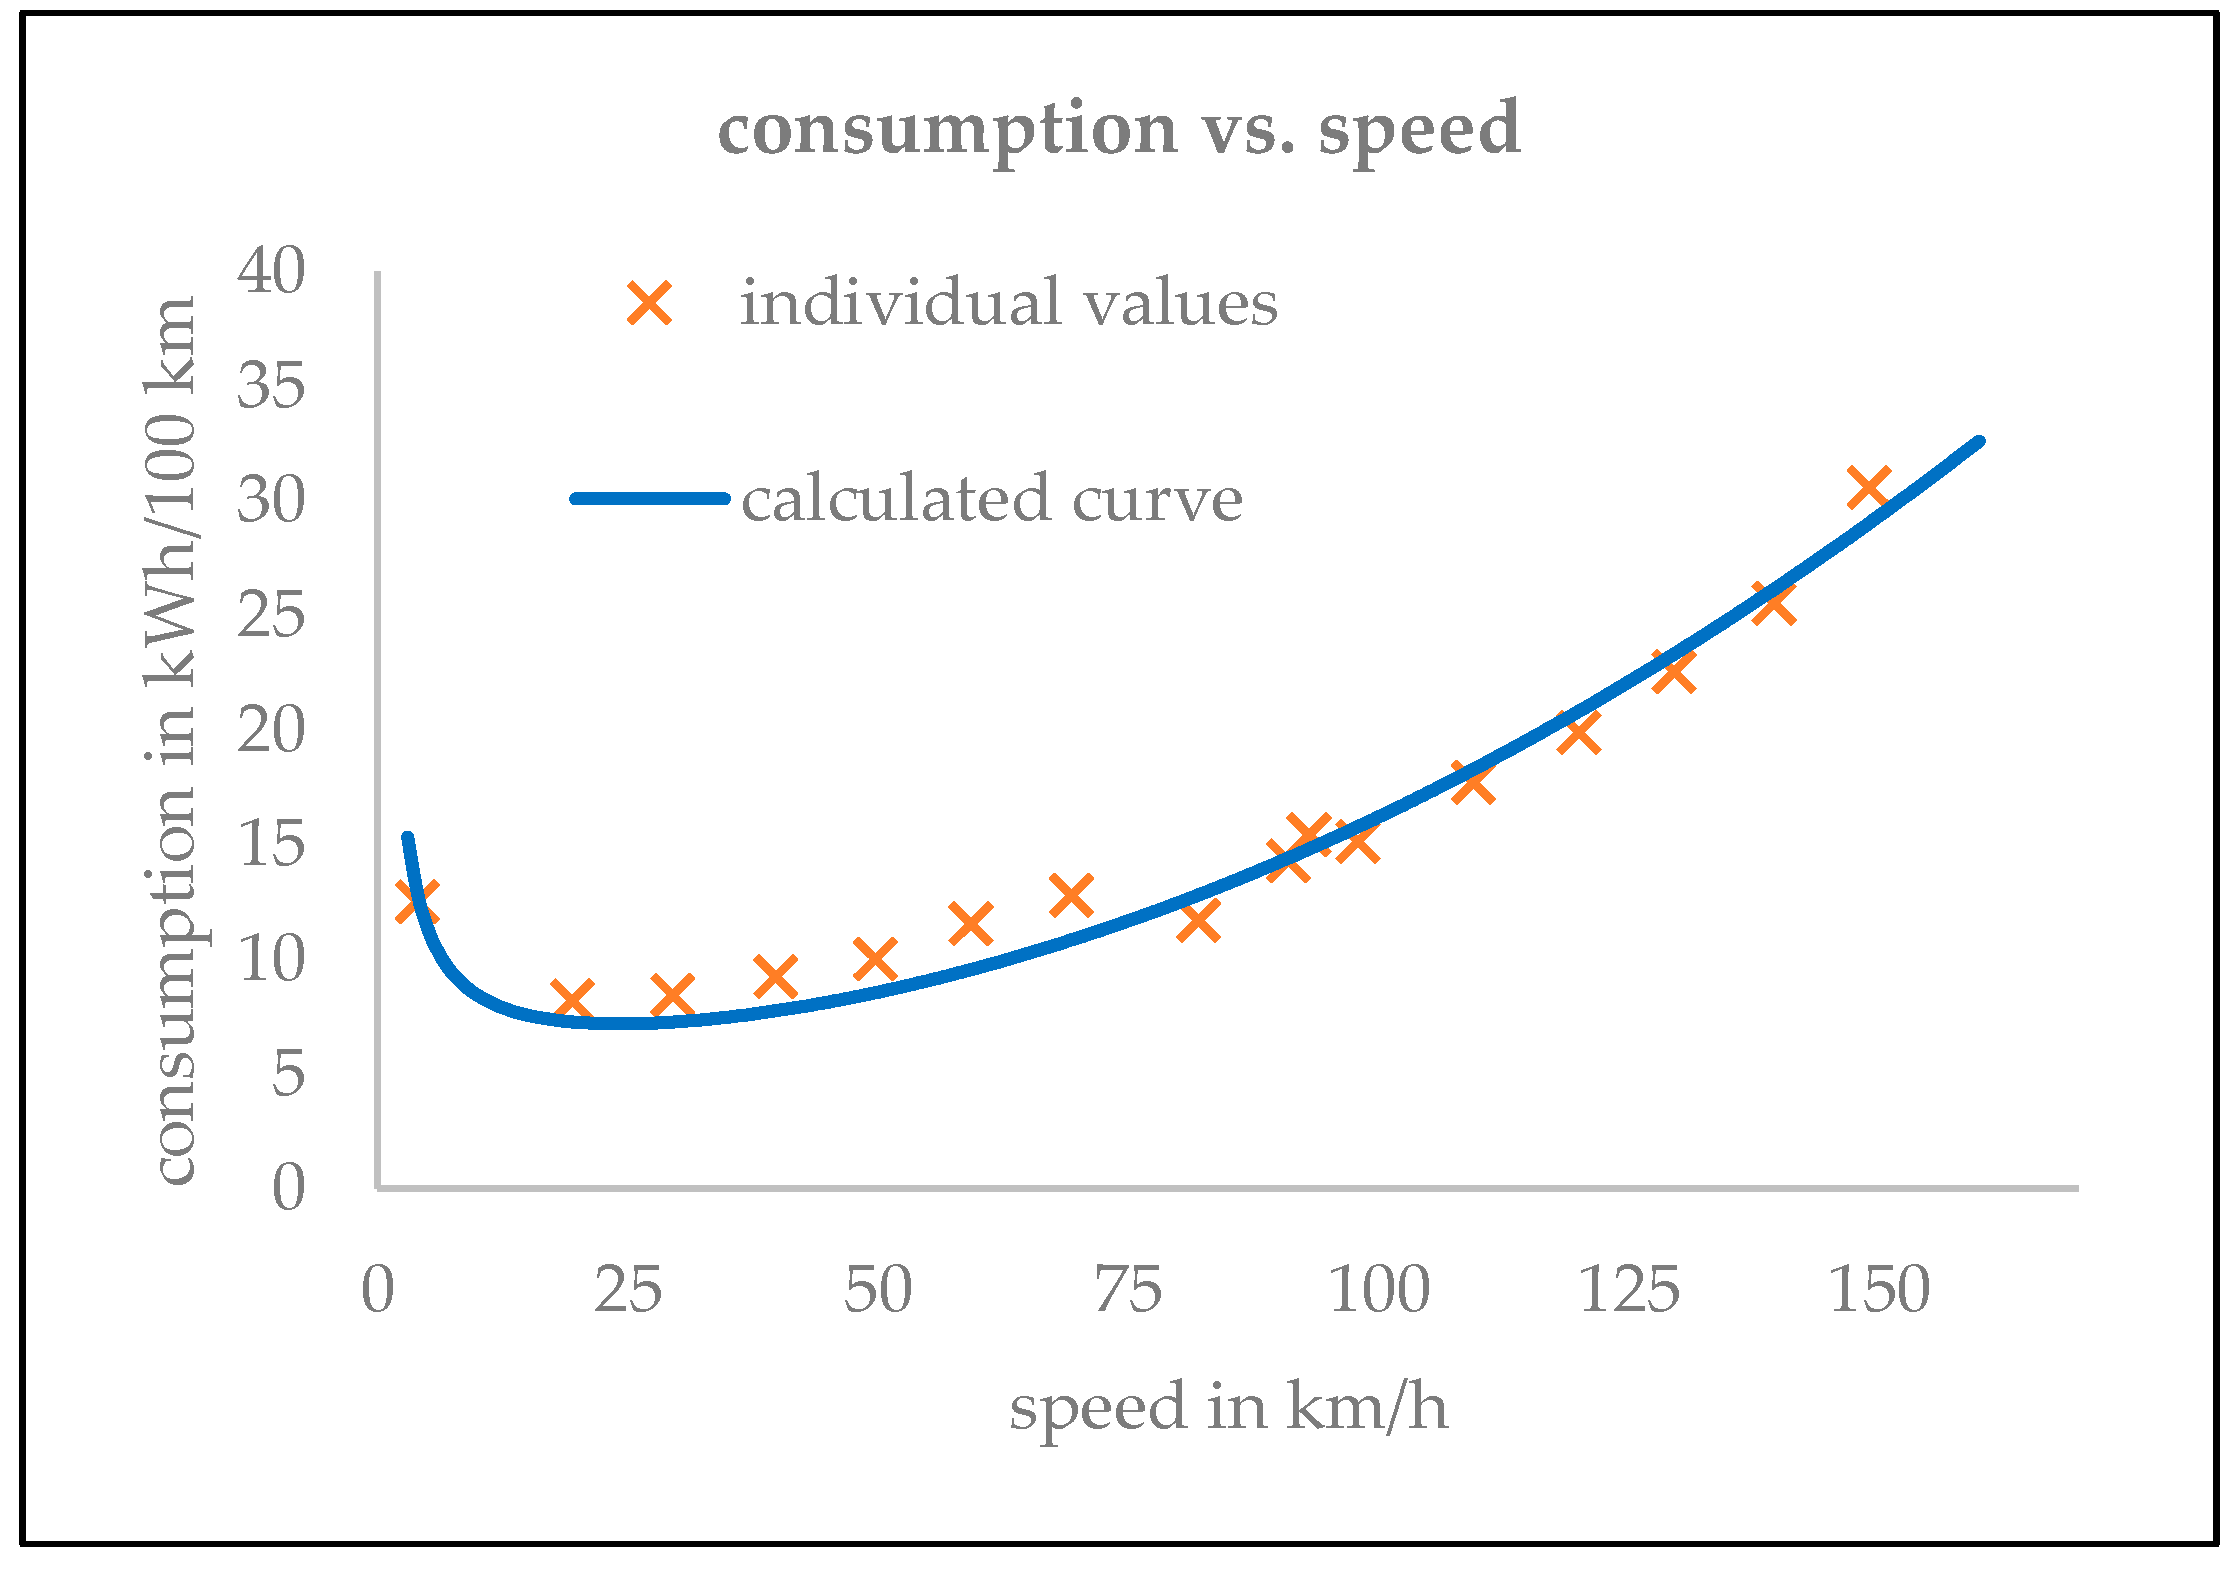
The diagram in Figure 6 indicates Equation (22) together with the consumption values from Table 2. The consumption consists of a quadratic, a constant, and a hyperbolic component. The diagram in Figure 7 graphically compares the individual parts of the function. The constant consumption part can be calculated by the parameter b :
C cp = b / 36 5   kWh / 100   km
From a certain speed onwards, the square part of the consumption curve dominates. This value can be calculated by equating the quadratic term with the hyperbolic term. After transformation, Equation (24) is obtained:
v q = c a 28 km / h
The minimum consumption is obtained by differentiating Equation (22) and then setting it to zero:
d C d v = 2 · a · v c v 2 = 0
Using Equation (25), the minimum consumption is calculated at a speed of:
v min = c 2 · a 3 24   km / h .
At this speed, the consumption of:
C min 7.2   kWh / 100   km
reveals the lowest value.
The hyperbolic part of the function is responsible for the fact that consumption increases again below a speed of 24 km/h. The reason for this is the standby energy requirement of the vehicle.
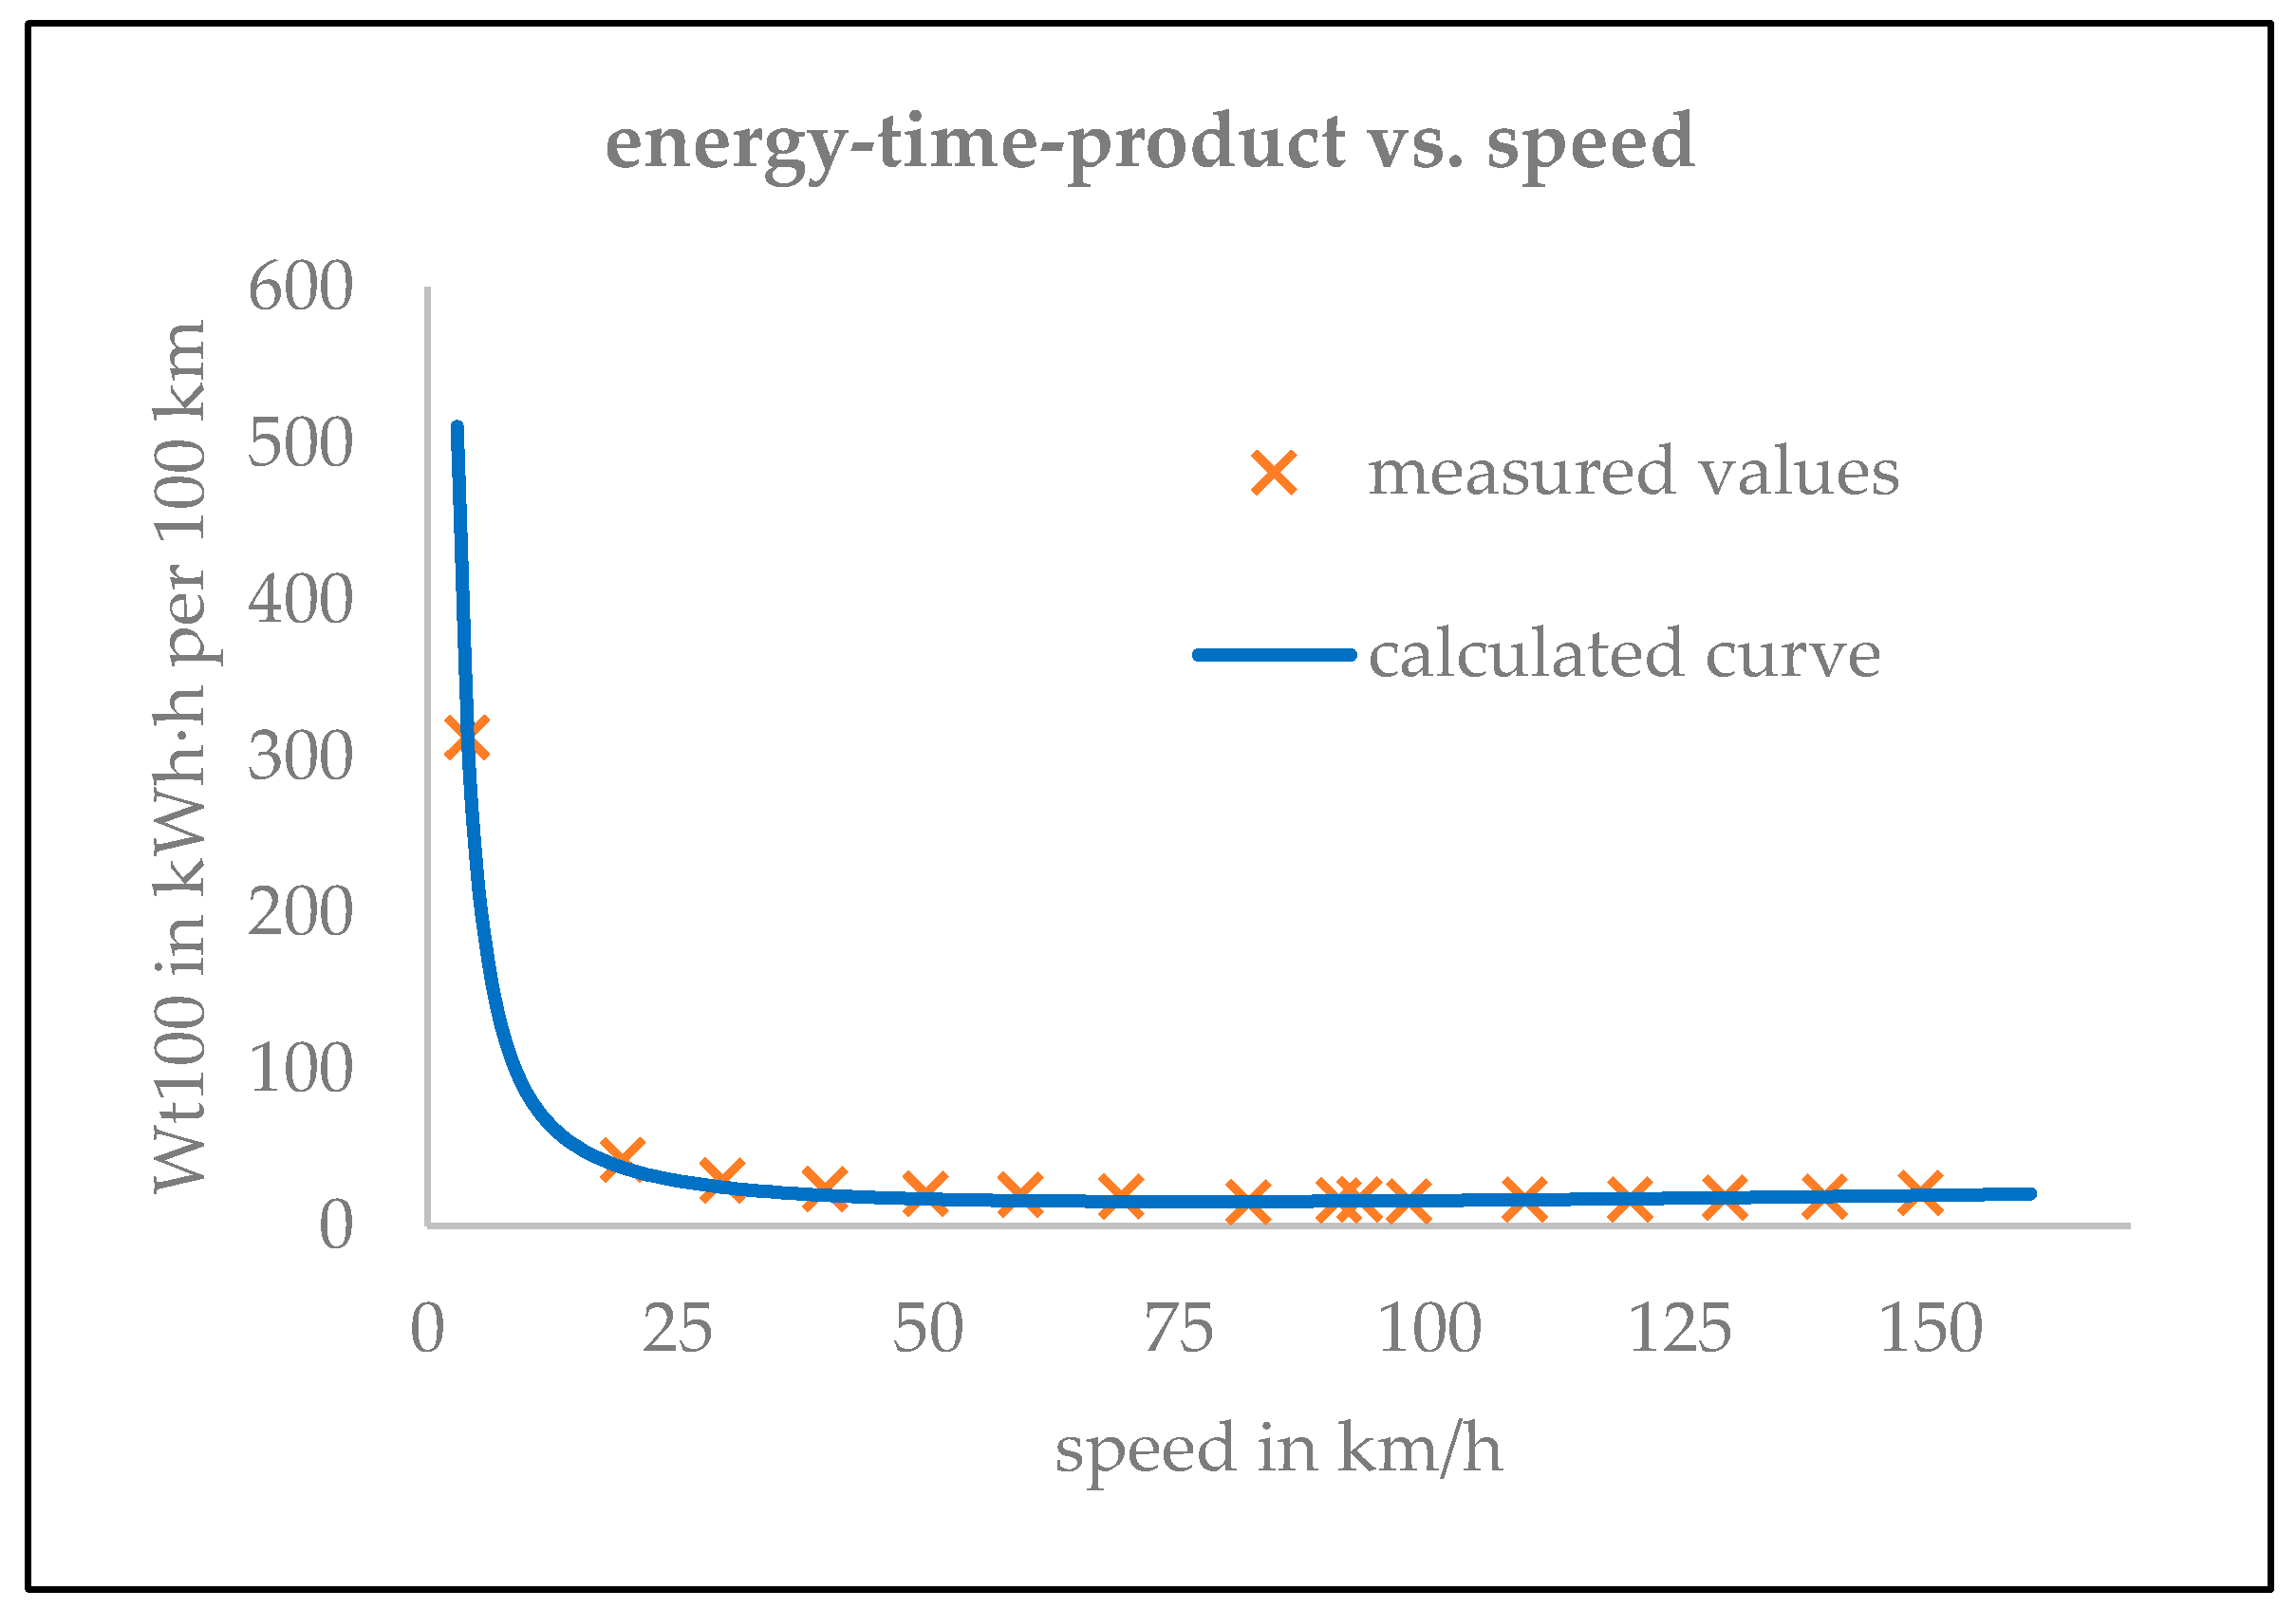
A different consumption consideration arises if the product is formed from the energy and travel time required for a specific driving distance. If the product is related to a distance of 100 km, Equation (27) is obtained:
W t 100 = P v · t 100 = C · t 100 = C · 100   km v = a · v + b v + c v 2 · 100   km
Figure 8 shows the values of the energy–time product from Table 5 and the function calculated according to Equation (27) for a distance of 100 km.
The energy–time product provides information about the driving speed to be maintained to cover a given distance in the shortest time with the lowest energy demand. Therefore, the energy–time product is suitable for choosing the optimal speed for different vehicles. The minimum of the function is calculated using Equation (28):
d a · v + b v + c v 2 · 100   km d v = a b v 2 2 c v 3 · 100   km = 0
This cubic function cannot be explicitly solved for the speed. The minimum is therefore calculated iteratively. This results in a numerical value of:
v opt 76   km / h .
At this speed, the lowest value for the energy–time product is calculated. The numerical value is approximately:
W t 100 m i n 15.6   kWh · h / 100   km .
However, it is also clear from the course of the function that this minimum is very weak. The course of the function is very flat from a speed of around 50 km/h. In practice, this means that the energy–time product is almost independent of the driving speed.
However, it should be emphasized at this point that the considerations made here assume that the selected route can be covered with one battery charge. If this is not possible, then battery charging duration would have to be taken into account, which would produce completely different results.

4. Discussion

Individual values of the battery power determined in the driving tests clearly deviate from the compensation function (see Figure 5). The deviations in the consumption values can be seen even more clearly (see Figure 6). Nevertheless, the calculated compensation function represents the best-fitting curve for the battery power. The deviations are due to various influencing factors. In order to estimate the effects of deviations in the influencing factors on the required battery power, an error analysis can be carried out. In the first step, the basis for this should form Equation (9). This means that differences in the height of the road and the influence of the wind are initially ignored. If only those parameters that can actually fluctuate during the measurement runs are taken into account, then Equation (29) results:
P b = P b v v + P b ρ ρ + P b P s P s
After carrying out the partial derivatives of Equation (9) according to Equations (29), Equation (30) results:
P b = 3 · ρ · c d · A · v 2 2 · η + m · g · c r η v + c d · A · v 3 2 · η ρ + P s
Here, the first step is to estimate the possible fluctuations in speed, air density, and power at a standstill.
The average speed used is based on the distance and time measured by the vehicle. The time measurement can be assumed to be sufficiently precise. The accuracy of the distance measurement is estimated to be 1%. Therefore, the speed deviation can also be set at 1%.
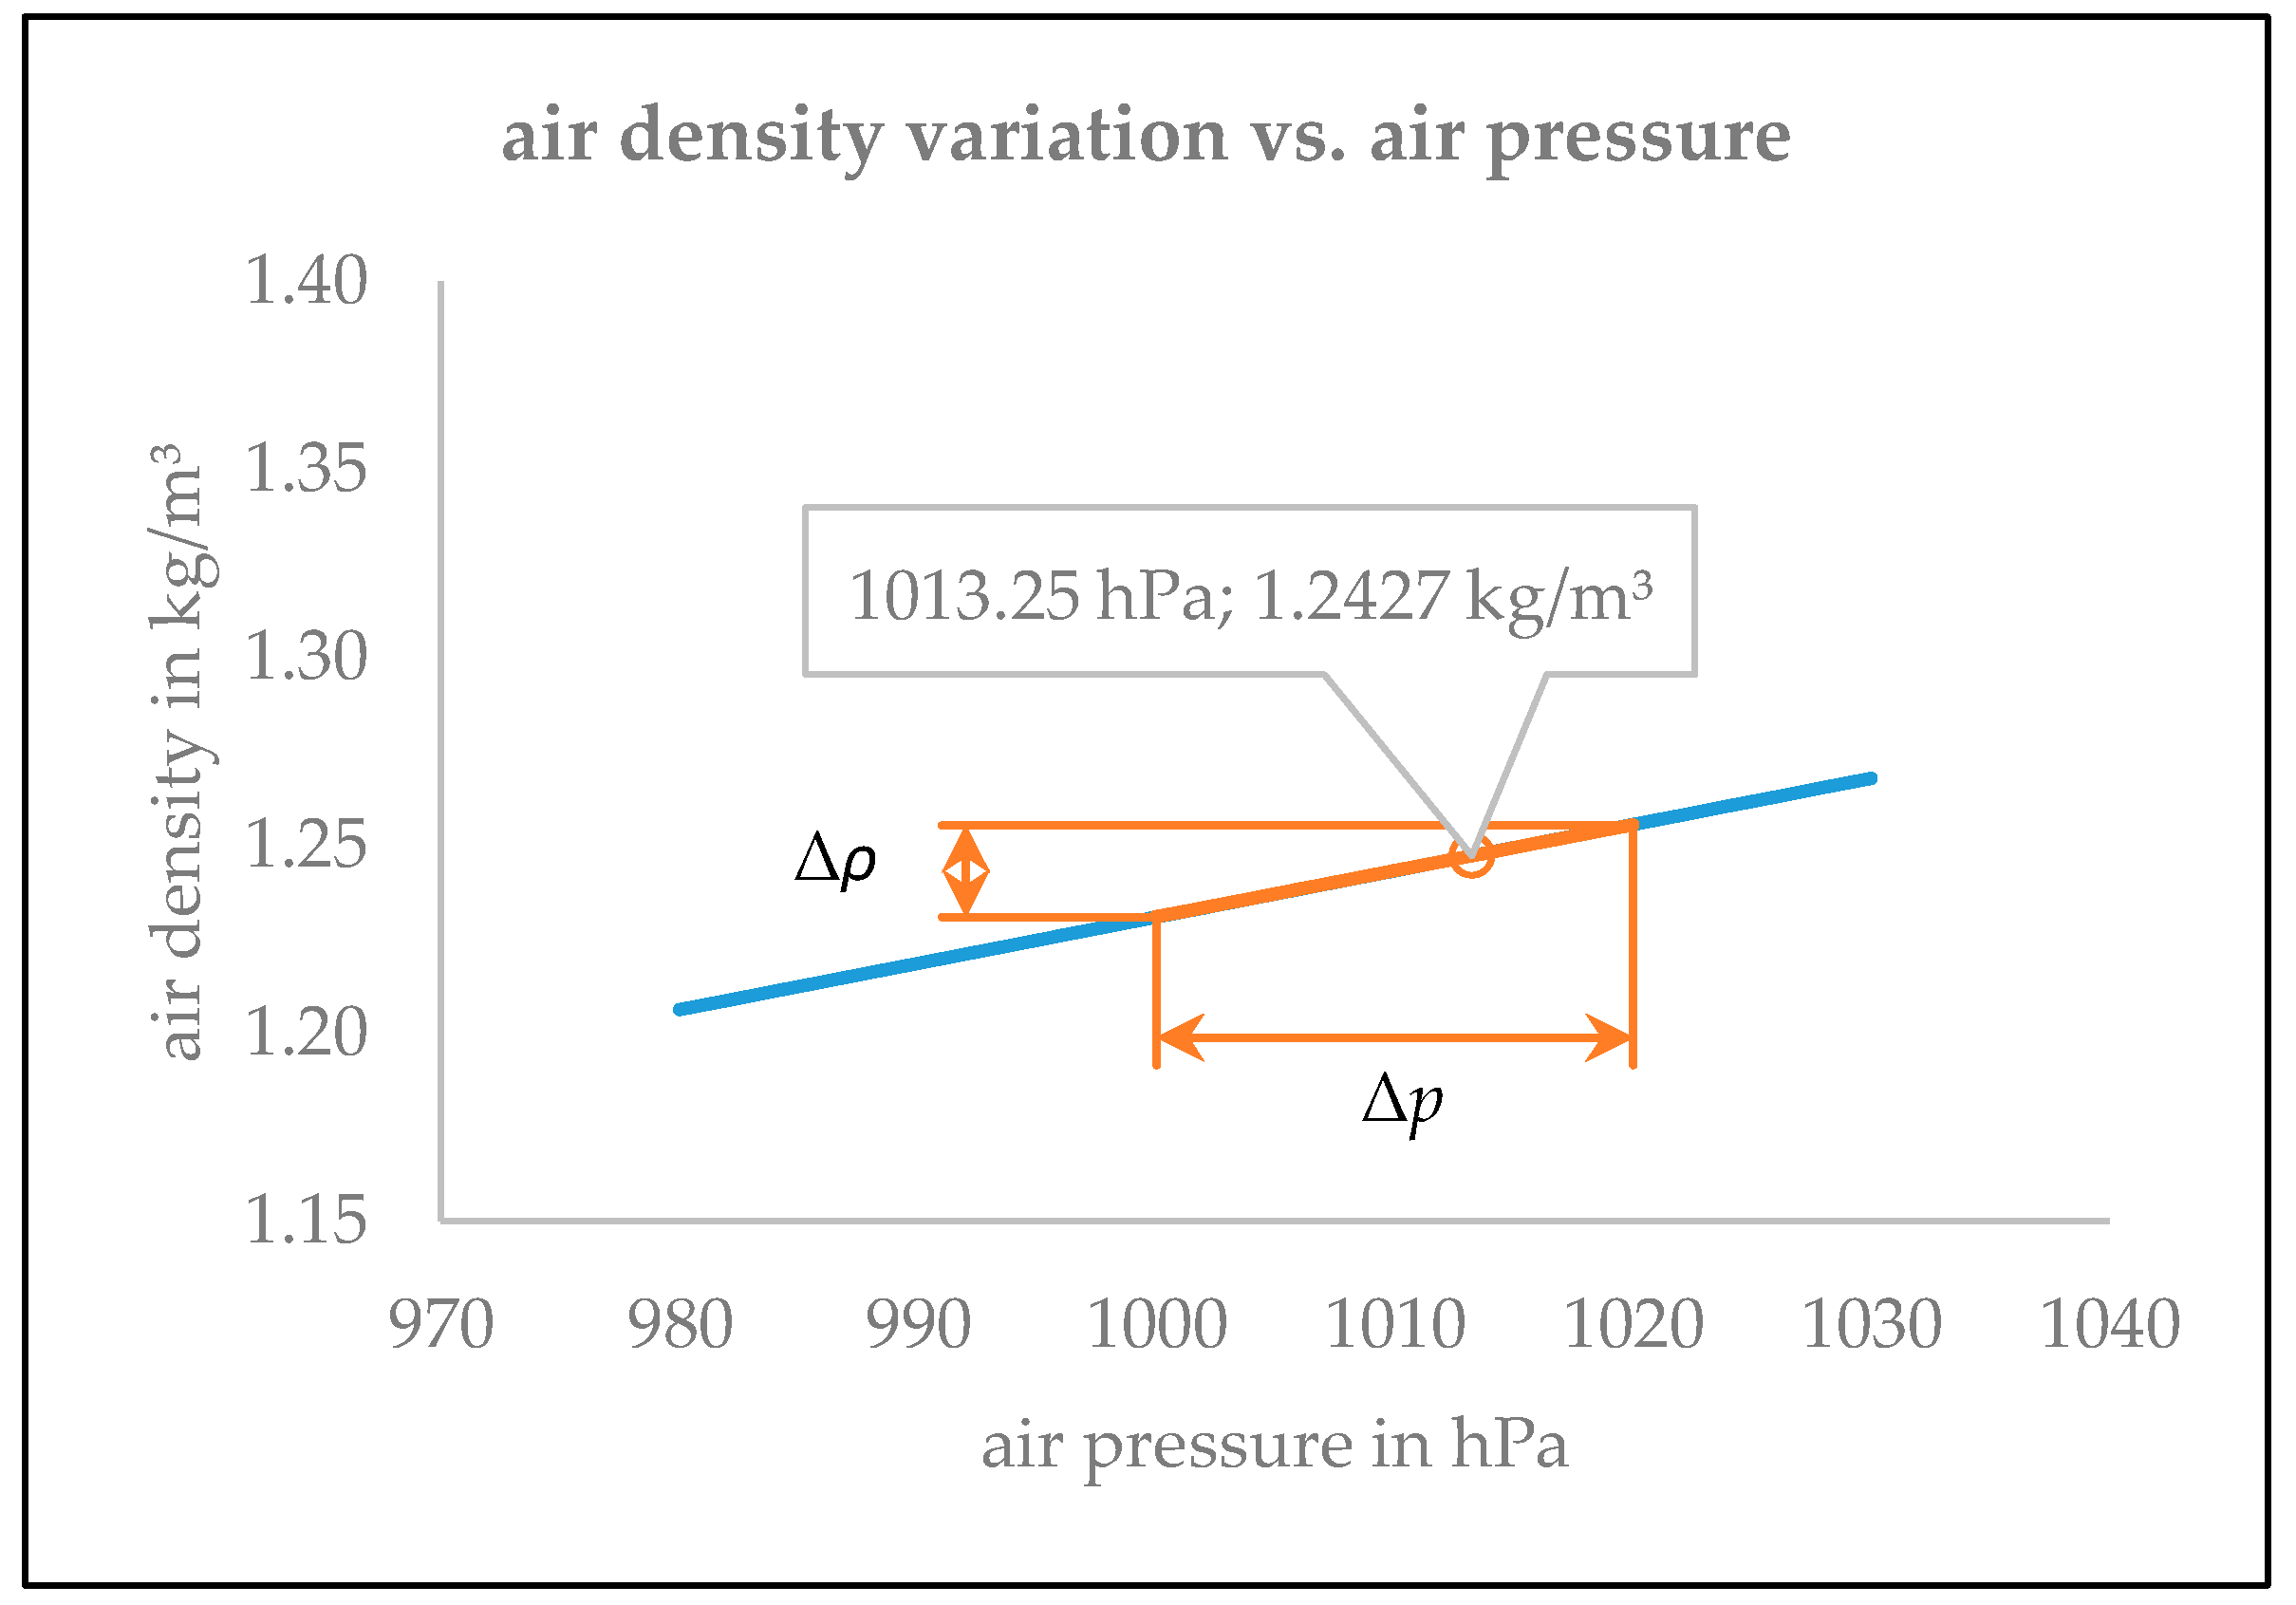
According to Equation (18), the air density again depends on two parameters. In order to estimate the possible range of fluctuations in air density, a consideration of the boundaries was carried out. Figure 9 shows the range of air density fluctuations due to temperature fluctuations. The air pressure also affects air density. Since there is no air pressure measurement in the vehicle, the possible range of fluctuations is estimated. All trips were carried out slightly above sea level. Therefore, a pressure range of 1000 hPa to 1020 hPa has been used. The resulting air density fluctuation can be seen in Figure 10.
The boundary values for the air pressure arise when the lowest temperature occurs at the highest air pressure (yields the maximum air density) and when the highest temperature occurs at the lowest air pressure (yields the minimum air density). Table 6 lists the fluctuations due to temperature, air pressure, and the resulting boundary values. With these considerations, the maximum fluctuation for air density can be estimated at 0.0639 kg/m3.
The power at standstill can be read from the display of the vehicle at standstill with an accuracy of one decimal in kW. The fluctuation can therefore amount to 0.1 kW due to rounding effects.
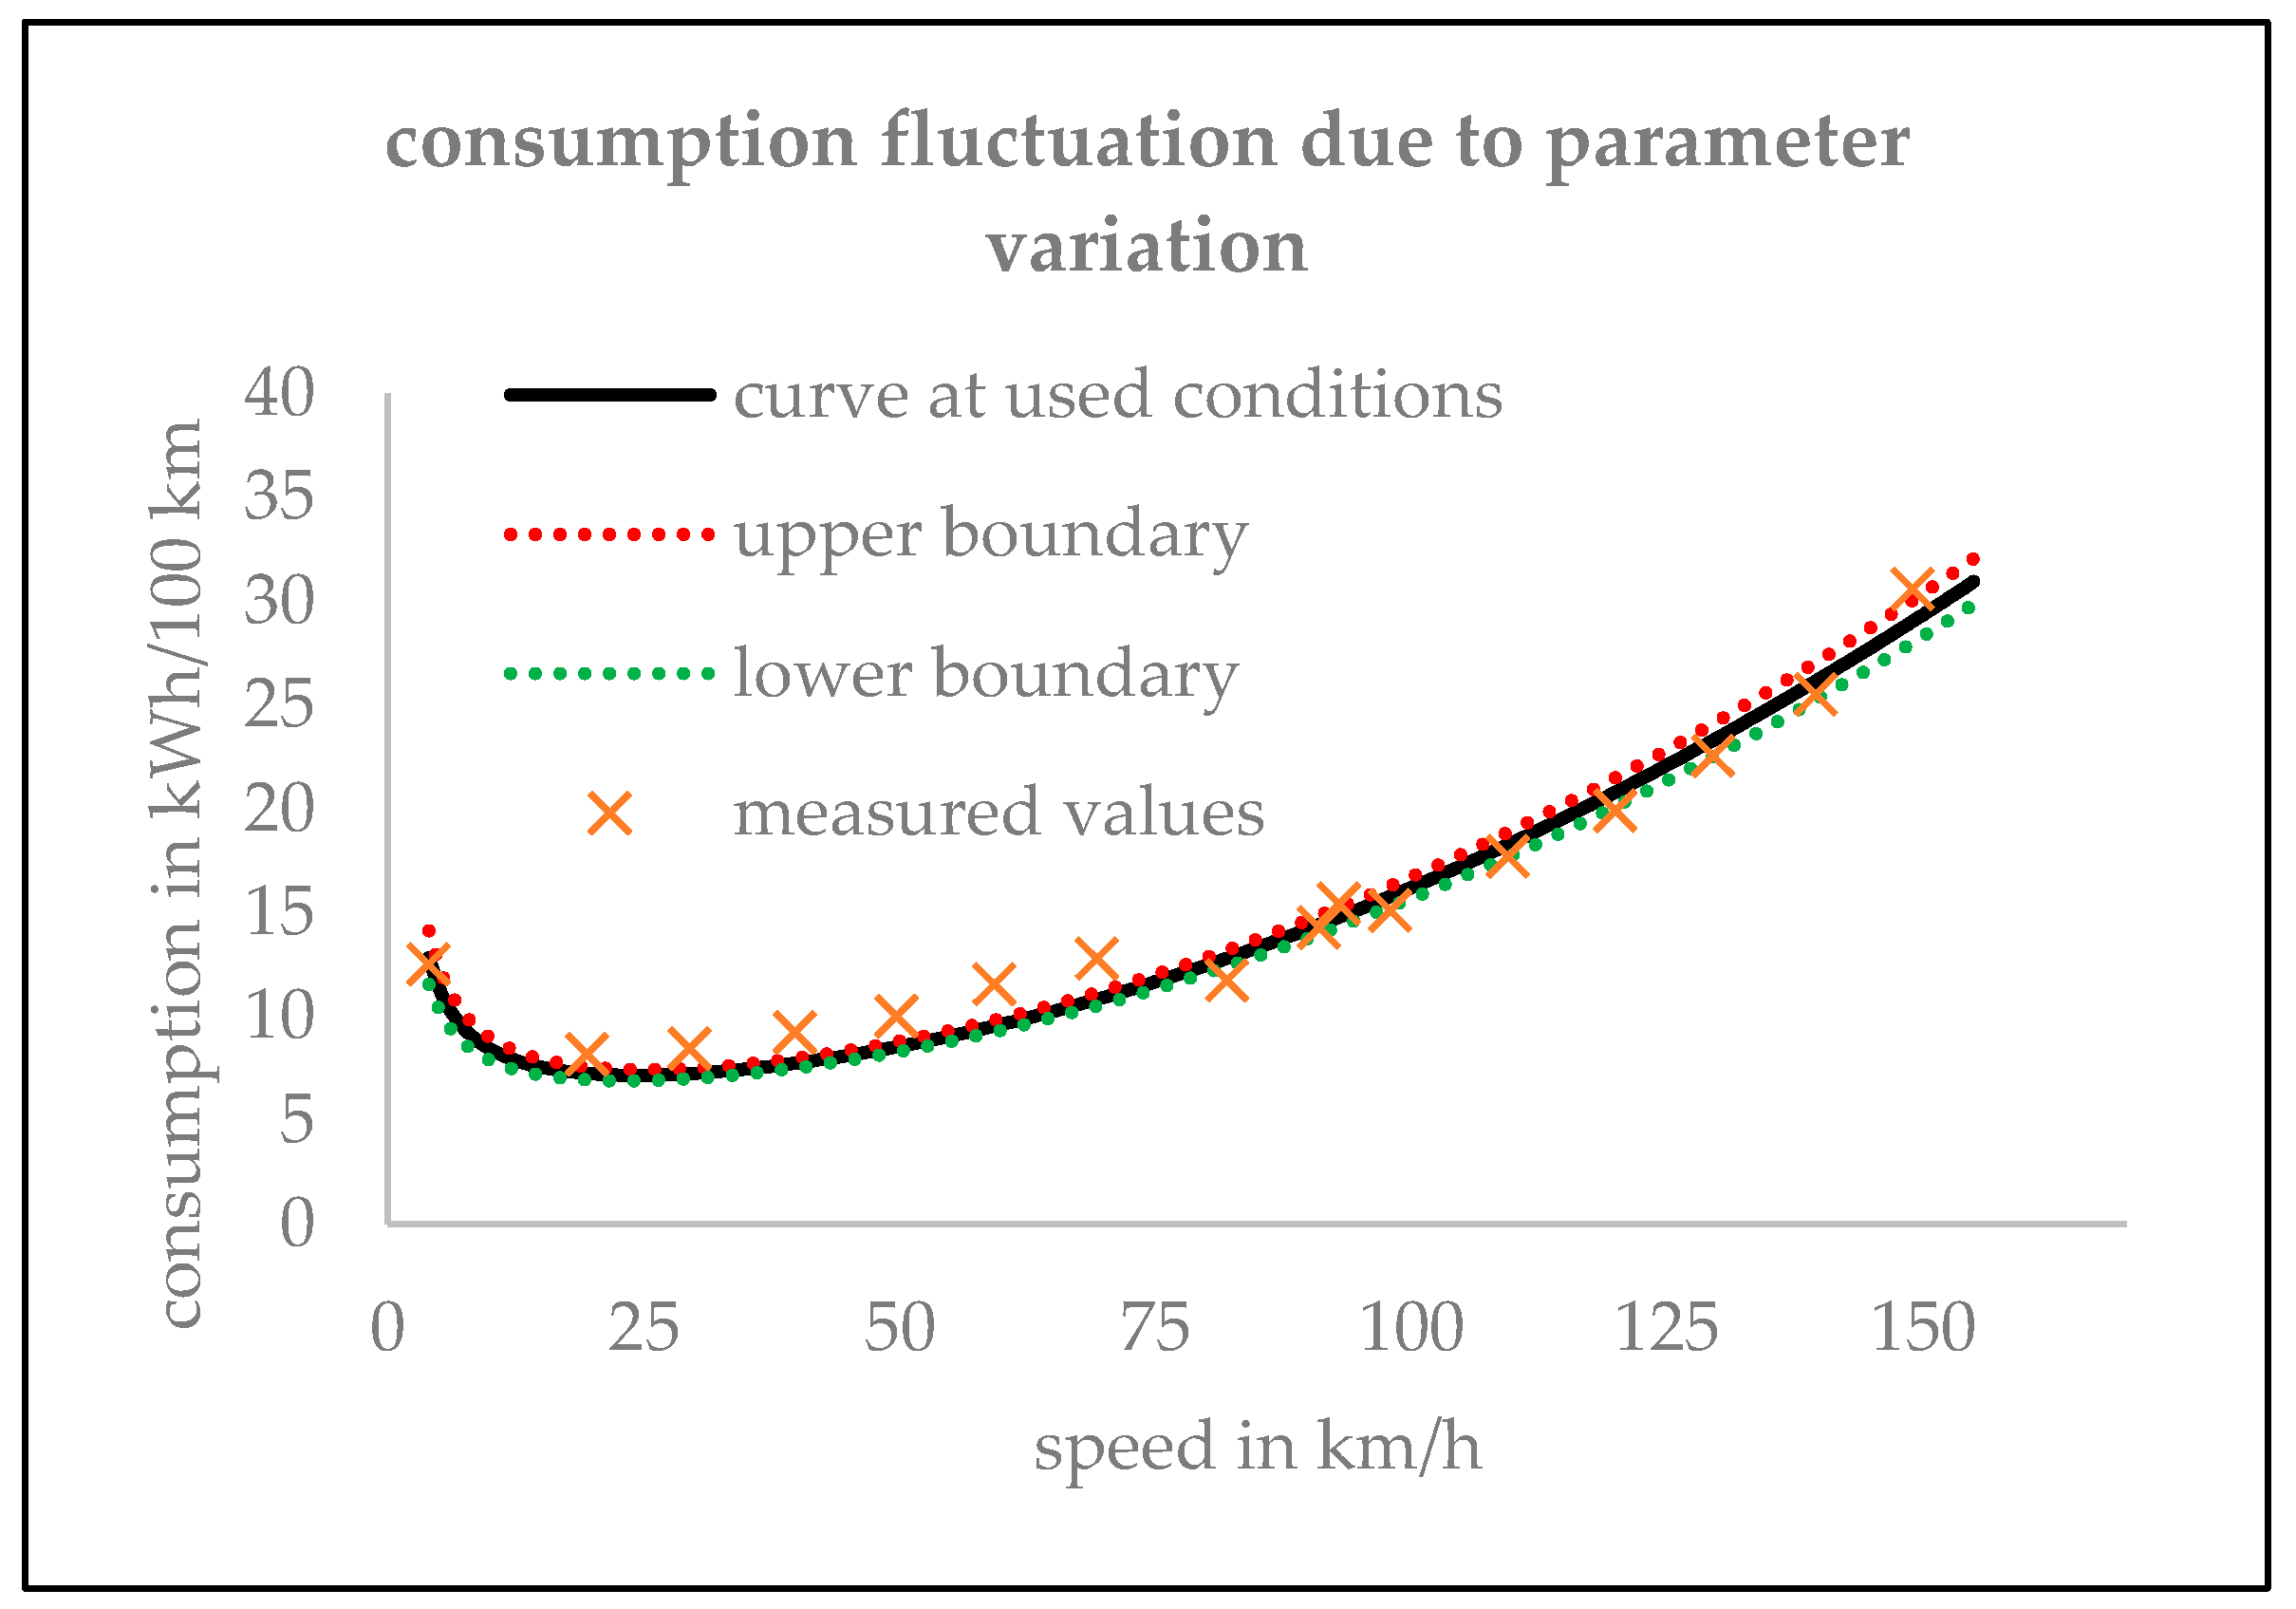
Taking these fluctuations into account, the boundaries of the fluctuation in the required battery power result from Equation (30). When using Equation (10), the corresponding boundary curves for the fluctuation in consumption can also be calculated. Figure 11 and Figure 12 show the corresponding diagrams.
As can be seen from the curves in Figure 11 and Figure 12, the deviations in the power and consumption values due to the possible variations in air density, speed accuracy, and standstill power are quite small and, therefore, cannot explain the larger deviations in the measured values.
In the second step, the influence of height differences in the road and the influence of wind during the measurement drives are taken into account. A simple examination of Equation (8) reveals that in a driving cycle with an outward and return drive on the same route, a difference in the height of the road is completely compensated for, but not the influence of the wind. In contrast to the linear influence of the angle of inclination of the road, the resulting airspeed enters the equation squarely. As a result, differences in air resistance are not completely balanced out during a driving cycle. A simple numerical example should illustrate the effect. Assuming a value of 40 km/h as the driving speed and a value of only 25 km/h (moderate breeze) for the wind speed, the numerical values listed in Table 7 using the determined parameters can be obtained. The deviations per driving cycle amount to 8.5%.
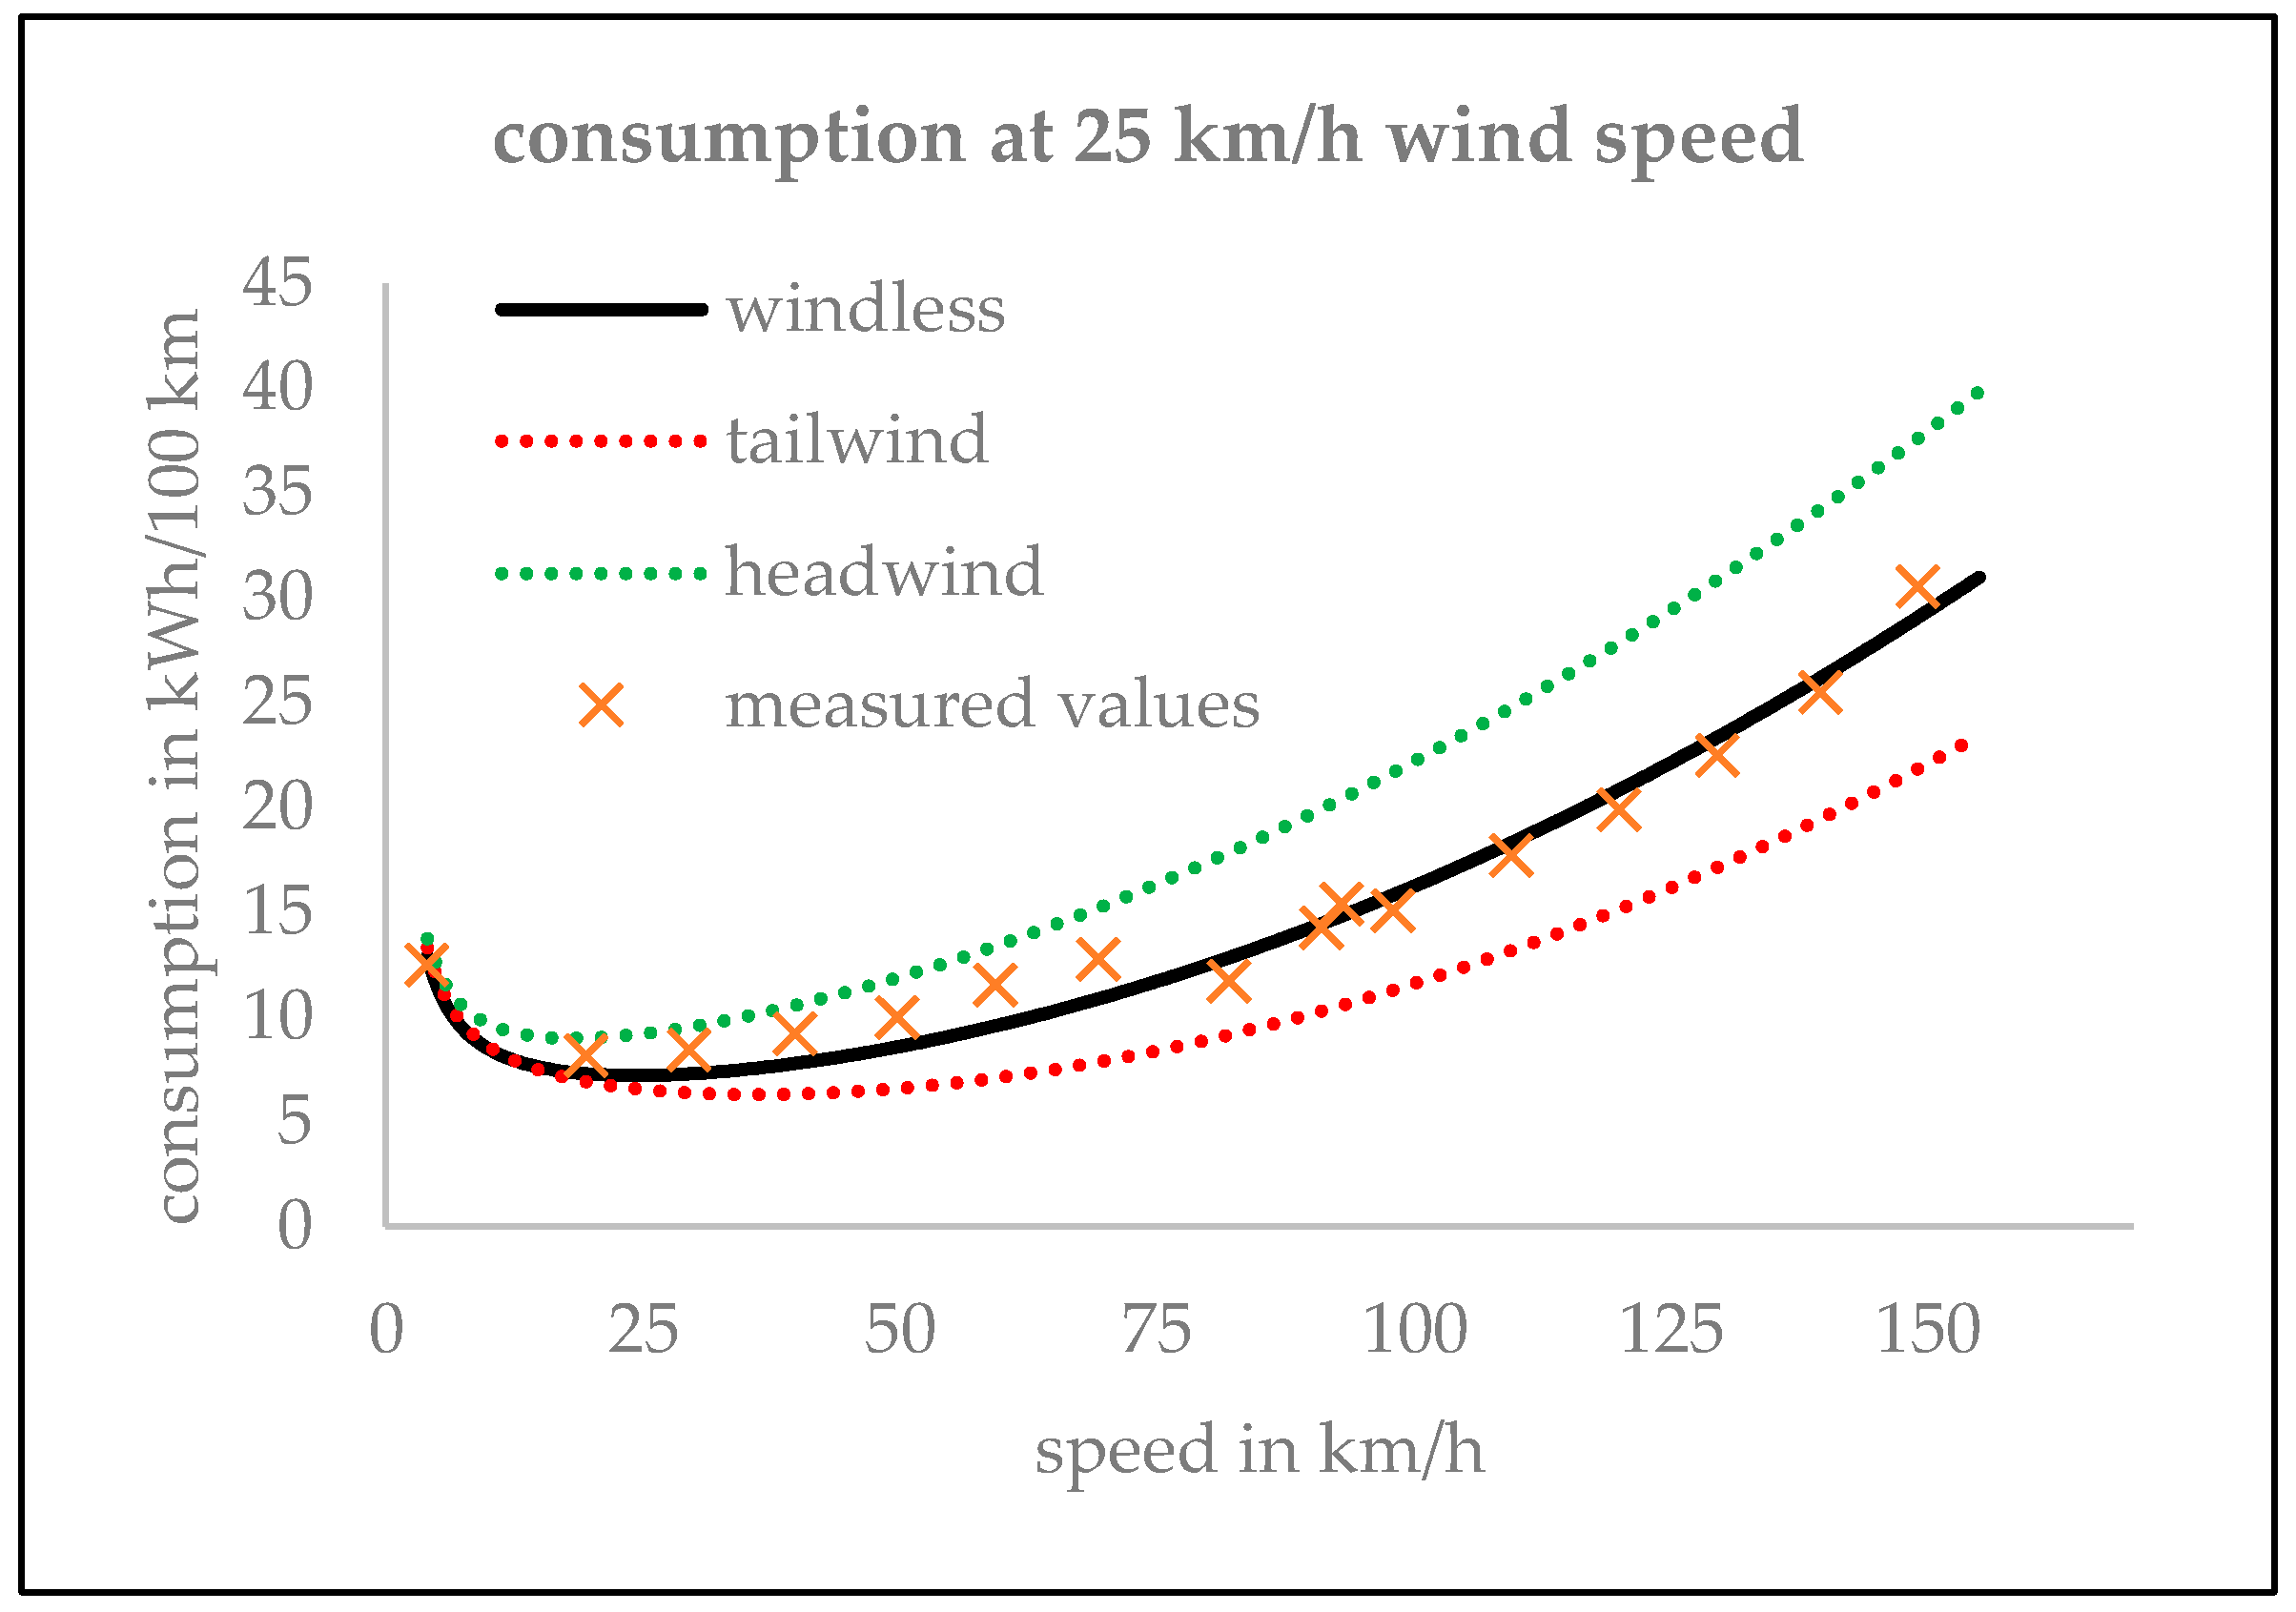
If the wind direction changes during the outward and return drives, larger differences arise for the corresponding driving cycles. Figure 13 and Figure 14 show the range of fluctuations in the required battery power and consumption when driving with either only a headwind or only a tailwind at a wind speed of 25 km/h. This consideration corresponds to the extreme case where the wind direction rotates by 180° when driving outward and backward.
From the diagrams of Figure 13 and Figure 14, it can be clearly seen that the spread of the measured values can be attributed solely to the changing wind conditions during test drives. All other effects are comparatively small and can generally be ignored.

5. Conclusions

The results show that it is possible to determine unknown loss parameters of electric vehicles with simple test drives. The driving data can be collected on public roads without any additional technical equipment. The calculations can also be carried out using a simple spreadsheet program. Therefore, the presented method can be used by everyone. Nevertheless, the factors influencing the accuracy of the method should be known. In particular, the ambient conditions, such as temperature and wind, must be as constant as possible during the measurement runs. Differences in road heights and moderate wind can be very well compensated by cyclical runs consisting of outward and return drives on the same road. However, if the wind conditions are not stable during a driving cycle or the wind is too strong, the cycle differences from outward and return drives do not compensate for each other and the fluctuations in the measured values are correspondingly larger.
On the whole, this method makes it much easier or, even in general, possible for many electric vehicle users to carry out substantial efficiency studies. Questions often arise about the impact of a certain driving style, environmental conditions, or the selectable driving modes of the electric vehicle on the energy consumption. Careful execution of the procedure shown in this paper may provide answers to individual questions. By finding out the relevant information, a more efficient driving style could be achieved, which would save expenses due to the reduced energy requirement, and, aside from that, the necessary charging frequency could be reduced, which is of particular interest to people without an own charging option at home.

6. Disclaimer

We hereby point out that taking photographs while driving limits driving safety. Photos should not be taken by the driver himself while driving.

Author Contributions

Conceptualization, A.W.; methodology, A.W.; software, A.W.; validation, A.W.; formal analysis, A.W.; investigation, A.W.; resources, A.W.; data curation, A.W.; writing—original draft preparation, A.W.; writing—review and editing, A.W. and S.S.; visualization, A.W. and S.S.; supervision, A.W. and S.S.; project administration, A.W.; funding acquisition, A.W. All authors have read and agreed to the published version of the manuscript.

Funding

This research received no external funding.

Data Availability Statement

The data presented in this study are available on request from the corresponding author. The data are not publicly available due to privacy.

Conflicts of Interest

The authors declare no conflicts of interest.

References

  1. European Parliament. EU Ban on the Sale of New Petrol and Diesel Cars from 2035 Explained. Available online: https://www.europarl.europa.eu/topics/en/article/20221019STO44572/eu-ban-on-sale-of-new-petrol-and-diesel-cars-from-2035-explained (accessed on 11 May 2024).
  2. Stevic, Z.; Radovanovic, I. Energy Efficiency of Electric Vehicles. In New Generation of Electric Vehicles; InTech Open: London, UK, 2012; pp. 93–134. [Google Scholar] [CrossRef]
  3. Mavlonov, J.; Ruzimov, S.; Tonoli, A.; Amati, N.; Mukhitdinov, A. Sensitivity Analysis of Electric Energy Consumption in Battery Electric Vehicles with Different Electric Motors. World Electr. Veh. J. 2023, 14, 36. [Google Scholar] [CrossRef]
  4. Mruzek, M.; Gajdáč, I.; Kučera, L.; Barta, D. Analysis of Parameters Influencing Electric Vehicle Range. Proc. Eng. 2016, 134, 165–174. [Google Scholar] [CrossRef]
  5. Szumska, E.; Jurecki, R. Parameters Influencing on Electric Vehicle Range. Energies 2021, 14, 4821. [Google Scholar] [CrossRef]
  6. Jaswal, A.; Madhurakavi, R.; Chandrasekaran, P. Low Rolling Resistance Tires and Their Impact on Electric Vehicles. SAE Technol. Pap. 2017, 28, 1941. [Google Scholar] [CrossRef]
  7. Beckers, C.; Besselink, I.; Nijmeijer, H. Combined Rolling Resistance and Road Grade Estimation Based on EV Powertrain Data. IEEE Trans. Veh. Technol. 2023, 72, 3201–3213. [Google Scholar] [CrossRef]
  8. Andriaminahy, F.; Amamou, A.; Kelouwani, S.; Zioui, N.; Ghobadpour, A.; Agbossou, K. Comparative Study of Vehicle Aerodynamic and Rolling Resistance Coefficients Estimation Methods. In Proceedings of the 2019 IEEE Vehicle Power and Propulsion Conference (VPPC), Hanoi, Vietnam, 14–17 October 2019. [Google Scholar]
  9. Van Greunen, R.; Oosthuizen, C. Data Driven Methods for Finding Coefficients of Aerodynamic Drag and Rolling Resistance of Electric Vehicles. World Electr. Veh. J. 2023, 14, 134. [Google Scholar] [CrossRef]
  10. Kiyakli, A.; Solmaz, H. Modeling of an Electric Vehicle with MATLAB/Simulink. Int. J. Automot. Sci. Technol. 2018, 2, 9–15. [Google Scholar] [CrossRef]
  11. Banuri, S.; Qayyum, U.; Qureshi, K.; Ahmed, A. Investigation of Drag Coefficients for Various Car Models. In Proceedings of the 17th IBCAST—2020: 17th International Bhurban Conference on Applied Sciences and Technology (IBCAST), Islamabad, Pakistan, 14–18 January 2020. [Google Scholar]
  12. Anderson, L.; Larsen, J.; Fraser, E.S.; Schmidt, B.; Dyre, J.C. Rolling Resistance Measurement and Model Development. J. Transp. Eng. 2014, 141, 2. [Google Scholar] [CrossRef]
Figure 1. Used electric vehicle (Volkswagen ID.3).
Wevj 15 00298 g001
Figure 2. Display screen of the vehicle.
Wevj 15 00298 g002
Figure 3. Example display values for outward and return drives on the same route with a set target speed of 40 km/h: (a) outward run 1; (b) return run 1; (c) outward run 2; (d) return run 2.
Wevj 15 00298 g003
Figure 4. Energy consumption of the vehicle at standstill.
Wevj 15 00298 g004
Figure 5. Battery power versus vehicle speed on a plane road.
Wevj 15 00298 g005
Figure 6. Energy consumption versus speed of the electric vehicle.
Wevj 15 00298 g006
Figure 7. Influence of the functional components of the consumption equation.
Wevj 15 00298 g007
Figure 8. Energy–time product depending on the driving speed for a distance of 100 km.
Wevj 15 00298 g008
Figure 9. Range of fluctuations in air pressure during measurement runs.
Wevj 15 00298 g009
Figure 10. Range of fluctuation in air pressure due to air pressure variation.
Wevj 15 00298 g010
Figure 11. Range of fluctuation in the required battery power with maximum varying parameters.
Wevj 15 00298 g011
Figure 12. Range of fluctuation in consumption with maximum varying parameters.
Wevj 15 00298 g012
Figure 13. Range of variation in the required battery power as a function of driving speed when driving at 25 km/h with headwind and tailwind.
Wevj 15 00298 g013
Figure 14. Range of fluctuation in consumption as a function of driving speed when driving at 25 km/h with headwind and tailwind.
Wevj 15 00298 g014
Table 1. Technical data of the used test vehicle 1.
Vehicle TypeID.3 Pro Performance
Total energy content of battery62 kWh
Motorpermanent magnet synchronous motor
Continuous power70 kW
Peak power150 kW
Peak torque310 Nm
Vehicle mass including one driverappr. 1900 kg
Projected frontal area2.36 m2
Drag coefficient0.267
TiresBridgestone Turanza Eco
Tire dimension215/45R20
Set tire pressure 2front and back: 2.5 bar
Transmission gearone gear
1 Manufacturer information. 2 Manufacturer recommendation.
Table 2. Collected average consumption, temperature, and power values at several driving speeds.
Speed
(km/h)
Consumption
(kWh/100 km)
Battery Power
(kW)
Ambient Temperature
(°C)
Air Density 1
(kg/m3)
4.012.500.5131.2335
19.58.181.681.2560
29.58.432.581.2560
39.89.203.781.2549
49.89.985.081.2566
59.311.536.881.2577
69.312.788.881.2538
82.011.709.6151.2260
91.014.2513.061.2628
93.015.4014.3121.2400
98.015.1014.8131.2357
109.517.7019.4121.2390
120.019.9023.9121.2400
129.522.5029.1111.2411
139.525.5035.691.2510
149.030.5545.591.2521
1 Calculated at 1013.25 hPa.
Table 3. Obtained function parameters using Gaussian least squares method.
Function ParameterObtained Numerical Value
parameter a in kg/m0.4938
parameter a in h3/km3·kW 11.05842·10−5
parameter b in N191.9
parameter b in kWh/km 10.05331
parameter c (equals to static power P s )0.3
1 If using km/h as unit for speed and kW as unit for battery power.
Table 4. Numerical values used to calculate the loss parameters.
Projected vehicle frontal area2.36 m2
Air drag coefficient0.267
Average ambient temperature 110 °C
Air density 21.247 kg/m3
Acceleration due to gravity9.81 m/s2
1 Calculated as average from Table 2. 2 At 10 °C and 1013.25 hPa.
Table 5. Numerical values for the energy–time product for a driving distance of 100 km.
Speed
(km/h)
Consumption
(kWh/100 km)
Driving Time t100 1
(h)
Energy–Time Product
(kWh h)
4.012.5025.00312.50
19.58.185.1341.92
29.58.433.3928.56
39.89.202.5223.14
49.89.982.0120.05
59.311.531.6919.45
69.312.781.4418.45
82.011.701.2214.27
91.014.251.1015.66
93.015.401.0816.56
98.015.101.0215.41
109.517.700.9116.16
120.019.900.8316.58
129.522.500.7717.37
139.525.500.7218.28
149.030.550.6720.50
1 Driving time at stated speed for a distance of 100 km.
Table 6. Maximum fluctuations and boundary values for air density during measurement runs.
Due to Temperature 1Due to Air Pressure 2Boundary Values
max ρ 6   ° C = 1.2645   kg / m 3 ρ 1020   hPa = 1.2555   kg / m 3 ρ max = 1.2729   kg / m 3
min ρ 15   ° C = 1.2250   kg / m 3 ρ 1000   hPa = 1.2309   kg / m 3 ρ min = 1.2090   kg / m 3
1 According to measured values of Table 2 and at 1013.25 hPa. 2 According to estimated fluctuation and at 10 °C.
Table 7. Cycle differences at 40 km/h driving speed and 25 km/h wind speed.
Wind DirectionBattery PowerConsumption
outward drive with headwind4.22 kW10.55 kWh/100 km
return drive with tailwind2.53 kW6.32 kWh/100 km
average of cycle run3.37 kW8.44 kWh/100 km
windless drive3.11 kW7.77 kWh/100 km
difference 10.26 kW (8.5%)0.66 kWh/100 km (8.5%)
1 Difference between outward and return drive compared to windless drive.
Disclaimer/Publisher’s Note: The statements, opinions and data contained in all publications are solely those of the individual author(s) and contributor(s) and not of MDPI and/or the editor(s). MDPI and/or the editor(s) disclaim responsibility for any injury to people or property resulting from any ideas, methods, instructions or products referred to in the content.