Article

Analysis of the Driving Range Evaluation Method for Fuel-Cell Electric Vehicles

1
CATARC Automotive Test Center (Tianjin) Co., Ltd. Tianjin 300300, China
2
China Automotive Technology and Research Center Co., Ltd. Tianjin 300300, China
3
School of Mechanical Engineering, Hebei University of Technology, Tianjin 300130, China
*
Author to whom correspondence should be addressed.
World Electr. Veh. J. 2024, 15(6), 223; https://doi.org/10.3390/wevj15060223
Submission received: 6 March 2024 / Revised: 7 April 2024 / Accepted: 19 April 2024 / Published: 21 May 2024

Abstract

:
The range is one of the most important performance indicators for fuel-cell electric vehicles. This article focuses on the analysis of GB/T 43252-2023 “Energy Consumption and Range Test Methods for Fuel-Cell Electric Vehicles” from the perspective of a standard analysis, and conducts actual vehicle tests on the range test method and process. It introduces the measurement method of hydrogen gas filling for test vehicles, and explains the main content of the new standard revision and the main differences between the new and old standards. This article takes the fuel-cell dump truck as an example, and analyzed the relationship between the output power of fuel-cell stacks and power batteries during vehicle operation and driving conditions, as well as the proportion of fuel cell output power. The results show that the optimal output power range of fuel cells is 20–40 kW, accounting for 45.2% of the total operating time. When driving at high speeds, the output power of fuel cells is greater than that of power batteries.

1. Introduction

In response to the increasingly severe global challenges of environmental pollution and energy scarcity, new energy vehicle technology has become a focal point for the sustainable development of the automotive industry. Fuel-cell electric vehicles (FCEVs), as a primary component of new energy vehicles, are considered a crucial development direction due to their zero emissions, high efficiency, and long endurance, and the diversification of hydrogen resources [1,2,3]. Countries such as the United States, Japan, the European Union, and China are taking actions to promote the development of the fuel-cell vehicle industry [4,5]. At the current stage, domestic fuel-cell vehicle technology is maturing, with continuous improvements in the key performance of fuel cells and an increase in the pure hydrogen driving range of vehicles [6,7,8]. According to data from the China Automotive Technology Research Center, when fuel-cell electric vehicles travel between 300 to 500 km, the proportion of the pure hydrogen driving range accounts for nearly 50%. In the field of fuel-cell electric vehicles, the driving range is a crucial performance indicator and an important parameter for commercialization, directly influencing user acceptance and usage experience. Currently, the research is primarily focused on innovation in simulation modeling and testing methods for fuel-cell vehicles. Bubna et al. [9] proposed a prediction-based power management strategy for fuel-cell hybrid vehicles, which can reliably forecast the total energy required to complete specific driving cycles, enabling fuel cells to operate at their most efficient state. Zhu et al. [10] developed a comprehensive economic forecasting model for vehicles equipped with different power systems. The prediction results indicate that, in the future, the power system costs and lifecycle costs of pure electric vehicles and fuel cell vehicles will further decrease, and may even gradually surpass those of traditional gasoline vehicles. Jiang et al. [11] constructed a historical–real-time energy consumption-weighted range prediction algorithm, addressing the issue of significant deviations in the range prediction caused by extreme conditions within segments, thus achieving an effective range prediction for fuel-cell vehicles. Zeng et al. [12] utilized intelligent algorithms to develop a nonlinear regression model for vehicle powertrains, aiming to predict the current and voltage on the DC bus. The specific results of energy consumption indicate that using the predicted data obtained from the model is feasible for analyzing the energy consumption of FCHVs. Sellali et al. [13] studied a novel health-conscious EMS algorithm based on model predictive control (MPC), which aims to minimize battery degradation to extend its lifespan.
In terms of innovation in testing methods, Hao et al. [14] proposed a new method for testing the hydrogen consumption, electrical energy consumption, and driving range of fuel-cell vehicles, which does not require an additional hydrogen supply, measurement instruments, or energy consumption calibration, thus enhancing the operability of the tests. Guo et al. [15] investigated the energy variations of fuel cells and power batteries under cycling conditions, as well as methods for the rapid testing and evaluation of the driving range. They established rapid testing and evaluation methods for the driving range under different energy-blending states and for electric hybrid vehicles. Lim et al. [16] developed a method for measuring the fuel consumption of hydrogen fuel-cell vehicles on a chassis dynamometer, providing information for the development of hydrogen fuel economy testing methods. Guo [17] conducted research on testing and evaluating the driving range of fuel-cell vehicles, testing the energy consumption and hydrogen consumption of electric–hydrogen hybrid fuel-cell vehicles, and developing driving range evaluation methods for different types of fuel-cell vehicles. Duan et al. [18] proposed a method for testing the driving range of fuel-cell vehicles under CLTC-P conditions. The experimental results showed a high consistency between the mileage calculated based on hydrogen consumption and actual mileage. Sun et al. [19] conducted tests on the fuel-cell truck (FCT) under a constant speed of 40 km/h and the Chinese Heavy-duty Truck Testing Cycle (CHTC-HT) to determine the driving range of fuel-cell vehicles under different conditions and analyzed the impact of different conditions on the economic evaluation.
However, the aforementioned studies are limited to optimizing energy management strategies and improving driving range testing methods, without delving into the specific experimental content of the testing standards themselves. They do not analyze the energy consumption and driving range of fuel-cell electric vehicles from the perspective of the entire process of driving, from full hydrogen and full battery to vehicle stop, due to fuel exhaustion. To address this research gap, this paper focuses on the specific experimental content of GB/T 43252-2023 “Test Methods for Energy Consumption and Driving Range of Fuel-Cell Electric Vehicles” [20], elaborating on the main revisions of the new standard and the major differences between the new and old standards. The paper analyzes the method for classifying test vehicles, focuses on the testing procedures of Class A vehicles using the shortened method and Class B vehicles using the complete cycle method, and outlines the methods for measuring the amount of hydrogen refilled externally or onboard. Taking a Class B fuel-cell dump truck (FCDT) as the research subject, the paper conducts driving range tests under the CHTC-D condition using the complete cycle method. It analyzes the changes in the output power of fuel cells and power batteries, the total energy output changes, and the optimal power output range of fuel cells throughout the entire process from full hydrogen and full battery to vehicle stop due to energy exhaustion. This work can provide practical experience for future standard formulation and revision.

2. Comparison of Main Content between New and Old Standards

The evaluation standards for the energy consumption and driving range testing of fuel-cell electric vehicles originated from the earliest document, “Test Methods for Technical Parameters of Power Batteries and Fuel Cells (Trial)” (Zhongjihan (2017) No. 2), which was one of the mandatory regulations. Subsequently, the Equipment Center issued the “Fuel Cell Vehicle Testing Specification (Trial)” (Equipment Center (2021) No. 367) [21], proposing the concept of fuel-cell energy ratio. The most recent standard, GB/T 43252-2023 “Test Methods for Energy Consumption and Driving Range of Fuel-Cell Electric Vehicles”, has undergone significant changes in the evaluation methods for the energy consumption and driving range testing of fuel-cell electric vehicles, including various aspects such as testing conditions, testing procedures, and data processing. The new standard, based on the experience of the old standard test methods, introduces three important aspects for the first time: first, it requires vehicle classification based on the ratio of energy changes before testing, leading to more detailed testing procedures and data processing methods; second, it proposes a shortened method for testing the driving range of Class A vehicles, reducing test time and costs, and improving test efficiency; third, it subdivides the previous single test vehicle’s onboard hydrogen supply into Class A vehicles using an external hydrogen supply and Class B vehicles using an onboard hydrogen supply. Additionally, the testing conditions have been enhanced, adding a pre-immersion step before testing, specifying the immersion temperature and time, and adjusting the environmental temperature range from the previous 25 ± 5 °C to 23 ± 5 °C, which is more reasonable. Moreover, the new standard determines the hydrogenation and charging amounts before testing for different types of vehicles and proposes the use of “China driving cycles” as testing conditions, making it more suitable for the operating modes of domestic fuel-cell vehicles. The improvements and refinements in the new standard are not only for the policies outlined in the jointly issued “Medium and Long-Term Development Plan for the Hydrogen Industry (2021–2025)” by the National Energy Administration and the National Development and Reform Commission, but also for the formulation of standards that are more in line with the situation of the Chinese fuel-cell vehicle industry and actual driving conditions, enabling consumers to obtain driving ranges and hydrogen consumption values that are closer to reality. For a detailed comparison of the main content between the old and new standards, refer to Table 1.

3. Method and Process for Driving Range Testing

The driving range testing methods for fuel-cell electric vehicles include the Shortened Method and the Complete Cycle Method. Before selecting a testing method, enterprises need to determine the category of the vehicle. If the ratio of the net energy change of the vehicle’s power battery to the energy consumption of hydrogen is less than or equal to 1.0%, the vehicle belongs to Class A; otherwise, it belongs to Class B. Class A vehicles can choose either the Shortened Method or the Complete Cycle Method for testing the driving range based on actual testing conditions. Class B vehicles, which are further divided into externally chargeable and non-externally chargeable types, use the Complete Cycle Method for testing the driving range. For fuel-cell systems with a high integration where it is impractical to measure the current and voltage of the fuel cell directly, the voltage and current at the output of the DC/DC converter can be measured, and the values can be converted with an efficiency assumption of 97.0% [20].

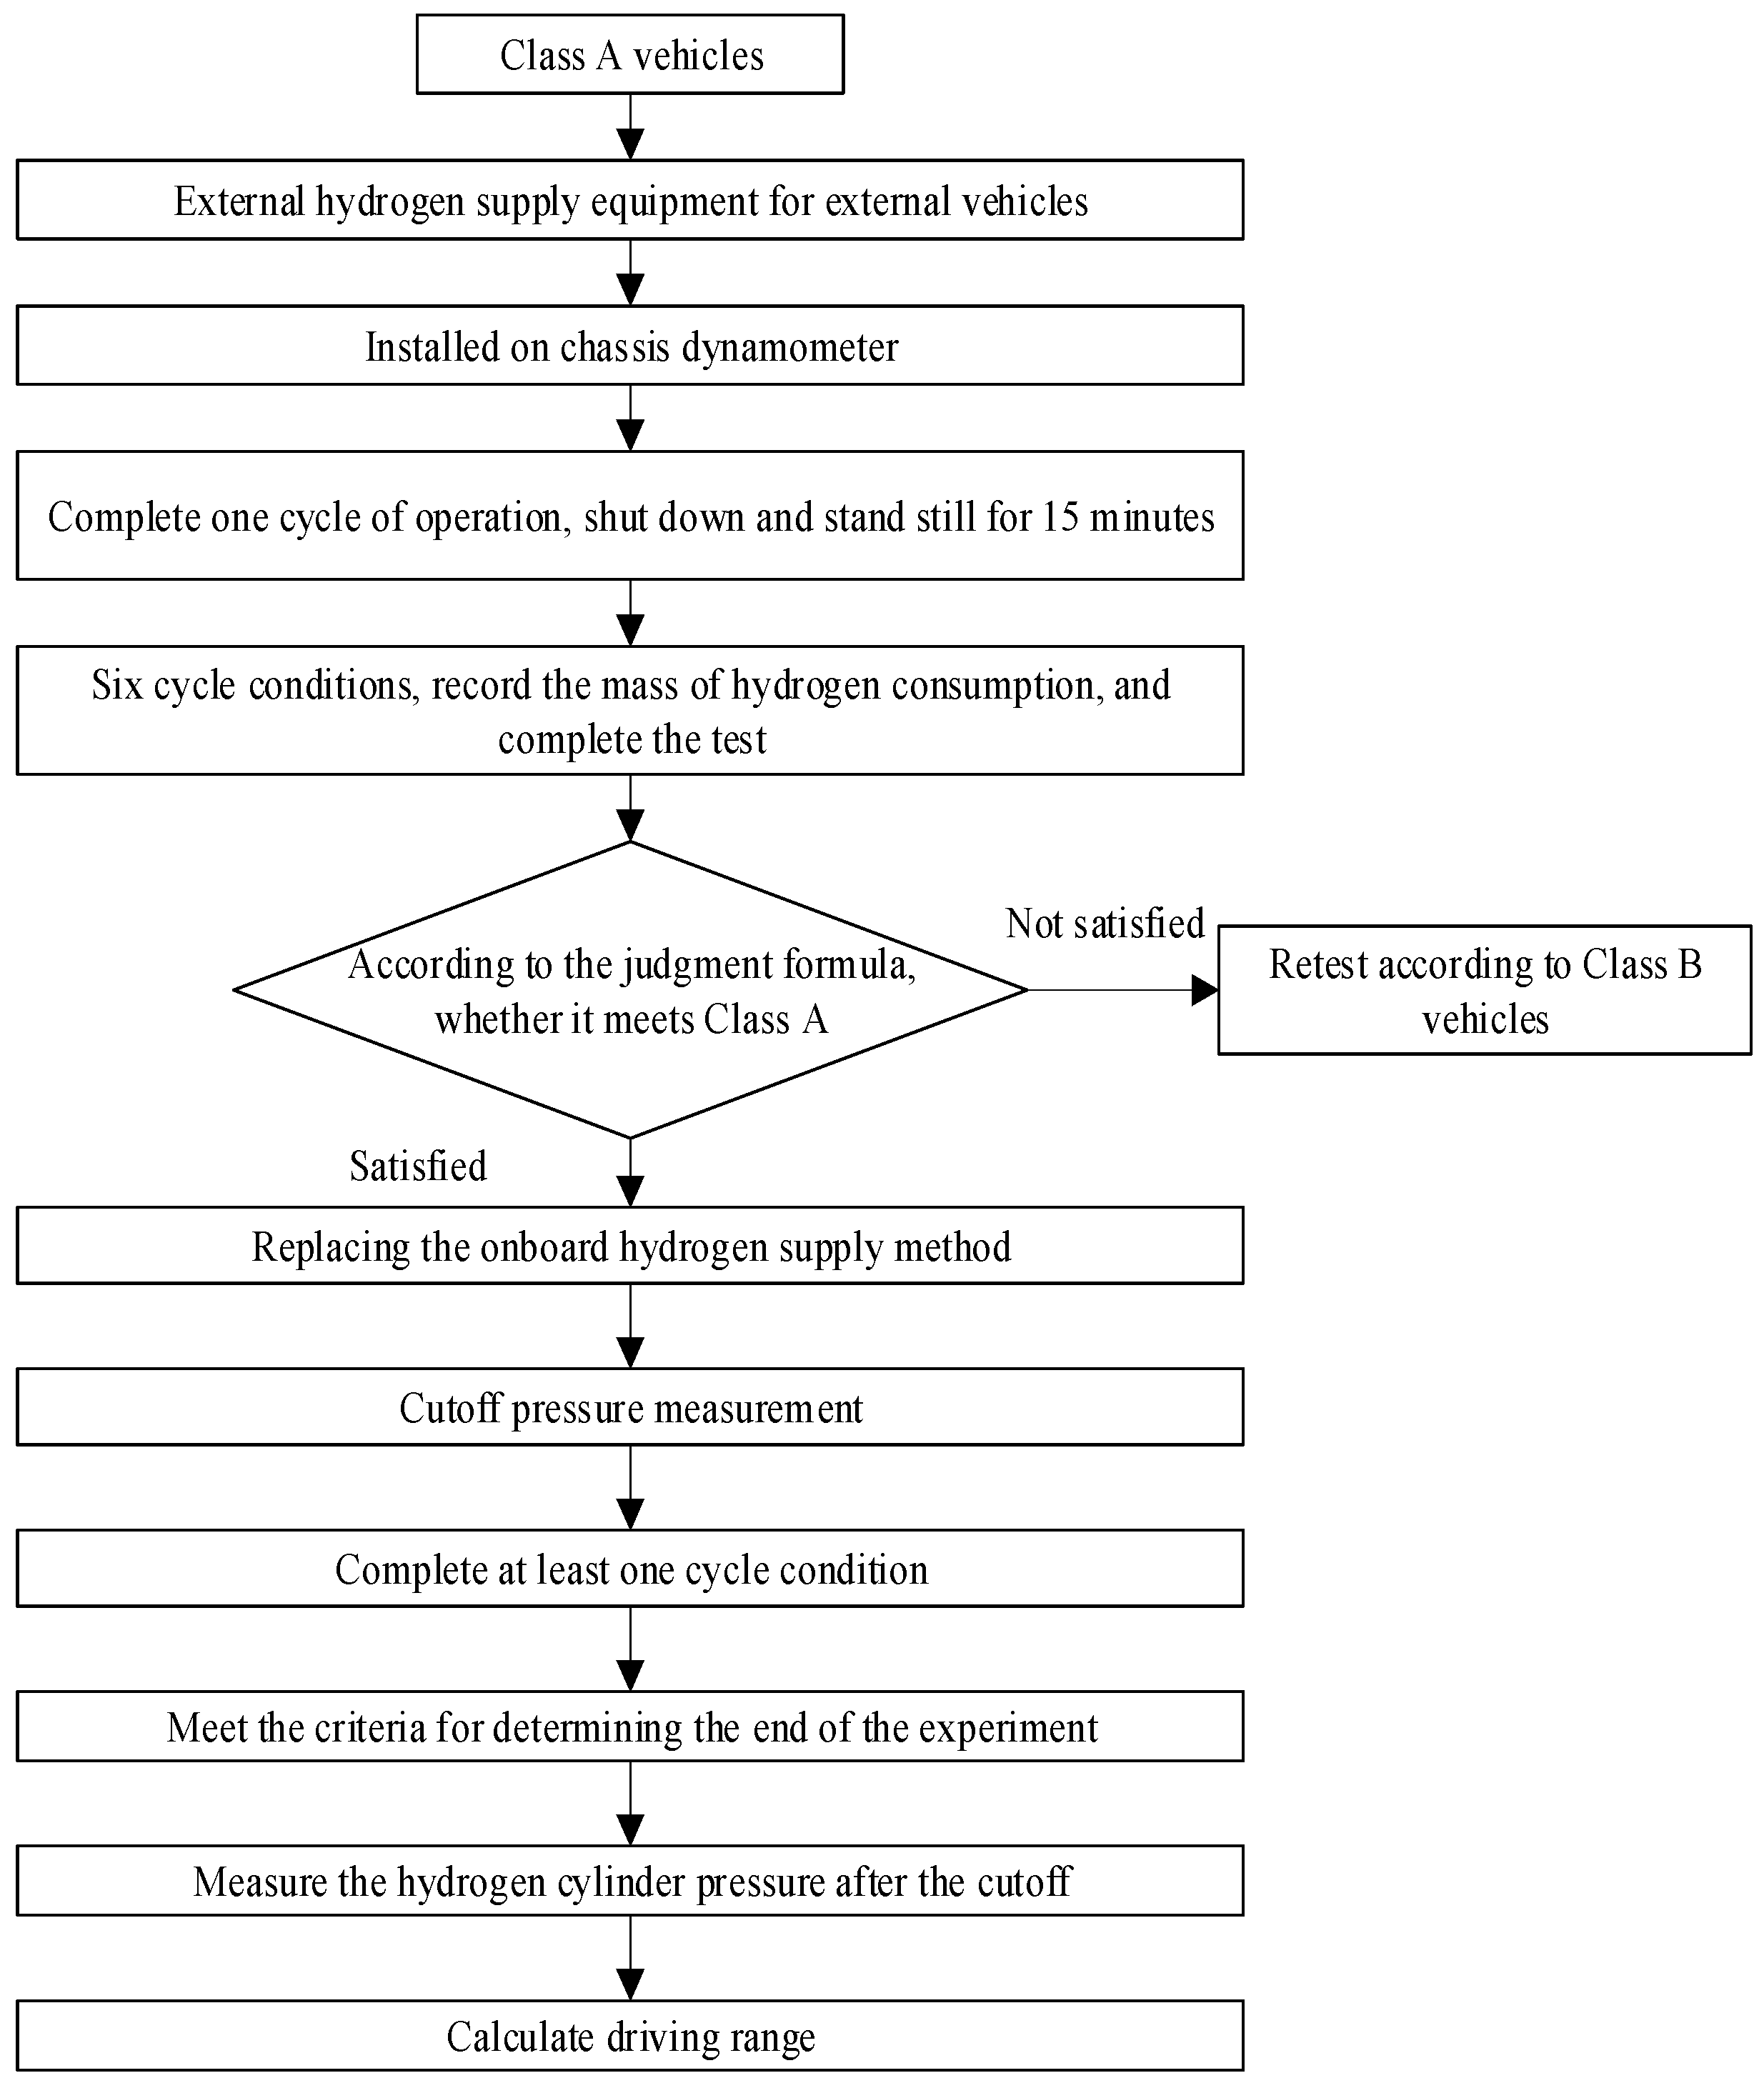
3.1. Shortening Method Testing Method and Process

The shorting method refers to the hydrogen cylinder cut-off pressure test conducted on a vehicle after running six test cycles, as shown in Figure 1:
  • Turn off the onboard hydrogen supply system of the test vehicle, use an external hydrogen supply, connect the external hydrogen supply equipment, and run in at least 300 km before the test;
  • After fixing the vehicle on the chassis dynamometer, conduct the test at room temperature (18~28 °C);
  • The vehicle road load and chassis dynamometer load shall be set according to national standards or provided by the enterprise;
  • After completing one cycle of operation, the vehicle should be shut down and stationary for 15 min;
  • Turn on the vehicle signal acquisition device, and the collected signals include but are not limited to the current and voltage of the power battery, vehicle mileage, and hydrogen mass. The frequency of each signal acquisition is not less than 5 Hz;
  • Start the vehicle and conduct 6 consecutive driving tests according to the Chinese driving schedule to determine the vehicle’s category again;
  • If it is a Class A vehicle, replace the onboard hydrogen supply method, measure the cut-off pressure, run the complete cycle condition at least once, and measure the hydrogen cylinder pressure after the cut-off after reaching the judgment conditions for the end of the test;
  • If it is a Class B vehicle, retest according to the finish running method;
  • If the total output energy of the power battery of Class B vehicles is calculated to be less than or equal to 0, then the pure hydrogen driving range is equal to the total driving range of the vehicle; on the contrary, follow the steps of external charging in Class B vehicles for data processing.

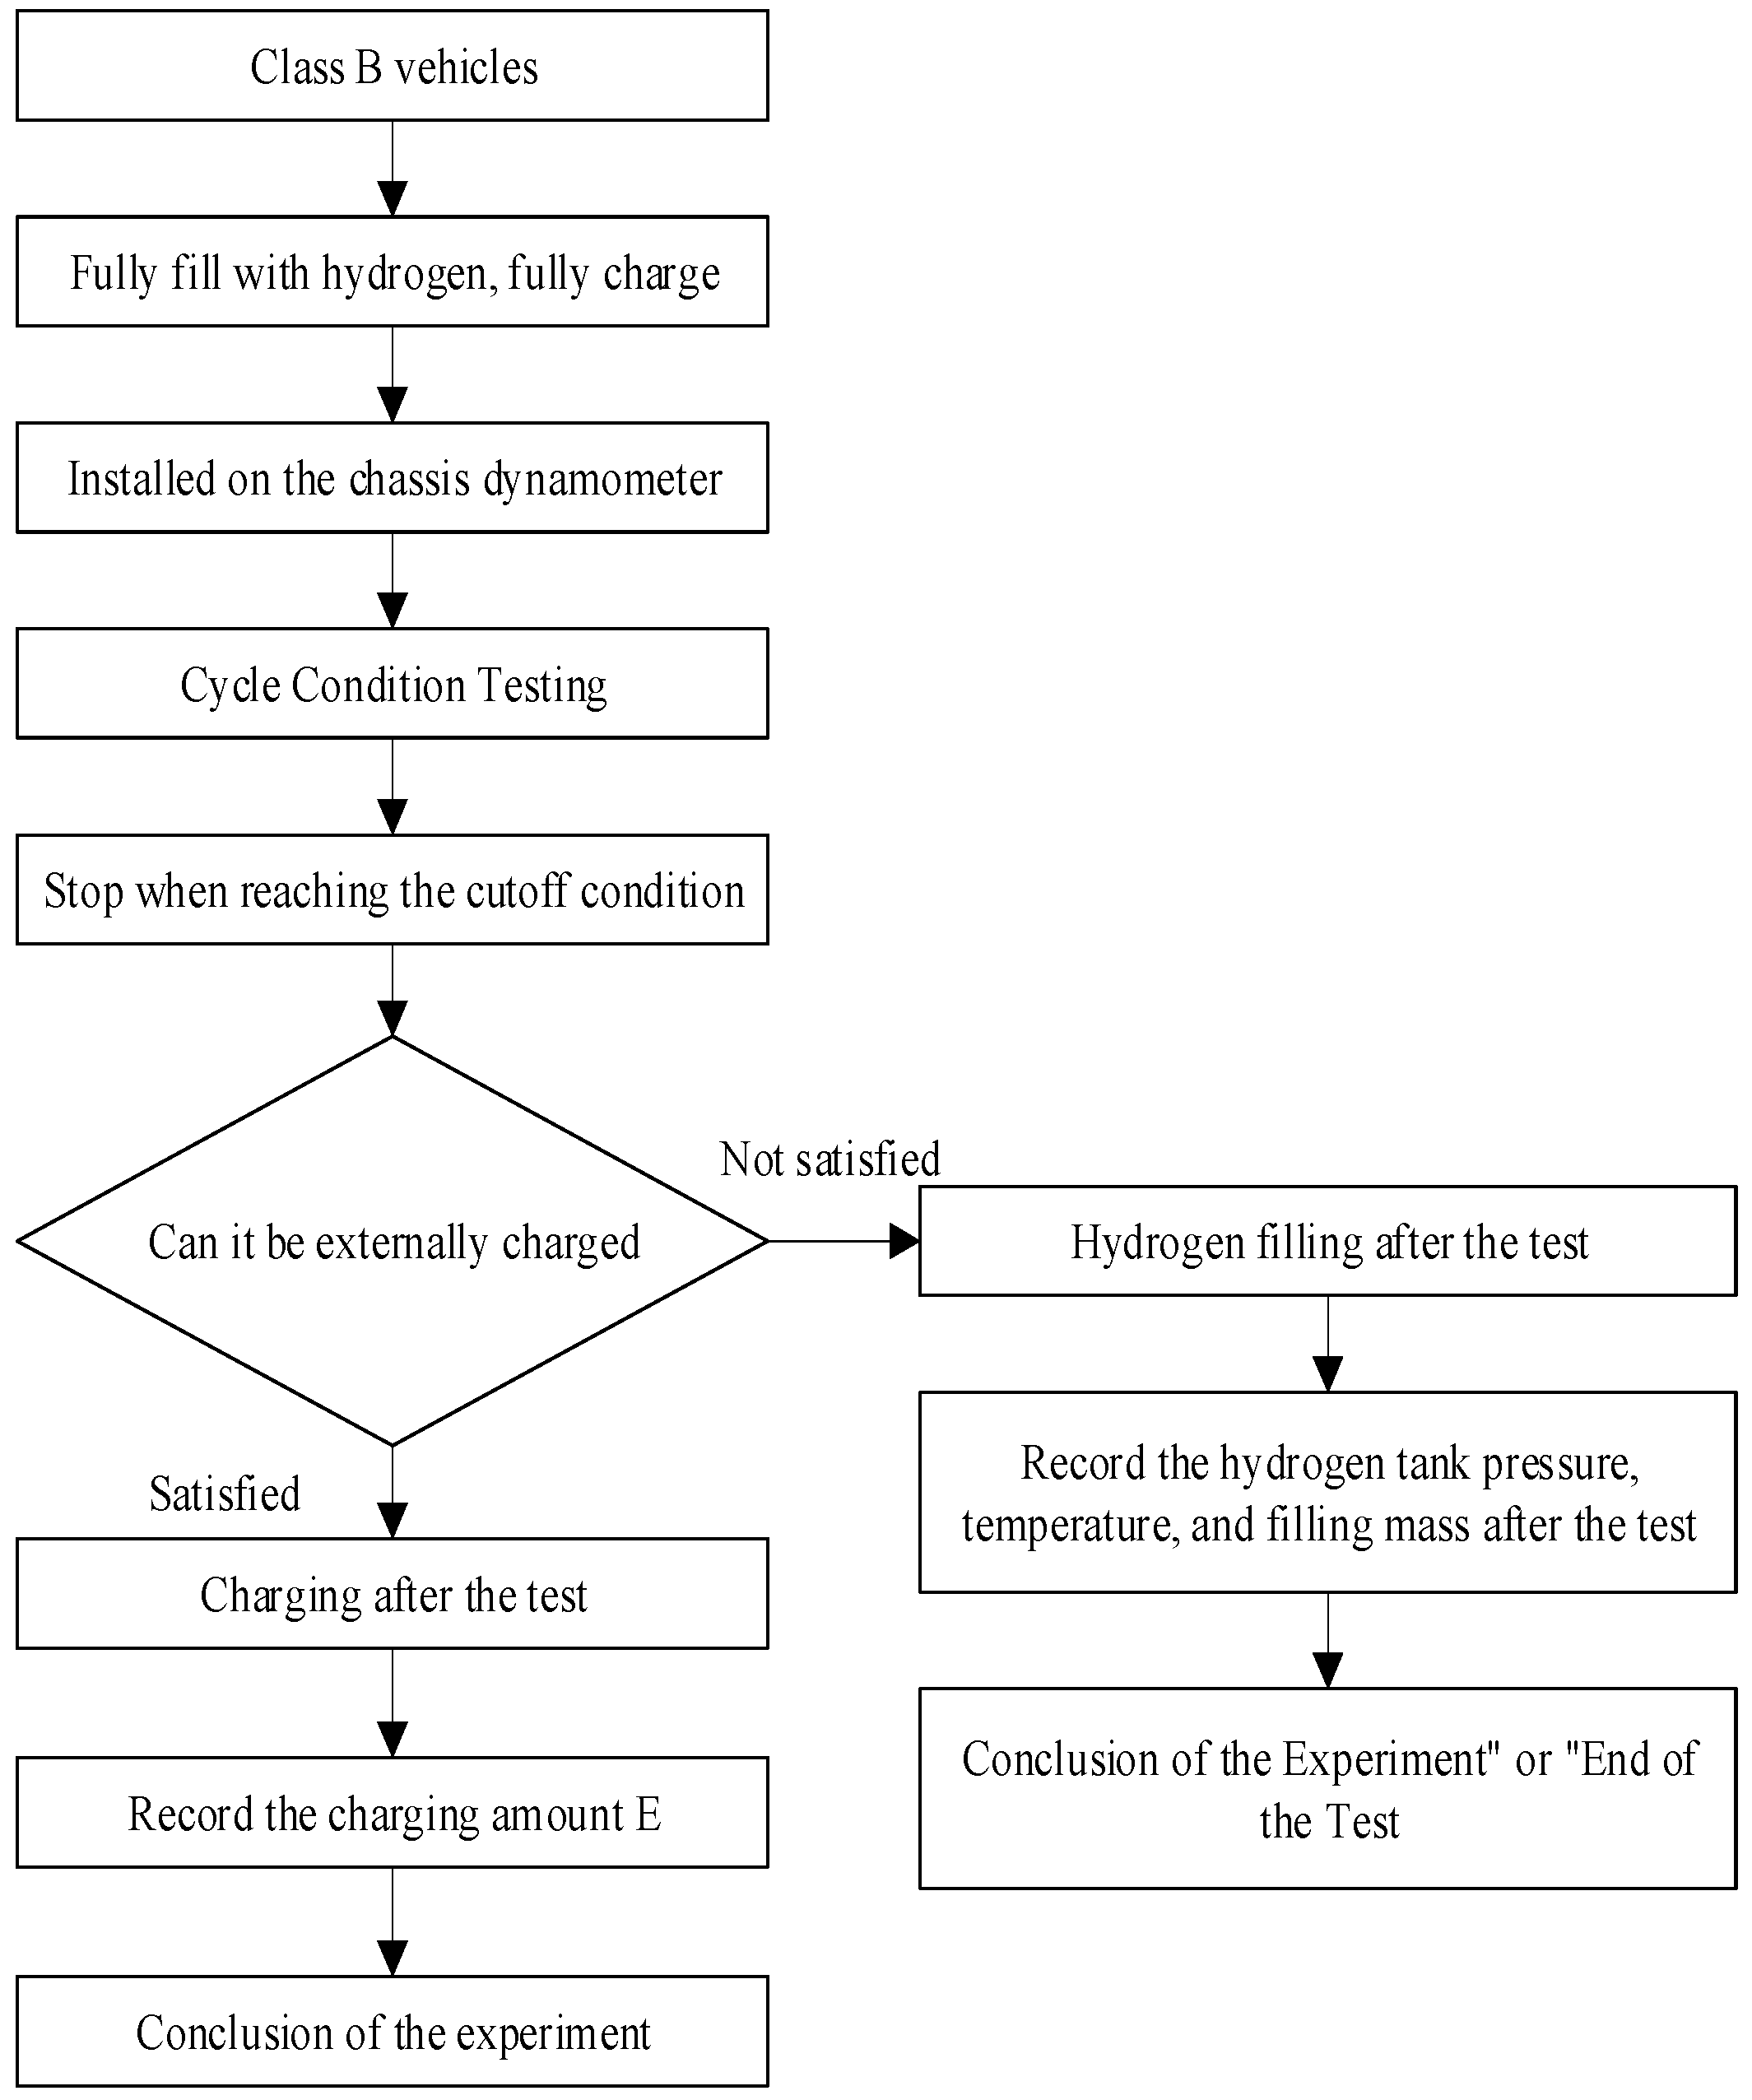
3.2. The Testing Method and Process of the Finish Running Method

The Finish Running method refers to the process of running the vehicle from a state of full hydrogen and full electricity to a stop when the fuel is depleted. The testing process is shown in Figure 2.
  • The test vehicle adopts an onboard hydrogen supply system, and the onboard hydrogen cylinder is filled with hydrogen to fully charge the power battery. Before the test, it should be run in for at least 300 km;
  • After fixing the vehicle on the chassis dynamometer, conduct the test at room temperature (18~28 °C);
  • The vehicle road load and chassis dynamometer load shall be set according to national standards or provided by the enterprise;
  • Turn on the vehicle signal acquisition device, and the collected signals include but are not limited to the temperature and pressure of each hydrogen cylinder, the current and voltage of the hydrogen fuel cell and power battery, the vehicle’s mileage, hydrogen consumption, and hydrogen flow rate. The frequency of each signal acquisition is not less than 5 Hz;
  • Start the vehicle and conduct continuous condition tests according to the Chinese working condition table. During the test, the number of stops outside the working condition cycle shall not exceed three times, and the total stopping time shall not exceed 15 min until the deadline conditions are met. Record the total mileage of the vehicle;
  • If the vehicle can be charged externally, it should be charged within 30 min after the end of the test, and the charging amount should be recorded;
  • If the vehicle cannot be charged externally, hydrogen should be added after the test, and the pressure, temperature, and mass of hydrogen added to the hydrogen cylinder should be recorded after the test.

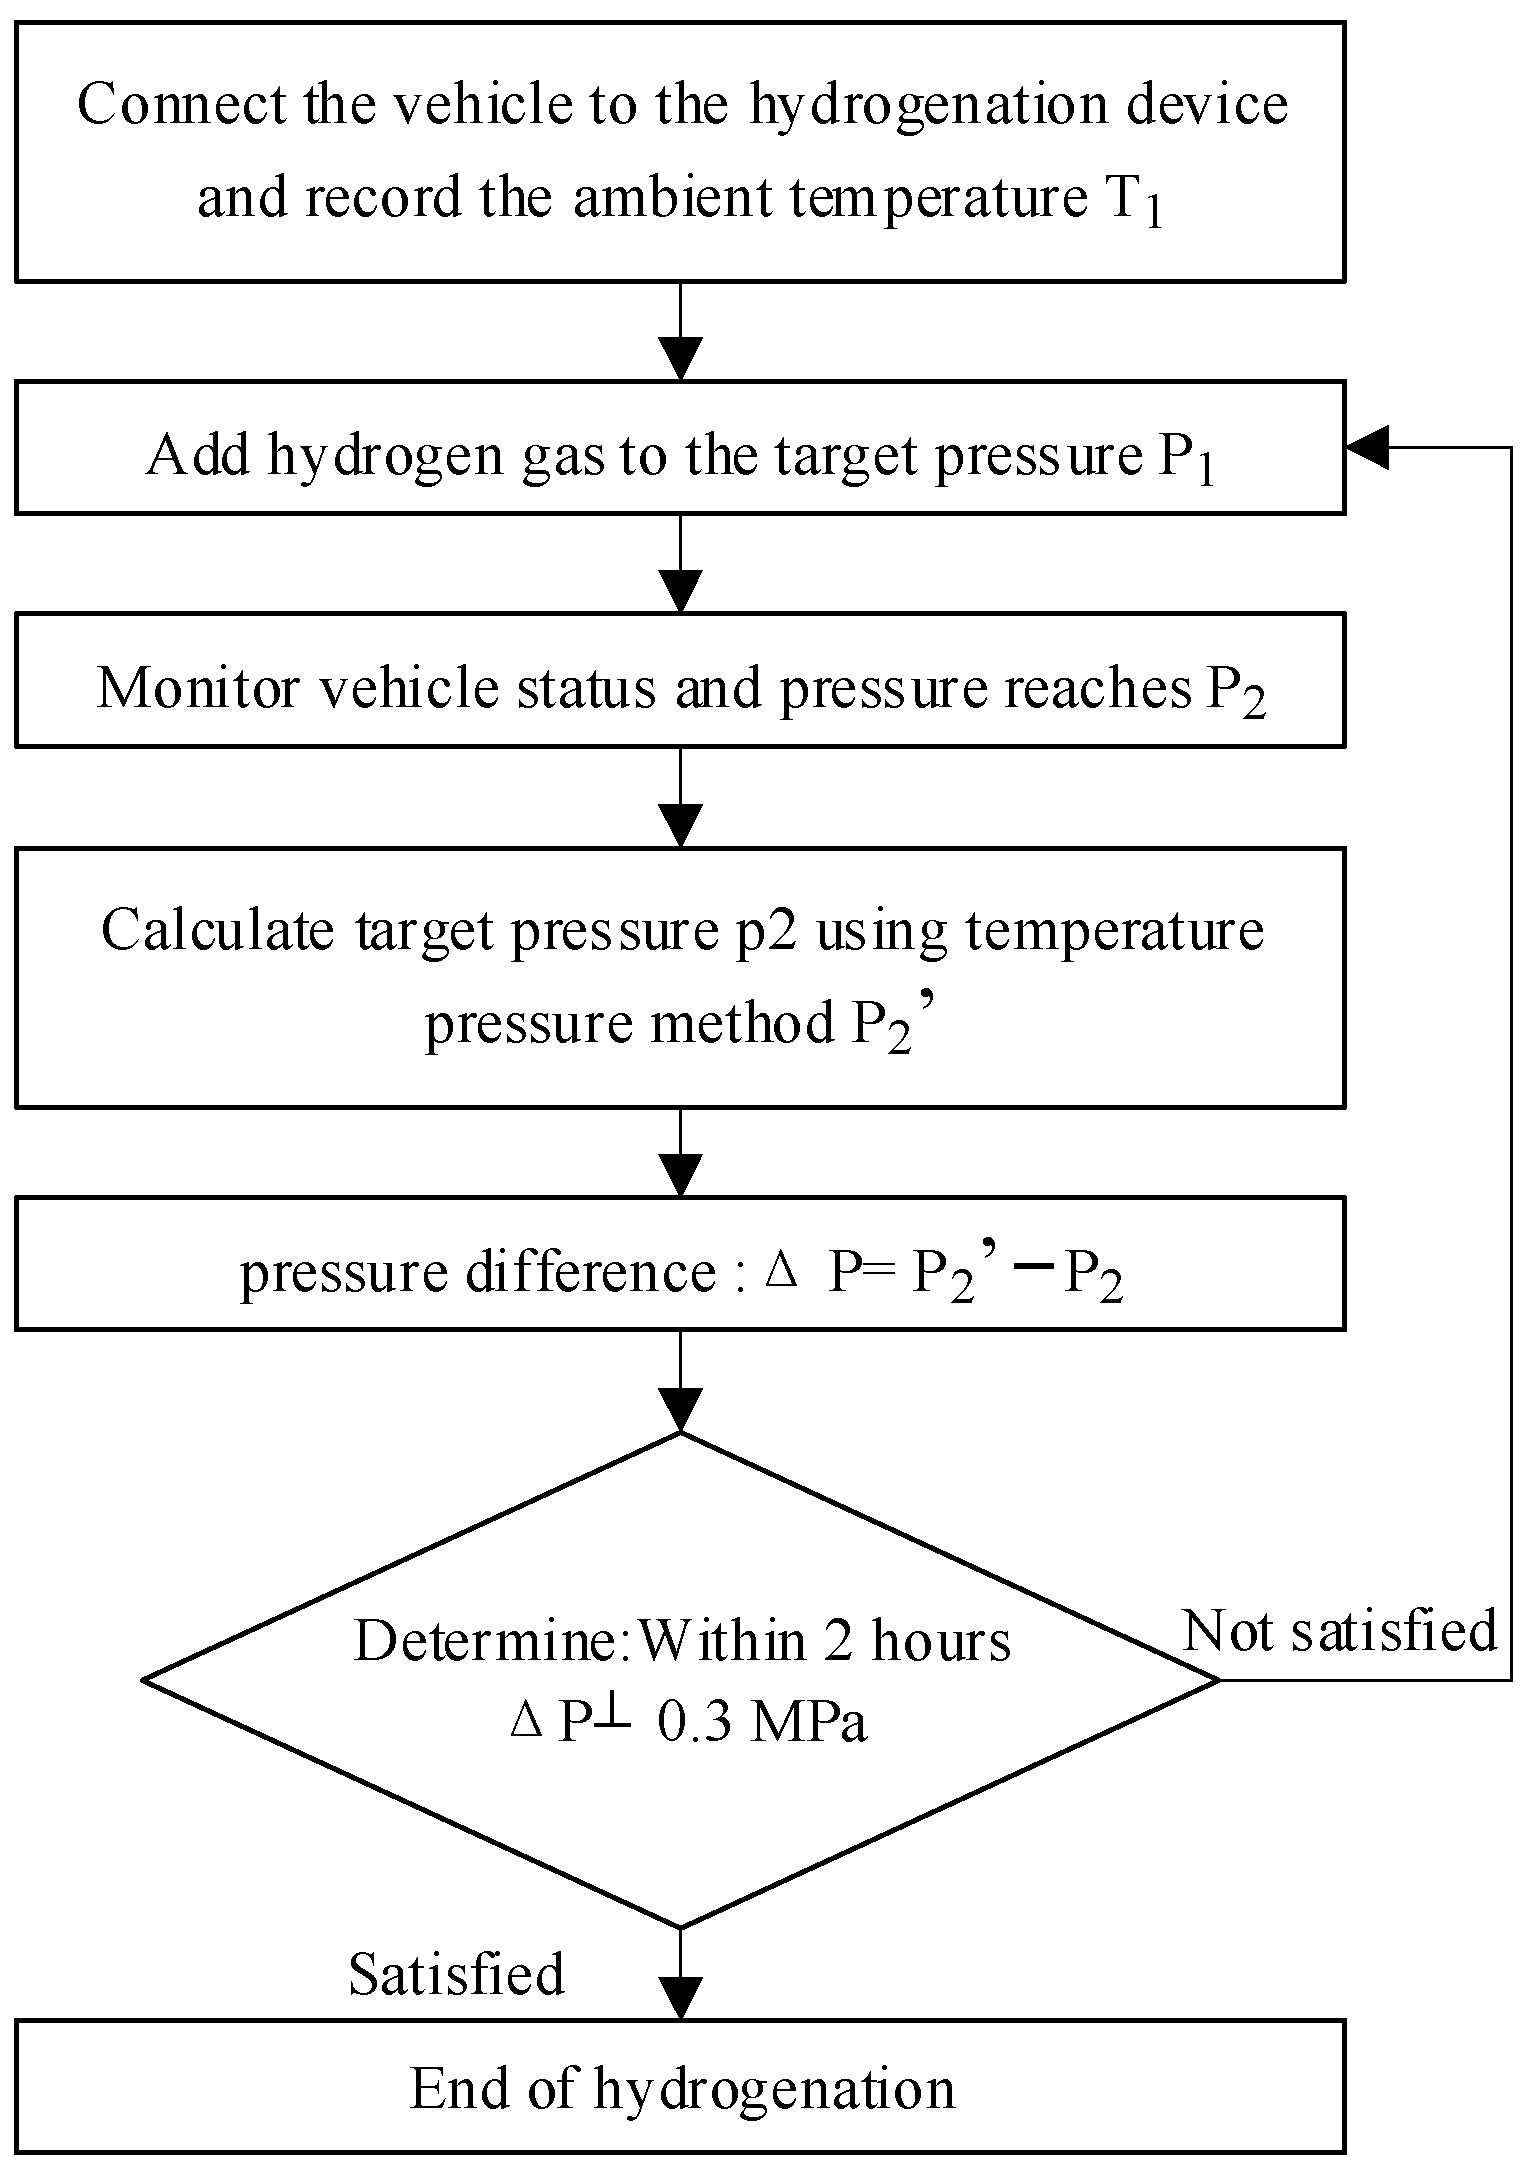
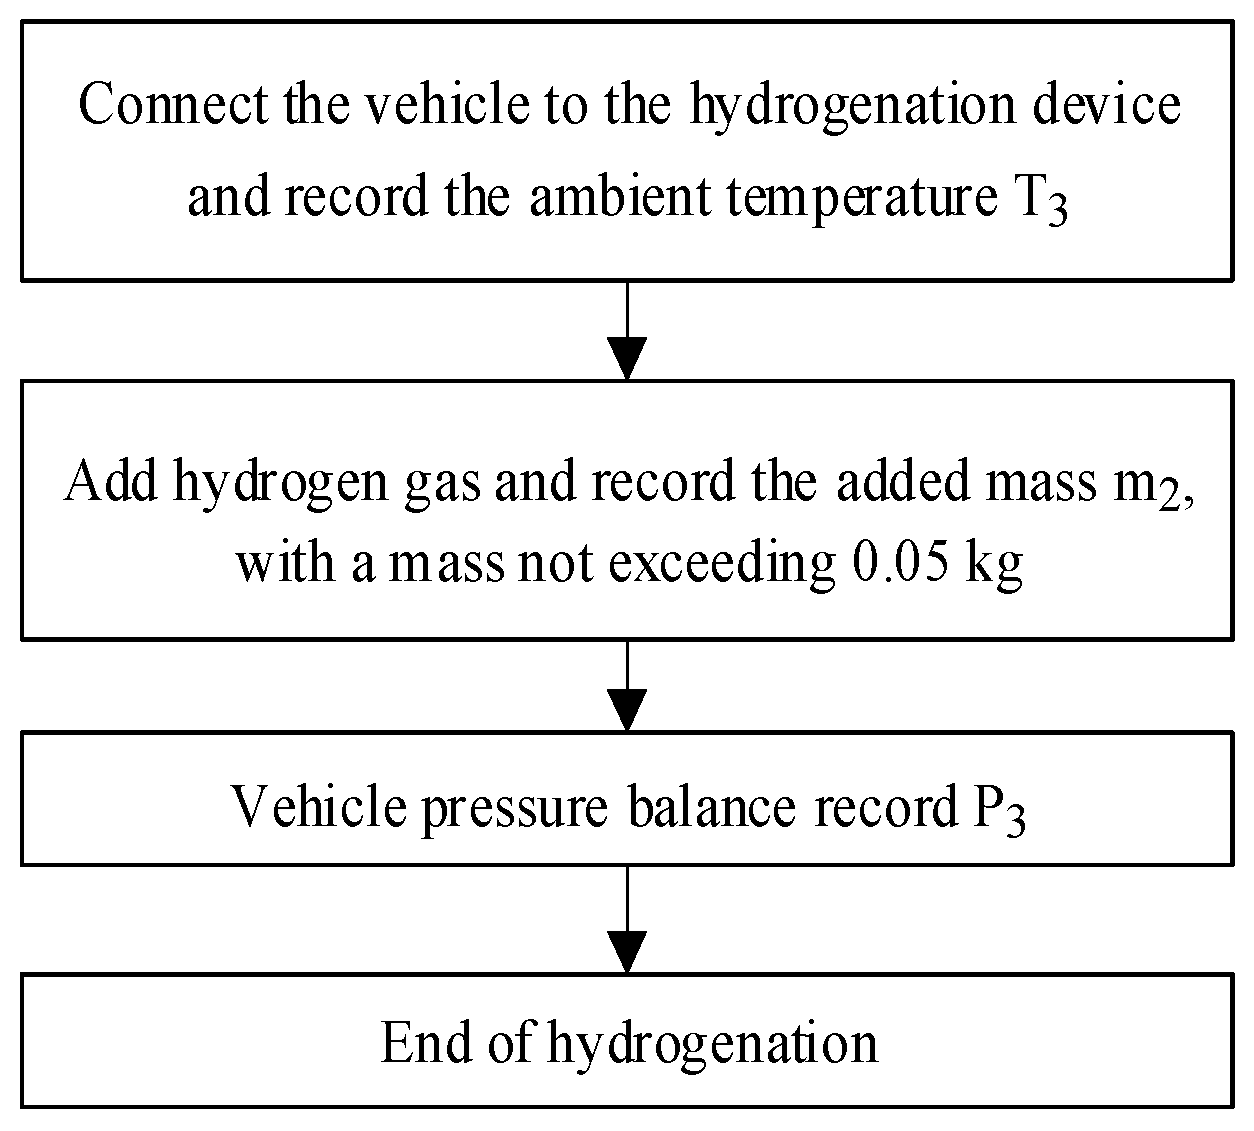
4. Calculation Method for Adding Hydrogen Gas

Currently, in the domestic fuel-cell vehicle market, the powertrain configurations primarily consist of hybrid powertrains, where both fuel cells and battery systems act as power sources. These hybrid powertrains are classified as Class B vehicles [24,25,26]. Class B vehicles typically have larger battery capacities, and the power supply from the fuel-cell stack is often step-wise. The power output of the fuel-cell stack is determined based on the state of charge (SOC) of the battery and the overall vehicle power demand. On the other hand, Class A vehicles are those where hydrogen fuel serves as the sole power source [27,28]. In Class A vehicles, the primary source of energy is the fuel-cell stack, and the battery capacity is generally smaller. The battery in Class A vehicles primarily functions to smooth out power demands. The standard specifies that Class A vehicles use an external hydrogen supply method, while Class B vehicles use an onboard hydrogen supply method during testing. It is crucial to note that, when using the hydrogen-related test equipment for hydrogen filling and pressure measurement inside hydrogen cylinders during testing, it is essential for trained professionals from enterprises to handle the equipment to prevent potential safety hazards. This section focuses on the measurement methods for hydrogen filling, whether using an external or onboard hydrogen supply, during the testing of vehicles.
  • For Class A vehicles undergoing external hydrogen supply testing, it is necessary to install high-precision volumetric or mass flow meters in the external hydrogen supply equipment. During the test, hydrogen gas is supplied at the pressure specified by the manufacturer, and the volume or mass of hydrogen passing through the flow meter is recorded.
  • For Class B vehicles undergoing onboard hydrogen supply testing, the mass of hydrogen injected during the test is calculated using the pressure–temperature method [29].
Before hydrogen filling in preparation for the test, the process involves a potential issue where the onboard hydrogen storage tank may experience temperature elevation, preventing the hydrogen tank from reaching 100% filling due to the expansion of the hydrogen gas. This results in an actual hydrogen storage mass that falls short of the intended amount. The hydrogen filling is paused until the hydrogen tank pressure decreases, and the vehicle stabilizes gradually [30,31]. Hydrogen filling is then resumed until the pressure difference between the monitored hydrogen tank pressure and the target pressure calculated by the pressure–temperature method is less than or equal to 0.3 MPa within a 2 h timeframe. At the point when the hydrogen filling before the test concludes, the environmental temperature T1, the hydrogen tank pressure P1, and the filled hydrogen gas mass m1 are recorded. If the specified conditions are not met, the hydrogen filling process continues until the criteria are satisfied [20]. The testing procedure is outlined in Figure 3.
After the test, a small amount of hydrogen gas (not exceeding 0.05 kg) is injected into the vehicle using a mass flow meter. This is performed to facilitate the hydrogen pressure measurement in the hydrogen tank by providing a flow of hydrogen gas to the hydrogen injection system. The mass of hydrogen injected is denoted as m2 [20]. Following the injection of a small amount of hydrogen, the environmental temperature T3 and the internal pressure of the hydrogen tank P3 are recorded. The remaining hydrogen mass in the vehicle m3 is then calculated using the pressure–temperature method. The testing procedure is illustrated in Figure 4. In summary, it can be concluded that the mass of hydrogen consumed by fuel-cell electric vehicles in the test is mH2, and the specific formula is as follows:
m 1 = 2.016 × V R × P 1 Z 1 × T 1
In the formula, m1 represents the mass of hydrogen gas refilled into the tank before the test, measured in grams (g); V denotes the total volume of the high-pressure portion and accessories in the fuel tank (such as pressure relief valves, pipelines, etc.), measured in liters (L); R represents the universal gas constant, where R = 0.008314 [MPa·L/(mol·K)]; P1 is the number of gas molecules and pressure inside the tank at the beginning of the test, measured in megapascals (MPa); T1 stands for the number of gas molecules and temperature inside the tank at the beginning of the test, measured in Kelvin (K); and Z1 denotes the compressibility factor of hydrogen gas at P1 and T1.
m 3 = 2.016 × V R × P 3 Z 3 × T 3
In the formula, m3 represents the remaining mass of hydrogen gas in the tank after the test, measured in grams (g); P3 denotes the number of gas molecules and pressure inside the tank at the end of the test, measured in megapascals (MPa); T3 stands for the number of gas molecules and temperature inside the tank at the end of the test, measured in Kelvin (K); and Z3 denotes the compressibility factor of hydrogen gas at P3 and T3.
m H 2 = m 1 + m 2 m 3
In the formula, mH2 represents the mass of hydrogen gas consumed during the test process, measured in grams (g); and m2 represents the mass of a small amount of hydrogen gas added to the tank after the test is completed, measured in grams (g).
Z = i = 1 6 j = 1 4 v i j P i 1 ( 100 / T ) j 1
In the formula, P represents pressure, measured in megapascals (MPa); T represents temperature, measured in Kelvin (K); and Vij represents constants, as listed in Table 2.

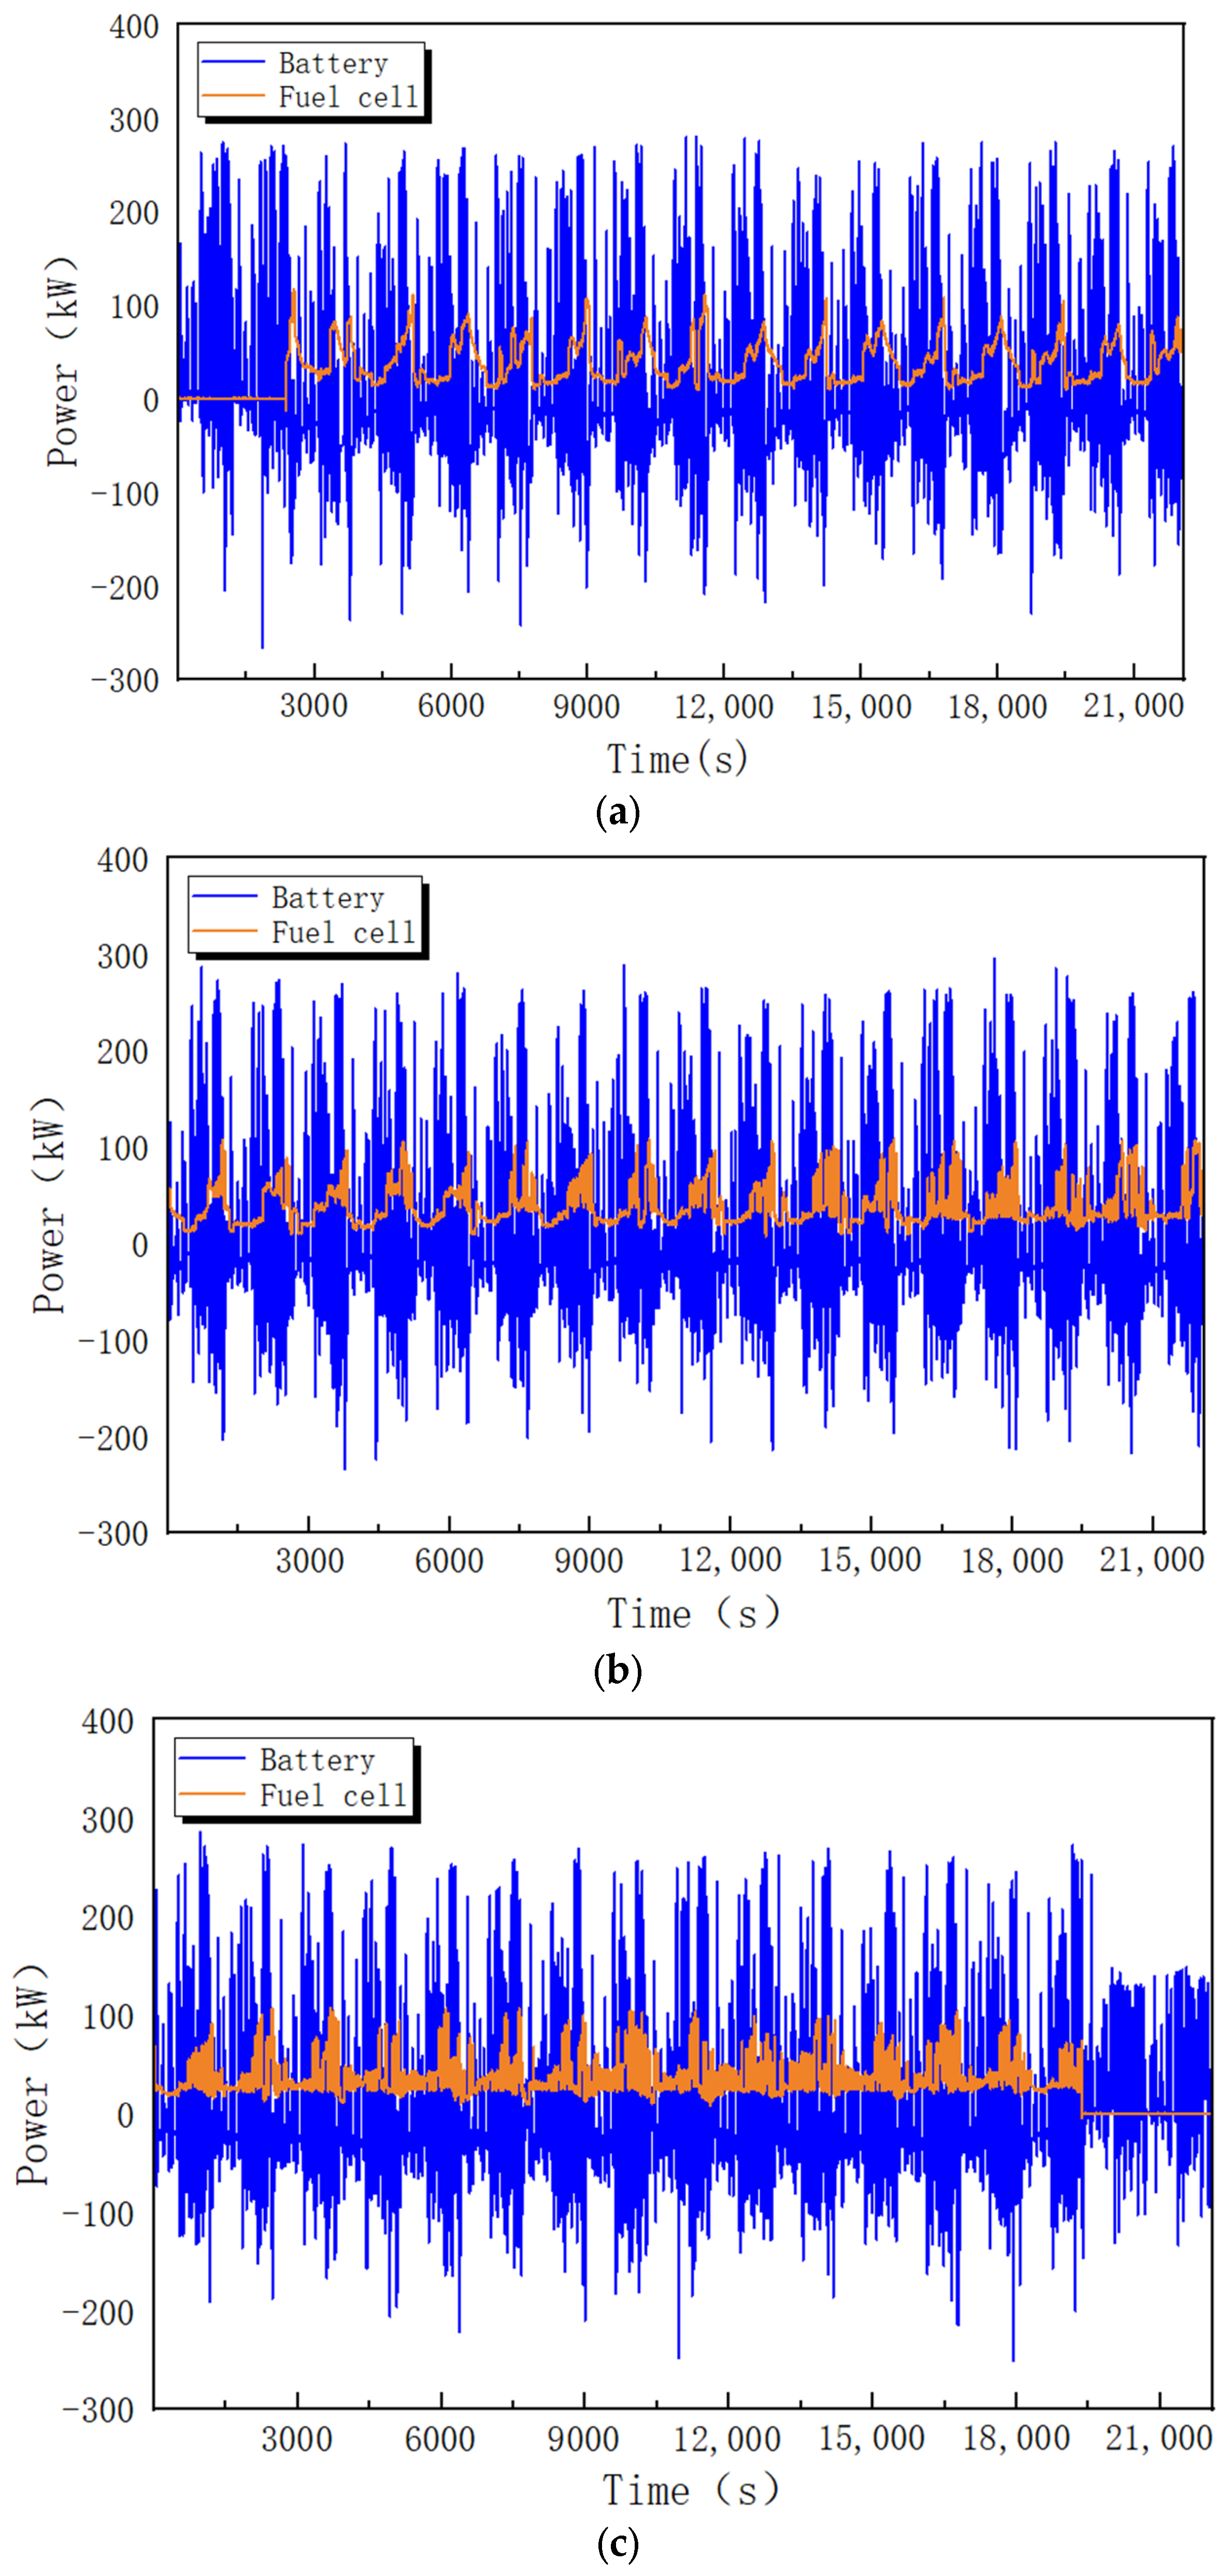
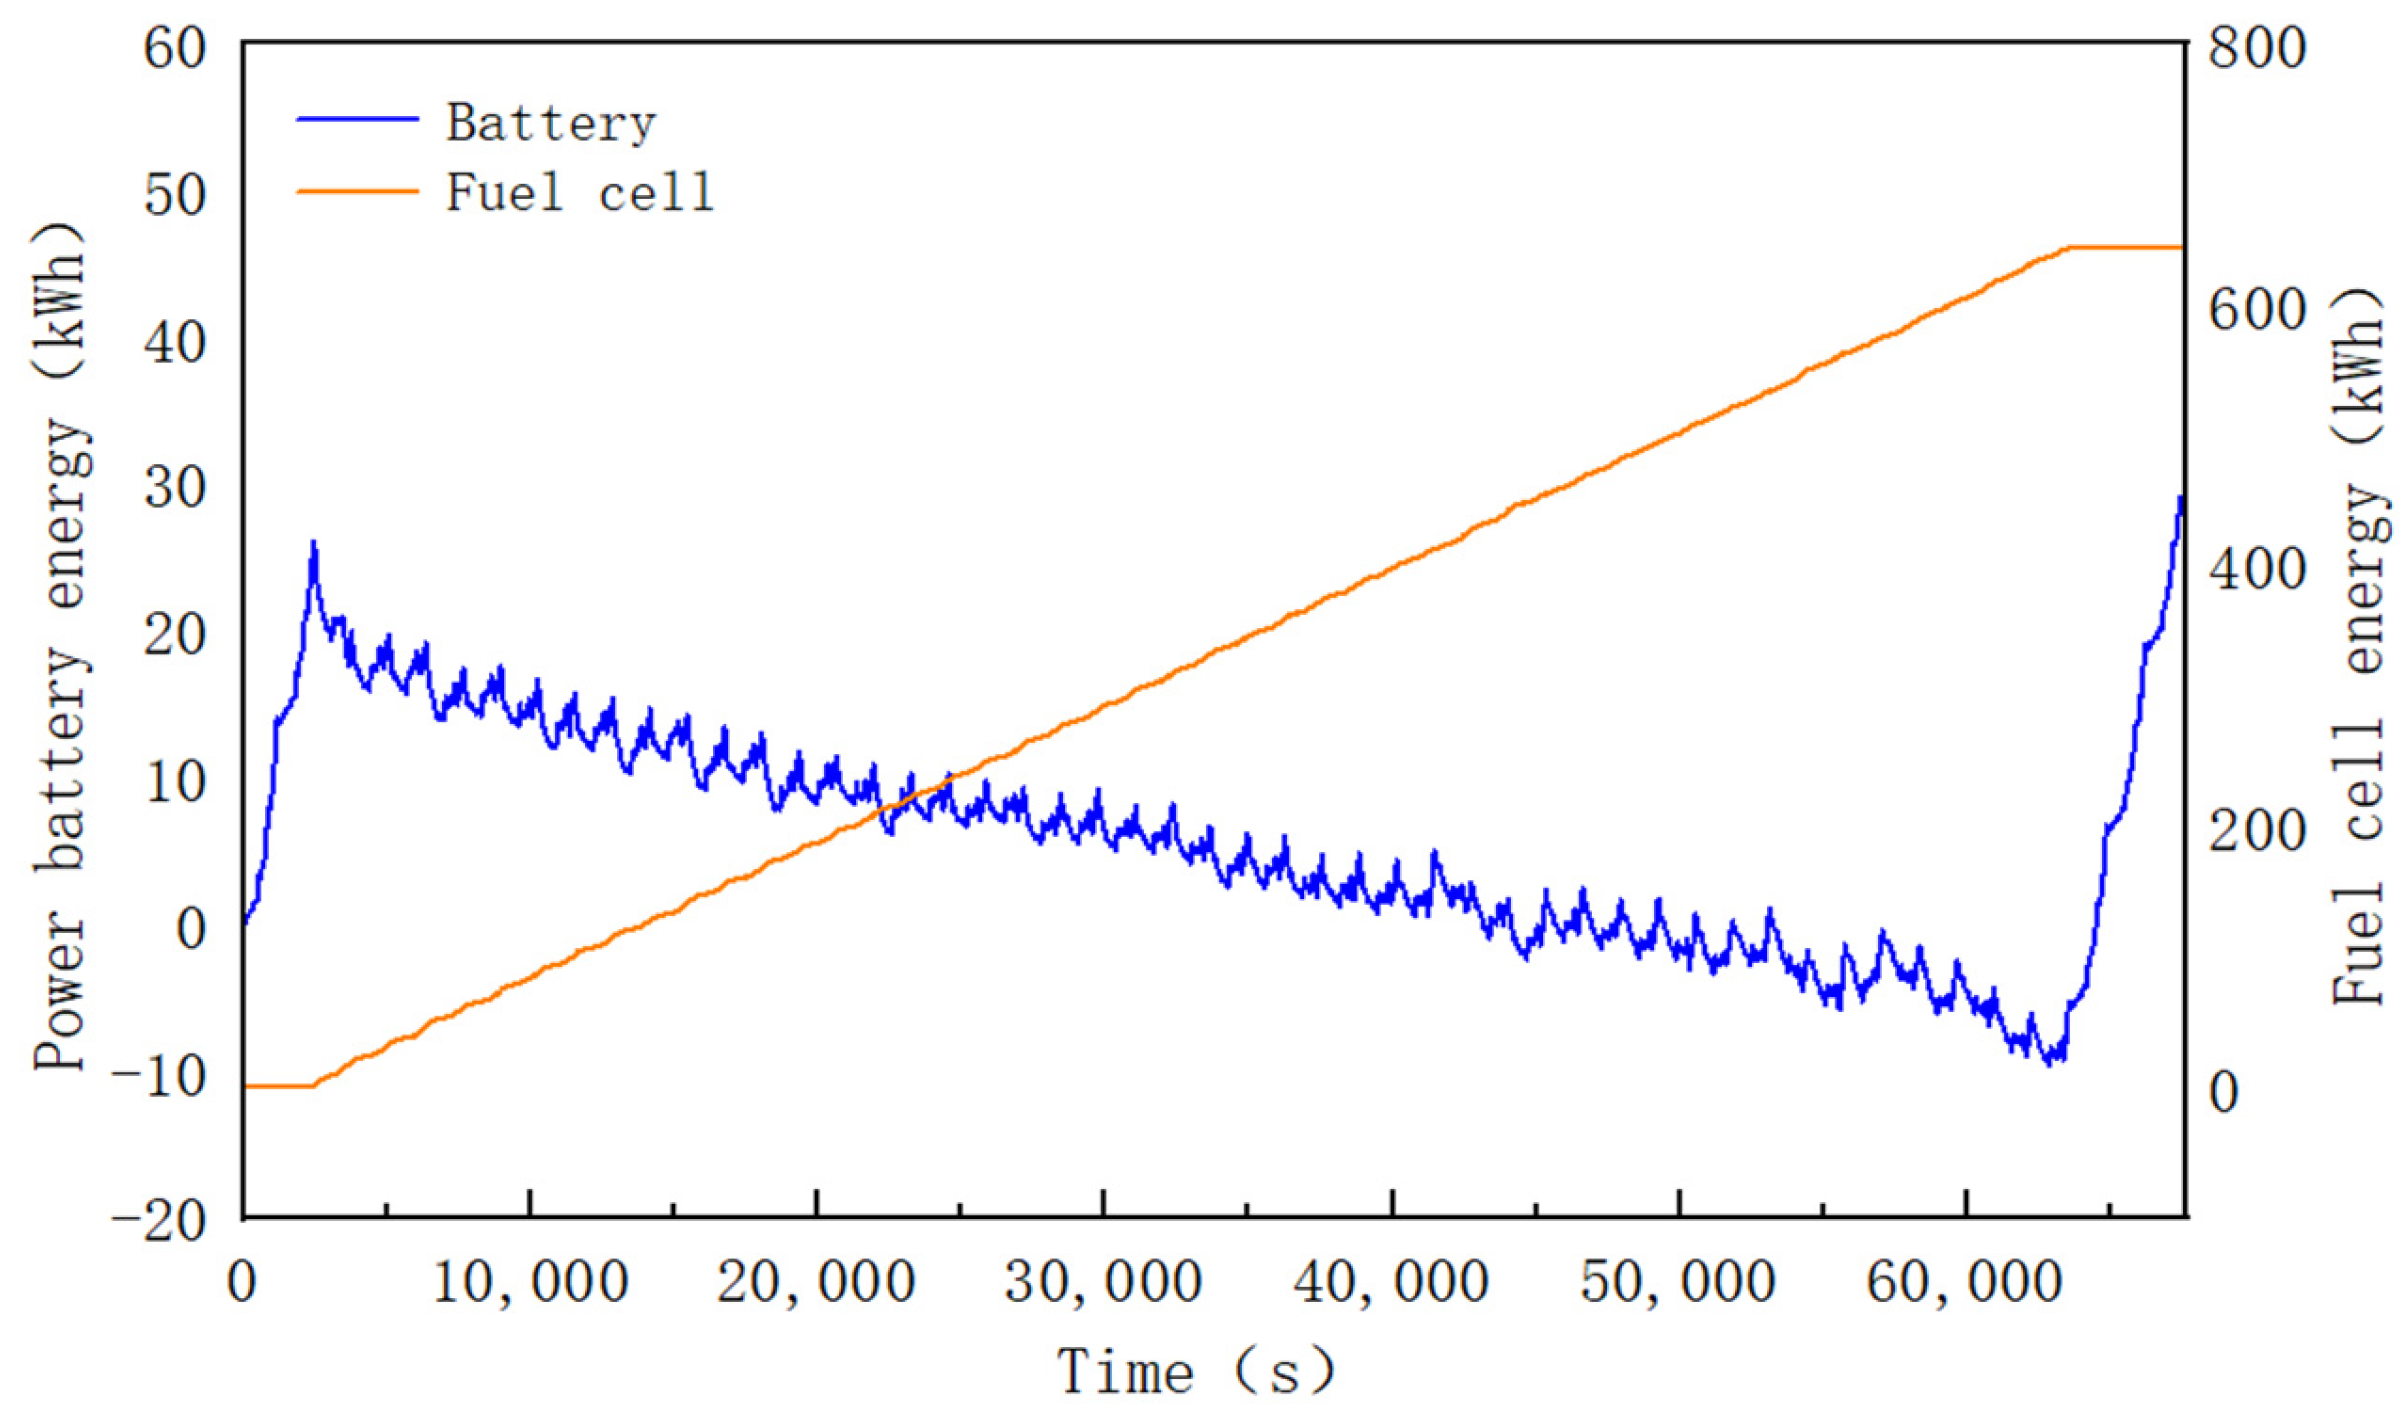
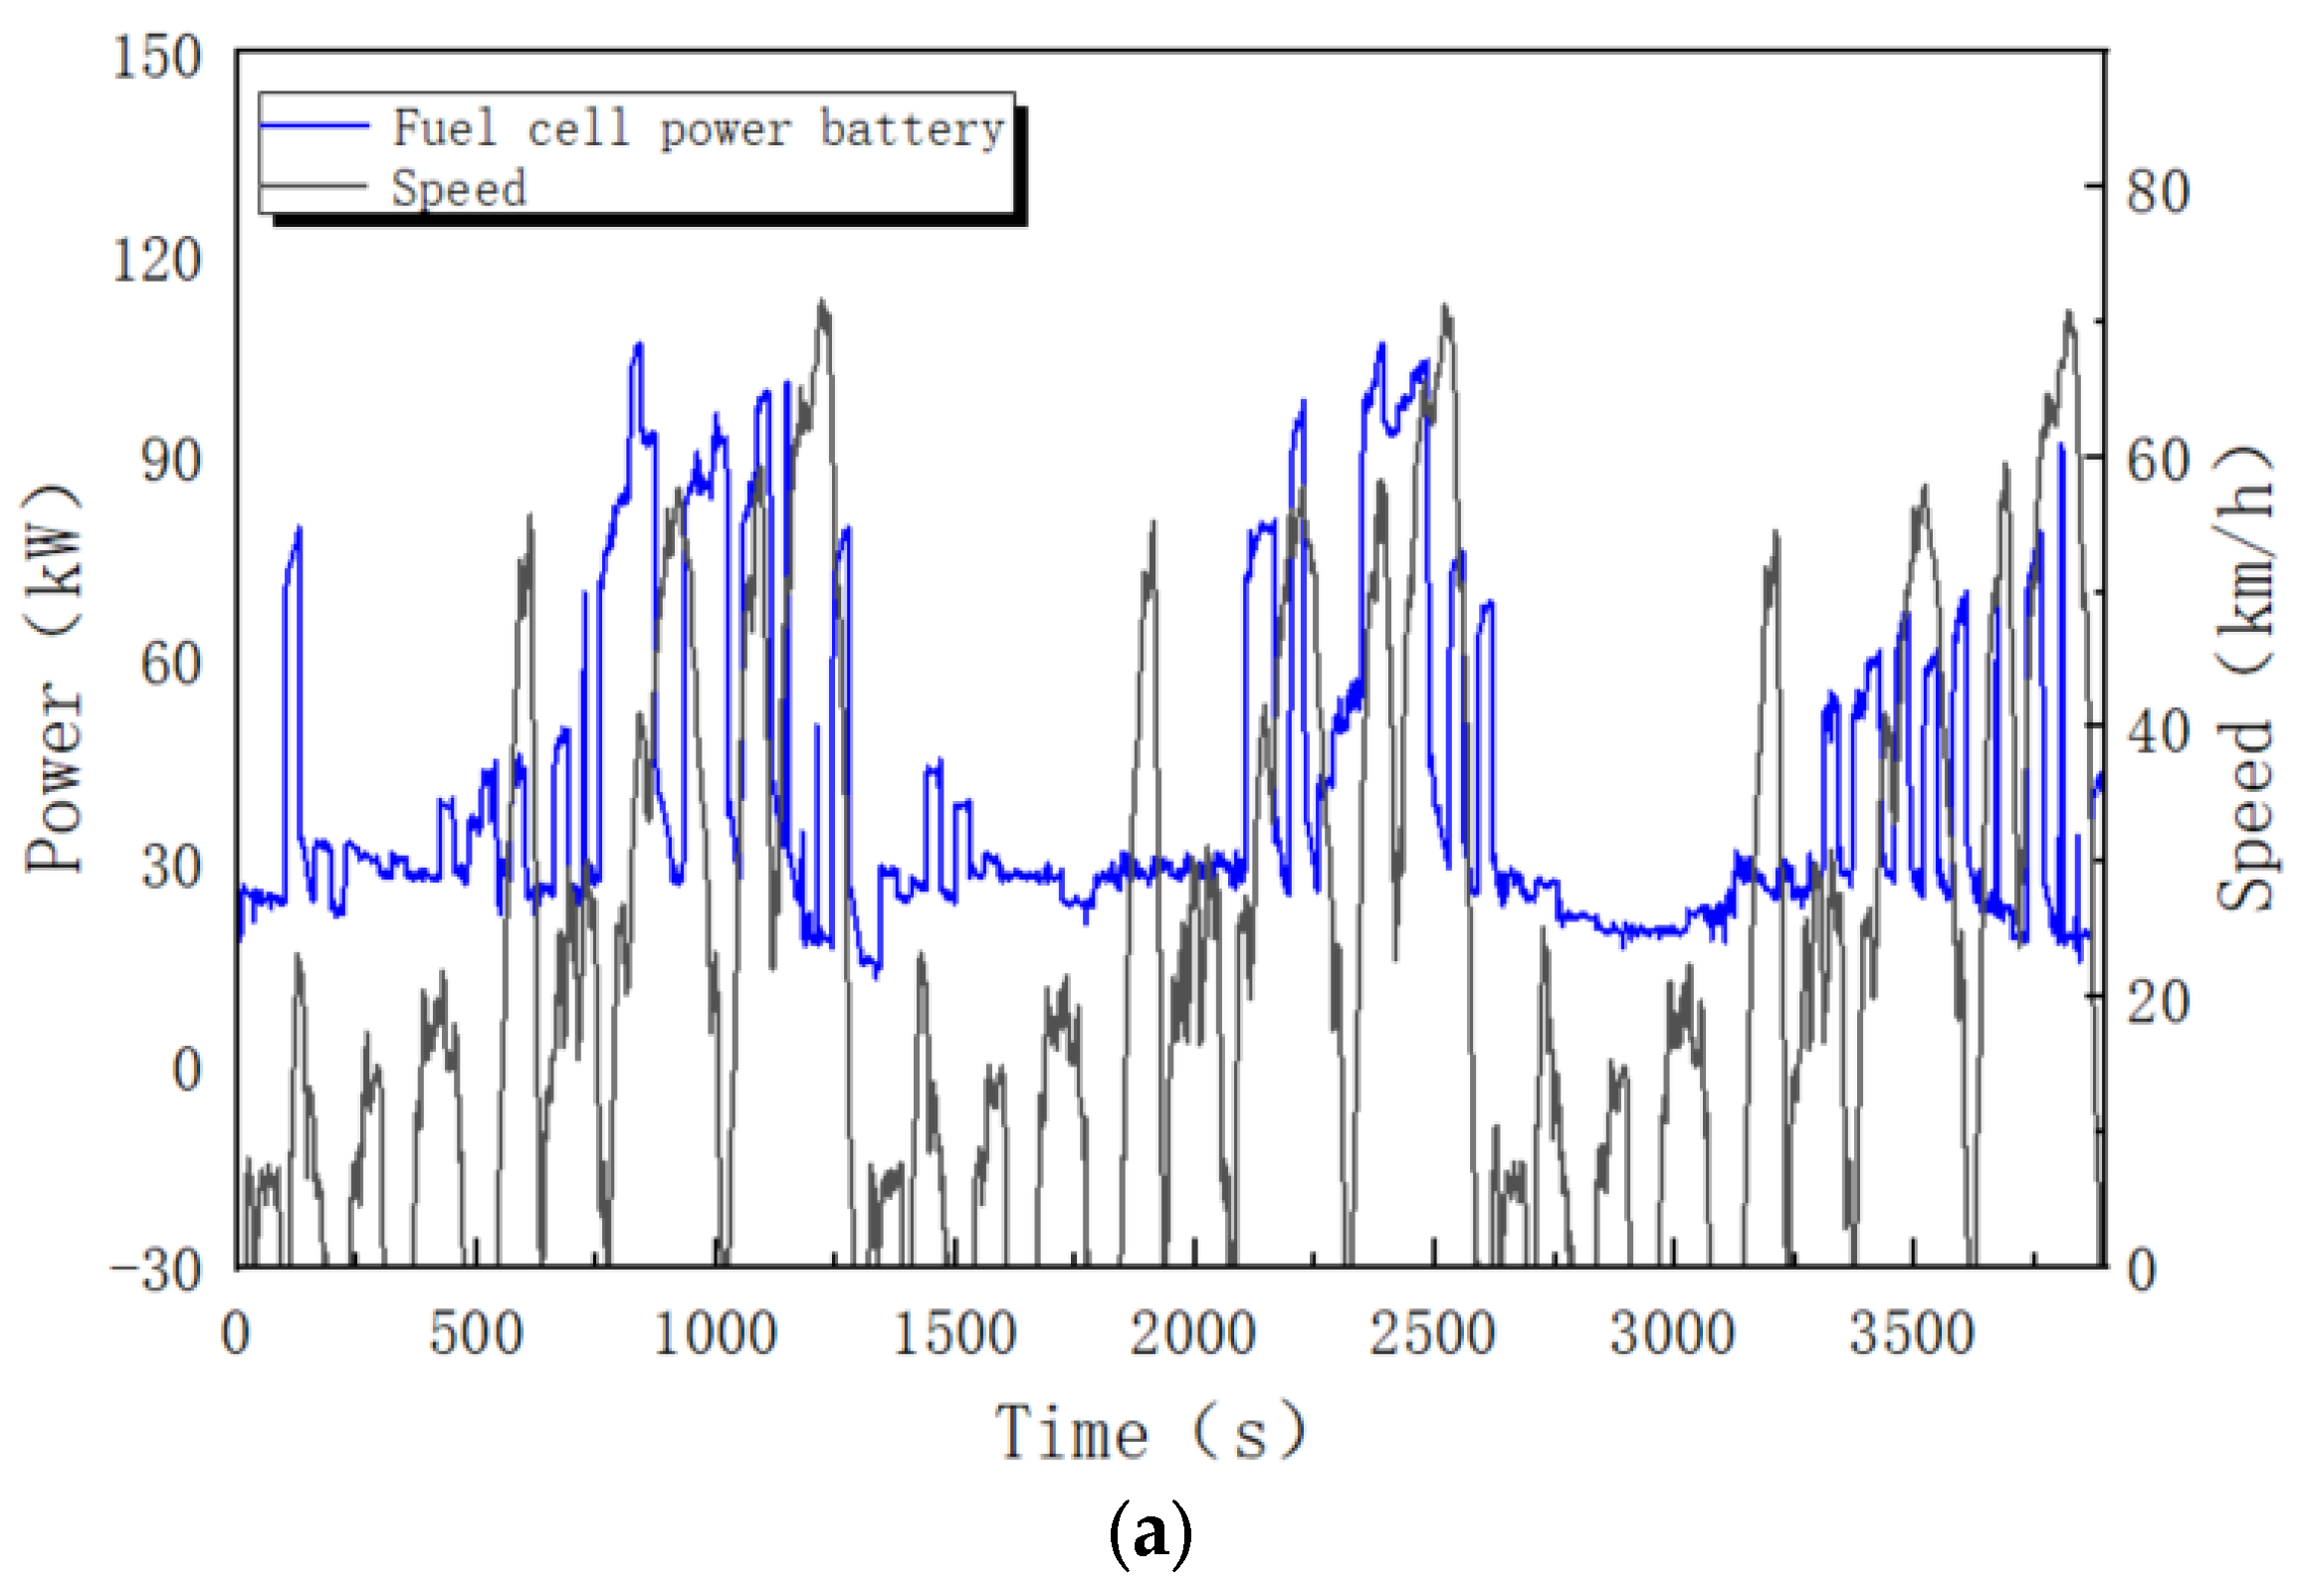
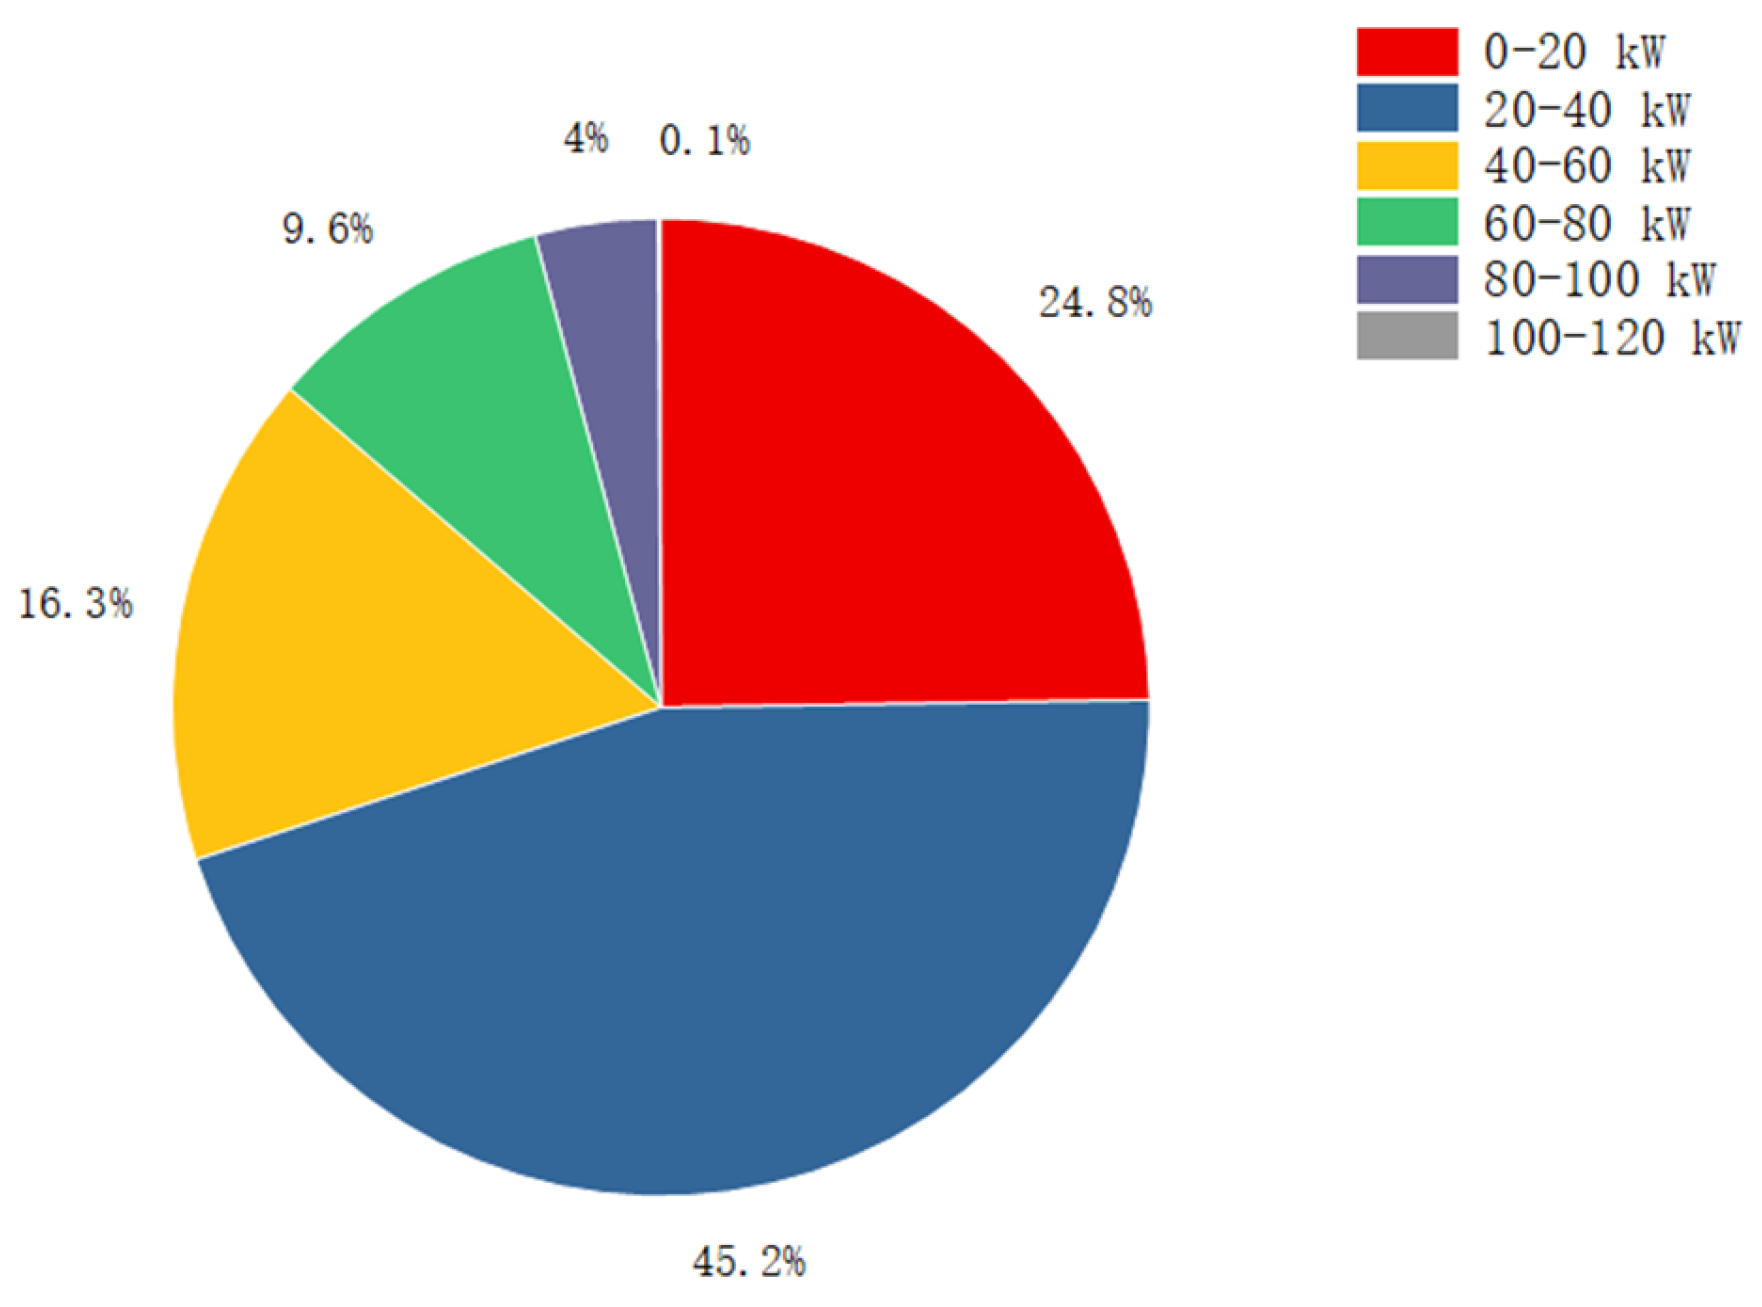
5. Data Processing and Analysis

A Class B fuel-cell dump truck (FCDT) was selected for the driving range test using the Complete Cycle Method under the CHTC-D driving cycle. The test vehicle is a fuel-cell hybrid electric vehicle, where power is provided jointly by a fuel cell and a battery. In the pure electric mode, the FCDT is solely driven by the battery. In the hybrid mode, the FCDT utilizes both the fuel cell and the battery to output power, depending on the actual power demand, vehicle speed, and the state of charge of the battery. The vehicle is equipped with four Type III hydrogen storage cylinders, each with a capacity of 320 L, and a nominal working pressure of 35 MPa. The rated capacity of the power battery is 105.284 kWh.
The fuel-cell dump truck (FCDT) completed 51.6 cycles under the CHTC-D condition. Figure 5 shows the variation of fuel cell and power battery output power over time during the first 51 cycles of the test process. From the perspective of the entire driving process, the 51 cycles of driving are divided into three stages: the early stage consists of cycles 1–17, the middle stage consists of cycles 18–34, and the late stage consists of cycles 35–51. Data analysis reveals that, after the vehicle starts, power is only provided by the power battery. When the power battery level falls below a predefined value, the fuel cell begins to operate and output power. Both the fuel cell and power battery output power vary periodically with driving conditions. Moreover, as the test progresses, the involvement of the fuel cell becomes increasingly frequent and intense. Finally, the fuel cell stops working first, and, when the power battery is depleted, the test ends. The energy variation curve in Figure 6 indicates that the fuel cell has been operating within the optimal efficiency range, serving as the total power source for the vehicle’s energy output. It charges the power battery while providing propulsion. The charging rate of the power battery is lower than the discharge rate, resulting in a regular decrease in energy output. The test data show that the maximum output power of the fuel cell is 116.7 kW, and that of the power battery is 294.9 kW. The detailed range testing data are shown in Table 3.
Figure 7 reveals that the output power of the fuel cell and the power battery exhibits systematic increases or decreases in response to changes in vehicle speed. The power variations in the power battery are more frequent compared to the fuel cell. However, when the vehicle speed is relatively high, the power output from the power battery may be insufficient. In such instances, the fuel cell increases its power output for energy supplementation. At this point, the power output from the fuel cell surpasses that of the power battery. Overall, the power regulation of the entire vehicle is primarily governed by the power battery, with the fuel cell providing additional energy when the power battery cannot meet the operational demands.
Figure 8 shows the distribution ratio of the fuel cell output power, indicating that the output power range of the fuel cell is evenly distributed, but its main operating range is concentrated in 20–40 kW, accounting for 45.2% of the total operating time, indicating that the fuel cell has a high operating efficiency and stability in this range. In the two higher output power ranges of 40–60 kW and 60–80 kW, the proportion of fuel cells is 16.3% and 9.6%, respectively, indicating that the fuel cell can, to some extent, meet the needs of medium and high loads.

6. Summary

This paper focuses on the analysis of the latest standards for fuel-cell electric vehicles. The new standards further improve the testing process for energy consumption and the driving range, establish evaluation systems for testing the driving range using the shortening method and the running-out method, and provide detailed descriptions of the measurement methods for refueling hydrogen for test vehicles. Additionally, it proposes assessing the vehicles under the “China conditions” as the testing conditions. Based on a B-class fuel-cell dump truck (FCDT), the paper analyzes the trend of power source output power with the variation of driving conditions from the perspective of the vehicle’s entire driving process, starting from full hydrogen and full battery charge to the point where the vehicle’s energy is depleted and stops. The main research content is as follows:
The effective hydrogen storage capacity of fuel-cell electric vehicles needs to consider three aspects of hydrogen quantity: insufficient hydrogen filling due to the temperature rise of the hydrogen cylinder during refueling, the quantity of hydrogen gas added during refueling, and the measurement of the remaining quantity inside the hydrogen cylinder using the pressure–temperature method after the test is completed. Therefore, considering these three aspects of hydrogen quantity is essential for the effective utilization of hydrogen.
In fuel-cell electric vehicles, the fuel cell serves as the primary power source for the energy output, with power regulation primarily controlled by the traction battery. By conducting the exhaustive test method under the CHTC-D condition, the maximum output power of the fuel cell in the Class B fuel-cell dump truck (FCDT) was calculated to be approximately 116.7 kW, with the optimal output power range of 20–40 kW accounting for 45.2% of the total operating time. The maximum output power of the traction battery is approximately 294.9 kW, with a pure hydrogen driving range of 122.15 km and a hydrogen consumption of 9.987 kg/100 km.

Author Contributions

Conceptualization, T.G., L.S. and G.W.; methodology, T.G.; software, T.G.; validation, T.G., L.S. and S.W.; formal analysis, T.G.; investigation, T.G.; resources, T.G.; data curation, G.W., writing—original draft preparation, G.W. and S.W.; writing—review and editing, L.S.; visualization, G.W. All authors have read and agreed to the published version of the manuscript.

Funding

This study is funded by the Key Technology Research of Low Temperature and Long Life Fuel Cells, with the number 20220301011GX.

Data Availability Statement

The data presented in this study are available on request from the corresponding author. The data are not publicly available due to corporate sensitivity.

Conflicts of Interest

Ting Guo, Guozhuo Wang, and Shiyu Wu are employees of CATARC Automotive Test Center (Tianjin) Co., Ltd. Letian Sun is an intern at CATARC Automotive Test Center (Tianjin) Co., Ltd. The paper reflects the views of the scientists and not the company.

References

  1. Aminudin, M.; Kamarudin, S.; Lim, B.; Majilan, E.; Masdar, M.; Shaari, N. An overview: Current progress on hydrogen fuel cell vehicles. Int. J. Hydrogen Energy 2023, 48, 4371–4388. [Google Scholar] [CrossRef]
  2. Wang, H.; Wang, R.; Sui, S.; Sun, T.; Yan, Y.; Du, S. Cathode design for proton exchange membrane fuel cells in automotive applications. Automot. Innov. 2021, 4, 144–164. [Google Scholar] [CrossRef]
  3. Zhang, B.; Hao, D.; Chen, J.; Zhang, C.; Chen, B.; Wei, Z.; Wang, Y. Modeling and decentralized predictive control of ejector circulation-based PEM fuel cell anode system for vehicular application. Automot. Innov. 2022, 5, 333–345. [Google Scholar] [CrossRef]
  4. Wu, X.; Wang, J.; Zhang, Y.; Du, J.; Liu, Z.; Chen, Y. Review of DC-DC converter topologies based on impedance network with wide input voltage range and high gain for fuel cell vehicles. Automot. Innov. 2021, 4, 351–372. [Google Scholar] [CrossRef]
  5. Albatayneh, A.; Juaidi, A.; Jaradat, M.; Manzano-Agugliaro, F. Future of electric and hydrogen cars and trucks: An overview. Energies 2023, 16, 3230. [Google Scholar] [CrossRef]
  6. Zhang, S.Z.; Dai, H.F.; Yuan, H.; Ming, W.P.; Wei, X.Z. Study on the Sensitivity of Electrochemical Impedance Spectroscopy of Proton Exchange Membrane Fuel Cells. J. Mech. Eng. 2021, 57, 40–51. [Google Scholar]
  7. Kong, W.F.; Fang, C.; Liu, J.H.; Li, J.Q.; Li, F.Q.; Huang, S.T.; Zhao, X.W.; Shi, Y.; Yuan, D.; Xu, L.F.; et al. Research on Low-temperature Cold Start Strategy of Fuel Cell Based on Single Chip Impedance Consistency Blowing. Automot. Eng. 2024, 46, 260–268+336. [Google Scholar] [CrossRef]
  8. Cullen, D.A.; Neyerlin, K.C.; Ahluwalia, R.K.; Mukundan, R.; More, K.L.; Borup, R.L.; Weber, A.Z.; Myers, D.J.; Kusoglu, A. New roads and challenges for fuel cells in heavy-duty transportation. Nat. Energy 2021, 6, 462–474. [Google Scholar] [CrossRef]
  9. Bubna, P.; Brunner, D.; Advani, S.G.; Prasad, A.K. Prediction-based optimal power management in a fuel cell/battery plug-in hybrid vehicle. J. Power Sources 2010, 195, 6699–6708. [Google Scholar] [CrossRef]
  10. Zhu, C.; Liu, D.; Teng, X.Y.; Zhang, G.H.; Yu, D.; Liu, S.; Hu, N.D. Comparative Analysis and Prediction Research on Comprehensive Economy of New Energy Vehicles. Automot. Eng. 2023, 45, 333–340. [Google Scholar] [CrossRef]
  11. Jiang, J.Z.; Yang, W.H.; Peng, B.; Guo, T.; Xu, Y.K.; Wang, G.Z. Prediction of Driving Range of Fuel Cell Vehicles Based on Energy Consumption Weighted Strategy. Automot. Eng. 2023, 45, 2357–2365+2329. [Google Scholar] [CrossRef]
  12. Zeng, T.; Zhang, C.; Hu, M.; Chen, Y.; Yuan, C.; Chen, J.; Zhou, A. Modelling and predicting energy consumption of a range extender fuel cell hybrid vehicle. Energy 2018, 165, 187–197. [Google Scholar] [CrossRef]
  13. Sellali, M.; Ravey, A.; Betka, A.; Kouzou, A.; Benbouzid, M.; Djerdir, A.; Kennel, R.; Abdelrahem, M. Multi-objective optimization-based health-conscious predictive energy management strategy for fuel cell hybrid electric vehicles. Energies 2022, 15, 1318. [Google Scholar] [CrossRef]
  14. Hao, D.; Zhang, Y.; Wang, R.; Wang, X.; Zhu, K.; Li, J.; Hou, Y. An improved test method for energy consumption and range of fuel cell vehicles. Int. J. Chem. Eng. 2020, 2020, 5704180. [Google Scholar] [CrossRef]
  15. Guo, T.; Wang, G.Z.; Liang, R.L.; Wu, S.Y.; Wu, Z.; Liang, R.; Nie, Z.; Wang, F. A Fast Way to Measure the Range of a Fuel Cell Vehicle. J. Phys. Conf. Ser. 2023, 2437, 012103. [Google Scholar]
  16. Lim, J.S.; Lee, H.W.; Hong, Y.S.; Lee, K.B.; Yong, G.J.; Kwon, H.B. Development on Fuel Economy Test Method for Hydrogen Fuel Cell Vehicles. Trans. Korean Hydrog. New Energy Soc. 2010, 21, 207–213. [Google Scholar]
  17. Guo, T. Research on the Measurement Method of Driving Range for Fuel Cell Vehicles. Power Technol. 2021, 45, 848–850+931. [Google Scholar]
  18. Duan, Z.; Mei, N.; Feng, L.; Yu, S.; Jiang, Z.; Chen, D.; Xu, X.; Hong, J. Research on hydrogen consumption and driving range of hydrogen fuel cell vehicle under the CLTC-P condition. World Electr. Veh. J. 2021, 13, 9. [Google Scholar] [CrossRef]
  19. Sun, T.; Chen, G.; Lan, H.; Guo, J.; Wang, X.; Hao, D. Experimental study on fuel economy of fuel cell truck under different driving cycle. In Proceedings of the 2021 4th Asia Conference on Energy and Electrical Engineering (ACEEE), IEEE, Virtual, 10–12 September 2021; pp. 38–43. [Google Scholar]
  20. GB/T 43252-2023; Test Methods for Energy Consumption and Driving Range of Fuel Cell Electric Vehicles. National Technical Committee for Standardization of Automobiles (SAC/TC 114): Beijing, China, 2023.
  21. Wu, D.; Guo, T. Comparative Analysis of Domestic and Foreign Evaluation Methods for Driving Range of Fuel Cell Vehicles. China Stand. 2023, 7, 165–168. [Google Scholar]
  22. GB/T 38146.1-2019; Part 1 of China Automotive Driving Cycle: Light-duty Vehicles. National Technical Committee for Standardization of Automobiles (SAC/TC 114): Beijing, China, 2019.
  23. GB/T 38146.2-2019; Part 2 of China Automotive Driving Cycle: Heavy-duty Commercial Vehicles. National Technical Committee for Standardization of Automobiles (SAC/TC 114): Beijing, China, 2019.
  24. Jokela, T.; Kim, B.; Gao, B.; Wellers, M.; Peng, Z. A review of fuel cell technology for commercial vehicle applications. Int. J. Heavy Veh. Syst. 2021, 28, 650–678. [Google Scholar] [CrossRef]
  25. Das, H.S.; Tan, C.W.; Yatim, A.H.M. Fuel cell hybrid electric vehicles: A review on power conditioning units and topologies. Renew. Sustain. Energy Rev. 2017, 76, 268–291. [Google Scholar] [CrossRef]
  26. Muthukumar, M.; Rengarajan, N.; Velliyangiri, B.; Omprakas, M.; Rohit, C.; Raja, U.K. The development of fuel cell electric vehicles—A review. Mater. Today Proc. 2021, 45, 1181–1187. [Google Scholar] [CrossRef]
  27. United States Department of Energy. Technology Assessment of a Fuel Cell Vehicle: 2017 Toyota Mirai Energy Systems Division; United States Department of Energy: Washington, DC, USA, 2017.
  28. Hong, B.K.; Kim, S.H. Recent advances in fuel cell electric vehicle technologies of Hyundai. ECS Trans. 2018, 86, 3. [Google Scholar] [CrossRef]
  29. GB/T 35178-2017; Measurement Method for Hydrogen Consumption of Fuel Cell Electric Vehicles. National Technical Committee for Standardization of Automobiles (SAC/TC 114): Beijing, China, 2017.
  30. Hu, D.; Xiang, C.; Lu, D.; Wang, J. Characterization of hydrogen refueling temperature rise of the on-board hydrogen system under different failure modes. Appl. Therm. Eng. 2024, 247, 123026. [Google Scholar] [CrossRef]
  31. De Miguel, N.; Acosta, B.; Moretto, P.; Cebolla, R.O. Influence of the gas injector configuration on the temperature evolution during refueling of on-board hydrogen tanks. Int. J. Hydrogen Energy 2016, 41, 19447–19454. [Google Scholar] [CrossRef]
Figure 1. The procedure for Shortened Method testing of driving range.
Wevj 15 00223 g001
Figure 2. The procedure for Complete Cycle Method testing of driving range.
Wevj 15 00223 g002
Figure 3. Procedure for hydrogen refueling before the test.
Wevj 15 00223 g003
Figure 4. Procedure for hydrogen refueling after the test.
Wevj 15 00223 g004
Figure 5. Power changes of fuel cells and power cells under CHTC-D operating conditions: (a) Cycle 1–17; (b) Cycle 18–34; and (c) Cycle 35–51.
Wevj 15 00223 g005
Figure 6. Energy changes of power cells and fuel cells.
Wevj 15 00223 g006
Figure 7. (a) Relationship between fuel cell power change and vehicle speed. (b) Relationship between power cell power change and vehicle speed.
Wevj 15 00223 g007aWevj 15 00223 g007b
Figure 8. Fuel cell output power distribution.
Wevj 15 00223 g008
Table 1. Comparison of main content between new and old standards.
StandardSection 4 of Zhongjihan (2017) No. 2 Document “Test Methods for Technical Indicators of Power Cells and Fuel Cells”Equipment Center (2021) No. 367 Document “Test Specification for Fuel Cell Vehicles” Section 6GB/T 43252-2023 “Test Methods for Energy Consumption and Range of Fuel-Cell Electric Vehicles”
Test conditionsOutdoor testing field: 5~23 °C, chassis dynamometer,
ambient temperature: 20~30 °C
Chassis dynamometer,
ambient temperature: 20~30 °C
Chassis dynamometer,
ambient temperature: 23 ± 5 °C,
immersion temperature: 23 ± 3 °C,
soak the car for no less than 2 h
Vehicle statusFull hydrogen, half electricFull hydrogen, battery capacity to be adjusted by the manufacturerClass A: predetermined battery state or adjusted by the manufacturer, Class B: fully filled with hydrogen, fully charged (externally chargeable)/predetermined battery state or adjusted by the manufacturer (non-externally chargeable)
Hydrogen supply methodVehicle-mounted hydrogen supplyVehicle-mounted hydrogen supplyClass A: hydrogen supply outside the vehicle,
Class B: onboard hydrogen supply
Vehicle classificationemptyemptyThe classification is based on the ratio of the net energy change of the power battery to the energy consumption of the fuel-cell hydrogen. If the ratio is less than 1.0%, it falls into Class A; otherwise, it is classified as Class B.
Test conditionsM1 and N1: NEDC,
other models: constant speed of 40 ± 2 km/h
GB/T 38146.1 [22] and GB/T 38146.2 [23] refer to specific Chinese standards.GB/T 38146.1 and GB/T 38146.2 refer to specific Chinese standards.
Decision processRun from the beginning to the endRun from the beginning to the endClass A: 6 cycles (Shortened Method),
Class B: from the beginning to the end (Complete Cycle Method)
Cut-off determinationNot meeting operational cycle conditions or hydrogen pressure alarmInstrument indication; failure to meet operational cycle requirementsInstrument indication; failure to meet operational cycle requirements
Measurement resultsTotal driving rangePure hydrogen driving rangePure hydrogen driving range
Table 2. Coefficient Vij [29].
Coefficient Vijj
1234
i11.00018−0.00225460.01053−0.013205
2−0.000672910.028051−0.024126−0.0058663
30.000010817−0.000126530.000197880.00085677
4−1.4368 × 10−71.2171 × 10−67.7563 × 10⁻⁷−1.7418 × 10⁻⁵
51.2441 × 10⁻⁹−8.965 × 10⁻⁹−1.6711 × 10−81.4697 × 10−7
6−4.4709 × 10−123.0271 × 10−116.3329 × 10⁻¹¹−4.6974 × 10⁻¹⁰
Table 3. Economic data related to fuel-cell dump truck.
Vehicle ModelParameterValue
Fuel-cell dump truckThe net energy change of power batteries (kWh)478.48
Power battery capacity (kWh)105.284
Power battery contribution mileage (km)315.27
The total output energy of fuel cells (kWh)647.36
Hydrogen consumption per 100 km CH2 (kg/100 km)9.987
Fuel-cell contribution to driving range (km)122.15
Total driving range (km)437.42
Disclaimer/Publisher’s Note: The statements, opinions and data contained in all publications are solely those of the individual author(s) and contributor(s) and not of MDPI and/or the editor(s). MDPI and/or the editor(s) disclaim responsibility for any injury to people or property resulting from any ideas, methods, instructions or products referred to in the content.

