1. Introduction
With climate change being a monumental challenge of the 21st century, the European Union (EU) has been implementing policies to reduce greenhouse gas (GHG) emissions. In the 2030 Climate Target plan, the European Commission proposed to cut GHG emissions by at least 55% until 2030—compared to 1990—and pursue climate neutrality by 2050 [
1]. The transport sector, responsible for about 25% of GHG emissions in Europe, is a primary contributor in reaching those climate goals.
In the 2022 “REPower EU” plan, the EU adopted a solar energy strategy that aims to accelerate the deployment of solar energy to reduce GHG emissions and the dependence on fossil fuels [
2]. Besides stationary applications of photovoltaics (PV), new approaches on utilizing PV in the transport sector can become beneficial in helping reduce carbon emissions.
The market share of Electric Vehicles (EV) has been on the rise over the last decade, and 17 countries have already set targets to phase out the internal combustion engine within the next few decades ([
3], p. 15f). For the city of Berlin, the electrification of all private cars would lead to an additional daily electricity demand of more than 6000 MWh [
4]. To reduce this demand, producing energy onboard with the use of solar panels has been suggested.
Recently, new developments of vehicle-integrated photovoltaics have appeared. A small number of Original Equipment Manufacturers (OEMs) already offer an optional solar roof with modest energy outputs, and there have been promising developments with fully solar-oriented concepts that are trying to enter the market.
This study will focus on the solar potential of vehicles with integrated photovoltaics in the urban environment of Berlin-Neukölln, Germany, which represents a densely populated urban center in Germany well and has a dataset of all parking spots available (
Section 3.1). A digital surface model-based solar simulation was conducted. The model factored in the effect of shading in urban surroundings throughout the day in a year. This model was then evaluated using a dataset of 48,827 parking sites to identify the suitability for the solar charging of parked photvoltaic-equipped EVs.
Additionally, this research will generate a methodological approach to assess solar irradiation at an urban street level, taking seasonal vegetation influence into account. A distinct feature of the method is the open data approach that enables reproducibility for any desired location, with freely available data and free, open-source software.
2. State of the Art
This section provides a literature review of research on vehicle-integrated photovoltaics (VIPV), with a focus on studies that assess vehicle PV potentials in urban environments. Further, the scope of this work is defined, and potential research gaps are identified. In the end of
Section 2.5, the research gap is identified and research questions are formulated.
2.1. Commercial Availability of the Technology
A review of current VIPV products, lightweight PV cells, and module technologies was conducted by Commault et al. [
5]. It was concluded that VIPV products and developments for various applications are on a steady rise, especially car-based vehicle integration.
Currently available car models with integrated solar roofs are the Toyota Prius PHV [
6], the Hyundai Sonata [
7], and the Hyundai Ioniq 5. Meanwhile, there are current developments to integrate PV into mass-produced private passenger cars: Sono Motors Sion [
8], Lightyear, Mercedes EQXX Concept, Fisker Ocean Fisker, Inc., Manhattan Beach, CA, USA [
9], Squad Solar City Squad Mobility BV, Breda, The Nederland [
10], and Aptera Sol Aptera Motors Corp., Carlsbad, CA, USA [
11].
2.2. Previous Studies on Achievable Energy
Earlier studies about VIPV have mainly focused on supplying additional power to auxiliary systems in applications such as refrigerating, heating, or air conditioning in commercial trucks [
12], buses [
13], or ambulances [
14]. These systems are heavily reliant on battery power when the internal combustion engine is not running. The extra energy supplied from solar panels can extend the capabilities of the onboard batteries and save fuel when the internal combustion engine is running. In the context of this study, PV systems on vehicles are exclusively used to charge the high-voltage (HV) battery of EVs and therefore contribute to the driving energy, which would typically be obtained by charging from the electricity grid.
Yamaguchi et al. [
15] assumed a relatively high solar module efficiency of 35%, which enables over 30 km/day of solar driving under an average irradiance of 4
. This study provides cost targets for different module efficiencies and highlights the importance of low costs for the solar panels.
Lee and Park [
16] analyzed electrical scooters in India and found that using a foldable 40 Wp solar panel, up to 45% of the energy demand could be satisfied using solar energy. They did not include building shading in their considerations.
Numerous studies that focus on PV potentials do not include shading characteristics of a real-world environment or set rather simple assumptions about the influence of shading. These studies focus primarily on vehicle parameters, including the PV systems, vehicle geometry, as well as battery and charging management systems. Heinrich et al. [
17] have shown that with PV on a typical sedan car roof (1.7–2 m
2; 20% panel efficiency), an additional annual driving distance of 1900–3400 km can be achieved in Freiburg, southern Germany. This amounts to 13–23% of the yearly mean driving distance of cars in Germany (15,000 km). This would also result in approximately one fewer charging stop per month in the summer and an increased range on sunny days. This scenario did not account for losses due to shading. In a second ‘at work charging’ scenario, a car parked in the sun from 9 a.m. to 5 p.m. from Monday to Friday (assuming no sun exposure the rest of the time) resulted in an annual solar range of 1100–2030 km, which is ~60% of the range from the first ‘always unshaded’ scenario. The main challenges stated are transformation losses from the panel to the HV battery, as well as possible battery self-consumption. Another issue addressed is the curvature of car roofs, which can lead to a significant irradiance mismatch, resulting in decreased panel efficiency. Open parking/driving during the day is crucial to generate substantial energy yields. Also, the panel technology must be durable and provide an aesthetic appearance for customers. For an improvement of energy yields, other surfaces, such as the hood and/or sides, could also be equipped with solar modules.
Kutter et al. [
18] have assessed the yield potential of VIPV on commercial trucks and vans. One of the five scenarios across Stockholm, Freiburg, and Seville was the use-case of a parcel delivery van, which can achieve an annual solar range of 6637 to 11,450 km, which covers 35% to 60% of the annual energy demand. The panel efficiency was assumed at 21%, and shading was not considered in this study. They also found that self-consumption can be a critical factor in the feasibility of VIPV and that it needs to be minimized. The study conducted a break-even analysis, mainly determined by irradiation, electricity prices, and vehicle charging efficiency.
2.3. Weather and Shading
To analyze the real-world potential of VIPV, it is essential to assess the influence of environmental shading. Shadowing is more prominent in urban areas where a high building and vegetation density reduce solar energy yields. There are several studies that used test vehicles to measure shadow cast in real street environments.
Carr et al. [
19] measured the solar irradiance on a test vehicle in the Netherlands over a time span of 20 weeks. With extrapolated driving patterns and shadowing events, the authors showed that in good conditions, VIPV could provide up to 41% of the required driving energy and up to 5617 km/year for the reference vehicle. Another study that measured irradiance in a real-world scenario with a test vehicle is the work of Araki et al. [
20]. Onboard pyranometer data measurements in Japan showed that shading impacts and a curved car roof decreased the practical solar resources by 25%. It is of note that the vehicle measurements in the Netherlands and Japan were acquired in a mainly non-urban environment. An overview of various case studies and solar irradiance measurements was composed by Araki et al. [
21] that showed how different research vehicles perform in different regions. For PHEVs (Plug-in Hybrid Electric Vehicle) an average power generation of 2.1 kWh/day over 100 days was achieved on a Toyota Prius equipped with 800 Wp solar panels [
22]. Under the real environment conditions in Japan, they achieved a GHG reduction of 63%. Further measurements under real driving conditions were conducted by Oh et al. [
23], Ota et al. [
24] in South Korea and Japan. Ota et al. [
24] concluded that the PV performance under intermittent shading conditions in an urban setting still achieves a relatively high performance ratio of 0.87. Oh et al. [
23] combined irradiance measurements on a solar bus route with irradiance modeling and concluded that there is little economic feasibility with the current technology used in the study. But with better utilization of roof space, it has high potential in the future. Another study of a bus route in New Zealand found that installed solar panels can offset ~8.5% of the electricity demand [
25].
Many studies have assessed the solar potential of VIPV with solar irradiance datasets that provide an accurate estimation, considering weather conditions. Most solar simulations in an urban environment assess the solar potentials of rooftops. However, real-world street-level urban shading influences based on digital surface model (DSM) data have been sparsely investigated. DSM-based solar simulations are an attractive tool to assess solar yields with complex shading characteristics over a larger urban area.
The study most closely related to the approach and methodology of this article is the work of Brito et al. [
26], who have assessed solar potential in the urban area of Lisbon, Portugal. It is based on the irradiance modeling methodology by Santos et al. [
27]. The authors used a Digital Surface Model on which a solar simulation was conducted to include the effect of shadowing in the urban environment. They measured the solar irradiation on parking sites and roads to estimate the solar yield for VIPV. The results showed that the annual loss due to shadowing can reach 25% for roads and over 50% for urban parking spaces. Despite the shading losses, the average solar range extension was between 10 and 18
, assuming that there is the installation of a photovoltaics system of 1 kW peak power (kWp), which can significantly reduce charging needs in the summer, especially. Since the study performed by Brito et al. [
26] was found to have a very similar approach to this study, it is further discussed in the methodology,
Section 3. A further study by Said-Romdhane et al. [
28] investigated shading losses by city obstacles and concluded that urban shading is a serious problem for maximizing the photovoltaic potential.
2.4. Life Cycle Assessment
Kanz et al. [
29] presented a life cycle assessment (LCA) of a VIPV system on a light utility electric vehicle, the StreetScooter Work L. The study compared the on-board PV electricity generation with grid charging by calculating the CO
2 equivalents per kWh for the location of Cologne, Germany. With a PV array of 930 Wp, an operation time of 8 years, and an average shadowing factor of 30%, an emission factor of 0.357 kg CO
2-eq/kWh could be achieved. The average grid charging emissions amount to 0.435 kg CO
2-eq/kWh. However, if the shadowing factor exceeds 40%, the VIPV emissions would surpass the grid charging emissions. Kanz et al. further consider scenarios of a longer vehicle lifetime of 12 years and a “green” electricity manufacturing process, both of which decrease the emissions of the VIPV solution. On the other hand, the grid charging emissions are also expected to decrease in the future with the further deployment of renewable energies in Germany.
2.5. Research Gap and Research Questions
The current literature review on the potential of VIPV has shown that there are opportunities for further research on spatial solar simulations that take shadowing into account. Specifically, a gap was identified in the research of irradiance modeling for VIPV potentials that accounts for the influence of vegetation. In previous studies, tree shading was assumed to be constant throughout the year, affecting results by up to 50% (see
Section 3.4). Furthermore, there are no published studies that have assessed the street-level solar potential in Central Europe and no approaches utilizing only open data and free software.
The scope of this work includes a solar assessment for VIPV at the street level, while considering the influences of building and vegetation shading. The focus lies on the characteristics of urban solar irradiation and the resulting potentials of parked SEVs, assuming a flat horizontal solar panel on the car roof. It is summarized in the following three research questions:
What solar yield can be achieved by using VIPV on parked vehicles in urban areas, taking into account shading and partial shading of vegetation and buildings?
What are the potential solar range benefits and charging cost savings for private parked cars with the use of VIPV?
From an environmental perspective, how does the implementation of VIPV on parked vehicles compare to traditional grid-connected PV systems?
The result quantifies the desired irradiance, solar yield, and range values, while identifying parking site locations that can maximize the solar potential of VIPV. This includes a novel consideration of the impact of seasonally varying vegetation.
3. Methodology
The approach to calculate the solar yield potential of Solar Electric Vehicles (SEVs) is based on a Digital Surface Model (DSM), to which a monthly solar radiation simulation is applied. The solar simulation is enriched by long-term weather data as well as vegetation influence. A detailed database of the parking points enables the assessment of received solar energy on vehicles parked in the study area of Berlin-Neukölln.
All datasets used in this study are publicly available as open data to enable reproducibility. The free geographic information systems QGIS 3.22.1 [
30] and GRASS (Geographic Resources Analysis Support System) 7.8 [
31] were used to develop the solar yield model and visualizations. OpenStreetMap (OSM) [
32] was used as the geographic database.
DSMs are elevation raster maps generated by aerial LiDAR (Light Detection And Ranging) measurements or image-based digital surface models. They provide highly detailed altimetry datasets of cities or other desired regions. DSMs are the foundation for conducting solar simulations to generate solar irradiation maps that provide spatial information about solar energy potential, as well as shading influence by buildings, terrain, and vegetation throughout the day and year [
33].
The methodology chosen in this study was found to closely resemble the works of Brito et al. [
26], who assessed the “Urban solar potential for vehicle integrated photovoltaics” for the city of Lisbon. Their main concept also consisted of conducting solar simulation models based on DSMs to analyze the solar potential of vehicles in an urban area. Aside from the main idea of the solar assessment, there are also differences in the approaches, as seen in
Table 1. A comparison of the study results follows in
Section 5.
One of the major differences of this study compared to Brito et al. [
26] is that the Lisbon study assumed that parking spots under trees were being shaded at all times. In this study, parking points under trees are also treated differently. However, the seasonal vegetation transmittance is being taken into account to be able to make accurate solar yield predications about all of the available public parking sites of the study area.
The methodology of this study is presented in the following subchapters, starting from the input parking point data (
Section 3.1), the development of the custom Digital Surface Model (
Section 3.2), the solar simulation and solar maps (
Section 3.3), integration of vegetation (
Section 3.4), and the assumptions about the solar yield model and vehicle solar system (
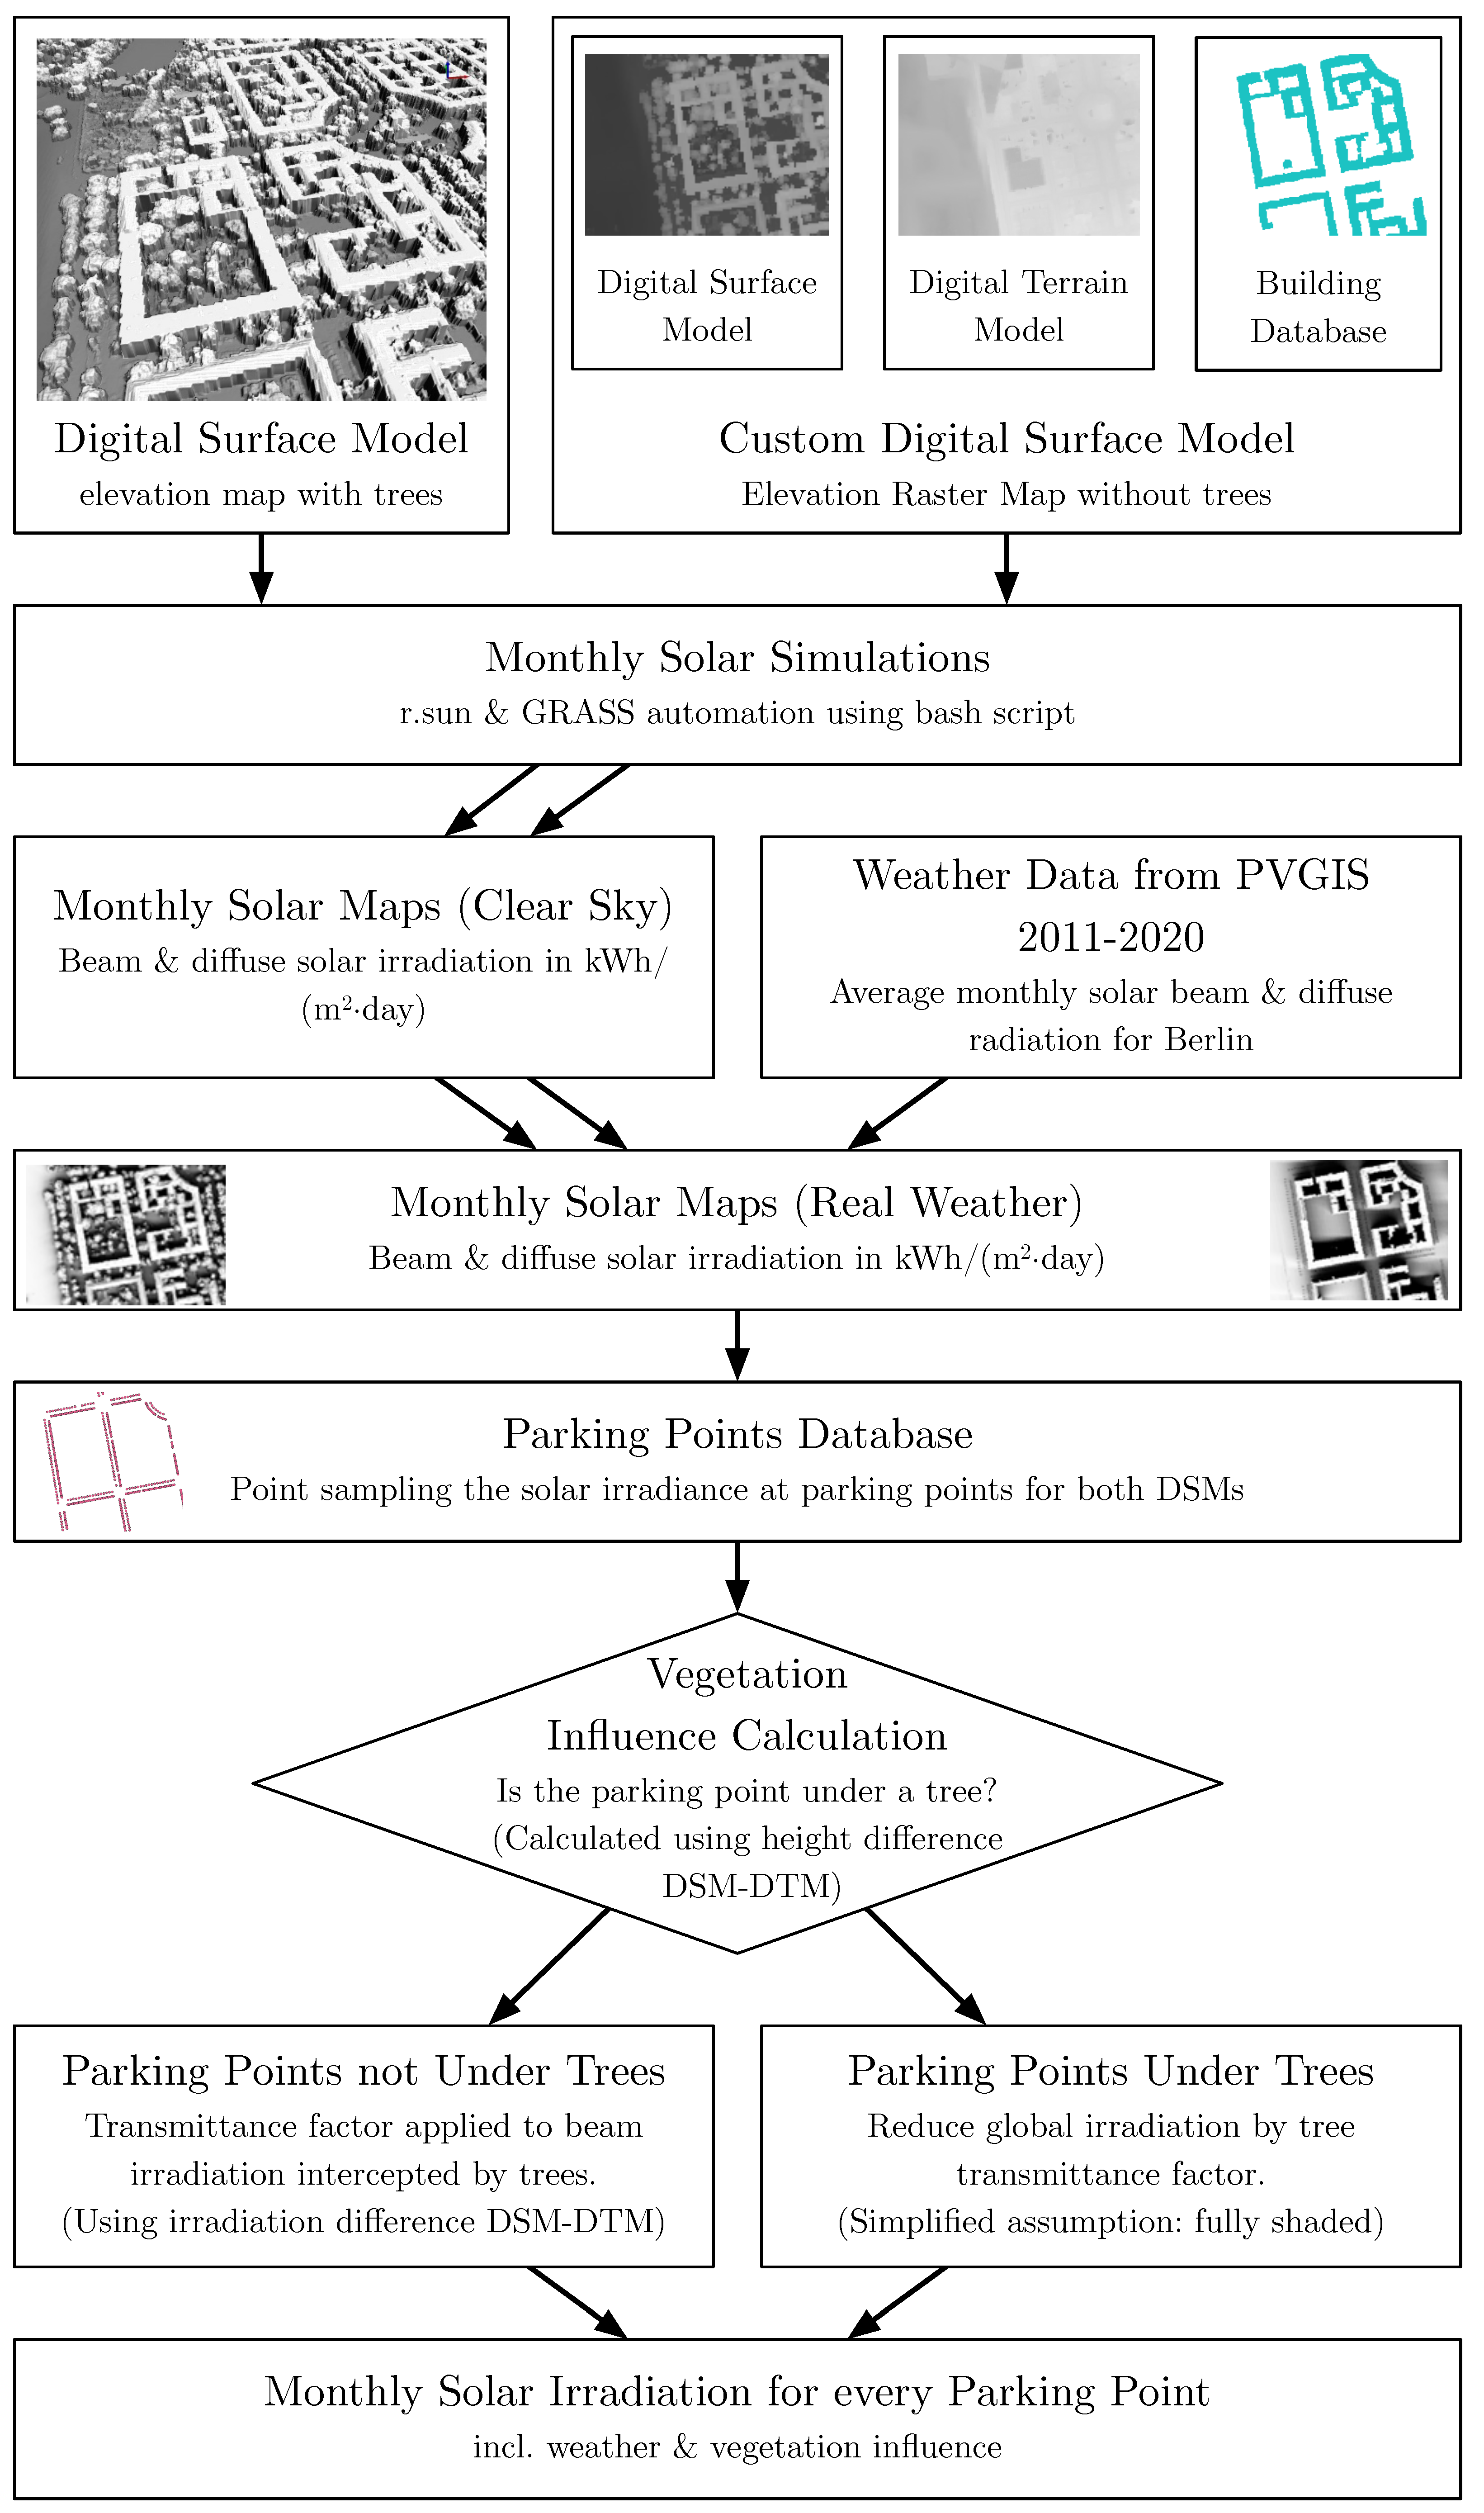
Section 3.5). A condensed overview of the methodology is shown in
Figure 1.
3.1. Parking Sites in Berlin-Neukölln
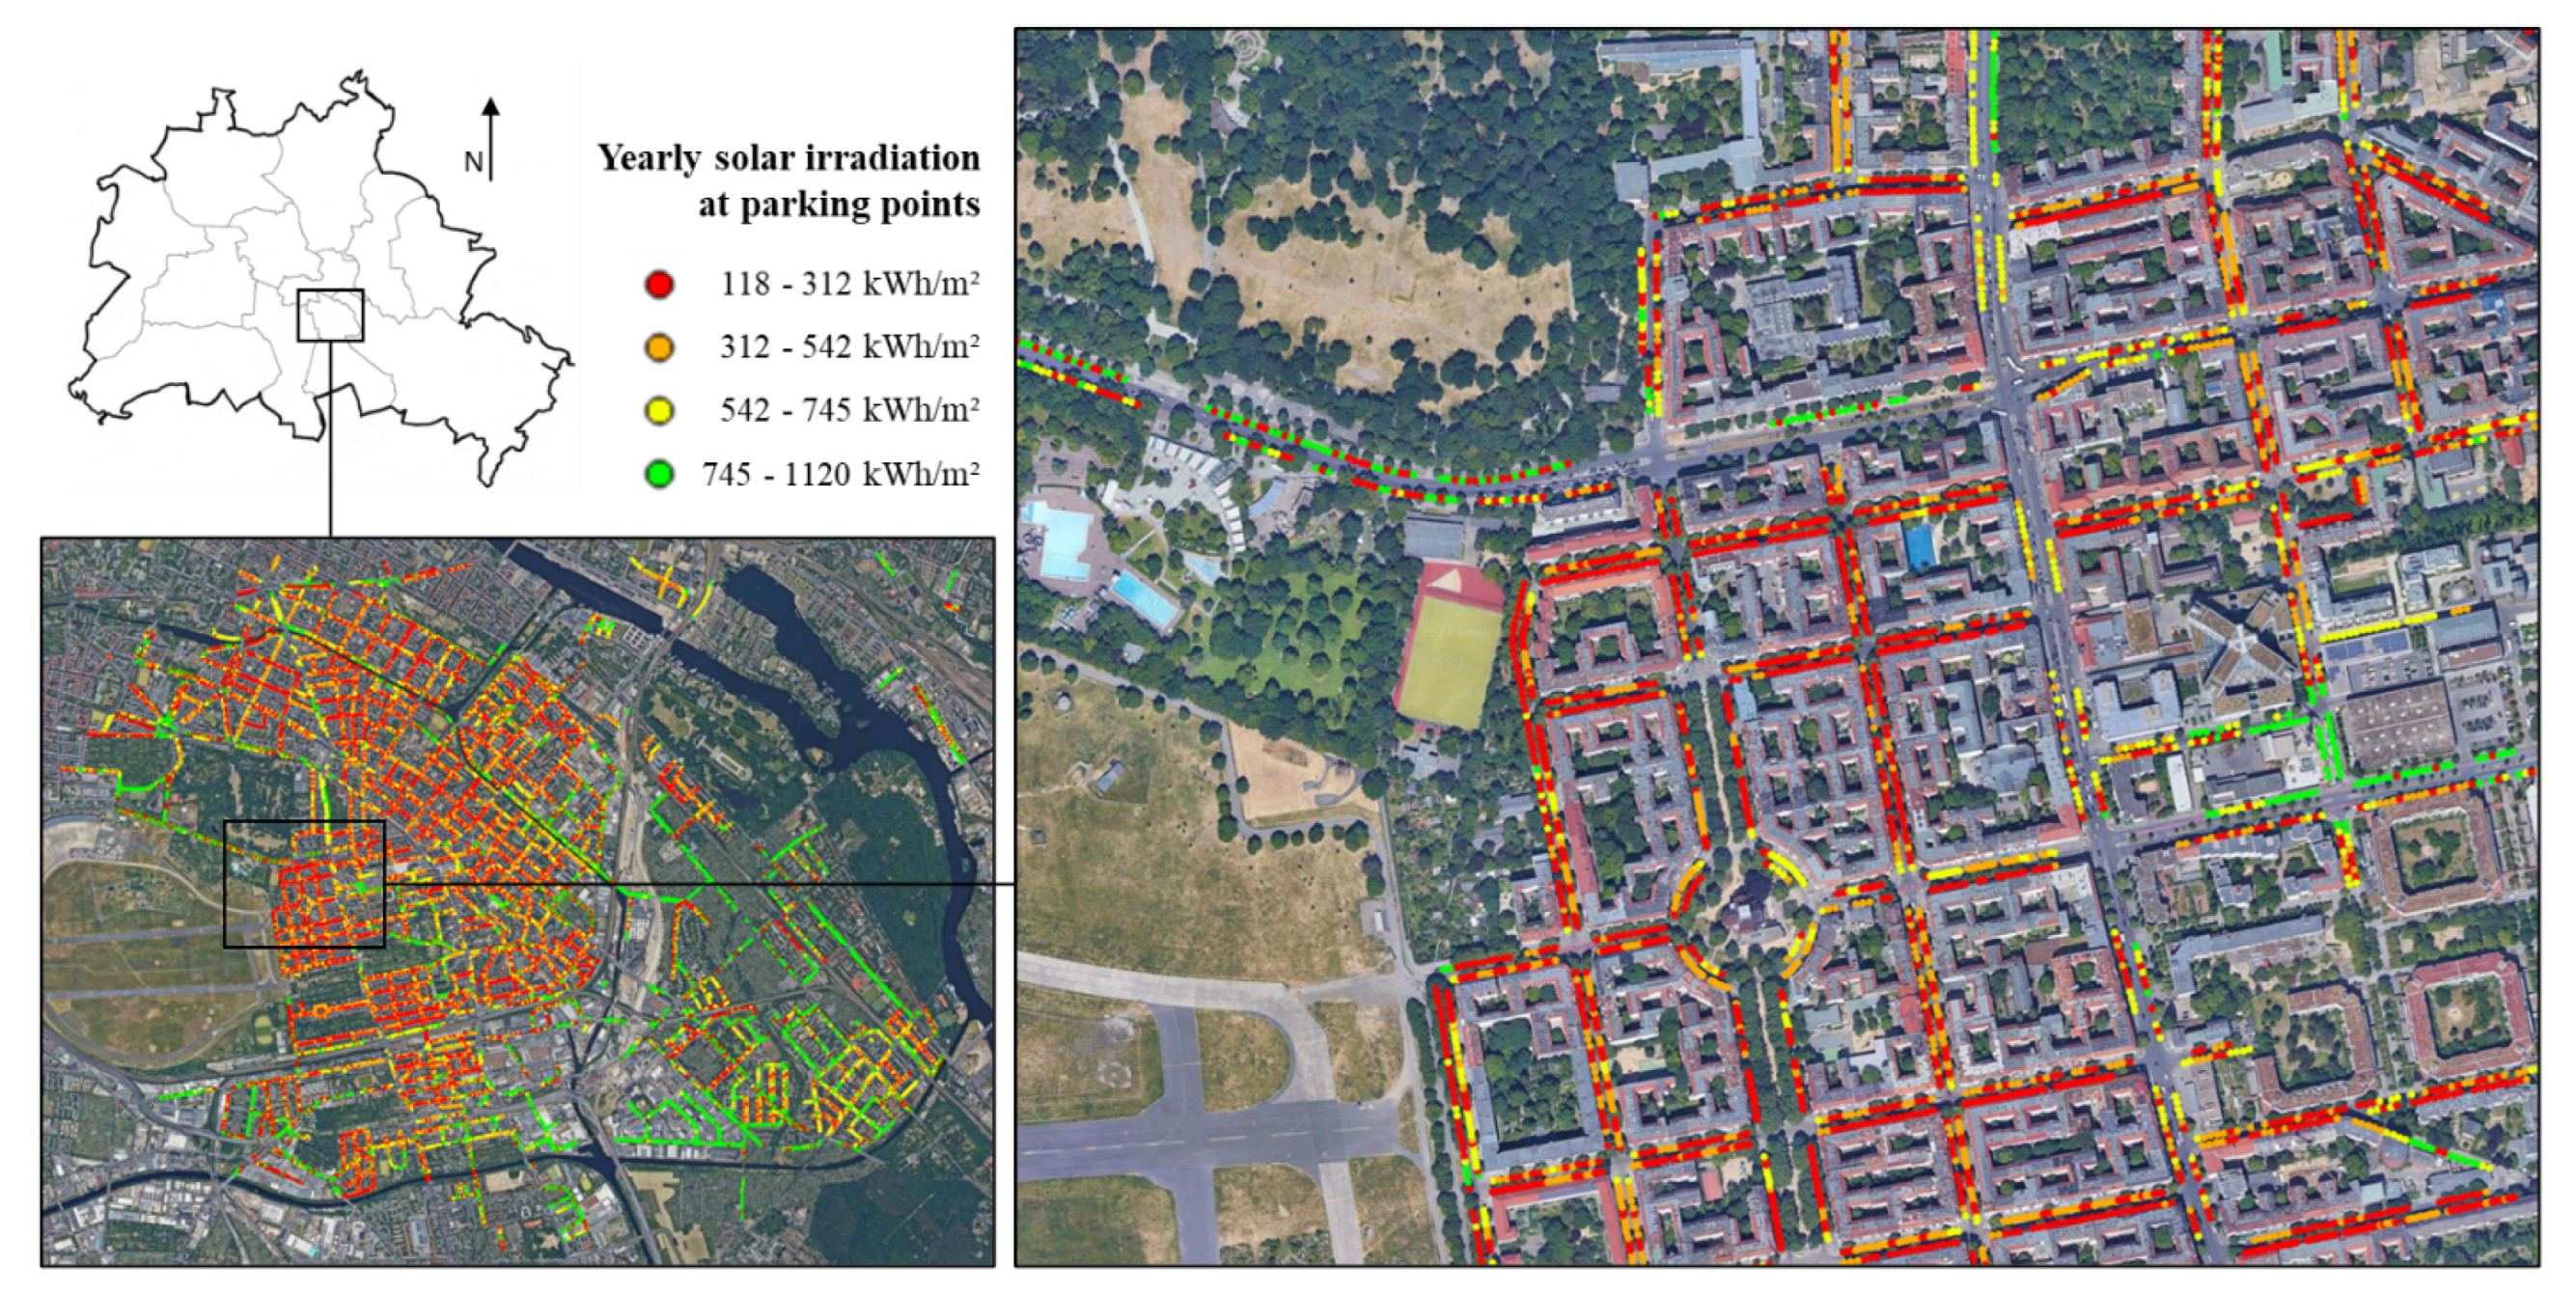
In the district (in this case, ‘district’ refers to the German definition of ‘Ortsteil’ instead of the ‘Bezirk’ Neukölln) of Berlin-Neukölln, the location of 48,827 individual public parking sites have been catalogued by the “OpenStreetMap Parking Space Project” by Seidel [
34]. Currently, this dataset is the only publicly available high-detail dataset of parking sites in Berlin. The parking sites are represented by a point, their respective map coordinates, and other useful information, such as street name. The dataset extends over the district limits of Neukölln.
On average, private vehicles in Germany are parked 23 h of the day [
35]; hence, the solar energy received while driving is not taken into account in this study. Therefore, the resulting data are representative of vehicles being parked outside the whole day. While driving, the solar energy yield can vary greatly, depending on the amount of direct solar exposure, time of day, cloudiness, etc.
This study assesses outdoor public parking areas only. According to Seidel et al. in the study area, about 19% of parking spaces are in enclosed or underground parking garages, which will not be considered in this study [
34]. Also, the original parking point dataset was purged of 37 unsuitable points (19 of which had no coordinates, and 18 points were located under over-street buildings).
3.2. Development of the Custom Digital Surface
Model
In order to calculate the solar potential of vehicles in a dense urban environment, a high-resolution DSM (Digital Surface Model) is needed to simulate sun shading caused by buildings, terrain, and vegetation throughout the day. In 2020, new image-based DSMs of Berlin were published by the Berlin Senate Administration of Urban Development, Construction and Living [
36]. In this study, three datasets were used to develop a Custom DSM (from now on called DSM-nt, with nt meaning ‘no trees’) that enabled the integration of vegetation influence in the solar yield model.
The first dataset is an image-based DSM (bDOM—“Digitales bildbasiertes Oberflächenmodell”) that contains the surface elevation of the entire city, including buildings and vegetation. The measurements were taken in the summer, when tree crowns are fully developed. This DSM will be used for the solar simulation, while it also provides the building elevation footprints for the custom DSM-nt, which is purged of trees.
To generate the custom DSM-nt, a second dataset in the form of a DTM (Digital Terrain Model; (DGM—“Digitales Geländemodell”)) was used. This DTM contains information about the ground elevation. Buildings, vegetation, and other objects are not displayed. Both raster map datasets have a resolution of 1 m.
The third dataset, the WFS ALKIS Berlin building database supplied in QGIS, was used to crop the building footprints from the DSM to place them on top of the DTM ground. This ‘building footprint’ approach has been explained and used by Santos et al. [
27] to analyze the potential of roof photovoltaics.
The DSM-nt along with the original DSM was then used to conduct the solar simulations discussed in
Section 3.3. By simulating both DSMs, the shading influence of trees can be analyzed, as described in
Section 3.4.
The DSM elevation models of the study area measure 8 × 6 km and therefore cover 48 km2 of Berlin’s urban area. The final step prior to the solar simulation was the integration of vehicle heights. To properly reflect the car roof’s elevation, a vehicle height of 2 m was implemented into the DSM-nt raster map for each parking point.
3.3. Solar Simulation to Generate Monthly Solar
Maps
For this study the
r.sun GIS-based solar radiation model of Hofierka and Šúri [
37] was chosen. It calculates the solar irradiance
of elevation raster maps, in this case the DSM with trees and the custom DSM-nt of the study area Berlin-Neukölln. The proposed model simulates the sun position and radiation values for any given location, time, and date of the year. It casts shadows caused by elevation, such as terrain, buildings, and vegetation. The solar radiation is being split up into the beam component (direct sunlight) and the diffuse component (scattered light by the atmosphere). The
r.sun solar radiation model is embedded in the open-source environment GRASS.
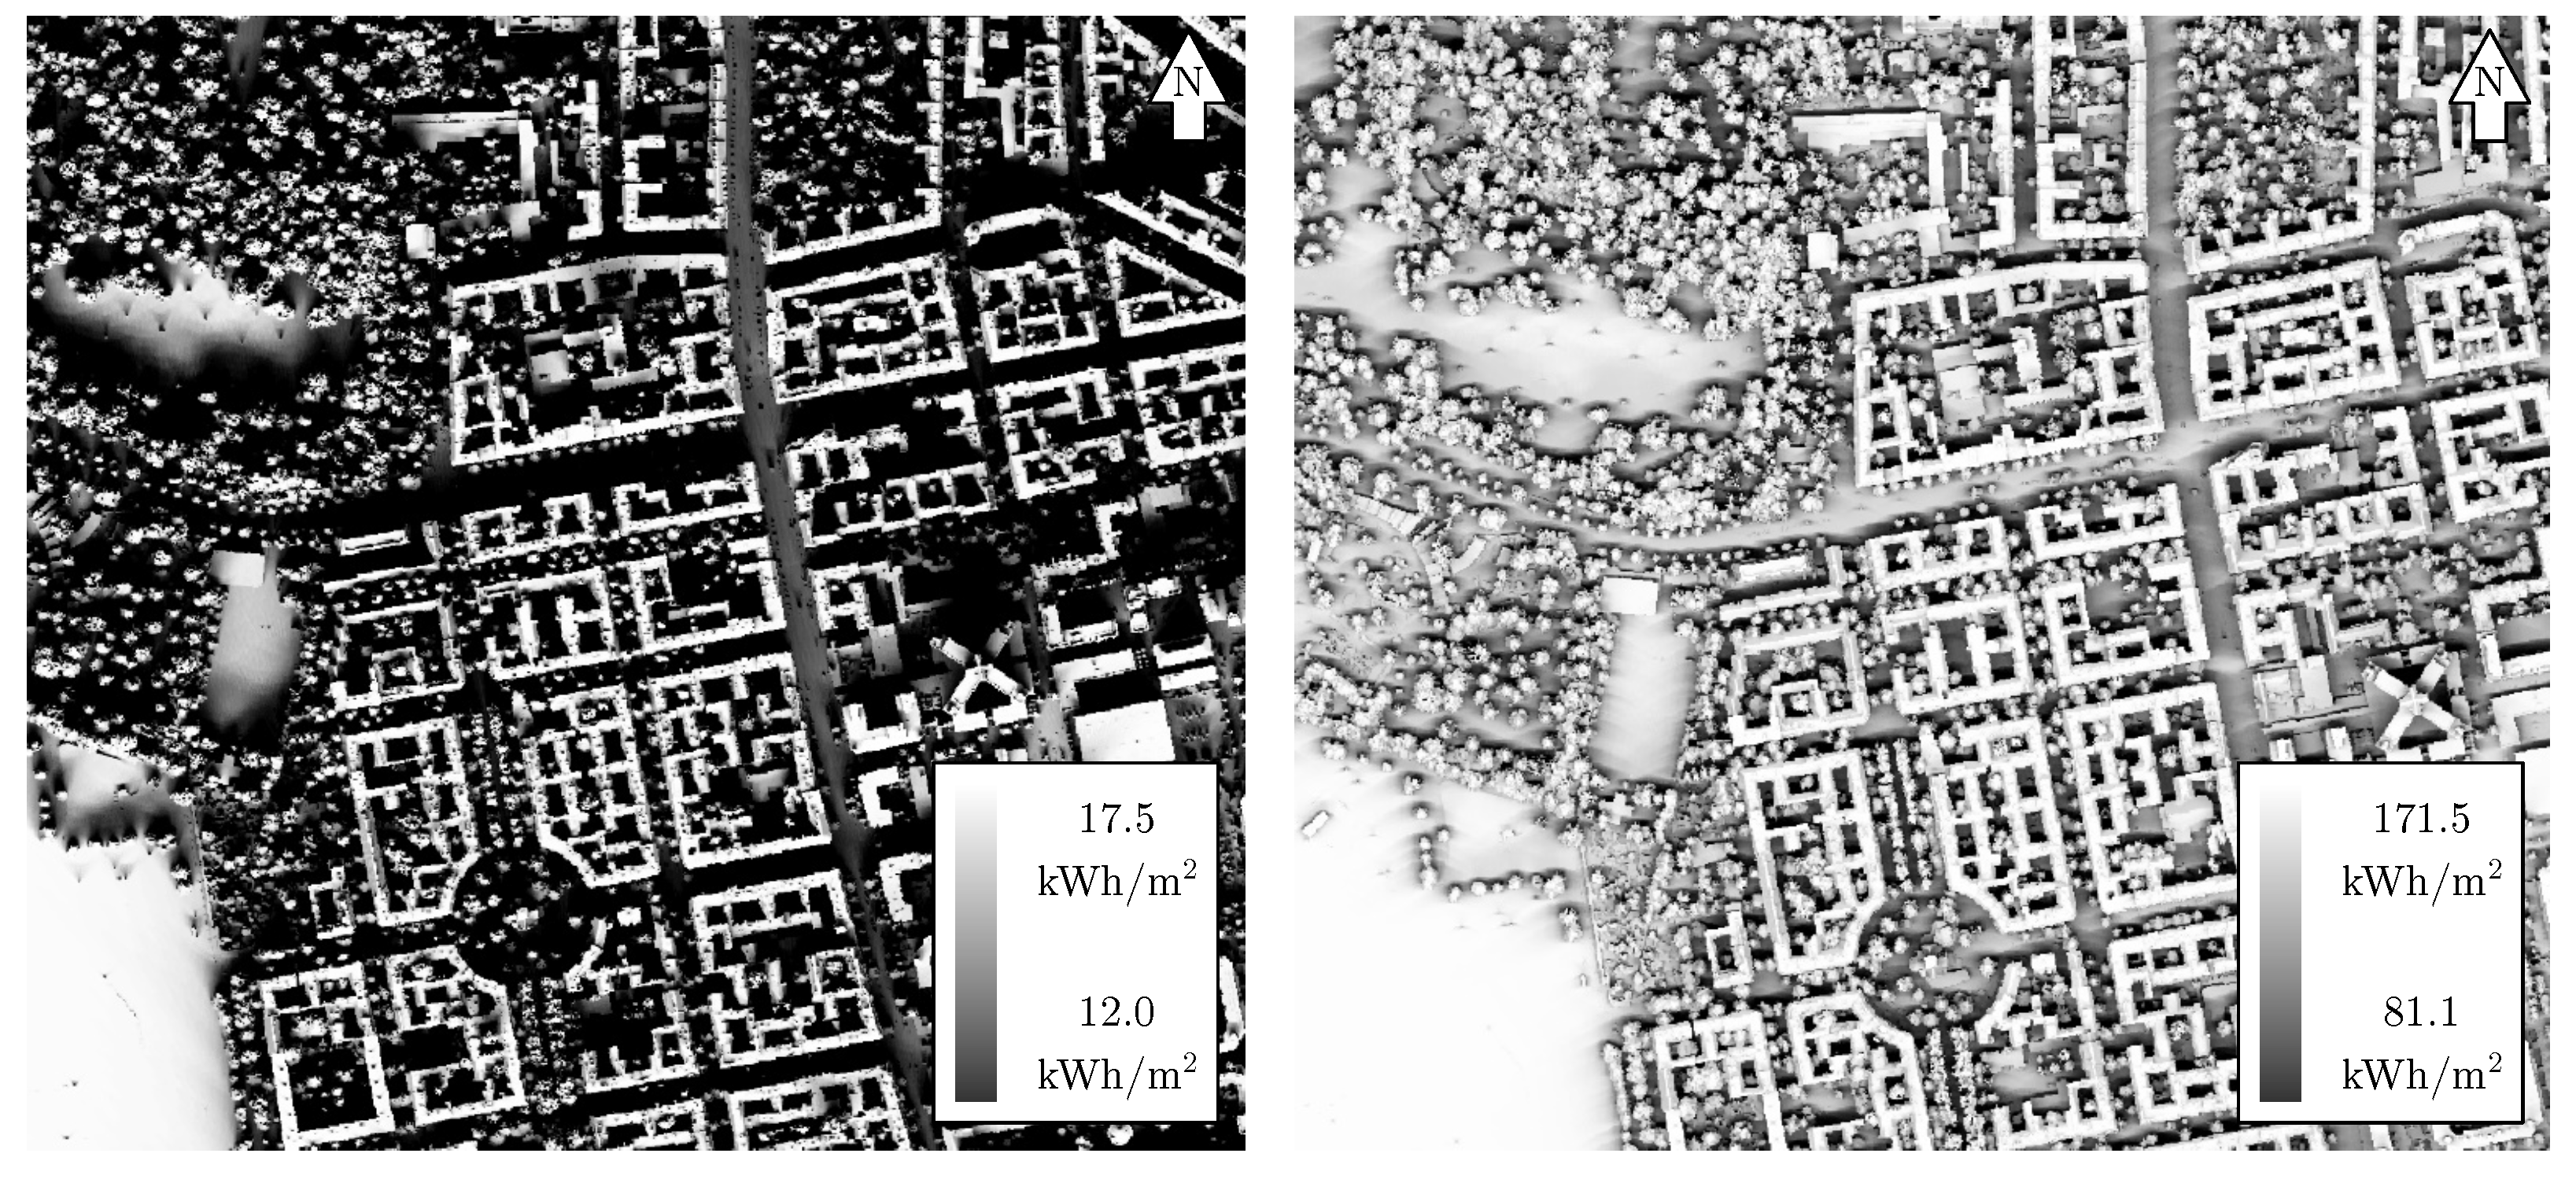
The r.sun model computes the solar irradiance over a given raster height map for a certain point in time. To simulate an entire day the r.sun simulation was done in 15-min steps. These solar irradiance snapshots were then summed up to calculate the solar irradiation values for the day . The resulting daily solar irradiation maps are called solar maps which contain the irradiation values for every 1 × 1 m pixel of the raster map.
The automation was accomplished by programming a bash script that automatically simulates each timestep and sums up the values for an entire day. To overcome computing time limitations only the representative day for each month was simulated. The representative day of a month in this context is the day with the mean daylength of the respective month. The solar irradiation values of the representative day were then assumed be present for the whole month.
The r.sun radiation model in its basic configuration calculates the solar irradiance under clear-sky conditions. To account for weather influences, in this case cloud coverage, the historical meteorological data from 2011 to 2020 of the European Photovoltaic Geographical Information System (PVGIS) was used to calculate the mean direct and diffuse solar irradiation for each month [
38]. The data provided originate from the SARAH2 database, which is derived from satellite images and is validated from measurements of commercial PV modules at the European Joint Research Center.
The clear-sky solar maps were then scaled with the real solar radiation data from the weather database to create solar maps that include real-world weather influences. In this process, the weather station elevation of 39 m was also accounted for since higher elevations result in higher solar irradiation values. Ground albedo as well as diffuse reflections from buildings were not taken into account. Ground albedo can be neglected since it is mainly notable in snow-covered regions. Diffuse or direct reflections from buildings are not within the capabilities of the r.sun solar radiation model.
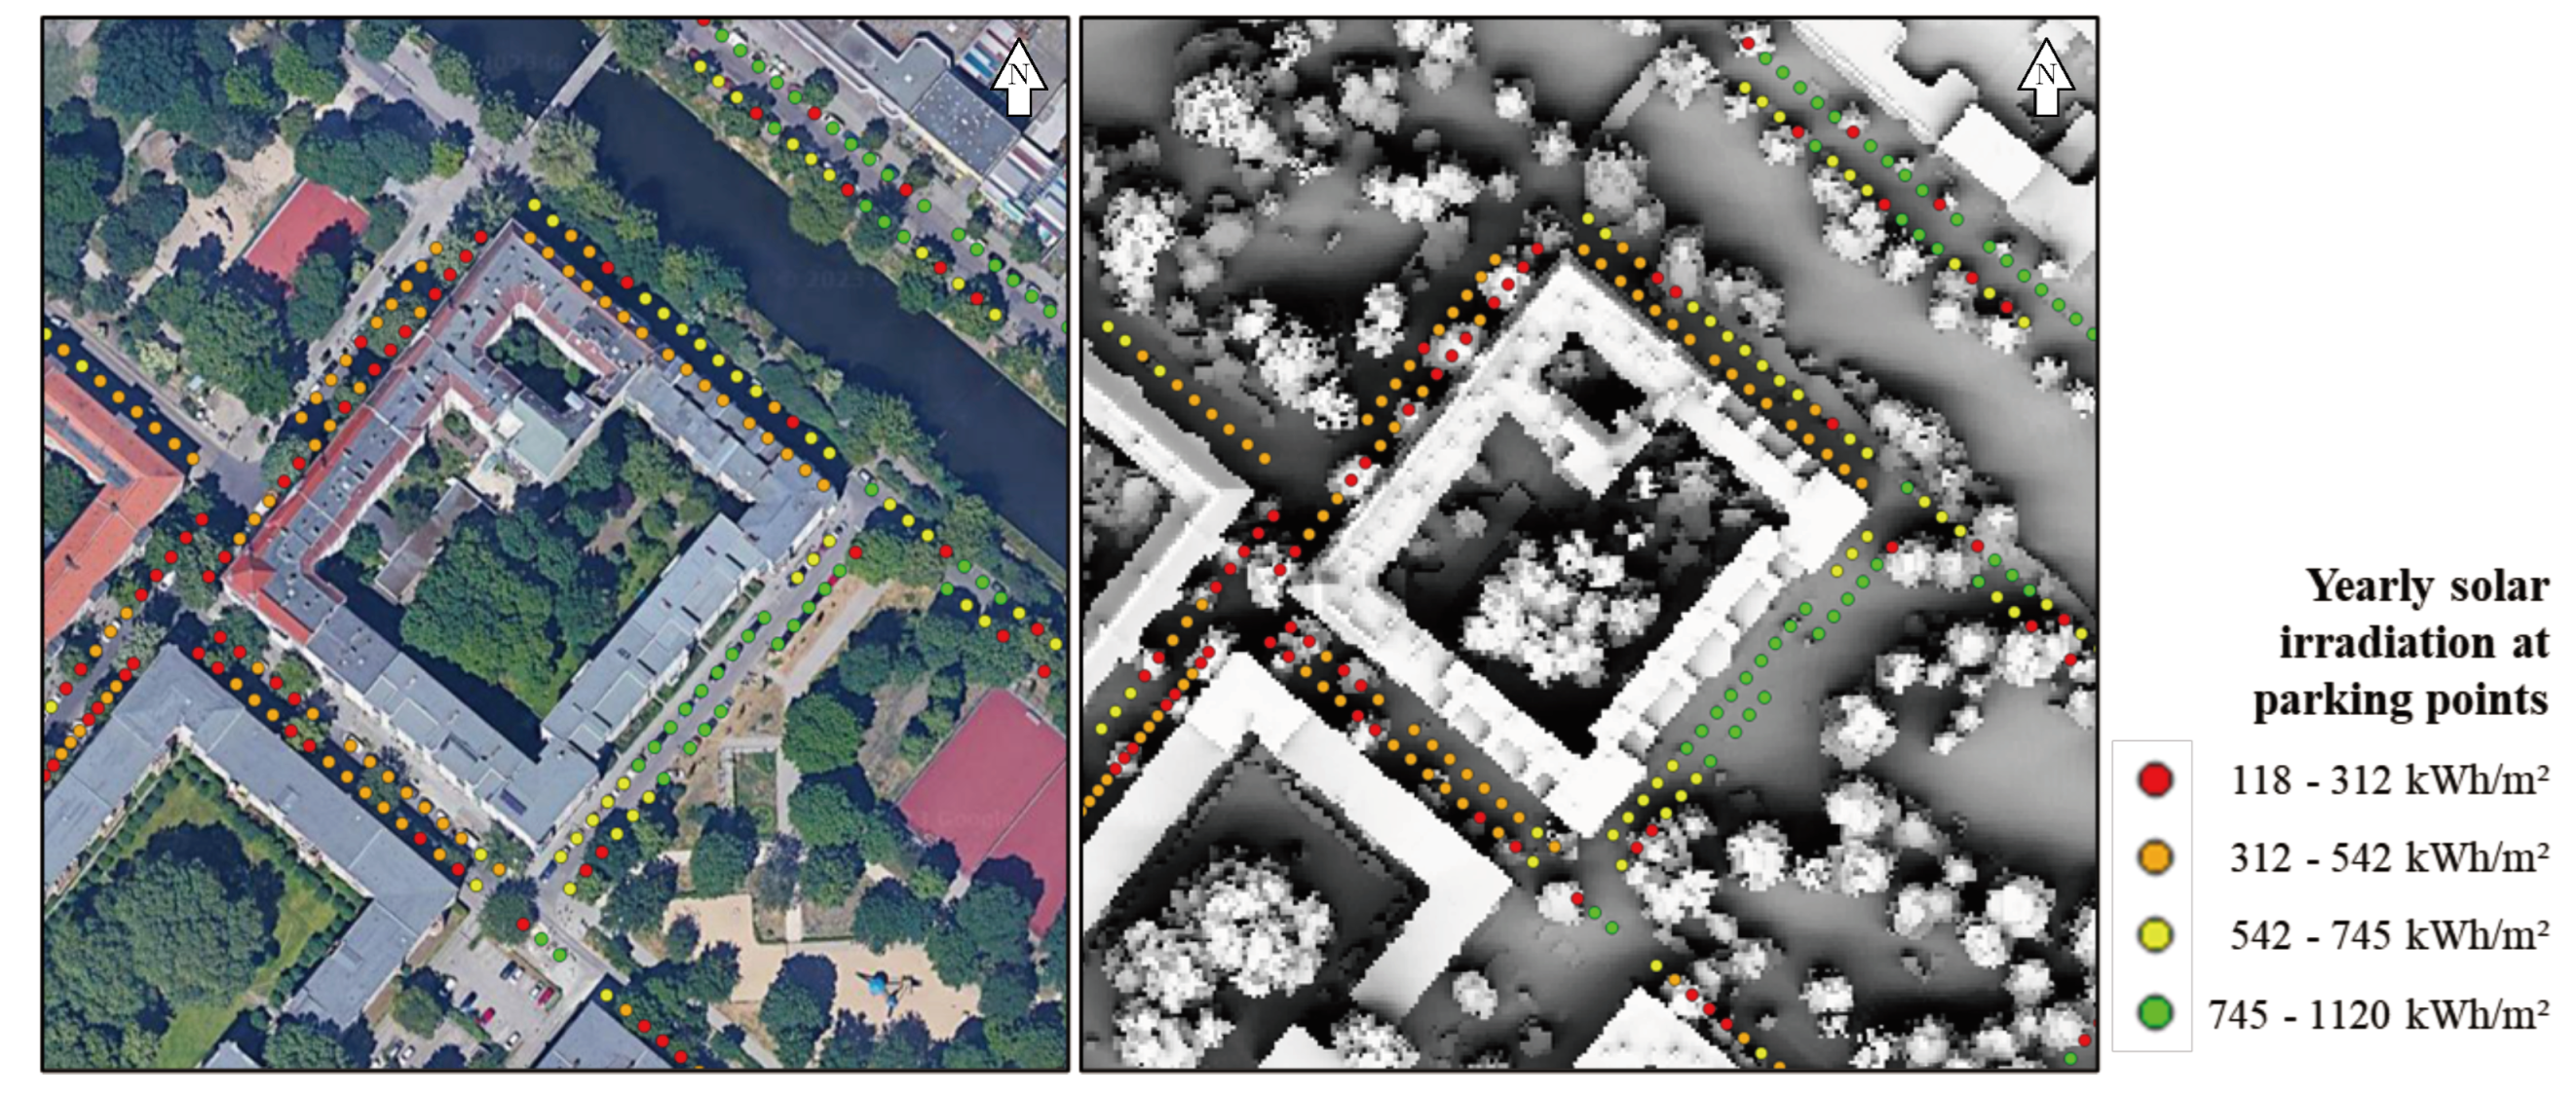
The solar simulation generated 12 solar maps (one for each month) that contain the spatial distribution of solar irradiation , including weather influences as well as shading areas caused by buildings. A solar map for the whole year was generated as well by combining the monthly solar maps. To extract the solar irradiation values from the solar maps, the QGIS Point Sampling Tool was used for the dataset of the 48,827 parking points. The result generated vector point layers (GeoPackages) that contain values of the beam and diffuse solar irradiation for each parking point for every month. The geopackages were exported as .csv/.xslx files to conduct the further vegetation influence and solar yield calculations.
Since the r.sun radiation model calculates the diffuse fraction of the solar irradiation for a flat horizontal plane, the sky view factor (SVF) was integrated into the model. The SVF is important in determining the surface radiation balance in obstructed areas [
39]. The SVF is defined as the proportion of visible sky above. In an urban environment, a significant proportion of the visible sky is blocked by buildings and trees, which reduces the diffuse irradiation. The diffuse irradiation is therefore multiplied with the sky view factor (a value between 0 and 1, while 1 represents an unobstructed sky) [
40,
41]. In this study, the SVF was calculated with the QGIS-integrated SAGA Tool
saga:skyviewfactor with the cell size method and 16 sectors. The operation was performed on the custom DSM-nt, which means that the SVF for this study is representative for buildings only. A sky view analysis on the DSM with trees was not performed because the resulting values very close to objects (in this case, trees, vehicles, and other objects) were highly inaccurate.
3.4. Integration of Shading by Urban
Vegetation
The resulting solar maps of the custom DSM-nt do not contain any information about vegetation, which was purged from the DSM with trees earlier. In this step, the vegetation is reintegrated into the model to simulate the real-world shading effect of urban trees. To evaluate the influence of trees on the solar yield of parked vehicles directly underneath trees, there were three attributes assessed:
The first was whether a parking point is located under a tree or not. This is determined by calculating the difference between the original Digital Surface Model (DSM) and the Digital Terrain Model (DTM). Since the DSM includes trees and the DTM does not, it can be measured if there is a tree above a certain parking point. In this study, it was assumed that if the difference of the DSM and DTM at a parking point is higher than 4 m, then this parking point is under a tree. Since the maximum height for trucks in Germany is 4 m, it is assumed that objects in the DSM that are lower than 4 m are trucks or other vehicles.
The second attribute to evaluate solar yield directly underneath trees is to quantify the transmittance (also referred to as transmissivity) of tree crowns. This topic was investigated by Konarska et al. [
42] in the study “Transmissivity of solar radiation through crowns of single urban trees”. The transmittance factor for several deciduous tree species was measured both in the summer, when trees are foliated, and winter, when trees are defoliated. Since the majority of trees in the study area of Neukölln are
Tilia (Linden) and
Acer (Maple) [
43], which shed their leaves in winter, the transmittance factors by Konarska et al. [
42] were applied. The mean transmittance factor of tree crowns was found to be 54% in winter and 10% in summer. This transmittance factor affects the received global irradiation (sum of the direct and beam components) under a tree. Similar transmittance factors were found by Oshio and Asawa [
44], who measured an average transmittance of 0.1 during a summer afternoon on a tree-shaded sidewalk.
The third attribute required to calculate the shading influence of trees is the vegetation periods throughout the year. From the study on tree shadowing by Rosskopf et al. [
45], it has been derived that deciduous trees are leafless from November until March. April to June exhibits the growth period, from July to September the tree crowns are fully developed, and in October, the leaves are shed. The transitions of the vegetation seasons were assumed to be linear. These attributes form the basis of a monthly transmittance factor, as shown in
Table 2.
Parking points that are not vertically located under a tree can still receive shading from trees nearby. In this model, the shading influence of trees for parking points not located under trees will only affect the beam component. (As explained in
Section 3.3, the diffuse component in this model is only reduced by the sky view factor of the buildings.) To quantify the beam irradiation through tree crowns, the tree transmittance factor for direct irradiation also measured by Konarska et al. was applied (see
Table 2).
The transmittance factors were then applied to the solar irradiation values of the affected parking points. The resulting solar irradiation values with weather and tree shading influence are presented in the following chapter.
A limitation of this method can be observed when the sun is at a lower angle in the sky and the irradiance hits locations under a tree. This limitation cannot be avoided when using raster maps. Shadow cast or sunshine under a tree cannot be simulated since the DSM only contains the maximum measured elevation for each 1 m × 1 m pixel. Therefore, in this study, the influence of trees was simplified and categorized in parking points under trees and parking points not under trees.
Even given these limitations, our approach improves on the state of the art in considering tree shading influence in an urban street environment. Other publications have mostly excluded the influence of vegetation in their research.
3.5. Solar Yield Calculation and Vehicle
Assumptions
The final step to assess the solar potential of parked vehicles is to calculate the solar yield. The solar yield is the energy of the incoming Global Horizontal Irradiation that is being converted into electrical energy, which is stored in the vehicle battery.
For this study, it is assumed that a Solar Electric Vehicle can hold 1 kWp of installed photovoltaic power, for comparability with Commault et al. [
5]. This would be achieved by a panel size of approximately 5 m
2 and a 20% panel efficiency (also, other combinations are possible, such as a panel with 25% efficiency on a 4 m
2 surface or a future high efficiency panel with 33.3% efficiency on a 3 m
2 surface). The solar panel is assumed to be a flat horizontal surface.
The energy conversion efficiency from the solar panels into the battery is assumed at a conservative 75%. The 25% of conversion losses are caused by the DC–DC converter, ohmic losses in cables, and other conversion losses, such as the mismatch of modules (partial shading), temperature influence, and soiling [
18]. The average energy consumption of state-of-the-art electric vehicles is 13 kWh/100 km [
17].
The electricity price for public AC charging was assumed at a moderate 0.50 €/kWh after comparing several charging energy suppliers from Germany [
46]. A monthly base fee was not comprised in the pricing. It is expected that charging prices will increase in the future, which will improve the cost savings of onboard solar panels.
As stated in
Section 3.1, the mean private car in Germany is parked for 23 h of the day; hence, the energy yields are calculated for a car being parked the whole day. The full battery effect (solar power not being utilized because the battery is already full) is not taken into account within this study. The assumptions to calculate the solar yield and extended driving range were also chosen to match with the works of Brito et al. [
26] to enable a comparison of the study results.
5. Discussion
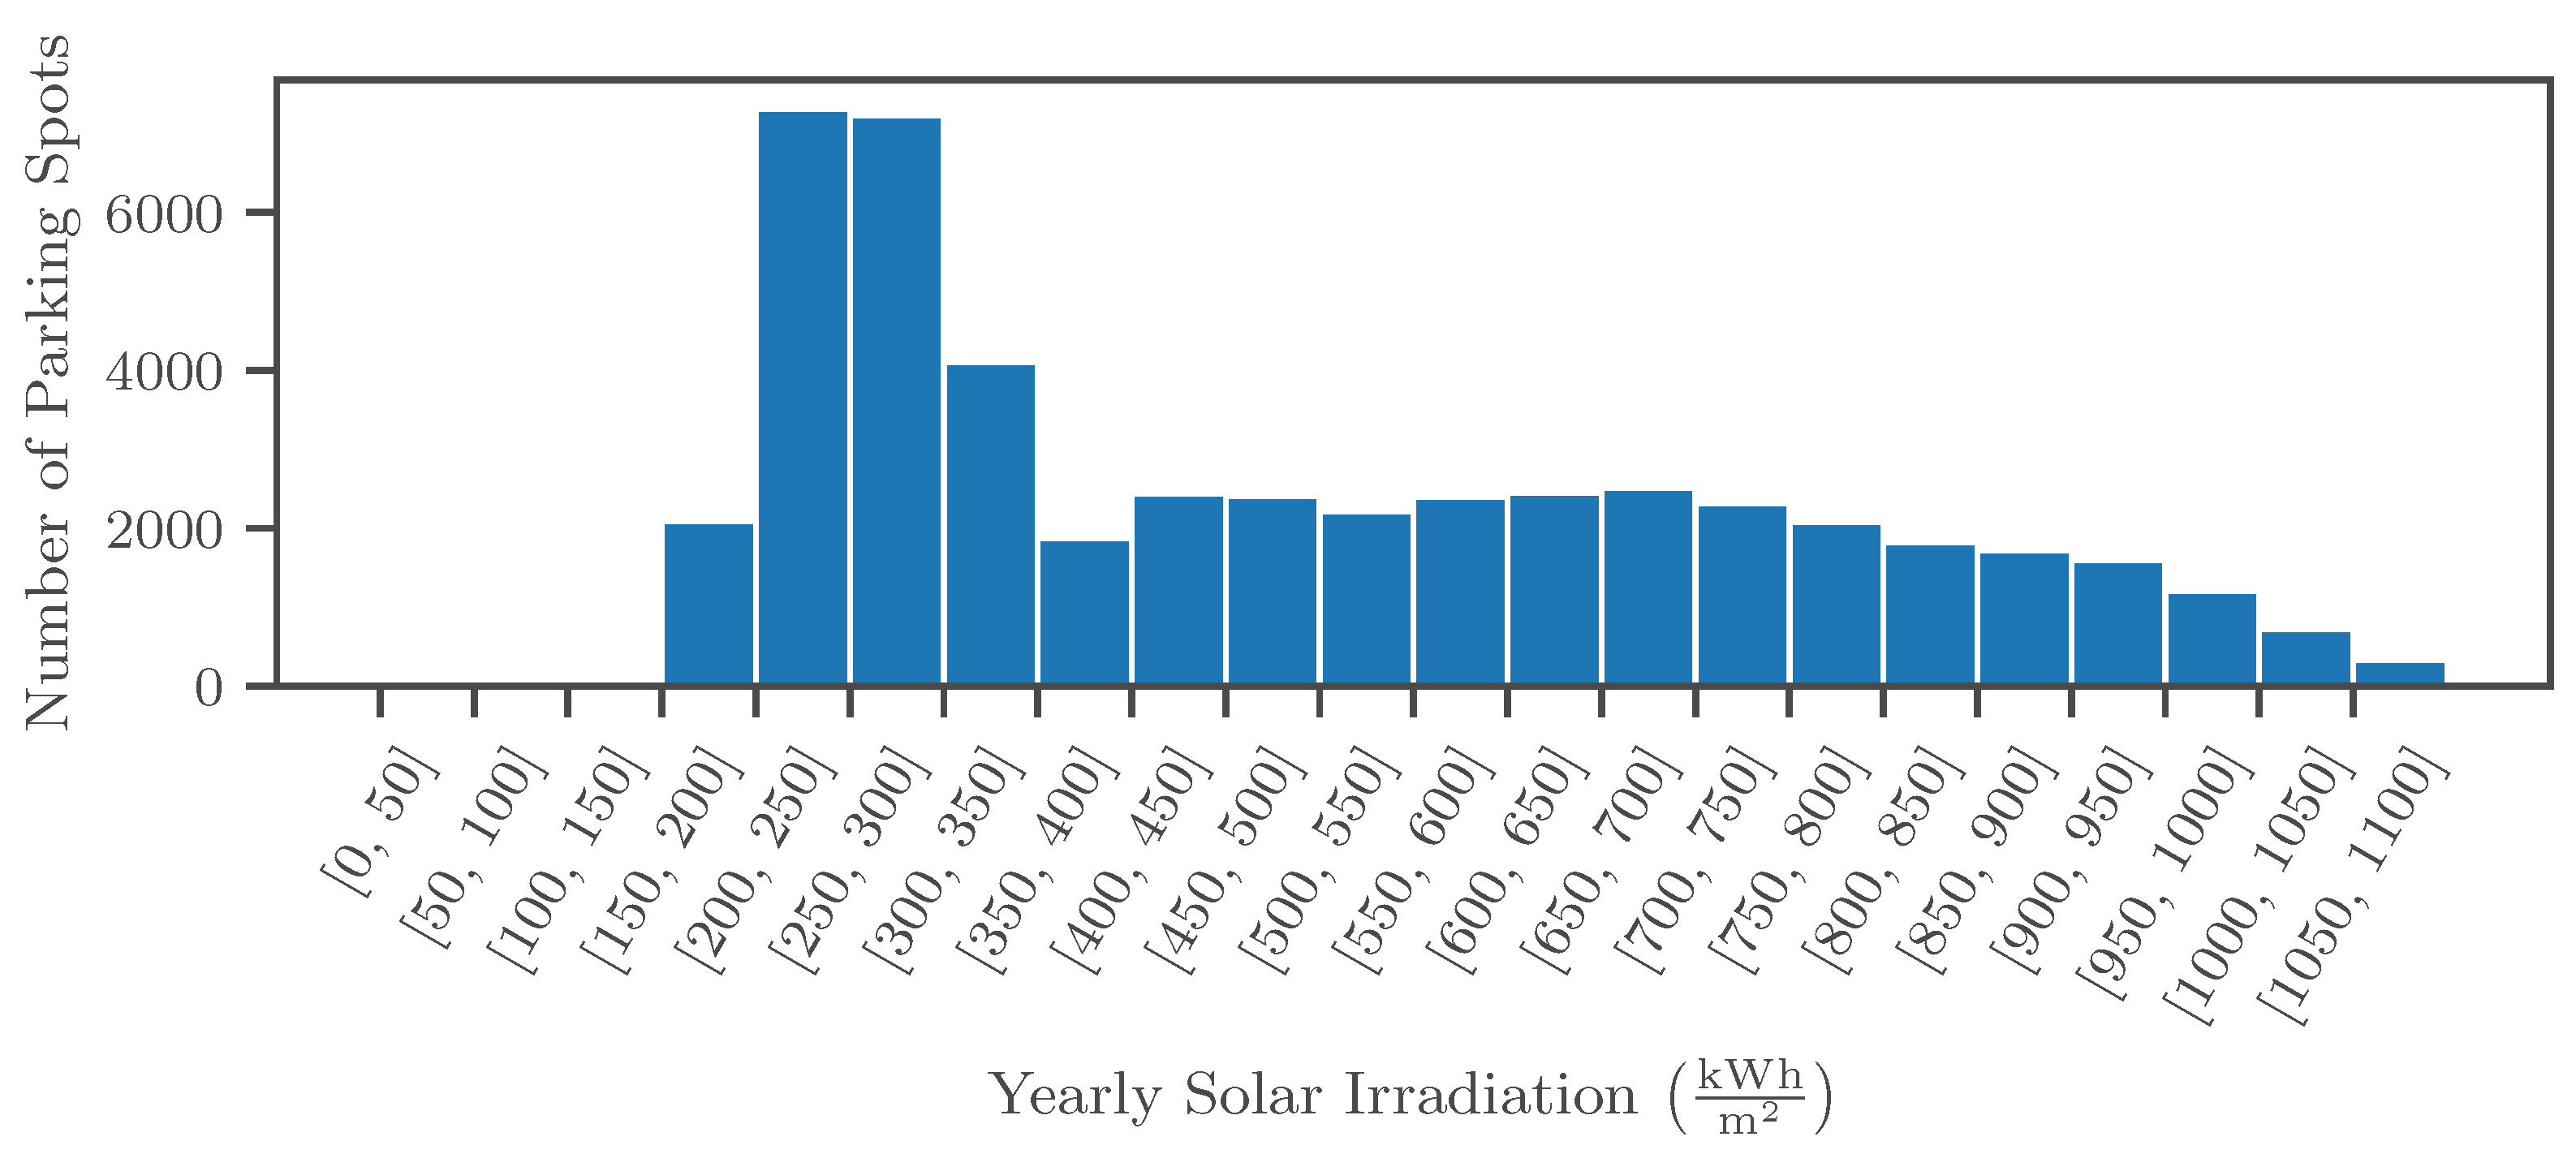
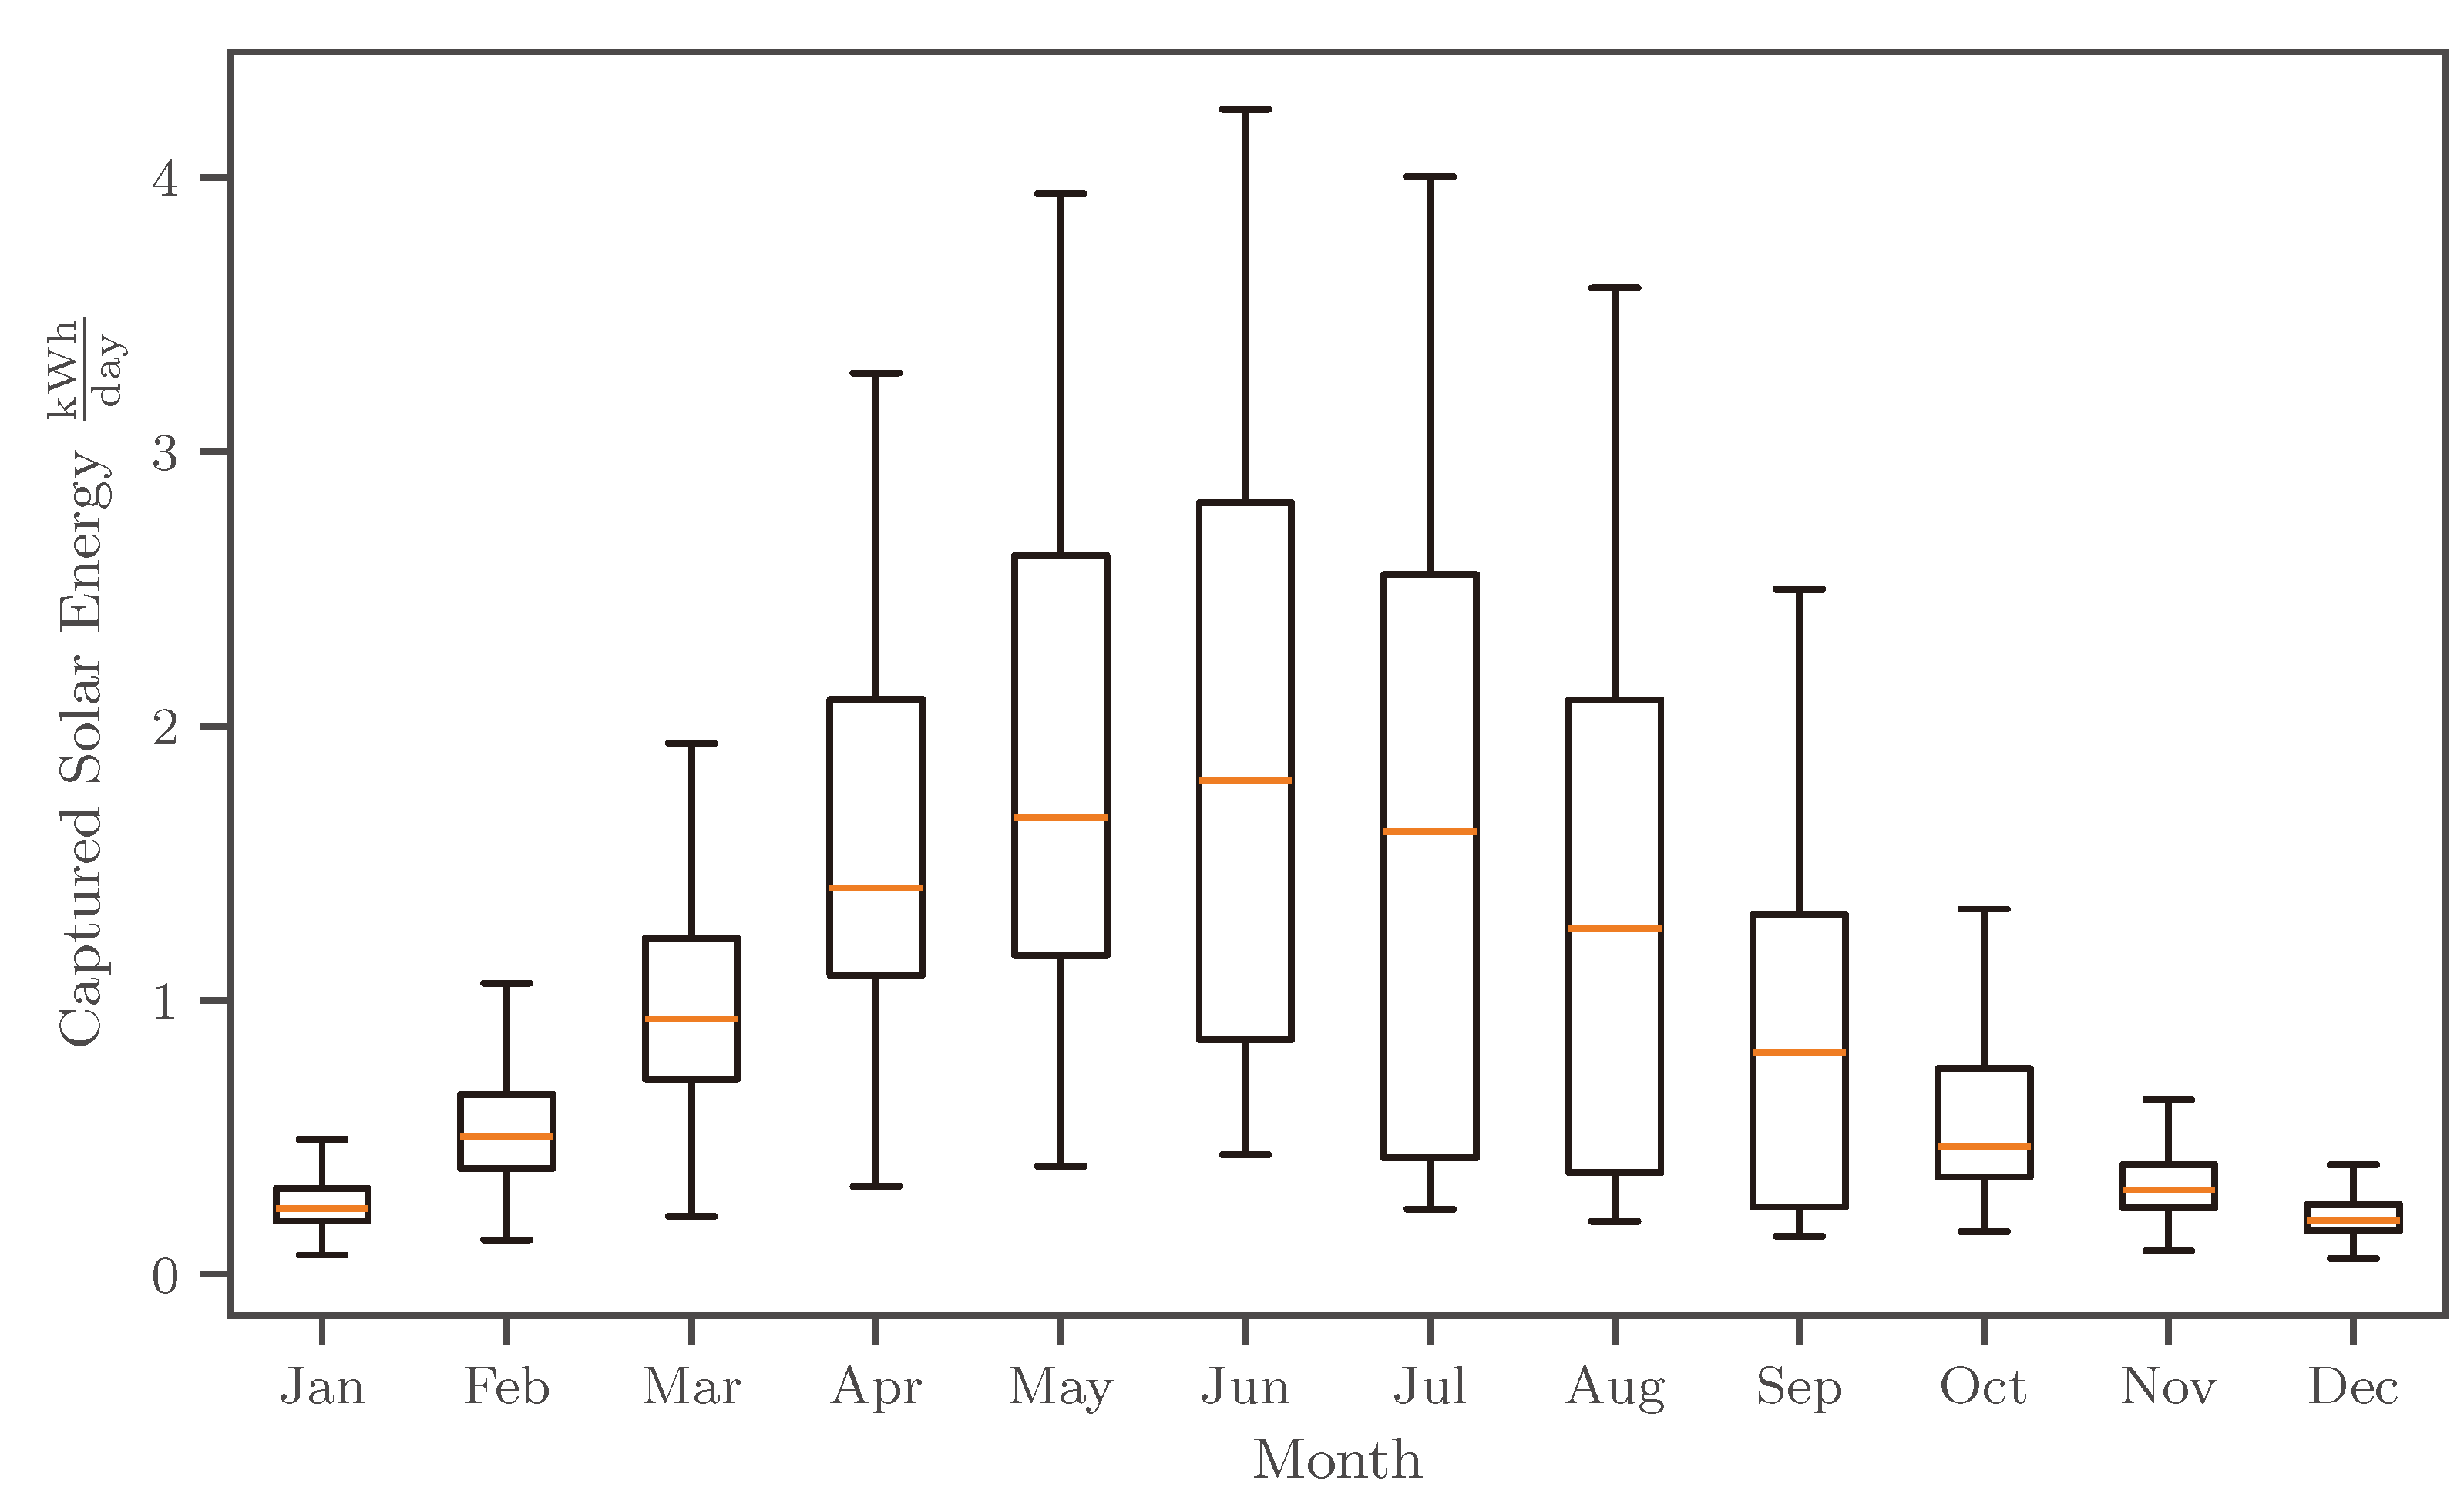
The results presented in the previous chapter show that significant shading losses are inevitable in an urban environment. Yet, the yearly added range of over 5000 km for a favorable parking location of the 90th percentile should not be neglected. It can be concluded that significant range increases—or charging energy decreases—are possible for vehicles at favorable parking spots under favorable conditions. However, the fixed parts of the transportation system, such as power grid infrastructure, charging infrastructure, and vehicle battery size, can only be reduced by a very small amount (less than 5%) when VIPV is widely implemented, as these components need to be designed for unfavorable times and places, where the energy gain is minimal. Another positive impact of VIPV could be the occurrence of fewer deep discharge events of vehicle batteries [
48]. Fewer deep discharging events can result in higher battery lifetime and therefore less battery waste.
5.1. Comparison to Previous Research
When comparing the results to the findings of Brito et al. [
26], the outcomes are similar. While Brito et al. estimated an annual average EDR for the median parking location to be about 10
, this study found an annual median EDR of 6.9
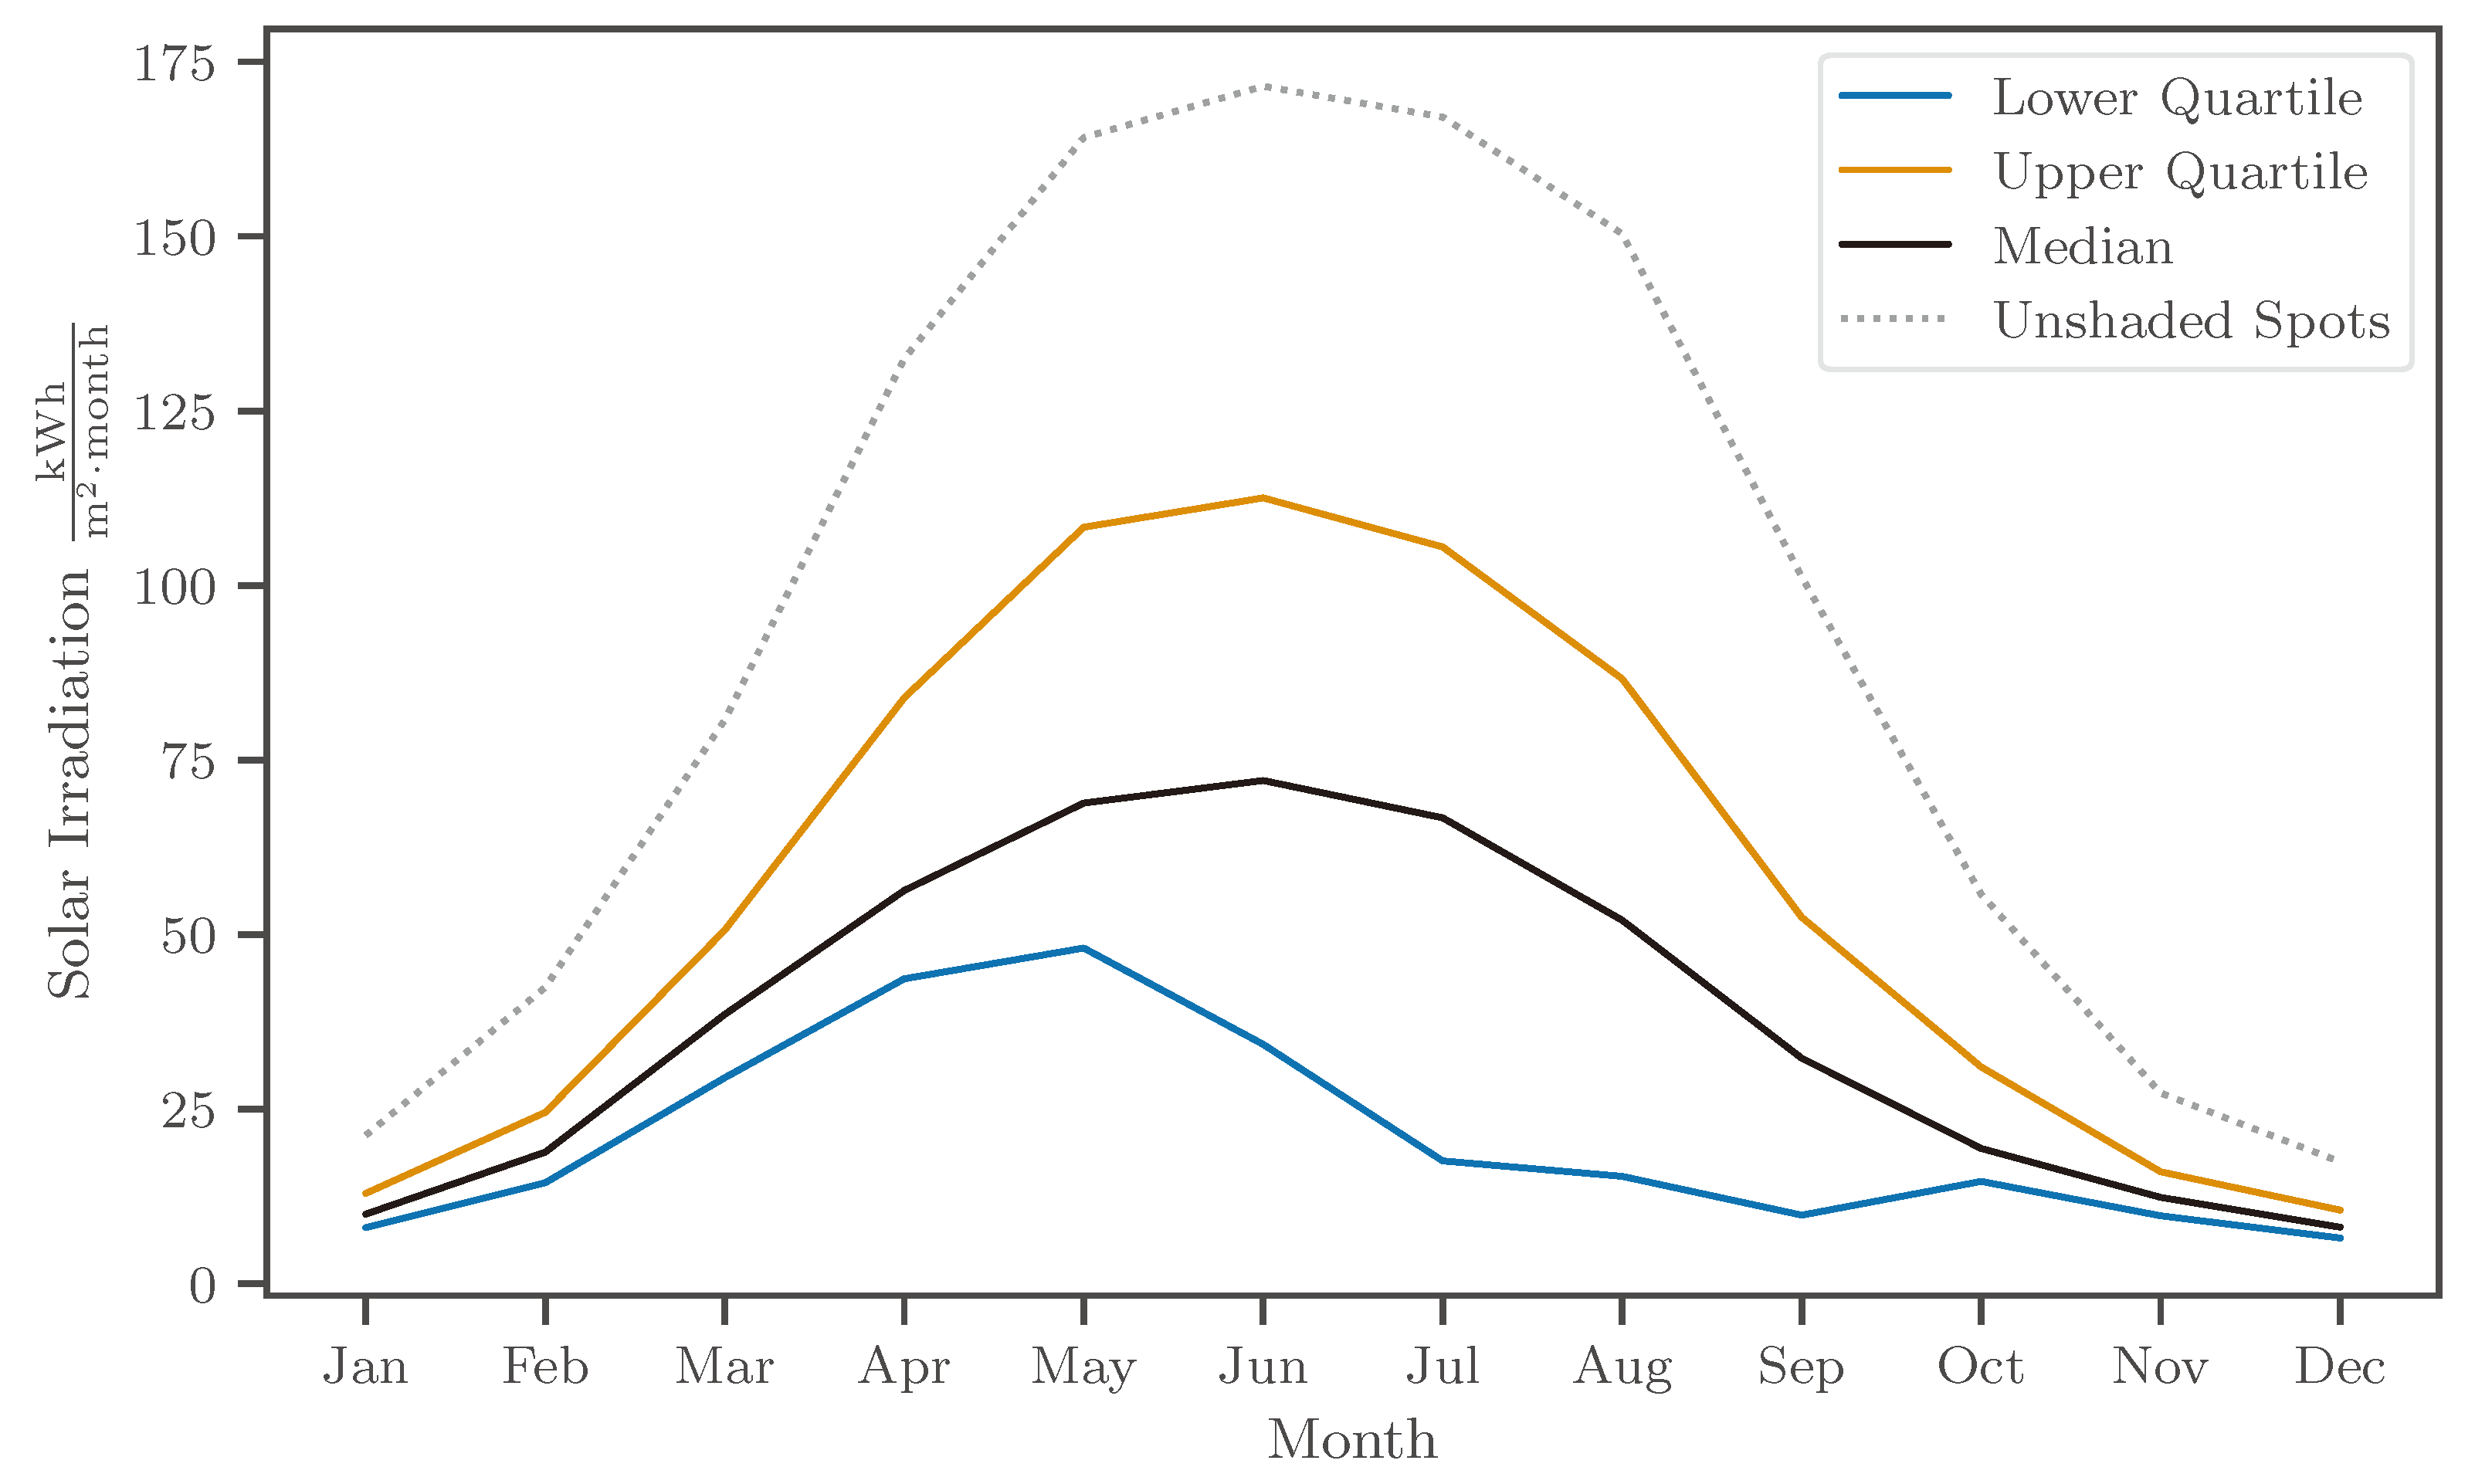
. This difference is most likely attributed to Lisbon being located further south and having more favorable weather conditions with lower cloud cover. The yearly unshaded solar irradiation in Berlin is 1117
, whereas in Lisbon, it amounts to 1764
[
38], which is 1.58 times higher than in Berlin. Brito et al. [
26] also concluded that the solar potential on roads is higher than on parking sites because the distance to buildings and trees is higher in the middle of the road. This can also be applied to the results of this research, whereas it can presumed as well that the solar yield while driving in Berlin is higher on average than in a parking location. This obviously depends greatly on the choice of the parking location.
Further, Brito et al. stated that for the median urban parking space, about 33% of the annual typical driving distance could be supplied by energy generated by PV. In Berlin, this value was estimated to be 27%. It is worth mentioning that the typical driving distance used by Brito et al. [
26] was 11,000 km/a, while in Berlin, a lower distance of 9323 km/a [
47] was assumed, which increases the relative annual solar added range. A notable difference between the studies are the monthly irradiation losses. Brito et al. [
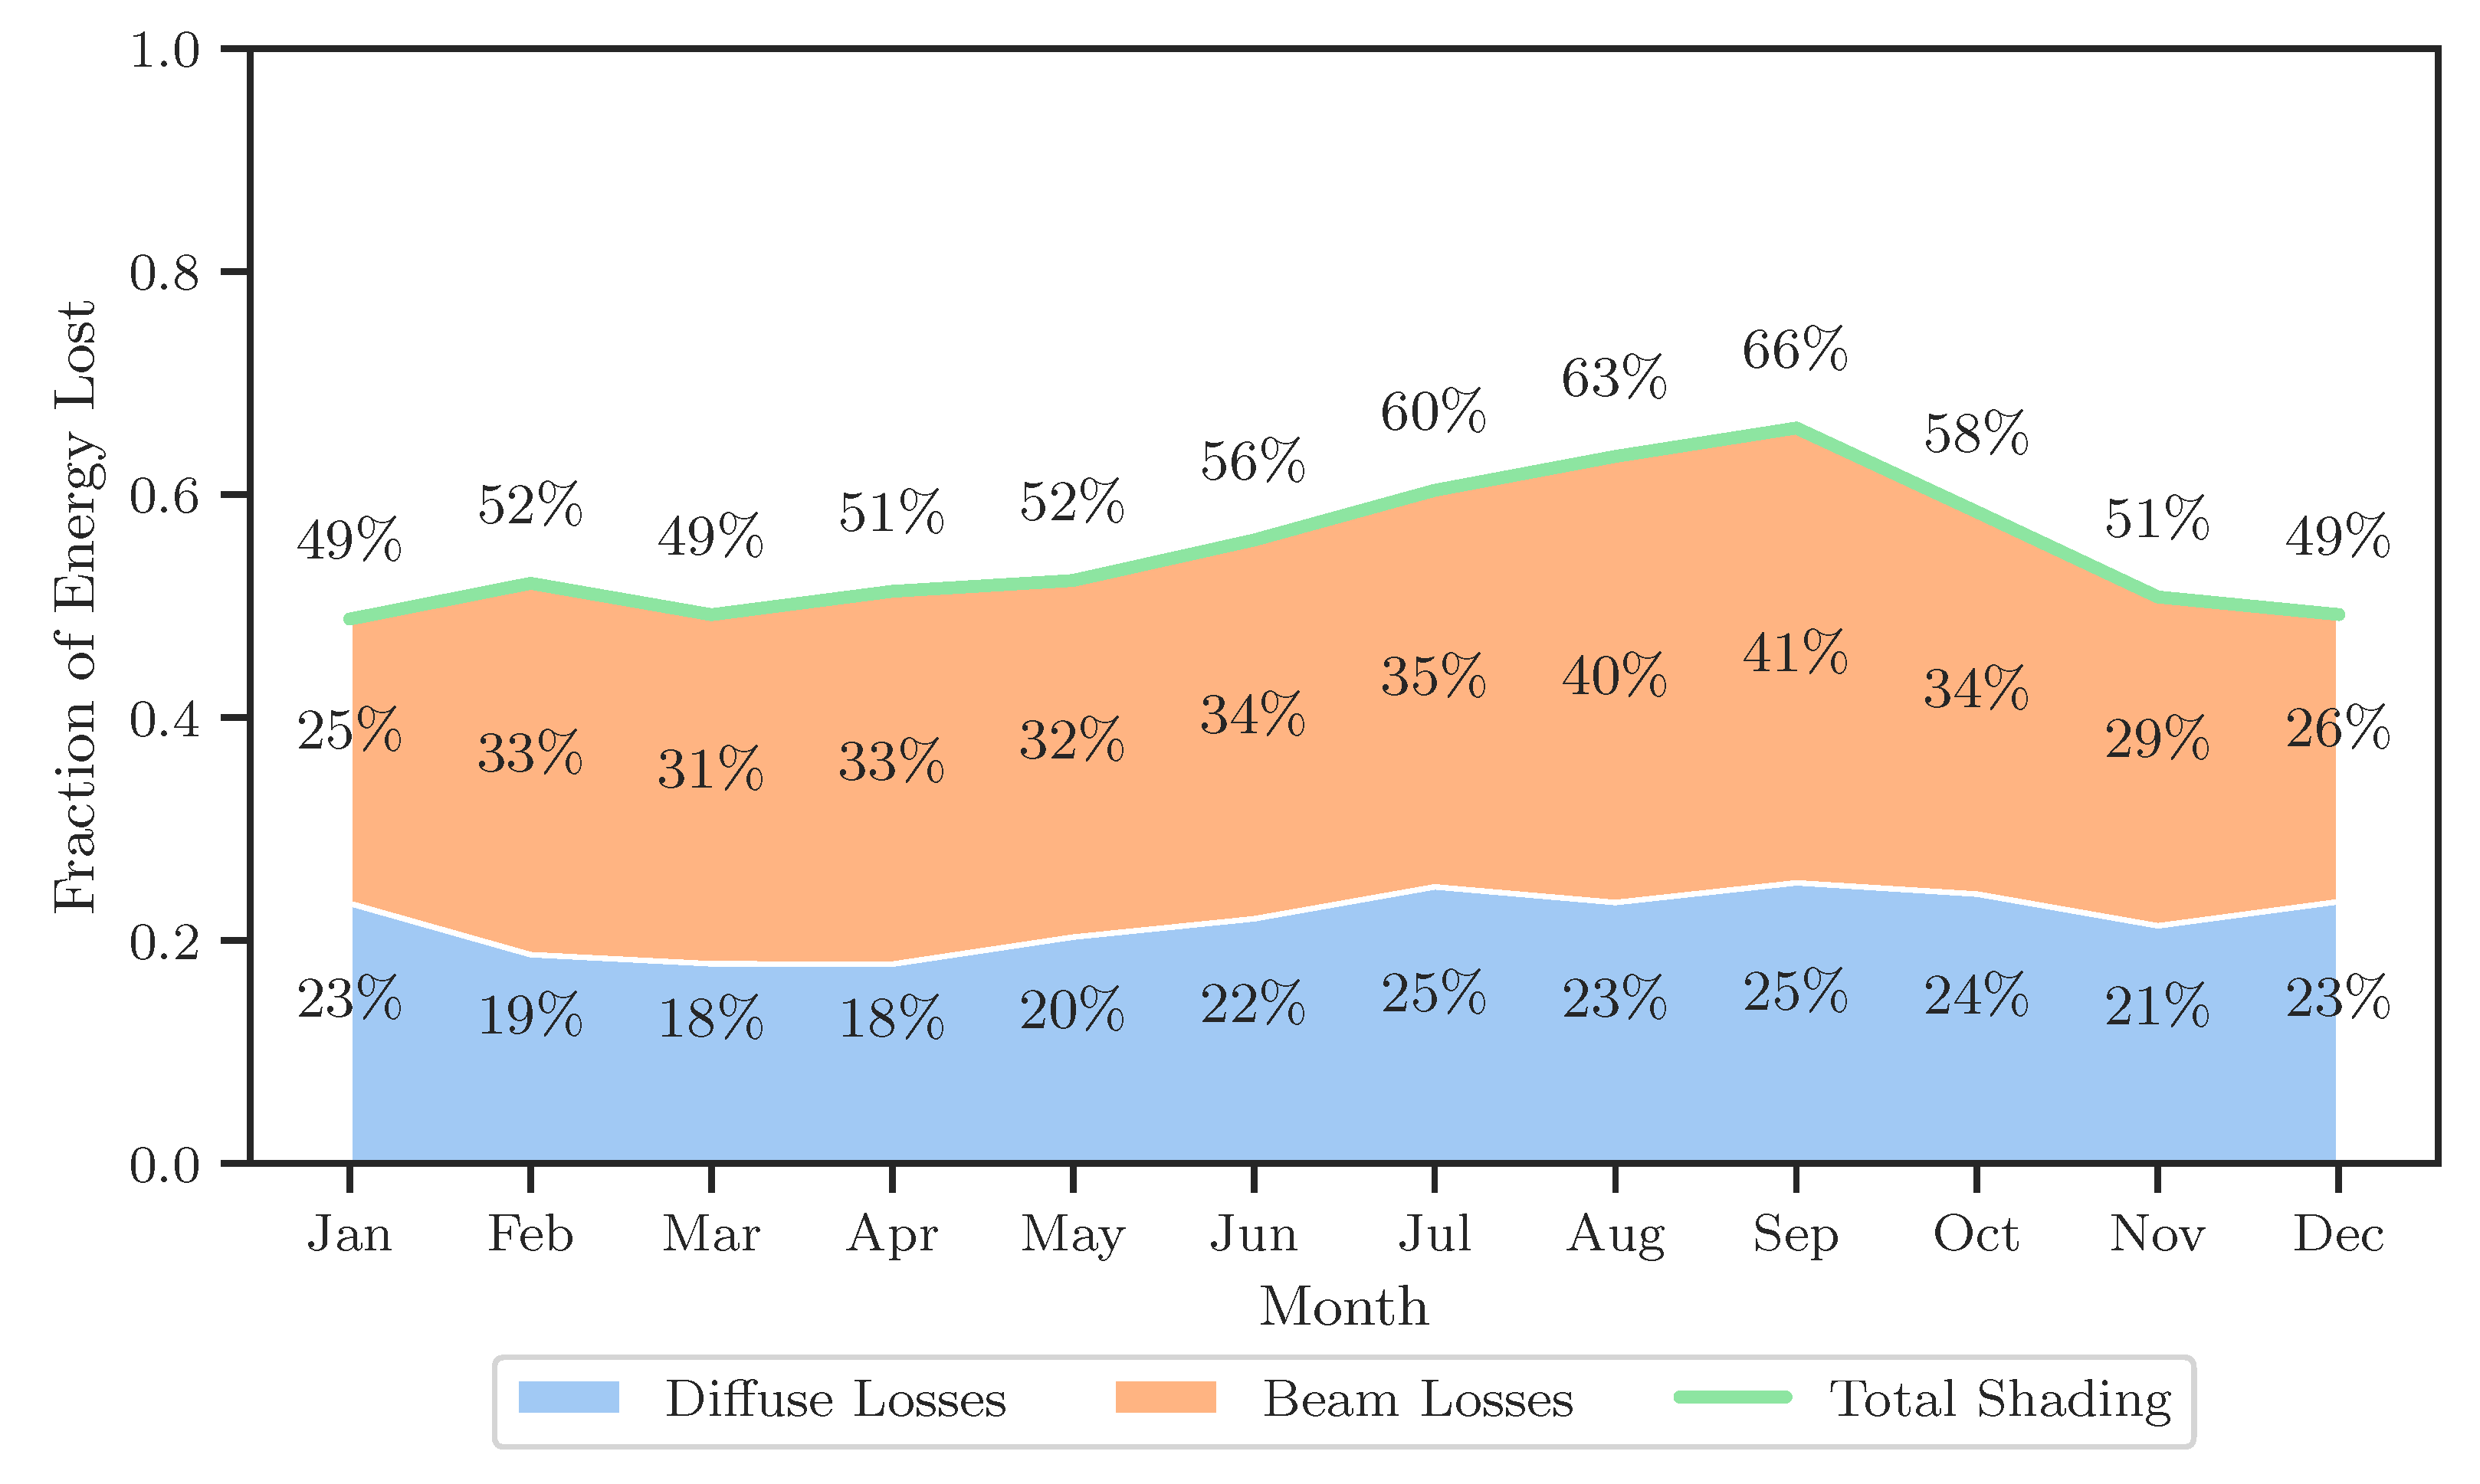
26] found irradiation losses in winter to be much higher than in the summer, while in the study of Berlin, irradiation losses were relatively constant throughout the year. This is most likely due to the integration of seasonal vegetation shading in this study. Since trees are blocking about 90% of the solar irradiance in the summer, the expected irradiation gains due to higher insolation angles of the sun might be mitigated by the tree foliage. Even though the results of the studies of Lisbon and Berlin are comparable, they are yet to be verified with experimental measurement data.
5.2. Limitations and Methodological Implications
The model assumptions and methodological implications have various impacts on the model results. The vehicle assumptions were chosen to match the assumptions by Brito et al. Whether a PV car roof panel with 1 kWp is feasible with current car geometries and state-of-the-art technology could be argued. Also, the assumption of the roof being flat and horizontal is a simplification since car roofs are usually curved surfaces. However, this aspect was taken into account by assuming conservative 25% conversion losses from the panel into the vehicle battery.
Another aspect that was not considered (congruent with Brito et al. [
26]) is the battery saturation effect. There might be instances when the vehicle battery is fully charged and therefore cannot receive any more energy. This leads to a potential overestimation of solar energy yields within this study [
49,
50]. Other neglected aspects (for comparability purposes) were temperature influences and battery self-consumption [
17].
Further, the energy output of VIPV on a daily or even hourly basis is highly dependent on the actual weather. In this study, weather data were averaged over time; hence, the daily solar yield and resulting added ranges can vary greatly from day to day, depending on the weather conditions and solar irradiance. The solar simulation time step interval of 15-min steps could also be decreased to increase the model’s precision.
Another limitation is the assumption of the parking spots/vehicles being points. This implies that a location is either in direct sunlight or not. In a real-world scenario, there are frequent instances where the solar panels would be partially shaded, which entails a technological challenge for module manufacturers to utilize partial shading conditions [
51].
The solar simulation also incorporates several limitations. One is that albedo and direct/diffuse reflections by buildings are not considered. Also, the diffuse irradiation was reduced by a sky view factor of the DSM-nt (without trees), as described in
Section 3.3. This leads to an overestimation of the diffuse component of the sunlight for vehicles not parked under trees but near trees. The introduced tree transmittance factors also introduce inaccuracies because they do not distinguish the exact location of a vehicle under a tree. A tree is a highly complex and partially transmittant 3D object that alters the solar irradiance. Regarding this problem, raster DSM elevation maps are subjected to limitations. Even though DSMs are excellent tools for spatial analyses, they also induce certain constraints regarding the 3D nature of objects, especially trees. An example of this problem is a vehicle under a tree receiving sunshine from an angle. Hence, the approach of vertical shading was used in this study to approximate the shadow influence by trees at parking points directly underneath. This could lead to an underestimation of solar yields under trees.
The parking point classification (whether the point is located under a tree or not) highly depends on the accuracy of the DSM and DTM. The tree threshold of 4 m can lead to errors, i.e., smaller trees, trucks, or objects that are taller than 4 m can lead to an incorrect classification. Also, parking points under bridges or buildings can be misinterpreted (manual purging required).
5.3. Sustainability
When applying the assumptions of Kanz et al. [
29] to the results within this study, it becomes apparent that the shadowing factor (shading losses) for the average parking point exceeds 50%. Therefore, VIPV would not be more sustainable than grid charging when taking all parking points into account. This means that to make VIPV a more sustainable option than grid charging, the consistent use of favorable unshaded parking locations is necessary. Kanz et al. [
29] also conclude that the outcomes of VIPV LCA studies strongly depend on the location of use of the vehicle, the annual irradiation, and the carbon footprint of the grid-mix in that location.
A different approach in evaluating the sustainability of VIPV is the comparison to stationary photovoltaics, such as a rooftop or utility-scale PV. The combined annual solar yield of all 48,827 parking points in the study area is a hypothetical 18 GWh. If this photovoltaic capacity was installed in an unshaded place like a roof, it could produce 41 GWh. These roof panels could also be sloped at a 40° angle and advantageous azimuth to generate an even greater energy yield of 48.6 GWh [
38]. While VIPV can improve the charging autonomy of vehicles, they are subjected to higher shading and an unfavorable orientation compared to stationary solar panels.
In an unshaded scenario, the efficiency of VIPV onboard charging is higher than the efficiency of PV grid charging. The VIPV system only requires a DC–DC voltage conversion to charge the battery, while PV grid charging undergoes a DC–AC conversion, grid transmission losses, and, finally, AC–DC conversion within the onboard charger. The conversion losses of grid PV charging, therefore, are greater than VIPV onboard charging. However, in shaded conditions, the efficiency advantage of VIPV rapidly disappears, and it becomes more efficient to charge the vehicle via grid PV.
When comparing VIPV to rooftop solar installations from an environmental perspective, the lifetime of each system plays a very important role, as most negative environmental consequences are caused by the manufacturing process, which can be “amortized” by the energy produced during the service life. For rooftop PV installations, a lifetime of 25 years is usually assumed [
52]. For the lifetime of electric vehicles, no good data set exists yet, as the wide adoption of electric vehicles is still in progress. The average fleet age in Germany is 11.3 years [
53]. However, due to vehicles leaving the fleet both through scrapping and export, as well as political and economical factors affecting fleet composition, the lifetime of future VIPV-equipped cars is uncertain. A higher lifetime or highly efficient recycling program for VIPV equipment can significantly improve their ecological footprint.
6. Conclusions and Outlook
Photovoltaics are one of the future pillars of sustainable energy generation. Next to stationary PV on roofs or dedicated PV farms, VIPV could be used in scenarios where available space for stationary PV is limited and unshaded parking is an option.
The results of this study imply that VIPV will not solve the energy supply challenges for urban electric vehicles. VIPV, rather, can unfold its potential in certain use-cases, where it is assured that the solar yield is being maximized by avoiding shaded areas. Only then can VIPV become a sustainable contributor to future transportation. However, in higher latitudes, this potential is mainly restricted to the spring and summer months.
Our research shows that up to 5000 km annually can be generated using VIPV on passenger cars in ideal unshaded parking locations in Berlin, Germany. However, this applies to 10% of the observed parking locations in the study area.
The utilization of solar energy in stationary applications is more favorable because it (ideally) is unshaded, the panels can be aligned at an ideal angle and azimuth, and the conditions of use are less challenging than PV integration into a vehicle.
Photovoltaics in world regions south of Berlin (51° latitude) could significantly improve solar performance. Heinrich et al. concluded that in an unshaded scenario, the yearly solar range could be increased by 50% in Spain or even 60% in California, USA, due to higher irradiation levels [
17].
Urban areas are the most challenging environments for VIPV. In rural regions and road networks, the solar yields are expected to be significantly higher. To ensure a better utilization of VIPV, designated solar parking areas could be established by communities. Mobile map applications could provide valuable information to inform drivers about favorable parking locations for solar charging. Conversely, the results of our study could also be used to identify well-shaded parking spots, where vehicles without solar panels heat up the least.
A further assessment of the potential of commercial vehicles and trucks is highly suggested. Large flat roof areas are suitable for PV, and the driving profiles are often located outside of urban areas.
The approach of this study is exclusively based on open data and free software to enable a barrier-free reproducibility for other world regions. Our methodology can be applied to different cities in a further study, analyzing the solar potential for different kinds of buildings and road layouts, tree coverage, and parking strategies and developing a generic prediction for the feasibility of VIPV in different types of cities. Further research can also be conducted on solar irradiance modeling of VIPV potential while driving. The consideration of trees can be further improved by using 3D photogrammetry.
