
User Need Prediction Based on a Small Amount of User-Generated Content—A Case Study of the Xiaomi SU7


Abstract
1. Introduction
2. Literature Review
2.1. User Need Mining and Predicting
2.2. UGC
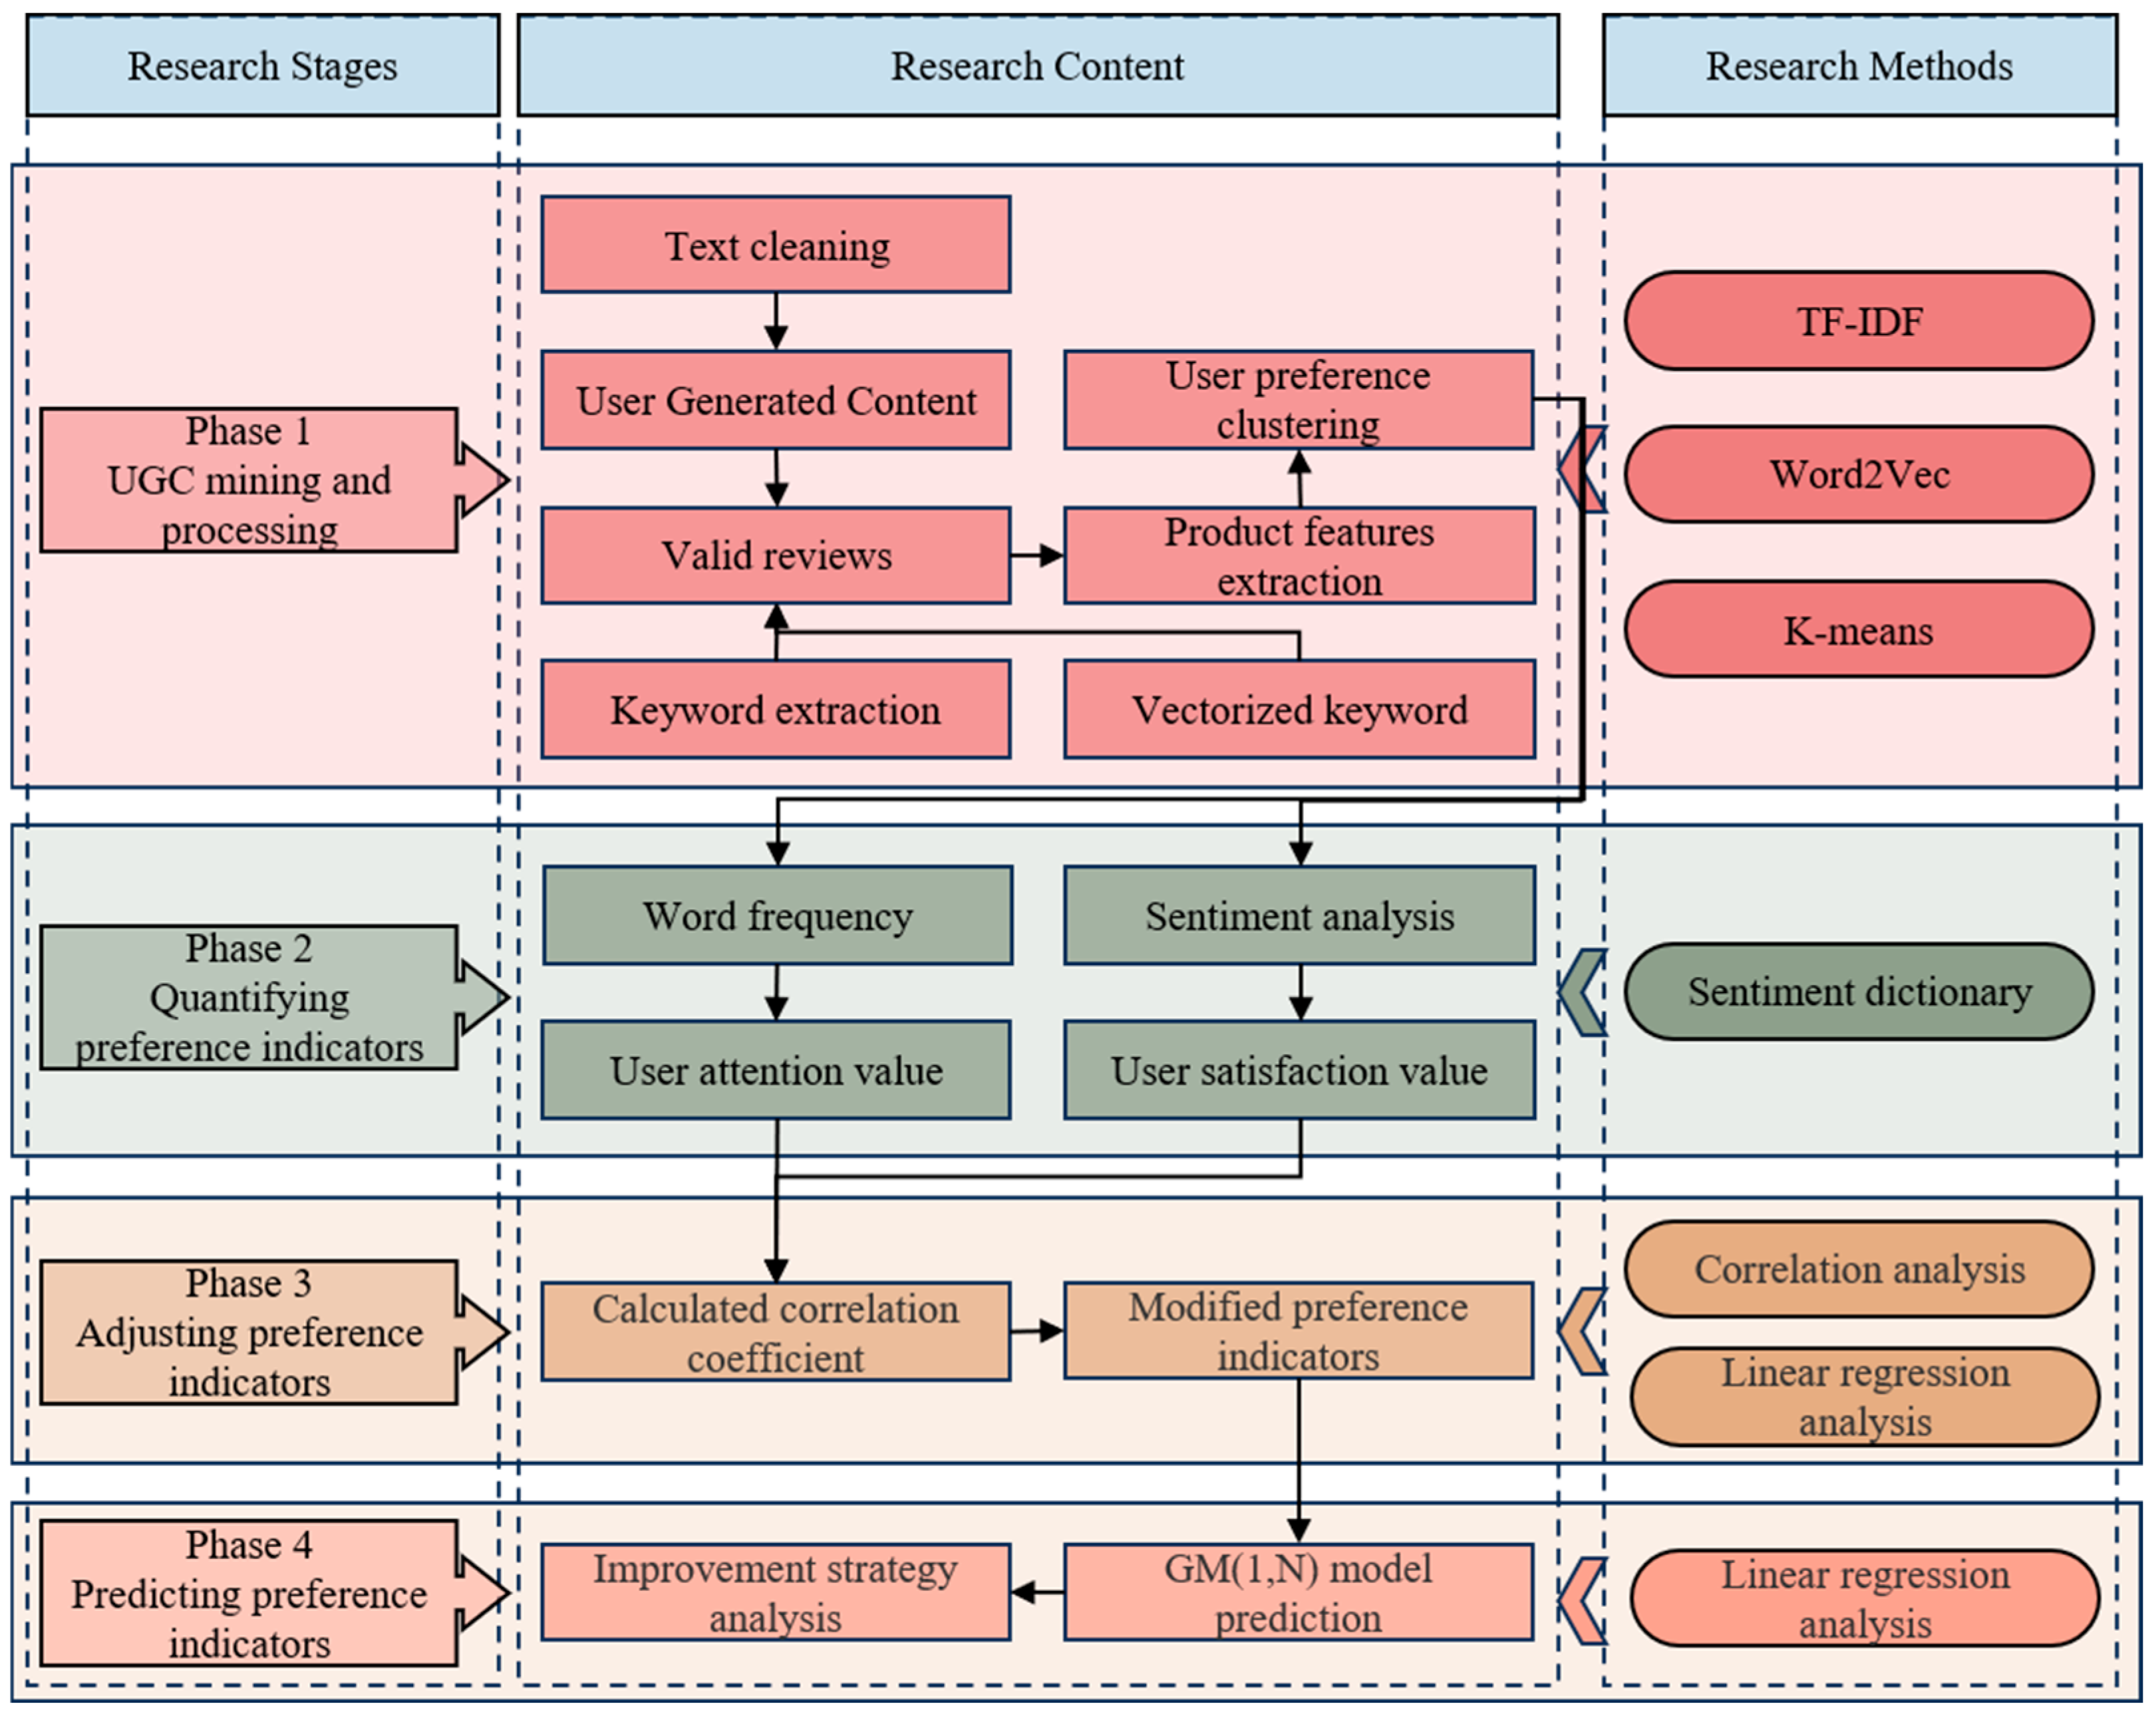
3. Methodology
3.1. UGC Mining and Processing
3.1.1. UGC Mining
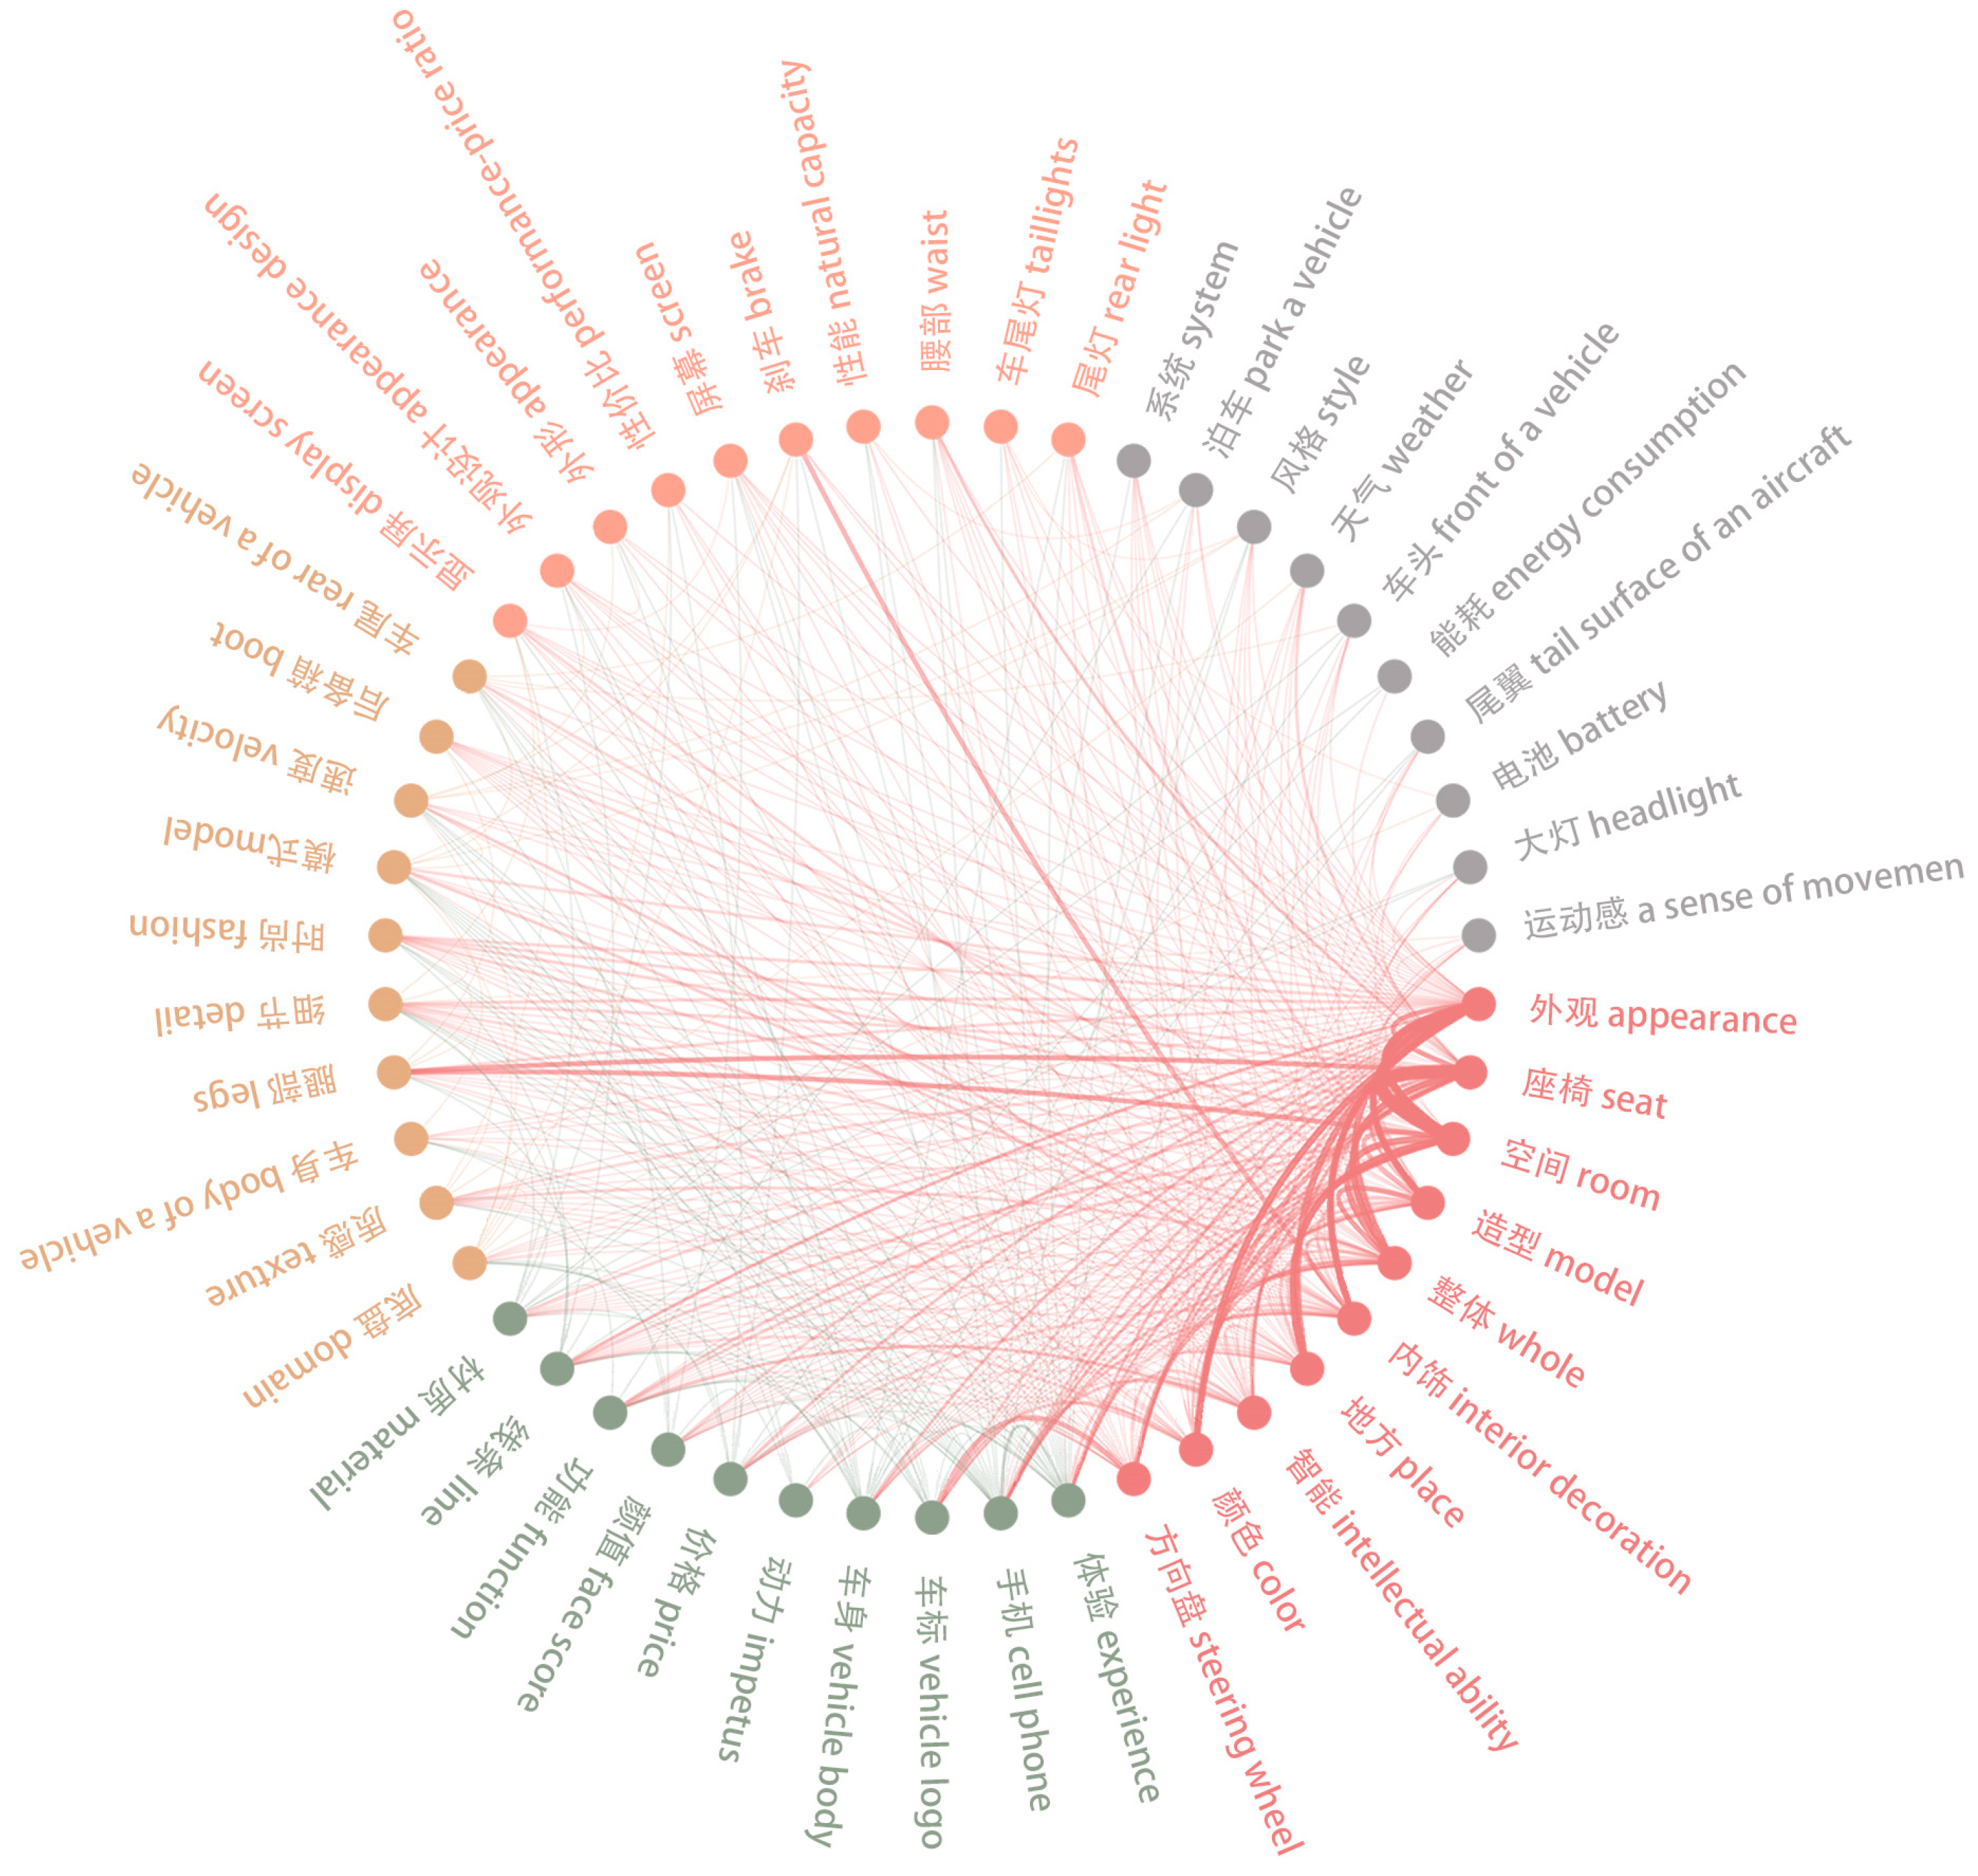
3.1.2. Product Features Extraction
3.1.3. User Need Clustering
3.2. Quantification of User Need Indicators
3.2.1. Calculation of User Attention
3.2.2. Calculation of User Satisfaction
3.3. Need Indicators Correction
3.3.1. Correlation Analysis Between User Need Indicators
3.3.2. Linear Regression Analysis Between User Need Indicators
3.3.3. Revision of User Need Indicators
3.4. Need Indicator Forecasts
4. Case Studies
4.1. UGC Mining and Processing for the Xiaomi SU7
4.1.1. UGC Mining for the Xiaomi SU7
4.1.2. Product Features Extraction and User Needs Clustering for the Xiaomi SU7
4.2. Quantification of User Need Indicators for the Xiaomi SU7
4.2.1. Calculation of User Attention for the Xiaomi SU7
4.2.2. Calculation of User Satisfaction for the Xiaomi SU7
4.3. Need Indicators Correction for the Xiaomi SU7
4.3.1. Correlation Analysis Between User Need Indicators for the Xiaomi SU7
4.3.2. Linear Regression Analysis Between User Need Indicators for the Xiaomi SU7
4.4. Need Indicator Forecasts for the Xiaomi SU7
5. Discussion
5.1. Model Validation
5.2. Analysis of Improvement Strategy of Product Design
6. Conclusions
7. Future Research Avenues
- (1)
- Firstly, augmenting the dataset to span a broader spectrum of products and user cohorts would enhance the universality of the research findings. This could entail collecting UGC from multiple platforms and regions, as well as integrating data from disparate sources, such as customer surveys and social media.
- (2)
- Secondly, it is imperative to enhance the prediction model by incorporating state-of-the-art machine learning algorithms and techniques. This could encompass exploring deep learning architectures for more accurate feature extraction and prediction, as well as devising hybrid models that amalgamate the strengths of diverse algorithms.
- (3)
- Finally, it is crucial to consider the impact of exogenous factors, such as technological advancements and regulatory modifications, on user needs. Future research should probe into how these factors interact with user needs and formulate corresponding product design and marketing adjustment strategies.
Supplementary Materials
Author Contributions
Funding
Data Availability Statement
Acknowledgments
Conflicts of Interest
References
- Li, X. Dynamic acquisition method of a user’s implicit information demand based on association rule mining. Int. J. Auton. Adapt. Commun. Syst. 2022, 15, 361–378. [Google Scholar] [CrossRef]
- Sun, H.; Guo, W.; Shao, H.Y.; Rong, B. Dynamical mining of ever-changing user requirements: A product design and improvement perspective. Adv. Eng. Inform. 2020, 46, 11. [Google Scholar] [CrossRef]
- Xia, B.H.; Sakamoto, H.; Wang, X.T.; Yamasaki, T. Packaging Design Analysis by Predicting User Preference and Semantic Attribute. ITE Trans. Media Technol. Appl. 2022, 10, 120–129. [Google Scholar] [CrossRef]
- Li, Q.X.; Yang, Y.; Li, C.J.; Zhao, G. Energy vehicle user demand mining method based on fusion of online reviews and complaint information. Energy Rep. 2023, 9, 3120–3130. [Google Scholar] [CrossRef]
- Lin, J.; Jiang, X.Y.; Li, Q.; Wang, C. A competitive intelligence acquisition framework for mining user perception from user generated content. Appl. Soft Comput. 2023, 147, 14. [Google Scholar] [CrossRef]
- Lashari, Z.A.; Ko, J.; Jang, J. Consumers’ Intention to Purchase Electric Vehicles: Influences of User Attitude and Perception. Sustainability 2021, 13, 6778. [Google Scholar] [CrossRef]
- Zou, P.Y.; Zhang, B.; Yi, Y.; Wang, Z.H. How does travel satisfaction affect preference for shared electric vehicles? An empirical study using large-scale monitoring data and online text mining. Transp. Policy 2024, 146, 59–71. [Google Scholar] [CrossRef]
- Tien, T.L. A research on the grey prediction model GM(1,n). Appl. Math. Comput. 2012, 218, 4903–4916. [Google Scholar] [CrossRef]
- Yang, L.; Liu, Y.Z.; Jiang, Y.C.; Wu, L.; Sun, J.S. Predicting personalized grouping and consumption: A collaborative evolution model. Knowl.-Based Syst. 2021, 228, 20. [Google Scholar] [CrossRef]
- Zhou, Y.; Zhang, Q.; Singh, V.P.; Xiao, M.Z. General correlation analysis: A new algorithm and application. Stoch. Environ. Res. Risk Assess. 2015, 29, 665–677. [Google Scholar] [CrossRef]
- Höskuldsson, A. Common framework for linear regression. Chemom. Intell. Lab. Syst. 2015, 146, 250–262. [Google Scholar] [CrossRef]
- Liu, Y.N.; Shen, Y.M. Personal Tastes vs. Fashion Trends: Predicting Ratings Based on Visual Appearances and Reviews. IEEE Access. 2018, 6, 16655–16664. [Google Scholar] [CrossRef]
- Yusuf-Asaju, A.W.; Dahalin, Z.B.; Ta’a, A. Towards Real-Time Customer Satisfaction Prediction Model for Mobile Internet Networks; Recent Trends in Data Science and Soft Computing; Springer Publishing: New York, NY, USA, 2019; pp. 95–104. [Google Scholar]
- Lee, C.; Xu, X.; Lin, C.-C. Using Online User-Generated Reviews to Predict Offline Box-Office Sales and Online DVD Store Sales in the O2O Era. J. Theor. Appl. Electron. Commer. Res. 2019, 14, 68–83. [Google Scholar] [CrossRef]
- Dou, R.; Li, W.; Nan, G. An integrated approach for dynamic customer requirement identification for product development. Enterp. Inf. Syst. 2019, 13, 448–466. [Google Scholar] [CrossRef]
- Ali, M.M.; Doumbouya, M.B.; Louge, T.; Rai, R.; Karray, M.H. Ontology-based approach to extract product’s design features from online customers’ reviews. Comput. Ind. 2020, 116, 103175. [Google Scholar] [CrossRef]
- Zhang, X.; Yang, M.; Su, J.; Yang, W.; Qiu, K. Research on product color design decision driven by brand image. Color Res. Appl. 2020, 45, 1202–1216. [Google Scholar] [CrossRef]
- Jiang, H.; Sabetzadeh, F.; Kwong, C.K. Dynamic analysis of customer needs using opinion mining and fuzzy time series approaches. In Proceedings of the 2021 IEEE International Conference on Fuzzy Systems (FUZZ-IEEE), Luxembourg, 11–14 July 2021; pp. 1–6. [Google Scholar]
- Ostasz, G.; Siwiec, D.; Pacana, A. Universal Model to Predict Expected Direction of Products Quality Improvement. Energies 2022, 15, 1751. [Google Scholar] [CrossRef]
- Cheng, F.; Yu, S.; Chu, J.; Fan, J.; Hu, Y. Customer satisfaction-oriented product configuration approach based on online product reviews. Multimed. Tools Appl. 2022, 81, 4413–4433. [Google Scholar] [CrossRef]
- Wang, S.; Wang, Y.; Hu, L.; Zhang, X.; Zhang, Q.; Sheng, Q.Z.; Orgun, M.A.; Cao, L.; Lian, D. Modeling User Demand Evolution for Next-Basket Prediction. IEEE Trans. Knowl. Data Eng. 2023, 35, 11585–11598. [Google Scholar] [CrossRef]
- Luo, H.; Song, W.; Zhou, W.; Lin, X.; Yu, S. An Analysis Framework to Reveal Automobile Users’ Preferences from Online User-Generated Content. Sustainability 2023, 15, 13336. [Google Scholar] [CrossRef]
- Zhang, N.; Qin, L.; Yu, P.; Gao, W.; Li, Y. Grey-Markov model of user demands prediction based on online reviews. J. Eng. Des. 2023, 34, 487–521. [Google Scholar] [CrossRef]
- Fan, Z. E-Commerce Data Mining Analysis based on User Preferences and Assiciation Rules. Scalable Comput. Pract. Exp. 2024, 25, 1765–1772. [Google Scholar] [CrossRef]
- Li, F.; Chen, C.-H.; Liu, Y.; Chang, D.; Cui, J.; Sourina, O. Autoencoder-enabled eye-tracking data analytics for objective assessment of user preference in humanoid robot appearance design. Expert Syst. Appl. 2024, 249, 123857. [Google Scholar] [CrossRef]
- Luo, S.; Shan, P.; Bian, Z.; Lin, H.; Zhang, Y.; Cui, Z.; Shen, C.; Wang, L. Effects of product personalisation degree on user perception in car front design. J. Eng. Des. 2024, 35, 944–971. [Google Scholar] [CrossRef]
- Dinaryanti, R.F.; Indrawati. Analysis Of Consumer Preferences In Choosing Smartphone Through User Comments On Youtube. Qual. Access Success 2024, 25, 323–330. [Google Scholar] [CrossRef]
- Li, S.G.; Zhang, Y.Q.; Li, Y.M.; Yu, Z.X. The user preference identification for product improvement based on online comment patch. Electron. Commer. Res. 2021, 21, 423–444. [Google Scholar] [CrossRef]
- Guo, F.; Li, F.X.; Nagamachi, M.; Hu, M.C.; Li, M.M. Research on color optimization of tricolor product considering color harmony and users’ emotion. Color Res. Appl. 2020, 45, 156–171. [Google Scholar] [CrossRef]
- Li, X.R.; Hou, X.G.; Yang, M.; Zhang, L.; Guo, H.Y.; Wang, L.Y.; Li, X.Y. A method of constructing an inspiration library driven by user-perceived preference evaluation data for biologically inspired design. Adv. Eng. Inform. 2022, 52, 15. [Google Scholar] [CrossRef]
- Gupta, R.K.; Gurumoorthy, B. Feature-based ontological framework for semantic interoperability in product development. Adv. Eng. Inform. 2021, 48, 23. [Google Scholar] [CrossRef]
- Naab, T.K.; Sehl, A. Studies of user-generated content: A systematic review. Journalism 2017, 18, 1256–1273. [Google Scholar] [CrossRef]
- dos Santos, M.L.B. The “so-called” UGC: An updated definition of user-generated content in the age of social media. Online Inf. Rev. 2022, 46, 95–113. [Google Scholar] [CrossRef]
- Lee, J.Y.H.; Yang, C.S.; Chen, S.Y. Understanding Customer Opinions From Online Discussion Forums: A Design Science Framework. Eng. Manag. J. 2017, 29, 235–243. [Google Scholar] [CrossRef]
- Wang, X.Z.; Liu, A.; Kara, S. Constructing Product Usage Context Knowledge Graph Using User-Generated Content for User-Driven Customization. J. Mech. Des. 2023, 145, 14. [Google Scholar] [CrossRef]
- Ng, C.Y.; Law, K.M.Y. Investigating consumer preferences on product designs by analyzing opinions from social networks using evidential reasoning. Comput. Ind. Eng. 2020, 139, 11. [Google Scholar] [CrossRef]
- Chan, K.Y.; Kwong, C.K.; Kremer, G.E. Predicting customer satisfaction based on online reviews and hybrid ensemble genetic programming algorithms. Eng. Appl. Artif. Intell. 2020, 95, 13. [Google Scholar] [CrossRef]
- Yan, M.; Lou, X.R.; Chan, C.A.; Wang, Y.; Jiang, W. A semantic and emotion-based dual latent variable generation model for a dialogue system. CAAI T. Intell. Technol. 2023, 8, 319–330. [Google Scholar] [CrossRef]
- Qi, J.Y.; Zhang, Z.P.; Jeon, S.M.; Zhou, Y.Q. Mining customer requirements from online reviews: A product improvement perspective. Inf. Manag. 2016, 53, 951–963. [Google Scholar] [CrossRef]
- Yu, Y.Y.; Chen, J.Q.; Mehraliyev, F.; Hu, S.K.; Wang, S.B.; Liu, J. Exploring the diversity of emotion in hospitality and tourism from big data: A novel sentiment dictionary. Int. J. Contemp. Hosp. Manag. 2024, 36, 4237–4257. [Google Scholar] [CrossRef]
- Jing, L.T.; Yang, J.W.; Ma, J.F.; Jing, X.; Li, J.Q.; Jiang, S.F. An integrated implicit user preference mining approach for uncertain conceptual design decision-making: A pipeline inspection trolley design case study. Knowl. Based Syst. 2023, 270, 27. [Google Scholar] [CrossRef]
- Qin, J.W.; Jiang, Y.P. Recommender resources based on acquiring user’s requirement and exploring user’s preference with Word2Vec model in web service. Int. J. Internet Protoc. Technol. 2019, 12, 144–152. [Google Scholar] [CrossRef]
- Ma, J.; Gong, Y.Q.; Xu, W.X. Predicting User Preference for Innovative Features in Intelligent Connected Vehicles from a Cultural Perspective. World Electr. Veh. J. 2024, 15, 130. [Google Scholar] [CrossRef]
- Yakubu, H.; Kwong, C.K. Forecasting the importance of product attributes using online customer reviews and Google Trends. Technol. Forecast. Soc. Change 2021, 171, 13. [Google Scholar] [CrossRef]
- Nasrabadi, M.A.; Beauregard, Y.; Ekhlassi, A. The implication of user-generated content in new product development process: A systematic literature review and future research agenda. Technol. Forecast. Soc. Change 2024, 206, 19. [Google Scholar] [CrossRef]
- Kim, D.; Seo, D.; Cho, S.; Kang, P. Multi-co-training for document classification using various document representations: TF-IDF, LDA, and Doc2Vec. Inf. Sci. 2019, 477, 15–29. [Google Scholar] [CrossRef]
- Church, K.W. Emerging Trends Word2Vec. Nat. Lang. Eng. 2017, 23, 155–162. [Google Scholar] [CrossRef]
- Lee, C.; Jeon, D.; Ahn, J.M.; Kwon, O. Navigating a product landscape for technology opportunity analysis: A word2vec approach using an integrated patent-product database. Technovation 2020, 96–97, 102140. [Google Scholar] [CrossRef]
- Sinaga, K.P.; Yang, M.S. Unsupervised K-Means Clustering Algorithm. IEEE Access 2020, 8, 80716–80727. [Google Scholar] [CrossRef]
- Yang, L.; Li, Y.; Wang, J.; Sherratt, R.S. Sentiment Analysis for E-Commerce Product Reviews in Chinese Based on Sentiment Lexicon and Deep Learning. IEEE Access 2020, 8, 23522–23530. [Google Scholar] [CrossRef]
- Wang, Z.Q.; Qin, Y.T. The Impact of Shanghai Epidemic, China, 2022 on Public Psychology: A Sentiment Analysis of Microblog Users by Data Mining. Sustainability 2022, 14, 9649. [Google Scholar] [CrossRef]
- Chen, X.H.; Chen, S.C.; Xue, H. Large correlation analysis. Appl. Math. Comput. 2011, 217, 9041–9052. [Google Scholar] [CrossRef]
- Rashid, A.; Zeb, M.A.; Rashid, A.; Anwar, S.; Joaquim, F.; Halim, Z. Conceptualization of smartphone usage and feature preferences among various demographics. Clust. Comput. 2020, 23, 1855–1873. [Google Scholar] [CrossRef]
- Ari, B.; Güvenir, H.A. Clustered linear regression. Knowl. Based Syst. 2002, 15, 169–175. [Google Scholar] [CrossRef]
- Luo, S.J.; Zhang, Y.F.; Zhang, J.; Xu, J.H. A User Biology Preference Prediction Model Based on the Perceptual Evaluations of Designers for Biologically Inspired Design. Symmetry 2020, 12, 1860. [Google Scholar] [CrossRef]
- Zeng, B.; Duan, H.M.; Zhou, Y.F. A new multivariable grey prediction model with structure compatibility. Appl. Math. Model. 2019, 75, 385–397. [Google Scholar] [CrossRef]
- Cheng, Y.; Li, Y.P.; Zhang, N.; Chen, L.J.; Cao, J. A knowledge graph-enabled multi-domain mapping approach supporting product rapid design: A case study of new energy vehicles. Adv. Eng. Inform. 2024, 62, 19. [Google Scholar] [CrossRef]
- Hou, X.G.; Gou, B.C.; Chen, D.K.; Chu, J.J.; Ding, N.; Ma, L. A method to assist designers in optimizing the exterior styling of vehicles based on key features. Expert Syst. Appl. 2024, 254, 14. [Google Scholar] [CrossRef]


| Author | Reference | Year | Research Methods and Contents |
|---|---|---|---|
| Liu et al. | [12] | 2018 | Proposed a visually-aware temporal rating model with topics using review text to help mine visual dynamics and non-visual features for a rating prediction task. |
| Yusuf-Asaju et al. | [13] | 2019 | Employed machine learning algorithms for the prediction of customer satisfaction. |
| Lee et al. | [14] | 2019 | Proposed predictive global sensitivity analysis based on user-generated reviews for the prediction of the demand for hyperdifferentiated products. |
| Dou et al. | [15] | 2019 | Integrated a fuzzy Kano model and optimized gray model for the prediction of dynamic customer requirements and used House of Quality to calculate the optimal improvement plan. |
| Ali et al. | [16] | 2020 | Proposed an ontology-based method to extract the design features of products from online customer reviews. |
| Zhang et al. | [17] | 2020 | Used gray theory combined with Kansei engineering to mine the macro- and microscopic factors in product color design decision process based on the product color brand image. |
| Jiang et al. | [18] | 2021 | Used opinion mining and a fuzzy time-series method to predict the weights of customer needs. |
| Ostasz et al. | [19] | 2022 | Used the naïve Bayesian classifier for the prediction of the direction of product improvement. |
| Cheng et al. | [20] | 2022 | Proposed a model based on the quantitative Kano model and the customer satisfaction degree for the prediction of the customer satisfaction degree of the new component scheme. |
| Wang et al. | [21] | 2023 | Proposed an evolving demand satisfaction (EvoDESA) model to model a user’s demand evolution for next-basket prediction. |
| Luo et al. | [22] | 2023 | Constructed an importance–satisfaction gap analysis (ISGA) model to obtain the changing trend of Chinese car users’ needs from UGC. |
| Zhang et al. | [23] | 2023 | Used the gray–Markov model to predict the needs of automobile and mobile phone users from online reviews. |
| Fan et al. | [24] | 2024 | Studied the data of e-commerce product recommendations from the perspective of user preference and association rules. |
| Li et al. | [25] | 2024 | Developed a novel eye-tracking-based assessment tool to investigate user preference towards humanoid robot appearance design. |
| Luo et al. | [26] | 2024 | Used the chaos theory and cvxEDA algorithm to extract the features of the front face of automobiles and study the relationship between them and user perception. |
| Dinaryanti et al. | [27] | 2024 | Used topic modelling with the LDA algorithm and sentiment analysis with the naïve Bayes algorithm to analyze the factors that consumers consider when choosing smartphones. |
| User Need | Product Feature Keywords |
|---|---|
| , , back row , , , , , , , | |
| , , , , , , , , , , , , , , , , , , , , , , , , , , , , , , , , , , , , , , | |
| , , , , , , , , , , , , , , , , ,, , , , , soft , , ecology , , relaxed , science and technology , navigation , noise | |
| , , shelter control panel , , , , , , , , , display screen , , , , , shock absorption , icebox , ventilate , , |
| Periods | ||||
|---|---|---|---|---|
| 1 | 0.0484 | 0.0733 | 0.0535 | 0.0290 |
| 2 | 0.0839 | 0.1453 | 0.0363 | 0.0685 |
| 3 | 0.0486 | 0.0797 | 0.0267 | 0.0340 |
| 4 | 0.0623 | 0.0612 | 0.0380 | 0.0256 |
| 5 | 0.0574 | 0.0769 | 0.0361 | 0.0439 |
| Periods | ) | |||
|---|---|---|---|---|
| 1 | 0.4542 | 0.5079 | 0.3595 | 0.3984 |
| 2 | 0.6084 | 0.8428 | 1 | 0.5547 |
| 3 | 0.5938 | 0.3029 | 0.5128 | 0.1476 |
| 4 | 0.2695 | 0.5776 | 0.7772 | 0.3972 |
| 5 | 0.4844 | 0.5298 | 0.5770 | 0 |
| Average | Standard Deviation | |||||
|---|---|---|---|---|---|---|
| 0.031 | 0.015 | 1 | ||||
| 0.066 | 0.016 | 0.917 * | 1 | |||
| 0.029 | 0.007 | 0.551 | 0.331 | 1 | ||
| 0.013 | 0.005 | 0.963 ** | 0.977 ** | 0.340 | 1 |
| Average | Standard Deviation | |||||
|---|---|---|---|---|---|---|
| 0.031 | 0.015 | 1 | ||||
| 0.066 | 0.016 | 0.781 | 1 | |||
| 0.029 | 0.007 | 0.591 | 0.935 * | 1 | ||
| 0.013 | 0.005 | 0.689 | 0.963 ** | 0.880 * | 1 |
| Periods | ||||||||
|---|---|---|---|---|---|---|---|---|
| 1 | 0.0281 | 0.0378 | 0.0535 | 0.0478 | 0.4542 | 0.4178 | 0.5161 | 0.5061 |
| 2 | 0.0591 | 0.0778 | 0.0363 | 0.1015 | 0.6084 | 0.6910 | 0.9781 | 0.8624 |
| 3 | 0.0327 | 0.0440 | 0.0267 | 0.0824 | 0.5938 | 0.804 | 0.3147 | 0.2975 |
| 4 | 0.0469 | 0.0679 | 0.0380 | 0.0734 | 0.2695 | 0.6362 | 0.6247 | 0.6348 |
| 5 | 0.0409 | 0.0871 | 0.0361 | 0.0785 | 0.4844 | 0.5944 | 0.5110 | 0.5827 |
| Periods | ||||||||
|---|---|---|---|---|---|---|---|---|
| 6 | 0.035 | 0.082 | 0.037 | 0.064 | 0.318 | 0.572 | 0.334 | 0.466 |
| 7 | 0.031 | 0.088 | 0.038 | 0.057 | 0.256 | 0.531 | 0.234 | 0.417 |
| 8 | 0.027 | 0.093 | 0.039 | 0.049 | 0.197 | 0.490 | 0.139 | 0.369 |
| 9 | 0.023 | 0.098 | 0.040 | 0.042 | 0.140 | 0.451 | 0.047 | 0.322 |
| 10 | 0.015 | 0.104 | 0.041 | 0.034 | 0.087 | 0.413 | −0.040 | 0.276 |
| Feature Points | Connotation Explanation | Marking and Calculation |
|---|---|---|
| The ratio of the distance between the highest point of the spoiler and the height of the taillights to the height of the taillights. | ||
| The ratio of the height of the taillights to the distance between the bottom of the trunk and the taillights. | ||
| The ratio of the maximum height to the minimum height of the taillights. | ||
| The angle of the outer corner of the taillights. | ||
| The inner corner angle of the taillights. | ||
| The edge corner angle of the taillights. |
| Qin PLUS | Model 3 | Magotan | AION S | Hong Qi H5 | Xiaomi SU7 | |
|---|---|---|---|---|---|---|
| 2.80 | 2.83 | 2.74 | 2.72 | 2.79 | 2.68 | |
| 0.42 | 0.44 | 0.42 | 0.46 | 0.43 | 0.48 | |
| 1.98 | 1.85 | 2.04 | 1.89 | 1.92 | 2.10 | |
| 144.25° | 145.02° | 144.28° | 144.04° | 143.56° | 147.56° | |
| 145.46° | 147.25° | 148.34° | 145.86° | 144.78° | 143.58° | |
| 45.96° | 47.25° | 46.87° | 49.25° | 48.36° | 43.94° |
Disclaimer/Publisher’s Note: The statements, opinions and data contained in all publications are solely those of the individual author(s) and contributor(s) and not of MDPI and/or the editor(s). MDPI and/or the editor(s) disclaim responsibility for any injury to people or property resulting from any ideas, methods, instructions or products referred to in the content. |
© 2024 by the authors. Published by MDPI on behalf of the World Electric Vehicle Association. Licensee MDPI, Basel, Switzerland. This article is an open access article distributed under the terms and conditions of the Creative Commons Attribution (CC BY) license (https://creativecommons.org/licenses/by/4.0/).
Share and Cite
Liu, L.; Ma, B. User Need Prediction Based on a Small Amount of User-Generated Content—A Case Study of the Xiaomi SU7. World Electr. Veh. J. 2024, 15, 584. https://doi.org/10.3390/wevj15120584
Liu L, Ma B. User Need Prediction Based on a Small Amount of User-Generated Content—A Case Study of the Xiaomi SU7. World Electric Vehicle Journal. 2024; 15(12):584. https://doi.org/10.3390/wevj15120584
Chicago/Turabian StyleLiu, Lingling, and Biao Ma. 2024. "User Need Prediction Based on a Small Amount of User-Generated Content—A Case Study of the Xiaomi SU7" World Electric Vehicle Journal 15, no. 12: 584. https://doi.org/10.3390/wevj15120584
APA StyleLiu, L., & Ma, B. (2024). User Need Prediction Based on a Small Amount of User-Generated Content—A Case Study of the Xiaomi SU7. World Electric Vehicle Journal, 15(12), 584. https://doi.org/10.3390/wevj15120584