
High-Accuracy, High-Efficiency, and Comfortable Car-Following Strategy Based on TD3 for Wide-to-Narrow Road Sections

Abstract
:1. Introduction
2. Methods and Data
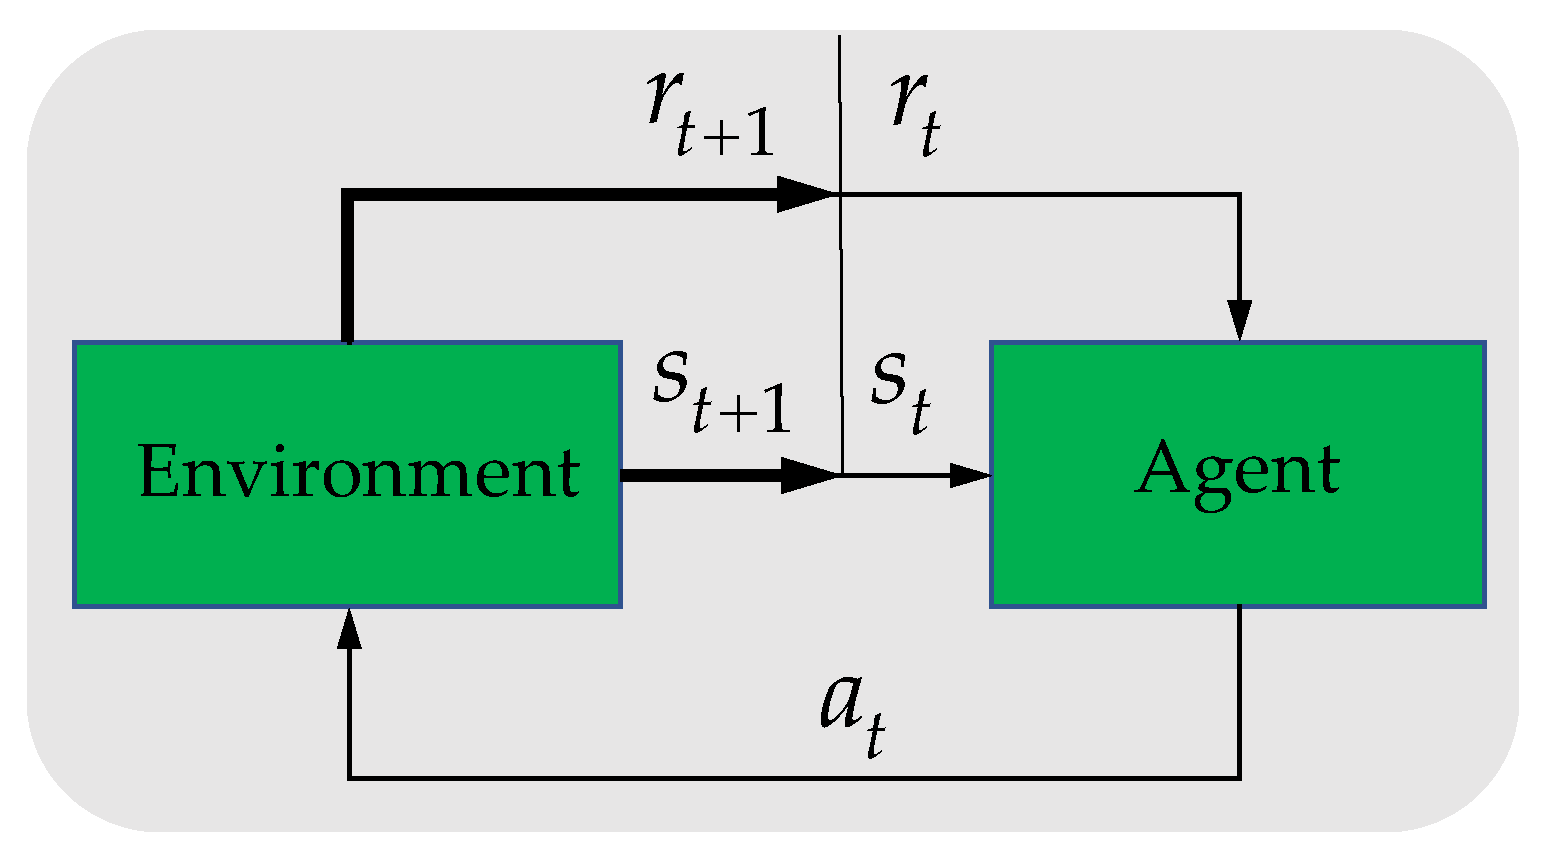
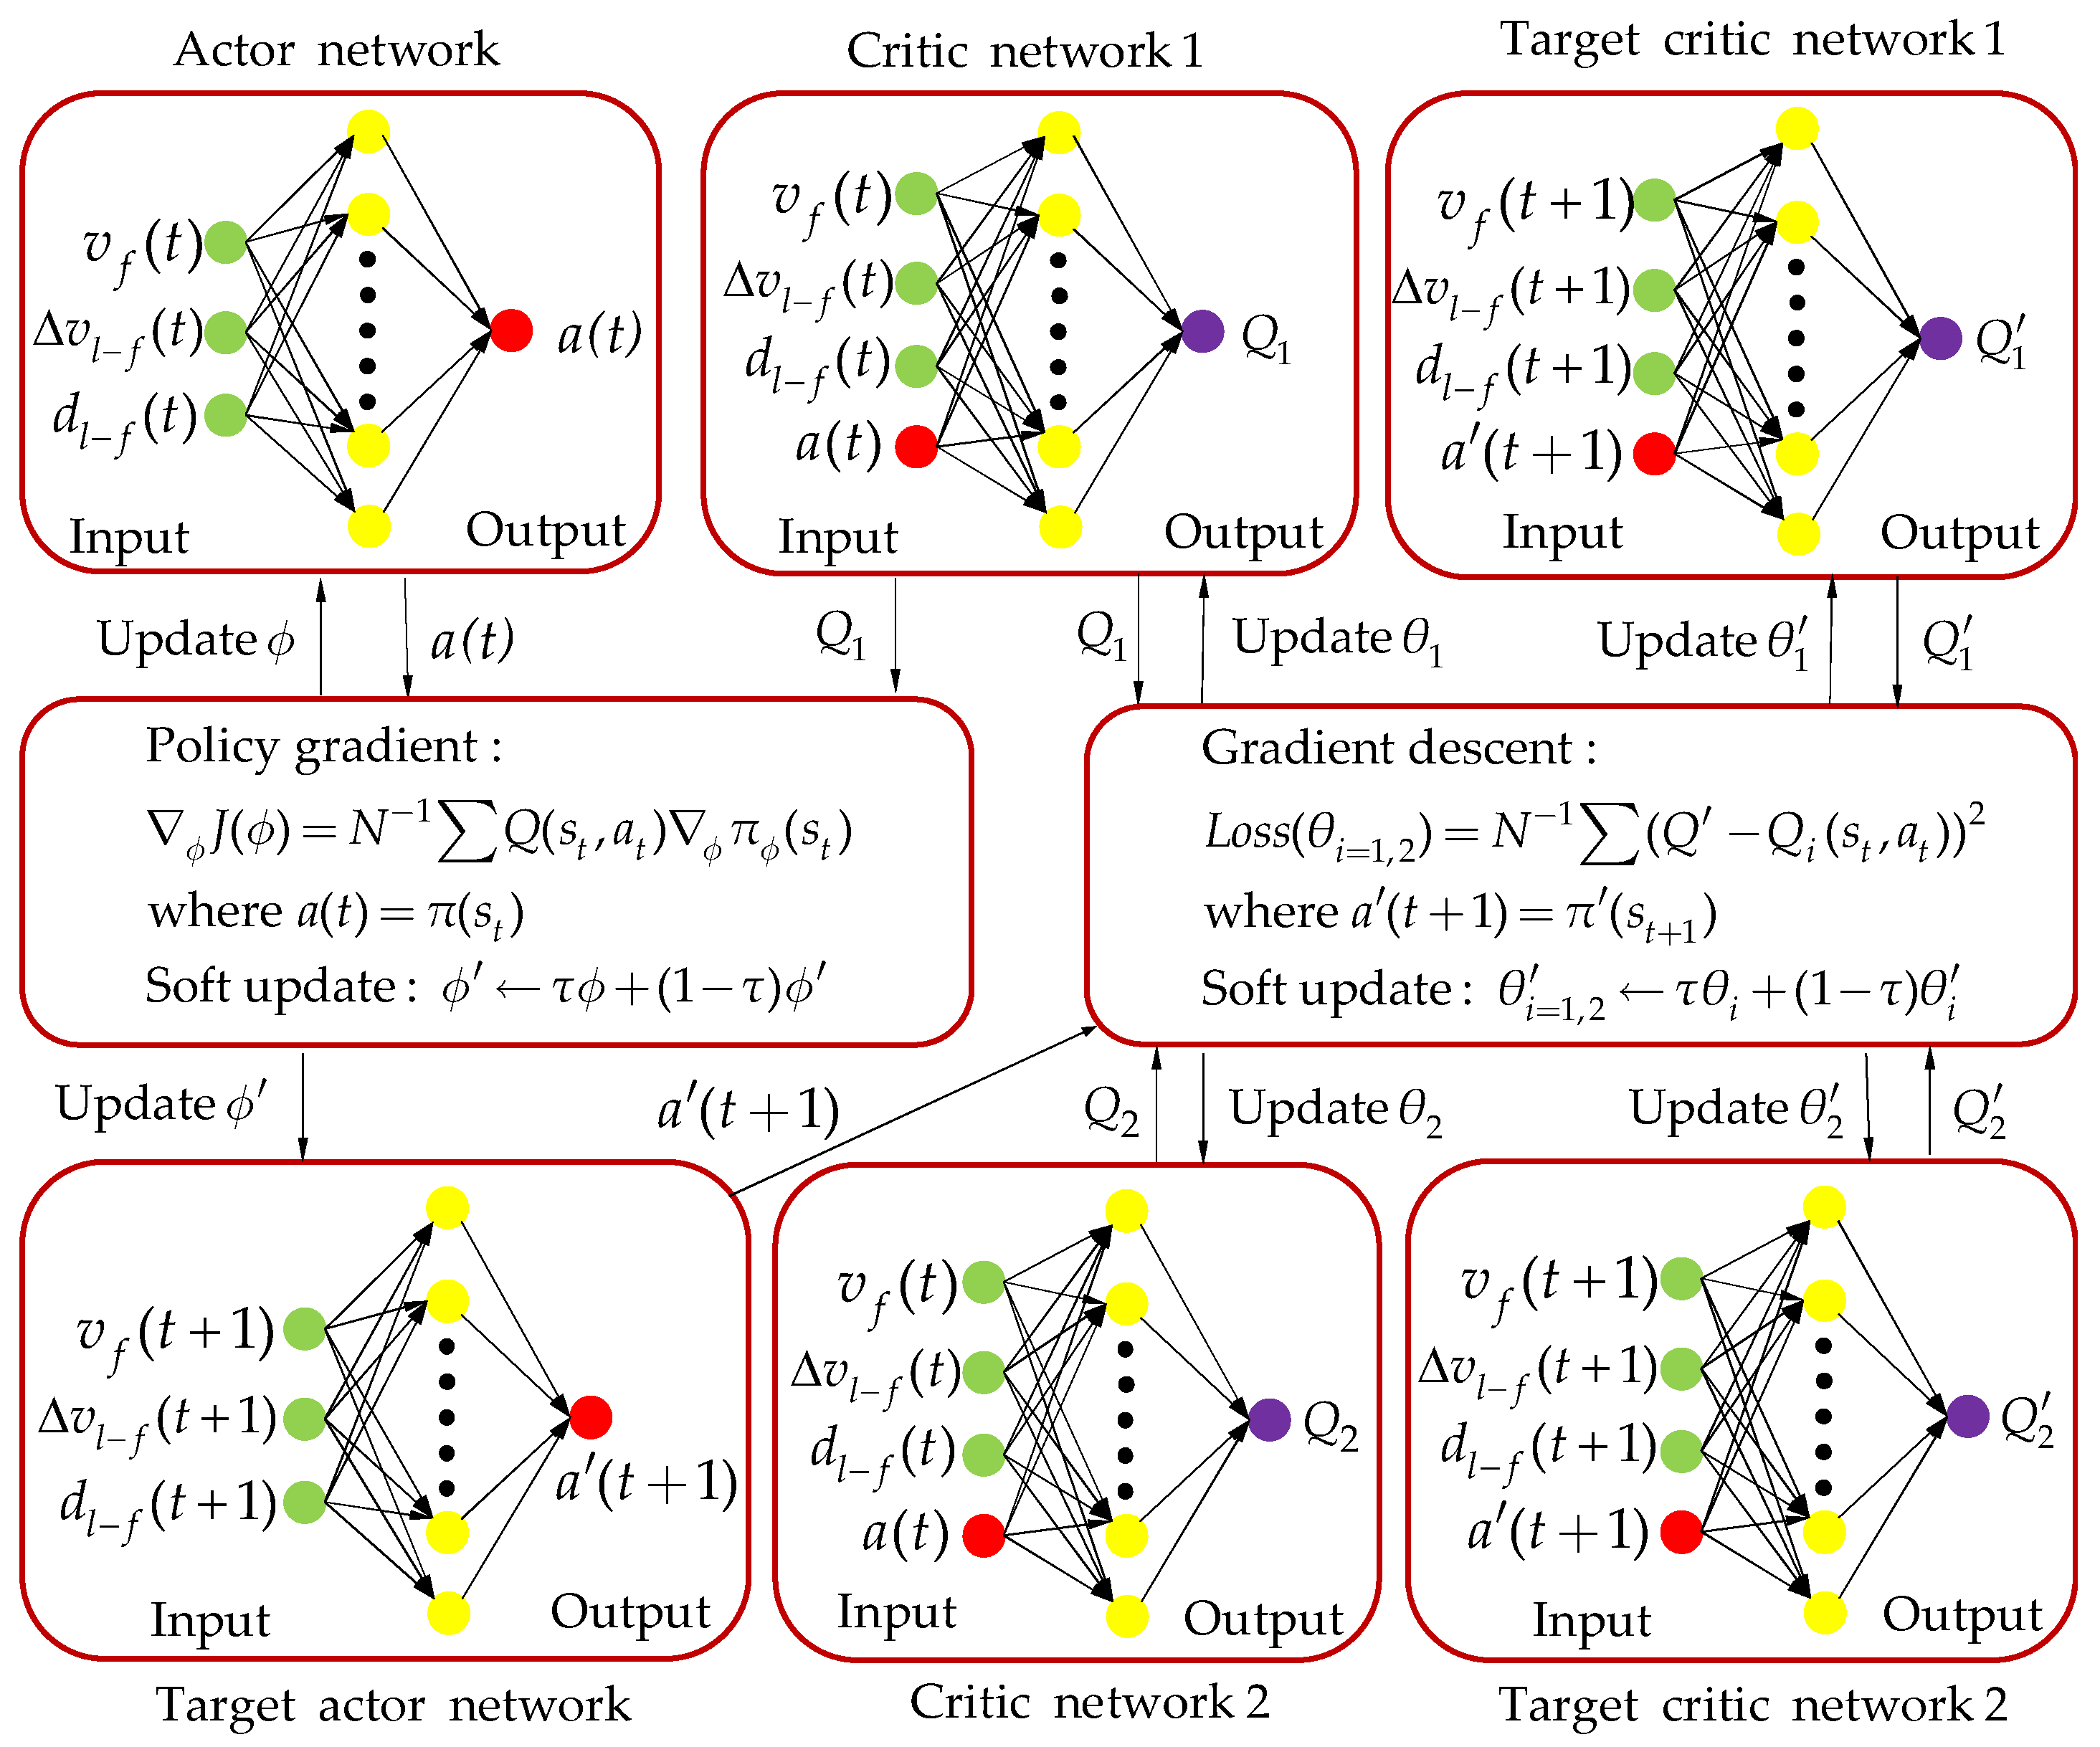
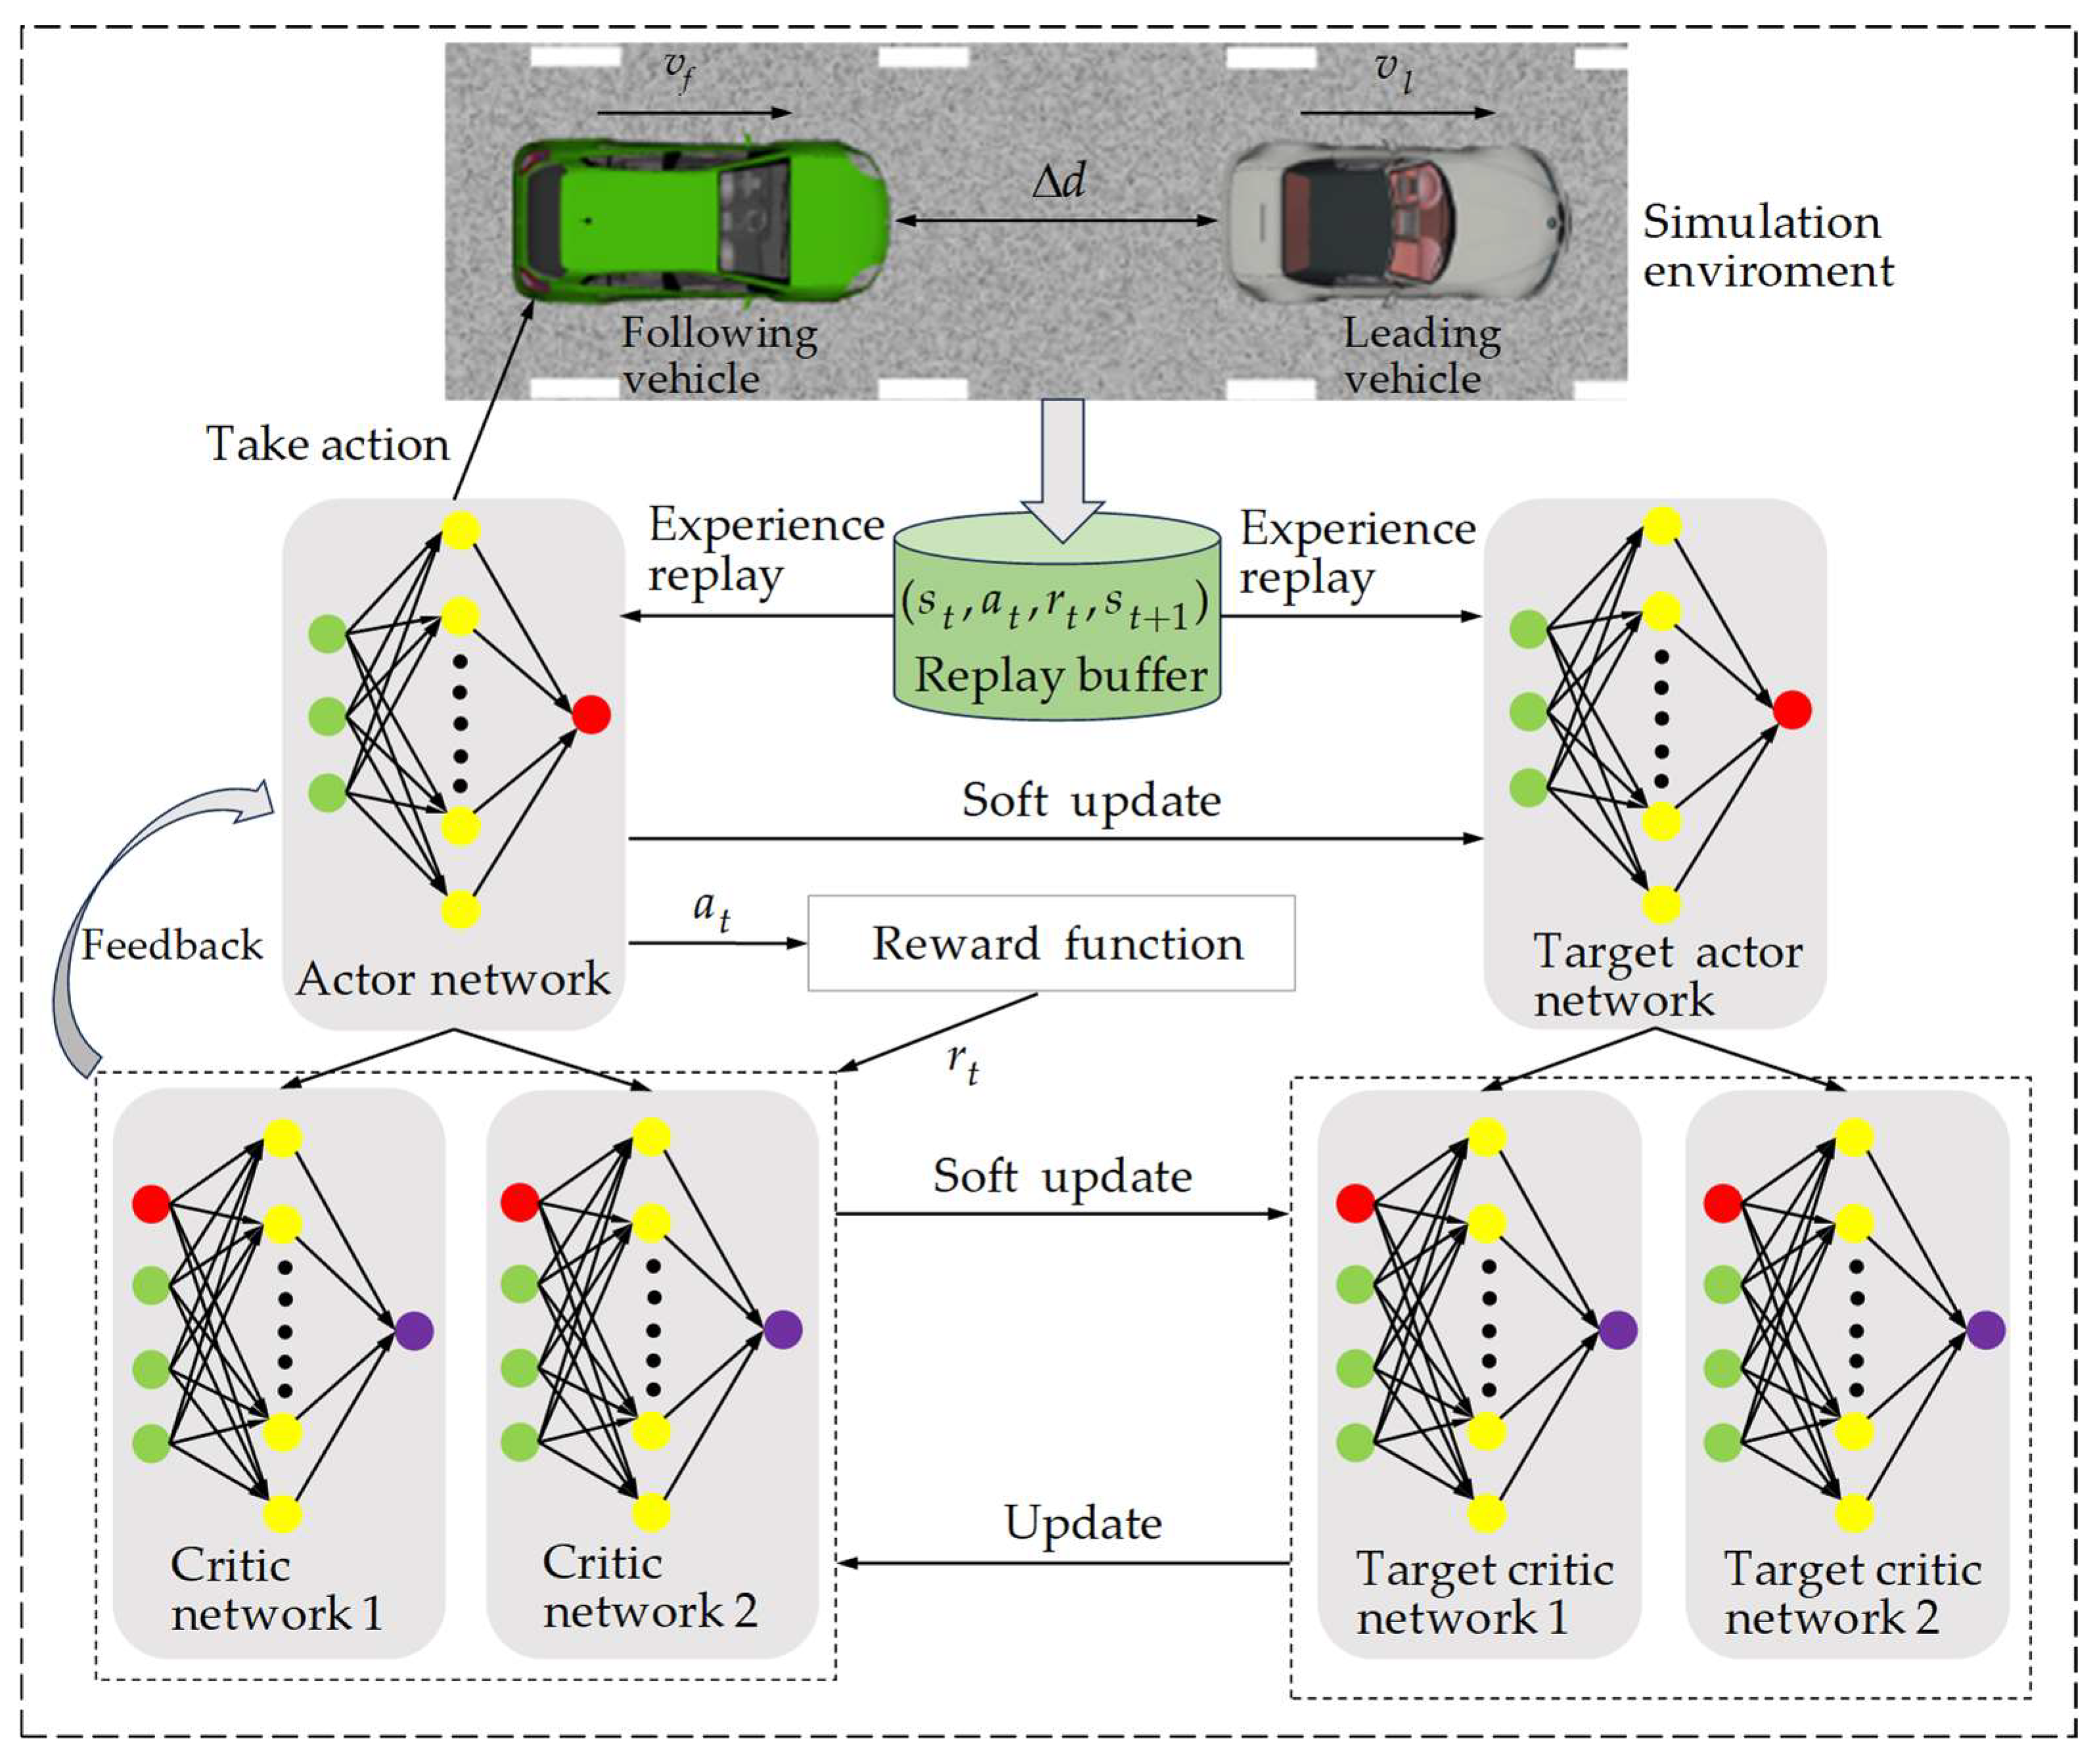
2.1. CF Strategy Based on TD3
2.2. Evaluation Metrics for Car-Following Behavior
2.3. Reward Function
| Algorithm 1: Car-Following Strategy Based on TD3 |
| Initialize critic networks , and actor network With random parameters , , Initialize target networks , , Initialize replay buffer for episode = 1 to do Initialize random process for action exploration Receive initial state for , do Choose action based on current policy and noise: , Execute action , obtain the reward , and enter the next state Store the state transition sequence in the replay buffer Randomly take a small batch of samples from the replay buffer: , Calculate based on the temporal difference: Update critic networks: if mod then Update actor network: Update target networks: , end if end for end for |
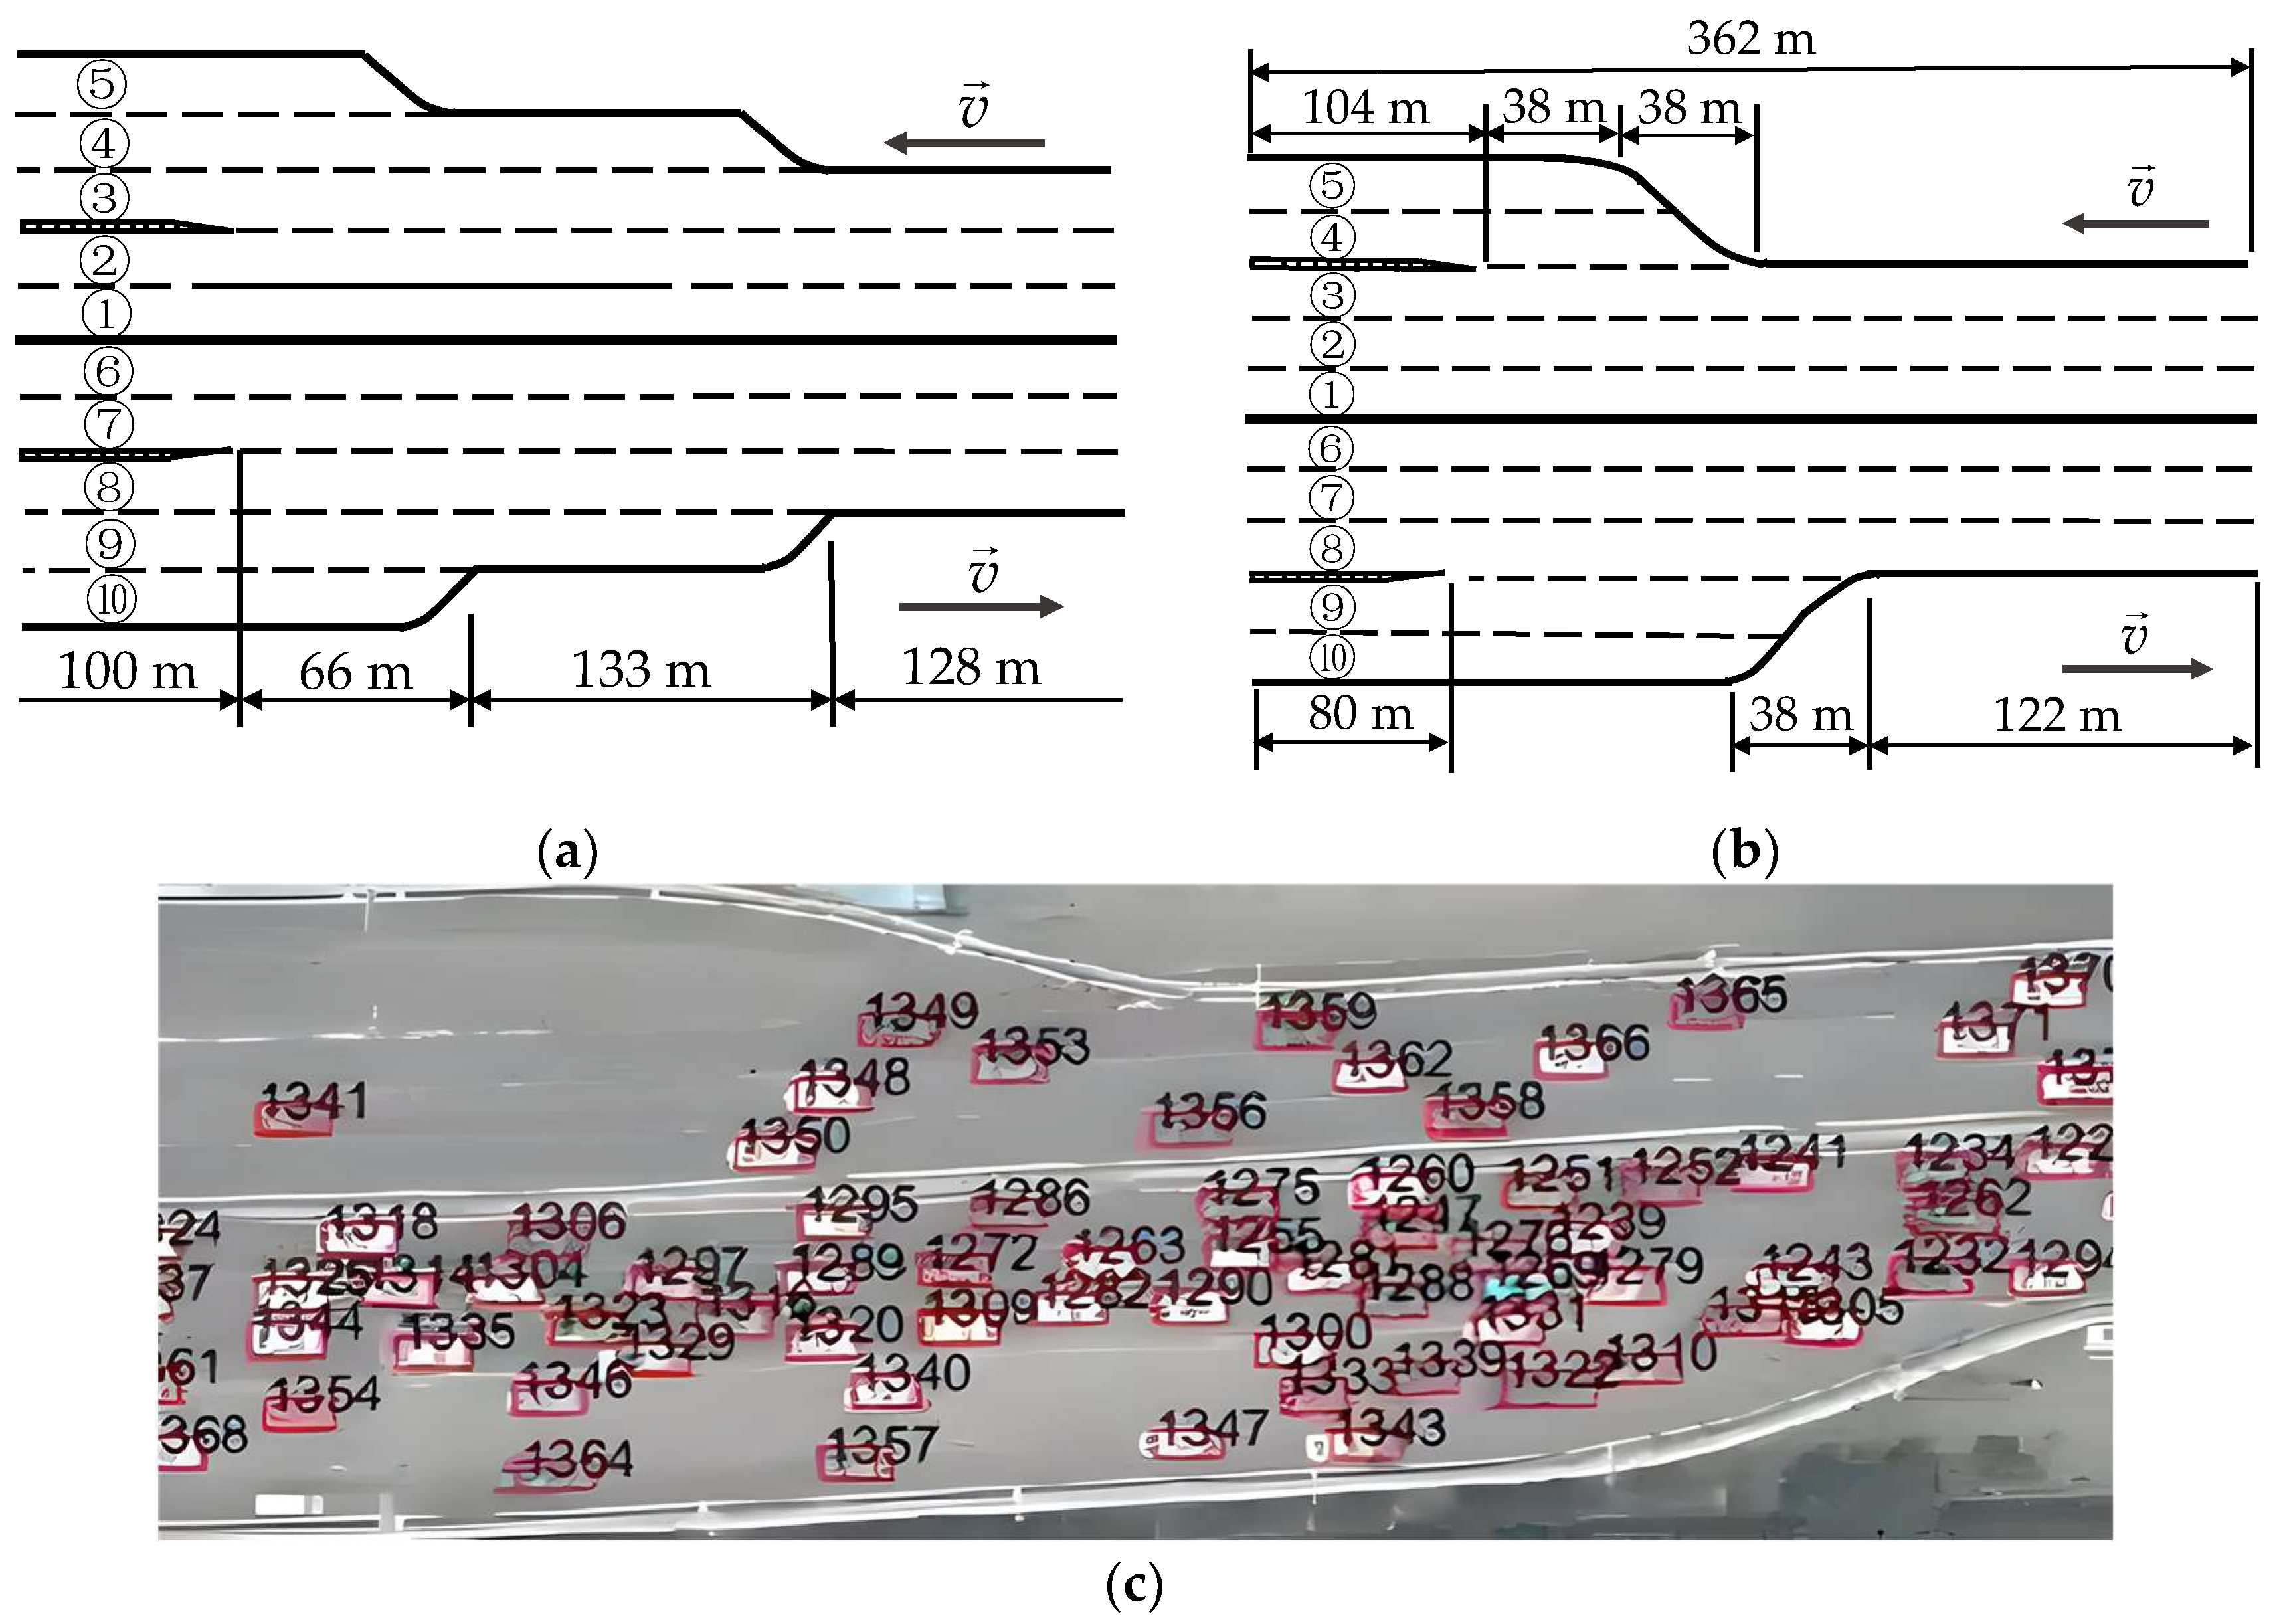
2.4. Data
3. Results and Discussion
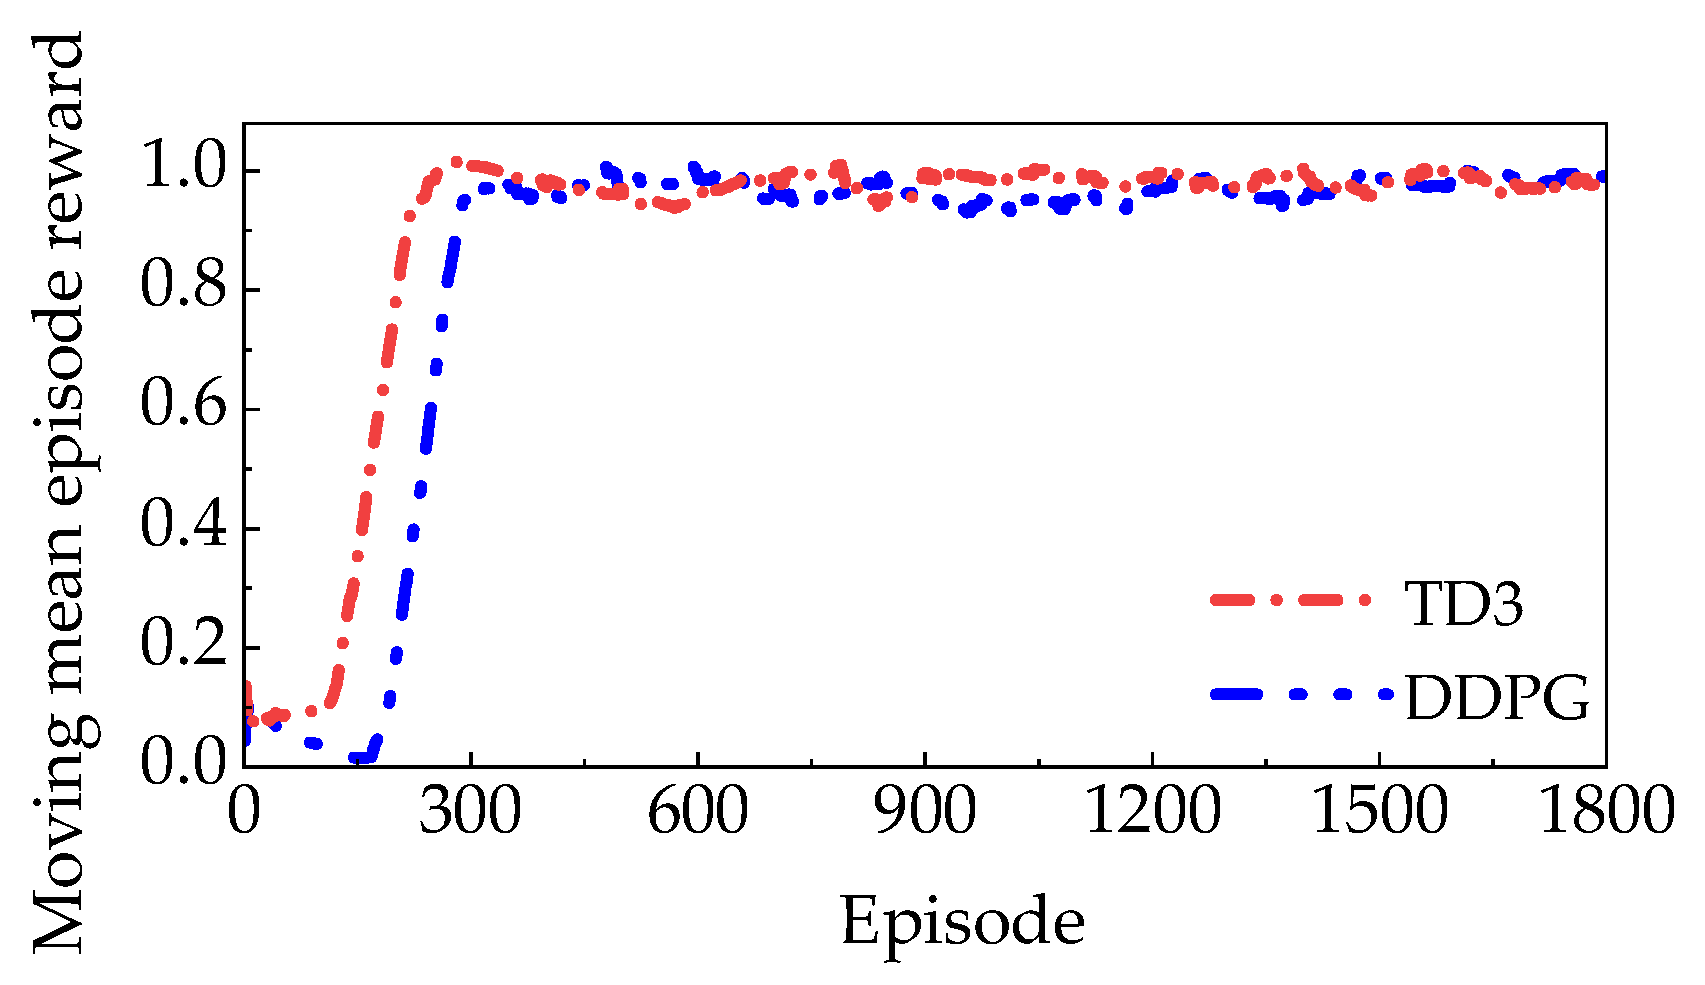
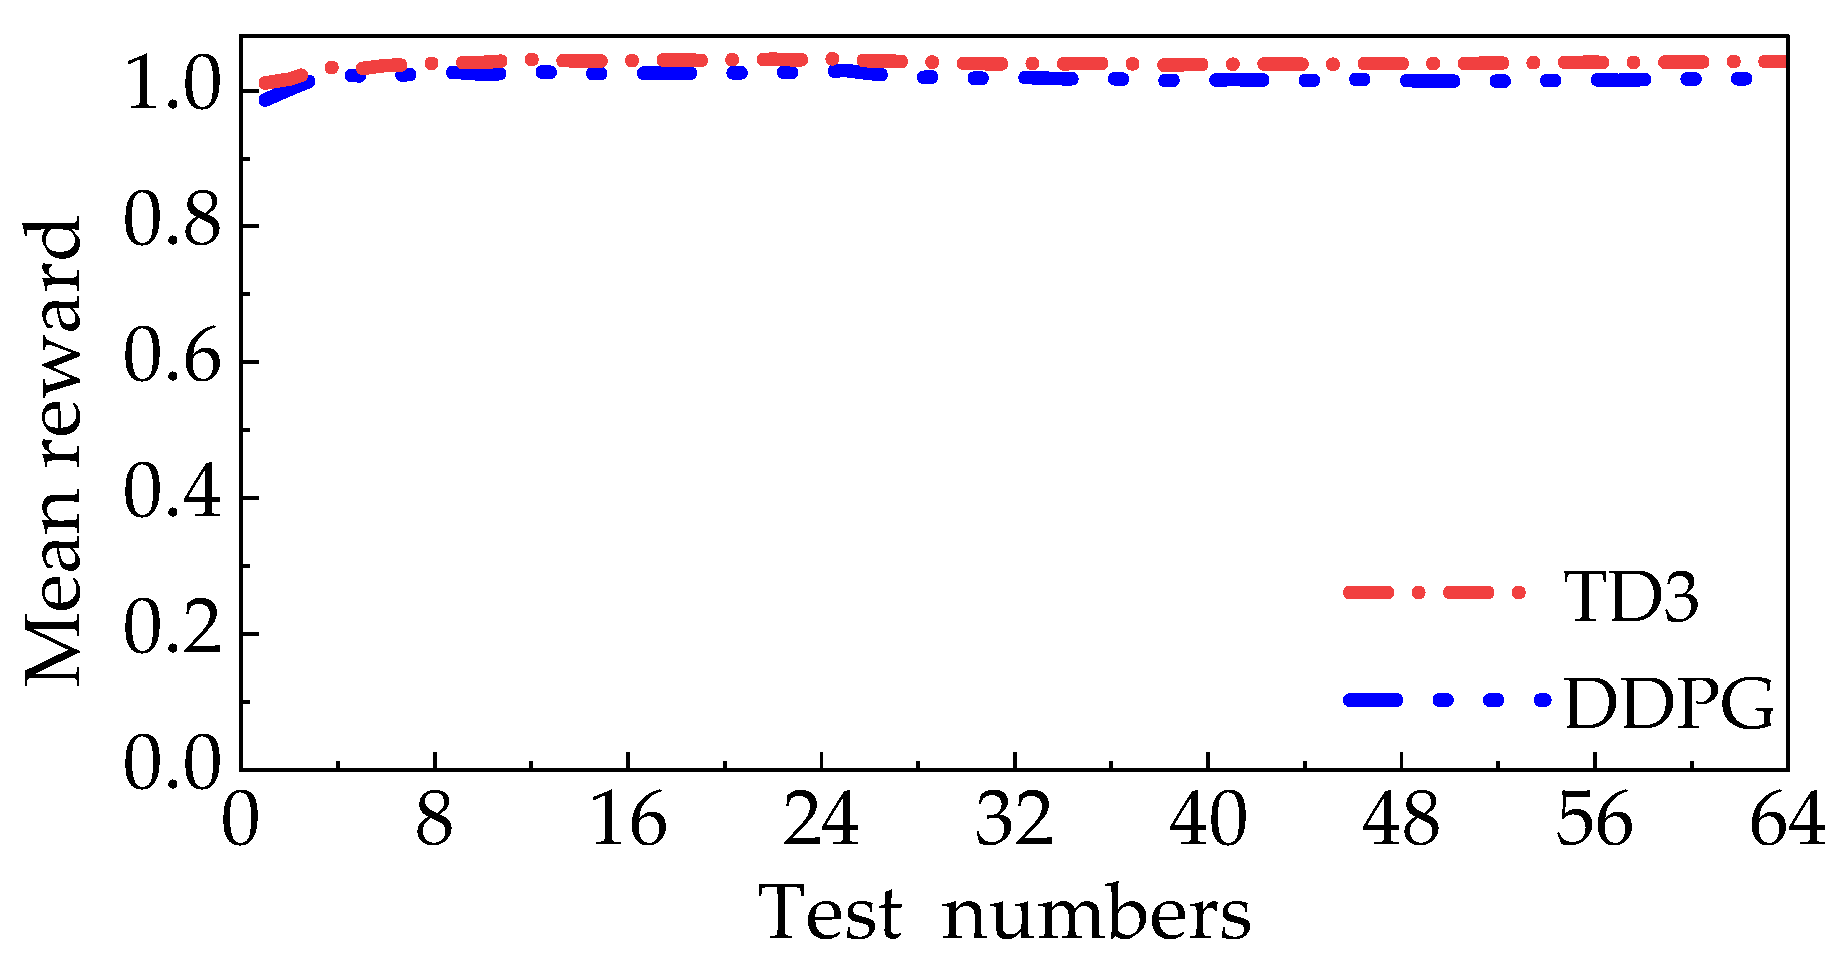
3.1. Strategies Training
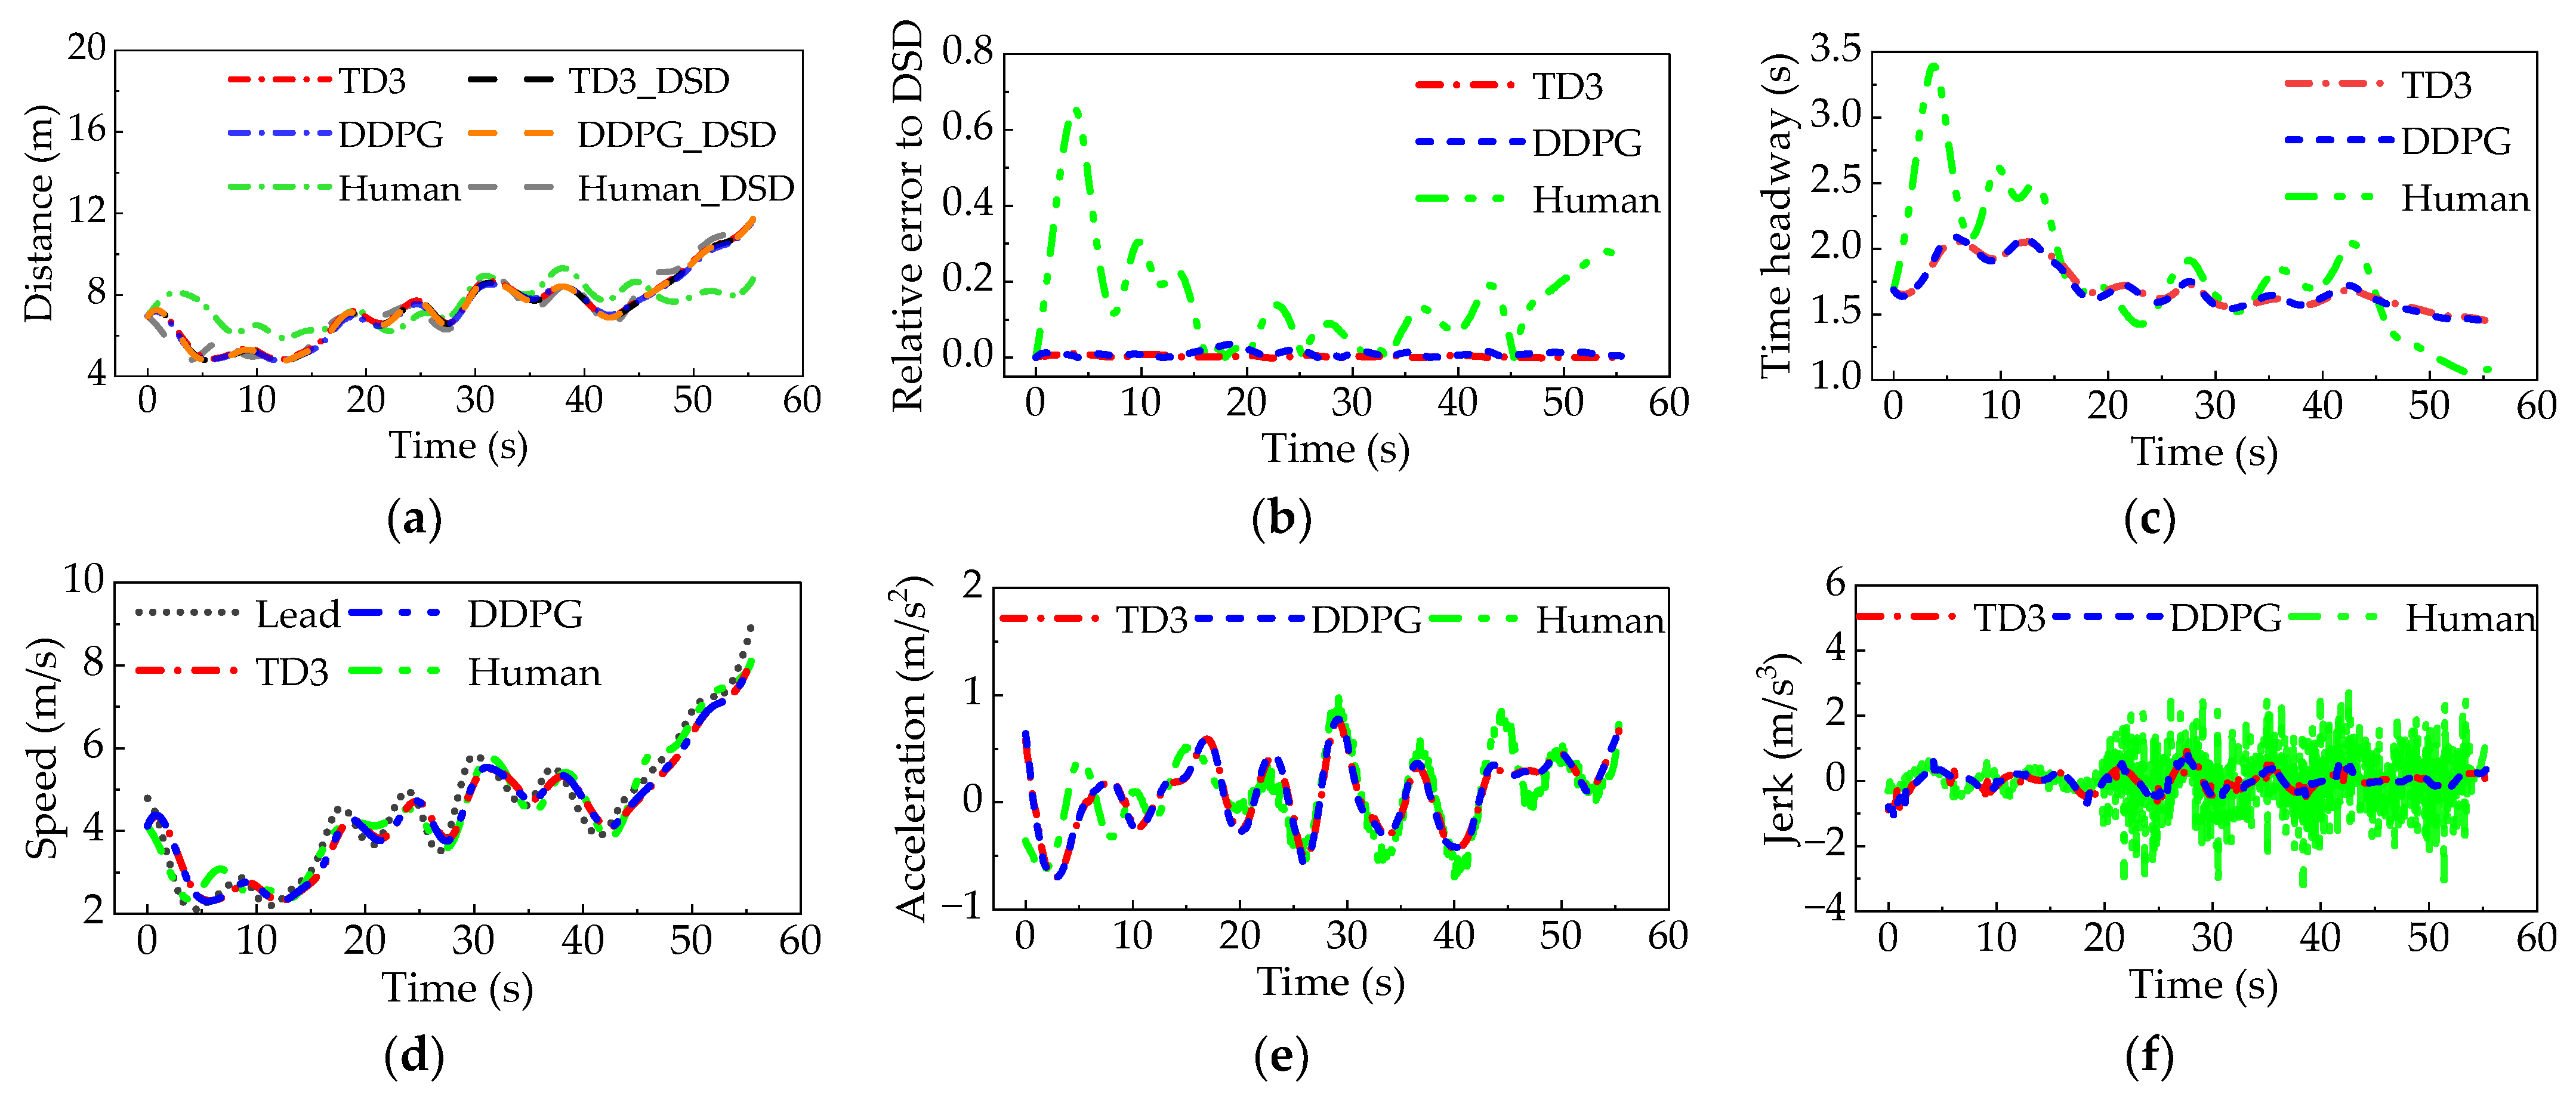
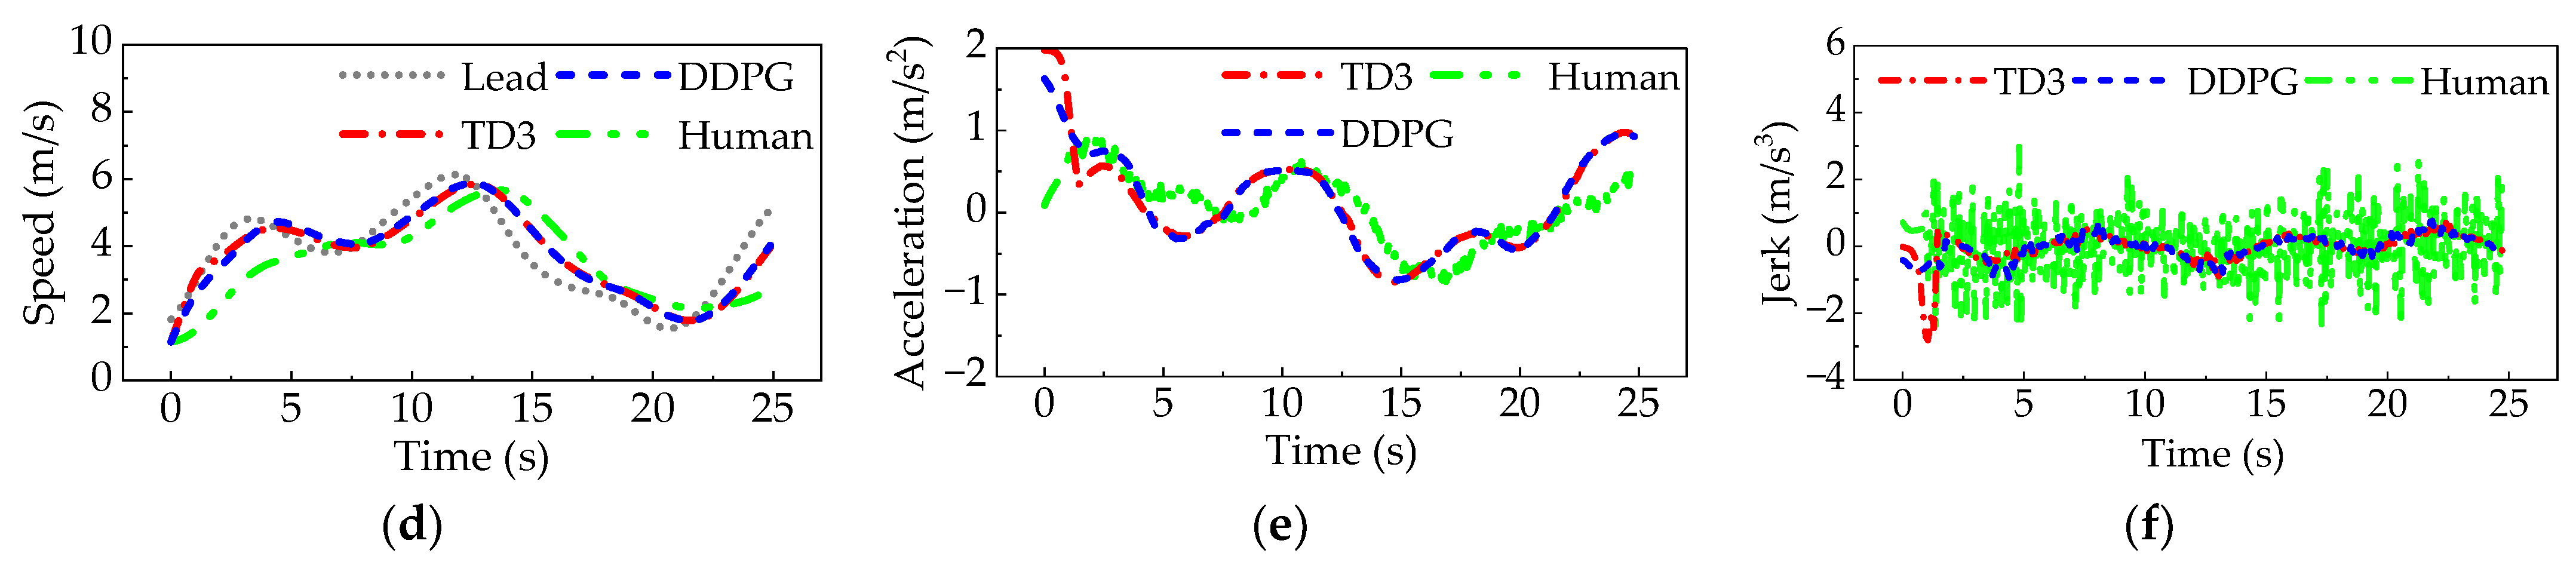
3.2. Simulation Results of Car-Following Experiments
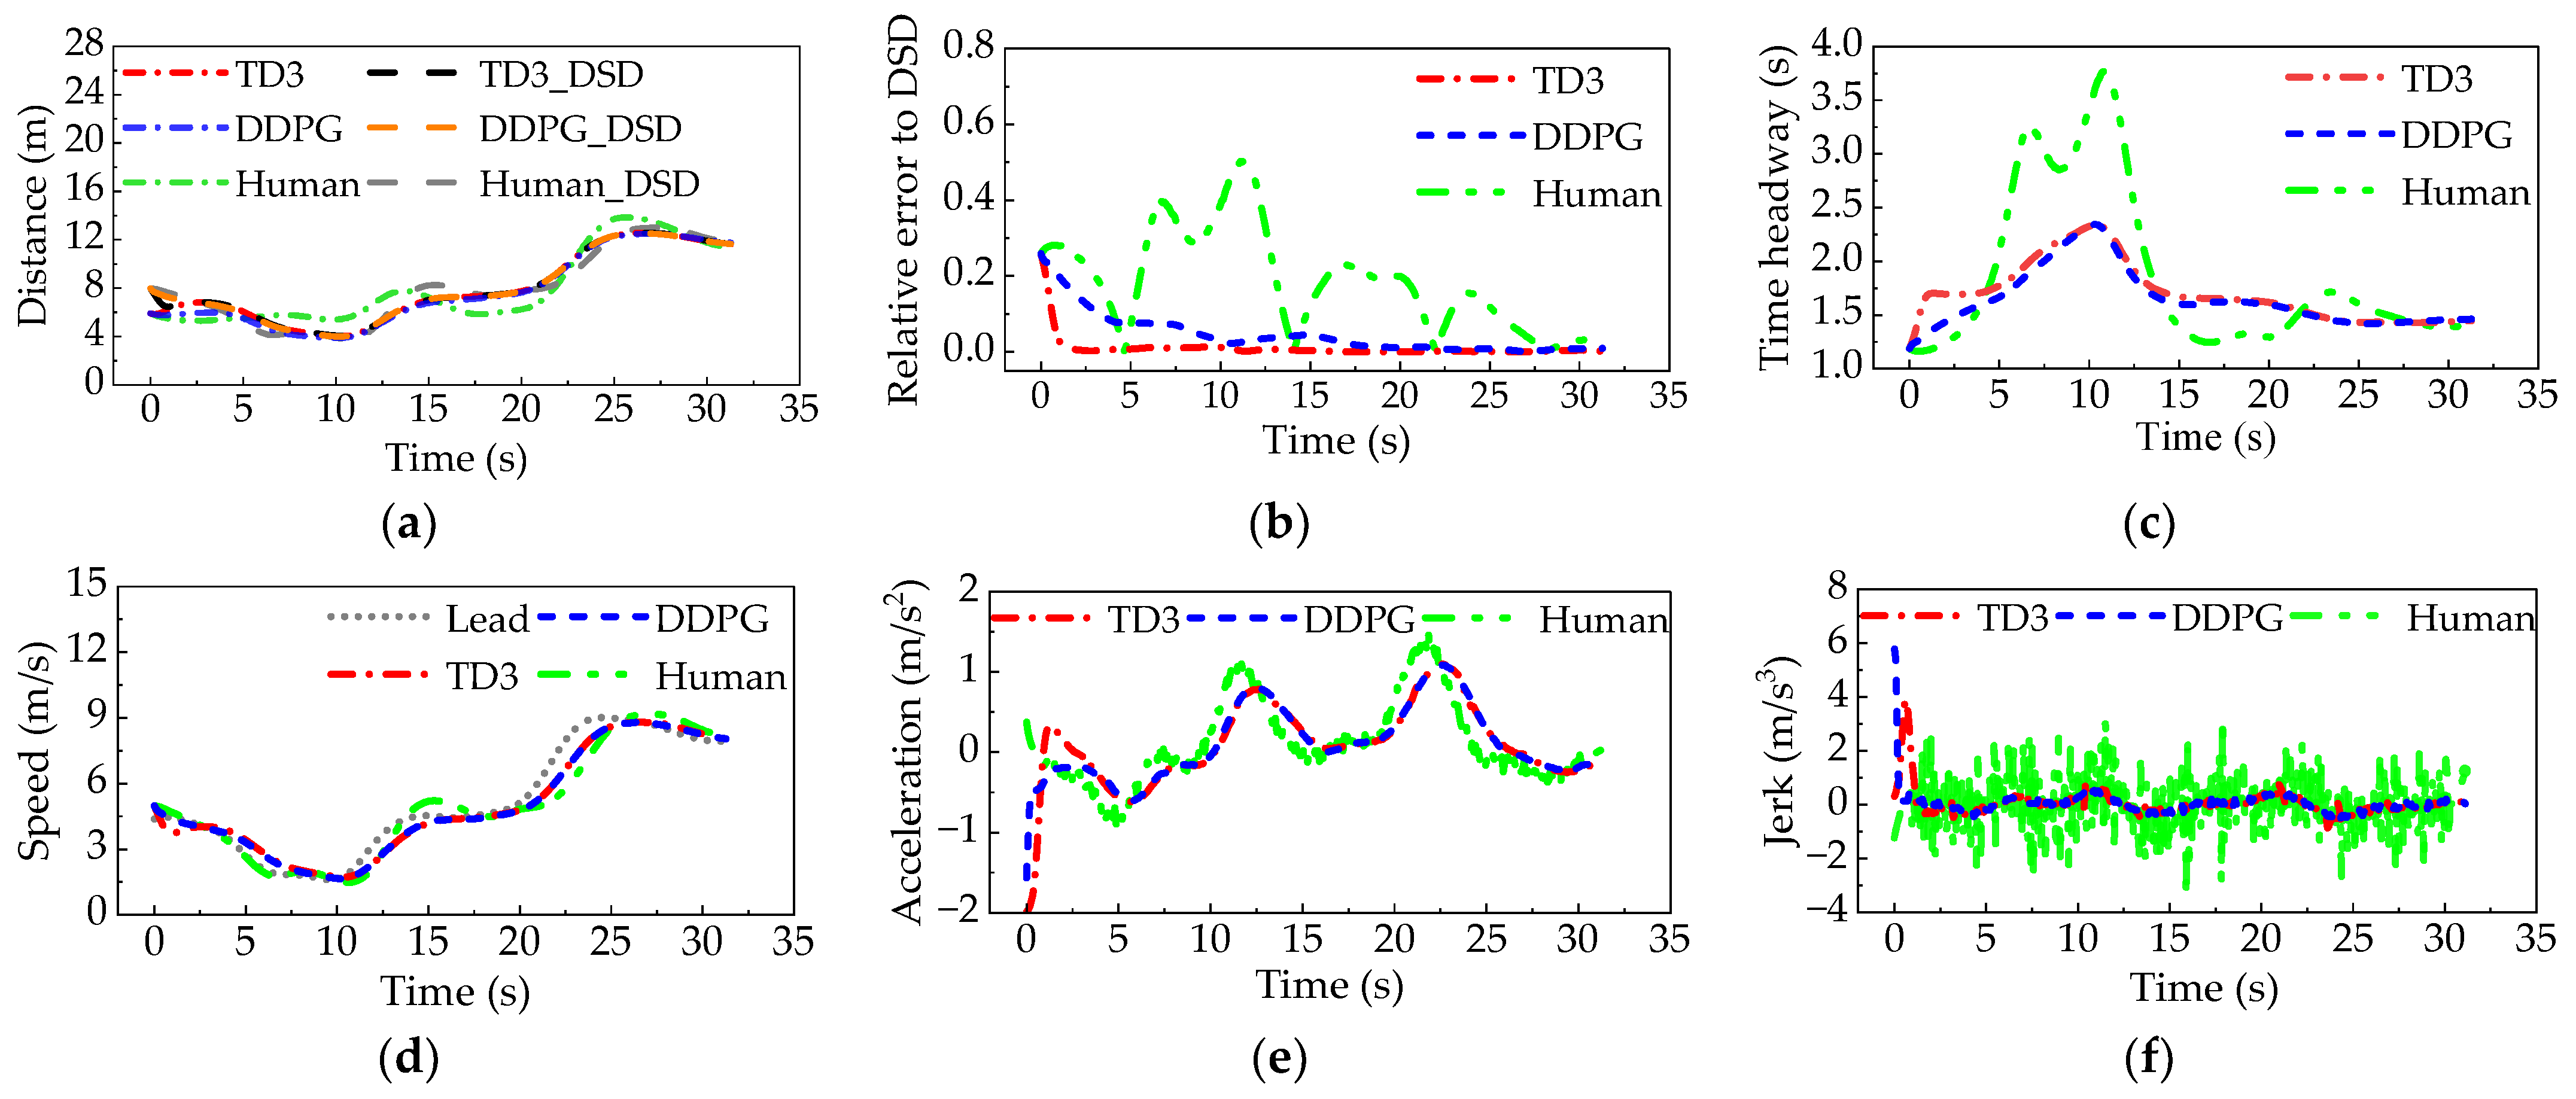
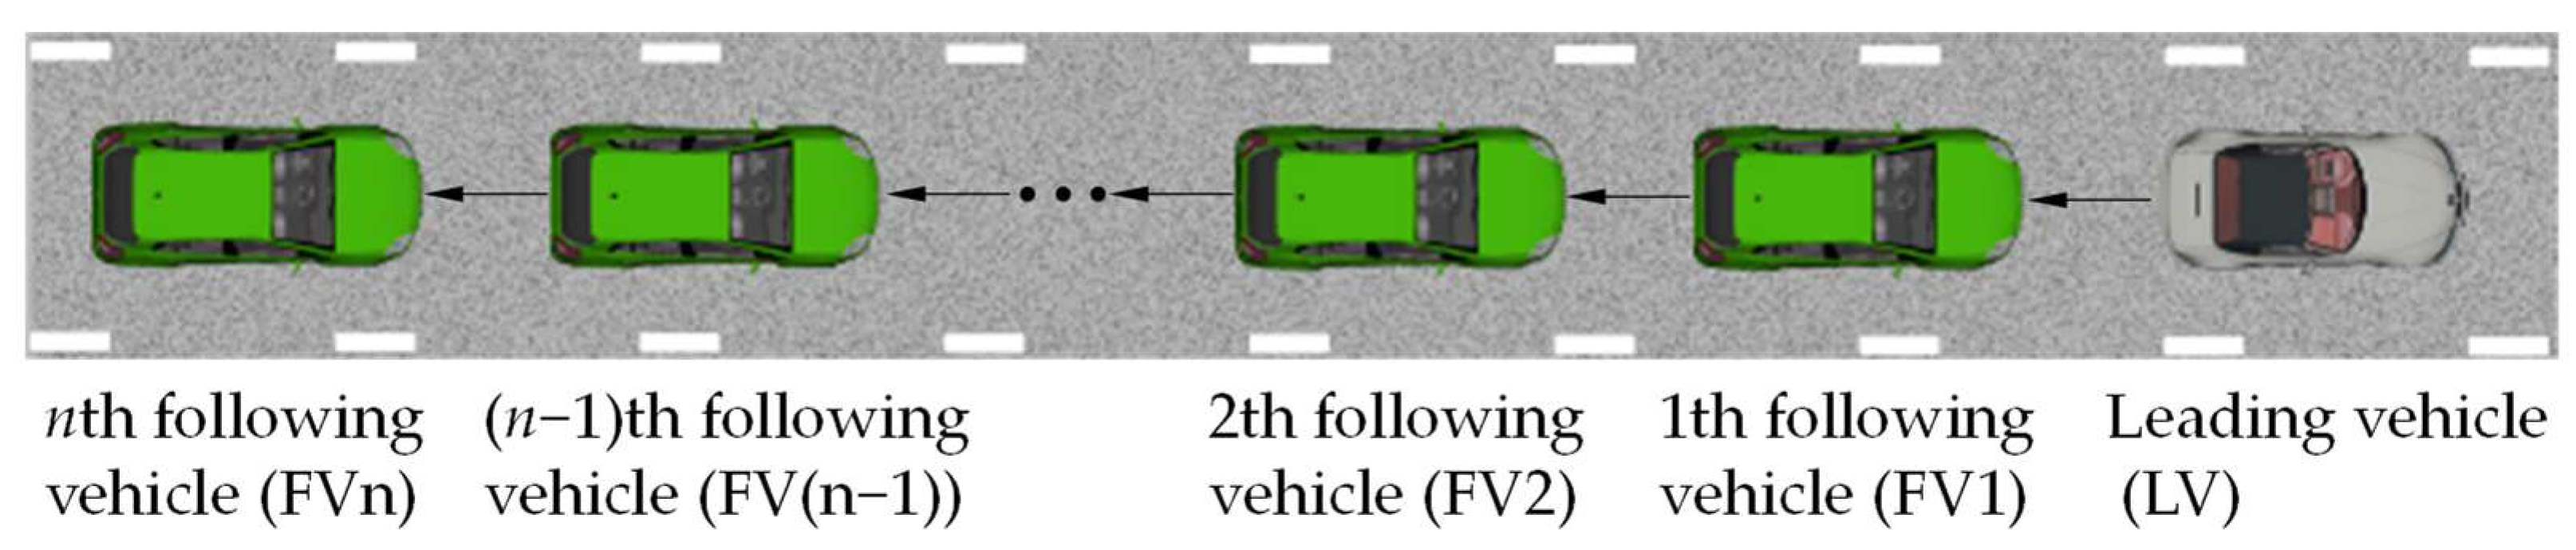
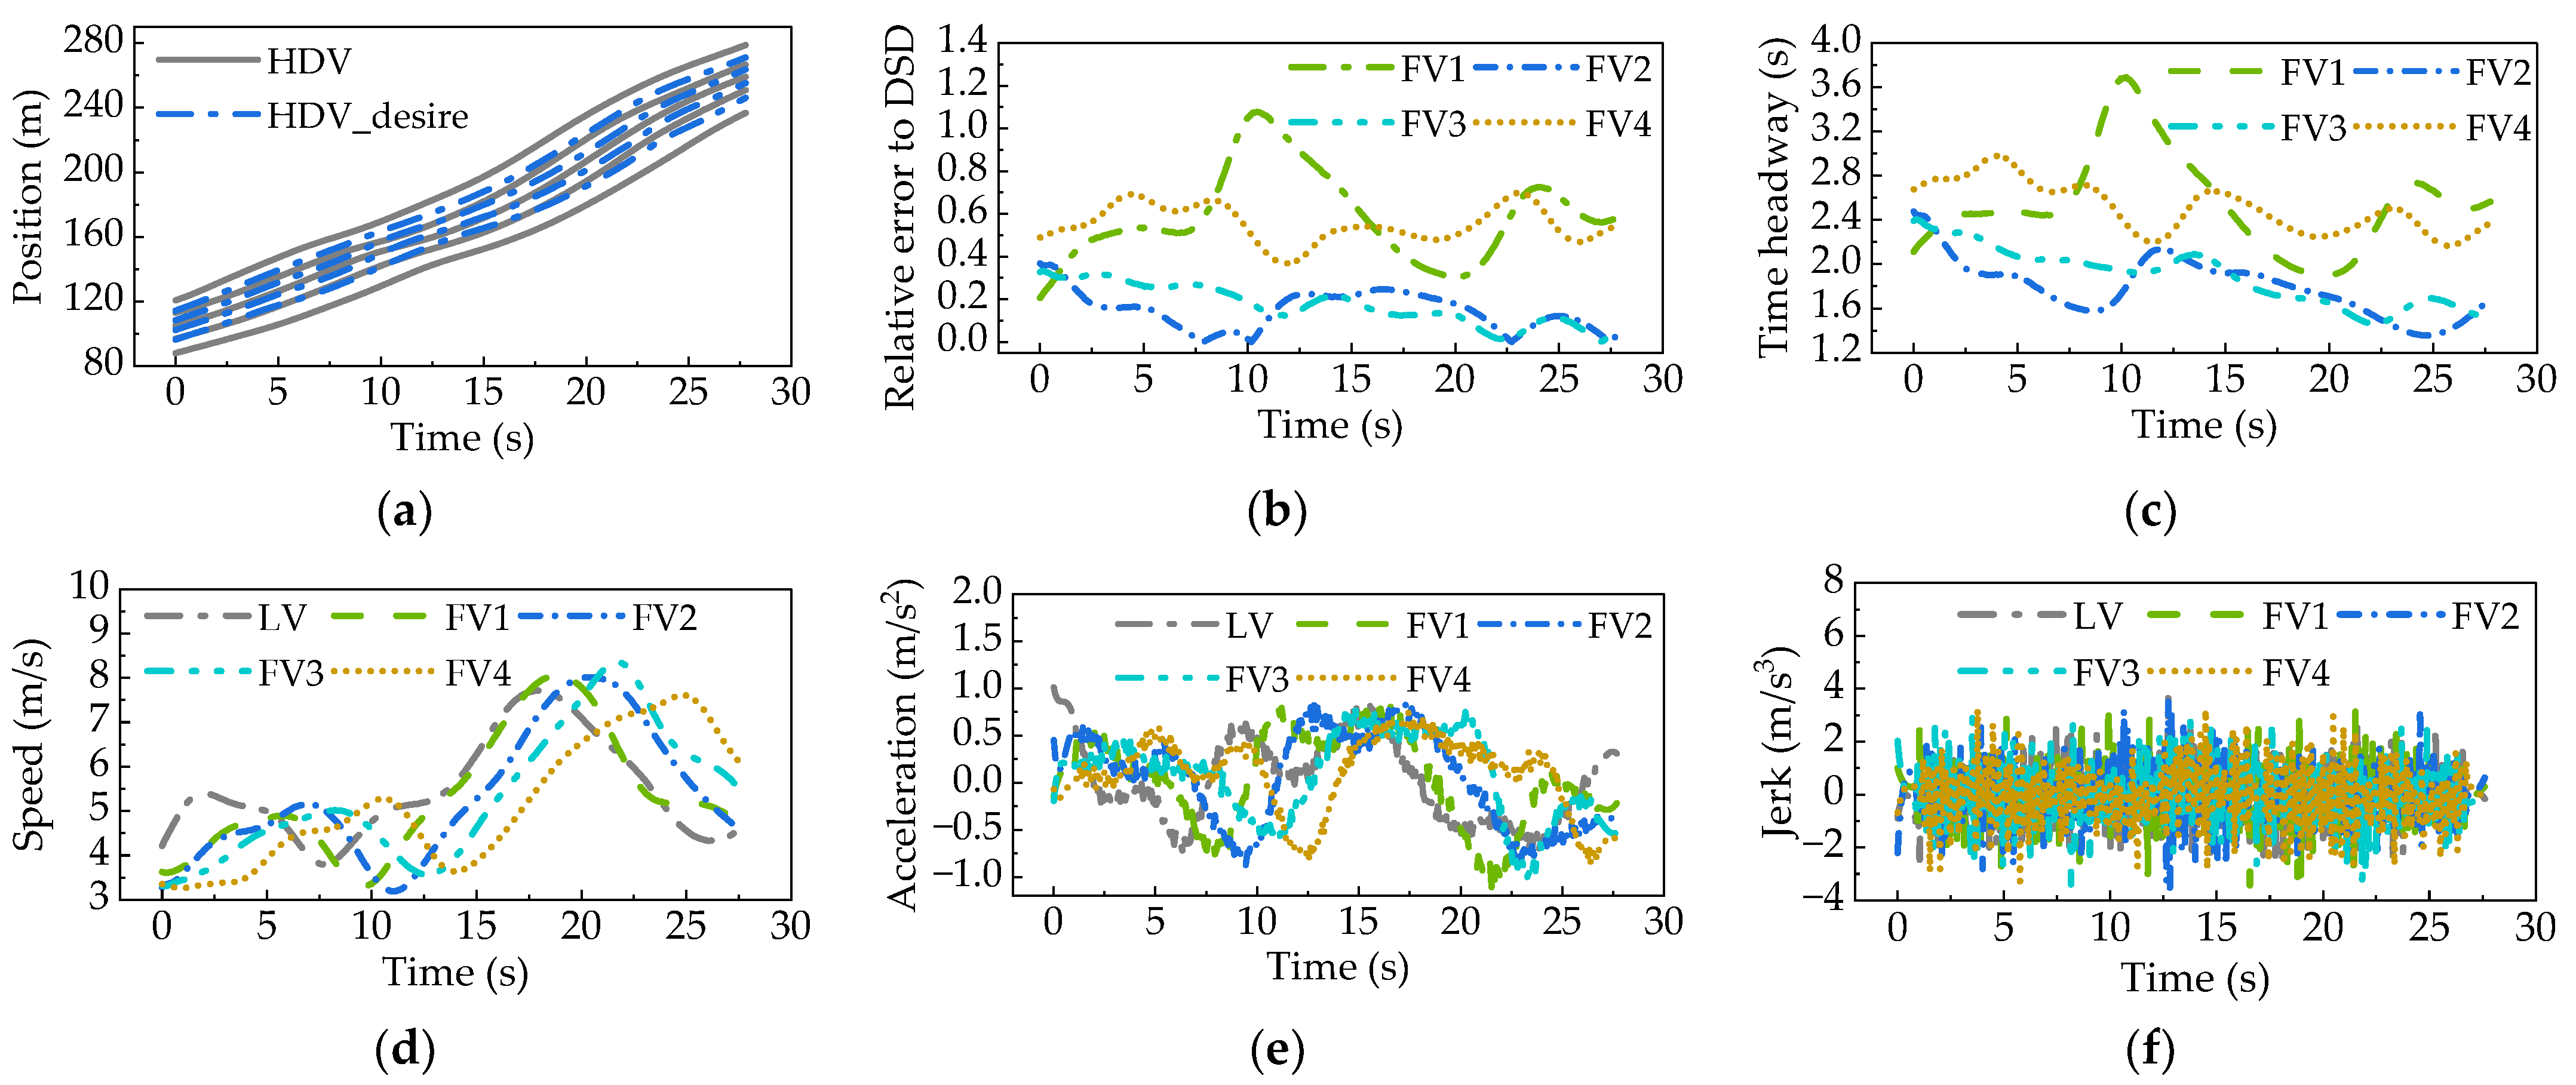
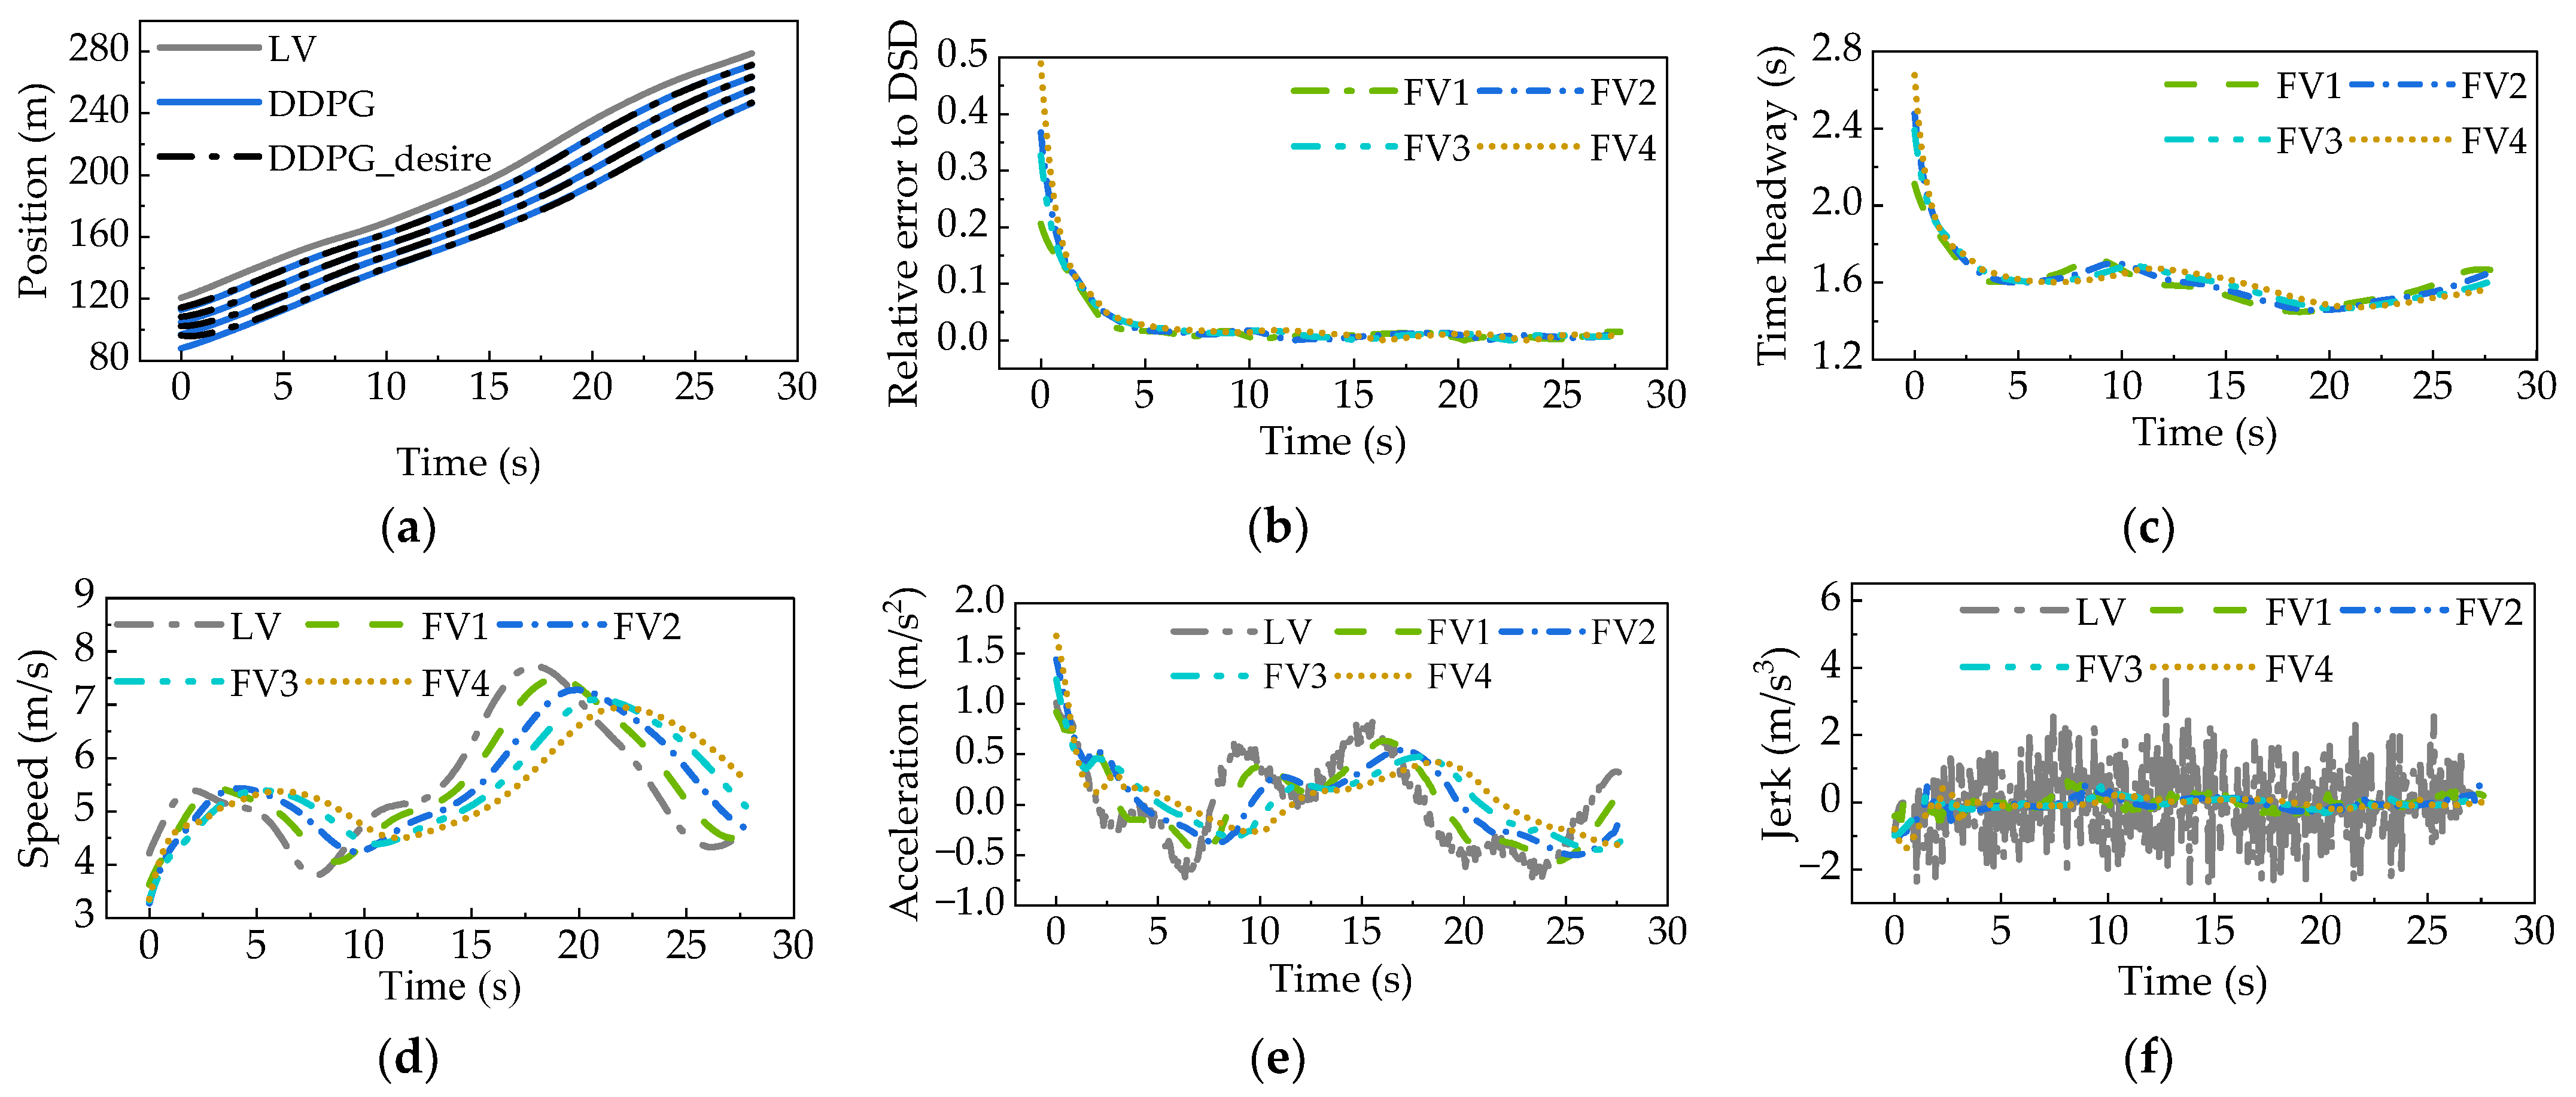
3.3. Simulation Results of Platoon-Following Experiment
4. Conclusions
Author Contributions
Funding
Data Availability Statement
Conflicts of Interest
References
- Yeo, H.; Skabardonis, A. Understanding Stop-and-Go Traffic in View of Asymmetric Traffic Theory. In Proceedings of the 18th International Symposium of Transportation and Traffic Theory, Hong Kong, China, 16–18 July 2009; Hong Kong Polytech University: Hong Kong, China, 2009. [Google Scholar]
- Goñi-Ros, B.; Schakel, W.J.; Papacharalampous, A.E.; Wang, M.; Knoop, V.L.; Sakata, I.; van Arem, B.; Hoogendoorn, S.P. Using Advanced Adaptive Cruise Control Systems to Reduce Congestion at Sags: An Evaluation Based on Microscopic Traffic Simulation. Transp. Res. Part C-Emerg. Technol. 2019, 102, 411–426. [Google Scholar] [CrossRef]
- Saifuzzaman, M.; Zheng, Z. Incorporating Human-Factors in Car-Following Models: A Review of Recent Developments and Research Needs. Transp. Res. Part C-Emerg. Technol. 2014, 48, 379–403. [Google Scholar] [CrossRef]
- Martin, T.; Ansgar, H.; Dirk, H. Congested Traffic States in Empirical Observations and Microscopic Simulations. Phys. Rev. E 2000, 62, 1805–1824. [Google Scholar]
- Newell, G.F. A Simplified Car-Following Theory a Lower Order Model. Transp. Res. Part B-Methodol. 2002, 36, 195–205. [Google Scholar] [CrossRef]
- Tian, J.; Li, G.; Treiber, M.; Jiang, R.; Jia, N.; Ma, S. Cellular Automaton Model Simulating Spatiotemporal Patterns, Phase Transitions and Concave Growth Pattern of Oscillations in Traffic Flow. Transp. Res. Part B-Methodol. 2016, 93, 560–575. [Google Scholar] [CrossRef]
- Zhou, M.; Qu, X.; Li, X. A Recurrent Neural Network Based Microscopic Car Following Model to Predict Traffic Oscillation. Transp. Res. Part C-Emerg. Technol. 2017, 84, 245–264. [Google Scholar] [CrossRef]
- Huang, X.; Sun, J.; Sun, J. A Car-Following Model Considering Asymmetric Driving Behavior Based on Long Short-Term Memory Neural Networks. Transp. Res. Part C-Emerg. Technol. 2018, 95, 346–362. [Google Scholar] [CrossRef]
- Wu, C.; Li, B.; Bei, S.Y.; Zhu, Y.H.; Tian, J.; Hu, H.Z.; Tang, H.R. Research on Short-Term Driver Following Habits Based on GA-BP Neural Network. World Electr. Veh. J. 2022, 13, 171. [Google Scholar] [CrossRef]
- Liao, Y.; Yu, G.; Chen, P.; Zhou, B.; Li, H. Modelling Personalised Car-Following Behaviour: A Memory-Based Deep Reinforcement Learning Approach. Transp. A 2022, 1–29. [Google Scholar] [CrossRef]
- Gao, H.; Shi, G.; Wang, K.; Xie, G.; Liu, Y. Research on Decision-Making of Autonomous Vehicle Following Based on Reinforcement Learning Method. Ind. Robot. 2019, 46, 444–452. [Google Scholar] [CrossRef]
- Goerges, D. Relations between Model Predictive Control and Reinforcement Learning. IFAC-PapersOnLine 2017, 50, 4920–4928. [Google Scholar] [CrossRef]
- Ye, Y.; Zhang, X.; Sun, J. Automated Vehicle’s Behavior Decision Making Using Deep Reinforcement Learning and High-Fidelity Simulation Environment. Transp. Res. Part C-Emerg. Technol. 2019, 107, 155–170. [Google Scholar] [CrossRef]
- Sun, M.; Zhao, W.; Song, G.; Nie, Z.; Han, X.; Liu, Y. DDPG-Based Decision-Making Strategy of Adaptive Cruising for Heavy Vehicles Considering Stability. IEEE Access 2020, 8, 59225–59246. [Google Scholar] [CrossRef]
- Zhu, M.; Wang, Y.; Pu, Z.; Hu, J.; Wang, X.; Ke, R. Safe, Efficient, and Comfortable Velocity Control Based on Reinforcement Learning for Autonomous Driving. Transp. Res. Part C-Emerg. Technol. 2020, 117, 102662. [Google Scholar] [CrossRef]
- Shi, H.; Zhou, Y.; Wu, K.; Wang, X.; Lin, Y.; Ran, B. Connected Automated Vehicle Cooperative Control with a Deep Reinforcement Learning Approach in a Mixed Traffic Environment. Transp. Res. Part C-Emerg. Technol. 2021, 133, 103421. [Google Scholar] [CrossRef]
- Yan, R.; Jiang, R.; Jia, B.; Huang, J.; Yang, D. Hybrid Car-Following Strategy Based on Deep Deterministic Policy Gradient and Cooperative Adaptive Cruise Control. IEEE Trans. Autom. Sci. Eng. 2022, 19, 2816–2824. [Google Scholar] [CrossRef]
- Qin, P.; Tan, H.; Li, H.; Wen, X. Deep Reinforcement Learning Car-Following Model Considering Longitudinal and Lateral Control. Sustainability 2022, 14, 16705. [Google Scholar] [CrossRef]
- Chen, J.; Zhao, C.; Jiang, S.C.; Zhang, X.Y.; Li, Z.X.; Du, Y.C. Safe, Efficient, and Comfortable Autonomous Driving Based on Cooperative Vehicle Infrastructure System. Int. J. Environ. Res. Public Health 2023, 20, 893. [Google Scholar] [CrossRef]
- Fujimoto, S.; van Hoof, H.; Meger, D. Addressing Function Approximation Error in Actor-Critic Methods. In Proceedings of the 35th International Conference on Machine Learning, Stockholm, Sweden, 10–15 January 2018. [Google Scholar]
- Li, G.Q.; Gorges, D. Ecological Adaptive Cruise Control for Vehicles with Step-Gear Transmission Based on Reinforcement Learning. IEEE Trans. Intell. Transp. Syst. 2020, 21, 4895–4905. [Google Scholar] [CrossRef]
- Helbing, D.; Tilch, B. Generalized Force Model of Traffic Dynamics. Phys. Rev. E 1998, 58, 133–138. [Google Scholar] [CrossRef]
- Zhang, G.; Wang, Y.; Wei, H.; Chen, Y. Examining Headway Distribution Models with Urban Freeway Loop Event Data. Transp. Res. Rec. J. Transp. Res. Board 2007, 1999, 141–149. [Google Scholar] [CrossRef]
- Wan, Q.; Peng, G.; Li, Z.; Inomata, F.H.T. Spatiotemporal Trajectory Characteristic Analysis for Traffic State Transition Prediction near Expressway Merge Bottleneck. Transp. Res. Part C-Emerg. Technol. 2020, 117, 102682. [Google Scholar] [CrossRef]
- Qin, P.; Li, H.; Li, Z.; Guan, W.; He, Y. A CNN-LSTM Car-Following Model Considering Generalization Ability. Sensors 2023, 23, 660. [Google Scholar] [CrossRef] [PubMed]
- Wang, Z.; Bian, Y.; Shladover, S.E.; Wu, G.; Li, S.E.; Barth, M.J. A Survey on Cooperative Longitudinal Motion Control of Multiple Connected and Automated Vehicles. IEEE Intell. Transp. Syst. Mag. 2020, 12, 4–24. [Google Scholar] [CrossRef]


| Parameter | Symbol | Value |
|---|---|---|
| Sampling step (s) | 0.08 | |
| Batch size | / | 128 |
| Discount factor | 0.91 | |
| Actor learning rate | 3 × 10⁻⁴ | |
| Critic learning rate | 3 × 10⁻⁴ | |
| Soft update rate | 8 × 10⁻³ | |
| Replay buffer capacity | / | 2 × 10⁶ |
| Parameter | Value | |
|---|---|---|
| Dataset 1 | Dataset 3 | |
| Road length (m) | 427 | 362 |
| Duration (s) | 255 | 545 |
| Temporal accuracy (s) | 0.01 | 0.01 |
| Position accuracy (m) | 0.01 | 0.01 |
| Sampling frequency (Hz) | 25 | 25 |
| Comparative Indicator | TD3 | DDPG | Human |
|---|---|---|---|
| Mean relative error to DSD | 0.96% | 2.24% | 42.78% |
| Mean-time headway (s) | 1.643 | 1.646 | 2.324 |
| Mean absolute value of jerk (m/s3) | 0.290 | 0.258 | 0.729 |
| Initial Condition | Data Source | Distance | Time Headway (s) | The Absolute Value of Jerk (m/s3) | ||||
|---|---|---|---|---|---|---|---|---|
| MREDSD * | Minimum | Mean | Maximum | Minimum | Mean | Maximum | ||
| An initial distance equal to DSD | TD3 | 0.30% | 1.449 | 1.701 | 2.052 | 0 | 0.211 | 0.904 |
| DDPG | 1.03% | 1.441 | 1.697 | 2.090 | 0 | 0.218 | 1.075 | |
| Human | 15.44% | 1.053 | 1.835 | 3.393 | 0.002 | 0.673 | 3.197 | |
| An initial distance less than DSD | TD3 | 0.88% | 1.188 | 1.704 | 2.336 | 0.002 | 0.260 | 3.915 |
| DDPG | 4.41% | 1.188 | 1.647 | 2.343 | 0.002 | 0.215 | 5.787 | |
| Human | 18.59% | 1.161 | 1.857 | 3.765 | 0 | 0.877 | 3.411 | |
| An initial distance greater than DSD | TD3 | 2.30% | 1.539 | 1.837 | 5.303 | 0 | 0.289 | 2.810 |
| DDPG | 5.58% | 1.520 | 1.905 | 5.303 | 0.002 | 0.267 | 0.986 | |
| Human | 101.72% | 2.963 | 3.741 | 5.321 | 0.003 | 0.890 | 2.967 | |
| Comparative Indicator | TD3 | DDPG | Human |
|---|---|---|---|
| Mean relative error to DSD | 1.10% | 2.47% | 42.22% |
| Mean-time headway (s) | 1.665 | 1.677 | 2.434 |
| Mean absolute value of jerk (m/s3) | 0.181 | 0.155 | 0.780 |
| Comparative Indicator | TD3 | DDPG | Human |
|---|---|---|---|
| Mean relative error to DSD | 0.87% | 2.58% | 36.51% |
| Mean-time headway (s) | 1.570 | 1.593 | 2.129 |
| Mean absolute value of jerk (m/s3) | 0.175 | 0.158 | 0.934 |
Disclaimer/Publisher’s Note: The statements, opinions and data contained in all publications are solely those of the individual author(s) and contributor(s) and not of MDPI and/or the editor(s). MDPI and/or the editor(s) disclaim responsibility for any injury to people or property resulting from any ideas, methods, instructions or products referred to in the content. |
© 2023 by the authors. Licensee MDPI, Basel, Switzerland. This article is an open access article distributed under the terms and conditions of the Creative Commons Attribution (CC BY) license (https://creativecommons.org/licenses/by/4.0/).
Share and Cite
Qin, P.; Wu, F.; Bin, S.; Li, X.; Ya, F. High-Accuracy, High-Efficiency, and Comfortable Car-Following Strategy Based on TD3 for Wide-to-Narrow Road Sections. World Electr. Veh. J. 2023, 14, 244. https://doi.org/10.3390/wevj14090244
Qin P, Wu F, Bin S, Li X, Ya F. High-Accuracy, High-Efficiency, and Comfortable Car-Following Strategy Based on TD3 for Wide-to-Narrow Road Sections. World Electric Vehicle Journal. 2023; 14(9):244. https://doi.org/10.3390/wevj14090244
Chicago/Turabian StyleQin, Pinpin, Fumao Wu, Shenglin Bin, Xing Li, and Fuming Ya. 2023. "High-Accuracy, High-Efficiency, and Comfortable Car-Following Strategy Based on TD3 for Wide-to-Narrow Road Sections" World Electric Vehicle Journal 14, no. 9: 244. https://doi.org/10.3390/wevj14090244
APA StyleQin, P., Wu, F., Bin, S., Li, X., & Ya, F. (2023). High-Accuracy, High-Efficiency, and Comfortable Car-Following Strategy Based on TD3 for Wide-to-Narrow Road Sections. World Electric Vehicle Journal, 14(9), 244. https://doi.org/10.3390/wevj14090244