1. Introduction
The traditional electrical power grid cannot be quickly developed, its equipment cannot be remotely controlled, and its level of automation is not high; thus, the use of a physical grid can no longer achieve the requirements of contemporary society as a power system [
1]. Emerging technology has laid the foundation for the construction of a smart grid [
2]. For example, technologies such as sensing and measurement, network communication, electronic information, automation, and intelligent algorithms allow the system to become more optimized [
3,
4]. With the promotion of these technologies, the power system is moving toward efficiency, stability, and high utilization [
5,
6].
With the rapid emergence of the smart grid and Internet of Things technology, the concept of “intelligence” has been gradually applied to the process of power grid management, and they have great potential to develop intelligent monitoring of the power grid [
7,
8]. With the emergence of networks, communication and other technologies, grid system condition monitoring is becoming more and more integrated, taking condition monitoring as a prerequisite to building a management system [
9,
10]. The current use of sensing technology integrated with intelligent information processing technology can complete effective processing of online as well as offline information to ensure real-time condition monitoring and fault warning of equipment [
11,
12].
Aranda, J used a systematic mapping approach to analyze data collected, transmitted and stored on the Internet, using an edge computing approach to handle data sent near smart grid information sources; they also analyzed attenuated data latency [
13]. Wang, W. studied a three-coil wireless power supply system to solve the problem of the power supply for sensors, thus ensuring stability and effectiveness [
14]. Yang, Z. used a power supply with an information-energy conversion circuit with limited simulation to investigate the energy harvesting capability that can be used for high-voltage transmission line condition monitoring [
15].
In addition, [
16] investigated an intelligent distribution network transmission line condition data collection and communication system that is distinct from the traditional transmission line condition monitoring data collection. Others [
17] have proposed an efficient, uncompressed algorithm for sensing data combining wavelet compression, and a neighborhood exponential sequence algorithm, which alleviate the data accumulation problem of a high-voltage transmission line condition system and achieves optimization of the system. studied A long-term online monitoring system was studied [
18] that can solve the condition monitoring of transmission lines in remote areas and obtained three monitoring periods for low-power wide area networks with a multi-objective particle swarm optimization algorithm that is suitable for the working mode in remote areas.
Research by [
19] presented an energy-efficient geographic routing protocol (EGRPM) which is suitable for wireless sensor networks with mobile sinks. EGRPM uses geographical information to partition networks into several cells, each of which could utilize single-hop or multi-hop communication with mobile sinks. Mobile sinks use a particular movement pattern to cover the network cells. This model uses a scheduling mechanism to determine the rest time of sinks.
Research conducted by [
20] introduced a deployment scheme for green IoT. This model utilizes a hierarchical structure for deploying devices in IoT. This research modeled the green IoT as an optimization problem and presented a clustering and Steiner tree-based approach, named MECA, to solve this problem. In [
21], an energy-efficient routing strategy for data dissemination (EEDD) was proposed which is suitable for wireless networks. This model operates with UAVs. In EEDD, the nature-inspired approach has been used for determining suitable routes between nodes and UAVs.
This paper integrates IoT technology and a smart grid to build an electric power IoT architecture. The contributions of the current research are as follows:
This research proposes an electric power IoT architecture which combines intelligent sensing technology with wireless communication and other IoT technologies. This model optimizes channel data collection technology and utilizes an orthogonal discrete multi-wavelet transform-based algorithm of edge computing technology to collect and processes high-voltage transmission line condition data from the smart grid.
This research designs an integrated intelligent sensing terminal with multiple parameters, and forms a complete intelligent condition monitoring system. It primarily studies technologies related to the status of high-voltage transmission lines, transmission line online monitoring categories, hardware design, communication network design of online monitoring systems, and some communication technologies involved in transmission line monitoring.
This research proposes a networking scheme that can be applied to the online monitoring of transmission lines and the design of the transmission line condition monitoring system based on a C/S multilayer framework.
Simulation experiments and tests are conducted to verify the performance of the algorithm and the performance of the system in terms of state measurement and communication to verify the feasibility of the monitoring system.
The remainder of this paper is organized as follows:
Section 2 includes the research background;
Section 3 describes the proposed model in detail;
Section 4 outlines the interpretion and discussion of the simulation results; and
Section 5 summarizes the findings and presents conclusions.
2. Power Internet and High Voltage Transmission Line Condition Monitoring Intelligent Sensor Design
Power IoT is the application of IoT in a smart grid, which is the result of recent developments in information and communication technology. It will effectively integrate communication infrastructure resources and power system infrastructure resources, improve the level of informationization of the power system, improve the utilization efficiency of the existing infrastructure of the power system, and provide important technical support for power grid generation, transmission, transformation, distribution and usage. The applied integration of IoT technology and smart grid construction can enhance the communication technology and the ability to place sensors in special locations, monitor the operation of power equipment at any time, and carry out more detailed system management of power and operation environment.
2.1. Power IoT Architecture and Component Technologies
2.1.1. Power IoT Architecture
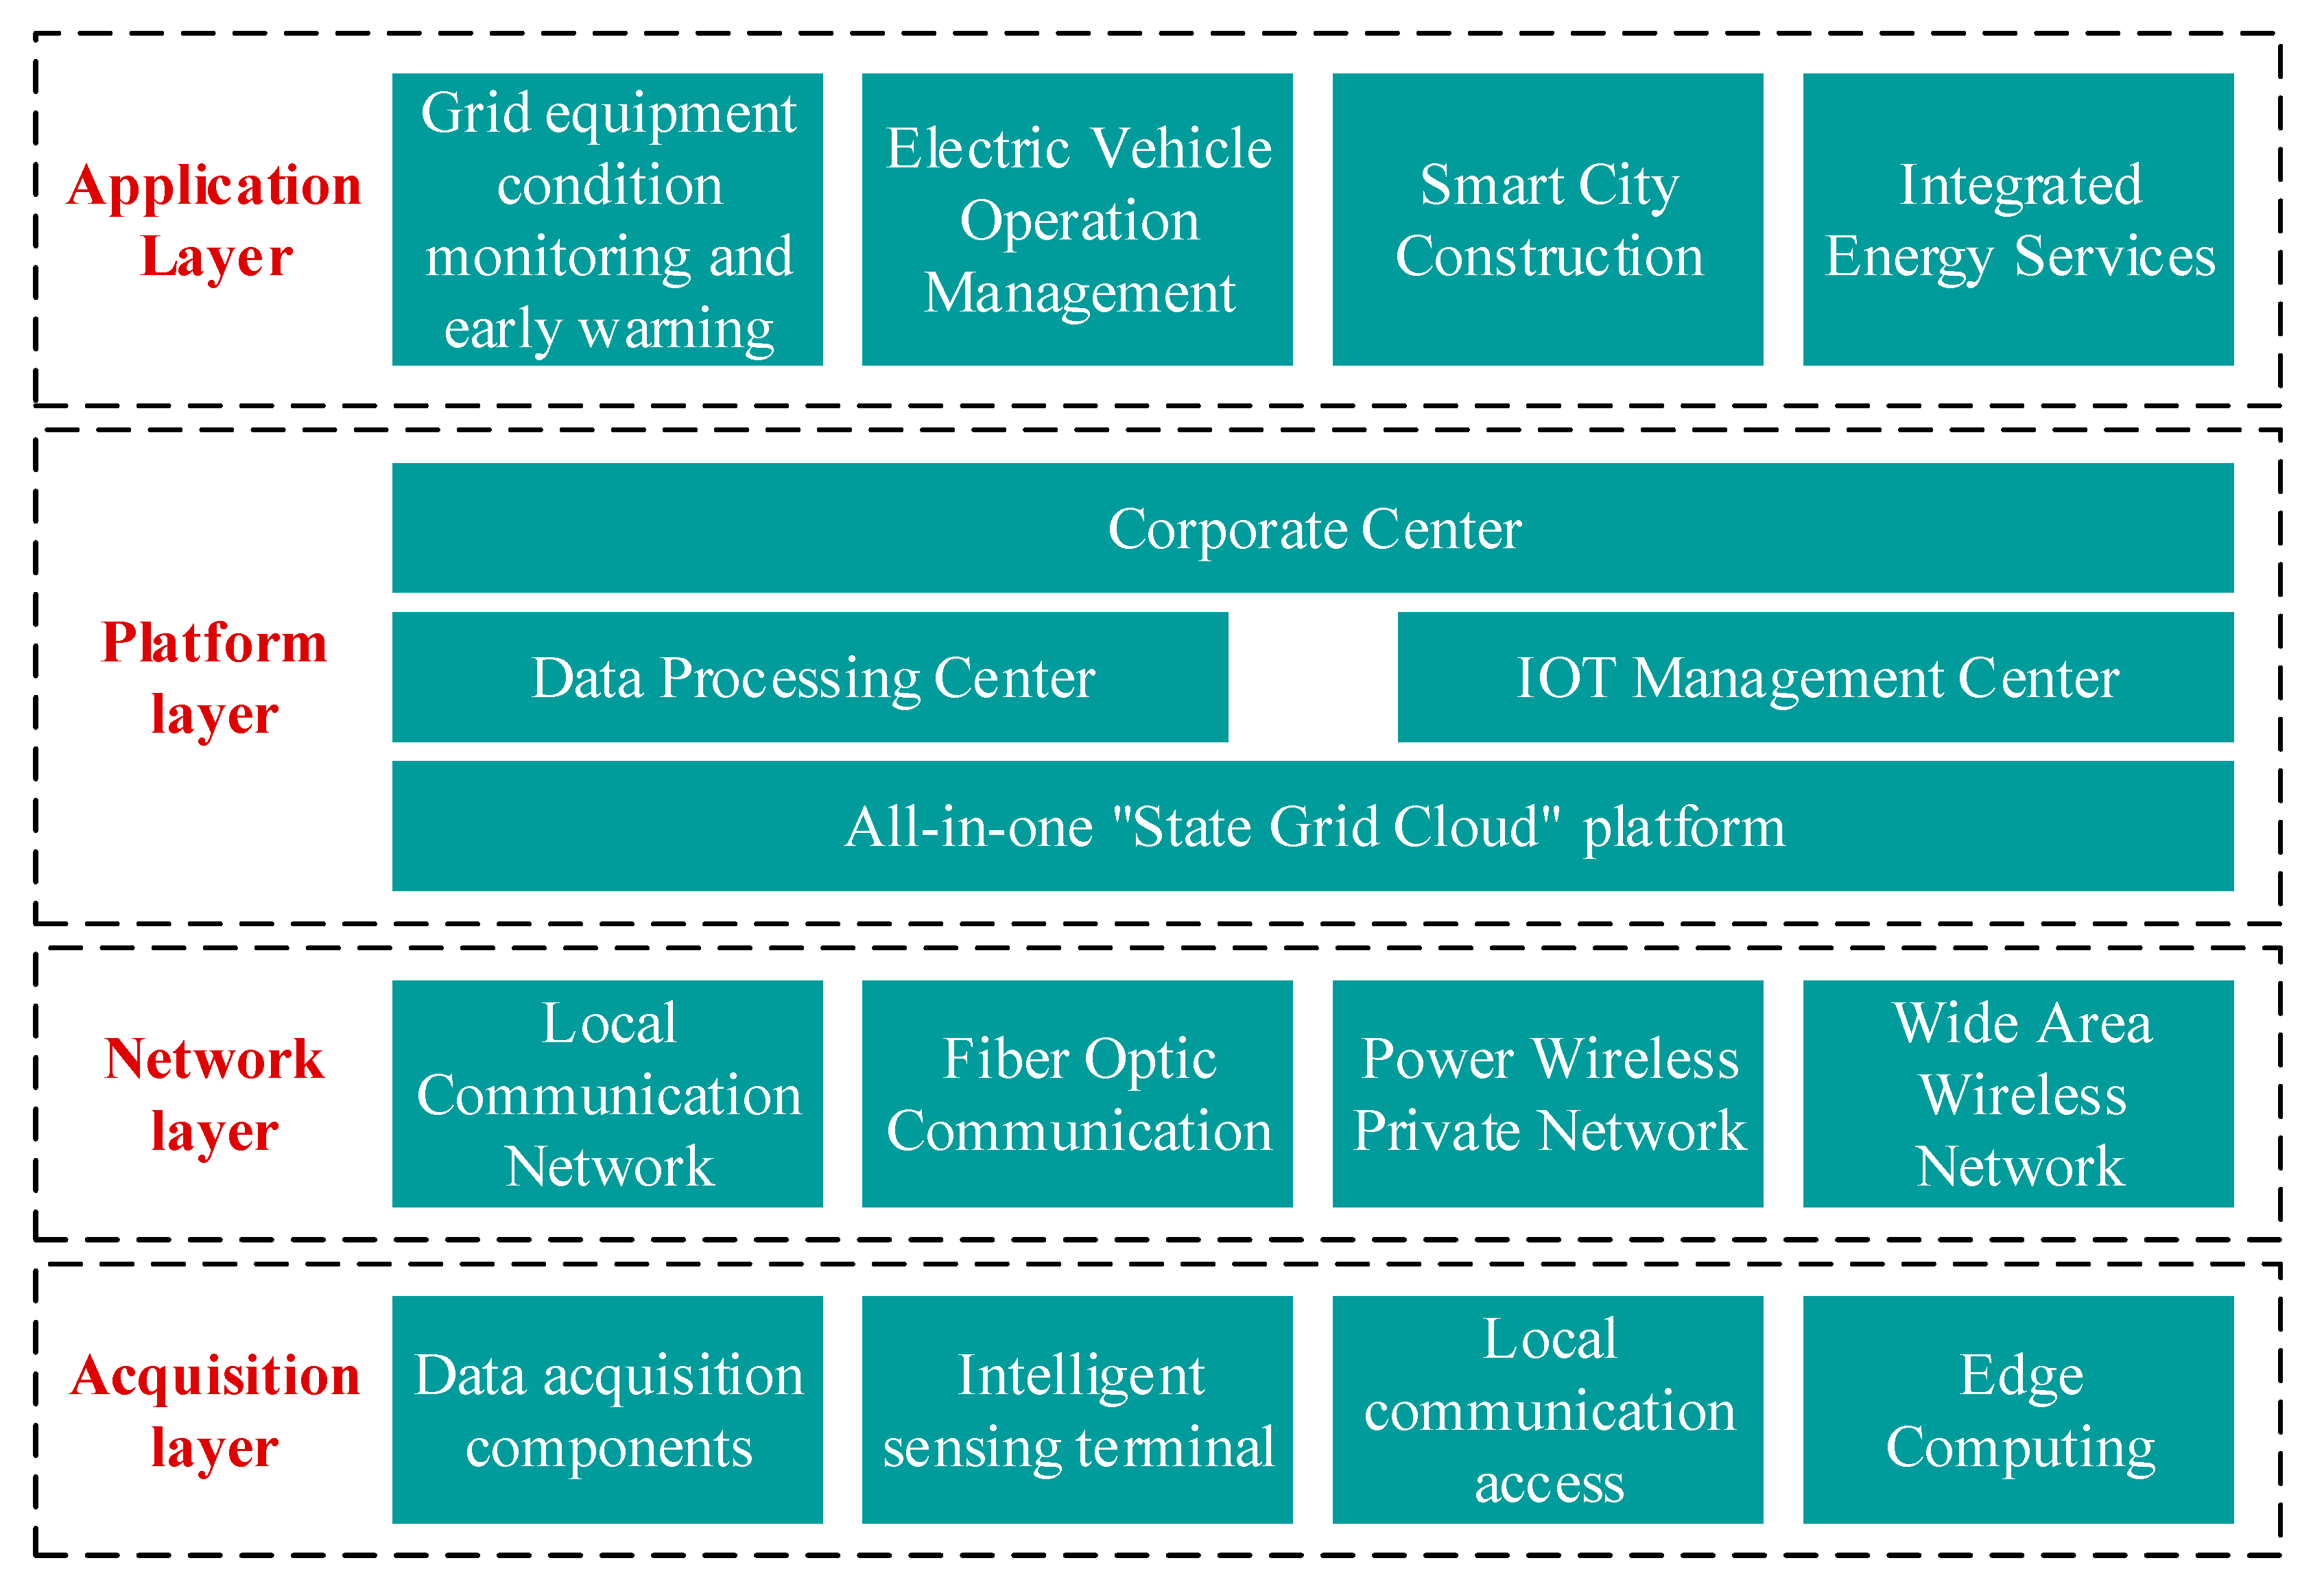
Electricity IoT combines “big cloud, things, mobile intelligence” communication architecture and technology to realize multi-level and wide-area interconnection communication and human-computer interaction management [
22]. The architecture of the power IoT is shown in
Figure 1.
The lower layer of the power IoT architecture mainly includes the collection layer and the network layer, while the upper layer mainly consists of the platform layer and the application layer, which cooperate with each other to form a common system. The collection layer at the bottom of the hierarchy adopts RFID technology and intelligent sensing technology to achieve dynamic acquisition of status information data of various devices and different users in each link the pathway “power generation–transmission–substation–user”. As the key level of communication between the collection layer and the platform layer, the main function of the network layer is to realize transmission of data flow of low latency and low power consumption over a wide area that includes various forms of communication. The platform layer covers the construction of a massive data processing, analysis, and integration management platform for electrical power equipment to enhance the ability of collaborative and efficient data processing. The application layer at the top of the architecture involves a variety of management applications for the stable operation of the power grid, while developing intelligent applications to meet actual needs to create a comprehensive service platform for smart energy.
2.1.2. Intelligent Sensing Technology
As an important means of interaction with the external environment and the main source of sensory information, intelligent sensors have become one of the core technologies for the future development of the information industry. Energy is needed by the Internet to achieve rapid, extensive and accurate information collection and to realize, via information interaction, two-way flow and optimal control of energy across different regions, types of energy producers, and consumers.
Power sensors and sensor networks are important infrastructures for the energy Internet and will have application value in all its aspects. One of the key tasks in building the energy Internet is to make full use of new Internet technologies, by developing smart sensing technologies and industries. Smart sensors first sense the physical quantity to be measured with the help of its sensitive elements, obtain the physical quantity through conditioning circuits, and then convert it into the corresponding electrical signal.
2.1.3. Wireless Communication Technology
Communication technology is divided into wired communication and wireless communication; the main difference is in the medium of signal transmission. Wireless communication technology is one of the more advanced modern communication technologies, which is mainly used to transmit information in free space by means of electromagnetic wave signals to achieve long-distance signal transmission. The technology mainly involves microwave as well as satellite communication, etc. Its signal needs to be transformed at the base station of the transmission process. The early wireless transmission technology is easily affected by external interference factors, resulting in unstable transmission signals. With the continuous innovation of science and technology, the new wireless communication technology ensures normal communication and promotes the overall development of the wireless communication business.
The distance of communication can be categorized as short-range wireless communication or long-range wireless communication; each has its own advantages and characteristics. There are four kinds of wireless communication technologies commonly used in the Internet of Things, namely ZigBee low-speed short-range transmission communication technology, GPRS technology, 5G communication technology, and NB-IoT technology.
2.2. Smart Grid High-Voltage Transmission Line State Data Acquisition Technology
2.2.1. Multi-Channel Data Acquisition Technology
Multi-channel data acquisition technology can significantly improve the speed of data acquisition and communication and enhance the efficiency of the power system. Multiple sources of data collection and data transfer are realized through multi-channel data collectors, and the final collected output data are used for data calculations and analyses through the cloud. Due to the adoption of multi-channel data acquisition technology, the data collection volume increases significantly, improving the overall efficiency of the system operation, and the whole process can be monitored remotely, realizing the data collection and operation of the power networking solution.
2.2.2. Edge Computing Technologies
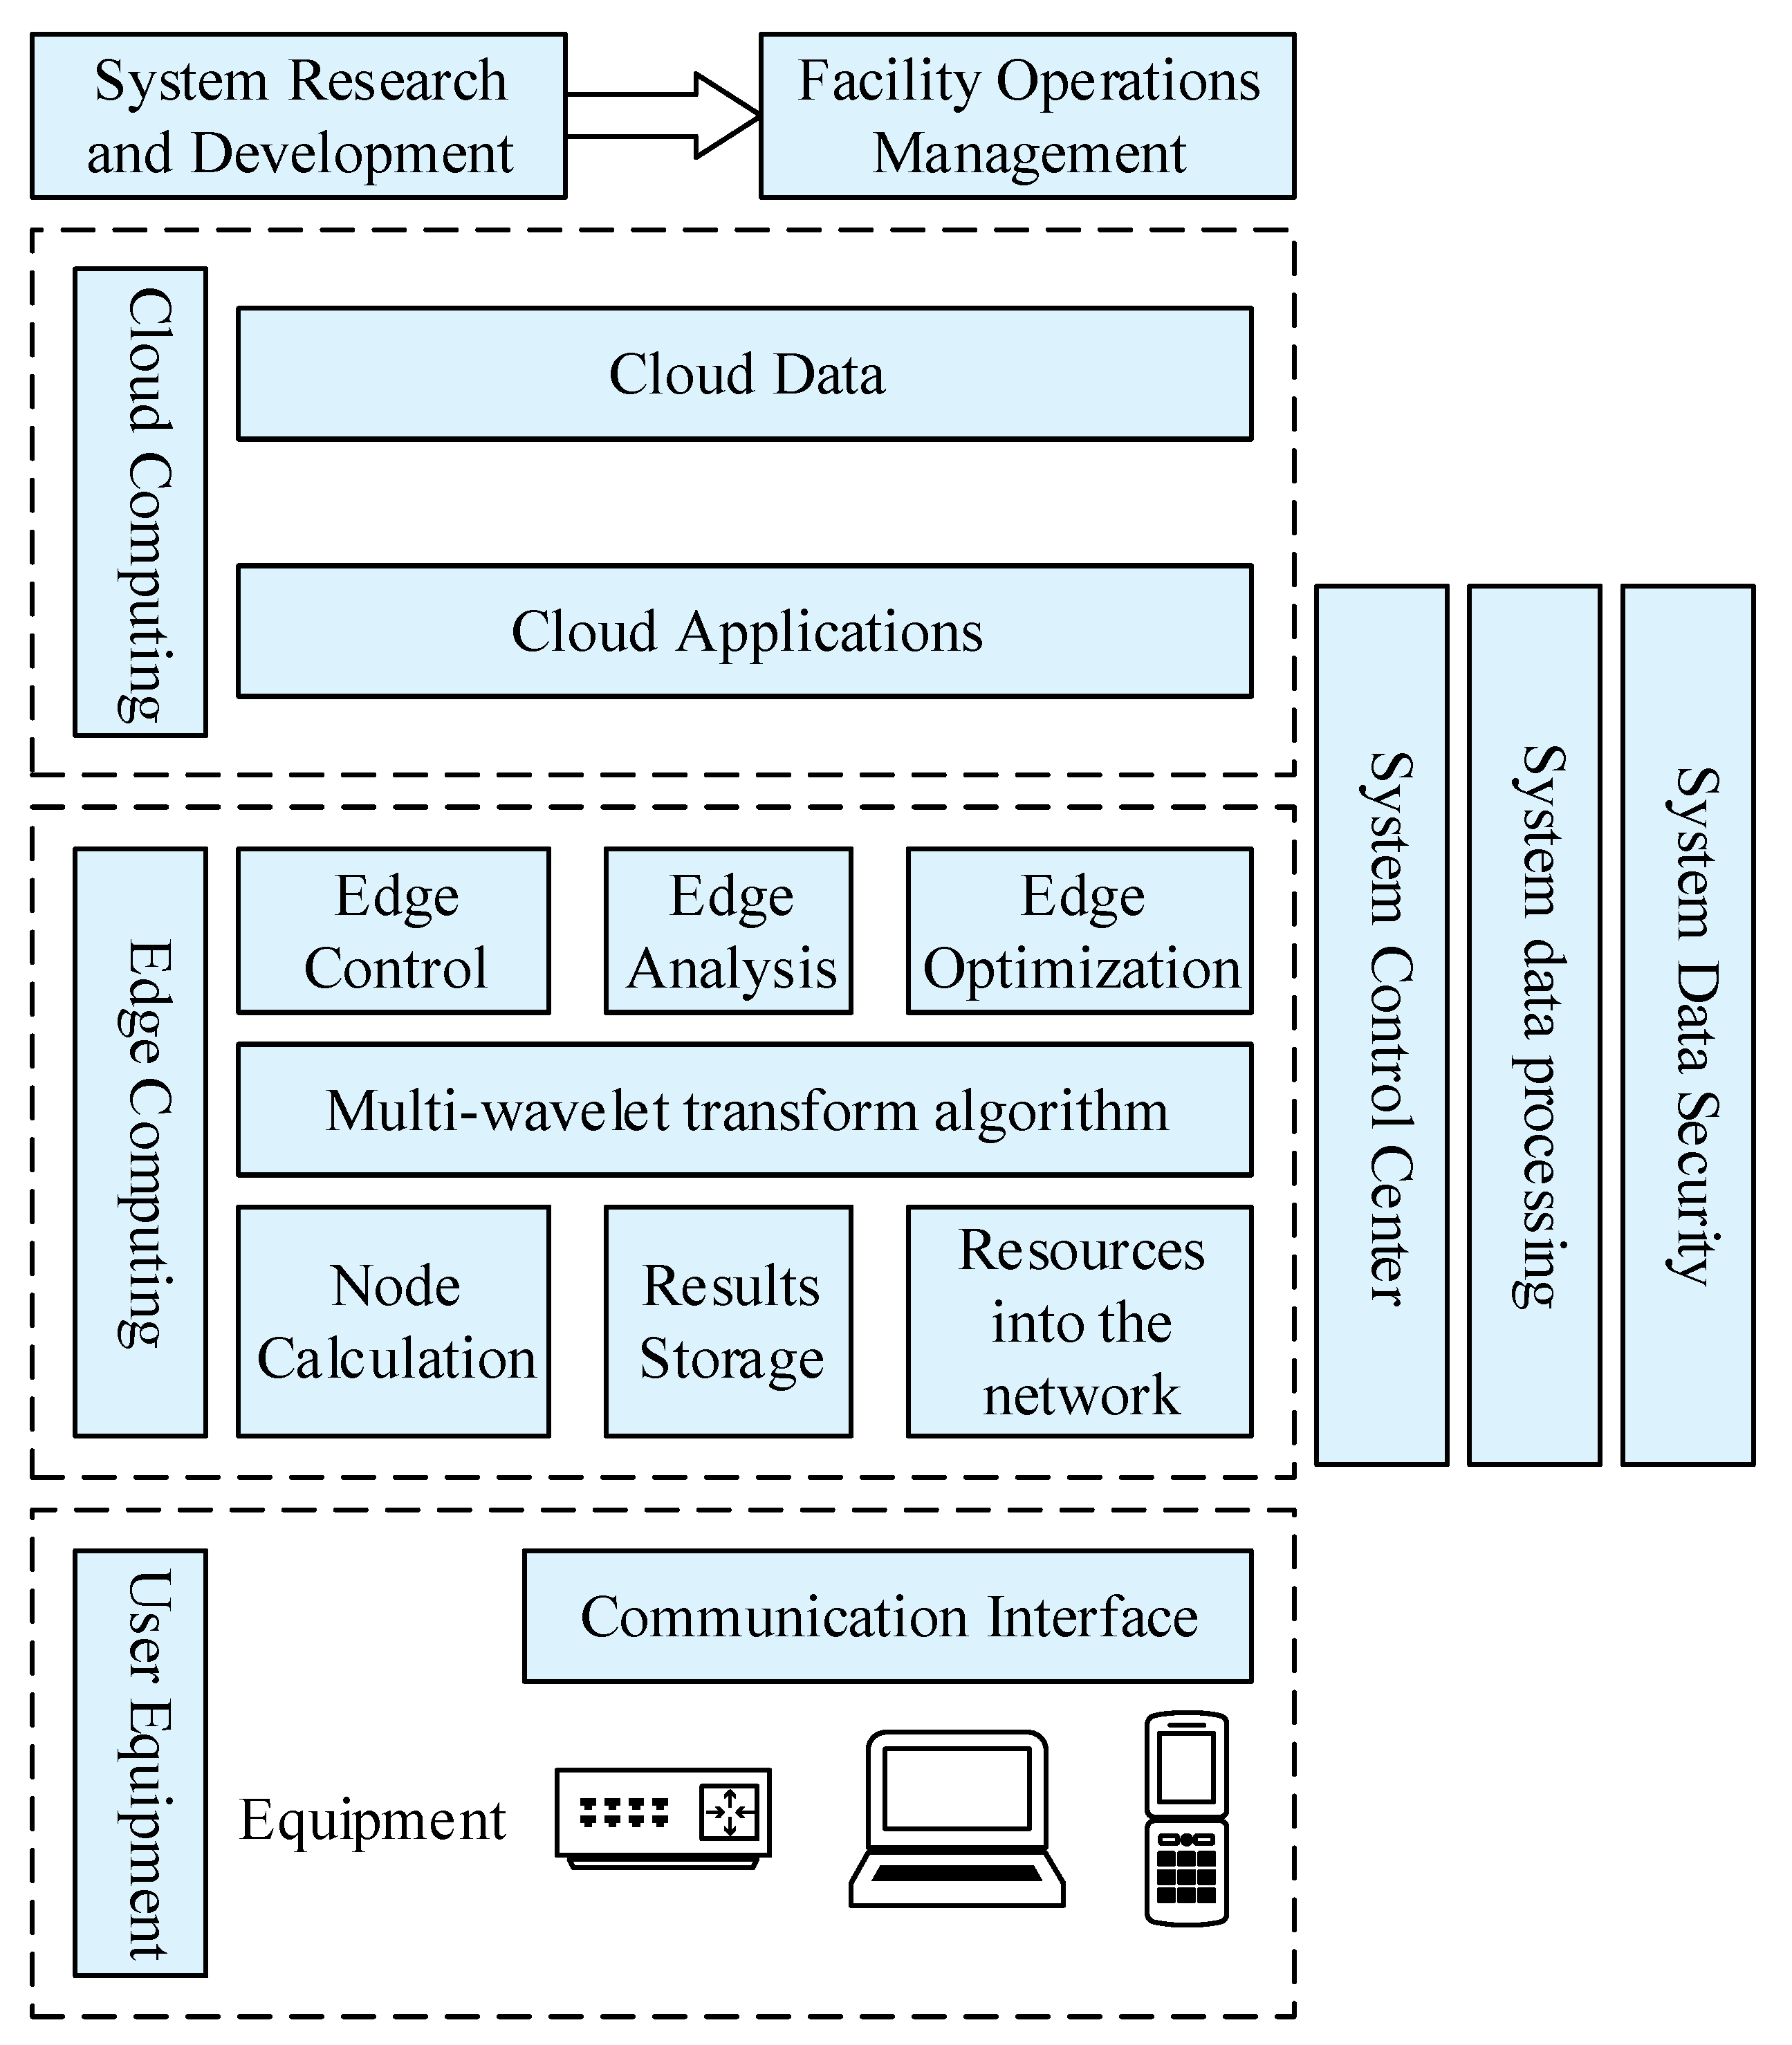
The edge computing network model mainly consists of cloud computing, communication network, edge server, and power terminal. This computing network determines the overall data processing and data storage capabilities through the performance of devices in each layer. The data interaction across layers is completed through the communication network [
23]. All users and devices of the power IoT collect data through terminals, and the collected terminal data is used as the input quantity of the system. The edge server operation framework is shown in
Figure 2.
As shown in
Figure 2, the operation process of the system is divided into three processes: cloud computing, edge computing, and user devices. User devices interact with edge computing through a communication interface. Edge computing consists of three sub-systems: system control center, system data processing, and system data security for the control, operation, and maintenance of the whole system. The multiwavelet transform algorithm is defined in the edge layer and is responsible for data collection, which is presented in the next section. Moreover, edge computing could benefit the applications, computing resources and data provided by the cloud layer. Data transmission between edge and cloud happens when the data needs to be processed in the main datacenter. In this case, only the necessary information is transmitted in order to minimize latency.
2.2.3. Data Collection Based on Orthogonal Discrete Multiwavelet Transform Algorithm
With the help of multiresolution analysis, it is possible to analyze the multiwavelet function motion space by means of the following equation:
where,
is an integer that indicates the number of spatial bases. According to the above equation, power edge calculation input data conforming to the multiwavelet algorithm can be represented by the orthogonality of the scale function and multiwavelet space function as follows:
where
and
denote the initial and terminal functions of the multiwavelet function moving space in the multiresolution analysis, respectively. The two are expanded on the data, and the expressions are:
and
In Equations (3) and (4), the multiwavelet space shifting initial function is called the scale function in the calculation application process, and the end function that will appear in the application process is called the wavelet function in this algorithm. The following functional relationship equations describe the output with the help of the orthogonal principle:
and
It can be seen through Equations (5) and (6) that the following problems remain in the relationship between the two: the scale function and the wavelet function can only respond to the movement of the space through the beginning and end functions, and it is also necessary to solve for the decomposition coefficients of the space function, which need to be decomposed to obtain the space function in the method proposed in this study. The decomposed function is:
In the decomposed function, its spatial decomposition coefficients also need to be spatially transformed by data translation and scaling, and the final double-scale function is represented by the following function:
where
denotes the angle coefficient of the dual scale function, according to:
where 1 denotes the angle coefficient of the dual scale function, according to:
Through the exposition of Equations (1)–(10), it is possible to output the multiwavelet function space-shifting initial function, that is, the scale function, which is expressed through the functional relationship equation using the following equation:
Due to the complexity of the above equation, a simplification process is performed to facilitate the calculation to obtain:
The simplified wavelet function is expressed through the following equation:
The spatial decomposition of the moving signal using the data space projection approach again results in the output of the following function:
The above equation indicates that the spatially shifted original signal can be obtained from the summation of functions on space, i.e., it can be expressed as
According to the derivation process of the scale function, the spatial decomposition existence relation is obtained and expressed as:
Substituting the above equation into the spatial shift decomposition formula, we finally obtain the following:
The orthogonal transformation of the scale space function and the wavelet function can then result in a reconstructed expression for the multiwavelet function, expressed by the following function:
Edge computing can complete the calculation using data from the device data collected from multiple channels, and the obtained data will be processed to complete the composition of the power IoT.
2.3. Smart Grid High-Voltage Transmission Line Condition Monitoring Intelligent Sensing Design
According to the demand for the development of the ubiquitous IoT of electric power, the intelligent sensing that constitutes the underlying structure of IoT is designed in conjunction with the overall system design scheme.
2.3.1. Overall Design of Intelligent Sensing
The overall structure of intelligent sensing includes the sensor nodes, microcontroller, and the modules for communication, information positioning, and energy extraction. Sensor nodes can be used to collect various status parameters in transmission lines, such as voltage, current, temperature and humidity, wire dance, insulator discharge, arc sag, wind deflection, etc. [
24].
The microprocessor collects and processes the corresponding data and later uploads it to the server side through the wireless communication module, thus, realizing the communication between the intelligent sensing terminal and the server side. Among the structure components, the sensor nodes collect data intermittently, and according to the varying demands for data, different data collection and sending cycles are set to reduce power consumption of the terminal as much as possible.
2.3.2. High-Voltage Transmission Line Condition Monitoring Sensing Network Node Design
The main functional modules of the sensor network node consist of a real-time multitasking management module, a Socket communication module, a configuration management module, an IEEE1451 protocol processing unit, a TEDS electronic data form, and a TII intelligent interface module. The main parameters measured by the sensor network, including phase volume, have a signal over-zero detection method and discrete Fourier algorithm. The over-zero detection method is simple to implement but susceptible to interference, and the discrete Fourier algorithm suffers from frequency leakage when the frequency of the collected signal changes.
2.3.3. Optimal Sensor Configuration Design for High Voltage Transmission Line Droop Monitoring
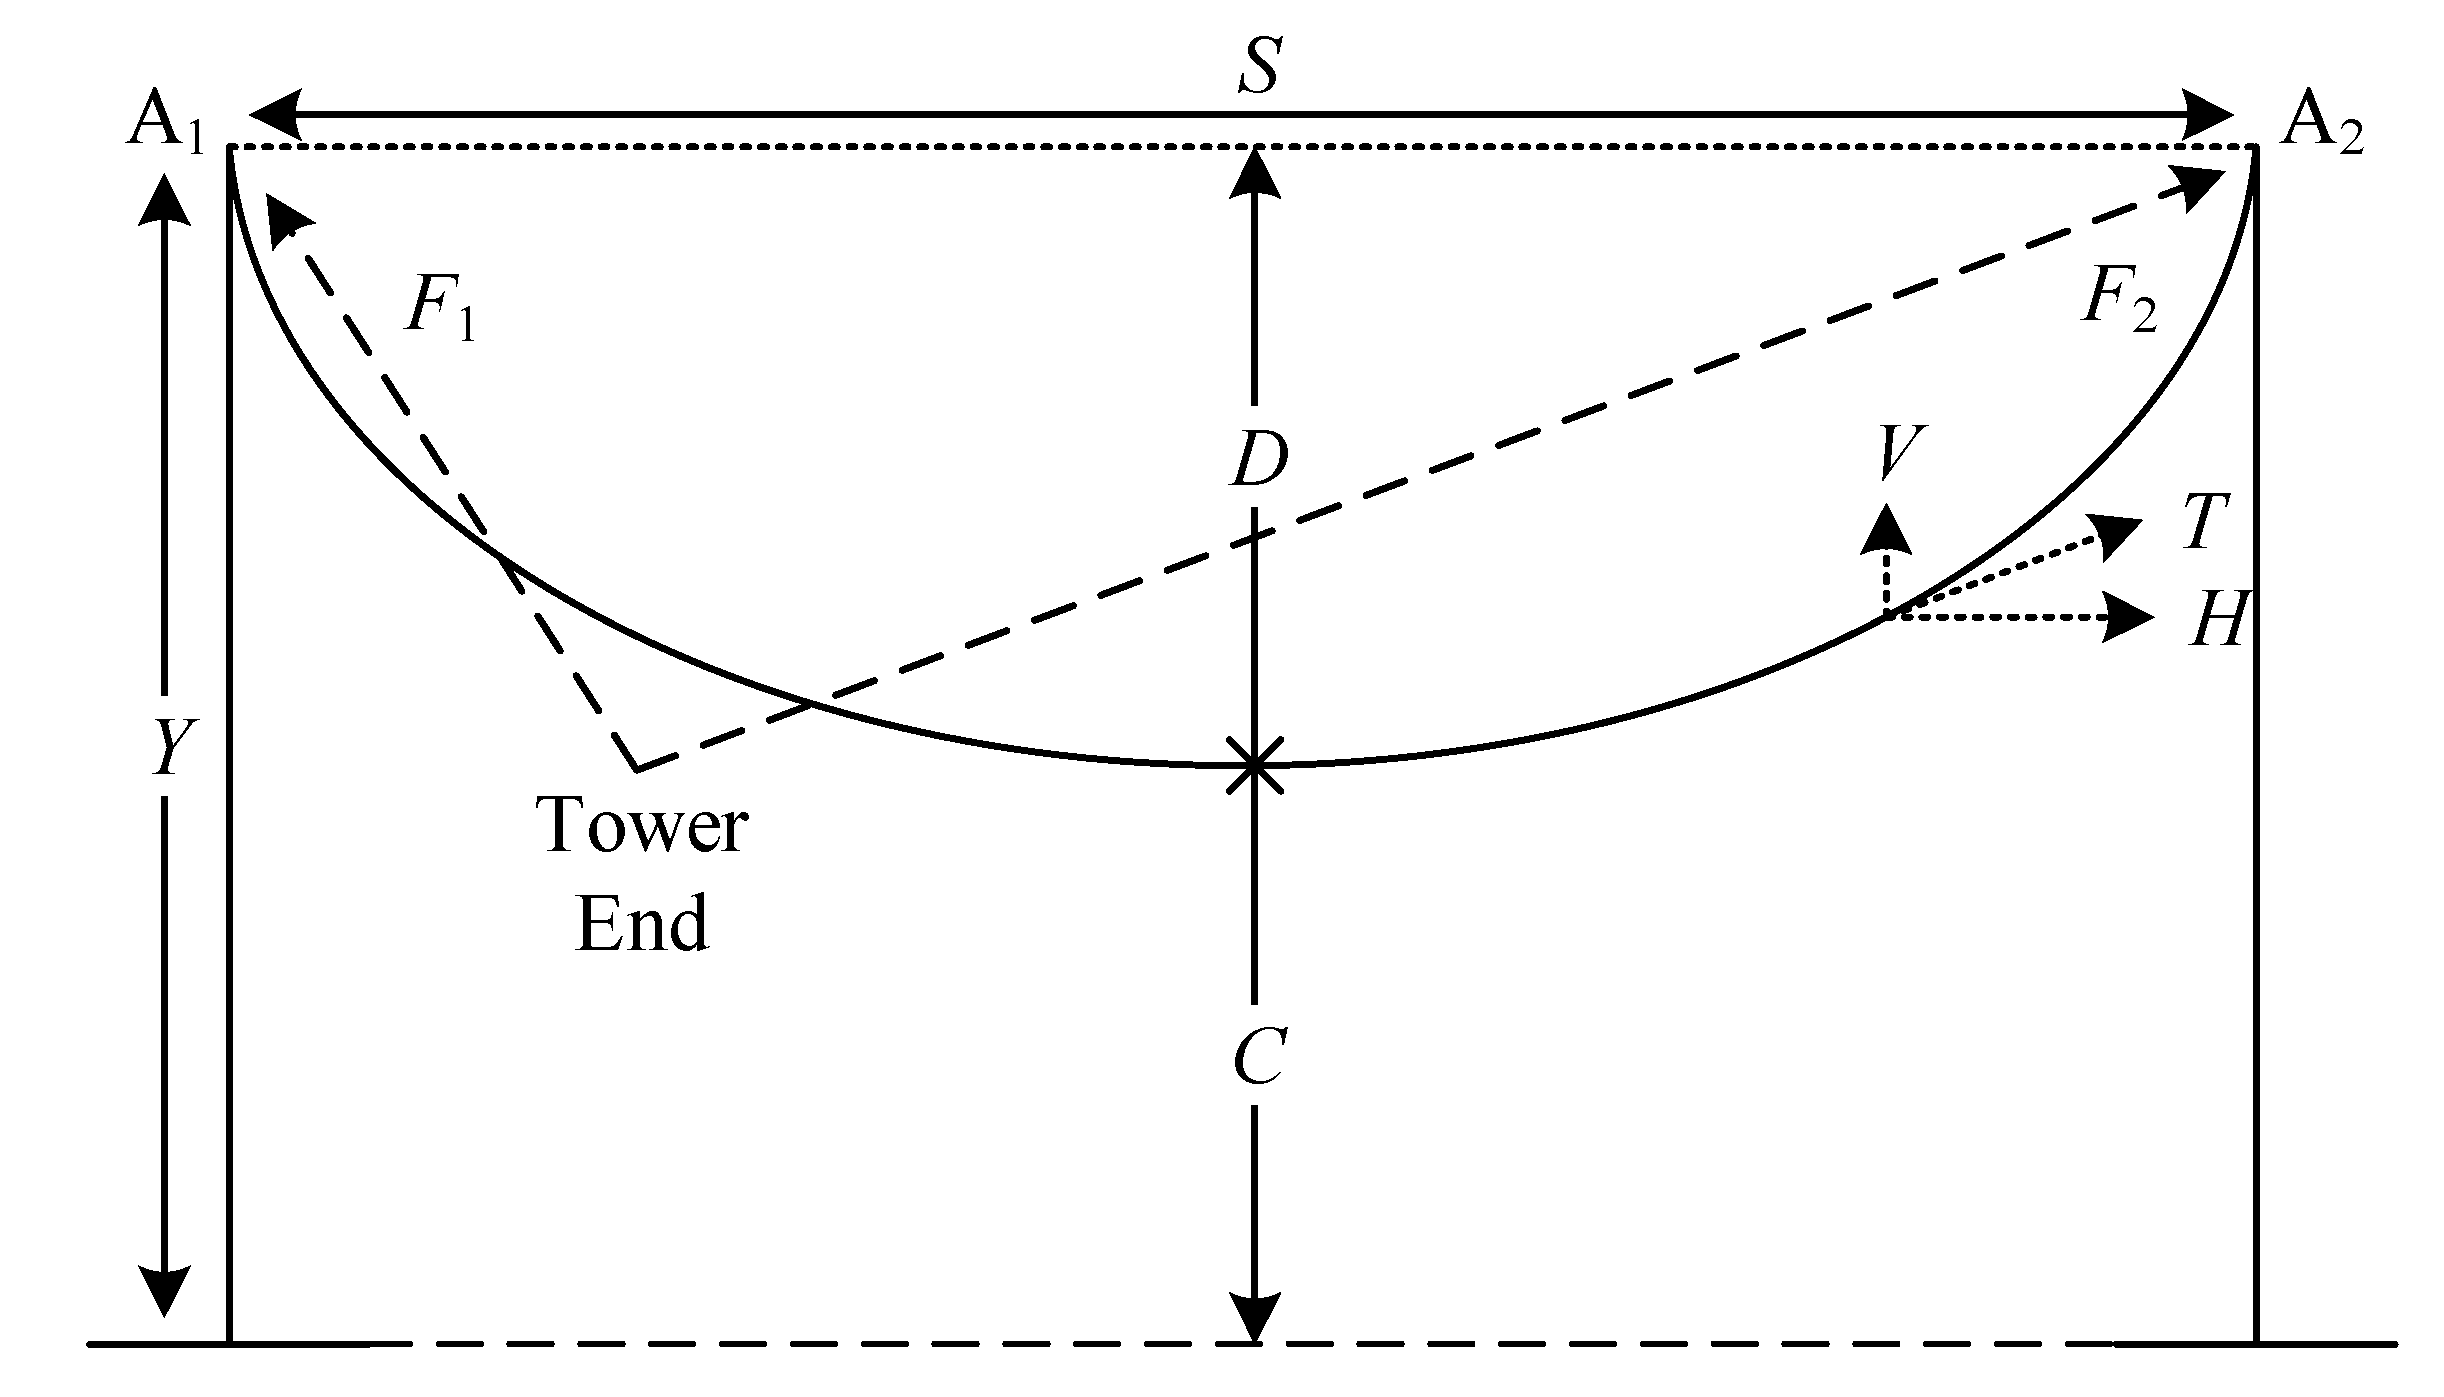
The monitoring of the droop can be determined by other parameters, but the tension is easily accessible and better reflects the change in the droop. Because the transmission line is suspended between two towers, a static model of the transmission line is usually used to describe its mechanical droop due to its weight,
W. Deriving the relationship for a single horizontal span configuration and extending it to any number of towers, the horizontal span configuration to measure transmission line sag is shown in
Figure 3.
According to the tension measurement, the drape
can be expressed as:
where
and
are the vertical and horizontal components of the line tension, respectively, and
is the span number of the horizontal span model.
With the change in line temperature
, the line length changes from
to
:
where
is the linear thermal expansion coefficient and
is the conductor temperature at length
.
The droop corresponding to the new length
can be expressed as:
Then the relationship between arc drape and tension is:
where,
is the span of the transmission line between the two towers.
In the Figure, the drape-tension relationship of the towers A and B2 is:
In order to obtain the location of the sensors during the elimination process, while maintaining the observability of the line, the problem is expressed as a linear integer programming, which yields:
where
is a function with non-zero terms,
and
are two consecutive towers,
is the set of connections, and
is the decision variable.
With the proposed optimal sensor configuration method, the need for sensors is greatly reduced. As a result, the measurement data required for droop estimation is also reduced, and the accuracy of the estimation is not affected.
3. Smart Grid High-Voltage Transmission Line Condition Detection System
The system design includes sensing terminal design and software design, which are combined to build the transmission line status Internet of Things. The system software design is based on the sensing terminal design and combined with the system requirements to realize the functions of the system software. This section explains the system design from several aspects, such as the design of the system structure, function, and communication.
3.1. System Architecture Design
The high-voltage transmission line smart grid system is designed with a three-layer C/S architecture, which divides the application functions into three parts: the representation layer ULL, the business logic layer BLL, and the data access layer DAL. The structure of the high-voltage transmission line smart grid system is shown in
Table 1. The representation layer is the user interface part of the application and is located at the uppermost layer of the three-layer architecture, receiving user input data and displaying the processed data needed by the user through the interface. The business logic layer is the core part of the system software, which accesses the data uploaded by the intelligent sensing terminal through socket communication, parses it, and stores it in the database, and then it is used for data transfer and business logic processing of the representation and data layers. The data access layer is the data management system through the ADO.NET data access interface, used to realize the operations of adding, deleting, checking, and changing data in the database and feeding the results back to the business logic layer.
3.2. System Functional Design
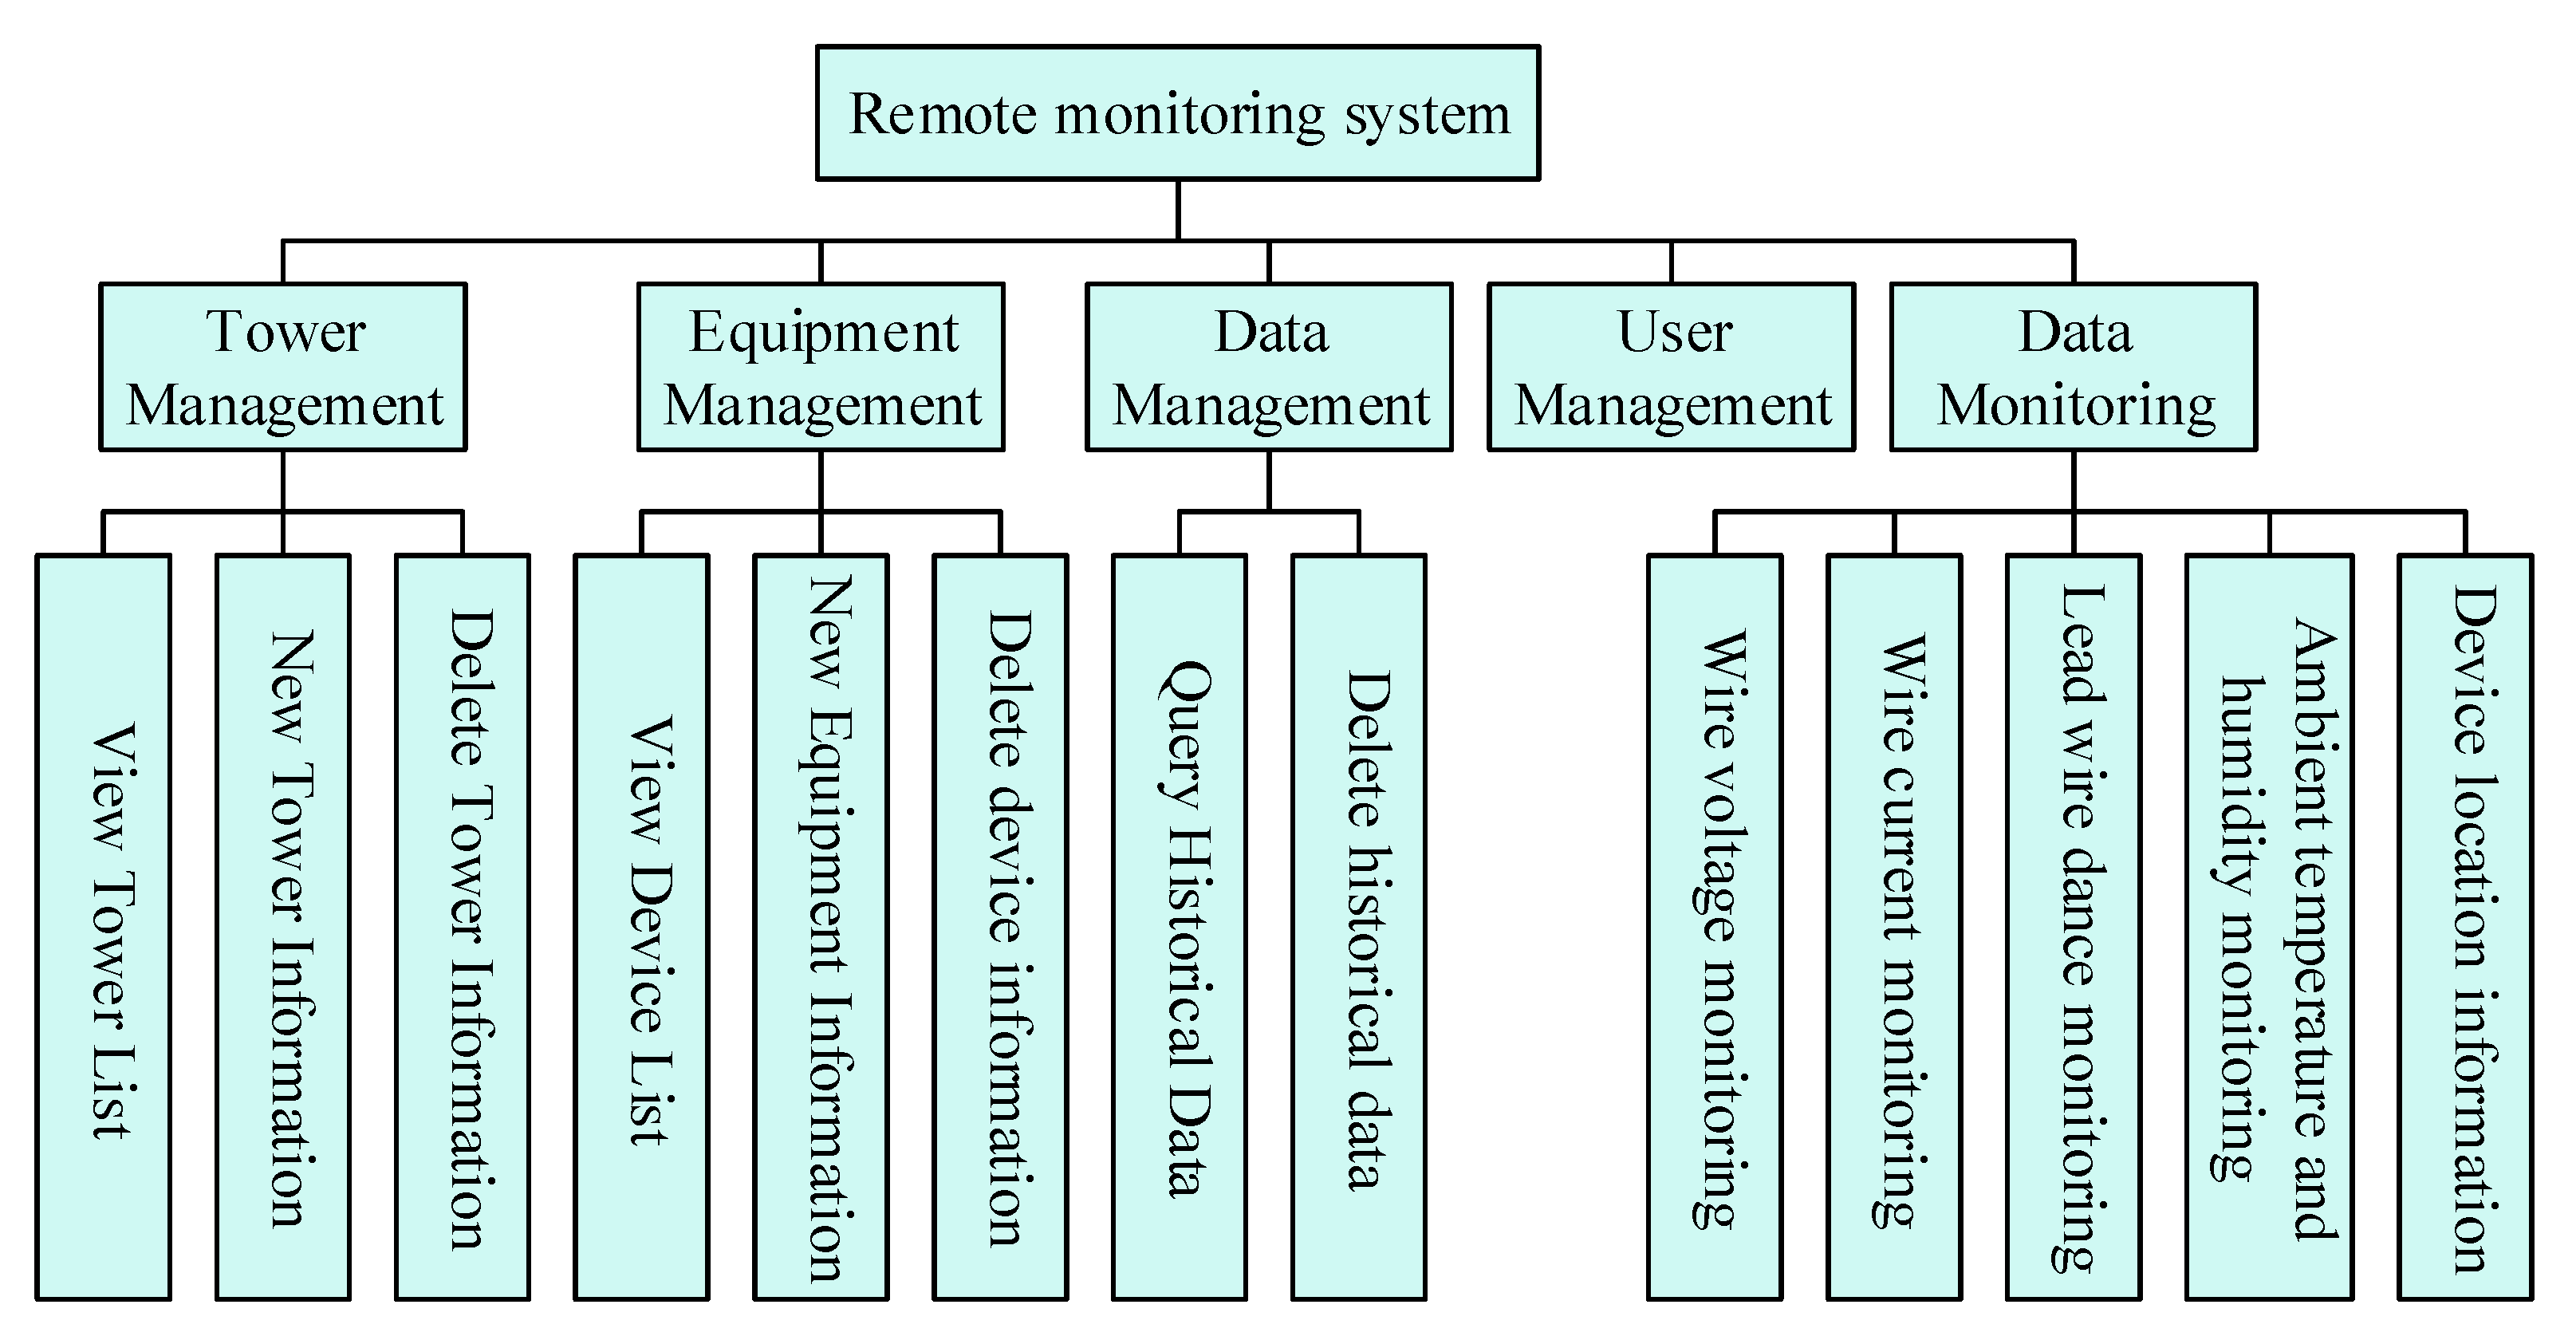
According to the functional requirements of the system, the functional structure of the system is designed, in general, following the design principles of top-down, gradual improvement, modularization, and structuring. The transmission line condition monitoring system includes user management, tower management, equipment management, data monitoring, and data management. Detailed definitions of functions in each module are given below. The functional structure block diagram of the system software is shown in
Figure 4.
The specific functions of each module in this system are as follows:
- (1)
The tower management sub-module can show the list of towers, and create and delete tower information. The tower information only involves the tower name, and the module’s data table includes this information.
- (2)
Equipment management sub-module can show the list of all equipment. In this sub-module, you can view the name, number, positioning information of a device and the name of the tower associated with the device.
- (3)
The user management sub-module is for users to authenticate by entering their accounts and passwords and thus enter the transmission line condition monitoring system for related operations. In addition, all entered user information can be managed.
- (4)
The data management sub-module is used to query the historical data of the terminal equipment within a given time period, according to the number of all the terminal equipment associated with the tower and the type of monitoring parameters. It is also possible to delete the historical data within a certain period of time to optimize the storage space of the system.
- (5)
The data monitoring sub-module is used to show the latest data information of all the status quantities monitored by the terminal equipment associated with the tower.
3.3. Communication Design
The sensing device communicates with the server through the GPRS communication network, using TCP/IP protocol as the data transmission protocol. The commonly used protocols in the transport layer of TCP/IP protocol are the UDP protocol and TCP protocol, which are connectionless, out-of-order, and unreliable transmission protocols, but are characterized by fast transmission speeds. The TCP protocol receives packets from the application layer and splits the data stream into fixed-length packet segments for transmission. It also performs the functions of confirming the legality of datagrams, controlling the traffic transmission within a certain period of time, handling network delays, detecting the format of datagrams sent by the source host, etc. It provides highly reliable data communication between the sensing device and the server.
- (1)
Communication link establishment
When the sensing terminal device collects data, the collected data are packetized at the application layer through a custom data communication protocol, and then, TCP packets are added to convert it into TCP packets to provide an end-to-end interface. The IP header is added to form an IP datagram, and the IP address addressing is used to select the best route between networks for data transmission.
- (2)
Data communication protocol design
In order to achieve standardized, automated, and transparent transmission of transmission line status monitoring information, the data transmission protocol for communication between the sensing terminal equipment and the server is designed, and the data is packetized, as the protocol of the application layer so as to establish a standardized and mutually compatible information management system. After receiving the data, the server-side parses the data in accordance with this data communication protocol format, after which, the data are stored in the database. The sensing terminal device has intermittent collection and automatic upload, and the data transmission protocol uses the data frame format, as shown in
Table 2.
4. Monitoring System Testing and Analysis
The sensor and system design is detailed in the previous section. The performance of the designed sensors was first tested, then the functional and non-functional aspects of the system are tested to verify its overall operational capability.
4.1. System Simulation Experiment
4.1.1. Experimental Parameter Settings
Python is used to simulate the algorithm ODMT mentioned in this paper. In total, 50 to 100 wireless rechargeable sensors are randomly placed within a 400 m × 400 m mobile sensor network. The sensors have a transmission range of 50 m. The MS acts as a mobile receiver and moves through the network collecting data without stopping. The battery rating of each sensor is 1 J, and the cache rating is 250 KB. In addition, the sensor nodes randomly generate 256 bits of burst data with the specific simulation parameters shown in
Table 3.
4.1.2. Experimental Results and Analysis
In this section, the performance of the ODMT proposed in this paper is evaluated through simulation experiments and compared with the EGRPM [
19] algorithm, MECA [
20] algorithm, and EEDD [
21] algorithm in the same sensor scale with a total time of Ts, to verify the effectiveness of the proposed ODMT. The simulation results show that the ODMT ensures a high acceptance rate of the network, which enables the sensor network to operate properly.
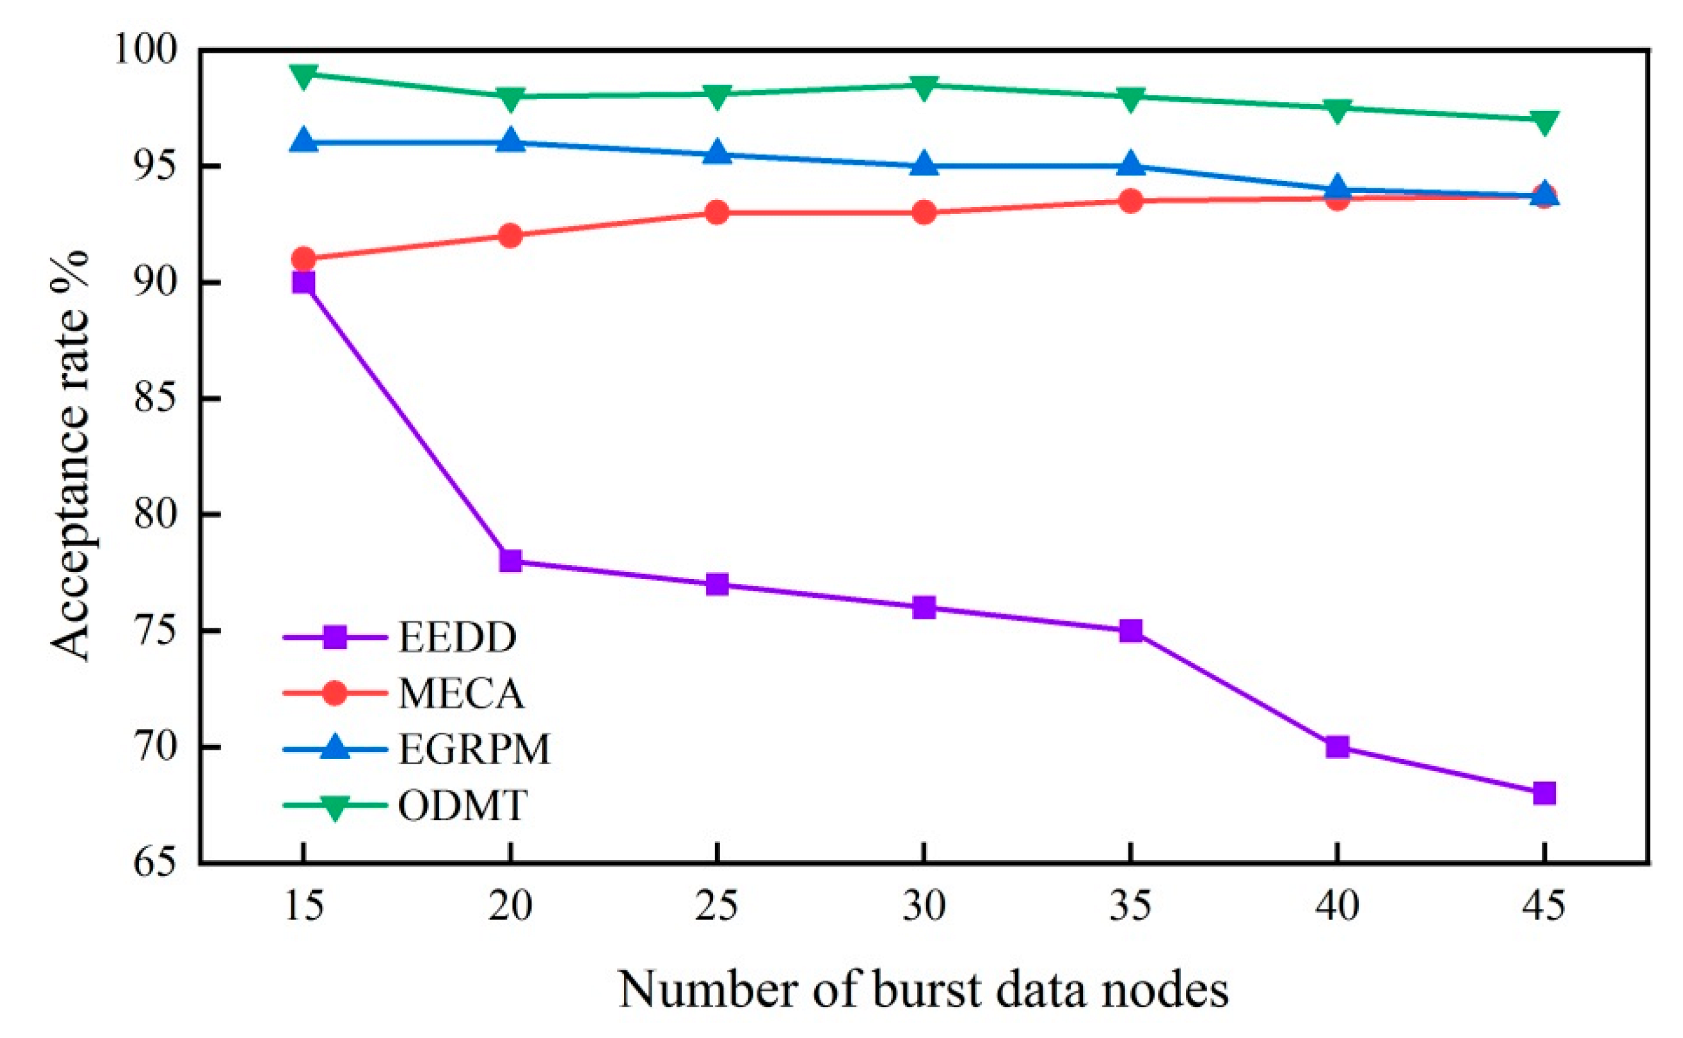
Figure 5 shows the average energy consumption for 100 sensor nodes. As the number of burst data nodes increases, the acceptance rate of the experimental algorithm decreases from 99% to 98%, which is a small decrease. The acceptance rate of the EEDD algorithm decreases from 90% to 68% as the number of burst data nodes increases, which is a relatively large decrease. Compared with other algorithms, the acceptance rate of the algorithm in this paper is higher, and the reduction is negligible.
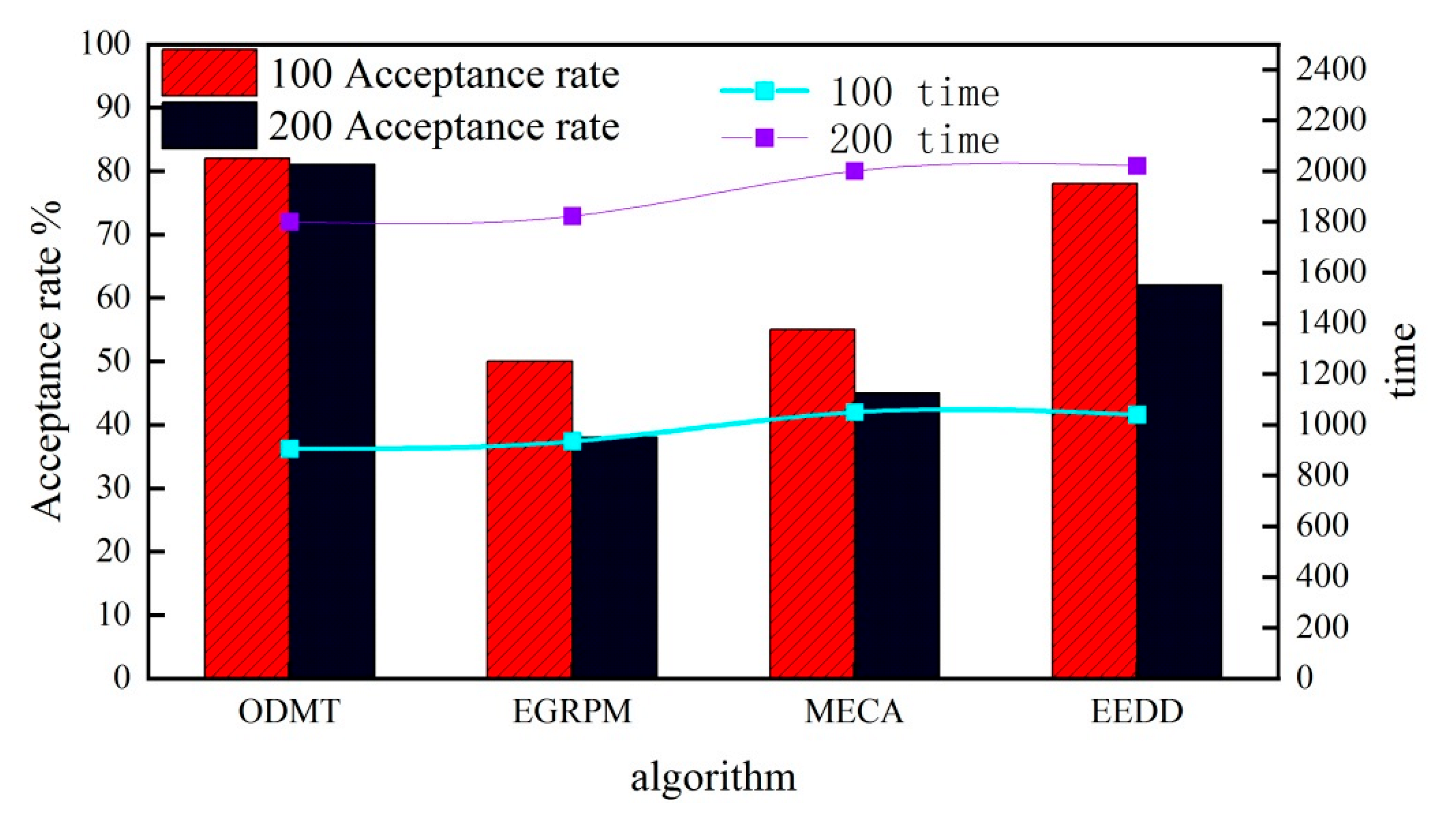
The network survival time is defined as the time when the first sensor node dies in the transmission process, and for a network size of 100 and 200 nodes where each node has different initial energy, it is the time when there remains 20 fixed nodes in the network to collect the burst data and transmit the burst data.
Figure 6 shows the network survival time when the number of sensor nodes is 100 or 200; ODMT and EGRPM [
19], MECA [
20], and EEDD [
21] algorithms have similar network survival times, over 2000. However, in terms of acceptance rate, ODMT always had a high acceptance rate of more than 80%. The comparison shows that the algorithm of this paper can accurately represent the network acceptance capability of different sensors.
The results of these experiments have been summarized in
Table 4. The results presented in
Table 4, confirm the efficiency of ODMT in achieving a high acceptance rate and at the same time, maintaining a competitive network survival time.
4.2. Measurement Performance Test and Analysis of State Parameters
4.2.1. Current Test
The rated current value of the experimental line is 500 A, and the data monitored according to the existing current sensor data values and the current transformer calibrator are shown in
Table 5. When the measured current exceeds 20% of the rated current, the ratio difference and phase difference change values are small, the overall measurement errors are approx. 3%, which is very small, and the ratio difference change is approx. 10°. This demonstrates that the stability of current sensing monitoring is good.
4.2.2. Voltage Test
This test required a high-voltage transmission line with the regulator and step-up transformer for the simulation, using a ratio of 1:120 step-up transformer, one end of which is connected to the high-voltage lead, one end of which is connected to earth. The monitoring terminal was suspended at 4 m, and this was followed by a multimeter to obtain the voltage regulator readings of input voltage,
, and voltage sensor output voltage,
;
Table 6 shows the voltmeter readings. The two values,
and
, are closely related to each other; thus, with the voltage sensor at a height of 4 m, the input voltage and output voltage difference ratio of about 5% and the value of distributed capacitance to the ground close to stable, demonstrate that the output voltage sensing monitoring is also relatively good.
4.2.3. Temperature Test
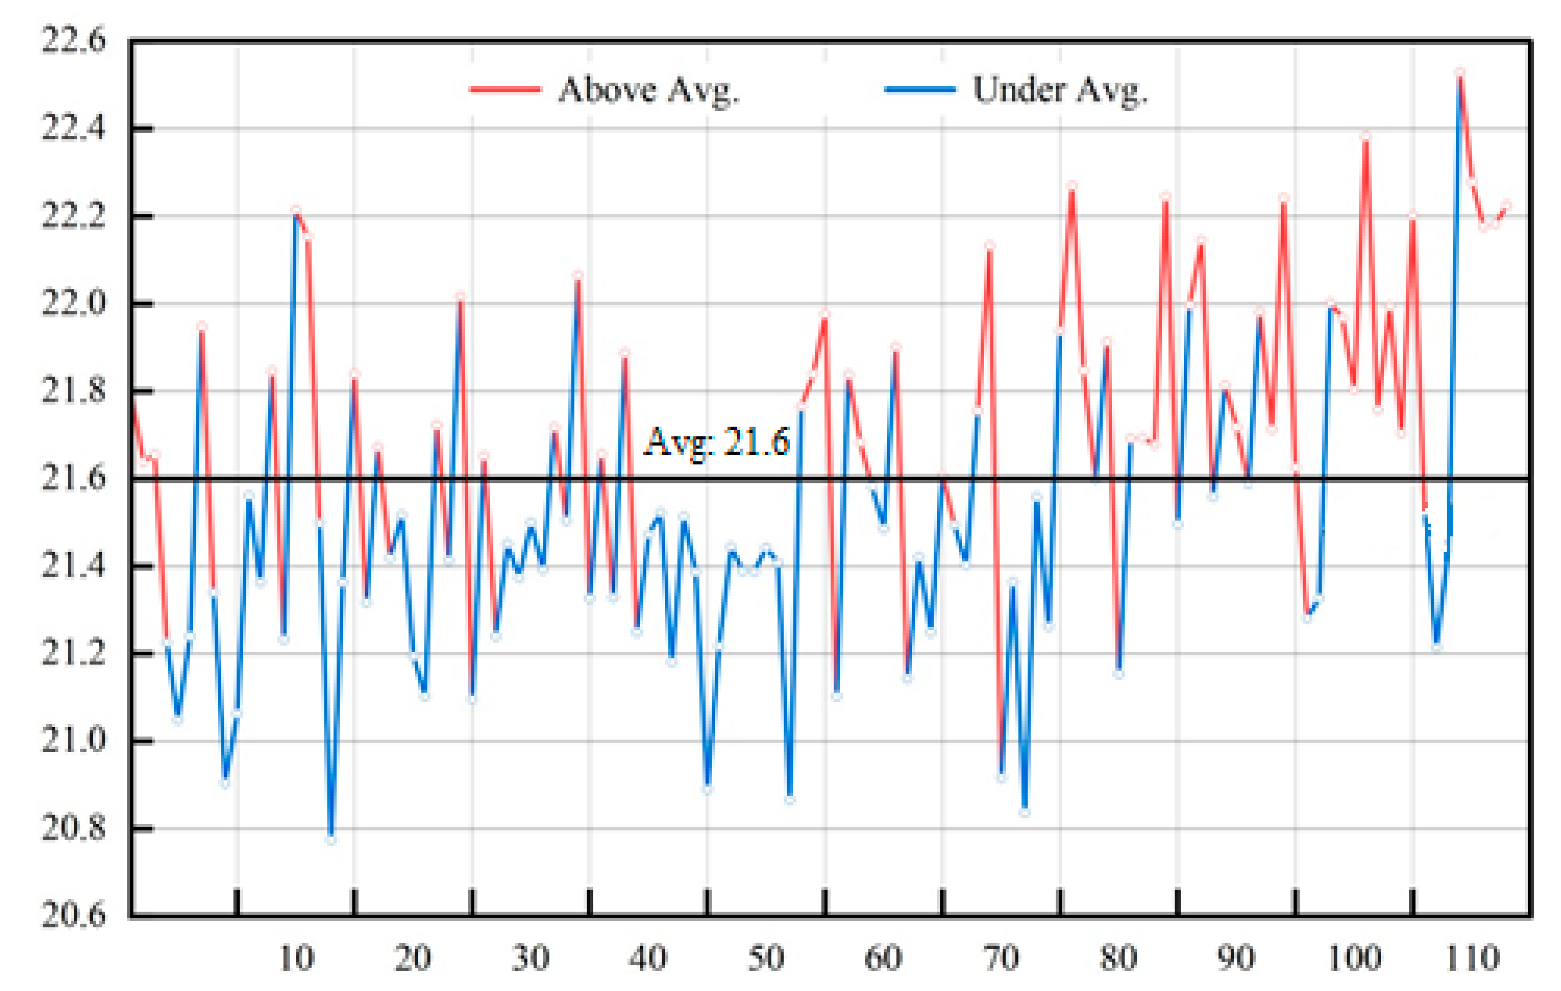
The experiment was conducted in a temperature-controlled chamber under existing experimental conditions to test the temperature sensing status monitoring. The temperature of the temperature-controlled chamber was controlled at 21.6 °C by setting this as the average temperature, and temperature sensors measured the temperature for 118 moments. The measurement results of the temperature sensor are shown in
Figure 7. The error range of temperature sensing monitoring is within ±1 °C, which meets the temperature sensing monitoring design requirements.
4.3. Communication Testing
The monitoring terminal transmits data to the monitoring host through the wireless module a total of 30 times. If no reply is received or there is a check error, etc., which makes the communication fail, the monitoring terminal will resend the data after 5 s. Each time the data is sent, the sending indicator will flash once. The data are transmitted by the monitoring terminal at different distances, and the success of communication is judged by the number of blinks of the indicator.
Table 7 shows the test results of the communication test. The results prove that the communication distance is within 200 m, the communication reliability is large, and the error rate is zero. The communication error rate increases when the communication distance exceeds 200 m; however, it is approx. 7%, which is within the acceptable range of error.
5. Conclusions
In this paper, the ODMT algorithm was used to collect data on the state of high-voltage transmission lines in smart grids, and detect them through state monitoring sensors. This research also utilized an intelligent system design to monitor the state of high-voltage transmission lines. This approach was analyzed through several simulation studies, and its efficiency was compared to similar systems. The results showed that the proposed method can achieve a higher acceptance rate compared to previous methods, and, at the same time, obtain a longer network survival time. According to the results, ODMT demonstrates a higher resistance of acceptance rate (varying about 1%) compared to previous works. This means the proposed algorithm can accurately represent the network acceptance capacity of different sensors. In addition, when the current exceeds 20% of the rated current, the ratio difference and phase difference change values are small; the overall measurement error is approx. 3%. Voltage sensing monitoring showed an input voltage to output voltage difference ratio of approx. 5% at a height of 4 m. The error range of temperature sensing monitoring is within ±1 °C. In summary, the measurement performance of each state quantity is good. Testing communications showed that, when the communication distance is within 200 m, the communication reliability is large, and the error rate is zero. When the communication distance is more than 200 m, the communication error rate will be increased and kept at approx. 7%, which is within the acceptable range of error. These results confirm the desired performance of the model proposed in this paper in simulated real-world applications.
Although this research tried to evaluate various functional aspects of the proposed method, this research still has limitations in terms of tested operational scenarios that can be resolved in future research. Additionally, the combination of optimization techniques for improving the configuration of the model is one of the aspects that can be improved in this research, which will be investigated in future works.
Author Contributions
Conceptualization, M.H. and N.K.; methodology, M.H.; software, N.K. and C.Z.; validation, M.H., N.K. and C.Z.; formal analysis, M.H.; investigation, N.K.; resources, N.K. and C.Z.; writing—original draft preparation, M.H. and C.Z.; writing—review and editing, N.K.; All authors have read and agreed to the published version of the manuscript.
Funding
This research received no external funding.
Data Availability Statement
The data that support the findings of this study are available on request from the corresponding author.
Acknowledgments
The authors would like to thank the anonymous reviewers for their valuable comments.
Conflicts of Interest
The authors declare no conflict of interest.
References
- Almaita, E.; Abdelsalam, E.; Al Nawafah, H.; AlShkoor, S.; Almomani, F. Analysis and feasibility of integrating a new and novel hybrid solar chimney power plant with a traditional electrical grid. Int. J. Energy Res. 2022, 46, 9194–9205. [Google Scholar] [CrossRef]
- Good, N.; Ellis, K.A.; Mancarella, P. Review and classification of barriers and enablers of demand response in the smart grid. Renew. Sustain. Energy Rev. 2017, 72, 57–72. [Google Scholar] [CrossRef]
- Joo, J. Infusion process of smart grid-related technology based on coping theory. Sustainability 2019, 11, 3445. [Google Scholar] [CrossRef]
- Rahbari-Asr, N.; Ojha, U.; Zhang, Z.; Chow, M. Incremental welfare consensus algorithm for cooperative distributed generation/demand response in smart grid. IEEE Trans. Smart Grid 2017, 5, 2836–2845. [Google Scholar] [CrossRef]
- Shair, J.; Li, H.; Hu, J.; Xie, X. Power system stability issues, classifications and research prospects in the context of high-penetration of renewables and power electronics. Renew. Sustain. Energy Rev. 2021, 145, 111111. [Google Scholar] [CrossRef]
- Liu, Y.; Li, Y.; Liang, H.; He, J.; Cui, H. Energy routing control strategy for integrated microgrids including photovoltaic, battery-energy storage and electric vehicles. Energies 2019, 12, 302. [Google Scholar] [CrossRef]
- Hwang, L.C.; Chen, C.S.; Ku, T.T.; Shyu, W.C. A bridge between the smart grid and the internet of things: Theoretical and practical roles of lora. Int. J. Electr. Power Energy Syst. 2019, 113, 971–981. [Google Scholar] [CrossRef]
- Hui, H.; Ding, Y.; Shi, Q.; Li, F.; Yan, J. 5g network-based internet of things for demand response in smart grid: A survey on application potential. Appl. Energy 2020, 257, 113972. [Google Scholar] [CrossRef]
- Lv, X.; Li, M. Application and research of the intelligent management system based on internet of things technology in the era of big data. Mob. Inf. Syst. 2021, 2021, 6515792. [Google Scholar] [CrossRef]
- Zhang, Z.; Wang, Q. Application status and prospects of 5G technology in distribution automation systems. Wirel. Commun. Mob. Comput. 2021, 2021, 5553159. [Google Scholar] [CrossRef]
- Zhang, F.; Wang, K. Key technologies of smart factory machine vision based on efficient deep network model. 3c Empresa Investig. Y Pensam. Crítico 2023, 12, 15–35. [Google Scholar] [CrossRef]
- Hung, L.L. Intelligent sensing for internet of things systems. J. Internet Technol. 2022, 23, 185–191. [Google Scholar]
- Aranda, J.; Costa, R.; Vargas, V.; Pereira, P.; Barbosa, J.; Vianna, M.P. Context-aware edge computing and internet of things in smart grids: A systematic mapping study. Comput. Electr. Eng. 2022, 99, 107826. [Google Scholar] [CrossRef]
- Wang, W.; Yang, S.; Yang, J.; Qi, W.; Hu, M. Optimization analysis of wireless charging system for monitoring sensors overhead the hvpls based on impedance matching. IEEE Trans. Electromagn. Compat. 2018, 61, 1207–1216. [Google Scholar] [CrossRef]
- Yang, Z.; Luo, Y.; Zeng, X.; Wu, P.; Cao, L. Power source based on electric field energy harvesting for monitoring devices of high-voltage transmission line. IEEE Trans. Ind. Electron. 2021, 68, 7083–7092. [Google Scholar]
- Zhu, X.; Choulli, E. Acquisition and communication system for condition data of transmission line of smart distribution network. J. Intell. Fuzzy Syst. 2018, 35, 4107–4120. [Google Scholar] [CrossRef]
- Liu, G.; Jia, L.; Hu, T.; Deng, F.; Chen, Z.; Sun, T.; Feng, Y. Novel data compression algorithm for transmission line condition monitoring. Energies 2021, 14, 8275. [Google Scholar] [CrossRef]
- Zeng, H.; Zuo, P.; Deng, F.; Zhang, P. Monitoring system of transmission line in mountainous area based on lpwan. Energies 2020, 13, 4898. [Google Scholar] [CrossRef]
- Naghibi, M.; Barati, H. EGRPM: Energy efficient geographic routing protocol based on mobile sink in wireless sensor networks. Sustain. Comput. Inform. Syst. 2020, 25, 100377. [Google Scholar] [CrossRef]
- Huang, J.; Meng, Y.; Gong, X.; Liu, Y.; Duan, Q. A novel deployment scheme for green internet of things. IEEE Internet Things J. 2014, 1, 196–205. [Google Scholar] [CrossRef]
- Sharma, V.; You, I.; Kumar, R. Energy efficient data dissemination in multi-UAV coordinated wireless sensor networks. Mob. Inf. Syst. 2016, 2016, 8475820. [Google Scholar] [CrossRef]
- Collier, S.E. The Emerging Enernet: Convergence of the Smart Grid with the Internet of Things. IEEE Ind. Appl. Mag. 2017, 23, 12–16. [Google Scholar] [CrossRef]
- Kumar, V.; Kumar, A.; Batth, R.S.; Rashid, M.; Gupta, S.K.; Raghuraman, M. Efficient data transfer in edge envisioned environment using artificial intelligence based edge node algorithm. Trans. Emerg. Telecommun. Technol. 2020, 32, e4110. [Google Scholar] [CrossRef]
- Hassani, A.; Plata-Chaves, J.; Bahari, M.H.; Moonen, M.; Bertrand, A. Multi-task wireless sensor network for joint distributed node-specific signal enhancement, lcmv beamforming and doa estimation. IEEE J. Sel. Top. Signal Process. 2017, 11, 518–533. [Google Scholar] [CrossRef]
| Disclaimer/Publisher’s Note: The statements, opinions and data contained in all publications are solely those of the individual author(s) and contributor(s) and not of MDPI and/or the editor(s). MDPI and/or the editor(s) disclaim responsibility for any injury to people or property resulting from any ideas, methods, instructions or products referred to in the content. |
© 2023 by the authors. Licensee MDPI, Basel, Switzerland. This article is an open access article distributed under the terms and conditions of the Creative Commons Attribution (CC BY) license (https://creativecommons.org/licenses/by/4.0/).
