Article

PLUG: A City-Friendly Navigation Model for Electric Vehicles with Power Load Balancing upon the Grid

by
Ahmad Nahar Quttoum
1,*,
Ayoub Alsarhan
2,
Mohammad Aljaidi
3 and
Mohammed Alshammari
4,*
1
Department of Computer Engineering, Faculty of Engineering, The Hashemite University, Zarqa 13133, Jordan
2
Department of Information Technology, Faculty of Prince Al-Hussein Bin AbdAllah II for Information Technology, The Hashemite University, Zarqa 13133, Jordan
3
Department of Computer Science, Faculty of Information Technology, Zarqa University, Zarqa 13110, Jordan
4
Department of Computer Science, Faculty of Computing and Information Technology, Northern Border University, Rafha 91431, Saudi Arabia
*
Authors to whom correspondence should be addressed.
World Electr. Veh. J. 2023, 14(12), 338; https://doi.org/10.3390/wevj14120338
Submission received: 10 October 2023 / Revised: 17 November 2023 / Accepted: 22 November 2023 / Published: 6 December 2023

Abstract

:
Worldwide, in many cities, electric vehicles (EVs) have started to spread as a green alternative in transportation. Several well-known automakers have announced their plans to switch to all-electric engines very soon, although for EV drivers, battery range is still a significant concern—especially when driving on long-distance trips and driving EVs with limited battery ranges. Cities have made plans to serve this new form of transportation by providing adequate coverage of EV charging stations in the same way as traditional fuel ones. However, such plans may take a while to be fully deployed and provide the required coverage as appropriate. In addition to the coverage of charging stations, cities need to consider the potential loads over their power grids not only to serve EVs but also to avoid any shortages that may affect existing clients at their various locations. This may take a decade or so. Consequently, in this work, we propose a novel city-friendly navigation model that is oriented to serve EVs in particular. The methodology of this model involves reading real-time power loads at the grid’s transformer nodes and accordingly choosing the routes for EVs to their destinations. Our methodology follows a real-time pricing model to prioritize routes that pass through less-loaded city zones. The model is developed to be self-aware and adaptive to dynamic price changes, and hence, it nominates the shortest least-loaded routes in an automatic and autonomous way. Moreover, the drivers have further routing preferences that are modeled by a preference function with multiple weight variables that vary according to a route’s distance, cost, time, and services. Different from other models in the literature, this is the first work to address the dynamic loads of the electricity grids among various city zones for load-balanced EV routing in an automatic way. This allows for the easy integration of EVs through a city-friendly and anxiety-free navigation model.

1. Introduction

As a new theme in transportation that is economic and friendly to the environment, in the last two decades, the electric vehicle (EV) industry has started to spread wider than ever. Rather than using fuel engines, EVs are mounted with batteries that store electric power charges that can be transformed into a mechanical form that allows for movement. These EVs are green transportation vehicles that come with zero carbon emissions, making them friendly to health and the environment. However, the adoption of such green-friendly vehicles still has some concerns that need to be tackled.
The lack of coverage of battery charging stations imposes a kind of range anxiety for EV drivers [1,2,3], especially for those who drive their vehicles for long intercity distances. Globally, this electric form of transportation is welcomed by all, governments and citizens. However, the lack of adequate infrastructure that allows for sufficient coverage of the required charging stations to serve these EVs is still hindering their adoption [4] as a complete alternative to fuel-driven vehicles. Although they have started to spread on a wider scale during the last few years, this scale is modest. To enhance this, solid investment is required to upgrade cities’ existing power grid infrastructures in order to allow for hosting such power-hungry charging stations at larger scales with a sufficient coverage that truly helps relieving such range-anxiety concerns. However, it may take a considerable time for such physical upgrades to be completed.
Scientifically, this opens new research paths for problems to be studied and tackled. Hence, besides efforts in battery-building technologies, the research is extended to ease such range issue limits. Therefore, relying on the existing power grid infrastructure, research efforts might help with (1) developing new power transformation techniques that allow for lower power consumption rates and (2) developing EV-oriented routing models that could help EV drivers choose navigation routes that are covered by the required charging stations. This allows for an anxiety-free driving experience. A navigation model that routes the EVs via routes that are covered with the required charging stations is truly emerging, but this work needs to be handled while considering the capacity of existing electrical power grids in our cities. Indeed, such grids were designed and assembled years ago to serve a variety of consumers: residents, business sectors, and industrial sites.
EVs are considered a new class of power-hungry machines that consume huge amounts of electricity in a short time. Therefore, especially in relation to fast chargers available at public charging stations, the provision of such charging services is expected to impose huge new loads on electricity power grids. Such loads, mainly when deployed at the city scale, could compromise grid stability and affect services provided to other types of consumers in their homes and workplaces. From the perspective of the electrical power grids, EVs are different from other sorts of consumers that may connect to the system. Indeed, such mobile power-hungry machines may get plugged to the grid at any time, any place, and even in any weather condition. This usage pattern adds huge sudden loads to the grid, imposing high levels of uncertainty on the whole power system. Usually, loads that exceed the assigned grid thresholds lead to power cutoffs at the assigned zone, although this may also expand to the neighboring zones if they are not handled and controlled as appropriate.
The rest of this paper is organized as follows: Section 2 presents the problem statement followed by related works in Section 3. Section 4 presents the model, starting with the base benchmark model in Section 4.1, followed by the shortest-route EV-oriented routing model in Section 4.2, which is then followed by its extension model, the PLUG: A City-friendly Navigation Model for EVs with Power Load-balancing Upon the Grid in Section 4.3. Samples of the simulation results are presented in Section 5. Finally, Section 6 concludes the paper.

2. Problem Statement

2.1. Problem

For cities, the adoption of EVs comes with several challenges that go far beyond the issue of transportation. To reach a successful integration platform, there are other challenging aspects that need to be met and satisfied. An example of such challenges is the existing electricity power grids, their transformers, infrastructure, and the other related industries of cabling and networking. In terms of charging, both home and public charging options necessarily require the development of charging points that provide such energy charging services in either alternating current (AC) or direct current (DC) formats. The challenge does not end here but rather actually starts. It extends to consider the loads such charging activities impose on the electricity power grids, too. Relatively, these EVs are considered power-hungry consumers that consume huge amounts of power from the electricity distribution grids. Accordingly, simultaneous unmanaged charging activities may create consumption peaks that exceed the grids’ load thresholds. This may compromise the grids’ stability, leading to service quality problems and power losses that may affect others in business sectors, industry cites, and residential clients.
In the literature, proposals for related problems come in two categories [5]: one that proposes increasing the limits of the power supplies to allow for higher grid capacities that can cope with such unexpected peak hours, a Supply-Side Control Action (SSCA), and another that proposes using a demand-related methodology that adapts the service policies according to the grids’ dynamic states, a Dynamic-Side Control Action (DSCA).
In SSCA, cities need to generate higher power ranges as well as improve the capacities of their existing infrastructures and grids’ transformers. Although this may solve the peak-threshold problem, it adds complexity and higher infrastructural costs to the system that leads to expensive price units to be paid by the service consumers. Indeed, such an SSCA approach may affect the residential users and others in business and industry cites who used to pay lower fares before the introduction of these EVs. The scenario is different in DSCA; it follows a supply–demand approach through which the energy providers may set varying price units based on the grids’ dynamic loads. Accordingly, and through the motivation of optimal billing, the consumers may adapt their consumption behavior in a way that avoids peak hours and chooses low-peak periods instead [6]. To some extent, this may work at the home level, where residents can choose when to run their home appliances and EV chargers in a way that reduces their bills. However, in real life, the option of home-garage charging may not always be preferable or even available. Indeed, home charging options are considered (1) slow; as on average, it takes 6 hours for an EV battery to be charged using those AC types of chargers that are available at homes. On the other hand, it only takes 30 min to be charged using the DC chargers available at the public charging stations. Compared to the public charging spots, home charging can be also considered (2) costly; as the residential tariffs usually increase with the increase in consumption rates [7]. Moreover, the option of home charging might be (3) limited; true, for people who live in downtown buildings and those areas with high population densities, home charging may not be an option, and so their only option is to use public charging spots. Yet, beside the charging speed and the cheaper charging price units, (4) public charging spots may provide other services that may attract the EV drivers: services like shopping malls, cafes, restaurants, and others. (5) Not to mention those EVs who need charging while travelling; for such cases, the option of public charging is considered the only option to have. Therefore, we can conclude that public charging services have higher demand rates when compared to those of home ones, and so higher loads are expected on the grid. These loads need to be carefully engineered in a way that guarantees the stability and satisfaction for all, EVs and the other electricity service clients.

2.2. Pricing Policies

Different dynamic pricing policies are proposed in the literature: Real-Time Pricing (RTP), Time of Use (ToU), Critical Peak Pricing (CPP), and Peak-Time Rebates (PTR) were used and employed to help shape the consumers’ consumption behavior. In RTP, the system adjusts the service price units in a dynamic way that reflects the real-time status of the utility being sold [8]. This may happen in intervals that vary between minutes and hours or more based on the system settings [9]. Such a policy looks optimal for utility owners, but it is somehow confusing for consumers [10]. True, consumers are mostly unaware of such fast fluctuations on the utility price units, and hence, they are unaware of the appropriate way to schedule their consumption activities accordingly. In ToU, the time slots and their corresponding price units are set in advance; this may follow historical statistics rather than real-time readings of the dynamic system status. Through ToU, the day time is divided into three periods: high-peak, normal, and low-peak periods. Accordingly, electricity service consumers can adjust their activities based on their needs and the corresponding price units known in advance for the intended period of usage. However, it is worth noting that with such predefined periods and the pre-set price units, service consumers will tend to shift their activities to these assumed low-peak periods, switching it to a high peak and maybe to new higher record periods [11]. Similarly, the CPP assigns varying price units to certain periods of time: those with critical consumption records, but using a different methodology compared to that of the ToU. In CPP, the price changes are calculated based on the current conditions of the system not on historical statistics as in ToU. Accordingly, the price units set by the CPP are assumed to be reflective of the current conditions of the system. Such price units might be higher for certain periods if compared to those of the ToU; however, this seems to be more effective from the systems’ perspective [12]. The policy of PTR is different; it follows an incentive-based methodology that rewards those consumers who consume less energy during the peak hours and penalizes those who consume more (i.e., assigns them higher price units to pay) [13]. This might seem motivating, but in practice, setting such price units, incentives, and penalties requires developing an efficient pricing scheme that needs to be transparent for both providers and consumers.
The aforementioned dynamic pricing policies can help with motivating the service consumers to distribute part of the anticipated grid loads, although we find that this could work only for part of the residential consumers. In numbers, we are talking about part of those who are responsible for 40% of the energy consumption on average [14]. For business sectors and the industrial sites, this might not be applicable. For EVs, this could only work for those drivers with a home charging option but not for the majority of EV drivers. Yet, such pricing policies did not consider the EVs that are in transit having trips to drive, those traveling on the streets within and between the cities. For a traveling EV driver, and according to an EV’s battery capacity and its State of Health (SoH), the driven EV might need to be charged wherever possible before reaching a dead-battery status, ending up at the side of the street waiting for the towing to come. In such cases, the drivers do not have the luxury of waiting for low price-unit periods to charge; instead, they will choose the next charging station in the path regardless of the grid load or the price-unit issues.

2.3. Paper Contribution

Connections of charging EVs to the power grids need to be somehow controlled in a way that preserves the system’s stability as much as possible. In a given city, this could be handled through a model that takes into account the varying loads of the power transformers that are distributed all over the city zones and places. According to such load readings, and from the grid’s perspective, the model can recommend routes that pass through adequate zones to charge a given EV without imposing any load threats to the system. This could be modeled through a price-based charging scheme through which the EV drivers will be motivated to set their navigators to choose those routes that pass via city zones with less loads. Such a model can help maintain balanced power loads at the grid transformer according the grid’s settings at the time it was designed and installed.
Therefore, in this work, as an extension to that of [15], we propose following a grid-monitoring system that provides for real-time readings of the grid loads at the chosen points of the infrastructure’s set of transformers. Having such readings, the model can use a pricing scheme that sets dynamic charging price units to autonomously encourage/discourage those EV drivers to charge their vehicles at certain charging points in the city. To facilitate that to the EV drivers, and due to the unawareness of the real-time price fluctuations and lack of understanding of the billing formulas for most of them, our proposed model reads such price changes and automatically adapts to choose the appropriate routes without any intervention from the EV drivers. Consequently, and according to the EV’s trip destination, the navigation model automatically nominates the paths that pass via those charging points that match the desired destination points while offering load-balanced grids along with competing charge price units. Briefly, our contribution comes in the form of proposing a city-friendly EV navigation model that is built to achieve the following:
  • Load awareness: The model is responsible for keeping up with the dynamic load changes in the city’s energy grids, and accordingly, it nominates those routes that help keep the grids’ load balanced.
  • Incentive driven: The model adopts the RTP dynamic pricing mechanism that motivates choosing load-balancing routes by offering lower price units for the charging services over such nominated routes.
  • Dynamically adaptive: The model’s routing process is adaptive to any dynamic updates happening at the nominated routes and their charging stations. It also adapts to the real-time status of the EV’s battery, and its driving mode changes.
  • Shortest: In addition to choosing the load-balancing grid zone, it runs the Dijkstra Algorithm to find the shortest load-balanced routes that pass through those nominated less-loaded city zones.
  • Autonomous: The model runs a navigation process for each EV in a way that matches its make, its model, the battery’s SoH, and the route preferences set by the driver via a weighted preference function.
  • Cognitive: Where its chosen routes may differ from one EV to another, even for the same EV profile and trip coordinates, routes may vary according to the chosen driving preferences, time, and weather conditions.

3. Related Work

EVs have been in service for two or more decades. However, they have started to spread exponentially in the past few years. In [16], the authors elaborate on such transportation alternatives from the perspectives of infrastructure, market, and drivers’ feedback and preferences. Routing wise, the authors of [17] proposed a navigation model that assumed time window constraints and static power consumption rates related to weight and traffic conditions. Their work applies to static assumptions that hardly apply to real-life conditions. Indeed, varying traffic conditions have negative impacts on power consumption in both fuel and electric power vehicles. What is more, with EVs, any proposed navigation model needs to consider the varying vehicles’ profiles and their battery conditions. Due to the limited insufficient coverage of electric charging stations in our cities, in [18], the authors tackled the problem of minimizing the route distances of these EVs compared to the fuel running ones. To enhance the EV charging stations coverage, the work of [19] presented a model that encourages the availability of charging stations along the existing traditional routes. A fast routing model is proposed in [20]. This allows for a good option that may suit some trips timewise; however, when it comes to EVs, the distance and other related issues like power loads might be a bigger priority.
In this domain of research, several proposals are presented in the literature; however, most of the research works related to EVs mainly tackles topics that are concerned with both wired and wireless charging technologies [21], battery industry [22], safety issues [23], marketing and economics [24], traffic load balancing, and congestion management [25,26,27]. As for routing and navigation models, the work of [28] proposes an EV navigation model that routes the EVs via paths that are claimed to cover the power charging requirements toward their destinations. In [28], the authors propose defining a polygon-shaped navigation space, through which the EVs are to be routed throughout their trips. Such a polygon space is bounded with a set of points starting by the charge request and the intended destination points. Within that polygon-shaped space, the proposal of [28] finds paths that pass through power charging stations; such paths lead to the intended trips’ destinations. However, it provides no information regarding whether these charging stations allow for compatible services for the running EV or not, nor does it provide any information about the distances to the nominated charging stations or between stations. In such a context, this information is truly important; a path that may suit an EV may not suit another. Indeed, EVs come with varying battery technologies and charge capacities, and so, their charge requirements are different. Hence, each EV may require different coverage of charging stations; this implicitly means a different number of charging stops per trip. True, an EV with a large battery capacity may require a path with fewer charging stations when compared to another EV with a smaller battery capacity, which may need more frequent charging stops along its paths. Therefore, a path that suits such a small-battery EVs and is considered the shortest might not be the same as that recommended for an EV with a larger battery. Indeed, the model might find another shorter one with sufficient coverage that matches its different charging requirements.
In [15], we proposed an anxiety-free EV routing model that is especially built to be EV oriented. It reads the running EVs’ make and model, its battery status, and the trip’s coordinates at the trip’s source point. Thus, it is considered autonomous, as it runs for each EV autonomously based on its own profile and battery requirements. It is adaptive, too, as it reads the dynamic changes on the EV and route status and updates the navigation routes accordingly. The models of [15,28] may help find navigation routes toward the EV’s trip destinations; however, neither the model of [28] nor that of [15] took into account the expected loads such EVs may impose to the cities’ energy grid systems through their charging requirements. The adoption of EVs is growing rapidly, and so their charging loads on the power grids are stressful and need to be studied and managed in order to avoid any shortages or overloaded zones.
The authors of [29] proposed a decentralized load management model that helps mitigate the demand rebound effects on the power system. In their work, they tackled the problem of increasing loads and demand escalations on the power system grids and how such a rise in demands can lead to service faults and shortages if not managed properly. In addition to smart home appliances, they also took into consideration the loads imposed by EVs and their home-charging activities. Such a proposal provides for an efficient model that allows relieving such high load threats and provides service satisfaction rates for both consumers and providers. In our work, we are tackling the problem of EV charging at the public stations, mainly considering those drivers who are in transit and do not have the option of deferring their charging times to other slots that may suit the grid system better. In this context, the proposal of [5] discusses billing strategies and peak-related policies that could help manage the power supply rates at the electricity power grids. Price-unit motivations were also addressed in [6,8]. In [7], a game theoretical approach was proposed to motivate behavior-based competition among the charging service providers in a way to regulate and manage the charging process.
The work of [30] developed a notification model that sends the updates about the charging price units and the queuing times to the EV drivers based on the changes in the charging service stations. This work is great; however, according to several studies and specialized surveys like that found in [10], it is sometimes difficult for an individual to independently behave according to such pricing notifications due to the general unawareness of billing strategies. Moreover, such notifications might be of better use at homes and for stationary machines but not for a running EV. It might not be useful for a driver that already chose the trip’s route and started driving toward the intended destination. Hence, in such a context, we find that enabling the EV’s navigation systems to automatically adapt to such dynamic updates would be more effective. This allows for quick responses that help balance the grid loads better while easing the process for the drivers.
The proposals in [15,28] help EV drivers find charge-covered paths toward their trips’ destinations. Compared to [28], the paths of [15] are calculated with reference to the running EV’s make and model, which means that they provide for guaranteed delivery. However, neither the model of [28] nor that of [15] considered the consumption loads of electricity at the power grids. The work in [30] proposed a notification model that reports the changes of the electricity price units to the service consumers; this looks useful, however, we need to consider the fact that many of the consumers are not aware of the billing systems and how their charges are calculated [10]. Therefore, we find it more practical to develop a navigation model that receives such notifications and behave accordingly. In this way, our model claims to be more realistic and practical.

4. Problem Formulation

This section starts by presenting a base benchmark model that has been compared with the first version of this work in [15]. Then, our shortest-route EV-oriented navigation model is presented in Section 4.2.1, which is followed by its PLUG model extension in Section 4.3.

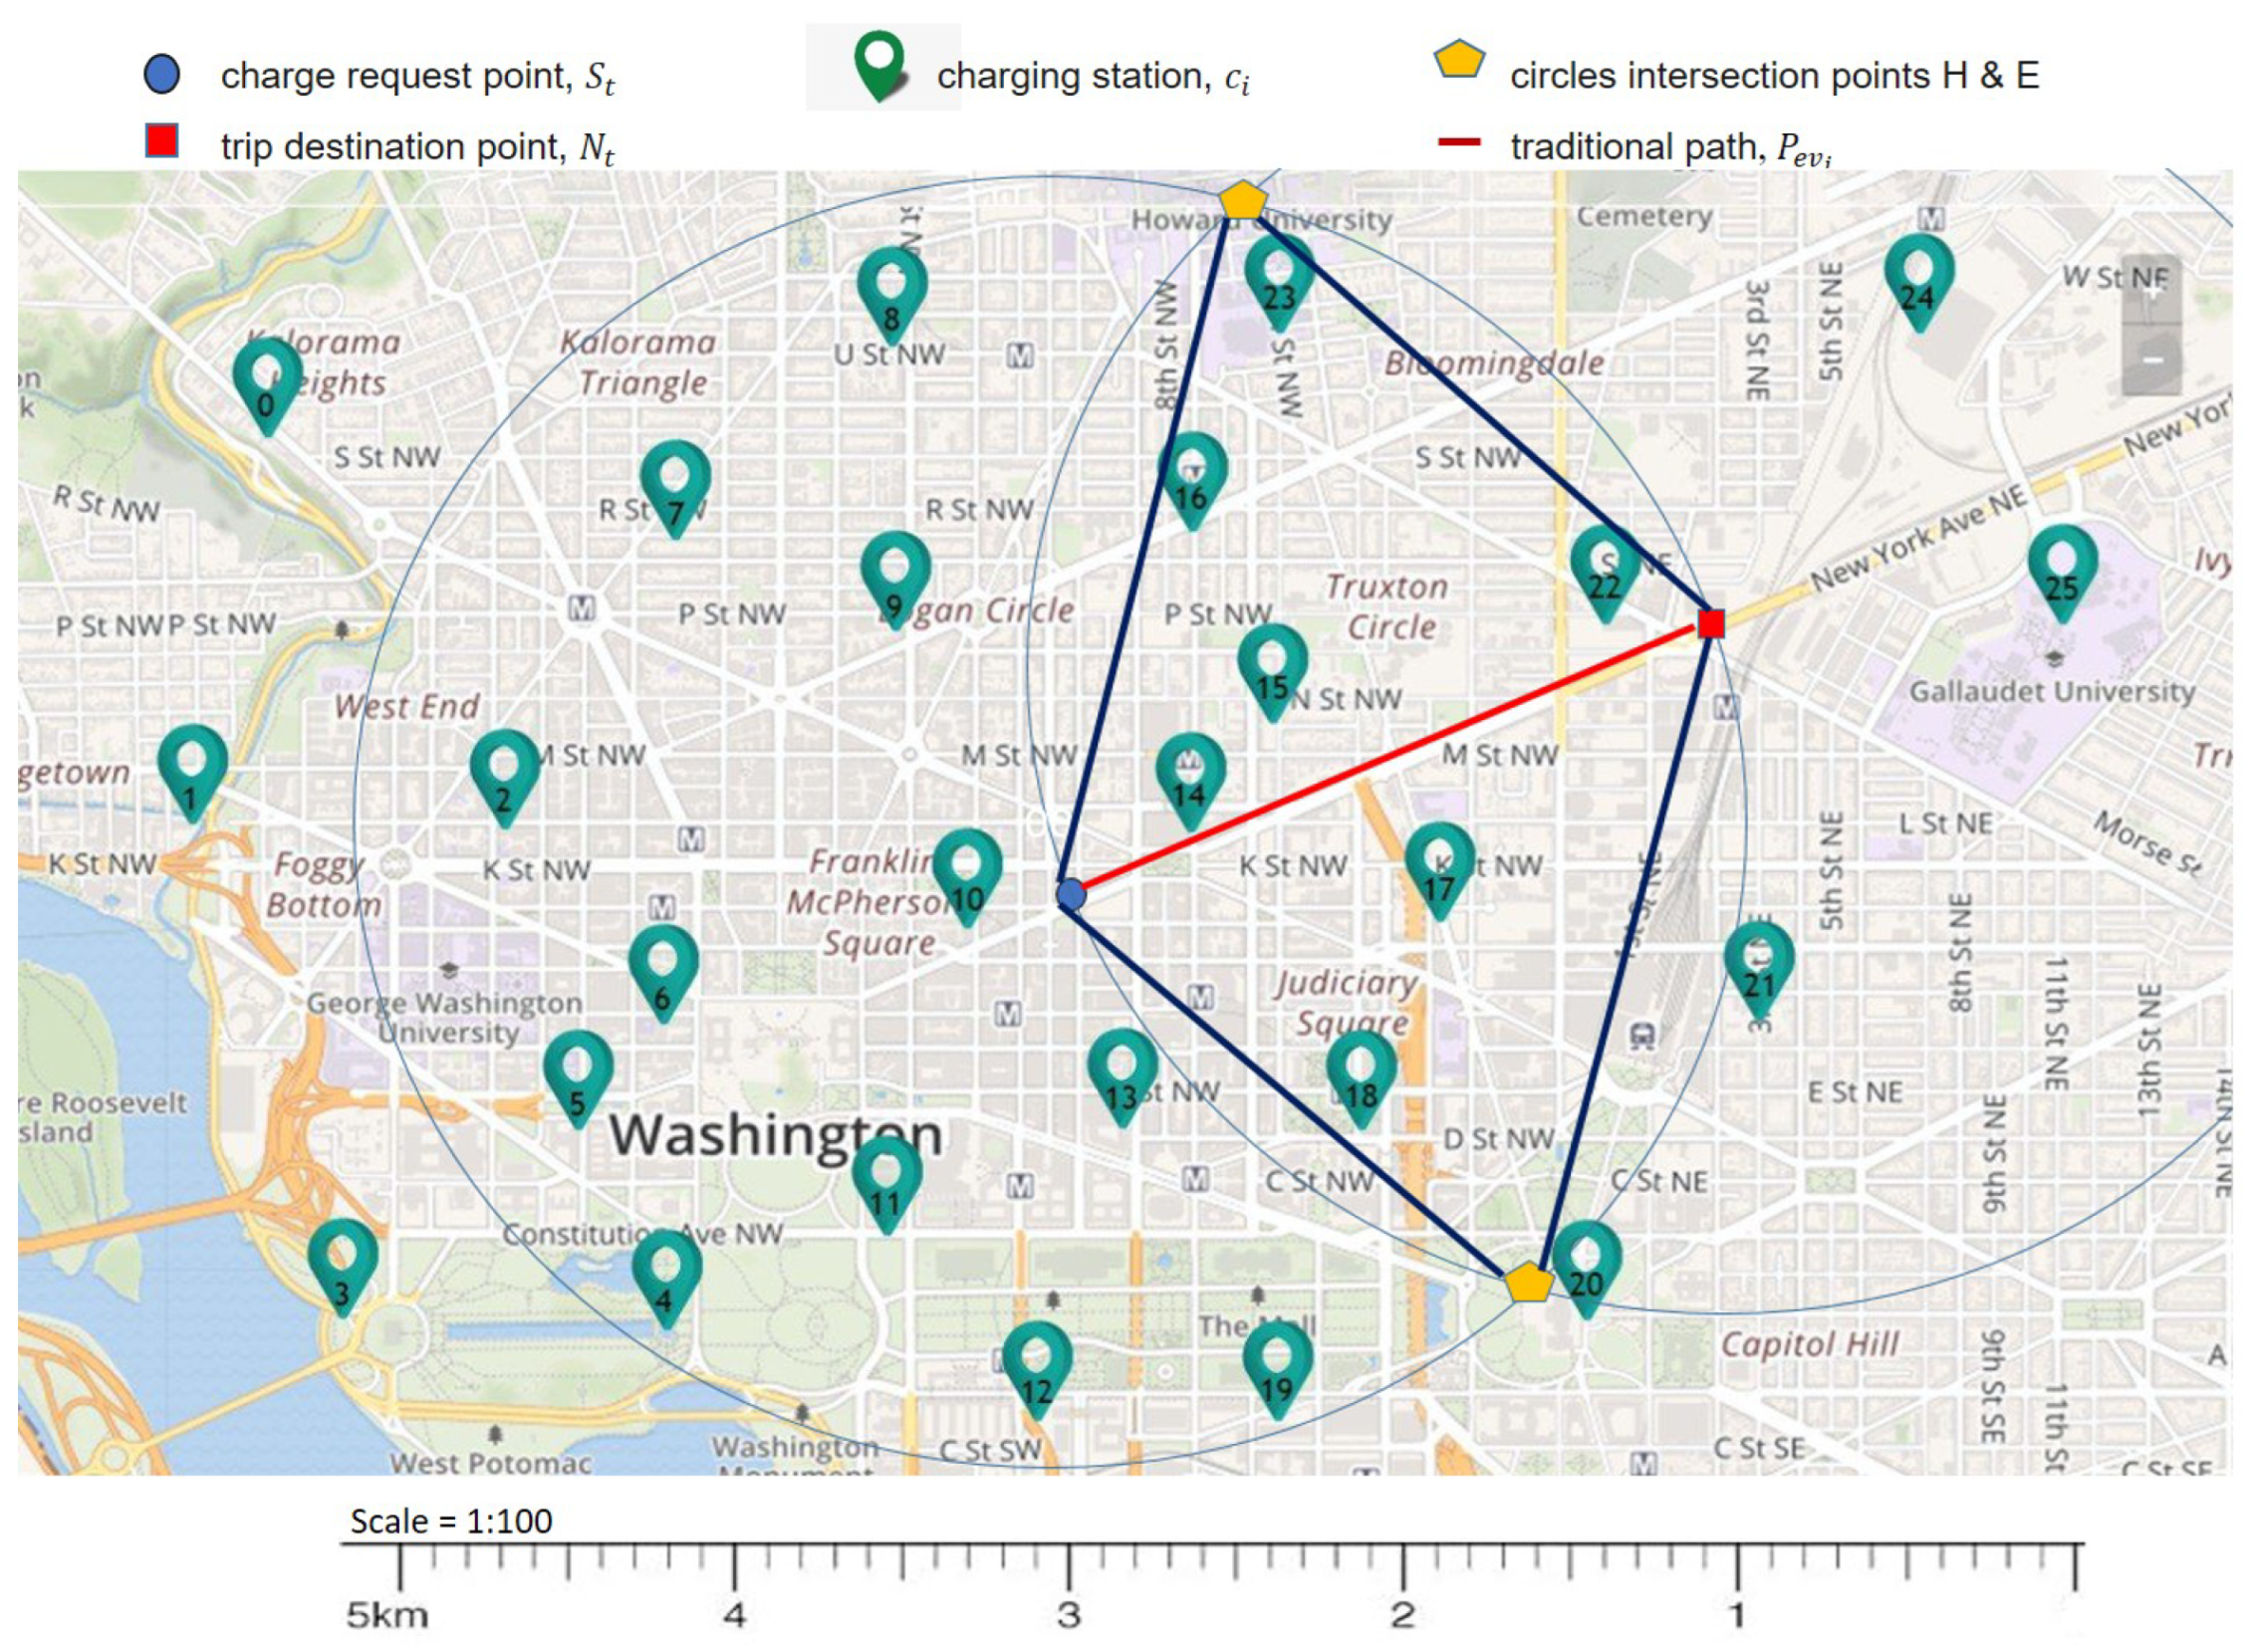
4.1. Benchmark Model

To check the validity of our proposed model PLUG, from the literature, we chose the work of [28] that presents a charge guidance model that routes the EVs via a dynamic area that is claimed to allow for a shortest path solution. To show that, we assume having a city map that comes with 25 different charging points as shown in Figure 1. The area of [28] is defined in accordance with the EV’s charge request point S along with the intended trip’s destination point P. Then, the model draws two circles each with a radius equal to the distance between the aforementioned points of S and P, as depicted in the hypothetical city-map example shown in Figure 1. These two circles intersect at two points that are referred to as H and E. As shown with the blue line drawings in Figure 2, connecting these points ( S , H , P , E ) forms a kind of polygon area. Within this area, their model is required to find a route toward the trip’s destination point P. This area allows narrowing the route lookup space (i.e., the number of charging points a route may pass through) in a way that limits the total distance toward the trip’s desired destination point. Accordingly, within that area, and as shown in the example of Figure 3, around the traditional path P e v i , the model selects a set of charging points c i that are claimed to serve the running EV toward its destination point P.
The work of [28] presents a navigation model that helps find routes for EVs toward their final destinations, this is true, but still, beside the electrical grid loads issue, we have a few concerns that we would like to verify:
  • Why did the model choose point S and the trip destination point P as a reference to create the charging area? What if we choose another reference point?
  • How does the model guarantee the match state for those charging points located within the predefined search area? In other words, on which basis do we define a charging point as being addeda candidate charging point for an EV request or not?
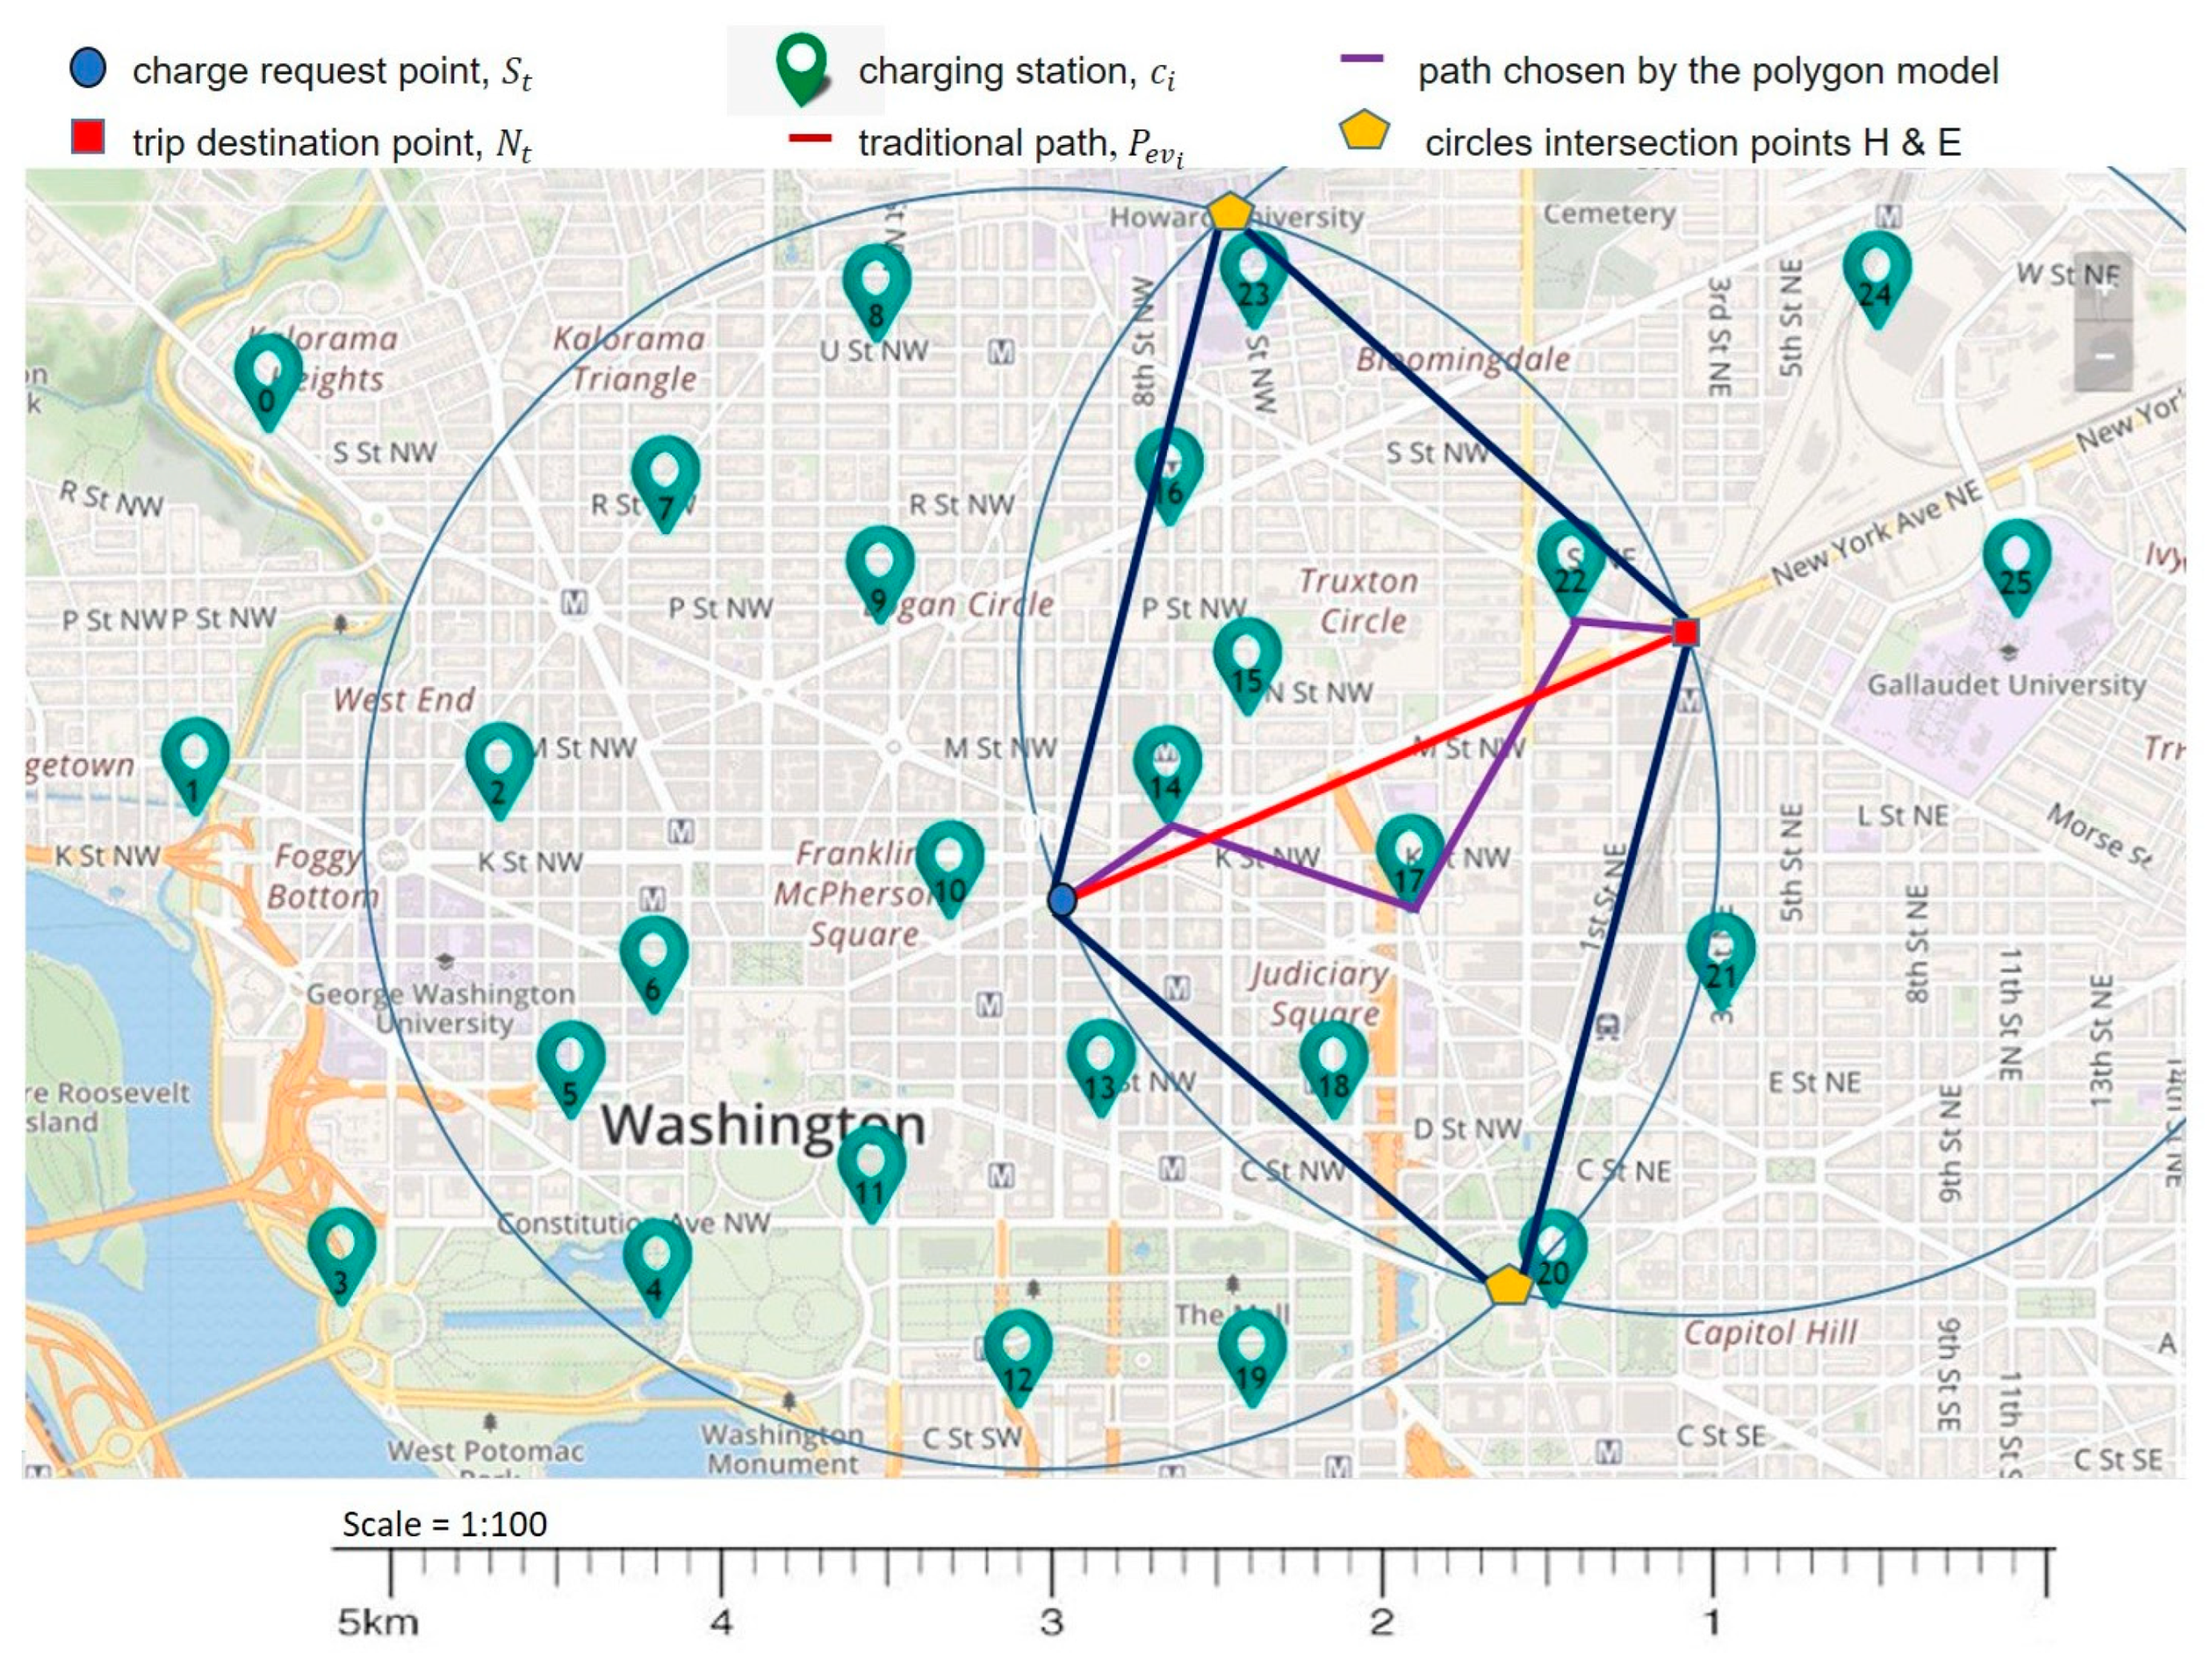
  • EVs come with different battery ranges and SoH values, so, has this been taken into account? A route that may suit an EV may not quite suit another.
  • Does the model provide any guarantees that the chosen routes are the shortest navigation routes?

4.2. Shortest-Route, EV-Oriented Routing Model

This section elaborates a routing model that is different from what is proposed in [28]. It is autonomous in the sense that it finds the candidate routes for each EV according to its special profile and battery status. This includes its make, model, driving mode, and the battery’s SoH. It is adaptive, too, as it adapts to any updates or changes happening in the aforementioned profile attributes or to any updates from the charging stations side.

4.2.1. Shortest-Route Navigation Methodology

The process of route planning starts in advance: it firstly reads the EV’s make and model, its dynamic battery level, the driving mode (eco, comfort, or sport), the weather (to consider the power requirements of wipers, lights, heating and air conditioning), day time (lighting), and the trip’s source and destination points’ coordinates. Based on these parameters, for the running EV in particular, the model finds the distance limit of the running EV battery. Using Dijkstra’s routing algorithm with the given weighted road network maps, the model finds the shortest distance routes the EV may drive toward the trip’s destination point.
On the shortest route P e v i , and according to the battery range threshold R e v i t h r , the model defines the point J that the running EV can reach using the current battery charge. As an example, Figure 4 shows the chosen route P e v i for the trip between the nodes 0 and 15, where along that route, the model sets a pin for the point J, around which the EV’s battery needs to be charged again in order to deliver the vehicle to the trip’s destination point 15. For a running E V i , the calculations of the range threshold value R e v i t h r are completed as represented in Equation (1). Being a dynamic model, in addition to the EV’s profile θ i and the other driving mode attributes, such threshold value calculations take into account the dynamic battery charge status τ e v i as kwh and its dynamic power consumption rate ρ e v i as km/kwh, too. The percentage variable α is used to set a kind of limit to the usable battery charge in a way to keep a reserve amount of charge for any urgent or unexpected changes on the planned route. Hence, in our simulation, we set the value of α to 90 % ; however, such value can be changed based on the driver’s preferences. Setting the α value to 90 % simulates the driver’s preference of charging when the EV’s residual battery charge reading is at 10 % .
R e v i t h r ( θ i , m ) = α [ τ e v i . ρ e v i ]
Based on the threshold distance value R e v i t h r , the model defines the place of point J on the route P e v i as presented in Equation (2). Accordingly, from the trip’s source point S t , the distance value R e v i t h r is applied over the chosen route P e v i to define the point J.
J = S t + R e v i t h r , S t & J P e v i
Accordingly, within the distance R e v i t h r from the trip’s source point S t , and based on the profiles of the area’s charging stations that are fed to the system, the model finds the candidate charging points ( c i , c i C ) that are compatible with the EV’s profile θ i , which defines its make and model. These candidate points are listed in array L, which are firstly examined for reachability from point J and then sorted according to their distance from the source point S t . If no charging point was listed in L, the model chooses the next shortest route for the assigned trip, and in the same way, it finds a new point J on the new route and proceeds with the same criteria mentioned before.
Consequently, for these charging points c 1 , c 2 , c 3 , L that have been checked to satisfy the running EV’s profile and distance requirements and then sorted according to their distance from the trip’s source point S t , the model chooses the charging point with the longest distance from S t . This allows for more residual charges in the next part of the trip toward the destination. This process is dynamic, which means the model keeps checking for any updates on the list of candidate charging points being listed in L.
It could be noted that the number of candidate charging points listed in L is somehow affected by the value of α . Indeed, the higher the value of α is, the larger the lookup domain for candidate charging points and thus the higher the probability of having a better match and vice versa for smaller α values. In the simulation part of this work, we chose the value of α to be 90 % .
The methodology of the aforementioned load-oblivious routing model is summarized in Algorithm 1. As shown in the algorithm, the model runs in accordance with the EV driver’s preferences in an autonomous and adaptive way, taking into account any updates on the route status or the chosen driving mode.
Algorithm 1 Shortest-route load-oblivious routing algorithm
1:  input: The model reads the EV make and model θ i , its SoH, and the trip’s S t and N t points,
2:    the current driving mode of the vehicle m , m M ,
3:    the battery charge status τ e v i ,
4:    the power consumption rate of the vehicle in ρ e v i ,
5:  for each EV type θ i , and the threshold value set by α ;
6:    Find the range threshold value R e v i t h r , and accordingly: from the point S t , find the location of point J,
7:    Calculate the distance D, from the point S t to point J;
8:  run the navigation model, list candidate charging points c i in L, and then
9:  while the list L is not empty, and there is at least a c i that is compatible with θ i , then do;
10:     From the source S t , ∀ c i L, find the distances to all c i points, and accordingly:
11:     sort list L in an descending order, update L,
12:     select c i with the longest distance from S i , and accordingly, update the route in the navigation system,
13:  else;
14:     choose the next shortest route towards N t ,
15:     find a new list L,
16:     get back to line 8 again,
17:  being charged in c i ; start from line 1 again.
18:  end
Accordingly, once the model chooses a candidate charging station c i along the route, it starts the whole process again from that chosen station as it was the trip’s source point. So, with a fully charged battery and the provided battery profile and SoH along with the remaining distance towards the trip’s destination point N t , it decideds whether it needs to route through another charging point or not. Moreover, the model also allows the option of checking the expected battery residual capacity at the trips’ destination points. Such an option considers the EVs’ readiness to start new trips right after finishing the running ones. To do so, the model could be set to choose the routes that allow for maximum residual battery capacities at the trips’ destination points.

4.2.2. Load-Oblivious Routing

Such navigation methodology may truly help in finding the shortest-EV matching routes: those routes that are not only the shortest but guaranteed to match the running EV’s charge requirements, too. Moreover, it also allows for cognitive routing experience, in the sense that it handles any updates in the driving modes, weather, and time attributes. However, the resultant power consumption rates and their effects on the power grids status are factors that were not considered. Shortest routes are always preferable, but when a grid’s status could possibly become compromised, priorities must change. Therefore, in the next part of this work, we are extending the shortest-route navigation model to consider the real-time loads of the electrical power grids and their transformers’ capacities.

4.3. PLUG: A Load-Aware Shortest-Route Navigation

In this part, the aforementioned methodology of shortest-route navigation is extended to consider the real-time loads of the electricity power grids in the route navigation process. Accordingly, as depicted in Figure 5, beside the EV’s profile and trip’s source and destination coordinates, we propose employing a grid-monitoring module that collects real-time readings from the city’s power transformers to be fed to the navigation methodology of our model. Such readings might not be quite helpful for individuals who are not aware enough of the billing strategies and how the electricity consumption bills are usually calculated. Therefore, in our proposed model PLUG, we developed a solution that is self-aware for such billing inputs, and it accordingly finds the low-cost routes in an automatic and autonomous way. Hence, in PLUG, the routing model dynamically reads the grid’s real-time loads and sets price-unit weights to the city’s charging stations. Through such price-unit weights, the model encourages those routes that pass via less loaded zones. It is worth highlighting that zones’ loads are dynamic and so their assigned price units. Thus, a route that might seem balancing at time unit t might be overloading at time t + 1 and vice versa. Based on these real-time weight values, the model runs Dijkstra’s routing algorithm to nominate the candidate routes to drive.
In this context, to allow for a level of flexibility and to handle the varying preferences of the different EV drivers, we propose a weight function, W P e v i , for the routing criteria. In such a function, the EV driver has a set of parameters through which the navigation preferences can be defined. As shown in Equation (3), for each candidate route, the routing weight function is mainly formed from the following three inputs that is related to the chosen routes: distance d P e v i , cost c P e v i , and time t P e v i .
W P e v i = ( α d P e v i + β c P e v i + γ t P e v i )
Hence, through the variable α , the driver can assign a percentage value that represents how important the total trip’s distance is. In the same way, the variables β and γ show how the driver values the trip’s total cost and time, respectively.

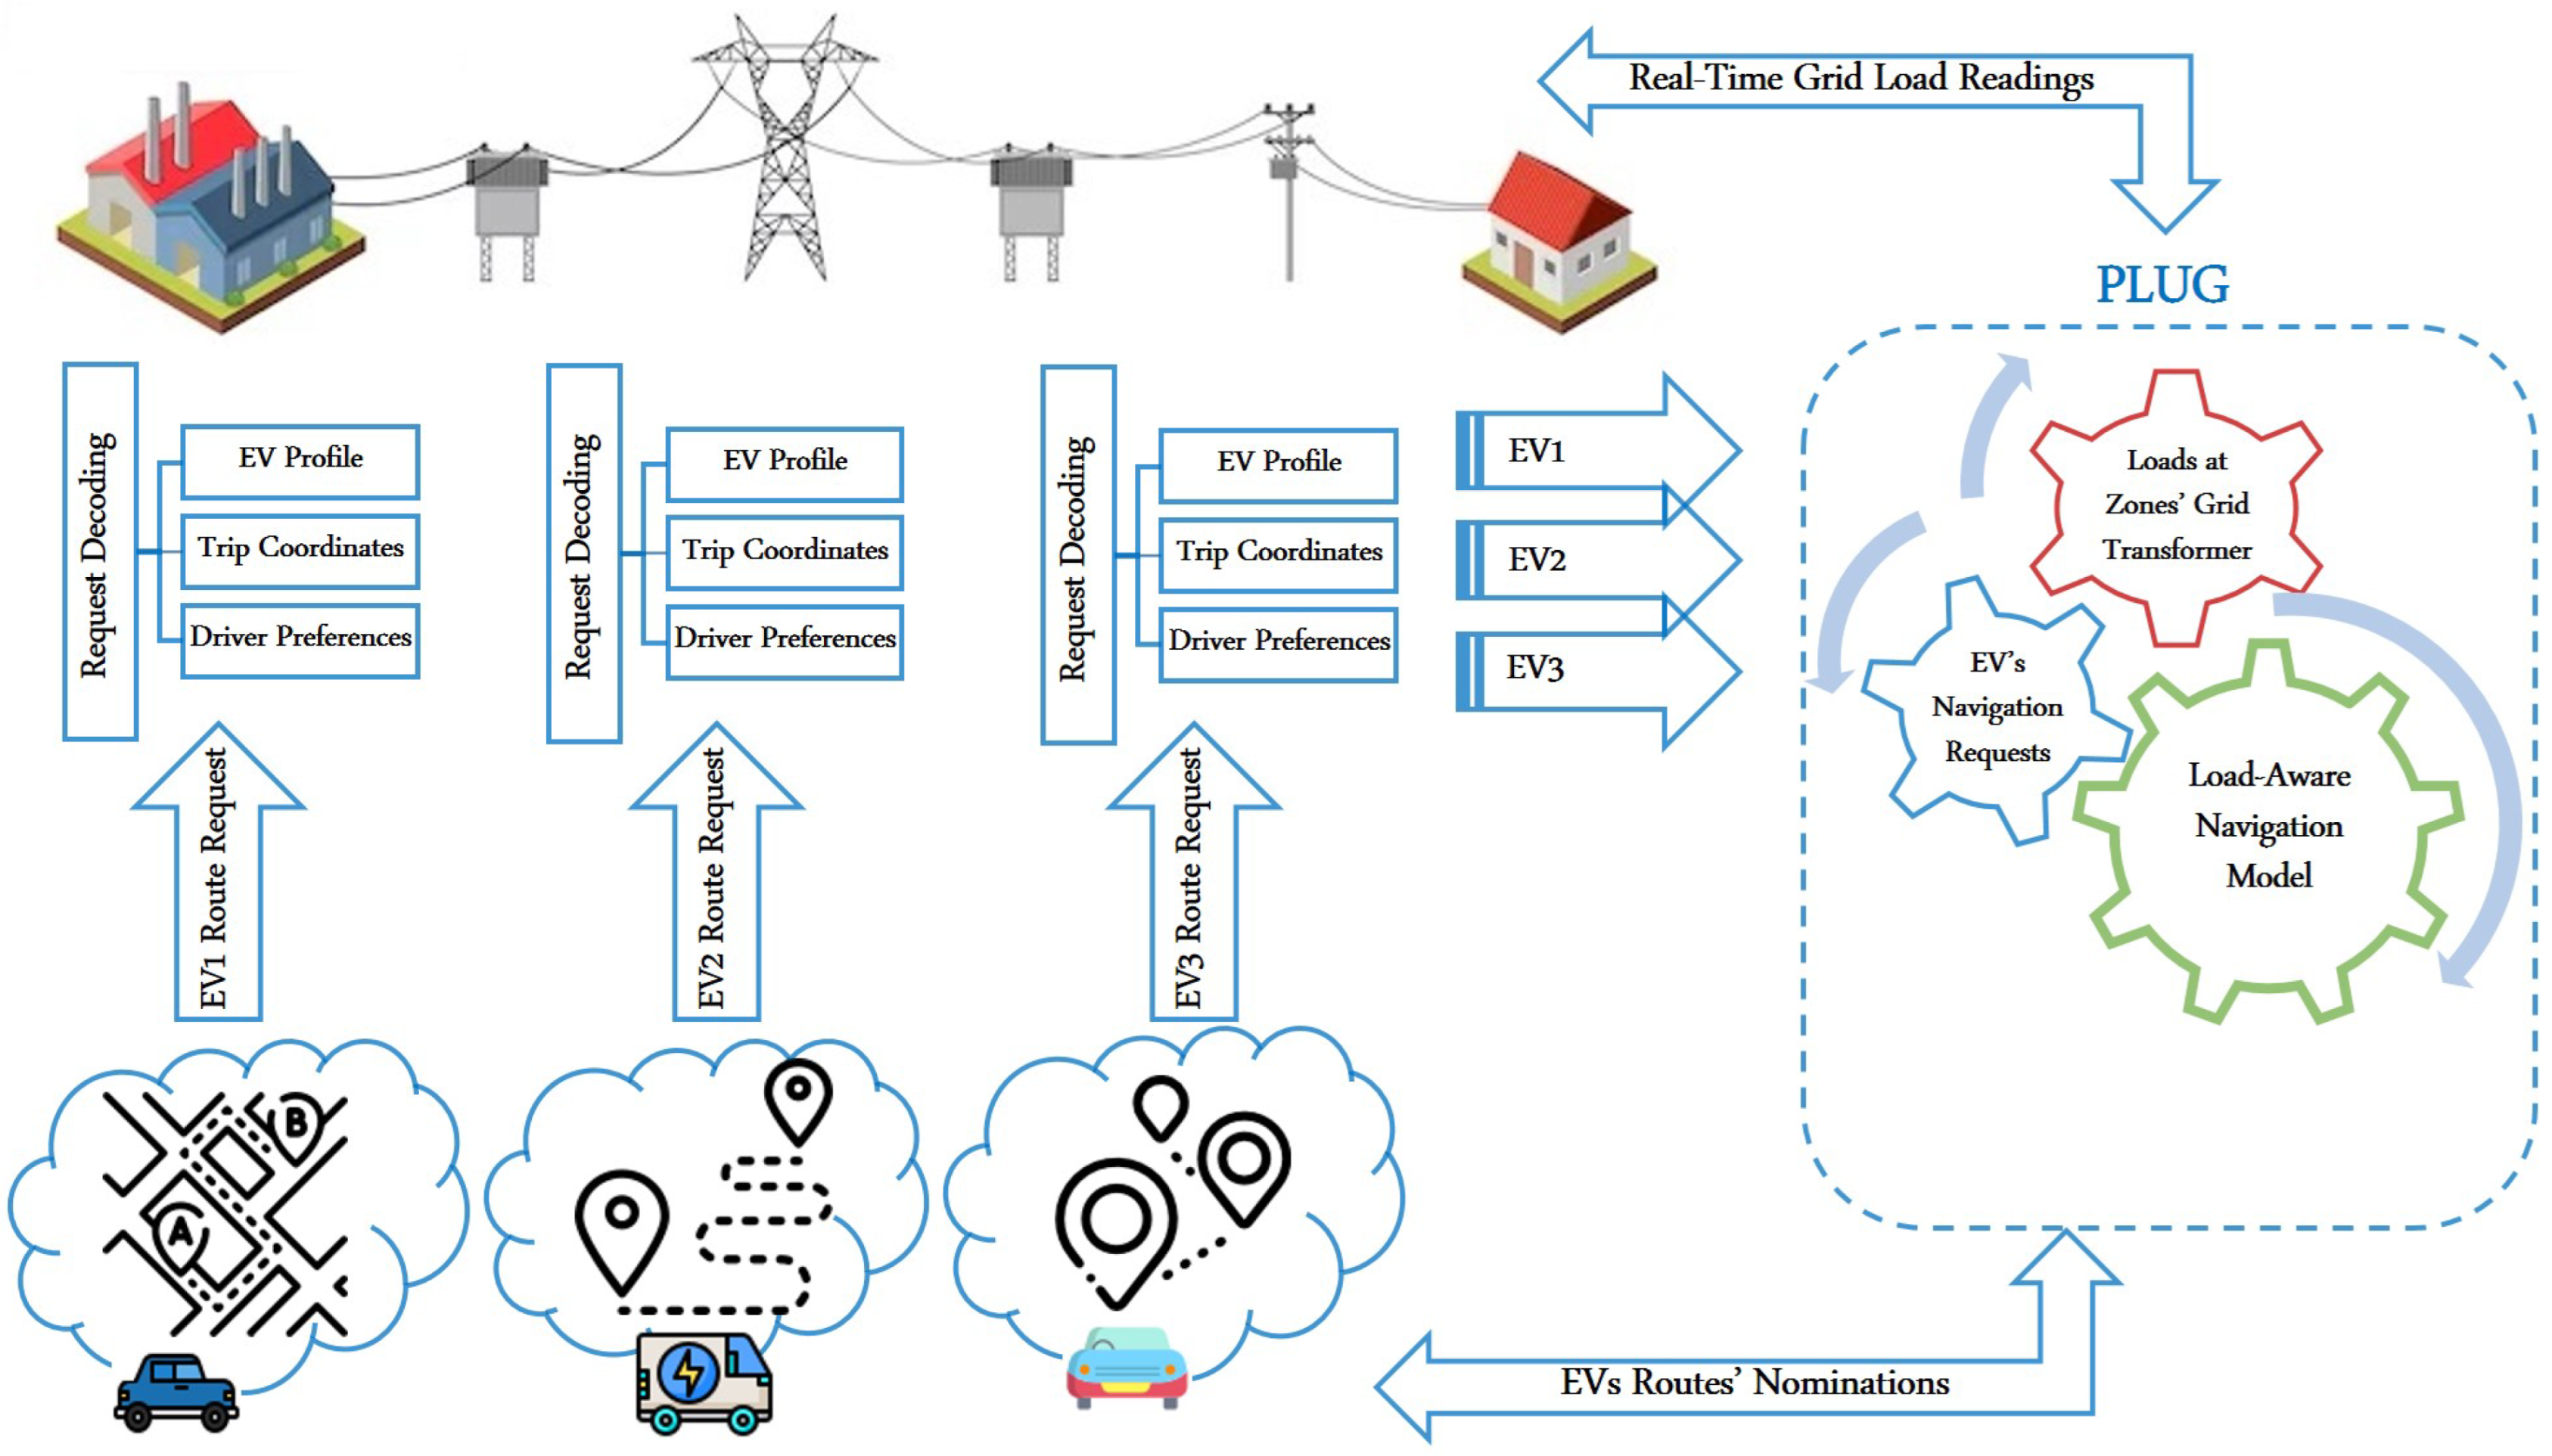
4.3.1. Communication Infrastructure Requirements

As shown in Figure 5, the PLUG model plays a kind of broker role; it collects the navigation request from the EVs and the real-time load status information from the city’s power grid transformers. Having such inputs being collected, the navigation decisions are revealed. Therefore, these EVs need to be equipped with client routing applications that can be connected to the PLUG servers. Such applications are required to have real-time access to the related EVs’ computers in order to read the required inputs to be fed to the PLUG server, which include the following: the EV’s make, model, battery SoH, battery charge, driving mode, location, time, and weather. At the same time, the city’s grid transformers need also to be connected to the PLUG monitoring servers in a way that allows for real-time updates of their dynamic load status representing the state of the charging stations at their premises. In the following part of the paper, we discuss the requirements of the PLUG model clients in further detail.

Model’s Requirement from EVs

Consequently, for EVs, the model is required to read the EV’s profile and set its driver routing preferences to the system before initiating the navigation request. For each trip, the model first finds a list of candidate routes. These routes are required to be covered with an adequate number of charging stations that match the running EV’s profile and its trip requirements. Through the driver’s preferences, the model can define the driver’s tolerance to the trip’s distance represented by α , tolerance to the charging cost represented by β , and to the trip’s total time represented by γ . Having such tolerance values along with the EV’s profile being read, the model sorts the candidate routes showing their weight scores defined in Equation (3).
The charging price-unit values for those charging stations nominated in the candidate routes are RTP values, which are fed by the grid monitoring module to reflect the real-time status of the power transformers. We chose the RTP dynamic pricing policy since it proved to be system beneficial, especially when deployed in an automatic framework [31].

Model’s Requirement from Charging Stations

To do so, the power grid transformers at the different city zones need to reveal their real-time status to the monitoring module in a dynamic way. For each zone in the city, this includes the following: (1) the maximum supply capacity, (2) the load threshold, and (3) the current consumption load. Accordingly, and based on the chosen dynamic pricing policy, the model assigns different price units for each zone. At the zone level, for each EV trip, the charging stations may vary according to different attributes, including the following: (1) how far is it from the running EV’s location, (2) distance to the EV’s trip destination, (3) available outlets capacity, (4) charging types and speed, (5) expected queuing times, and (6) the offered services and attraction points at the assigned charging station. Hence, for the same route, the model may suggest different charging stations that the EV may stop by to charge, although this may come with different weights based on the chosen stations.

4.3.2. Model’s Constraints

To attain efficiency and a truly anxiety-free navigation experience, the model has the following constraints to comply:

Trip’s Charge Requirements

The model first needs to check whether charging is required for the requested trip or not. In case no charge is required, then the model proceeds by finding the shortest route with no consideration to the grid’s load issue. These no-charge needed routes are nominated first by the navigation system as they are definitely the shortest, and it require no loads to be added to the power grid, too.
P e v i T = 1 if   there   exist   a   route   for   the   trip   T e v i   from   S t   t o   N t   with a   distance     R e v i t h r 0 otherwise

Charge Points Distances

In case charging is required, the first charging point c i of each candidate route in the list P e v i k for the assigned trip T needs first to become filtered according to its reachability (i.e., distance wise) from the EV’s current location.
P e v i K = 1 if   first   c i   that   is   part   of   route   P e v i k   from   S t   to   N t   comes   in   a   distance     R e v i t h r 0 otherwise

Charge Points Types

Each of the candidate routes in P e v i K for the assigned trip needs to be classified according to their charging stations’ compatibility, too. Based on the running EV’s profile, candidate charging stations need to pass the following:
P e v i K = 1 if     c i P e v i k   from   S t   to   N t   matches   the   EV   profile   θ i 0 otherwise

Complete Routes Only

Those routes that pass the filter of Equation (6) (i.e., have a P e v i K value equal to 1) need to pass through another filter that allows only routes with complete coverage to the trip’s destination point N t . Therefore, as long as the remaining distance to reach the trip’s destination point ≥ the EV’s battery distance limit R e v i t h r , then the model checks for the next coming charging point c i in the route.
P e v i K = 1 if   next   c i P e v i k ,   from   P e v i k P e v i K   comes   in   a   distance     R e v i t h r 0 otherwise
Therefore, in the list P e v i K , the model keeps only these routes that pass through charging points that are guaranteed to satisfy the EV’s profile and distance conditions.

Single Route Assignment Only

In PLUG, route assignment involves a kind of price unit hold for the routed vehicle until it reaches the nominated route charge point. Therefore, to restrict only one route assignment for a given EV trip, we added the following checkpoint to guarantee that no more than one single route is assigned to any trip being requested.
P e v i K P e v i T P e v i 1 ; P e v i { 0 , 1 }
Having such routes being filtered, and according to the modified weight function defined in Equation (9), the model calculates the weights W P e v i k for each route in the list P e v i K .
After that, these weighted routes are sorted in descending order according to their weight values, and the route with the highest value is nominated and shown on the screen to start navigation.
W P e v i k = ( α d P e v i k + β c P e v i k + γ t P e v i k ) , P e v i k P e v i K

4.3.3. PLUG Load-Aware Shortest-Route Navigation Algorithm

Algorithm 2 shows an abstraction of the previous discussion on how the navigation process is handled by the PLUG model. As discussed before, the model first reads (1) the EV’s profile and the driver’s route preferences, and then it reads (2) the real-time loads of the power grid’s transformers. Next, according to the intended trip’s source and destination points, the model uses Dijksrta’s routing algorithm to find the shortest routes, such routes need to pass through several constraints to filter their compatibility with the running EV and the required coverage and preference attributes. According to the real-time dynamic grid loads, the model assigns the routes’ cost. Finally, based on the driver’s preference options, the model weights the different routes and reveals the best matching route to the screen so navigation can start.
Algorithm 2 PLUG model: load-aware shortest-route navigation algorithm
1:  Input: PLUG model reads EV’s profile θ i , trip T e v i , and finds:
2:       T e v i source and destination points ( S t , N t ),
3:      EV battery charge status τ e v i ,
4:      EV power consumption rate ρ e v i ,
5:      EV range threshold value R e v i t h r ,
6:      EV driver preference values: ( α , β , γ ),
7:   read real-time grid’s loads of the city zones transformers,
8:   for  T e v i points of ( S t , and N t ), run Dijkstra, then:
9:     list the candidate routes in P e v i K , and check for:
10:     One: no-charge requirement routes,
11:       update P e v i K ,
12:     Two: charge-points distance compatibility,
13:       update P e v i K ,
14:     Three: charge-points type compatibility,
15:       update P e v i K to P e v i K ,
16:     Four: complete routes to N t ,
17:       update P e v i K to P e v i K ,
18:     Five: no duplicate routes for the same trip T e v i ,
19:  for each route in P e v i K , do:
20:     find the trip distance, d P e v i k , of the whole route,
21:     find the trip time, t P e v i k , of the whole route,
23:     update  P e v i K ,
24:     define the charging points used by the whole route, and then,
25:     locate their city zones, and get their real-time price units, then,
26:     calculate the route’s charge service costs, c P e v i k ,
27:     update  P e v i K ,
28:  for each candidate route in P e v i K :
29:     calculate the route’s weight value,
30:     update  P e v i K ,
31:  sort the routes in P e v i K in a descending according to their weight values,
32:  choose the first route in the list,
33:  add the expected charge loads to the nominated route’s charging stations,
34:  Start navigation,
35:  end

5. Simulation Results

5.1. Discussion

This section presents a few samples of the results obtained from the simulation that we developed using the Microsoft Visual Studio 2022 and C++ to assess the performance of our proposed routing model PLUG compared to its benchmark load-oblivious model. To simulate a real-life scenario, we chose to build a geographical city area that is developed and modeled as a directed graph, G, that interconnects a set of nodes, n, via a set of edges, e. The nodes represent city places that might be a trip’s source or destination, and the edges are the city streets that interconnect the places together. As shown in Figure 6, the city interconnects 16 different nodes together (labeled 0 to 15), hosting 18 different charging stations (labeled 101 to 118). The simulated city area is divided into 17 different zones (labeled A to Q), each hosting a different electricity transformer that is fed by the city’s power grid. In the simulation experiments, we ran both navigation models for varying EV profiles, each with different profile and battery range limits. The drivers’ preferences are also different. For the PLUG load-aware model, we assumed the drivers’ preferences as follows: α = 1%, β = 98%, and γ = 1%. This emulates the driver’s request for the least-cost routes regardless of distance and time metrics. Sure, such preferences can be changed to allow for least-cost shortest-distance route options. For load-oblivious routing, to emulate a shortest-distance routing request, we assumed the preferences to be 98% for α , 1% for β , and 1% for γ .
Cities in real life vary in population densities even at the zone level. Accordingly, the simulated city zones’ transformers are assumed to have varying power capacities and varying consumption ratios, too. Zones’ power capacities are set by the power distribution companies according to the grids’ physical capacity along with the historical usage statistics. Therefore, limits of such capacities are bounded by the grids’ physical infrastructure and the expected peak needs. Mostly, cities’ grid infrastructures are designed and built far before the introduction of such power-hungry EVs. What is more, we need to emphasize that such EVs are different from any other machine or home appliance; indeed, these machines are mobile and non-stationary with high consumption rate engines. Moreover, their needs cannot be linked to the number of residents in a specific zone or area. True, beside residents, urban areas may host random numbers of visitors, travelers, day-time employees, and other sorts of possible EV users whose number is mostly difficult to predict, especially in large active cities. With such a theme of uncertainty, efforts of grid’s load forecasting are not expected to be quite helpful. So, the model of this work is developed to read the real-time loads of the city zones, linking that to their hosted charging stations, and accordingly choose the proper routes for the charge-demanding EVs. As an example, Table 1 presents the status of the city’s grid transformers on a given weekday, assumed to be Monday, and the time is 16:00 h. The consumption ratios and their corresponding loads at the city zones’ transformers are represented in the color-coded city map in Figure 7. In the figure, the red colour refers to areas with high load ratios, while there are less in orange, then yellow and the least in the green-colored city areas. From the table, and with reference to Figure 7, we can read and match the city zones with their labels, A to Q, and find their corresponding charging stations, their consumption ratios, and the real-time price units.

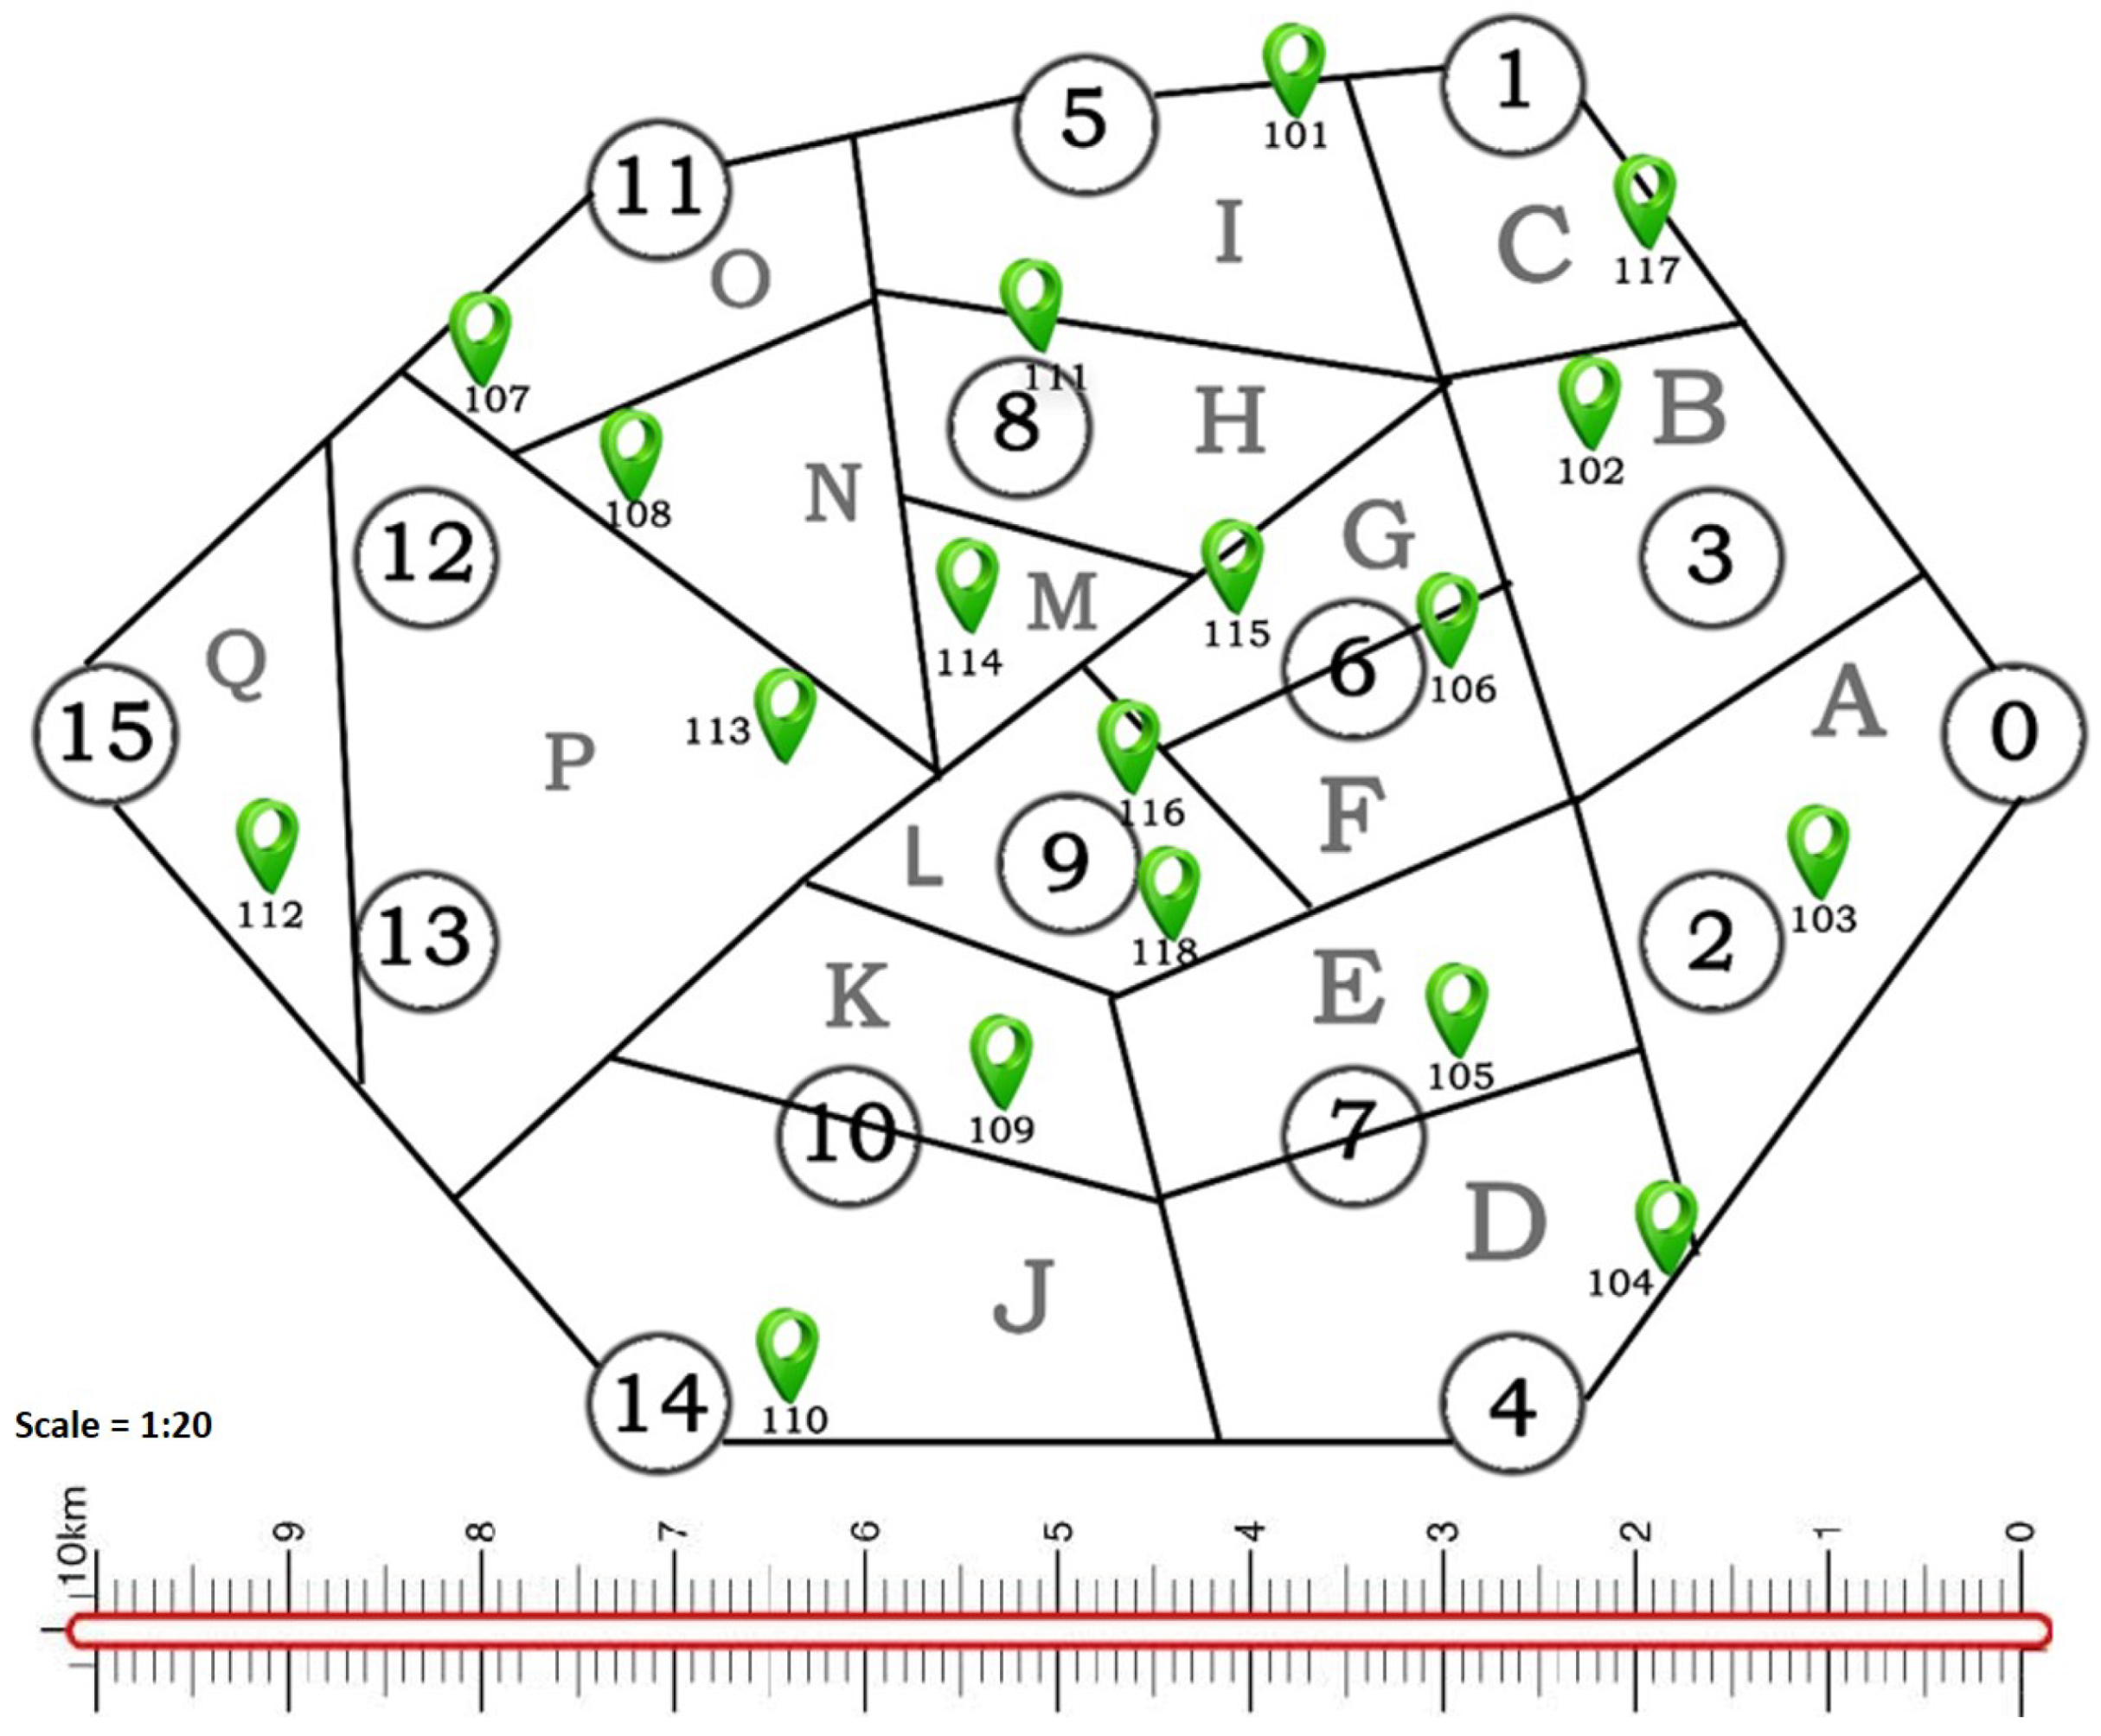
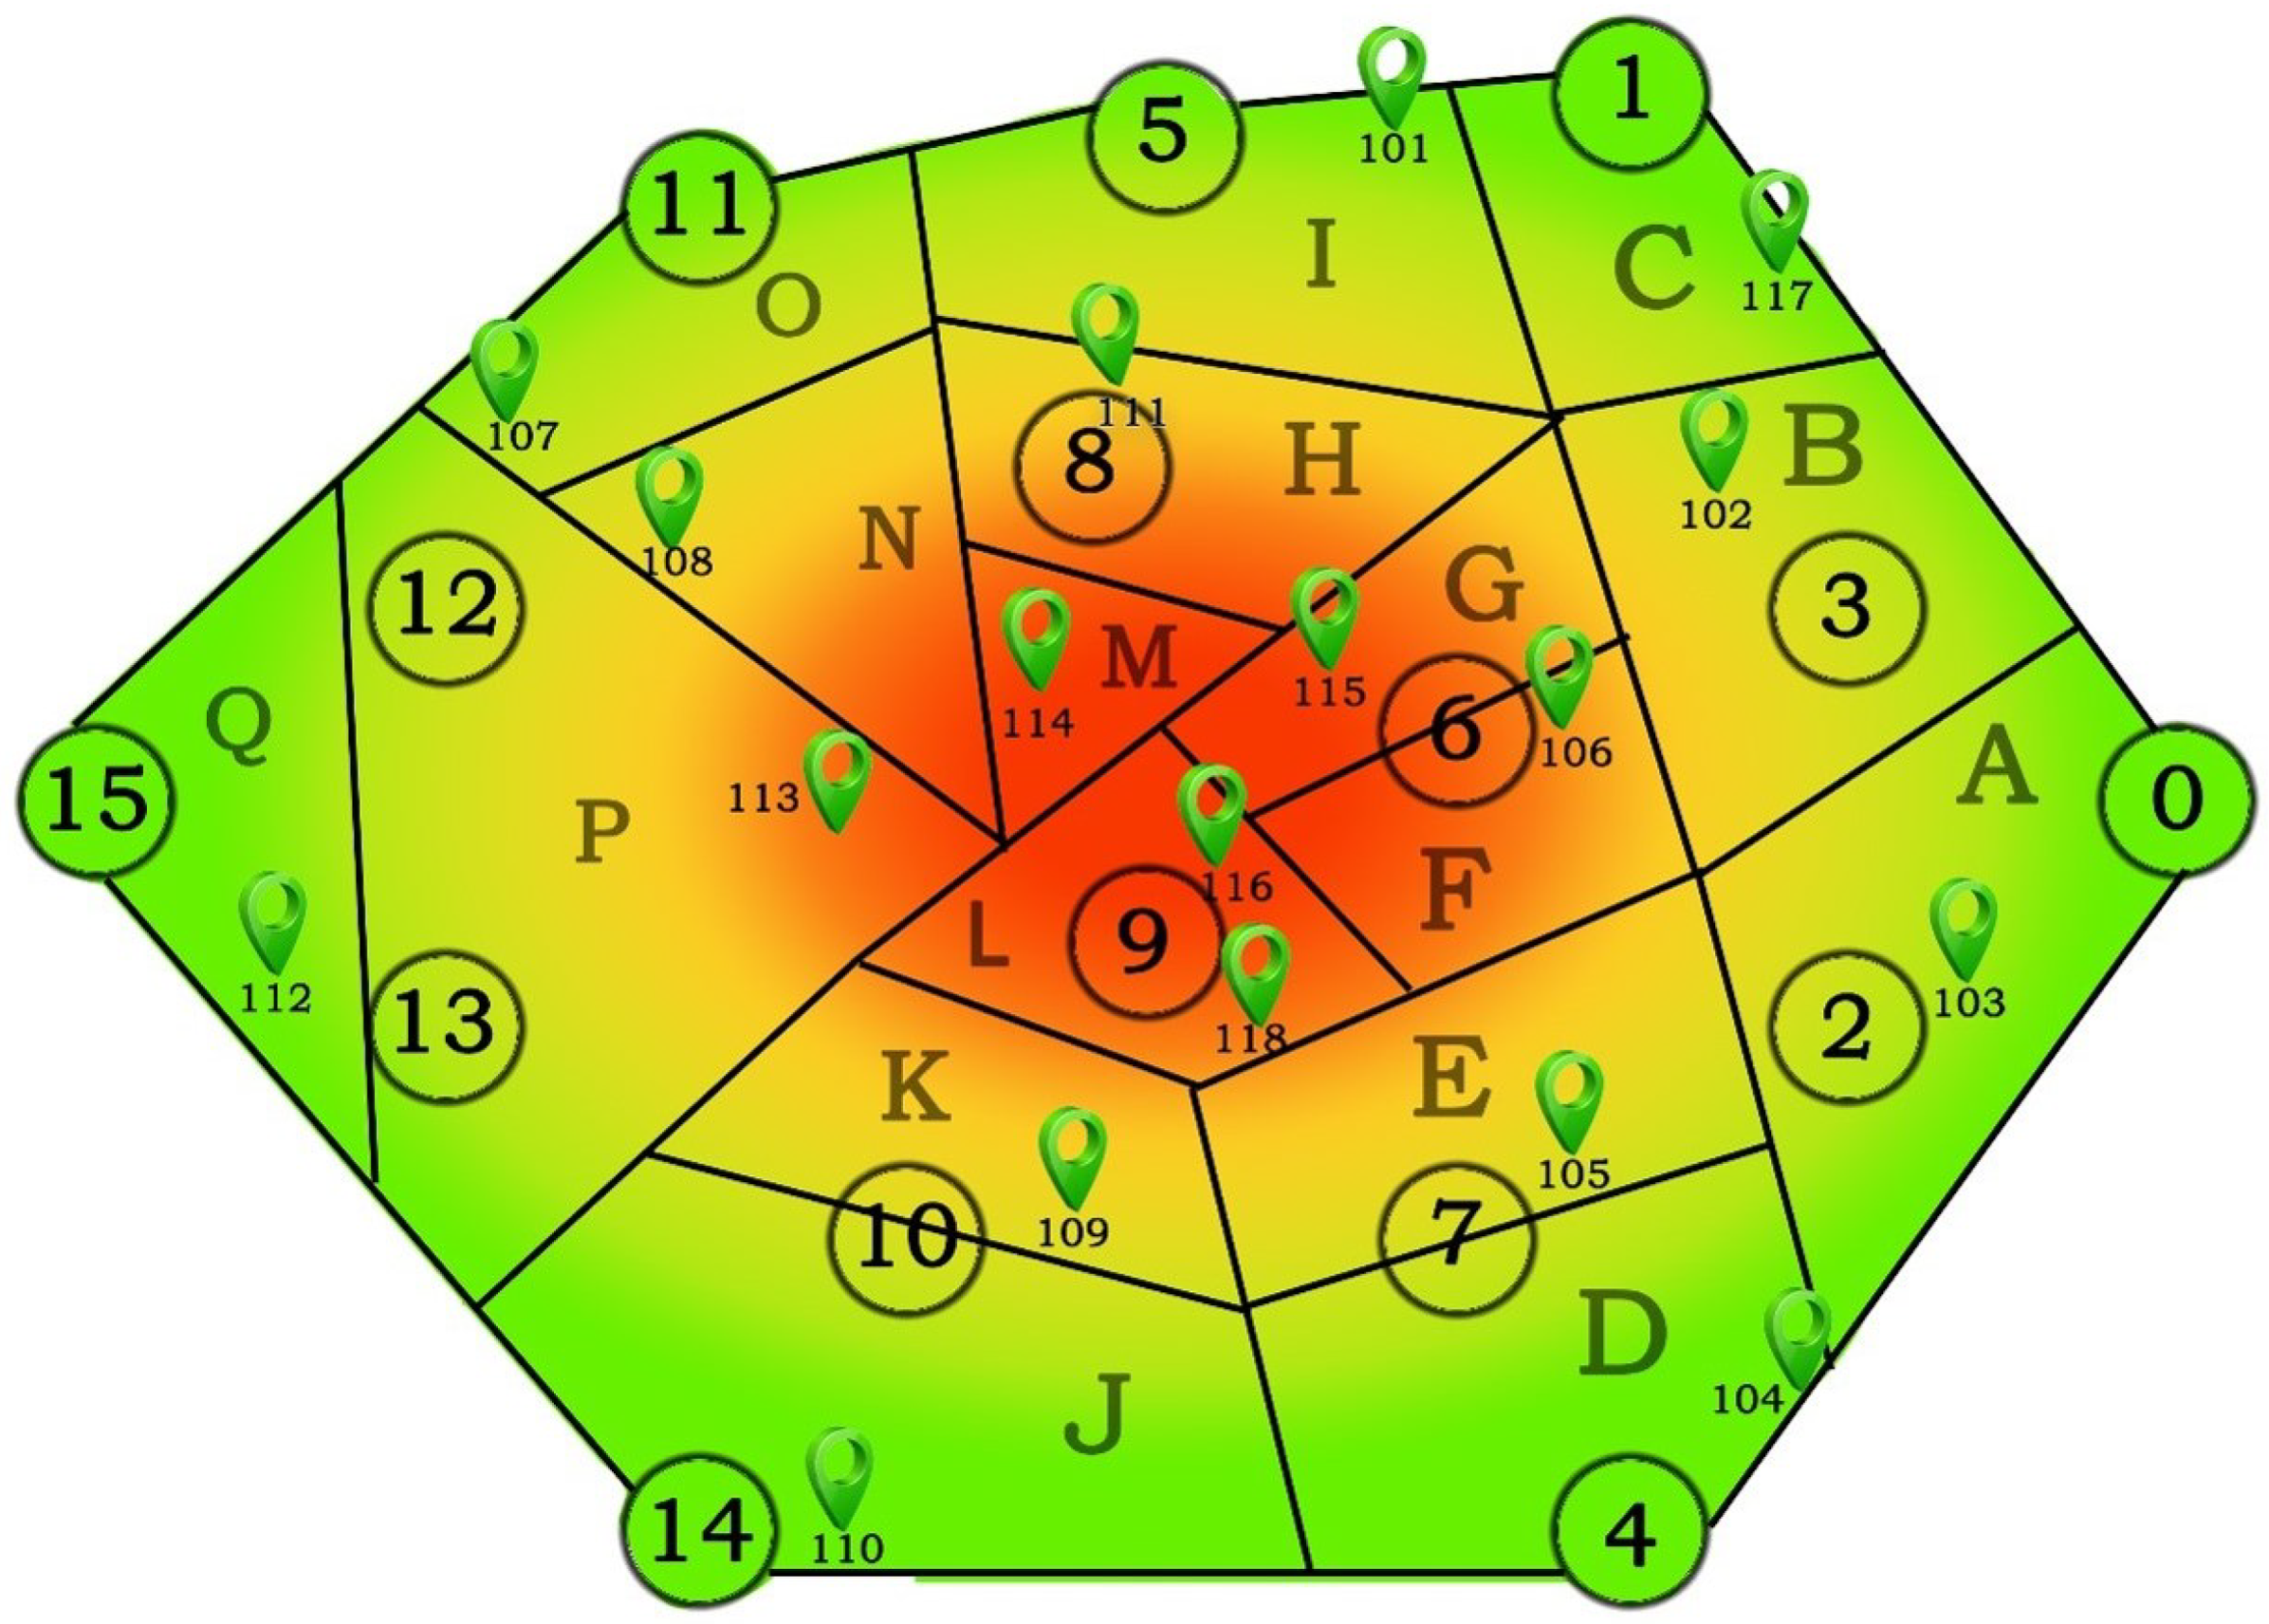
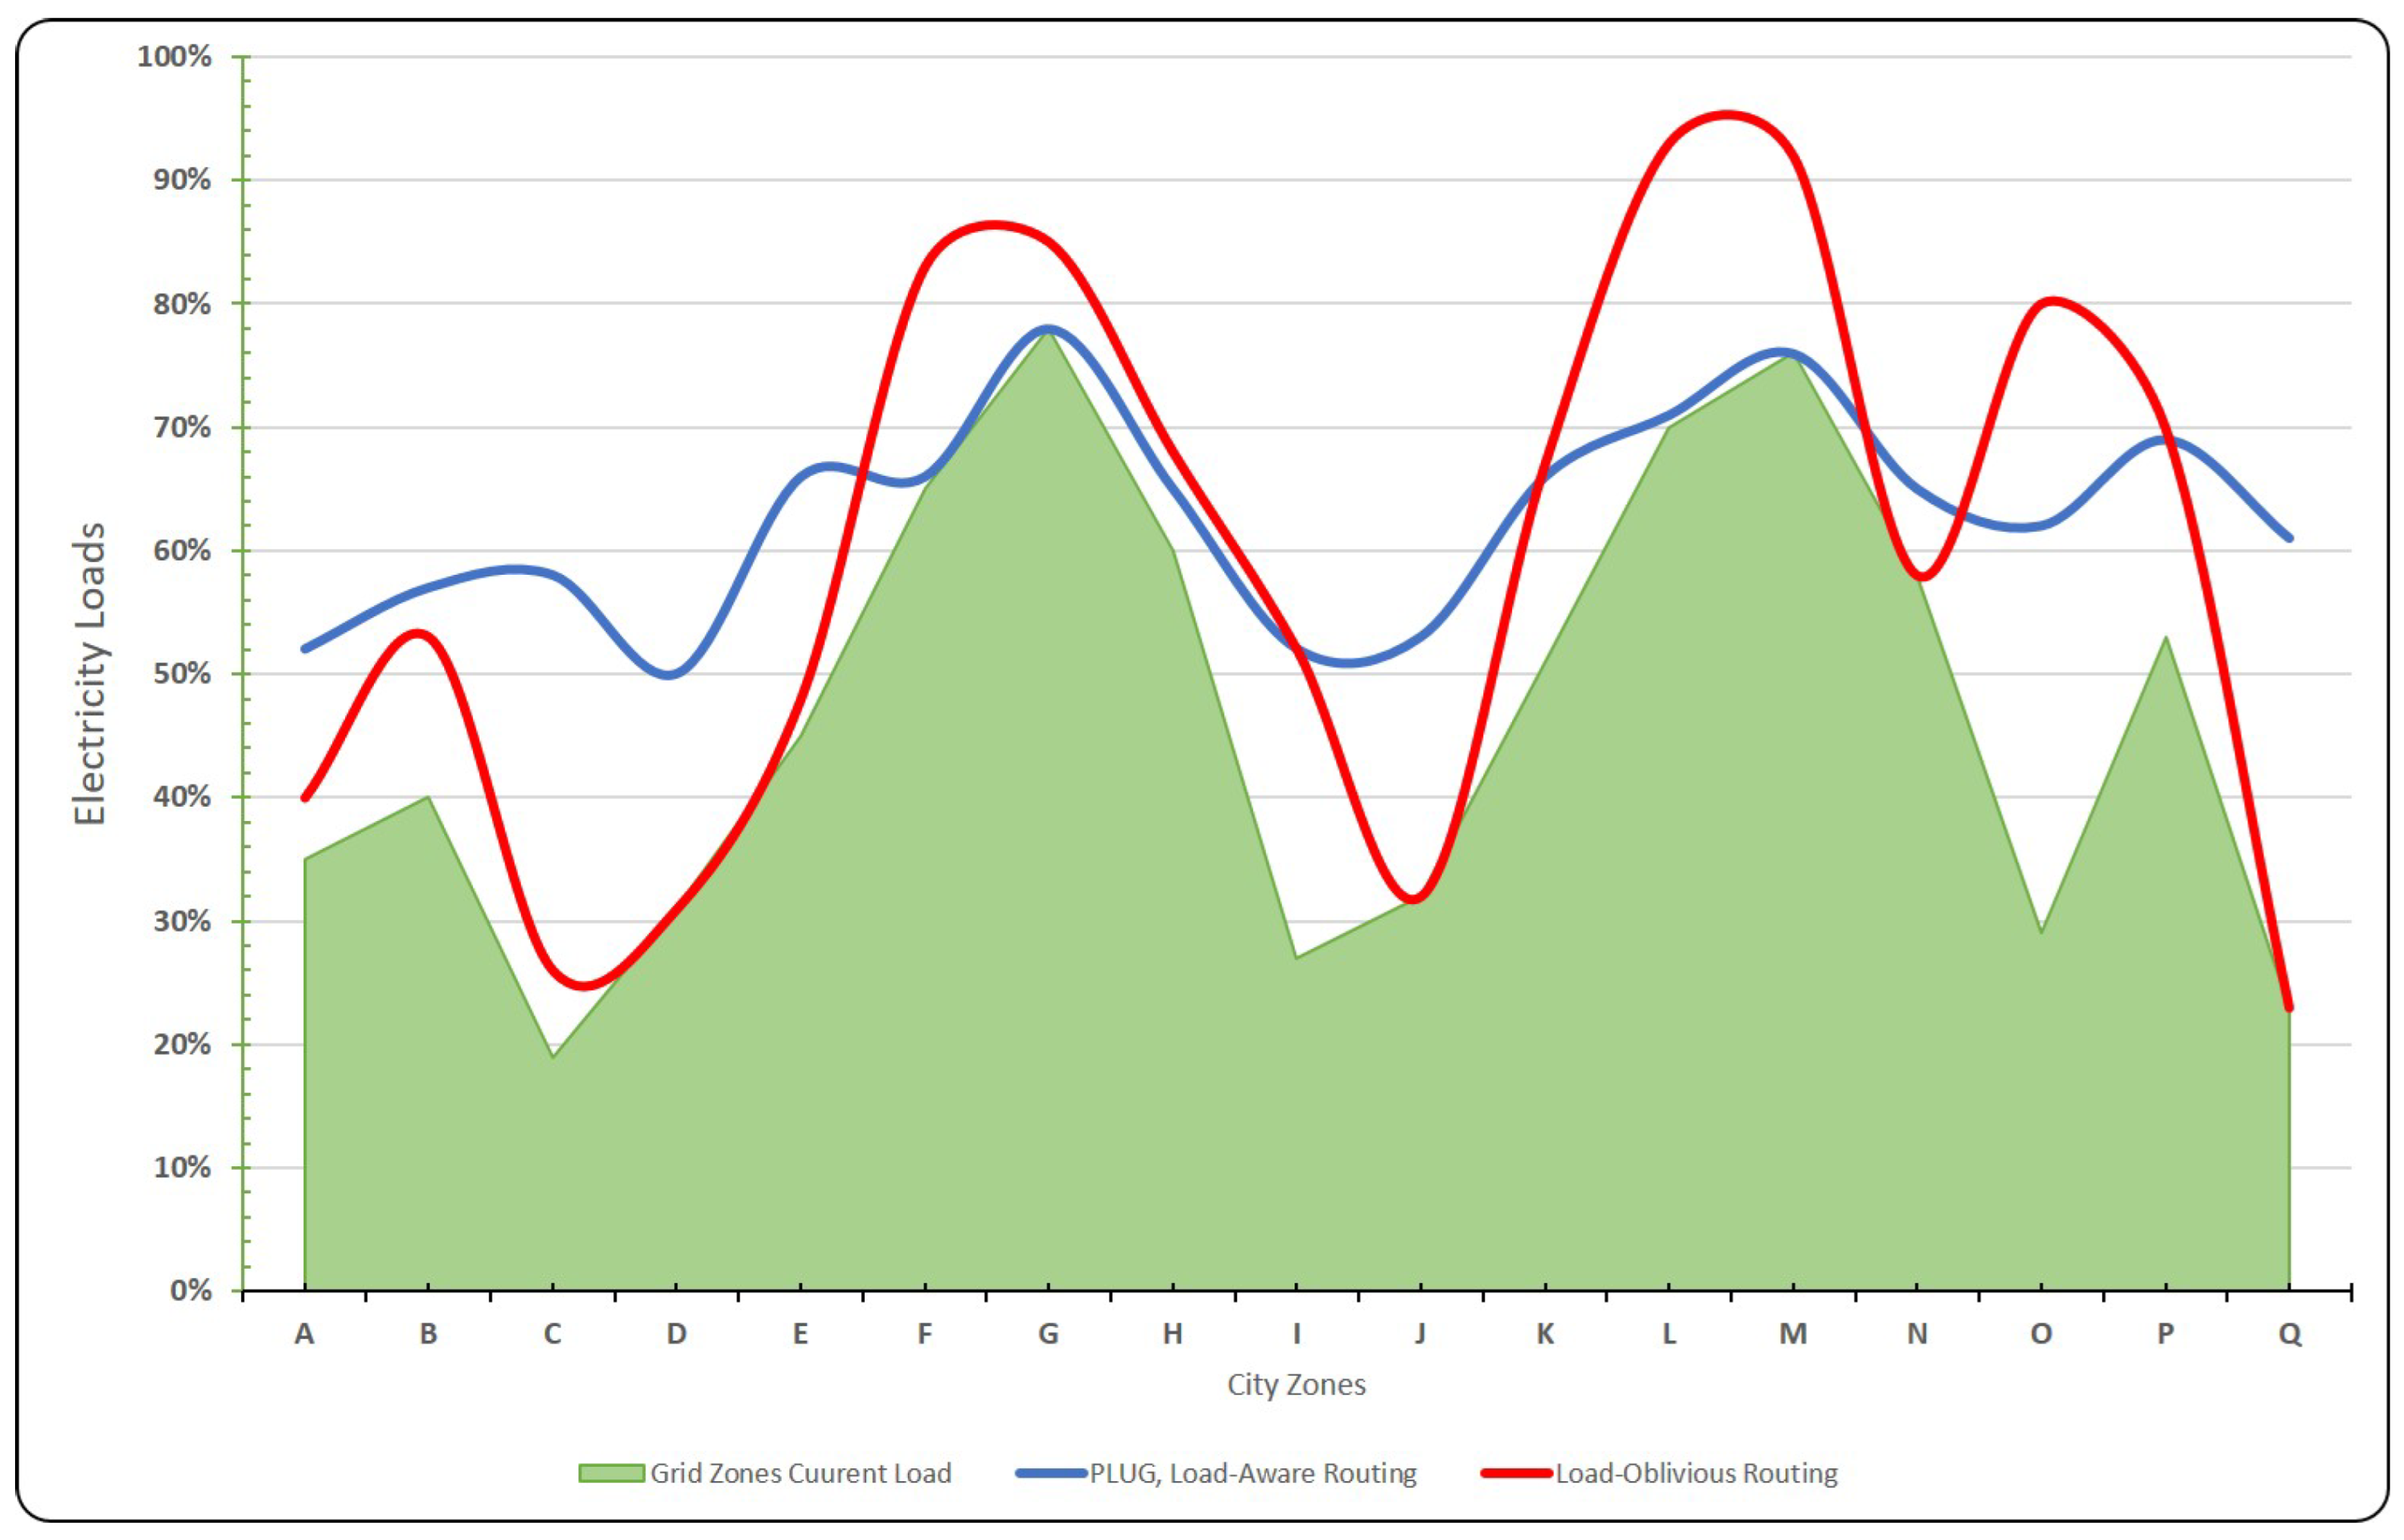
5.2. Load-Balanced Power Grid Zones
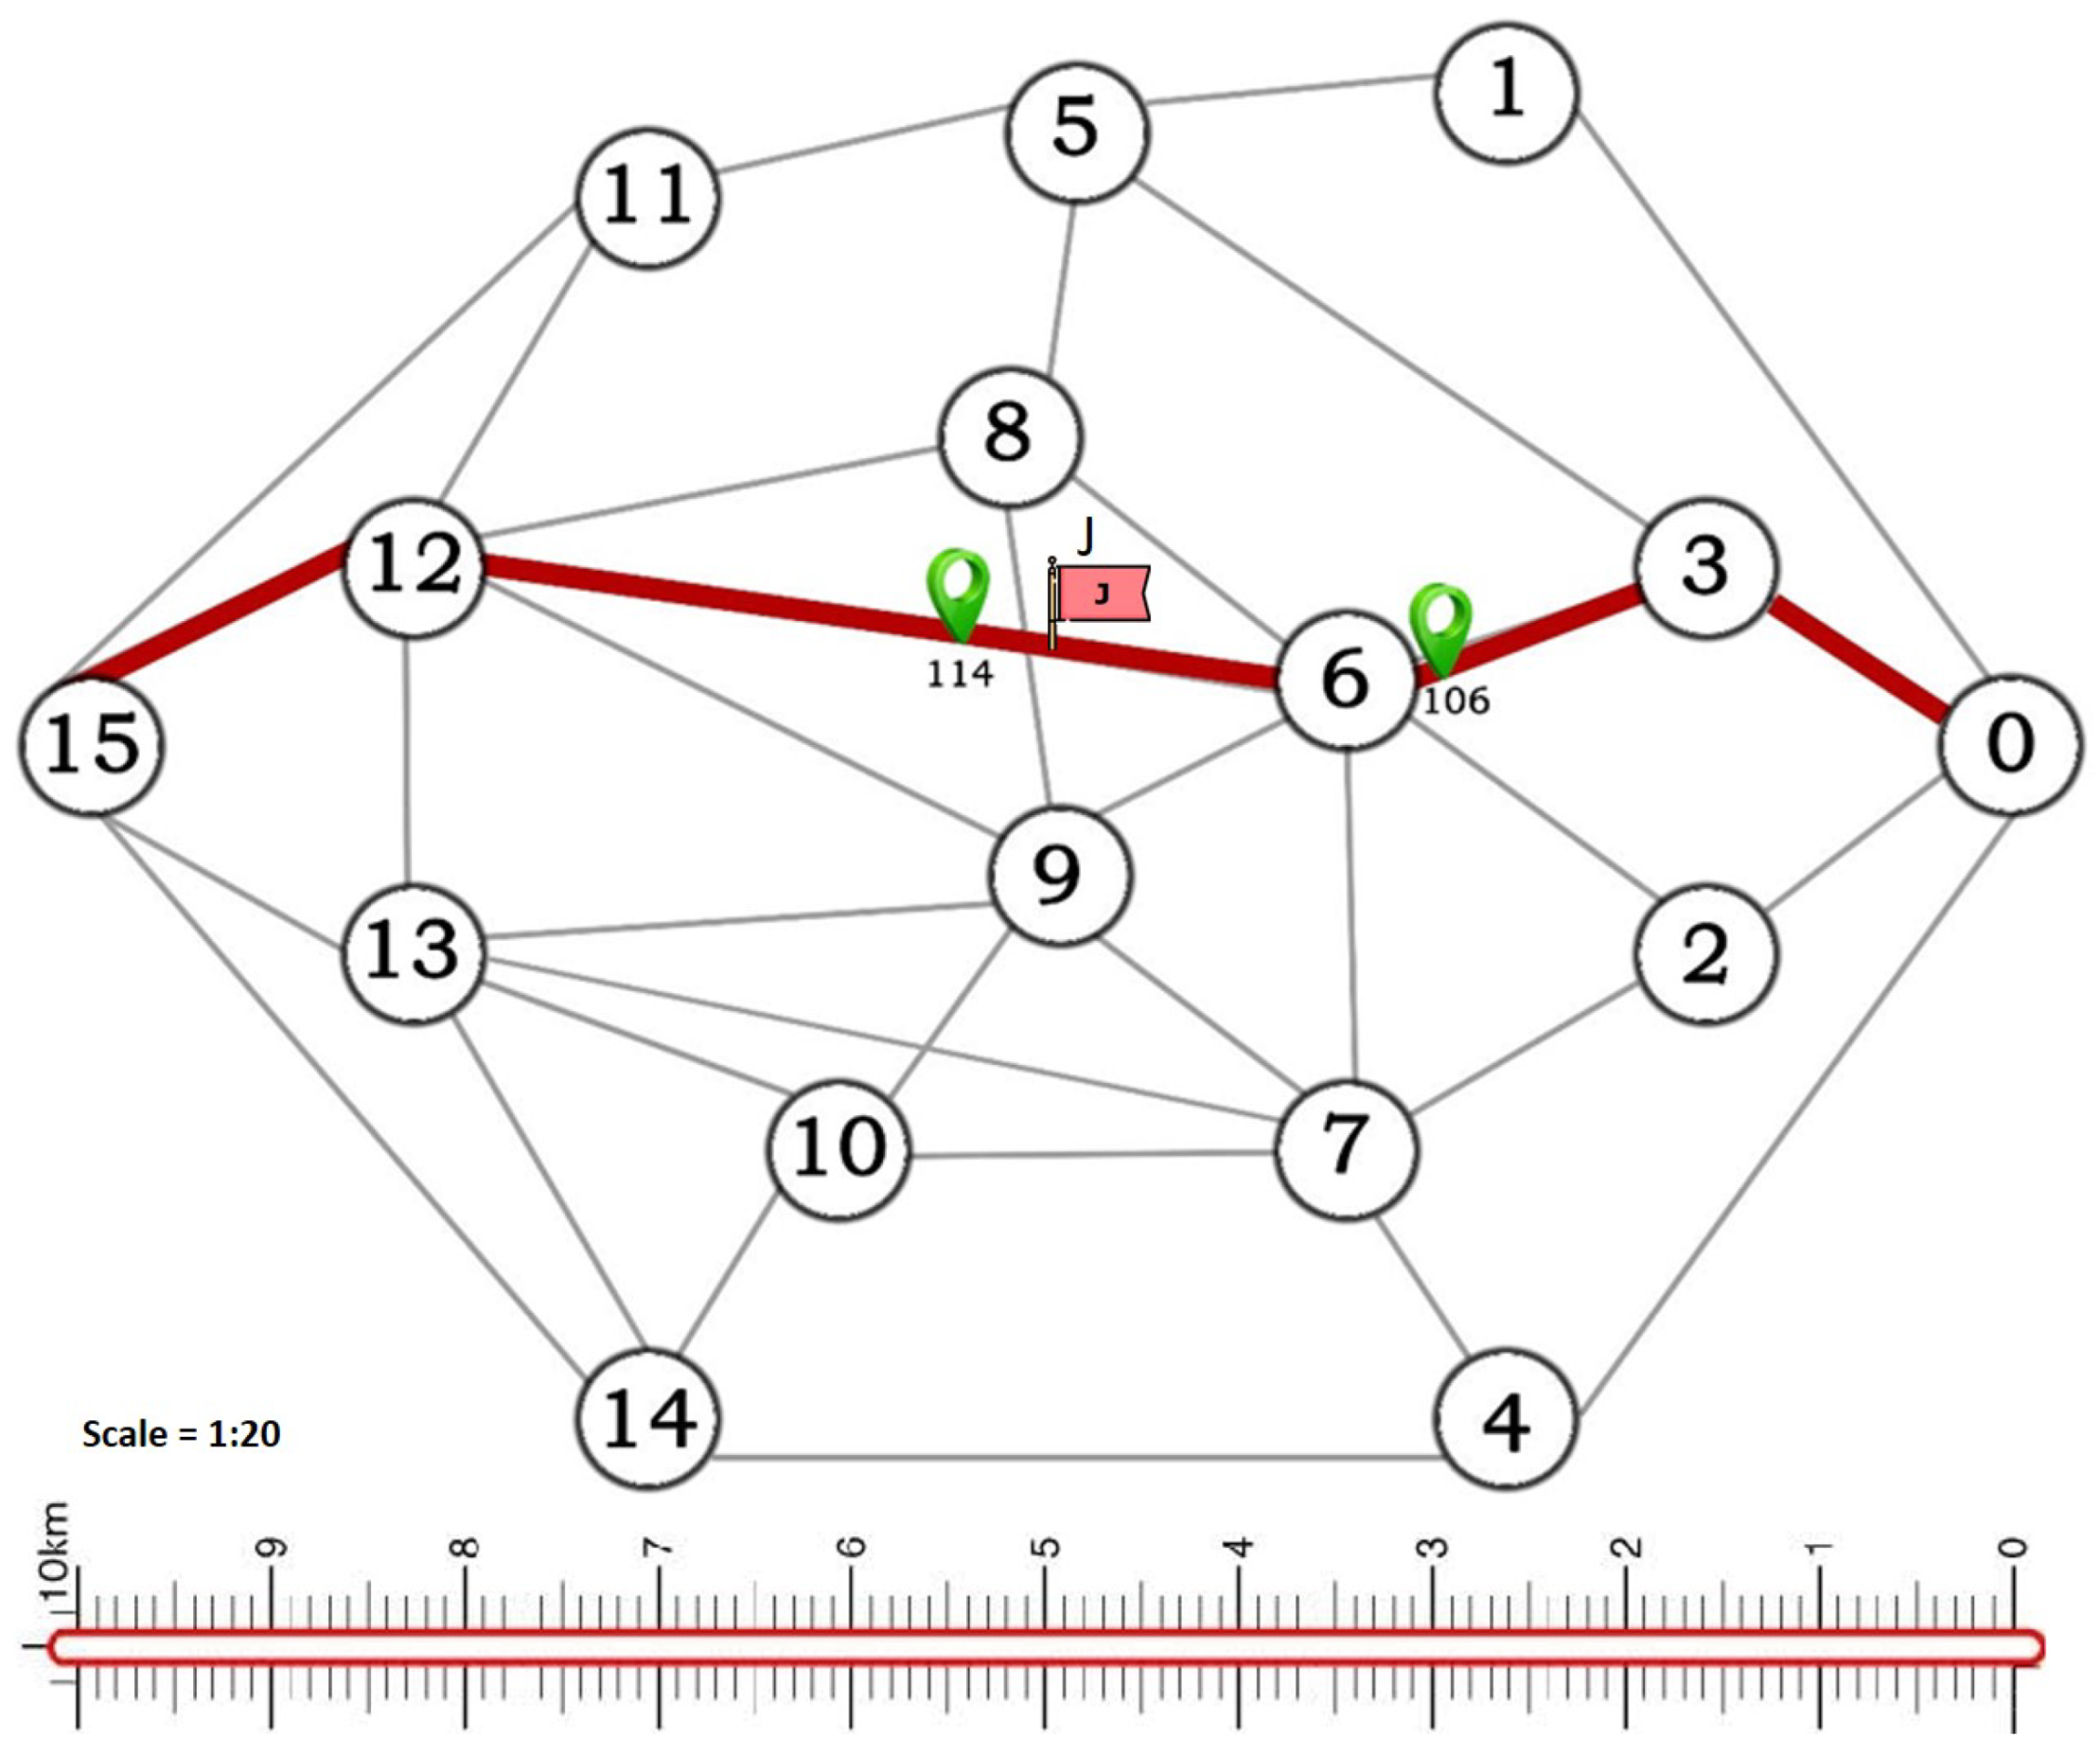
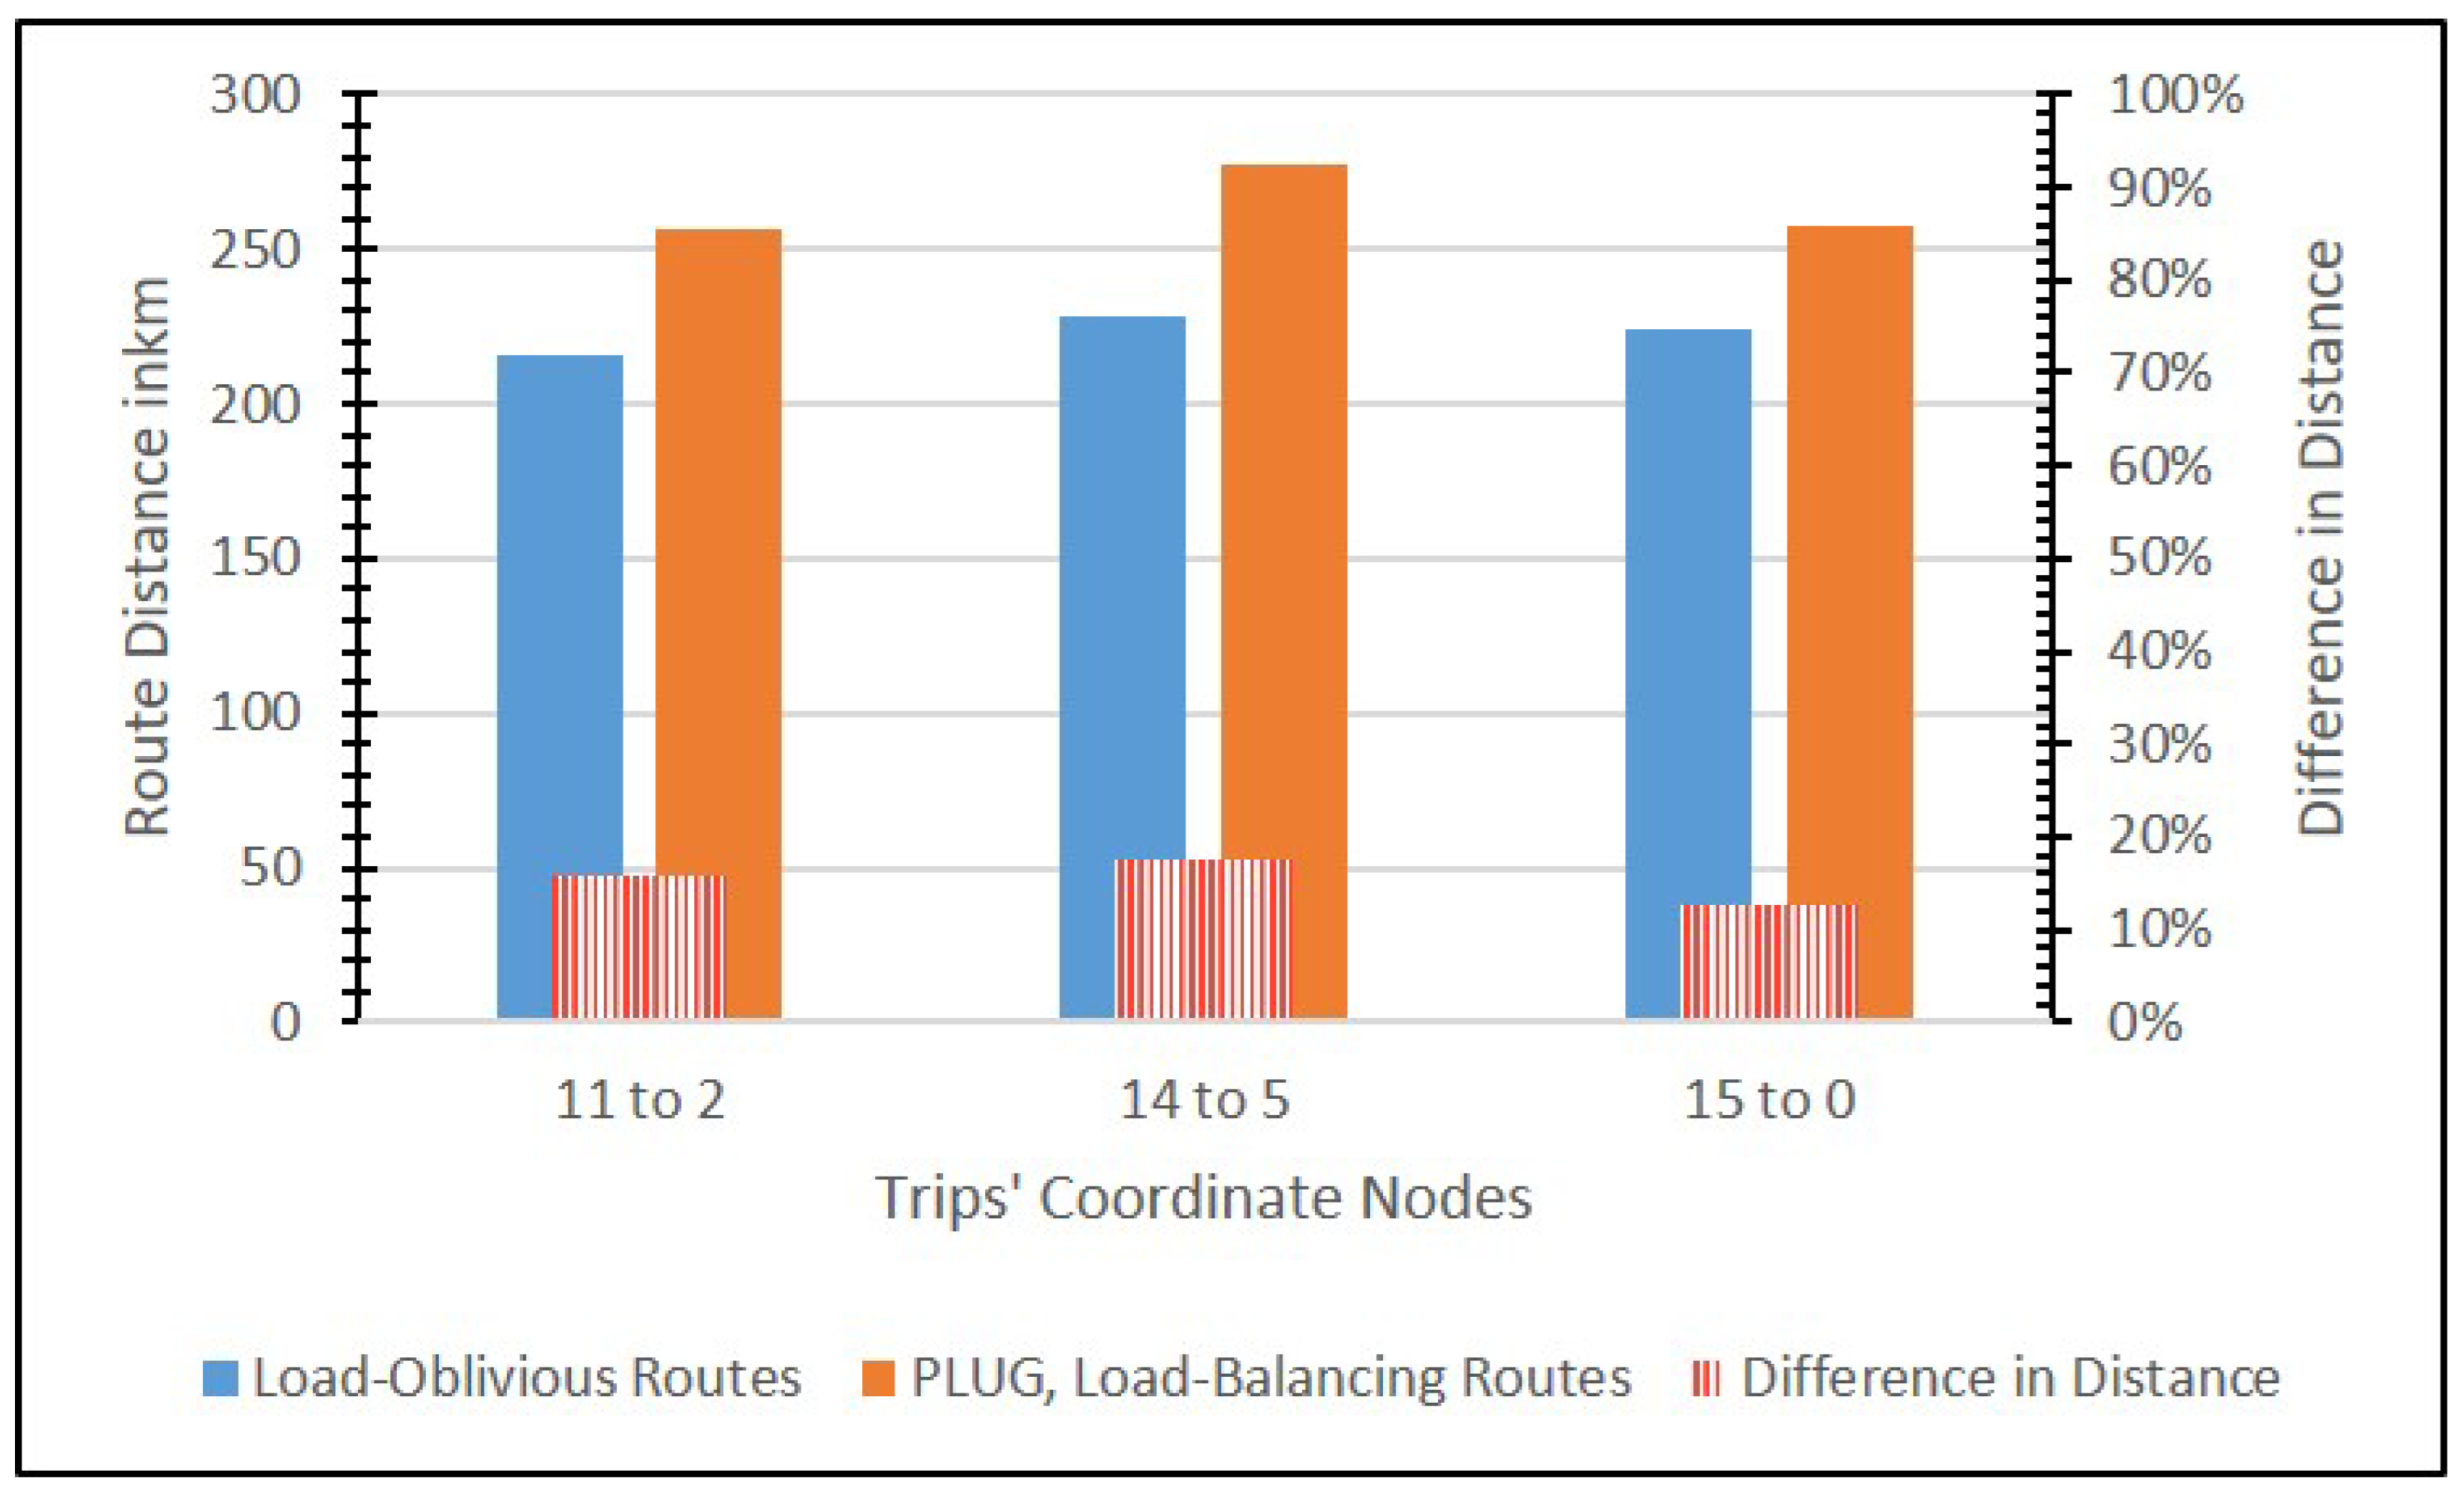
To access the load-balancing behavior of the proposed PLUG model and compare it to that of the load-oblivious benchmark model, we ran the simulation for almost 4000 EV trips between randomly chosen source and destination pairs of nodes among the 16 different city nodes. Figure 8 shows the resultant loads at the zones’ grid transformers after 2000 trips. The blue line shows the electricity loads with the PLUG model being deployed, while the load-oblivious model loads are shown in red.
By reading the load lines, we can clearly notice the balancing attempts of the PLUG routing model compared to that of the load-oblivious one. Figure 9 shows the load-balancing attempts after 4000 navigation requests; in the figure, the results of the PLUG model show near optimal load-balanced electricity loads distributed throughout all the city zones compared to the load-oblivious model, which still concentrates the loads at the city-center zones motivated by the shortest distance routing methodology being deployed.
It is worth mentioning that the numerical results revealed by the simulation show very high loads at the city-center zones F, G, L, and M. Those zones represent relay nodes in the shortest routes for many of the border city nodes. In real life, such high loads may result in power cut-offs in the hosting and the neighboring zones, too. The PLUG model avoids such potential problems by motivating other routes that pass via less-loaded zones.

5.3. Route Samples

Figure 10, Figure 11, Figure 12 and Figure 13 shows samples of the navigation results provided by the PLUG model compared to that of the load-oblivious one. For these runs, we chose the 2016 Nissan Leaf EV that comes equipped with a battery that runs for 168 km in economic driving mode. Such a 168 km range is expected from a 100 % SoH battery; therefore, we assumed a 90 % SoH which gives us 152 km. Hence, we simulate running an EV that is equipped with a 152 km range battery at full charge; we also assumed that our EV starts its new trips with an 80% charged battery (i.e., to emulate the case of starting a new trip with residual battery charges after being charged somewhere along the previous trip). In Figure 10, we are showing the routes’ distances of three different trips: trip (1) from source node 11 to destination node 2, trip (2) from node 14 to node 5, and trip (3) from node 15 to node 0. We started the presentation of the results by showing that deploying the PLUG model for EV routing instead of that pure shortest-distance load-oblivious model may result in longer distance routes for PLUG, although this increase in distance is only within the range of 10% to 20%.
However, such an increase is fully justified if we consider the bigger percentages of savings it allows for the drivers, as shown in Figure 11, and more importantly, the balance it makes to the power grid loads. Reading the results in Figure 11 for the aforementioned three trips, we can clearly notice that the savings per trip come within the range of 35% to 75%, which far exceeds the relatively little increase in trip distances. It is also worth highlighting that PLUG routes for the reversed trip coordinate nodes may also be different. Indeed, as in PLUG, besides distance, routes are chosen based on the charging points coverage and the loads of their hosting zones.
Consequently, as shown in Figure 12, the PLUG resulting route for trips 0 to 15 is different from that of trips 15 to 0. It is longer in distance and costlier in charging expenses, too. The routes of both trips come in equal distances when navigating using the load-oblivious model; however, as shown in Figure 13, their costs are different.
In trips 15 to 0, the load-oblivious model chose a route with only one charging station, that is station 114, and the route is (15, 12, 114, 6, 3, 0). On the contrary, for the reversed trip, it chose the route (0, 3, 106, 6, 114, 12, 15) that comes with one further stop: that is to charge at station 106. Referring to the recommended route, we find that due to distance limits, the EV cannot directly reach station 114 without being recharged, so it needs to charge at charging station 106 first and then continue to charge again at 114 before reaching the destination point 15. Comparing the routes of both models, we find that PLUG recommends a longer path for the reversed trip, that is (0, 104, 4, 110, 14, 15) which routes the EV via the borders of the city with a charging cost of $ 18 that reflects the low loads at the chosen charging stations when compared to the cost of $ 48 for the load-oblivious loaded route. Comparing the costs of both routes, we find that PLUG allows a 160% savings in charge cost when compared to the load-oblivious route. It is worth mentioning that PLUG model finds multiple routes for the required trips but chooses the one that best matches the weight preference settings presented in Equation (3). In this run, the preferences were set to choose the routes with the least-loaded charging stations. Accordingly, such routes might not be the least loaded ones, but this is still interesting when comparing their distance/cost metrics to those of the load-oblivious model. As an example, for the same trip from 0 to 15, one of the recommended routes (though not the least loaded) is a route that passes via (0, 103, 2, 7, 109, 10, 13, 15). This route costs $ 20 with a distance of only 257 km, meaning a big reduction in charging costs (less loaded stations) with only 14 % more distance to drive.

6. Conclusions

Electric vehicles are better for human health and the environment than vehicles that consume fossil fuels, and they have economic advantages, too. This is promising; however, cities need to be ready to serve such power-hungry fleets of EVs. To do so, this requires appropriate coverage of electric charging stations at almost the same level of coverage as petrol stations. However, such coverage issues might be challenging, as cities need to consider the potential loads such power-hungry non-stationary electric machines may impose on the power grid system. Unmanaged grid loads may compromise the grid’s stability, which may affect the city’s residents, business sectors, and industrial areas. Accordingly, this work proposed the PLUG model, which is a load-aware shortest route navigation model that is oriented for EVs. In PLUG, less loaded routes are motivated through lower charge price units. EV drivers that use PLUG routes accrue less costs on their trip. PLUG deploys RTP, a dynamic pricing model that adapts according to the real-time status of the power grid. Therefore, loaded city zones would charge higher price units for their charge services; accordingly, the model chooses other less-loaded city zones to create required routes toward the EVs trips’ destinations. PLUG’s simulation results show that EV drivers will have the option of choosing among varying routes toward their trips’ destinations based on the time of day and the city zones to pass through. This is modeled via a preference weight function with the RTP dynamic pricing scheme being deployed. The route options of those less-loaded zones are motivated by big reductions in the charging costs that may exceed 50 % of the load-oblivious ones for a minimal increase of 10 % to 20 % in the chosen route distances.

Author Contributions

Conceptualization, A.N.Q.; methodology, A.N.Q.; software, A.N.Q.; validation, A.N.Q.; formal analysis, A.N.Q.; investigation, A.N.Q.; resources, A.N.Q.; data curation, A.N.Q.; writing—original draft preparation, A.N.Q.; review and editing, A.N.Q., A.A., M.A. (Mohammad Aljaidi) and M.A. (Mohammed Alshammari); visualization, A.N.Q., A.A., M.A. (Mohammad Aljaidi) and M.A. (Mohammed Alshammari); supervision, A.N.Q.; project administration, A.N.Q.; funding acquisition, A.N.Q. and M.A. (Mohammed Alshammari). All authors have read and agreed to the published version of the manuscript.

Funding

This work is partially funded by the Deanship of Scientific Research at the Hashemite University.

Data Availability Statement

The data presented in this study are available on request from the corresponding author.

Conflicts of Interest

The authors declare no conflict of interest, and the funder had no role in the design of the study; in the collection, analyses, or interpretation of data; in the writing of the manuscript; or in the decision to publish the results.

References

  1. Wang, Y.; Bi, J.; Lu, C.; Ding, C. Route Guidance Strategies for Electric Vehicles by Considering Stochastic Charging Demands in a Time-Varying Road Network. Energies 2020, 13, 2287. [Google Scholar] [CrossRef]
  2. Bonges, H.A.; Lusk, A.C. Addressing electric vehicle (EV) sales and range anxiety through parking layout, policy and regulation. Transp. Res. Part A Policy Pract. 2016, 83, 63–73. [Google Scholar] [CrossRef]
  3. Guo, F.; Yang, J.; Lu, J. The battery charging station location problem: Impact of users’ range anxiety and distance convenience. Transp. Res. Part A Policy Pract. 2018, 114, 1–18. [Google Scholar] [CrossRef]
  4. Lin, Z.P.; Wang, H.S.; Tsai, A.J. The Intelligent Charging Path Planning for Electric Vehicle. Int. J. Comput. Netw. Wirel. Mob. Commun. 2016, 6, 1–8. [Google Scholar]
  5. Amin, A.; Tareen, W.U.K.; Usman, M.; Ali, H.; Bari, I.; Horan, B.; Mekhilef, S.; Asif, M.; Ahmed, S.; Mahmood, A. A Review of Optimal Charging Strategy for Electric Vehicles under Dynamic Pricing Schemes in the Distribution Charging Network. Sustainability 2020, 12, 10160. [Google Scholar] [CrossRef]
  6. Siano, P. Demand response and smart grids—A survey. Renew. Sustain. Energy Rev. 2014, 30, 461–478. [Google Scholar] [CrossRef]
  7. Tan, J.; Wang, L. Real-time charging navigation of electric vehicles: A non-cooperative game approach. In Proceedings of the 2015 IEEE Power and Energy Society General Meeting, Denver, CO, USA, 26–30 July 2015. [Google Scholar]
  8. Dutta, G.; Mitra, K. A literature review on dynamic pricing of electricity. J. Oper. Res. Soc. 2017, 68, 1131–1145. [Google Scholar] [CrossRef]
  9. Korolko, N.; Sahinoglu, Z. Robust Optimization of EV Charging Schedules in Unregulated Electricity Markets. IEEE Trans. Smart Grid 2017, 8, 149–157. [Google Scholar] [CrossRef]
  10. Latinopoulos, C.; Sivakumar, A.; Polak, J.W. Response of electric vehicle drivers to dynamic pricing of parking and charging services: Risky choice in early reservations. Transp. Res. Part C Emerg. Technol. 2017, 80, 175–189. [Google Scholar] [CrossRef]
  11. Bitencourt, L.A.; Bruno, S.B.; Renan, S.M.; Marcio, Z.F.; Ferreira, V.H. Optimal EV charging and discharging control considering dynamic pricing. In Proceedings of the 2017 IEEE Manchester PowerTech, Manchester, UK, 18–22 June 2017; pp. 1–6. [Google Scholar]
  12. Yin, Y.; Zhou, M.; Li, G. Dynamic decision model of critical peak pricing considering electric vehicles’ charging load. In Proceedings of the International Conference on Renewable Power Generation (RPG 2015), Beijing, China, 17–18 October 2015. [Google Scholar]
  13. Mohajeryami, S.; Schwarz, P.; Baboli, P.T. Including the behavioural aspects of customers in demand response model: Real time pricing versus peak time rebate. In Proceedings of the 2015 North American Power Symposium (NAPS), Charlotte, NC, USA, 4–6 October 2015. [Google Scholar]
  14. Abushnaf, J.; Rassau, A.; Górnisiewicz, W. Impact of dynamic energy pricing schemes on a novel multi-user home energy management system. Electr. Power Syst. Res. 2015, 125, 124–132. [Google Scholar] [CrossRef]
  15. Quttoum, A.N. AARM: An Autonomous Adaptive Routing Model for Electric-Vehicles. Procedia Comput. Sci. 2022, 210, 28–35. [Google Scholar] [CrossRef]
  16. Jeroen, S.; John, S.D. Transition Challenges for Alternative Fuel Vehicle and Transportation Systems. Environ. Plan. B Plan. Des. 2008, 35, 1070–1097. [Google Scholar]
  17. Schneider, M.; Stenger, A.; Goeke, D. The Electric Vehicle-Routing Problem with Time Windows and Recharging Stations. Transp. Sci. 2014, 48, 500–520. [Google Scholar] [CrossRef]
  18. Erdogan, S.; Hooks, E.M. A Green Vehicle Routing Problem. Transp. Res. Part E Logist. Transp. Rev. 2012, 48, 100–114. [Google Scholar] [CrossRef]
  19. Conrad, R.G.; Figliozzi, M.A. The Recharging Vehicle Routing Problem. In Proceedings of the 2011 Industrial Engineering Research Conference, Kuala Lumpur, Malaysia, 22–24 January 2011. [Google Scholar]
  20. He, F.; Yin, Y.; Lawphongpanich, S. Network equilibrium models with battery electric vehicles. Transp. Res. Part B Methodol. 2014, 67, 306–319. [Google Scholar] [CrossRef]
  21. Manshadi, S.; Mohammad, K.; AbdElghany, K.; Uster, H. Wireless Charging of Electric Vehicles in Electricity and Transportation Networks. IEEE Trans. Smart Grid 2018, 9, 4503–4512. [Google Scholar] [CrossRef]
  22. Yang, Z.; Huang, H.; Lin, F. Sustainable Electric Vehicle Batteries for a Sustainable World: Perspectives on Battery Cathodes, Environment, Supply Chain, Manufacturing, Life Cycle, and Policy. Adv. Energy Mater. 2022, 12, 2200383. [Google Scholar] [CrossRef]
  23. Zhang, L.; Gao, T.; Cai, G.; Hai, K.L. Research on electric vehicle charging safety warning model based on back propagation neural network optimized by improved gray wolf algorithm. Energy Storage 2022, 49, 104092. [Google Scholar] [CrossRef]
  24. Li, S.; Tong, L.; Xing, J.; Zhou, Y. The Market for Electric Vehicles: Indirect Network Effects and Policy Design. J. Assoc. Environ. Resour. Econ. 2017, 4, 89–133. [Google Scholar] [CrossRef]
  25. Mahardhika, S.P.; Putriani, O. A Review of Artificial Intelligence-Enabled Electric Vehicles in Traffic Congestion Management. In Proceedings of the First International Conference on Sustainable Engineering Development and Technological Innovation, ICSEDTI 2022, Tanjungpinang, Indonesia, 11–13 October 2022; European Alliance for Innovation: Bratislava, Slovakia, 2023. [Google Scholar]
  26. Hariri, A.O.; Esfahani, M.; Mohammed, O. A Cognitive Price-Based Approach for Real-time Management of En-route Electric Vehicles. In Proceedings of the 2018 IEEE Transportation Electrification Conference and Expo (ITEC), Long Beach, CA, USA, 13–15 June 2020. [Google Scholar]
  27. Etesami, S.; Saad, W.; Mandavam, N.; Poor, H. Smart Routing of Electric Vehicles for Load Balancing in Smart Grids. Automatica 2020, 120, 109148. [Google Scholar] [CrossRef]
  28. Cai, J.; Chen, D.; Jiang, S.; Pan, W. Dynamic-Area-Based Shortest-Path Algorithm for Intelligent Charging Guidance of Electric Vehicles. Sustainability 2020, 12, 7343. [Google Scholar] [CrossRef]
  29. Haider, Z.M.; Mehmood, K.K.; Khan, S.U.; Khan, M.O.; Wadood, A.; Rhee, S.-B. Optimal Management of a Distribution Feeder During Contingency and Overload Conditions by Harnessing the Flexibility of Smart Loads. IEEE Access 2021, 9, 40124–40139. [Google Scholar] [CrossRef]
  30. Xu, P.; Li, J.; Sun, X.; Zheng, W.; Liu, H. Dynamic Pricing at Electric Vehicle Charging Stations for Queueing Delay Reduction. In Proceedings of the 2017 IEEE 37th International Conference on Distributed Computing Systems (ICDCS), Atlanta, GA, USA, 5–8 August 2017; pp. 2565–2566. [Google Scholar]
  31. Mohsenian-Rad, A.H.; Leon-Garcia, A. Optimal Residential Load Control With Price Prediction in Real-Time Electricity Pricing Environments. IEEE Trans. Smart Grid 2010, 1, 120–133. [Google Scholar] [CrossRef]
Figure 1. Creation of route lookup area in [28].
Wevj 14 00338 g001
Figure 2. Route lookup area in [28].
Wevj 14 00338 g002
Figure 3. Route example in [28].
Wevj 14 00338 g003
Figure 4. Shortest-route, load-oblivious navigation from source 0 to destination 15.
Wevj 14 00338 g004
Figure 5. EV load-balanced routing, PLUG model demonstration.
Wevj 14 00338 g005
Figure 6. City area, showing 18 charging stations, in 17 zones, connecting 16 nodes.
Wevj 14 00338 g006
Figure 7. Color-coded city zones with grid’s transformer loads being read, time (16:00).
Wevj 14 00338 g007
Figure 8. Electricity grid loads with PLUG vs. load-oblivious EV routing model after 2000 trips.
Wevj 14 00338 g008
Figure 9. Electricity grid loads with PLUG vs. load-oblivious EV routing model after 4000 trips.
Wevj 14 00338 g009
Figure 10. PLUG distances.
Wevj 14 00338 g010
Figure 11. PLUG savings.
Wevj 14 00338 g011
Figure 12. Reversed trips distances.
Wevj 14 00338 g012
Figure 13. Reversed trips cost.
Wevj 14 00338 g013
Table 1. Loads at the city zones’ power grid transformers *.
Zone NameCharging Station No.Consumption RatioAvailability RatioCorresponding Dynamic Price Unit
A10340%60%$0.36
B10245%55%$0.42
C11720%80%$0.16
D10435%65%$0.33
E10552%48%$0.48
F10675%25%$0.78
G11588%12%$0.94
H11170%30%$0.69
I10130%70%$0.27
J11035%65%$0.33
K10957%43%$0.54
L116, 11882%18%$0.86
M11487%13%$0.90
N10866%34%$0.64
O10732%68%$0.30
P11361%39%$0.57
Q11225%75%$0.24
* These values represent percentages of the whole power capacity in the physical infrastructure whose specifications are assumed to be provided by the city.
Disclaimer/Publisher’s Note: The statements, opinions and data contained in all publications are solely those of the individual author(s) and contributor(s) and not of MDPI and/or the editor(s). MDPI and/or the editor(s) disclaim responsibility for any injury to people or property resulting from any ideas, methods, instructions or products referred to in the content.

