Abstract
During the charging process of the electric vehicle (EV), a spontaneous combustion accident may occur due to overheating of the battery, causing personal danger and property damage. To address the charging safety of EVs, this paper proposes a new hybrid EV charging process early warning protection method by combining Convolutional Long-Short Term Memory (ConvLSTM), the sliding window method, and the residual analysis method. The method is fully trained by extracting the deep features of EV charging data through ConvLSTM, eliminating the influence of erroneous transmission data through the sliding window method, and setting a reasonable warning threshold through the residual analysis method. The cross-validation results showed that among the four training sets, the ConvLSTM model of training, set three, had the highest prediction accuracy compared with the CNN, LSTM, BiLSTM and CNN-LSTM models, with RMSE reaching 0.029, MAPE reaching 11.37, and r2 reaching 0.89. Training set one had the worst prediction in the four training sets, and after using it to set the warning threshold, the alarm task was completed five sampling points earlier. Therefore, the hybrid model can quickly complete the safety warning task, thereby ensuring the safety of EV charging.
1. Introduction
Compared with traditional vehicles, EVs have great advantages in energy conservation and emission reduction [1,2,3]. With the development of the industry, the safety of EVs has become one of the hot issues, which is not only the key to ensuring the safety of life and property, but also an important guarantee for the rapid development of the EV market. Realizing the safety early warning of the power battery of EVs and establishing a perfect mechanism have become the focus [4,5]. It has been found that the thermal runaway of the battery is an important cause of the spontaneous combustion of the EV charging [6,7]. Therefore, it is important to build an early warning model to protect the safety of EV charging.
At present, there are few research studies in the field of safety warnings for the entire EV charging process. Therefore, the early warning method of a single battery can be used for reference. Shah et al. [8] derived a dimensionless parameter thermal runaway number (TRN), whose value determines whether a lithium-ion battery will undergo the thermal runaway or not. This work laid the foundation for subsequent safety warning efforts. Lyu et al. [9] designed an online dynamic impedance measurement device for real-time overcharge warning and early thermal runaway prediction of lithium-ion batteries, which can effectively reduce the failure rate of thermal runaway. Jiang et al. [10] proposed a fault diagnosis and thermal runaway warning method of the lithium-ion battery pack with standard voltage as the identification object, which can achieve not only accurate identification of faulty cells, but also the early detection of faults and early warning of thermal runaway.
Based on the research and analysis of thermal runaway for a single battery, a suitable early warning method was selected and applied to the entire battery of an EV to solve its combustion problem. As an emerging method in the field of machine learning, the neural network has successful practical cases in the fields of computer vision, early warning, and fault diagnosis. Therefore, the application of the neural network to early warning of the EV charging process has practical technical support. Since there are few applied cases of neural networks in the field of EV early warning at this stage, we can learn from other fields such as CNN [11,12,13], LSTM [14,15,16], BiLSTM [17,18,19], CNN-LSTM [20,21,22], and ConvLSTM [23,24,25] methods for research. In [11], a framework of automatically designed classifiers is proposed for the early detection of COVID-19 from chest X-ray images, minimizing redundant layers and improving prediction accuracy, which verifies the feasibility of CNN in the field of medication safety. In [14], based on the LSTM model, an early warning method for on-site earthquakes was proposed. Experiments show that this method can generate a highly nonlinear neural network and derive the alarm probability at each time step. This method can also effectively conduct an earthquake early warning, which verifies the reliability of LSTM in the field of geological safety. In [17], based on the BiLSTM model, a model for crop classification is proposed; it can fill in missing data and completes the classification task, which validates the accuracy of BiLSTM in the field of agricultural classification. In [20], a new data-driven method is proposed to use a hybrid deep neural network combining CNN, LSTM, and the classical neural network for RUL estimation, which verifies the validity of CNN-LSTM in the field of battery health status. In [23], the ConvLSTM model is used in traffic prediction, and the evaluation is based on the actual traffic data and the traffic flow data of the performance evaluation system, which verifies the applicability of ConvLSTM in the field of transportation convenience.
This research proposes a method for the EV charging safety warnings based on the ConvLSTM model. This hybrid neural network model uses the CNN model as the input of the LSTM model, which can solve the timing problem at the same time, train the model in more dimensions, and fully extract the deep features of the charging data [26,27]. It uses residual analysis to determine the EV charging status after obtaining the model residuals through the sliding window. Therefore, in theory, the model has the potential to predict charging faults. In the next part, the model is trained through the training set, and it is verified by comparing the predicted data with the true values in the test set. The main contributions can be summarized as follows:
- (1)
- In terms of model structure; firstly, the Batch Normalization layer is added to speed up the convergence and prevent the gradient explosion; secondly, deep data features are extracted by overlaying two ConvLSTM cells; then the array is flattened with the Flatten layer; finally, a Dense layer is used to extract the correlation between the features after the nonlinear variation and map them to the output space.
- (2)
- In terms of performance comparison, set the same parameters and compare the accuracy of the trained CNN, LSTM, BiLSTM, CNN-LSTM, and ConvLSTM models to verify the feasibility of the proposed ConvLSTM prediction model.
- (3)
- In terms of practical applications, after the trained model meets the model accuracy, setting the thresholds can realize the model early warning and alarm tasks to predict the occurrence of faults and to effectively avoid charging accidents in EVs.
The rest of this research is organized as follows. Section 2 describes the EV charging system and communication information. Section 3 focuses on the model design and the specific process. Section 4 verifies the model feasibility through experimental analysis. We summarize the research in Section 5.
2. Problem Statement
2.1. Electric Vehicle Charging System Analysis
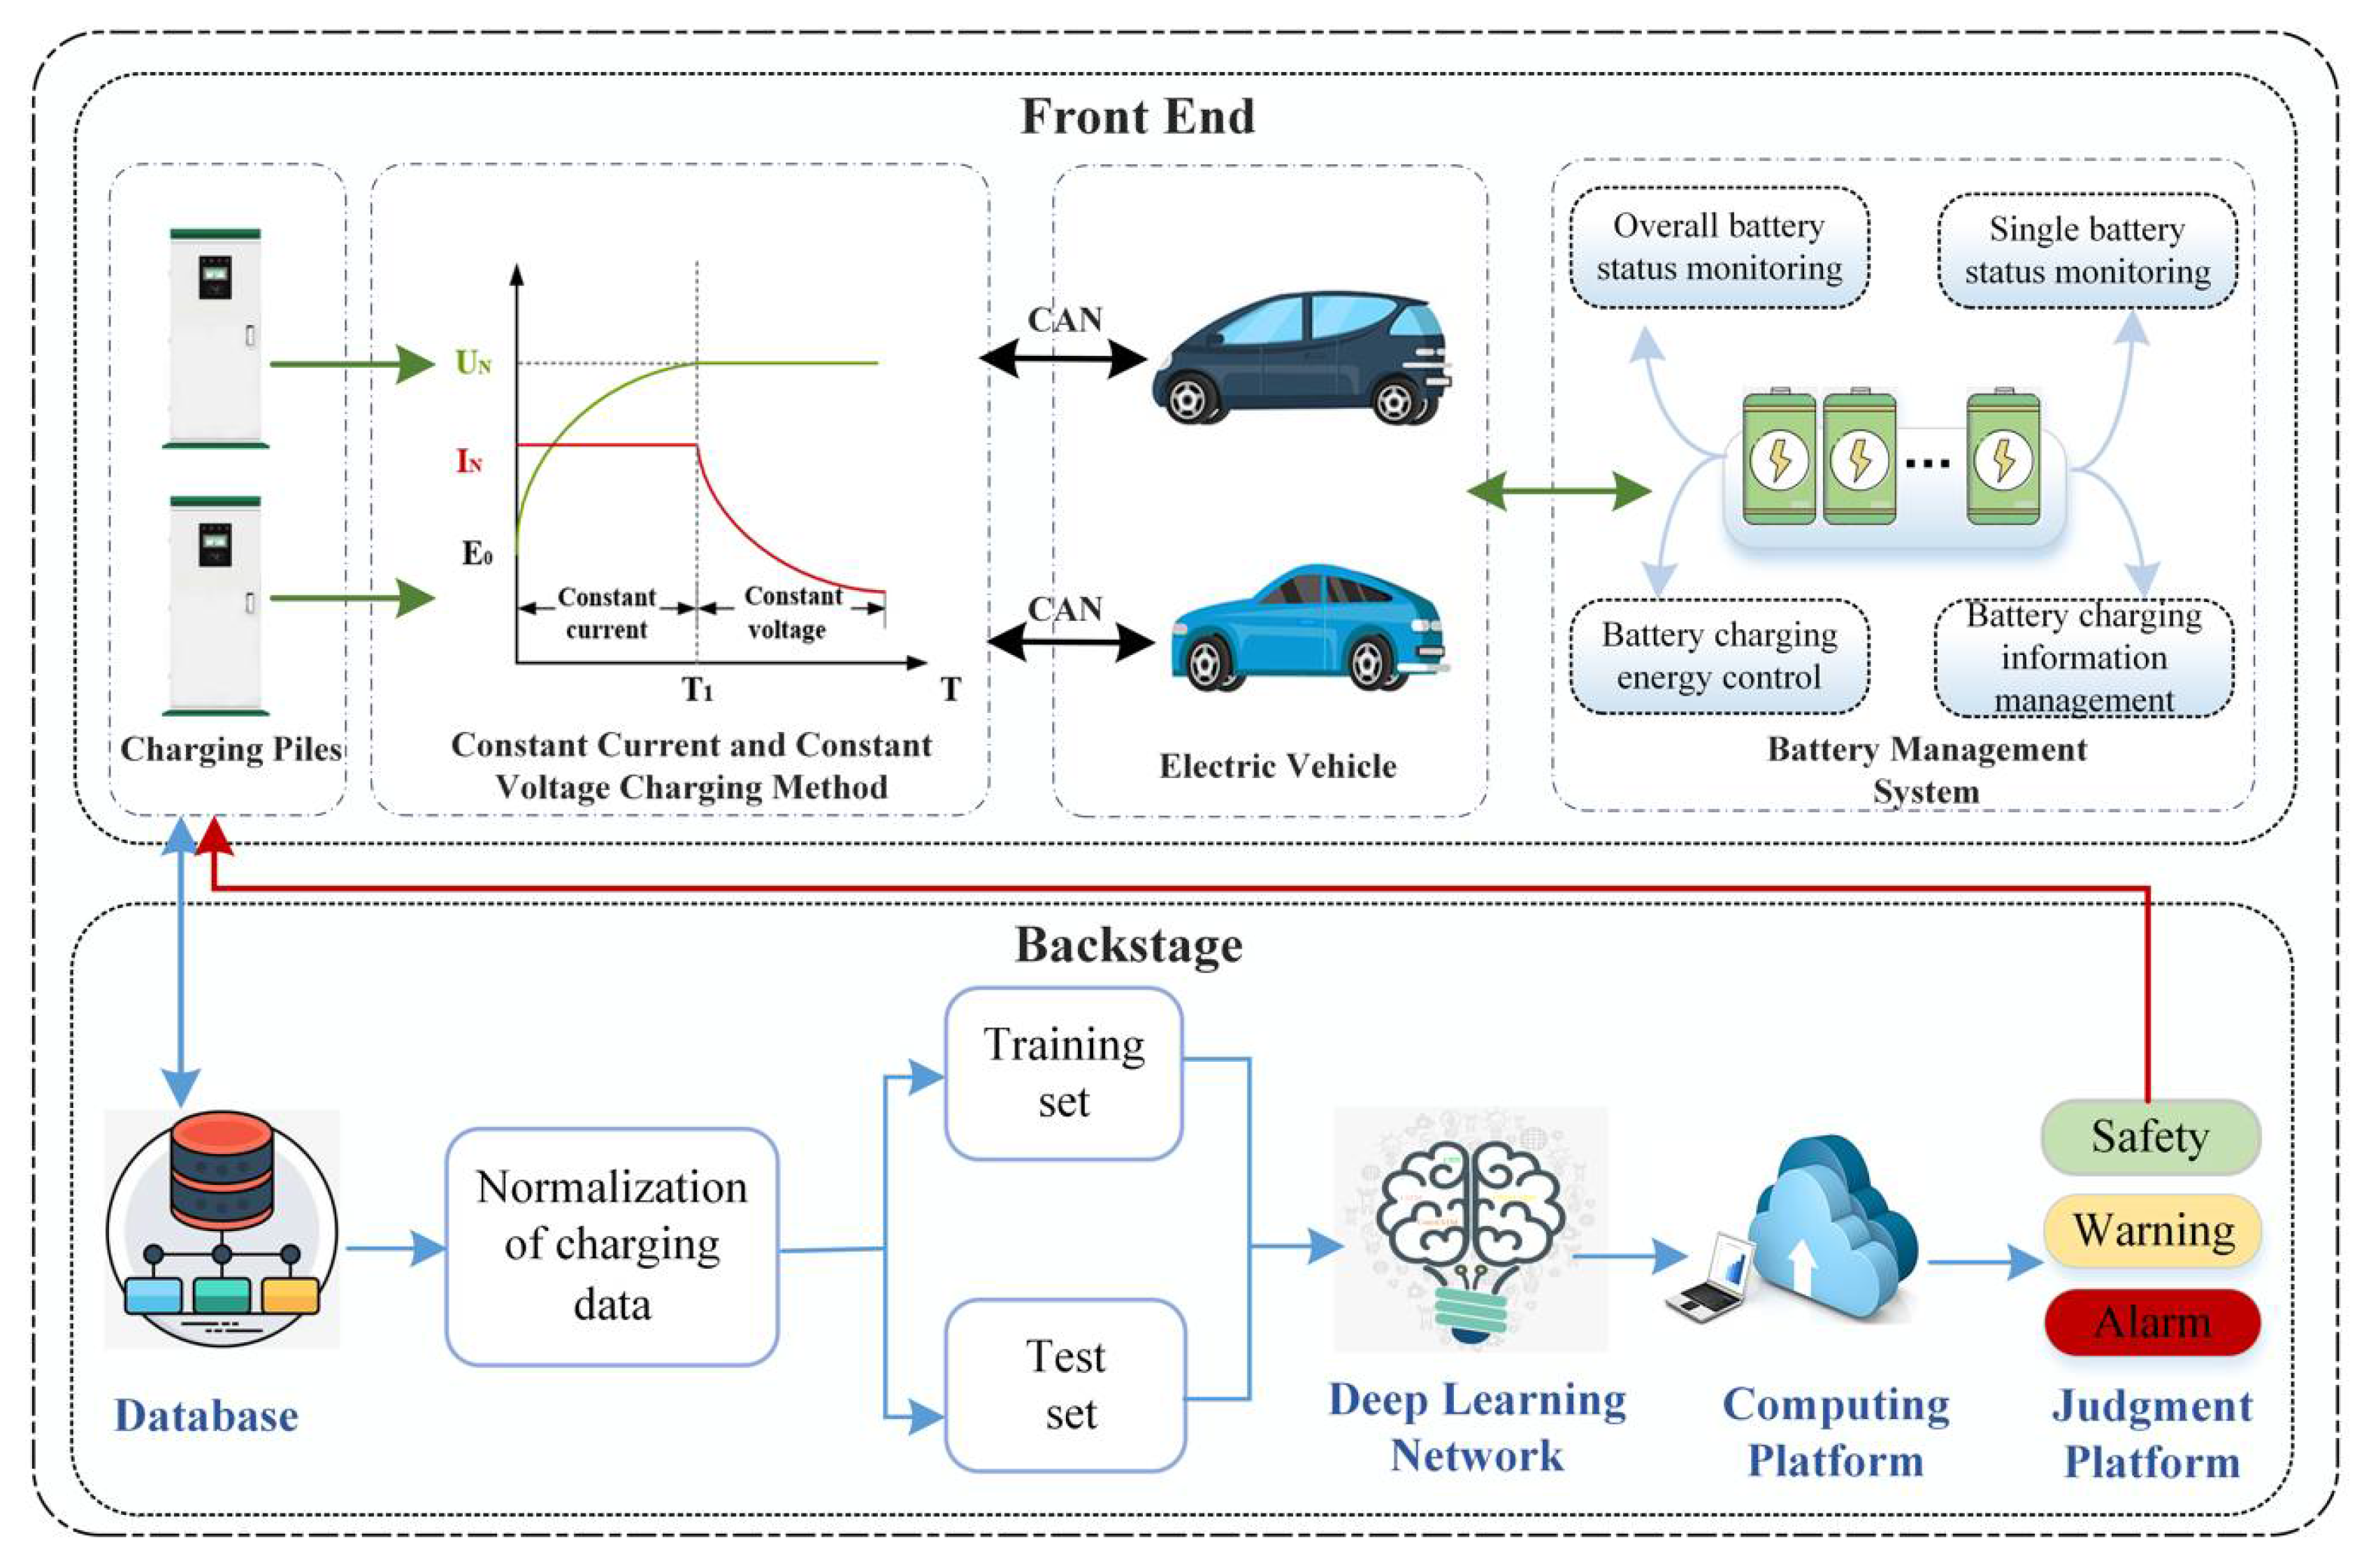
The EV charging platform system includes two parts: front end and backstage. The two parts cooperate to complete resource allocation and safety early warning work, which well guarantees the safety performance of the EV charging process. As shown in Figure 1, the direction of the arrow in the figure indicates the direction of data flow. The composition and functions of these two parts are as follows:
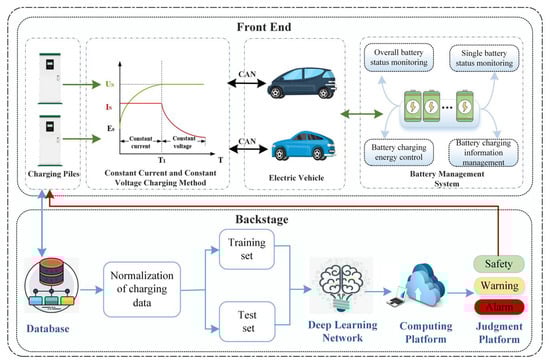
Figure 1.
Diagram of charging platform system for electric vehicle.
Front End: This part is mainly composed of charging equipment and EVs. The charging pile uses the constant current and constant voltage stage charging method to supply power for different types of EVs [28]. It transmits the real-time charging data to the database and executes various control commands of the judgment platform. The Controller Area Network (CAN) communication protocol is adopted between the EV and the charging pile to ensure the real-time interaction of information. The battery management system provides real-time monitoring of single and overall battery status. When the battery temperature is abnormal, the judgment platform sends out corresponding commands to control the charging and stopping of the EV.
Backstage: This part is responsible for judging the charging operation state of the EV. The main charging data in the EV database is normalized and the data set is divided on this basis. The training set is used for the training of the ConvLSTM prediction model, and the test set is used for the judgment of the three states of the EV safety, early warning, and alarm.
2.2. Reference Basis for the Electric Vehicle Charging Process
In the global EV charging industry, there are many charging standards. Standards include interface standards, which relate to the fit of the connector, and current communication standards, which affect whether the plug can be energized when inserted. This section focuses on communication standards for EVs. The European Union mostly uses the European Norm (EN) standard; the charging standard is mainly IEC 61851-1 [29]. The United States uses the Society of Automotive Engineers (SAE) as the standard; the charging standard is mainly SAE J2293/2 [30]. In China’s EV charging industry, the charging standard is mainly GB/T 27930 [31]. In the paper, the communication standard presented is the Chinese standard GB/T 27930. As shown in Table 1, information such as the charging voltage, charging current and temperature of the EV can be obtained before the EV is charged. As shown in the battery management system part and the constant current and constant voltage charging method part in Figure 1, the main status information of the EV power battery before charging is sent to the charging pile through the CAN bus, and the charging pile will be adopted according to the rated current and rated voltage of the EV. The constant current and constant voltage charging method is used to charge the EV. From the starting point to the time T, the high-power constant current charging method is adopted, and the charging current is the rated charging current of the EV; at the time T, the rated voltage value is reached, so it is transferred to the next stage. At this time, the charging current gradually decreases. During the charging process, the EV sends the main status information of this phase to the charging pile in real-time and the information is shown in Table 2. If no abnormal condition occurs during the charging process, the EV battery pack will stop charging when it reaches 99.8% of the rated capacity to prevent the vehicle from burning due to overcharging.

Table 1.
Main status information before charging of the electric vehicle battery.
Table 2.
Main status information during charging of the electric vehicle battery.
2.3. Analysis of the Model Selection Process
After reviewing the applications of neural network algorithms in different fields, the advantages and disadvantages of CNN, LSTM, BiLSTM, CNN-LSTM, and ConvLSTM were objectively evaluated, and the ConvLSTM model was finally chosen according to the actual EV charging application. In the actual working condition, the method proposed in this paper is different training models for different types of EV models, so the speed of model training in the prenormal charging state of EVs should be considered when selecting the model. Since the ConvLSTM model can handle spatio-temporal features simultaneously and has a simple structure and fast training speed, the model is suitable for application to the field of real-time EV warning. After charging is completed, the work of the platform is to keep its model on file and update it in real time to facilitate rapid prediction and evaluation of the EV at that charging point next time. The comparison of the advantages and disadvantages of different models is shown in Table 3.
Table 3.
Comparison of the advantages and disadvantages of different models.
3. Design of Early Warning Hybrid Model for Charging Process
3.1. Introduction to the Components of the Early Warning Hybrid Model
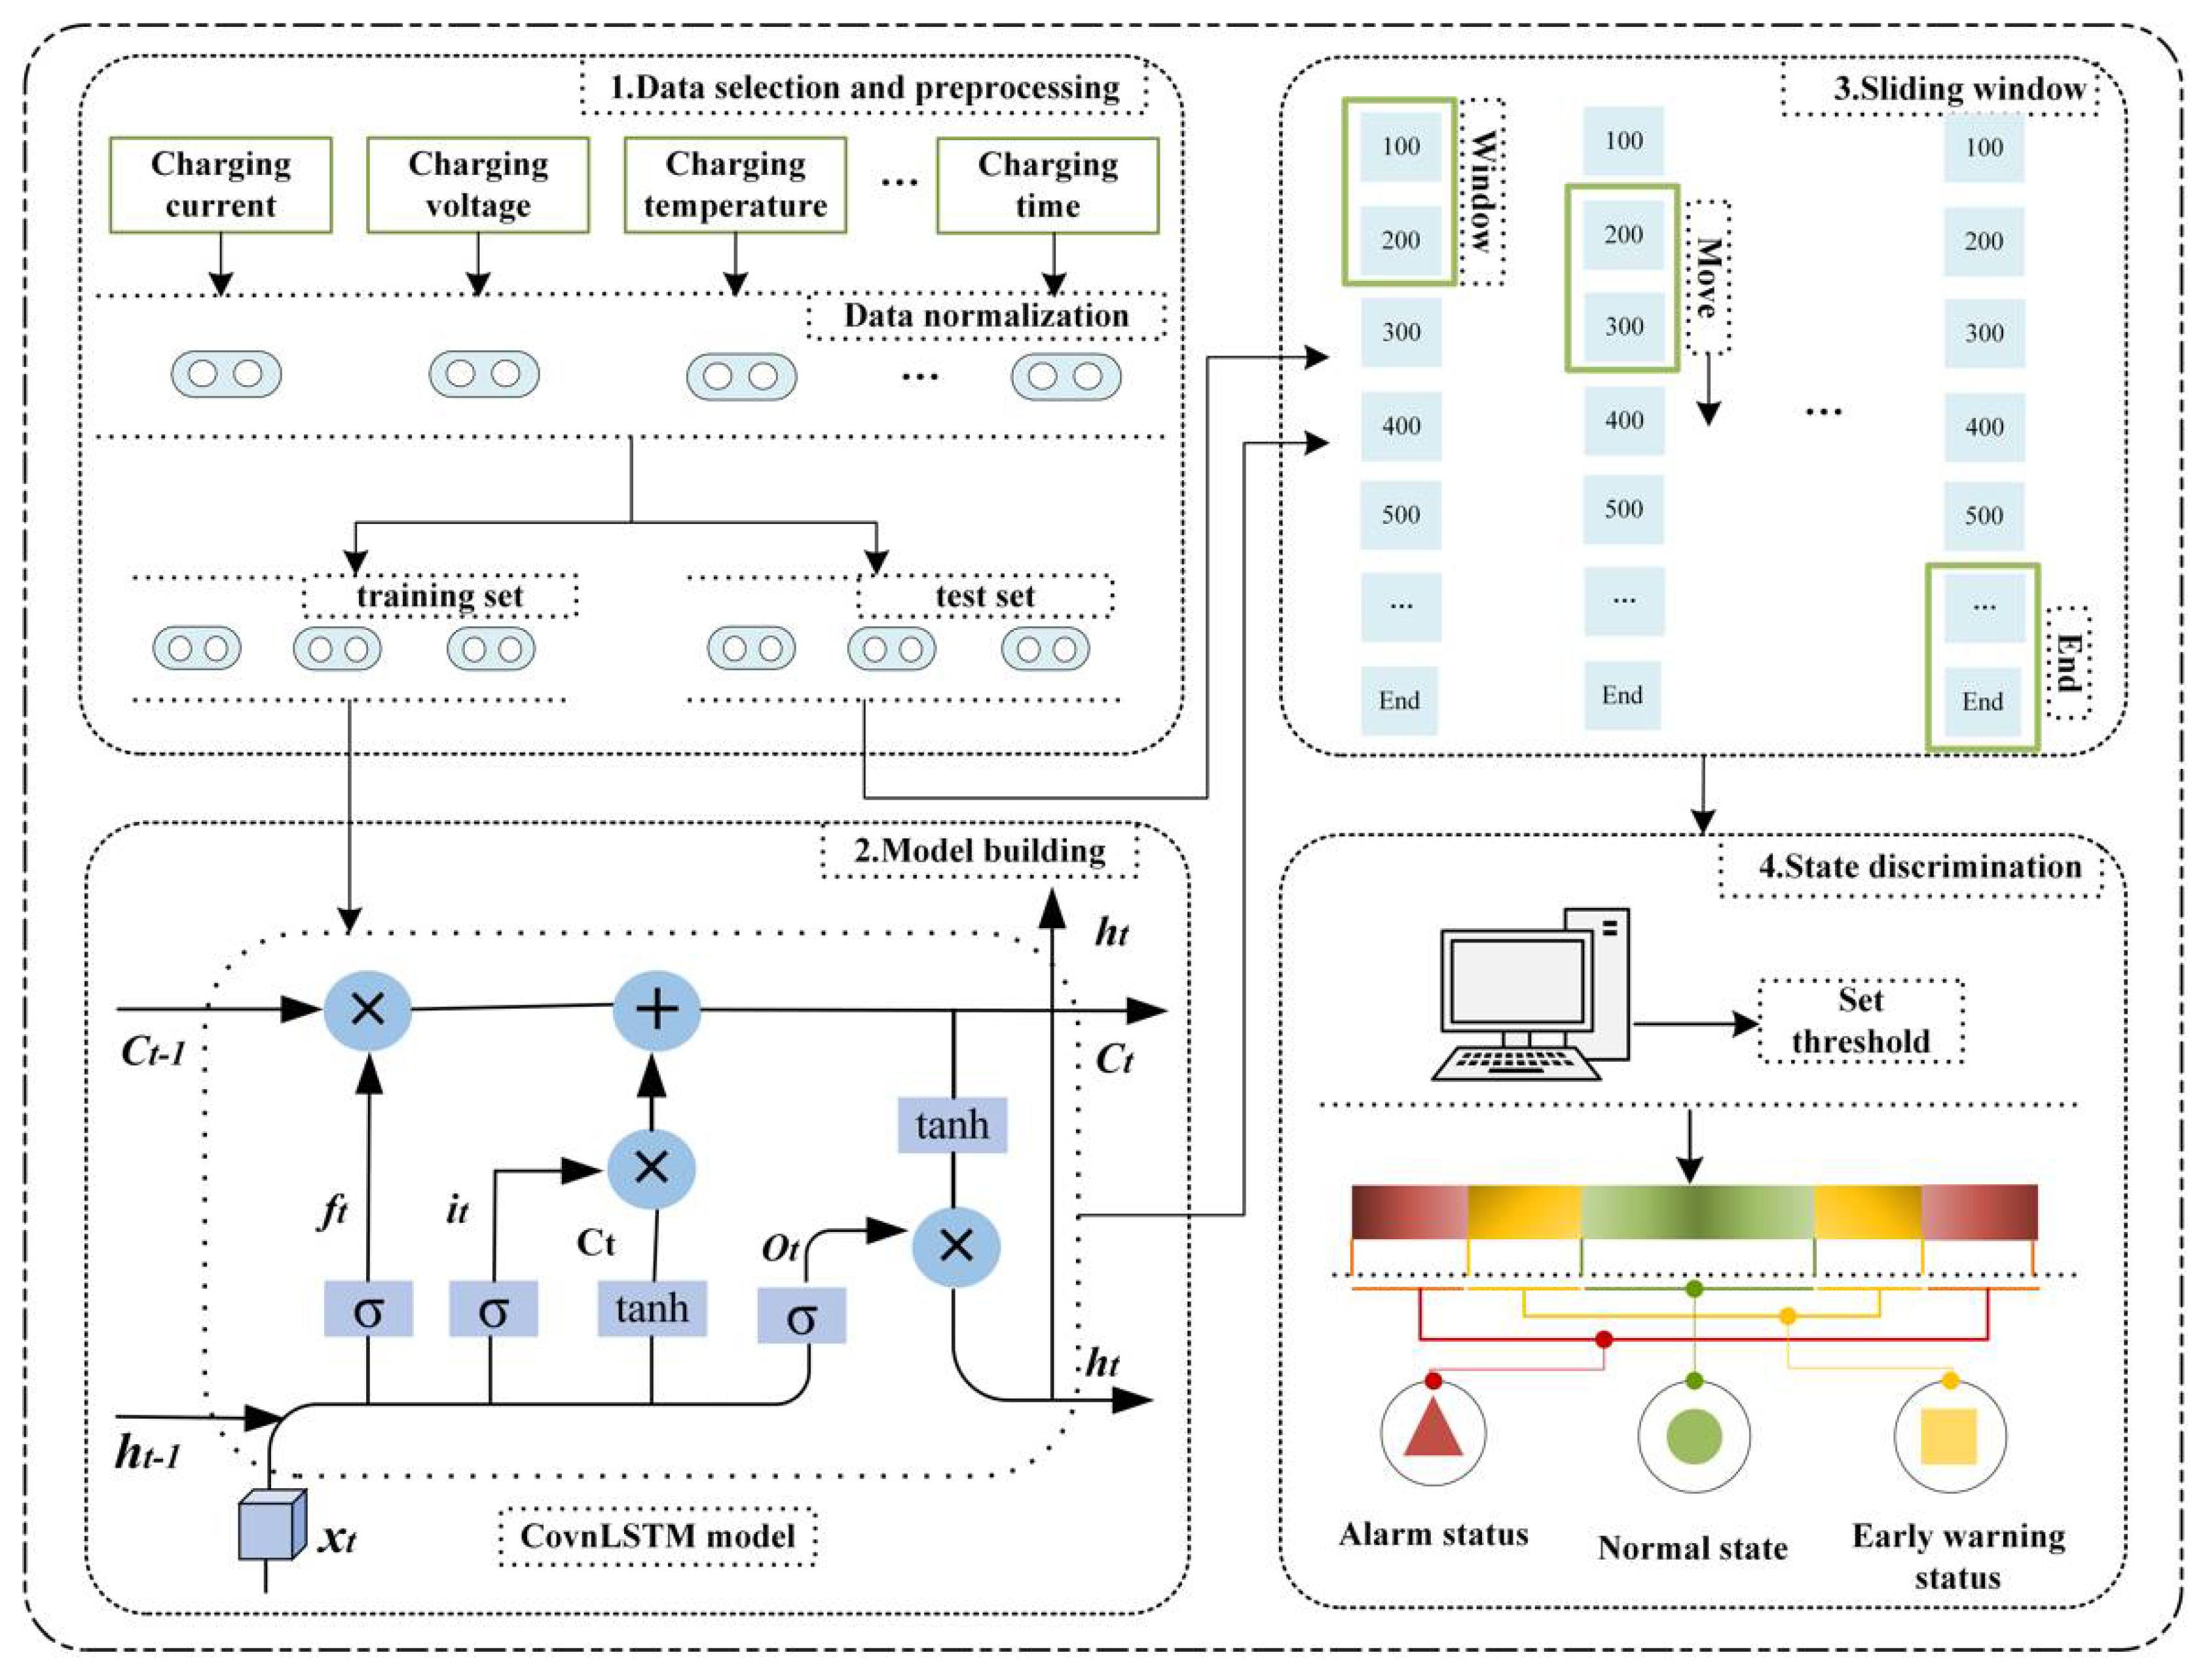
The early warning protection method of the EV charging process is divided into four modules: charging data selection and processing, model building, sliding window, and state discrimination.
- (1)
- Data selection and preprocessing: The charging data such as charging voltage, charging current, charging temperature, and charging time of the EV are transmitted to the charging pile through the CAN bus, and the charging pile transmits it to the backstage database. The backstage platform normalizes the charging data. The structure is shown in the data selection and preprocessing part of Figure 2.
 Figure 2. Diagram of safety pre-warning system for the electric vehicle charging.
Among them, the input features of the charging data are normalized and the data set is mapped between [−1, 1] in order to prevent errors caused by data variation and to improve the accuracy of the ConvLSTM model. The calculation formula is:
where represents the actual value of the EV at the moment of charging i; , represents the maximum and minimum values at time i before normalization; represents normalized output charge value.
- (2)
- Model construction: CNN is a neural network consisting of a convolutional layer, a pooling layer, and an output layer. It can share the weights of the convolutional kernel, reduce the free parameters, reduce the complexity of the network, and reduce overfitting, which has great advantages. It also has a powerful time series feature and extraction capability. Its calculation formula is:
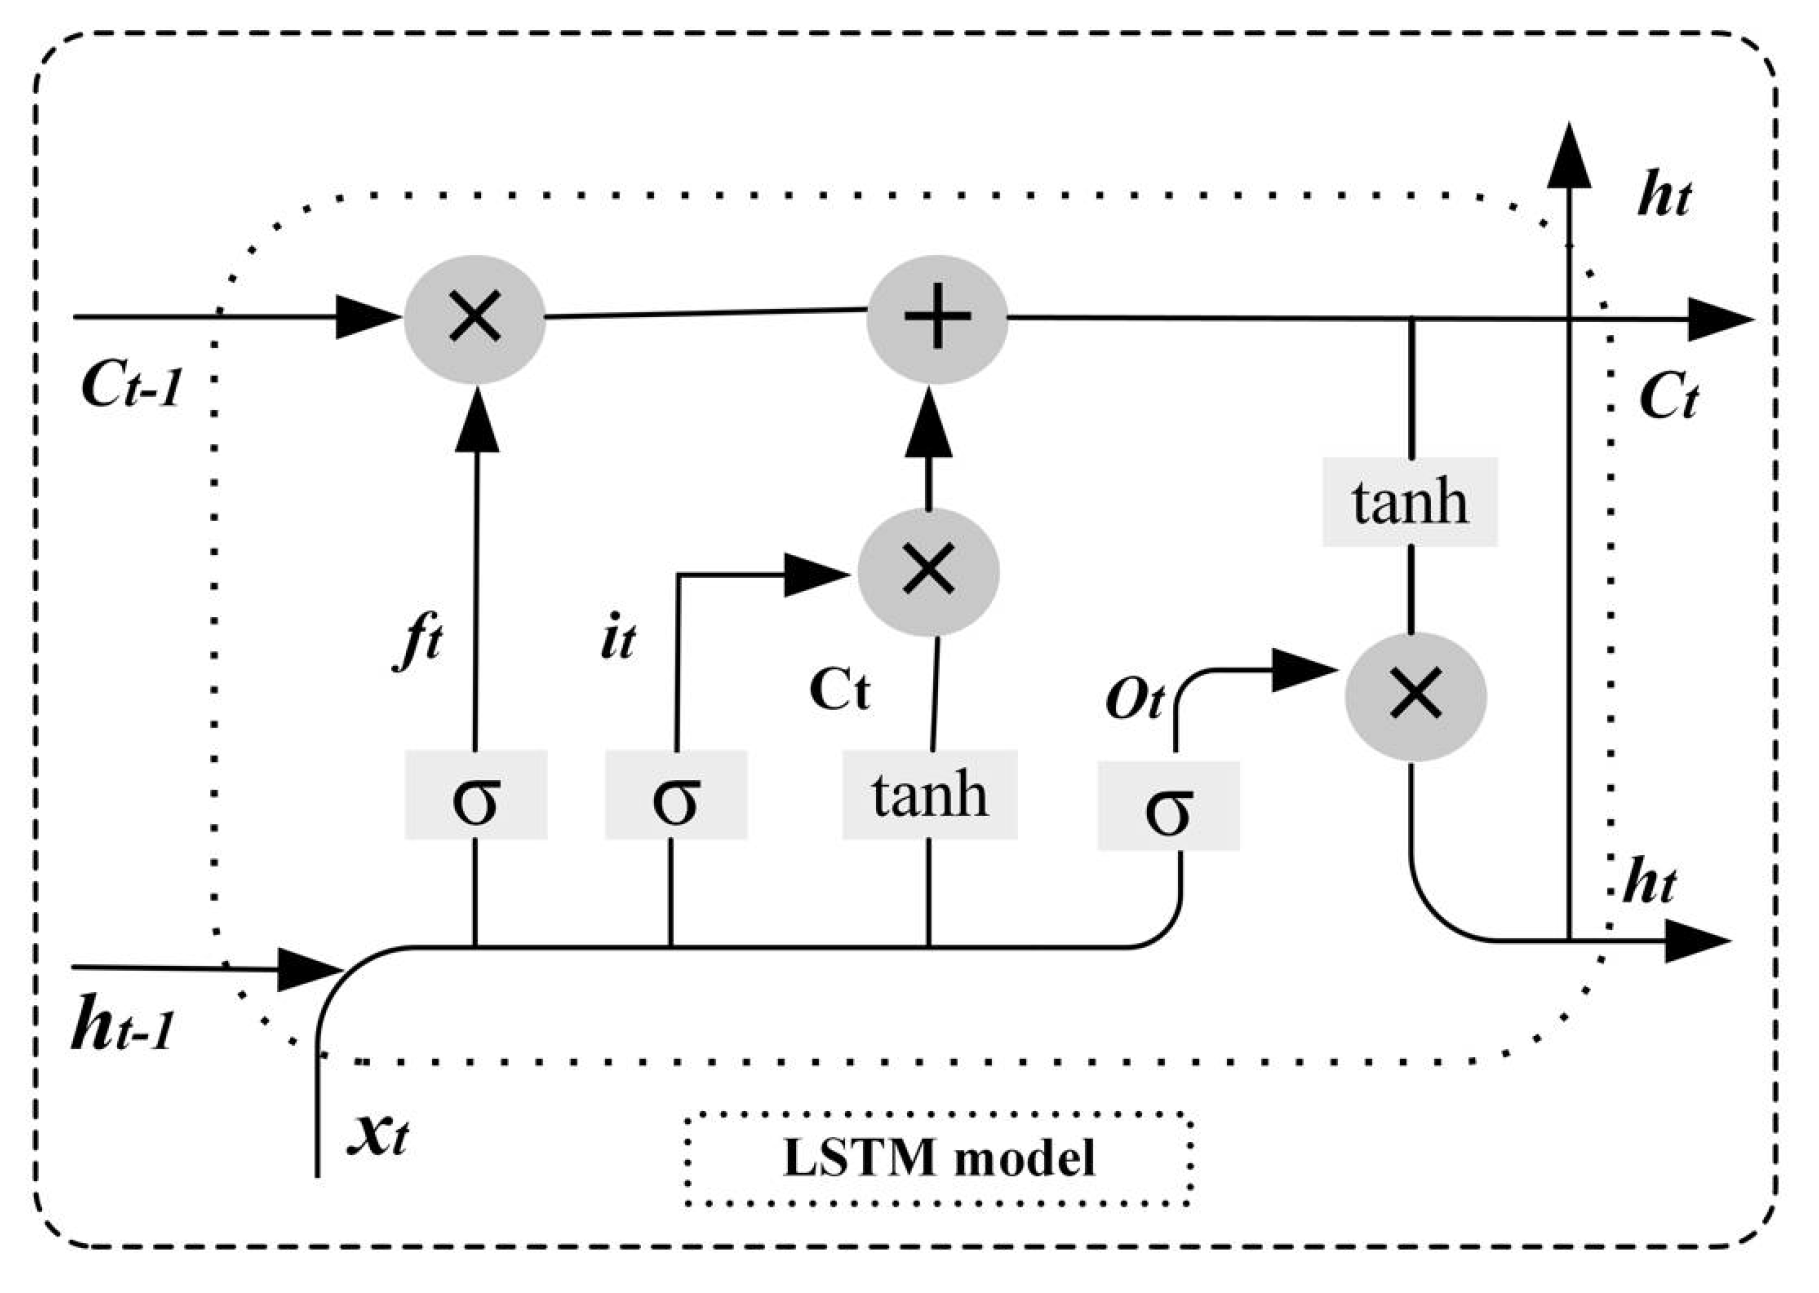
The LSTM network consists of three main gate structures, i.e., the input gate, the output gate, and the forget gate. These three gates and activation function work together to filter information from historical data, retain useful information, and discard useless information. It has a strong learning ability. The structure is shown in the model building part of Figure 3. Its calculation formula is:
where , and represent the forget gate, the input gate, and the output gate, respectively; represents the input data at t time step; represents the status of the memory cell at t time step; represents the output data at the previous time step; represents the sigmoid function; is the activation function; represents the weight matrices; and represents the bias vectors.
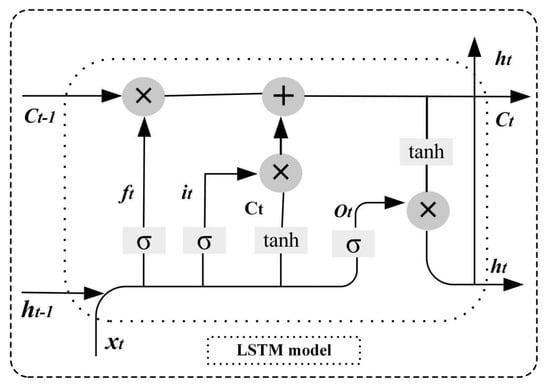
Figure 3.
The structure of LSTM model.
The ConvLSTM uses CNN as part of the input of LSTM, different from the LSTM, the ConvLSTM uses convolutional operations, and the model is better able to extract deeper features of EV charging data. The structure is shown in the model building part of Figure 2. The updated formula is:
where represents the convolution operations and represents the multiplication of the corresponding elements of the matrix, known as the Hadamard product.
- (3)
- Sliding window: Using the sliding window analysis method, a sliding window of length N is specified, and the data is processed through it. After the window slides forward one point, the predicted value is added to this window to generate a new window of the same sequence length. This process is repeated until the window is covered by the true value. Through the obtained several continuous sub-time series data, the prediction residual is continuously processed and analyzed to eliminate the influence of wrong charging data on the residual change during the transmission process, thereby avoiding false alarms effectively. The structure is shown in the Sliding window part of Figure 2.
When the width of the sliding window is N, the calculation formulas of the mean and standard deviation of the residuals under this window are:
where indicates the mean value of the residual of the charging temperature; is the standard deviation of the residual of the charging temperature; denotes the residual of the ith sampling point in the sliding window.
- (4)
- Status discrimination: The structure is shown in the status discrimination part of Figure 2. Using the sliding window to analyze and process the residual of the normal charging data and set the appropriate warning threshold. The formula for calculating the early warning threshold is:
The formula for calculating the alarm threshold is:
where represents the alarm coefficient of the residual mean; represents the alarm coefficient of the residual standard deviation; and represents the upper and lower alarm limits of the residual mean, respectively; is the upper alarm limit of the residual standard deviation.
The specific EV charging status judgement criteria in this paper are shown in Table 4:
Table 4.
Criteria for judging the charging status of electric vehicles.
In Table 4, Tr represents the temperature residuals, XE1 represents the upper early warning limits of the residual mean, XE2 represents the lower early warning limits of the residual mean, SE is the upper early warning limit of the residual standard deviation, XW1 represents the upper alarm limits of the residual mean, XW2 represents the lower alarm limits of the residual mean, SW is the upper alarm limit of the residual standard deviation. The criteria set in this paper are that when the temperature residual Tr is above the upper limit of SE and at the same time above XE1 or below XE2, the state is judged to be an early warning state; and when Tr exceeds any of the set alarm values, the state is judged to be an alarm state.
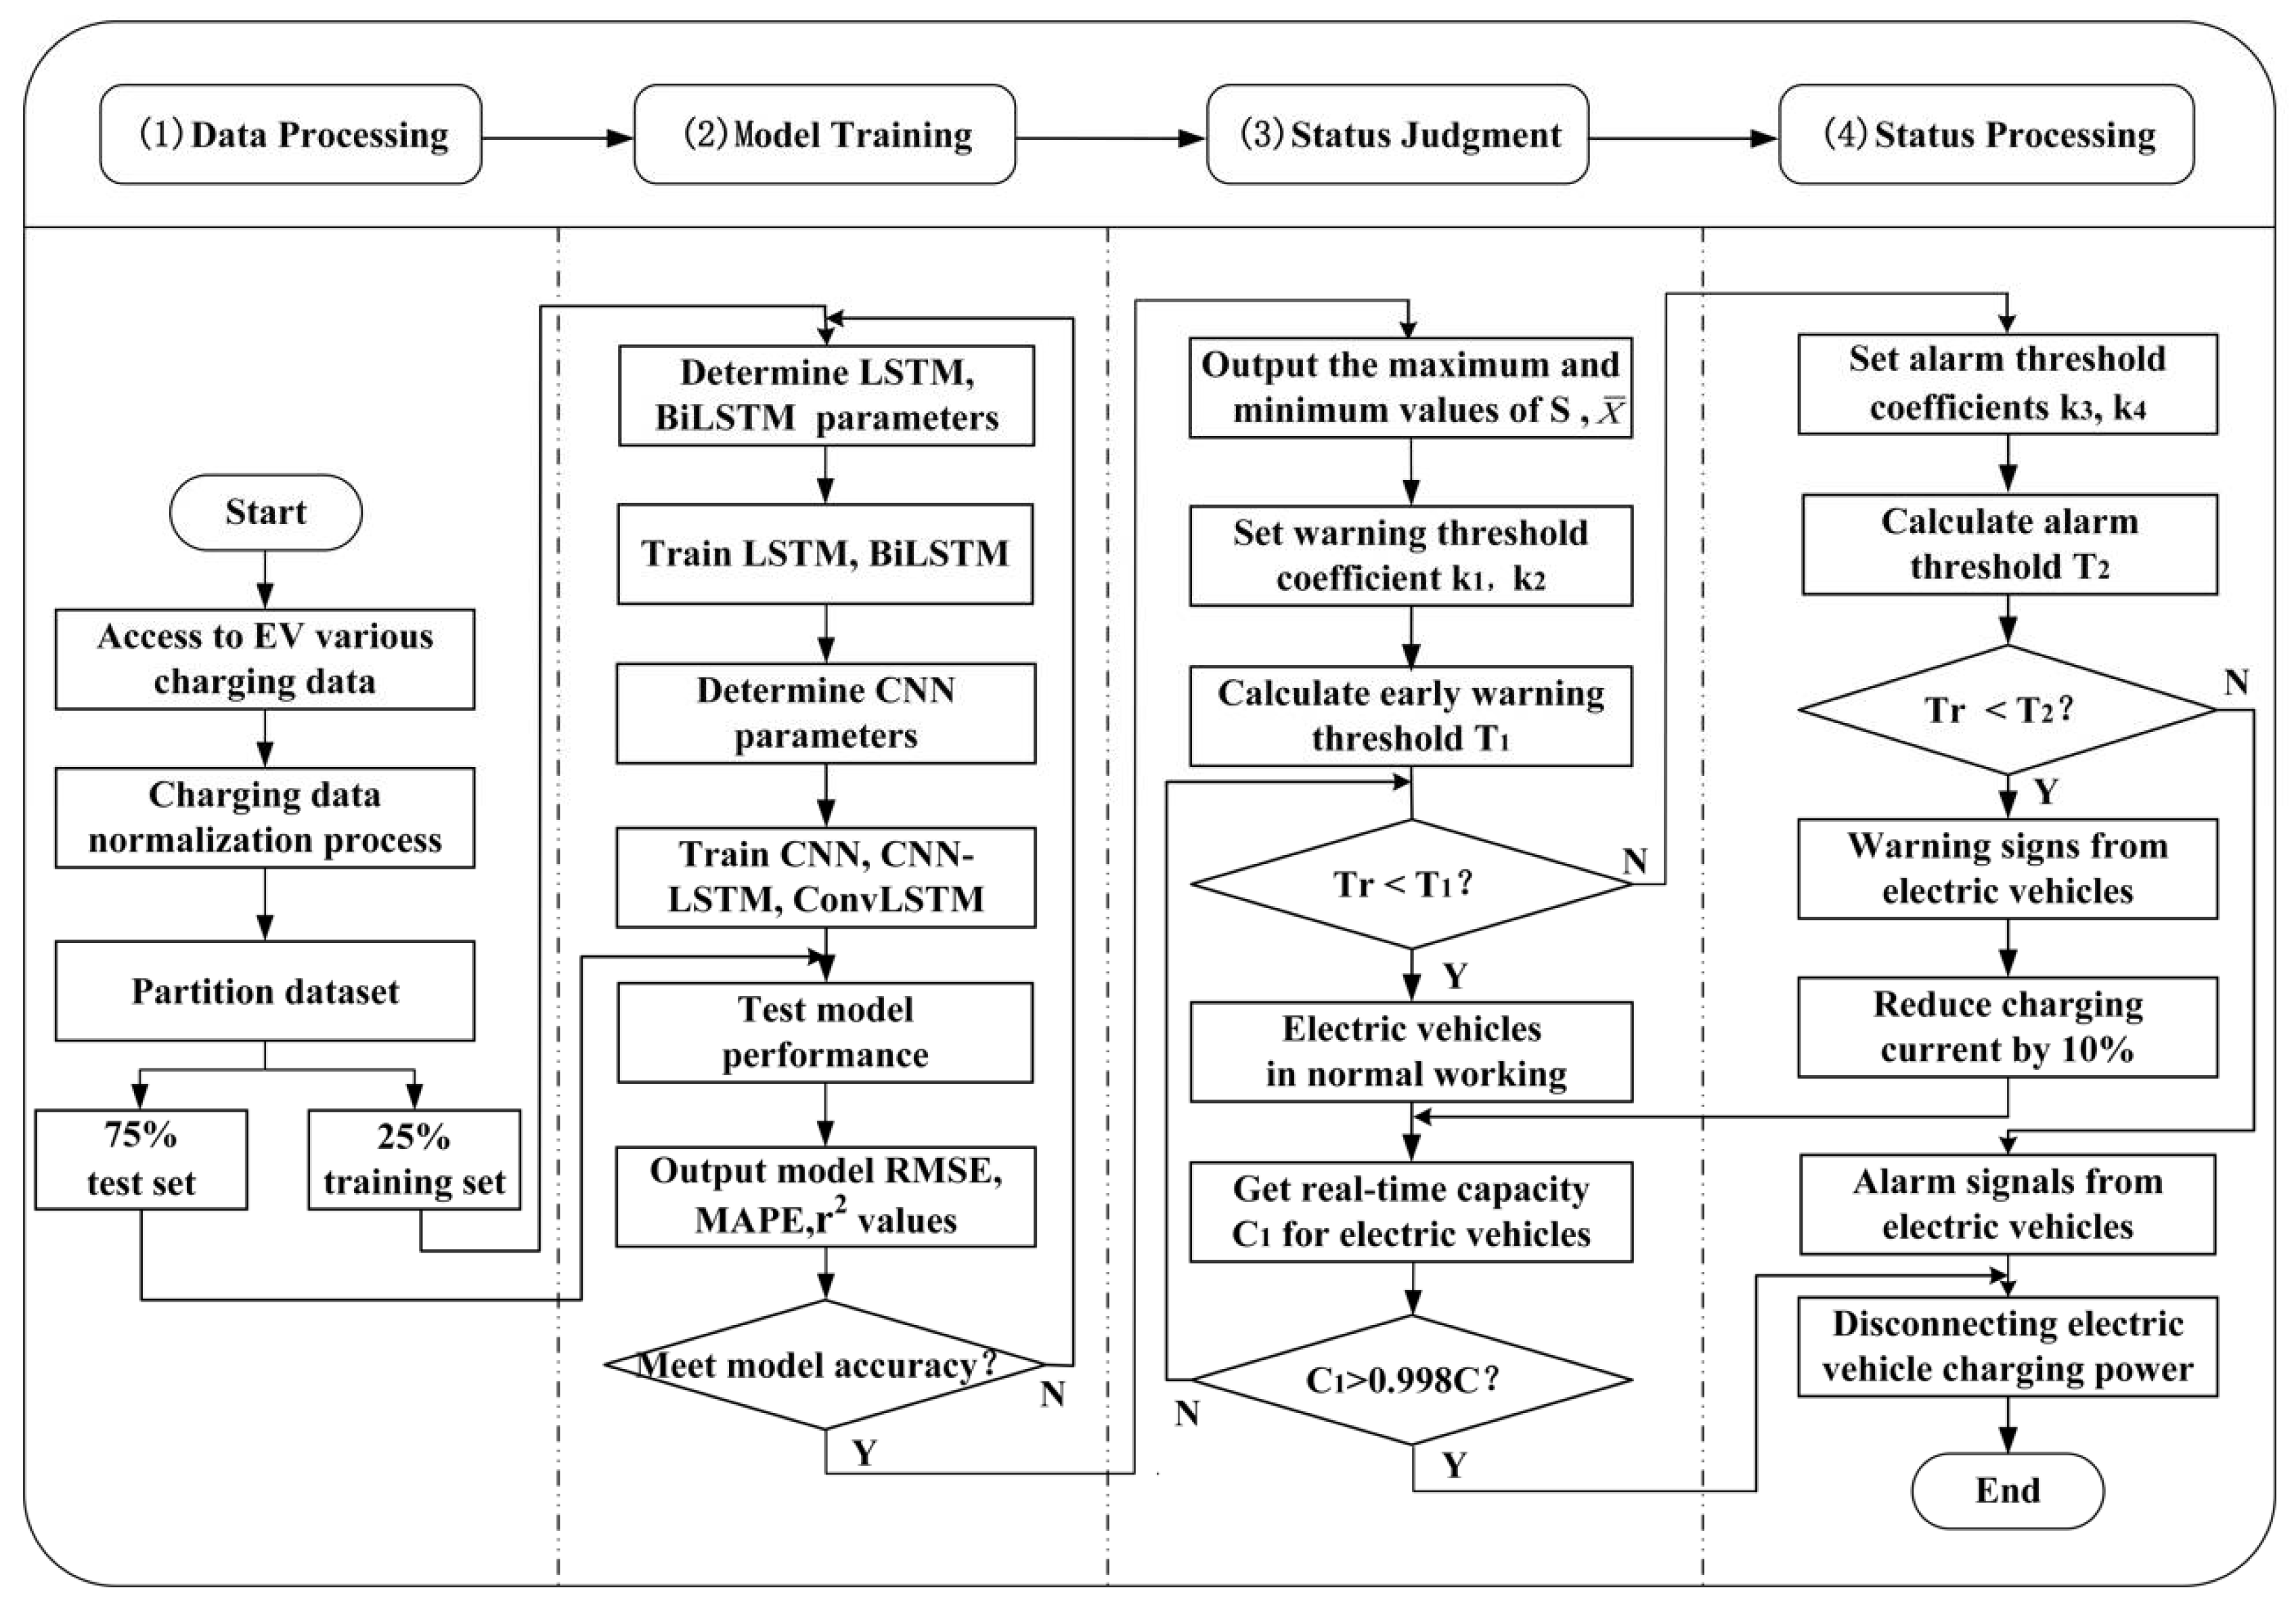
3.2. Introduction to the Early Warning Hybrid Model Process
The safety monitoring of EV charging systems needs to be realized by enhancing the dynamic monitoring and real-time early warning of EV charging equipment. The early warning hybrid model constructed by the ConvLSTM method can predict the potential risks during the battery charging process, so it can well guarantee the safety of the EV during the charging process. The security early warning process is mainly divided into four stages: Data Processing, Model Training, Status Judgment, and Status Processing. The flow chart is shown in Figure 4.
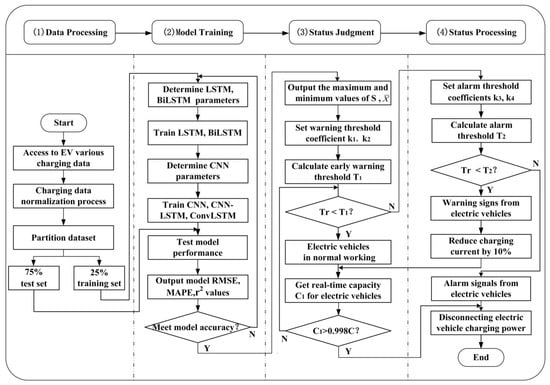
Figure 4.
Safe pre-warning flow chart for the electric vehicle charging.
The specific implementation process is as follows:
- (a)
- Data Processing: Collect the front end EV charging data and transmit it to the backstage database. Filter the charging data with reference significance, normalize and preprocess it, then divide the data set into a 25% training set and a 75% test set.
- (b)
- Model Training: Use training set to determine LSTM and BiLSTM model parameters, train the corresponding model and output its evaluation standard values; determine CNN model parameters, train CNN, CNN-LSTM, and ConvLSTM models and output their evaluation standard values. If the model meets the model accuracy requirements, enter the next stage to set the EV temperature warning threshold; if not, return to retrain the corresponding model.
- (c)
- Status Judgment: Set the EV temperature early warning and alarm thresholds. If its temperature is within the early warning threshold, this state indicates that the EV is charged normally and is the most ideal charging state. If its temperature is greater than the early warning threshold and less than the alarm threshold, the EV is in an early warning state at this time. If its temperature is greater than the alarm threshold, the EV is in an alarm state at this time.
- (d)
- Status Processing: If the EV is in a normal charging state, no processing is required; if the EV is in an early warning charging state, the charging current will be reduced by 10% after an early warning signal is issued. If the EV is in an alarming state, the alarm signal will be issued, and then the charging power will be cut off to stop charging.
The whole process of judging can obtain the real-time capacity of the EV battery. If the real-time capacity is greater than 99.8% of the rated capacity, the charging will be stopped. The system is in high-speed closed-loop operation, which can complete the safety early warning task in time.
In Figure 4, is the residual mean, is the decision factor, is the rated capacity, is the early warning thresholds, is the alarm thresholds, is the residual standard deviation, is the real-time capacity, RMSE is the Root-Mean-Square Error, MAPE is the Mean Absolute Percentage Error, is charging temperature residuals, and are early warning threshold factors, and is the alarm threshold factor.
4. Experimental Verification and Analysis
4.1. Data Selection
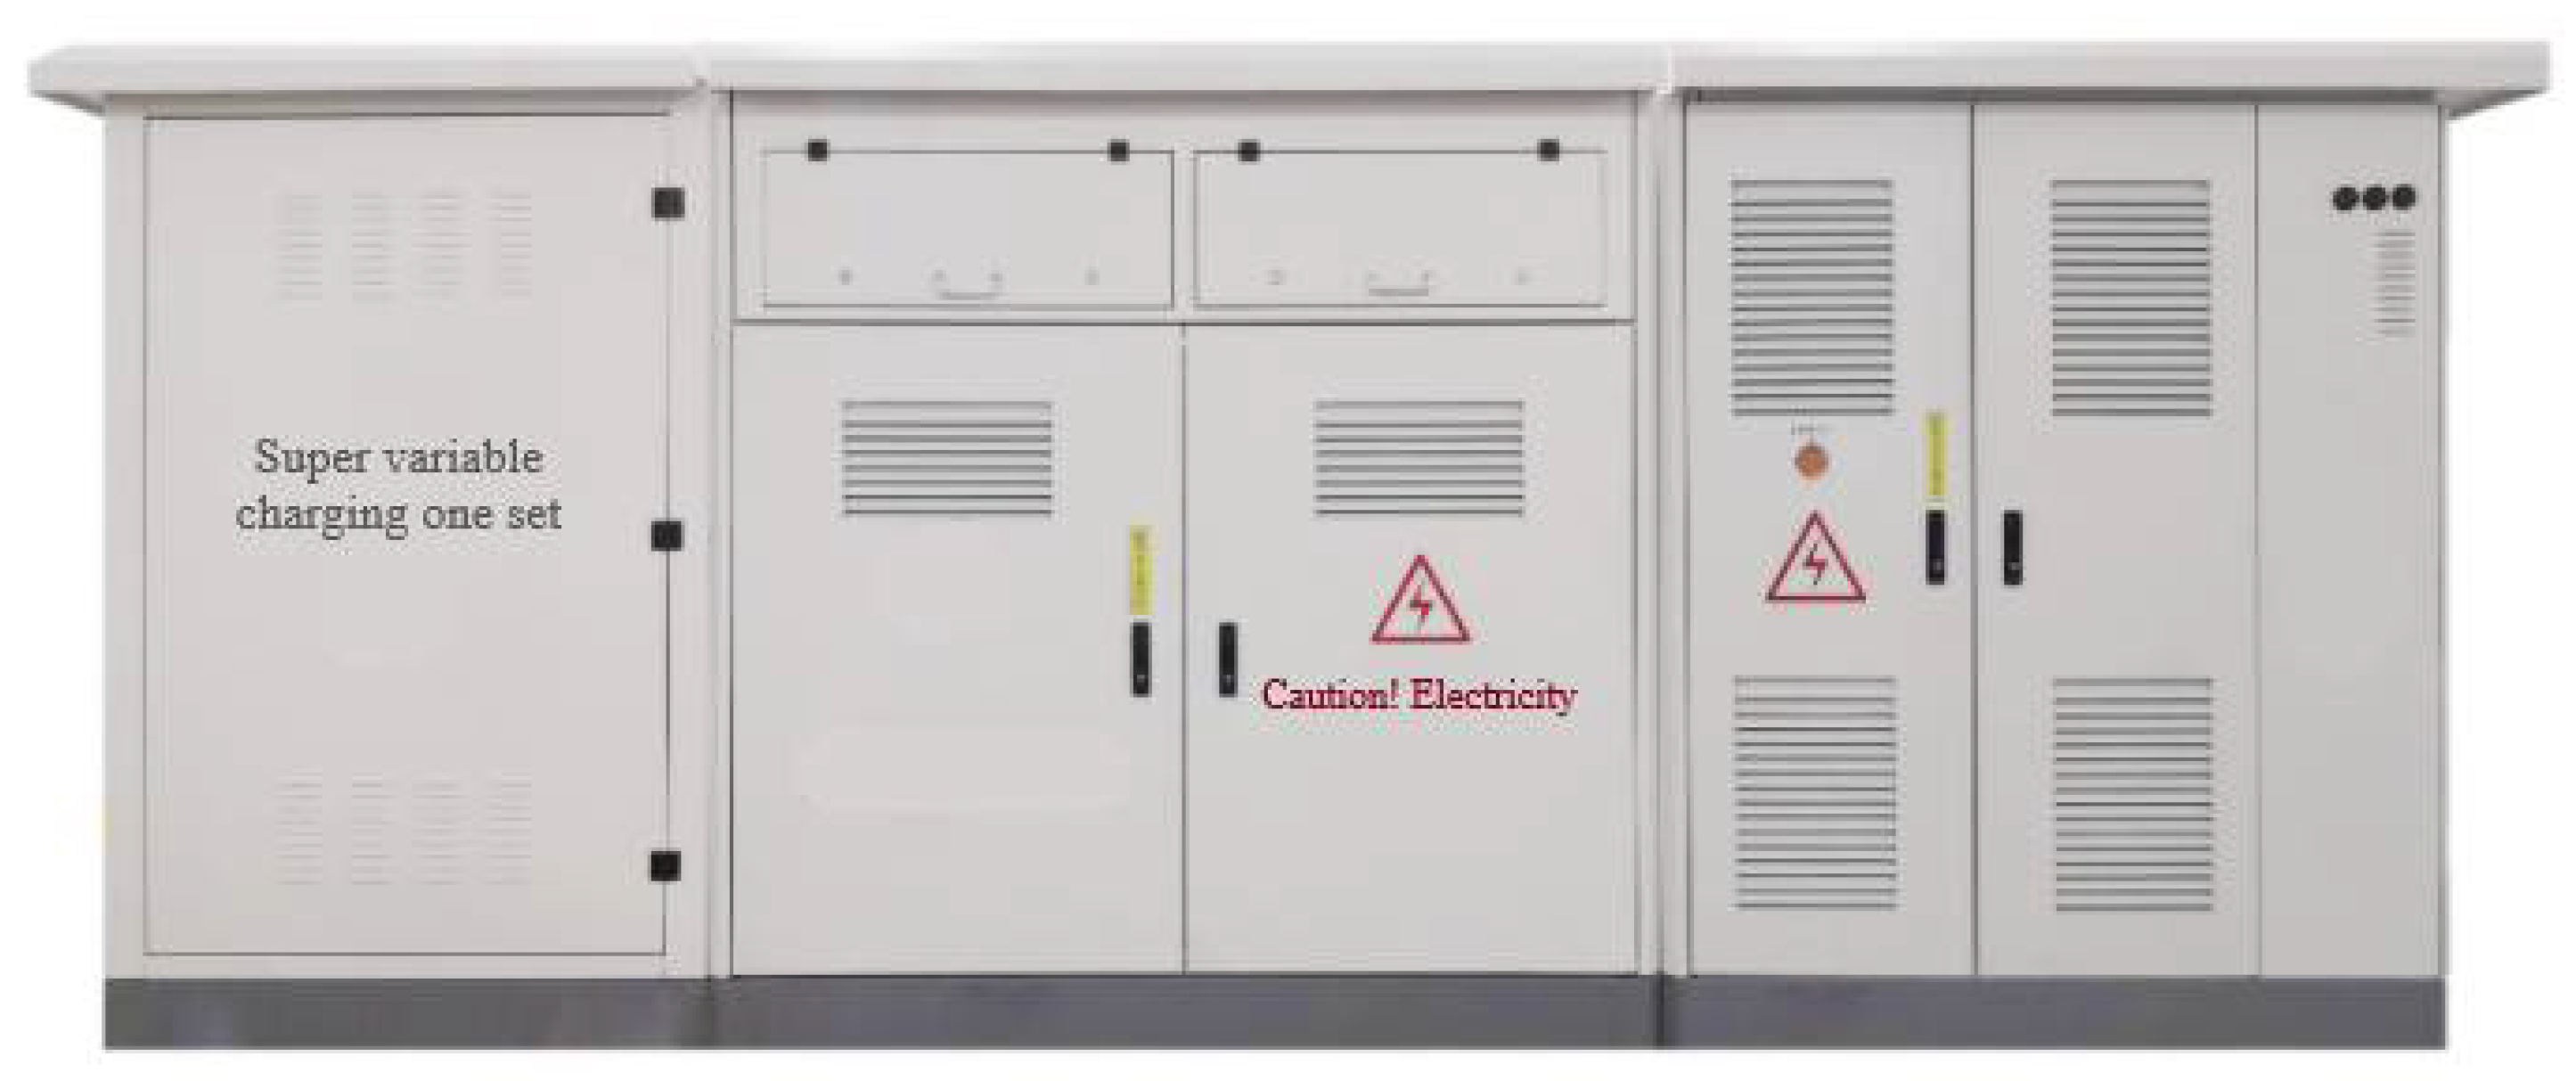
This paper collects EV charging data through actual charging stations. The following is the introduction of the charging station: it adopts high-power IGBT type charging device, adopts IGBT super charging group technology, and has an output voltage range of 50~800 V, with high integration, high efficiency, low power consumption and high reliability, as shown in the Figure 5.
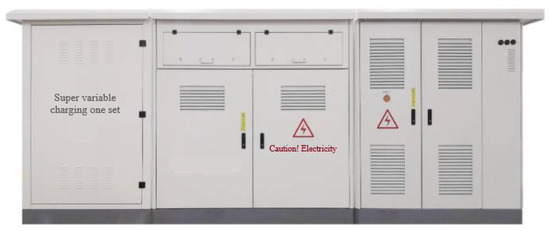
Figure 5.
High-power IGBT type charging equipment.
In order to obtain reliable continuous charging data in the training model, after normalizing the actual charging data, the battery module in the Simulink library of Matlab R2020a software is used to simulate the battery model of the EV. The main parameters of the model are shown in Table 5:
Table 5.
Parameters of simulated electric vehicle.
The EV adopts the high-power DC constant current and constant voltage charging method. On the charging side, based on the national standard communication standard GB/T 27930, the charging data of the interaction between the charging equipment and the EV BMS is dynamically collected and the transmission speed is 250 ms/sampling sites. After collecting the charging data, Simulink is used to simulate the model. Finally, the simulation data of 69,300 sampling sites are obtained.
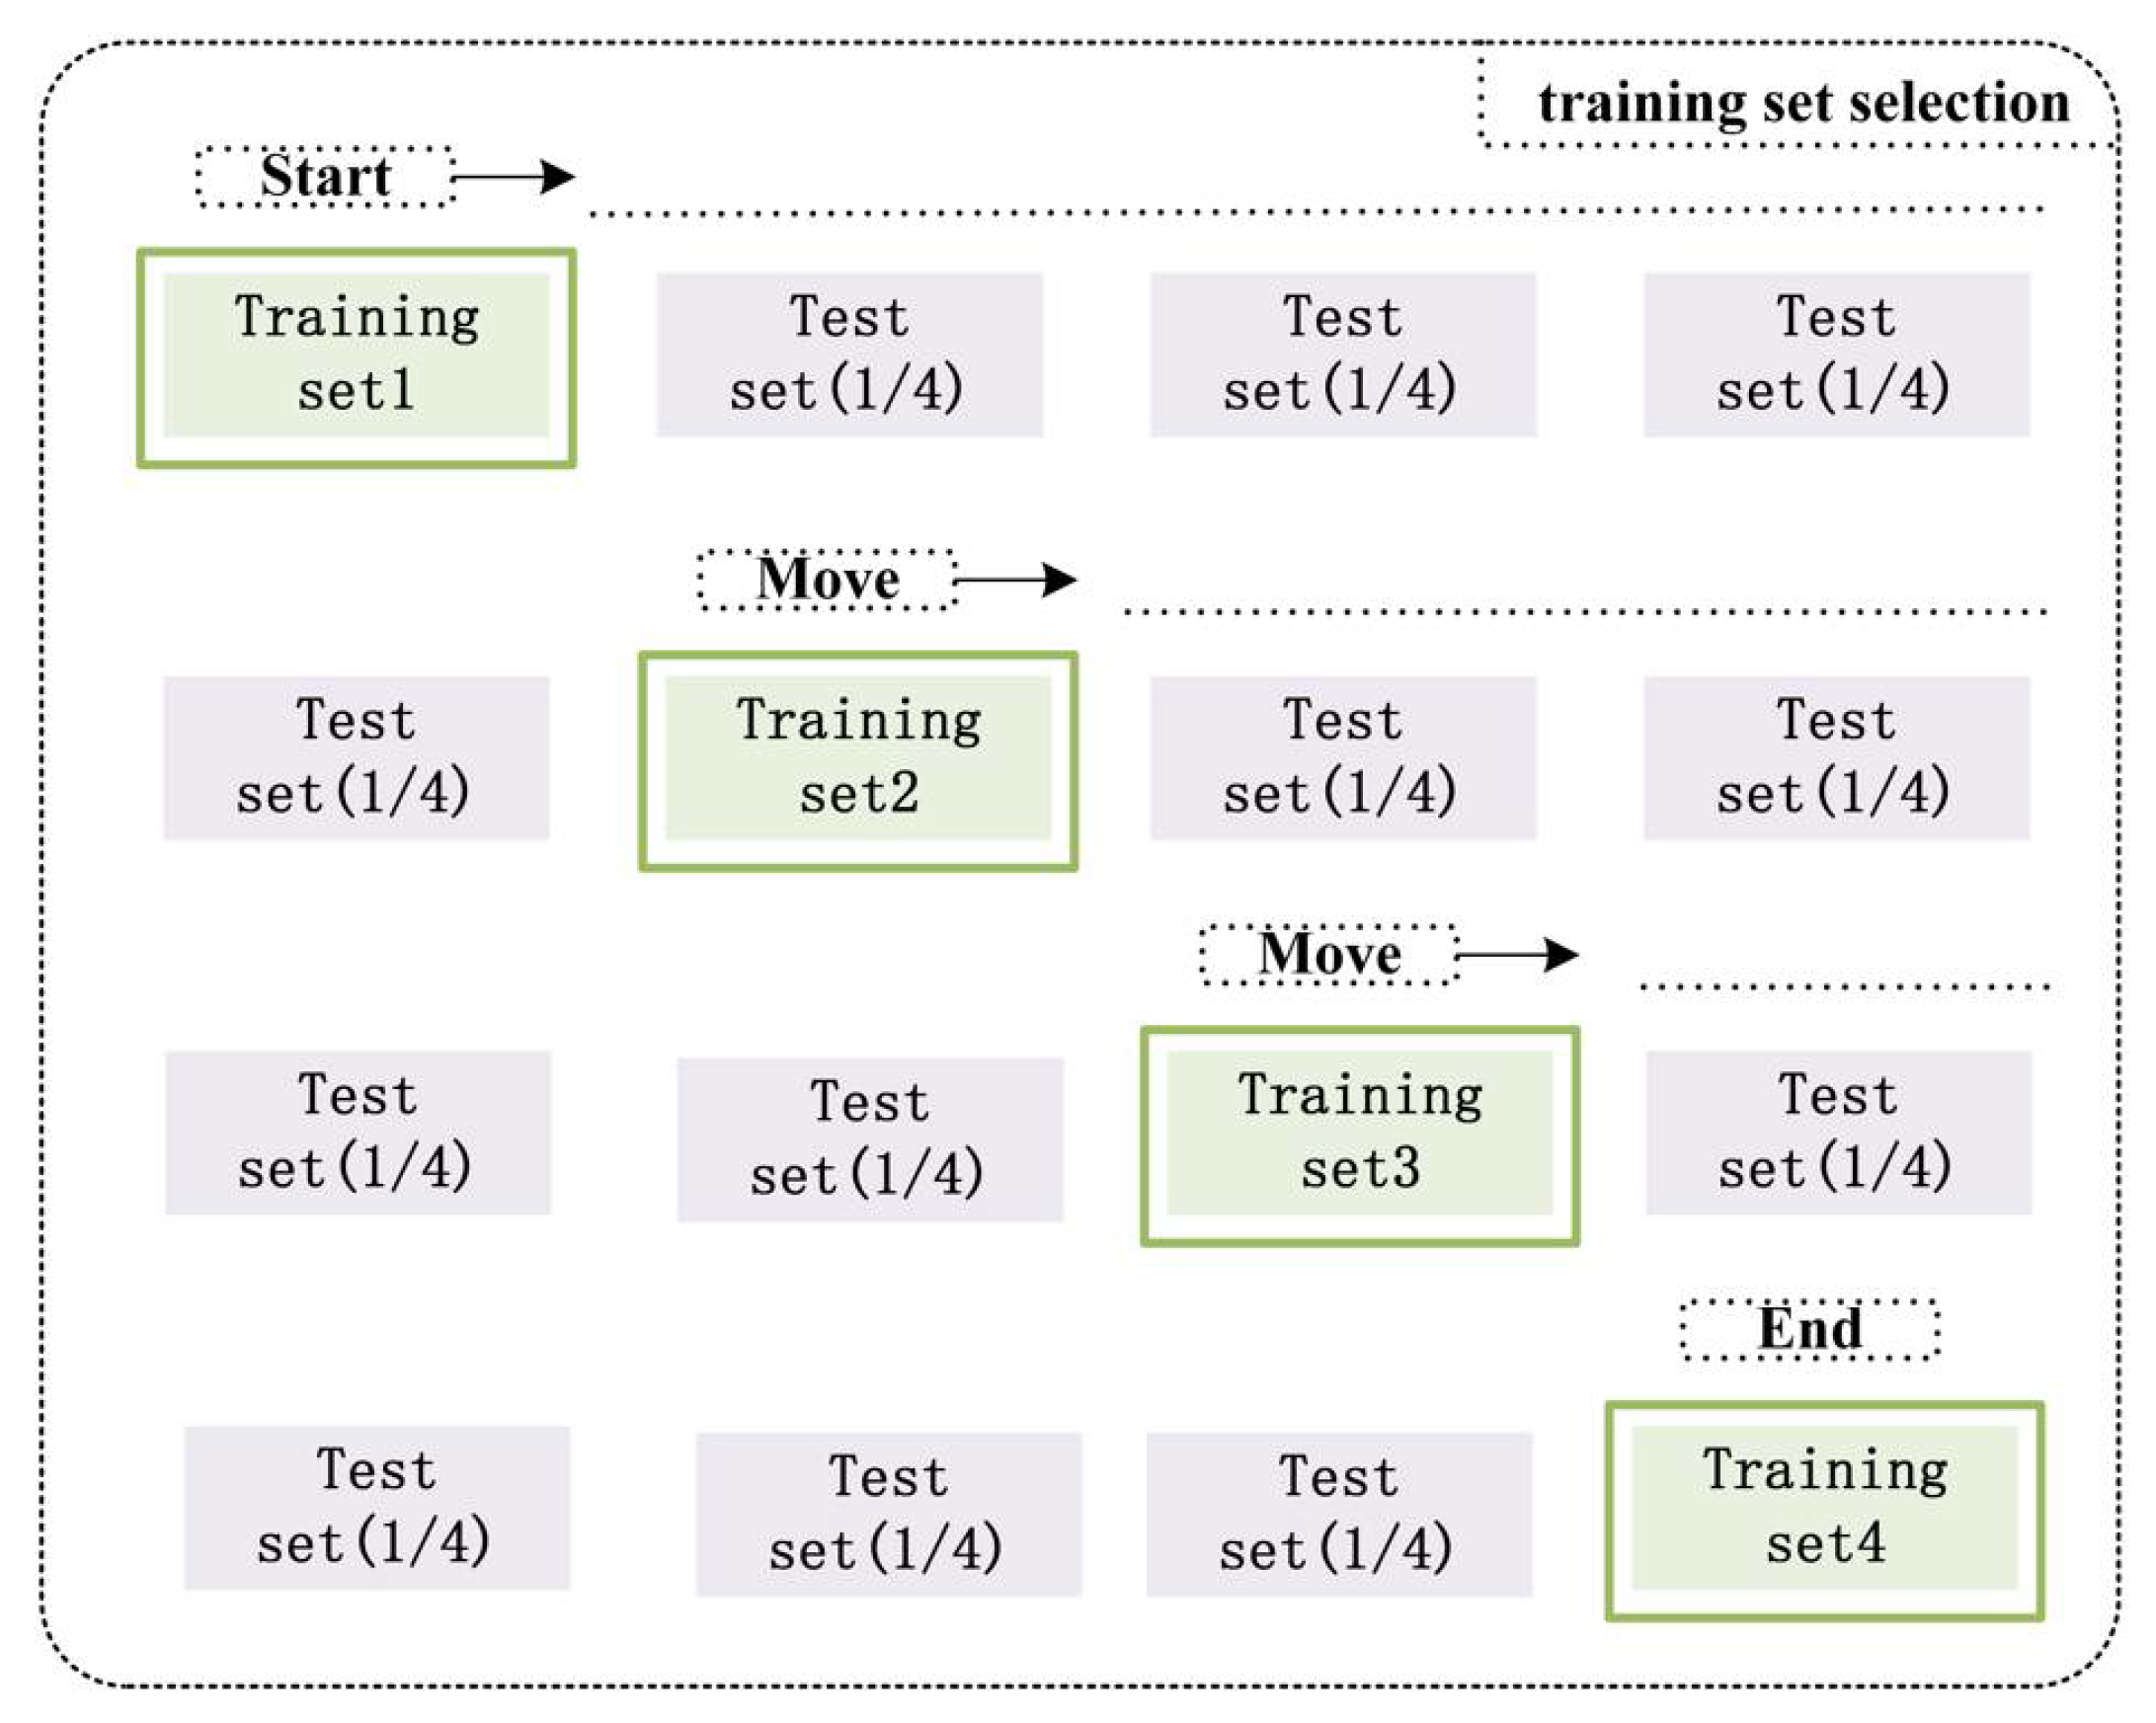
To verify the effectiveness of the proposed method in predicting the charging temperature of EV batteries, the dataset was divided into a 25% training set and a 75% test set, and different parts of the dataset were used in turn to train the model in different iterations, with the training set selected as shown in Figure 6:
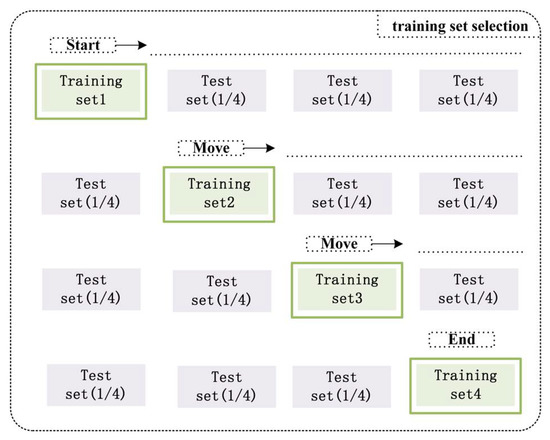
Figure 6.
Diagram of training set selected.
4.2. Model Construction and Evaluation Criteria
The simulation results for this part are performed in Python 3.8 and the Keras library. All model training runs on Windows 10 operating system, Intel® Core™ i5-1035G1 CPU @ 1.00 GHz 1.19 GHz (Manufacturer: Portland, OR, USA) processor. The platform version is TensorFlow 2.4.1 and the program version is Python 3.8.1. The depth learning framework is Keras 2.4.3.
The model in this paper is mainly composed of CNN and LSTM, and the prediction performance is further improved by using CNN as the input of LSTM. The model parameters involved are shown in Table 6:
Table 6.
Specific parameters of ConvLSTM model.
In Table 6, SELU is the activation function of the CNN model, and its main role is to map the input of the neuron to the output. Tanh is the activation function of the Loop layer of the LSTM model, and its role is to increase the nonlinearity of the neural network model. Adam acts as an optimizer for the LSTM, where a learning rate is maintained in each network circle and adaptively adjusted as the learning unfolds.
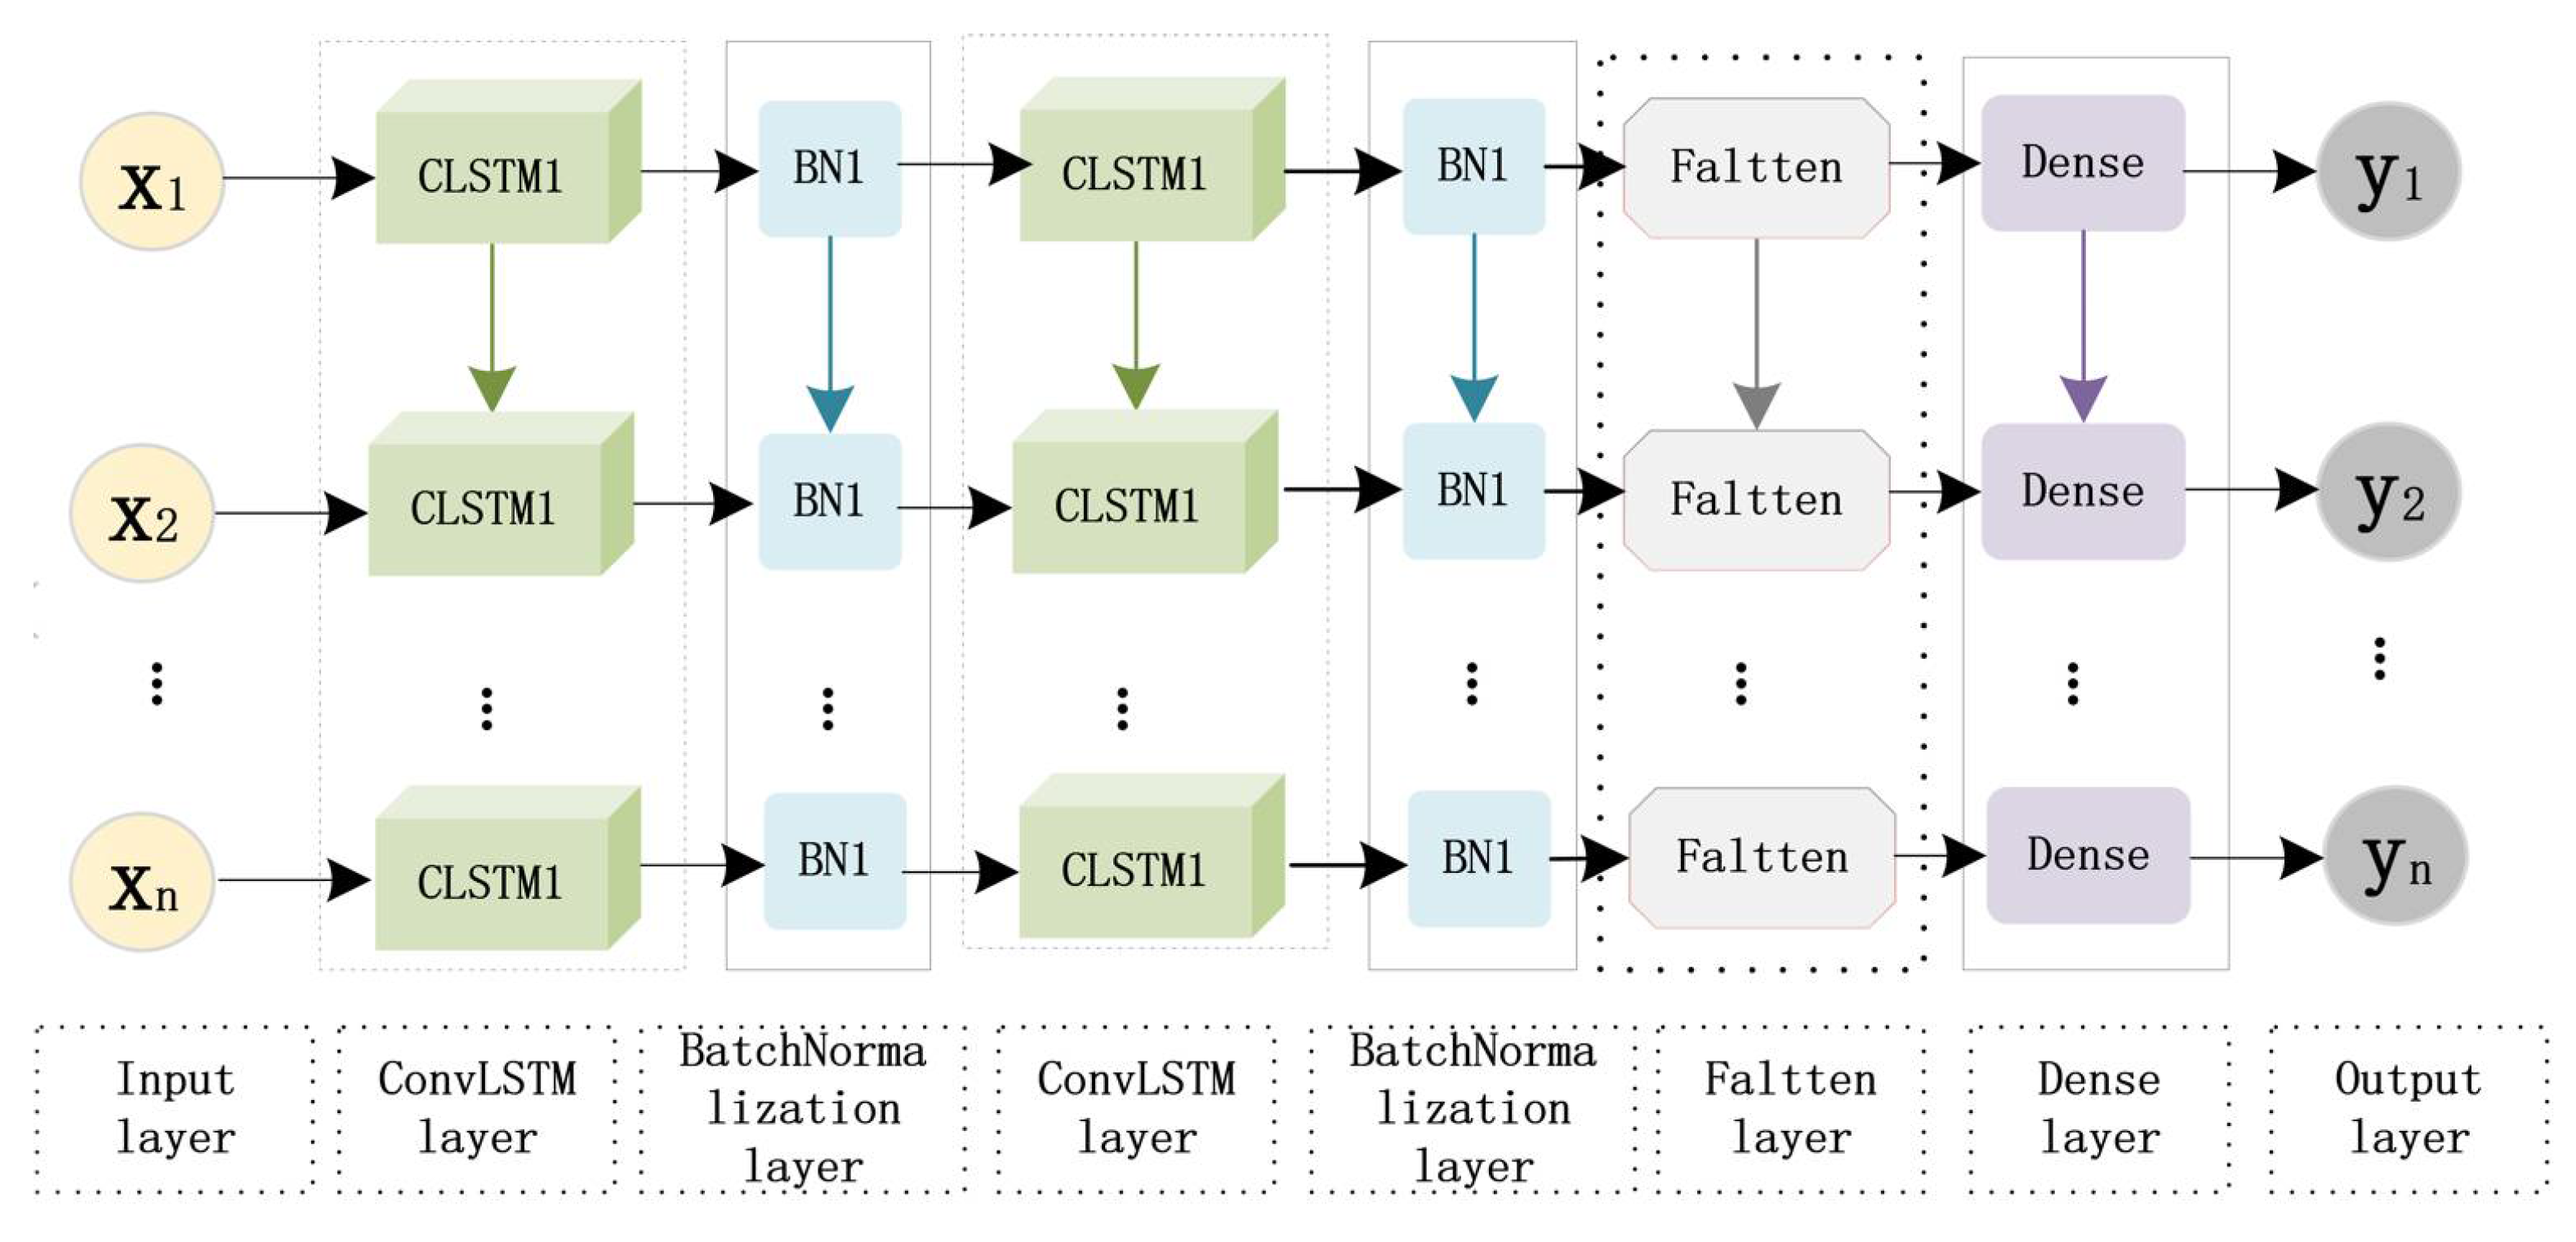
The internal structure of the model is shown in Figure 7, which consists of the ConvLSTM layer, Batch Normalization layer, Flatten layer, and Dense layer. Firstly, a Batch Normalization layer is added to speed up the convergence and prevent the gradient explosion. Secondly, deep data features are extracted by overlaying two ConvLSTM cells; then the array is flattened with the Flatten layer. Finally, a Dense layer is used to extract the correlation between the features after the nonlinear variation and map them to the output space.

Figure 7.
Diagram of the internal structure for the model.
The evaluation criteria in this research uses three common metrics for neural network regression prediction models: Root-Mean-Square Error (RMSE), Mean Absolute Percentage Error (MAPE), and R Squared (r2) to verify the accuracy of the prediction model. Its calculation formula is:
where represents the actual measured value of the charging temperature; represents the predicted value corresponding to the charging temperature; represents the average value of the output charging temperature. According to the above equation, the following conclusions can be drawn: The smaller the RMSE and MAPE while the larger the , the better the model fitting effect.
4.3. Analysis of Prediction Experiment Results
The complete experimental process of this paper is as follows: Firstly, the actual charging data is normalized, and the Simulink module is used to simulate the EV battery to obtain continuous simulated charging data. Secondly, on this basis, the training set and the test set are divided. Then, the training set with the worst prediction result is selected for temperature residual analysis, and the corresponding early warning and alarm thresholds are calculated. Finally, the fault charging data is used to verify the EV charging warning method proposed in this paper. The following are the specific experimental process and results:
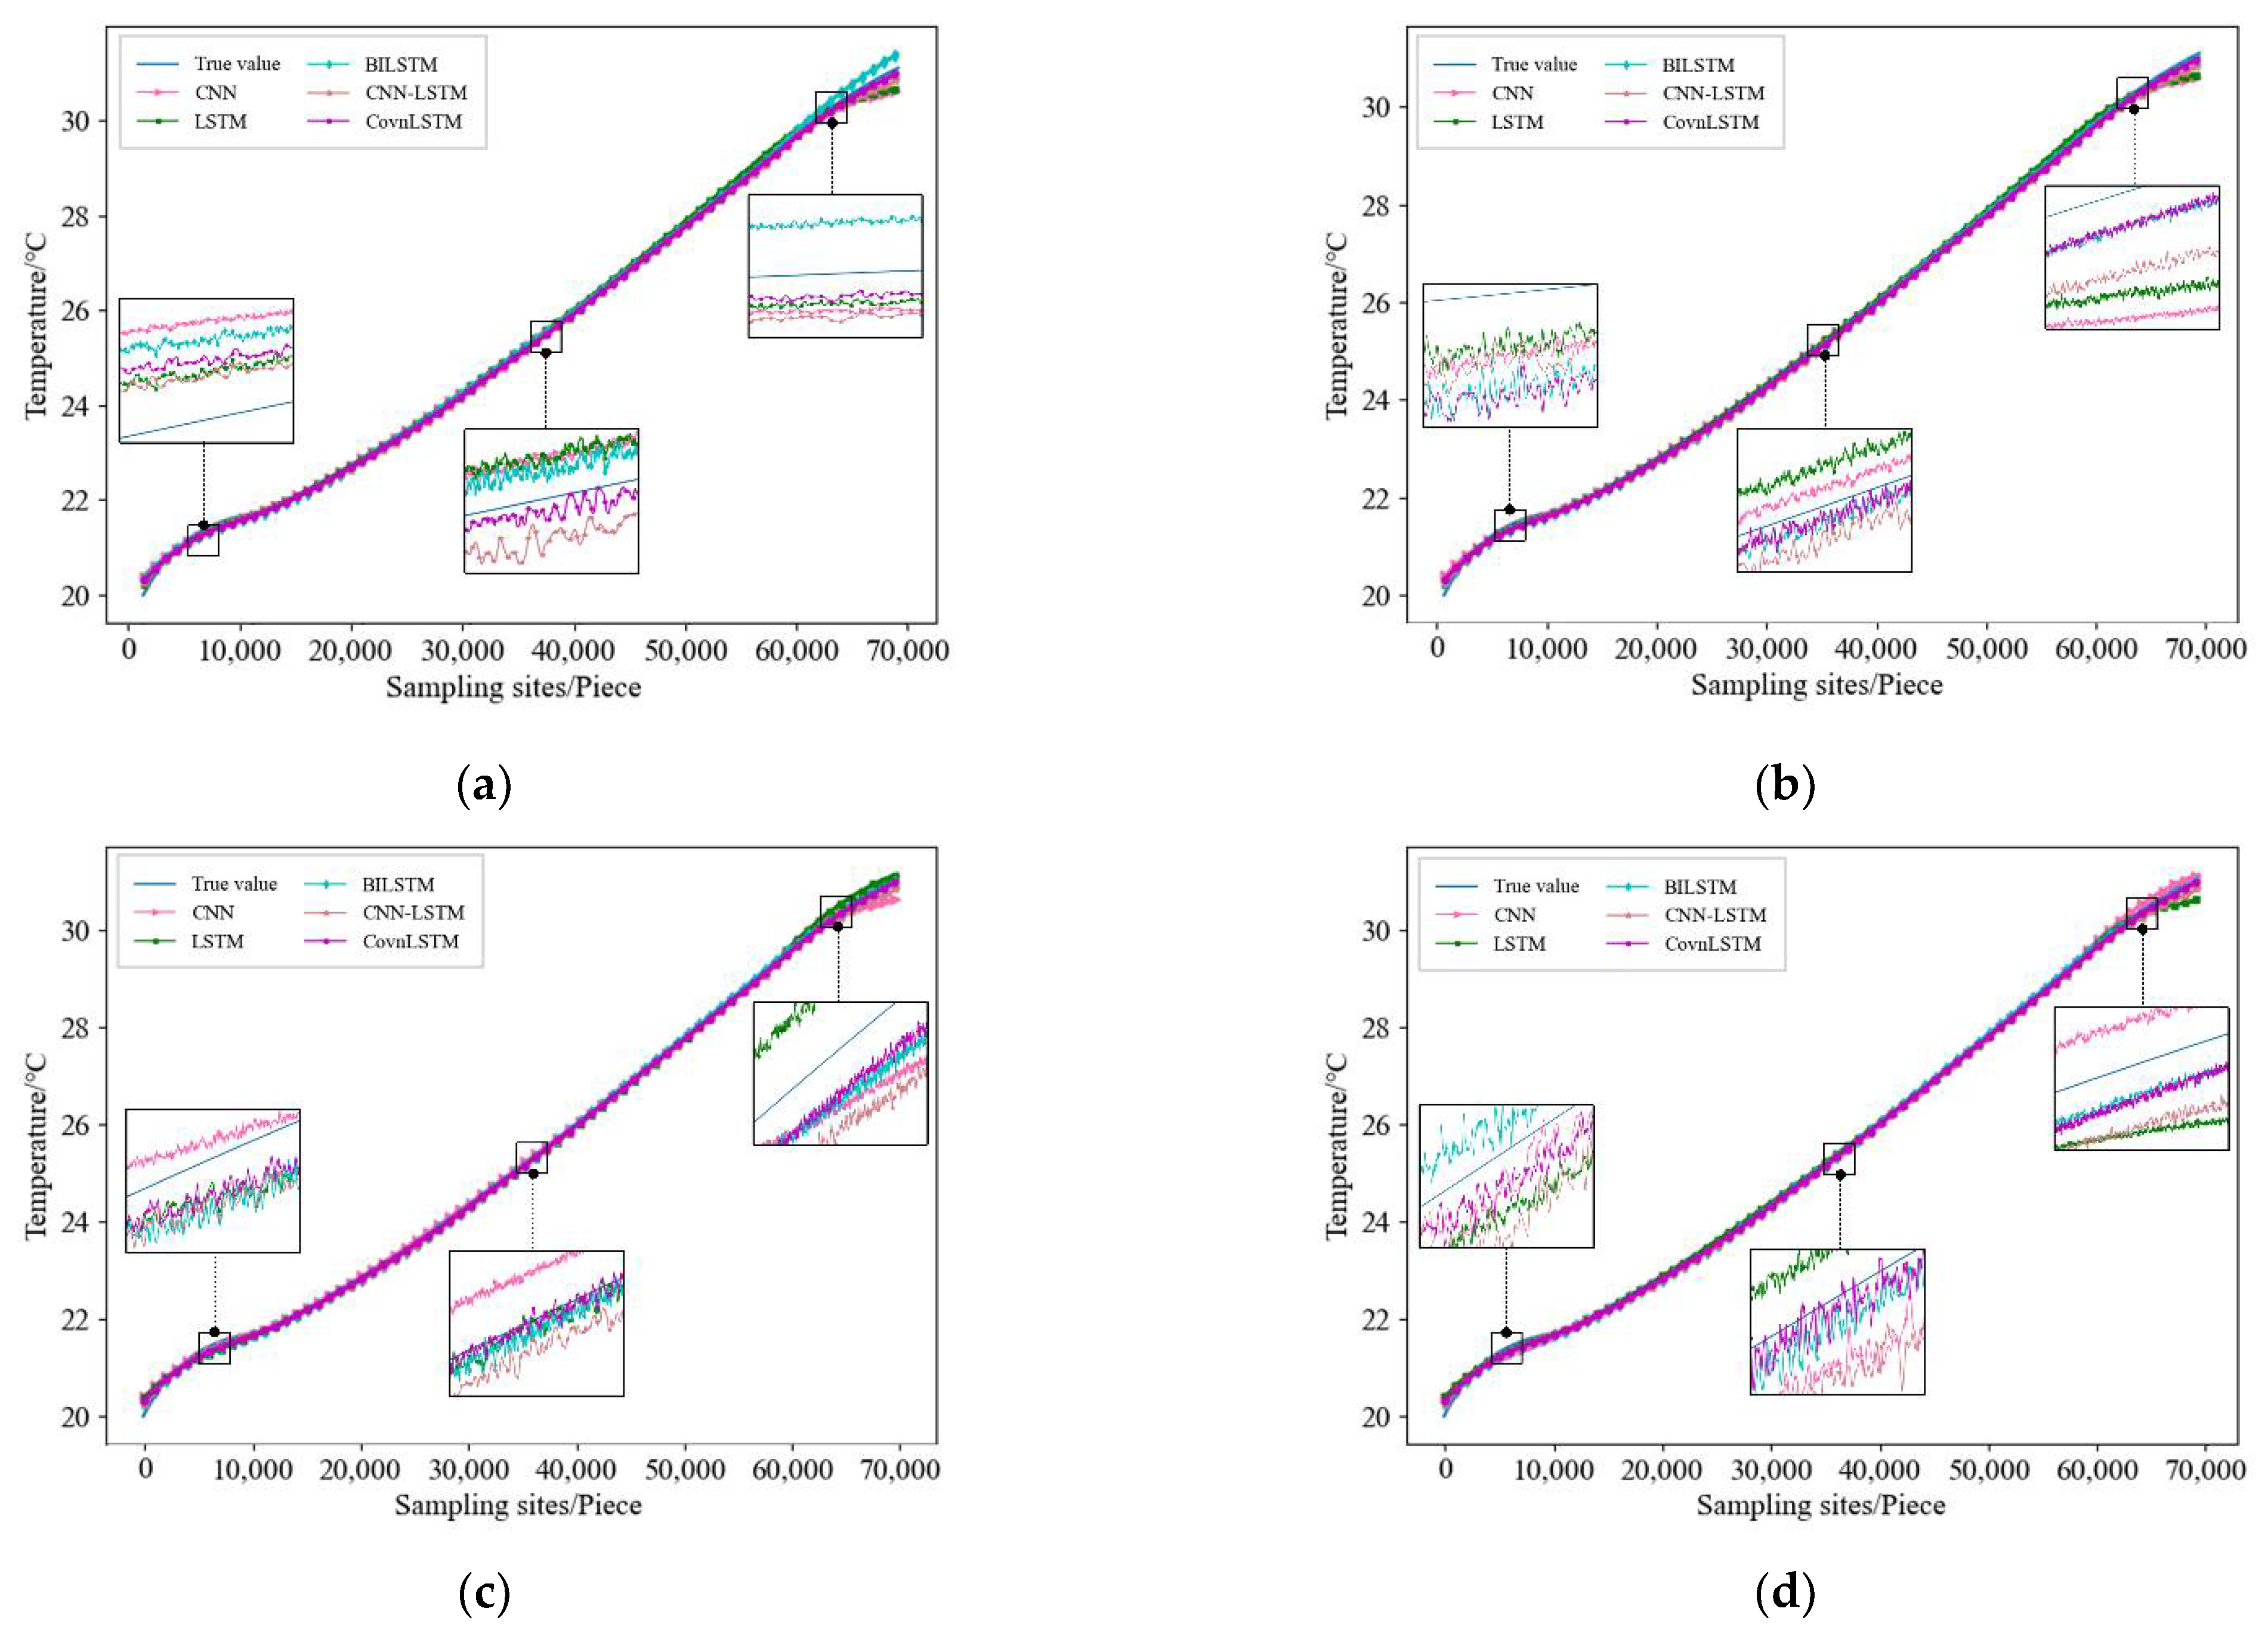
The normal charging data of the EV is selected to train the ConvLSTM model. When the EV is charged normally, the charging data is relatively stable, and the prediction error of the ConvLSTM model is relatively small. When a potential fault occurs in the charging of an EV, the degree of the fault will increase as the charging progresses, and the charging data of the EV will deviate from the normal charging range, resulting in a larger prediction error of the ConvLSTM model. To verify the accuracy and stability of the ConvLSTM model for predicting EV charging data, a cross-validation method was used after dividing the dataset. A graph of the predicted results of the cross-validation of this simulated EV model is shown in Figure 8:
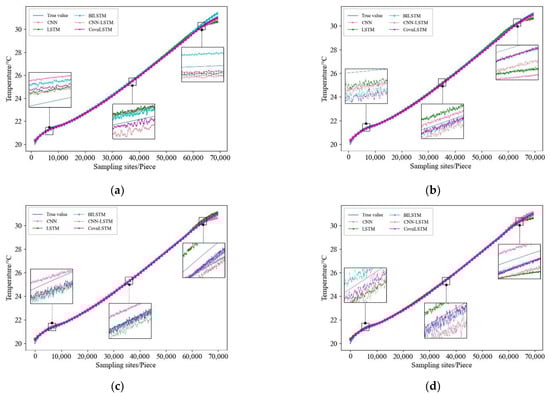
Figure 8.
Diagram of cross-validated prediction results for simulation model. (a) Prediction result of training set 1. (b) Prediction result of training set 2. (c) Prediction result of training set 3. (d) Prediction result of training set 4.
As shown in Figure 8, by analyzing the graph of predicted results, the following conclusions are drawn:
- (a)
- In the early stage of temperature prediction, the CNN-LSTM model in training set one gives predictions similar to the actual temperature values, and with more training data, the ConvLSTM model gives the best predictions in the middle and late stages of prediction.
- (b)
- In the early stage of temperature prediction, the ConvLSTM model in training set two was poorly predicted. The closest to the actual value was the LSTM model. However, in the middle and late stage, the ConvLSTM model and the BiLSTM model were the closest to the actual value.
- (c)
- The model prediction results of training set three are more satisfactory, and the ConvLSTM model proposed in this paper has the best prediction results in all three stages of prediction, which are closest to the actual values.
- (d)
- In the early and late stages of prediction, the ConvLSTM model and the BiLSTM model in training set four were closer to each other and had better predictions. However, the ConvLSTM model outperformed the BiLSTM model in the midterm prediction.
The predictions from the cross-validation of this simulated EV model are shown in Table 7:
Table 7.
Prediction results of cross-validation from simulation model.
Table 7 summarizes the prediction errors of the simulation model and the experi-mental results are shown below:
- (1)
- Training set one: Using the top 25% of the data as training set one, the prediction accuracy of the different models was evaluated. The experimental results showed that the ConvLSTM models all outperformed the other four types of models in terms of prediction accuracy, with a 0.007 reduction in RMSE, a 1.66 reduction in MAPE, and a 0.18 improvement in r2 compared to the CNN-LSTM models.
- (2)
- Training set two: The prediction accuracy of the different models was evaluated by training set two. The experimental results showed that the prediction accuracy of the models in training set two were all better than that in training set one. Regarding the ConvLSTM model in training set two, RMSE of was reduced by 0.003, MAPE was reduced by 0.07, and r2 was improved by 0.05 compared with that of the ConvLSTM in training set one.
- (3)
- Training set three: Among the four training sets identified, training set three had the best prediction, with RMSE and MAPE reaching the lowest and r2 the highest, where RMSE, MAPE, and r2 were 0.029, 11.37 and 0.89, respectively.
- (4)
- Training set four: In the four-part training set, training set four only predicted better than training set one. Compared with the ConvLSTM model in training set one, RMSE decreased by 0.01, MAPE decreased by 0.04, and r2 improved by 0.04.
The experimental results show that the ConvLSTM model has excellent performance in all four training sets using different evaluation metrics. RMSE, MAPE, and r2 metrics outperformed the CNN, LSTM, BILSTM and CNN-LSTM network models. It is demonstrated that the ConvLSTM network model proposed in this paper improves the temperature prediction accuracy of the whole EV battery. Among them, training set three has the best prediction accuracy and training set one has the worst prediction accuracy. The following experiments all use the prediction results of training set one to validate the EV temperature warning model proposed in this paper.
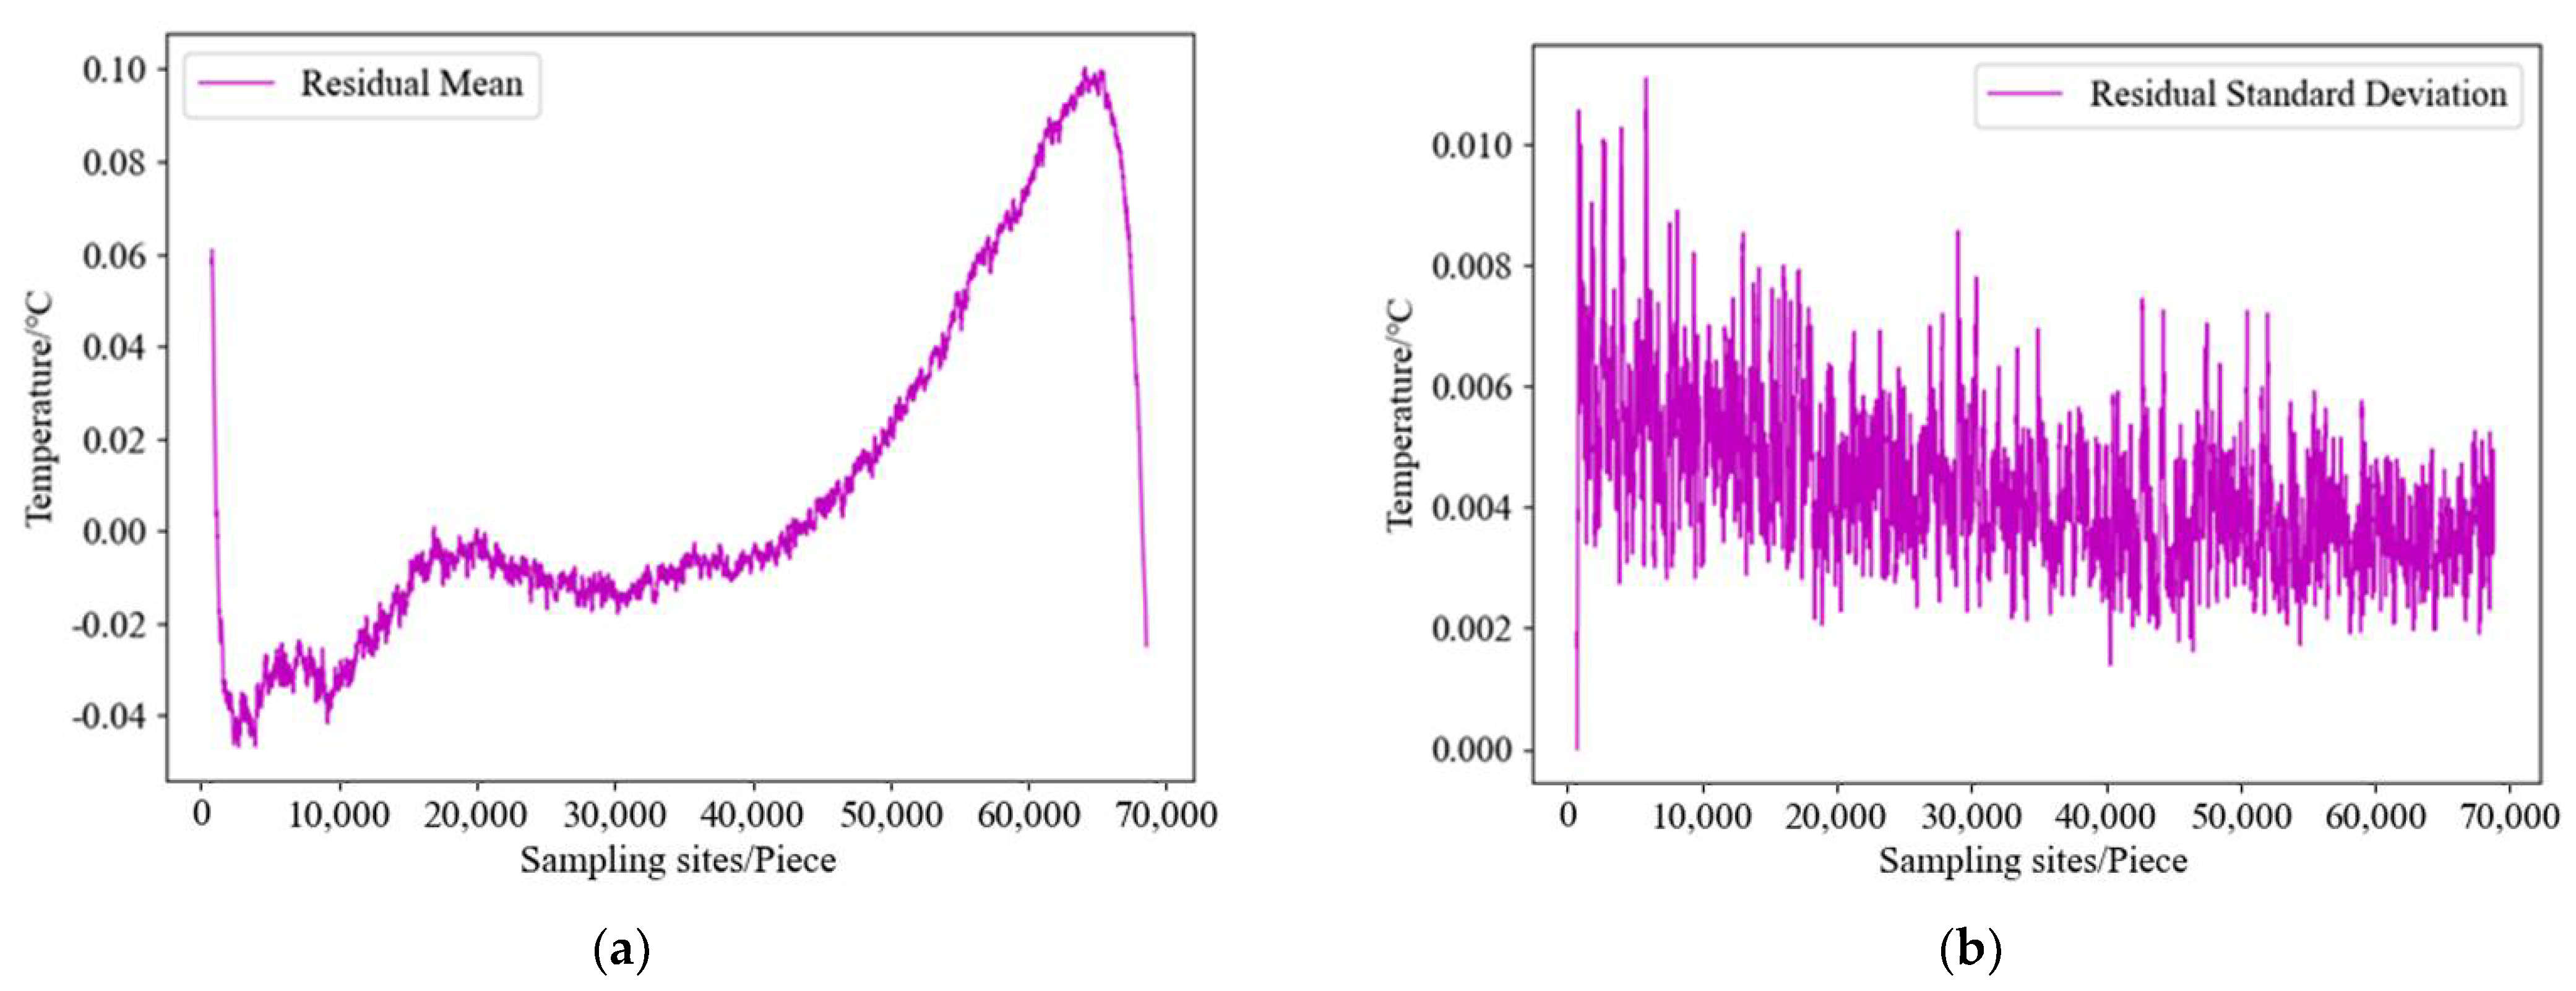
The sliding window residual statistics method can continuously detect changes in the residual statistics characteristics in real-time. When abnormal conditions occur in temperature, its operating characteristics will change so that the new observation vector deviates from the normal operating state space; the charging status of EVs can be determined by calculating the warning and alarm thresholds of EVs [32,33,34]. The width N was chosen to be 100. The mean value and the standard deviation of the temperature residuals for training set one of the simulation model are shown in Figure 9.
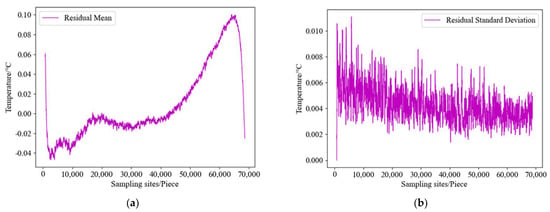
Figure 9.
Residual results for training set 1 of the simulation model. (a) Residual mean. (b) Residual standard deviation.
As shown in Figure 9a,b, the residual mean and the residual standard deviation can be obtained. According to many analyses of actual EV charging spontaneous combustion accidents, this paper takes k1 and k2 as 2, and calculates their early warning thresholds using Equation (6); when it exceeds the early warning threshold by 40%, an alarm signal is issued, this paper takes k3 and k4 as 2.8, and the alarm threshold is calculated using Equation (7). The specific values are shown in Table 8:
Table 8.
Calculated values for detailed pre-alarm thresholds.
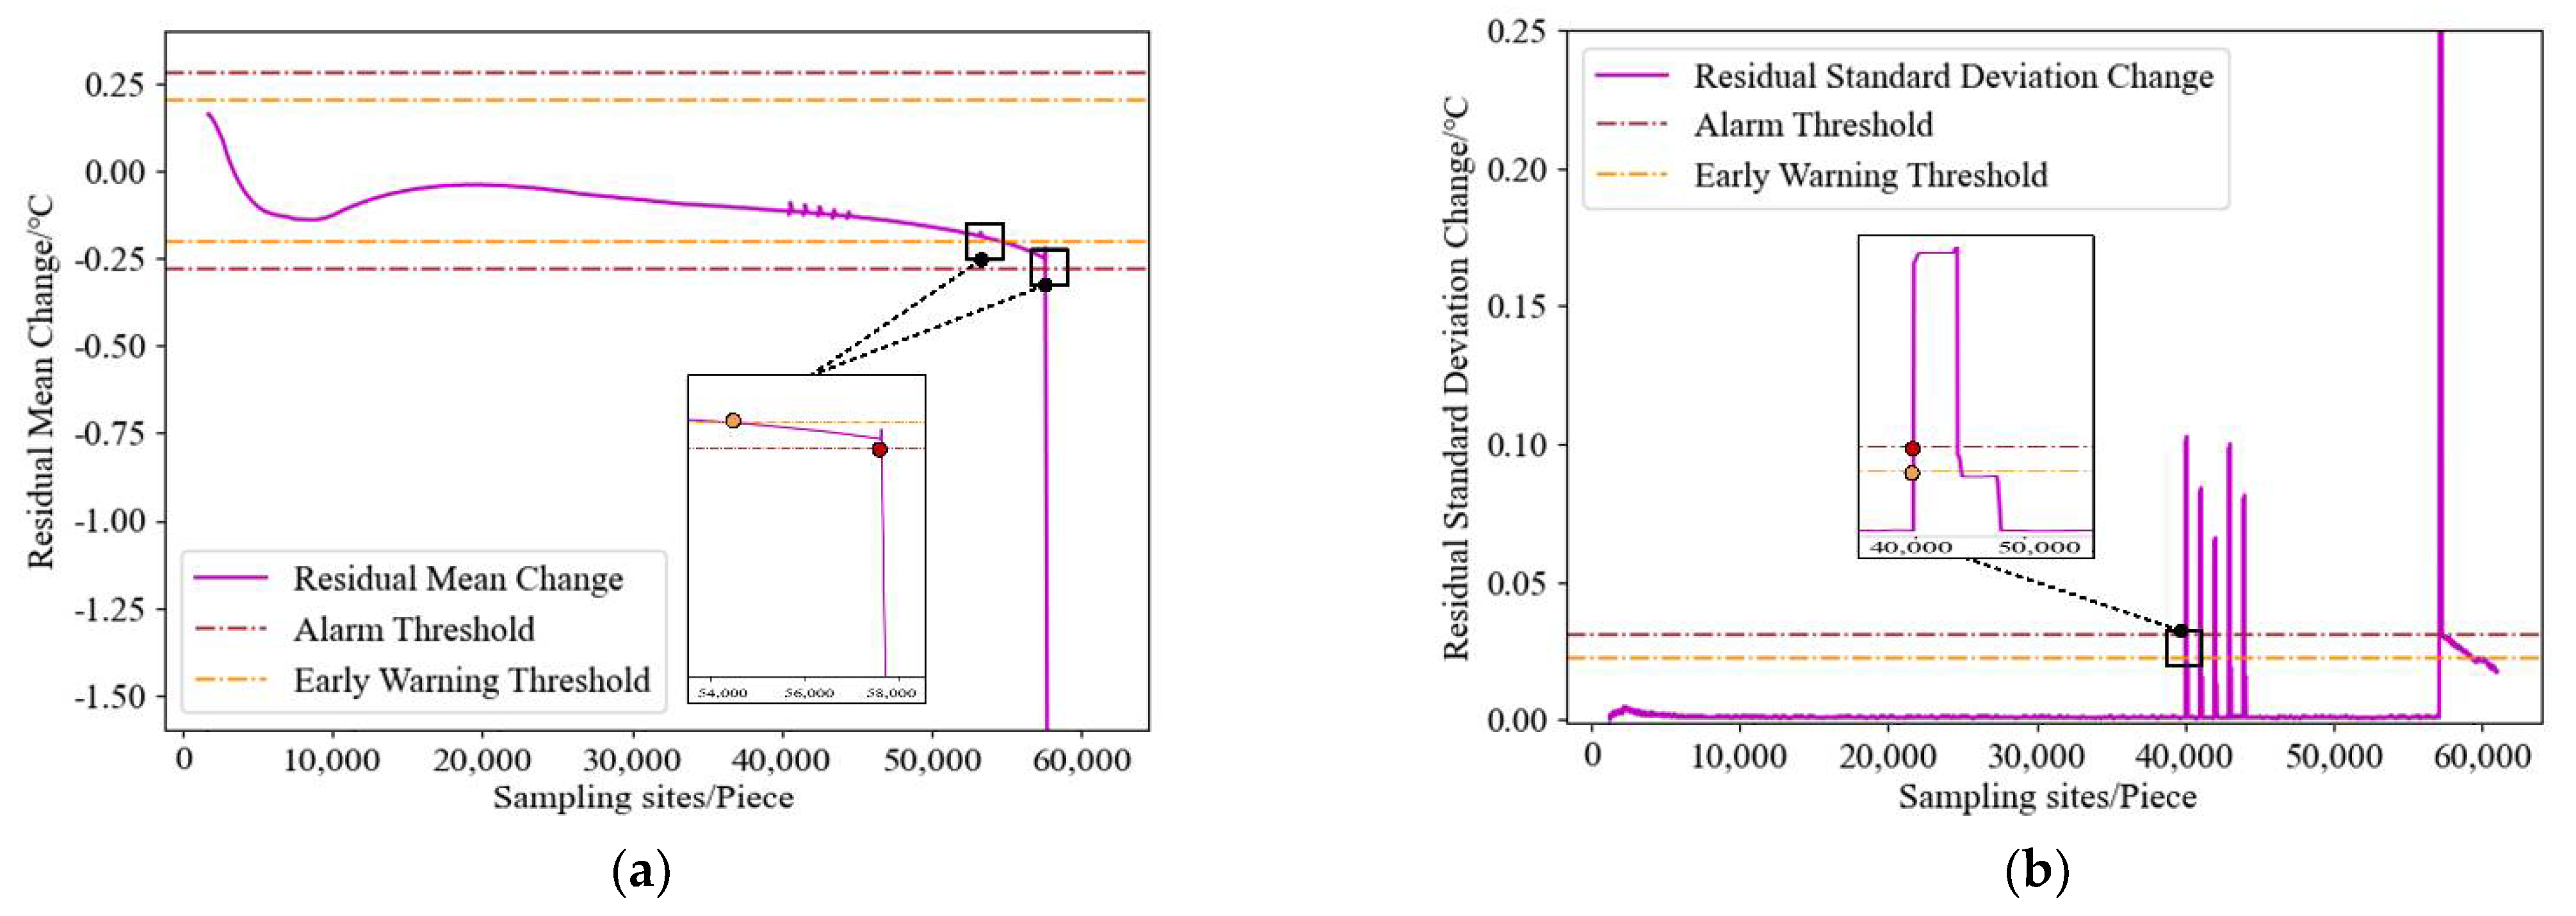
Input the EV fault data into the ConvLSTM safety pre-alarm model, and the obtained charging safety pre-alarm results are shown in Figure 10.

Figure 10.
Safe pre-warning results for training set 1 of the simulation model. (a) Residual mean change. (b) Residual standard deviation change.
As shown in Figure 10a, the residual mean exceeds the early warning threshold at the 54,250th sampling point and exceeds the alarm threshold at the 57,630th sampling point. As shown in Figure 10b, the residual standard deviation exceeds both the early warning and alarm threshold at the 39,998th sampling point. According to the safety pre-alarm method set in this research, the method sends an alarm signal at the 39,998th sampling point, and then stops charging. During the actual charging of the EV, the charging temperature at the 40,003rd sampling point was abnormal, and the on-board battery pack was burned at the 58,007th sampling point. Compared with the actual situation, the safety warning model proposed in this study stops charging 5 sampling points earlier than the earliest abnormal temperature point.
5. Conclusions
In this study, the ConvLSTM model is migrated to the field of EV warning for the problem of spontaneous combustion during EV charging, which is the first application of the model in this field.
Our experimental conclusions are as follows: The results showed that the model proposed in this study produced the lowest RMSE and MAPE while it obtained the highest r2 compared to other models with the same parameters. Among the four training sets, the ConvLSTM model of training set three had the highest prediction, with RMSE reaching 0.029, MAPE reaching 11.37, and r2 reaching 0.89. Training set one had the worst prediction and after using it to set the warning threshold, the simulation model completed the alarm task five sampling points ahead of schedule. Therefore, the early warning and alarm method proposed in this paper can detect abnormal charging conditions in advance and take corresponding protective measures such as reducing the current or stopping charging, effectively reducing the risk of spontaneous combustion in EVs.
In addition, the poorer prediction results for training set one is attributed to the larger charging voltage difference, higher charging current and more pronounced temperature variation at the early stage of EV charging; in training set four, it is because in the later stages of EV charging, the voltage difference kept narrowing, the charging current decreased and the temperature changes were not significant, training the model with these two parts of data reduced the prediction accuracy. Training set two and training set three were in the smoother charging stage, so the training model had better results.
In future work, the following two directions can be taken. Firstly, the early warning method proposed in this paper can be applied to the prediction of voltage, current and SOC of EVs, and the early warning indicators can collaborate with each other to make the EV early warning system more perfect. Secondly, the temperature prediction model can be replaced by a temperature rise prediction model, because the temperature rise is in the form of derivatives, which are more obvious and can capture abnormal charging conditions in a more timely manner. In summary, the method proposed in this paper has a more promising future in the field of EV early warning and hopefully will provide a new idea for researchers. There are, of course, shortcomings in our research. For example, our limited EV data allows only limited simulations to be performed to verify the accuracy of this hybrid model. In practical applications, consideration should also be given to data transmission delays, which are key to training the model in a timely manner, and this type of problem should be left to the collaboration of the relevant authorities.
Author Contributions
Conceptualization, X.Z. and D.G.; methodology, X.Z.; software, X.Z.; validation, X.Z.; formal analysis, X.Z., Q.Y. and Z.Z.; writing—original draft preparation, X.Z.; writing—review and editing, Q.Y., Z.Z. and D.G.; visualization, X.Z. All authors have read and agreed to the published version of the manuscript.
Funding
This research was funded by the Key Research and Development Program of Shandong Province of China (Grant No. 2019GGX101012).
Conflicts of Interest
The authors declare no conflict of interest.
References
- Wróblewski, P.; Lewicki, W. A method of analyzing the residual values of low-emission vehicles based on a selected expert method taking into account stochastic operational parameters. Energies 2021, 14, 6859. [Google Scholar] [CrossRef]
- Wang, X.; Jin, M.; Feng, W.; Shu, G.Q.; Tian, H.; Liang, Y.C. Cascade energy optimization for waste heat recovery in distributed energy systems. Appl. Energy 2018, 230, 679–695. [Google Scholar] [CrossRef]
- Li, M.; Cui, S.; Huang, H.Z.; Jiang, Y.; Wei, W.R. Effect of pipes in heat pump system on electric vehicle energy saving. Int. J. Green Energy 2020, 17, 666–675. [Google Scholar] [CrossRef]
- Jiang, L.R.; Li, T.Y.; Li, B.W.; Diao, X.H.; Zhang, J. Development and simulation of real-time early warning protection system for electric vehicle charging based on a two-layer protection model. World Electr. Veh. J. 2022, 13, 73. [Google Scholar] [CrossRef]
- Wróblewski, P.; Kupiec, J.; Drożdż, W.; Lewicki, W.; Jaworski, J. The economic aspect of using different plug-in hybrid driving techniques in urban conditions. Energies 2021, 14, 3543. [Google Scholar] [CrossRef]
- Hong, J.C.; Wang, Z.P.; Ma, F.; Yang, J.; Xu, X.M.; Qu, C.H.; Zhang, J.H.; Shan, T.X.; Hou, Y.K.; Zhou, Y.J. Thermal runaway prognosis of battery systems using the modified multiscale entropy in real-world electric vehicles. IEEE Trans. Transp. Electrif. 2021, 7, 2269–2278. [Google Scholar] [CrossRef]
- Gao, D.X.; Wang, Y.; Zheng, X.Y.; Yang, Q. A fault warning method for electric vehicle charging process based on adaptive deep belief network. World Electr. Veh. J. 2021, 12, 265. [Google Scholar]
- Shah, K.; Chalise, D.; Jain, A. Experimental and theoretical analysis of a method to predict thermal runaway in Li-ion cells. J. Power Sources 2016, 330, 167–174. [Google Scholar] [CrossRef] [Green Version]
- Lyu, N.W.; Jin, Y.; Xiong, R.; Miao, S.; Gao, J.F. Real-time overcharge warning and early thermal runaway prediction of li-ion battery by online impedance measurement. IEEE Trans. Ind. Electron. 2021, 69, 1929–1936. [Google Scholar] [CrossRef]
- Jiang, L.L.; Deng, Z.W.; Tang, X.L.; Hu, L.; Lin, X.K.; Hu, X.S. Data-driven fault diagnosis and thermal runaway warning for battery packs using real-world vehicle data. Energy 2021, 234, 121266. [Google Scholar] [CrossRef]
- Khishe, M.; Caraffini, F.; Kuhn, S. Evolving deep learning convolutional neural networks for early COVID-19 detection in chest X-ray images. Mathematics 2021, 9, 1002. [Google Scholar] [CrossRef]
- Li, C.R.; Xiao, F.; Fan, Y.X.; Yang, G.R.; Tang, X. SOH estimation of lithium-ion battery based on Convolutional Neural Network. J. Electr. Eng. 2020, 35, 4106–4119. [Google Scholar]
- Gao, D.X.; Lin, X.H. Fault diagnosis method of DC charging points for EVs based on Deep Belief Network. World Electr. Veh. J. 2021, 12, 47. [Google Scholar] [CrossRef]
- Wang, C.Y.; Huang, T.C.; Wu, Y.M. Using LSTM neural networks for onsite earthquake early warning. Seismol. Res. Lett. 2022, 93, 814–826. [Google Scholar] [CrossRef]
- Liu, J.M.; Su, Y.Q.; Wei, P.; Liu, Y.H. Video-EEG interaction cooperative emotion recognition based on Long and Short Memory and information Attention. Zidonghua Xuebao 2020, 46, 2137–2147. [Google Scholar]
- Chen, S.; Ge, L. Exploring the attention mechanism in LSTM-based Hong Kong stock price movement prediction. Quant. Financ. 2019, 19, 1507–1515. [Google Scholar] [CrossRef]
- Chen, B.L.; Zheng, H.W.; Wang, L.L.; Hellwich, O.; Chen, C.B.; Yang, L.; Liu, T.; Luo, G.P.; Bao, A.M.; Chen, X. A joint learning Im-BiLSTM model for incomplete time-series Sentinel-2A data imputation and crop classification. Int. J. Appl. Earth Obs. 2022, 108, 102762. [Google Scholar] [CrossRef]
- Wang, M.; Zhou, T.; Wang, H.H.; Zhai, Y.C.; Dong, X.B. Chinese power dispatching text entity recognition based on a double-layer BiLSTM and multi-feature fusion. Energy Rep. 2022, 8, 980–987. [Google Scholar] [CrossRef]
- Liang, T.; Chai, C.J.; Sun, H.X.; Tan, J.X. Wind speed prediction based on multi-variable Capsnet-BiLSTM-MOHHO for WPCCC. Energy 2022, 250, 123761. [Google Scholar] [CrossRef]
- Li, D.; Liu, P.; Zhang, Z.S.; Zhang, L.; Deng, J.J.; Wang, Z.P.; Dorrell, D.G.; Li, W.H.; Sauer, D.U. Battery thermal runaway fault prognosis in electric vehicles based on abnormal heat generation and Deep Learning Algorithms. IEEE Trans. Power Electron. 2022, 37, 8513–8525. [Google Scholar] [CrossRef]
- Kara, A. A data-driven approach based on deep neural networks for lithium-ion battery prognostics. Neural Comput. Appl. 2021, 33, 13525–13538. [Google Scholar] [CrossRef]
- Nandhini, K.; Tamilpavai, G. Hybrid CNN-LSTM and modified wild horse herd Model-based prediction of genome sequences for genetic disorders. Biomed. Signal Process. Control 2022, 78, 103840. [Google Scholar]
- Zhang, Y.; Cheng, T.; Ren, Y.B.; Xie, K. A novel residual graph convolution deep learning model for Short-term Network-based traffic forecasting. Int. J. Geogr. Inf. Sci. 2020, 34, 969–995. [Google Scholar]
- Huang, H.; Liu, C.; Tian, L.; Mu, J.S.; Jing, X.J. A novel FCNs-ConvLSTM network for video salient object detection. Int. J. Circ. Theor. Appl. 2021, 49, 1050–1060. [Google Scholar] [CrossRef]
- Guo, J.M.; Markoni, H. Driver drowsiness detection using hybrid Convolutional Neural Network and Long Short-term Memory. Multimed. Tools Appl. 2019, 78, 29059–29087. [Google Scholar] [CrossRef]
- Huang, H.; Zeng, Z.; Yao, D.; Pei, X.; Zhang, Y. Spatial-temporal ConvLSTM for vehicle driving intention prediction. Tsinghua Sci. Technol. 2021, 27, 599–609. [Google Scholar] [CrossRef]
- Kelotra, A.; Pandey, P. Stock market prediction using optimized Deep-ConvLSTM model. IEEE Trans. Big Data 2020, 8, 5–24. [Google Scholar]
- Yun, S.S.; Kee, S.C. Improved multilevel multistage Constant-Current Constant-Voltage superfast charging of multiple cells. J. Electr. Eng. Technol. 2022, 17, 209–219. [Google Scholar] [CrossRef]
- IEC 61851-1-2017; International Electrotechnical Commission. Electric Vehicle Conductive Charging System—Part 1 General Requirements. International Electrotechnical Commission: Geneva, Switzerland, 2017.
- SAE J 2293/2-2008; Energy Transfer System for Electric Vehicles Part 2: Communication Requirements and Network Architecture. Society of Automotive Engineers: Washington, DC, USA, 2008.
- GB/T 27930-2015; Communication Protocol of Electric Vehicle Off-Board Conductive Charger and Battery Management System. China Electricity Council: Beijing, China, 2015.
- Qu, H.Q.; Fu, S.; Pang, L.P.; Ding, C.; Zhang, H.L. Rapid temperature prediction method for electronic equipment cabin. Appl. Therm. Eng. 2018, 138, 83–93. [Google Scholar] [CrossRef]
- Bracale, A.; Carpinelli, G.; Gu, I.Y.H.; Bollen, M.H.J. A new joint sliding-window ESPRIT and DFT scheme for waveform distortion assessment in power systems. Electr. Power Syst. Res. 2012, 88, 112–120. [Google Scholar] [CrossRef]
- Ranjan, K.G.; Tripathy, D.S.; Prusty, B.R.; Jena, D. An improved sliding window prediction-based outlier detection and correction for volatile time-series. Int. J. Numer. Model. Electron. Netw. Devices Fields 2021, 34, e2816. [Google Scholar] [CrossRef]
Publisher’s Note: MDPI stays neutral with regard to jurisdictional claims in published maps and institutional affiliations. |
© 2022 by the authors. Licensee MDPI, Basel, Switzerland. This article is an open access article distributed under the terms and conditions of the Creative Commons Attribution (CC BY) license (https://creativecommons.org/licenses/by/4.0/).