
Research on the Performance Comparison of Two Fuel Cell Electric Vehicles with Typical Energy Management Strategies


Abstract
:1. Introduction
2. Theoretical Analysis
3. Experiment Preparation and Setup
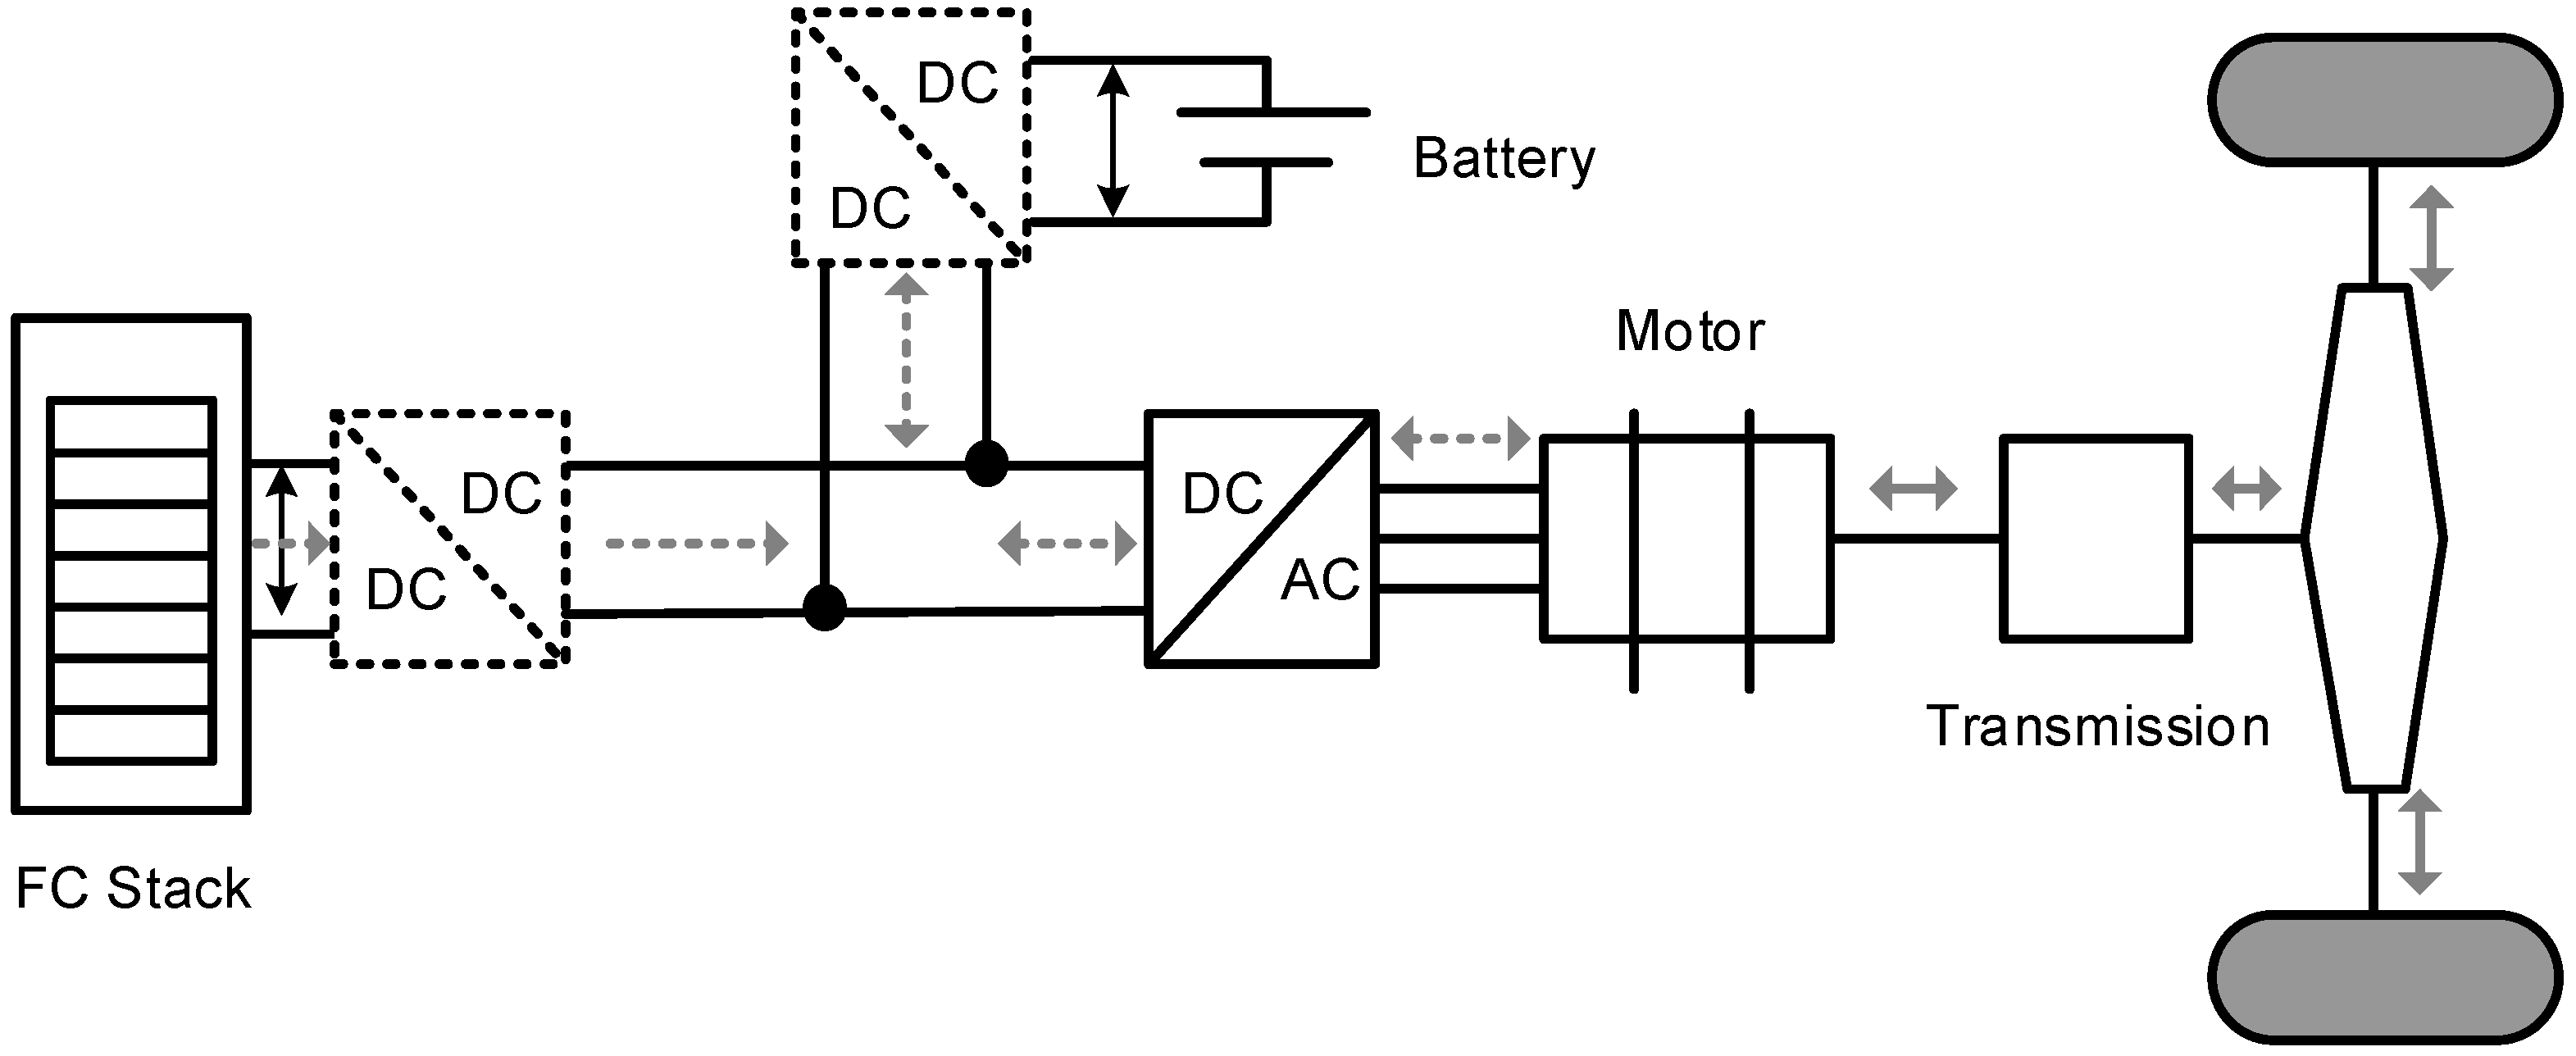
3.1. Test Vehicle
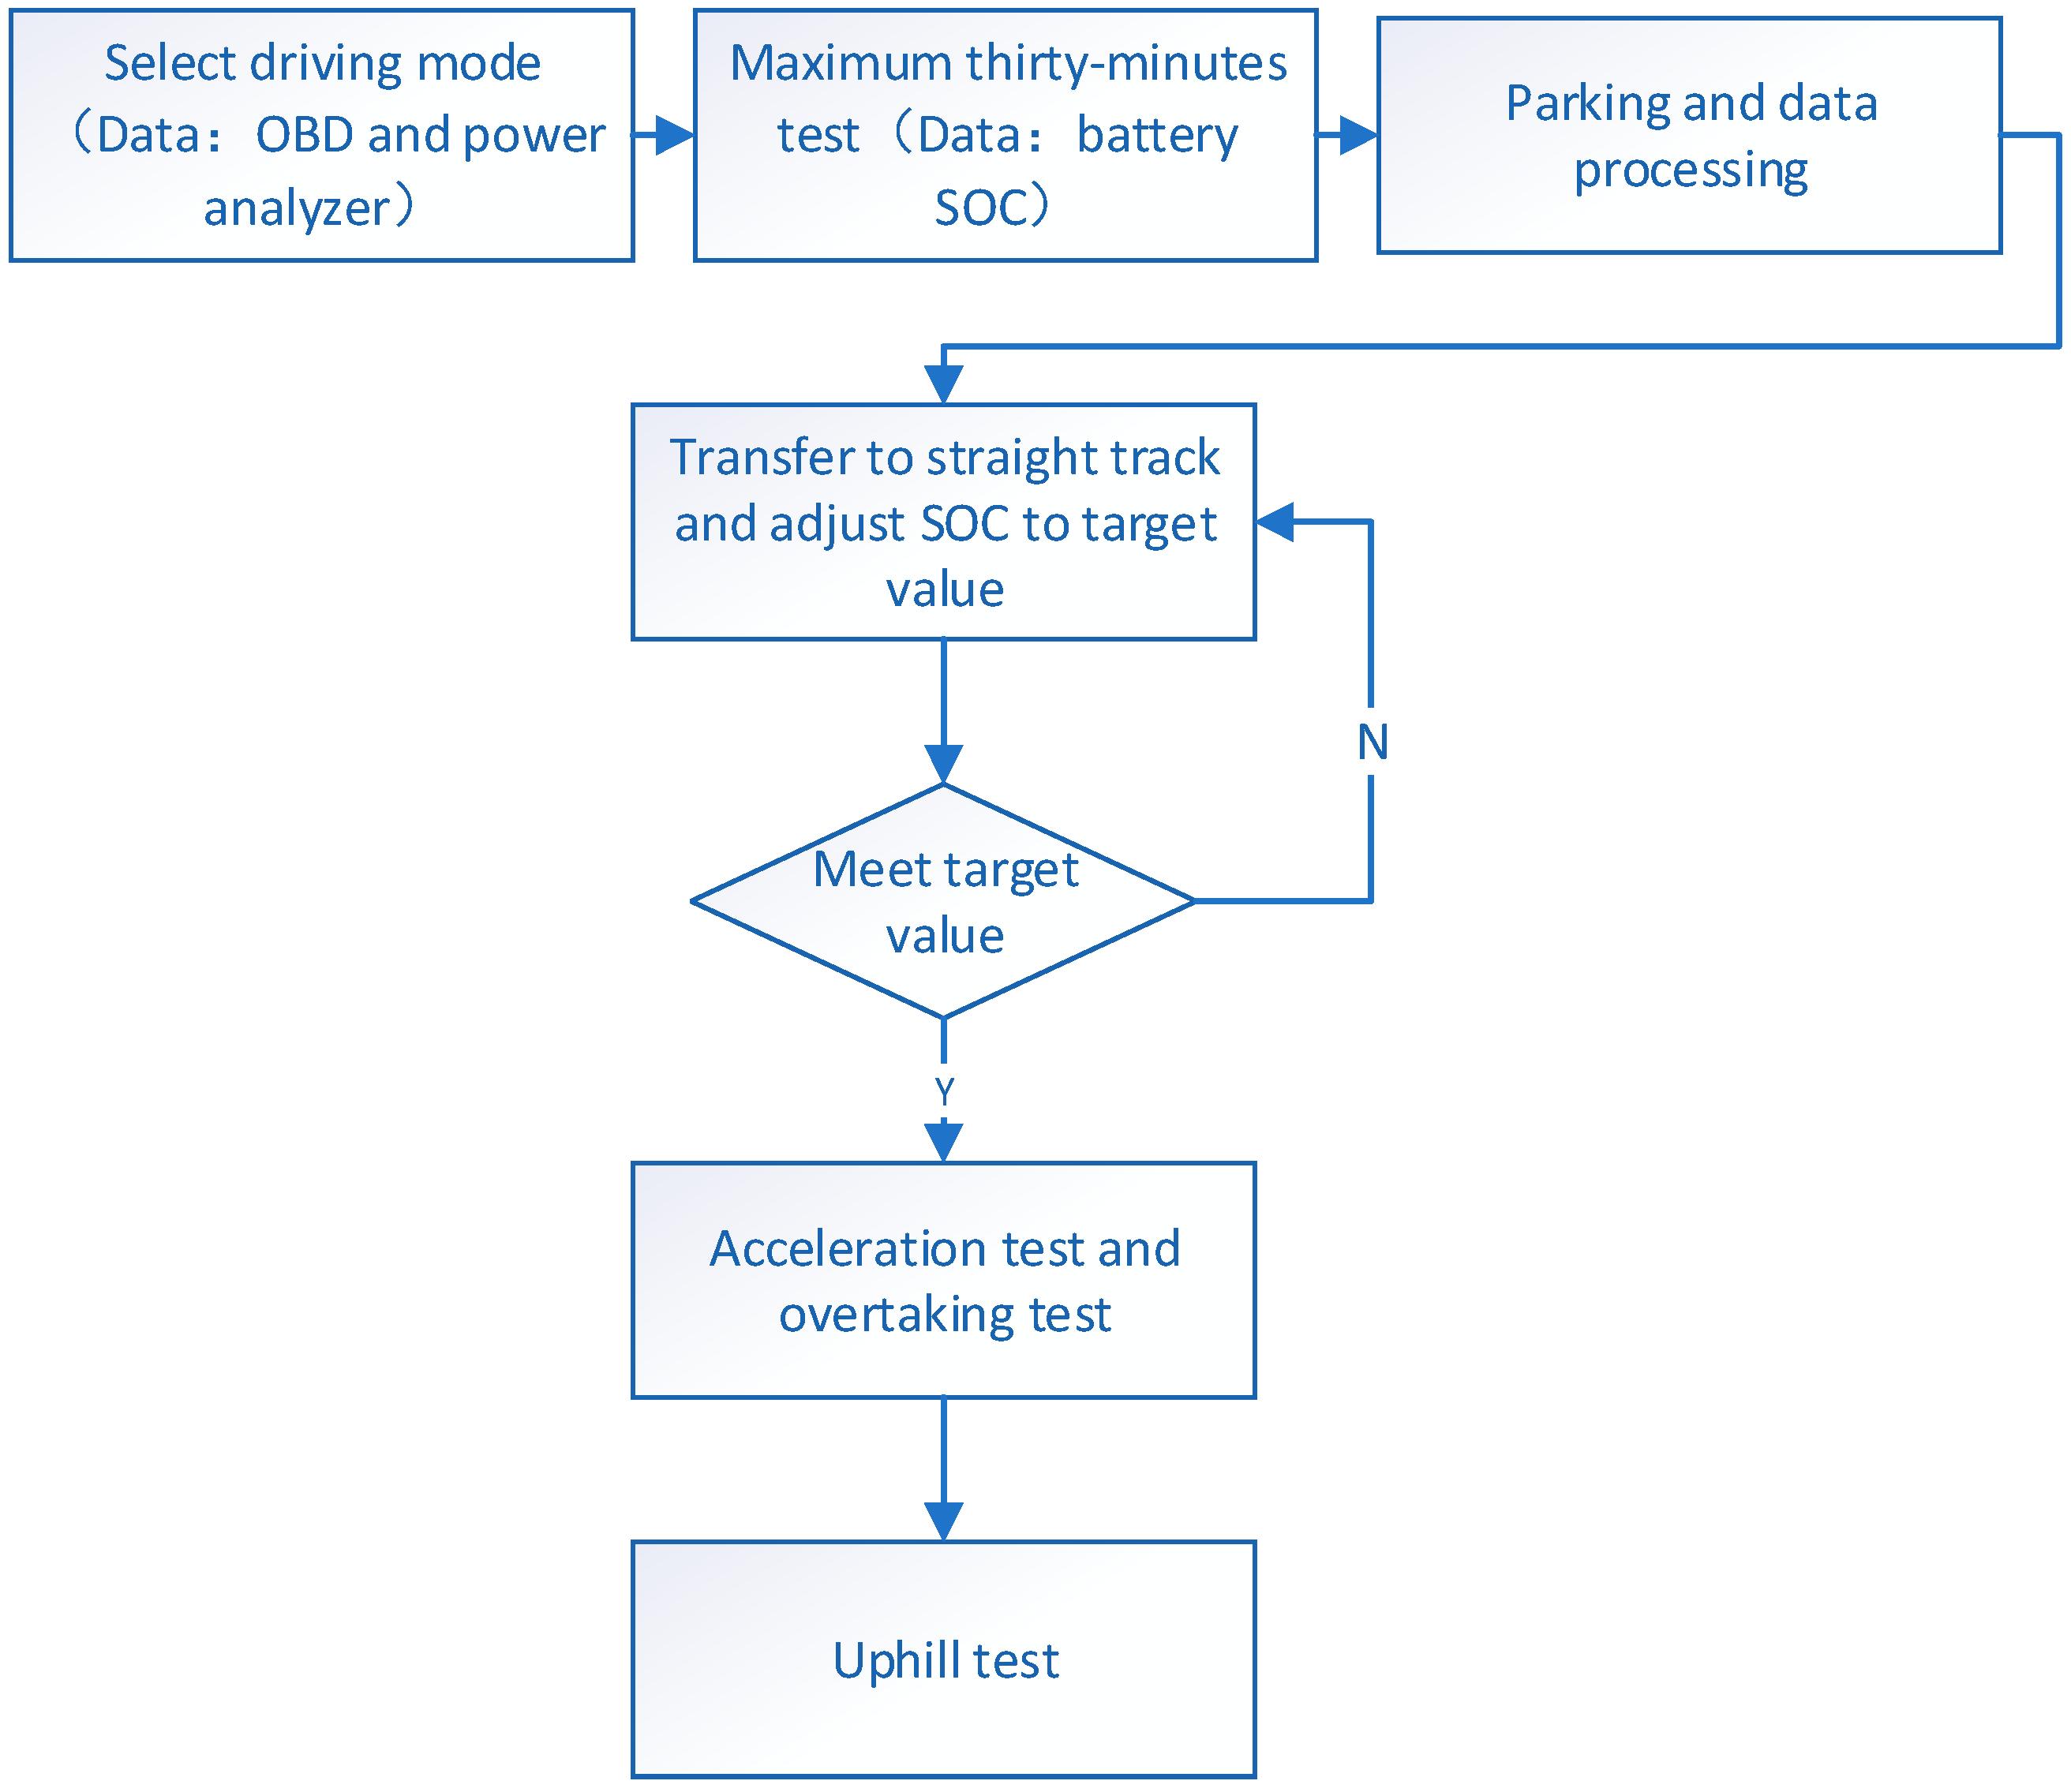
3.2. Test Method
- (1)
- Select the driving mode (default mode), start the on-board diagnostic (OBD) port recorder and the on-board power analyzer;
- (2)
- Carry out maximum thirty-min speed test and record the SOC;
- (3)
- Parking, data processing;
- (4)
- Transfer to the straight track and adjust SOC to the target value when finishing the (2);
- (5)
- Carry out the starting acceleration test (0–50 km/h) and the overtaking acceleration test (30 km/h–50 km/h). Before each test, confirm that the traction battery state is within the target value. Otherwise, repeat the procedure (4);
- (6)
- Transfer to the following test site and complete the uphill test.
3.3. Data Collection
4. Results and Discussion
4.1. The Stepped Power Control Strategy Vehicle
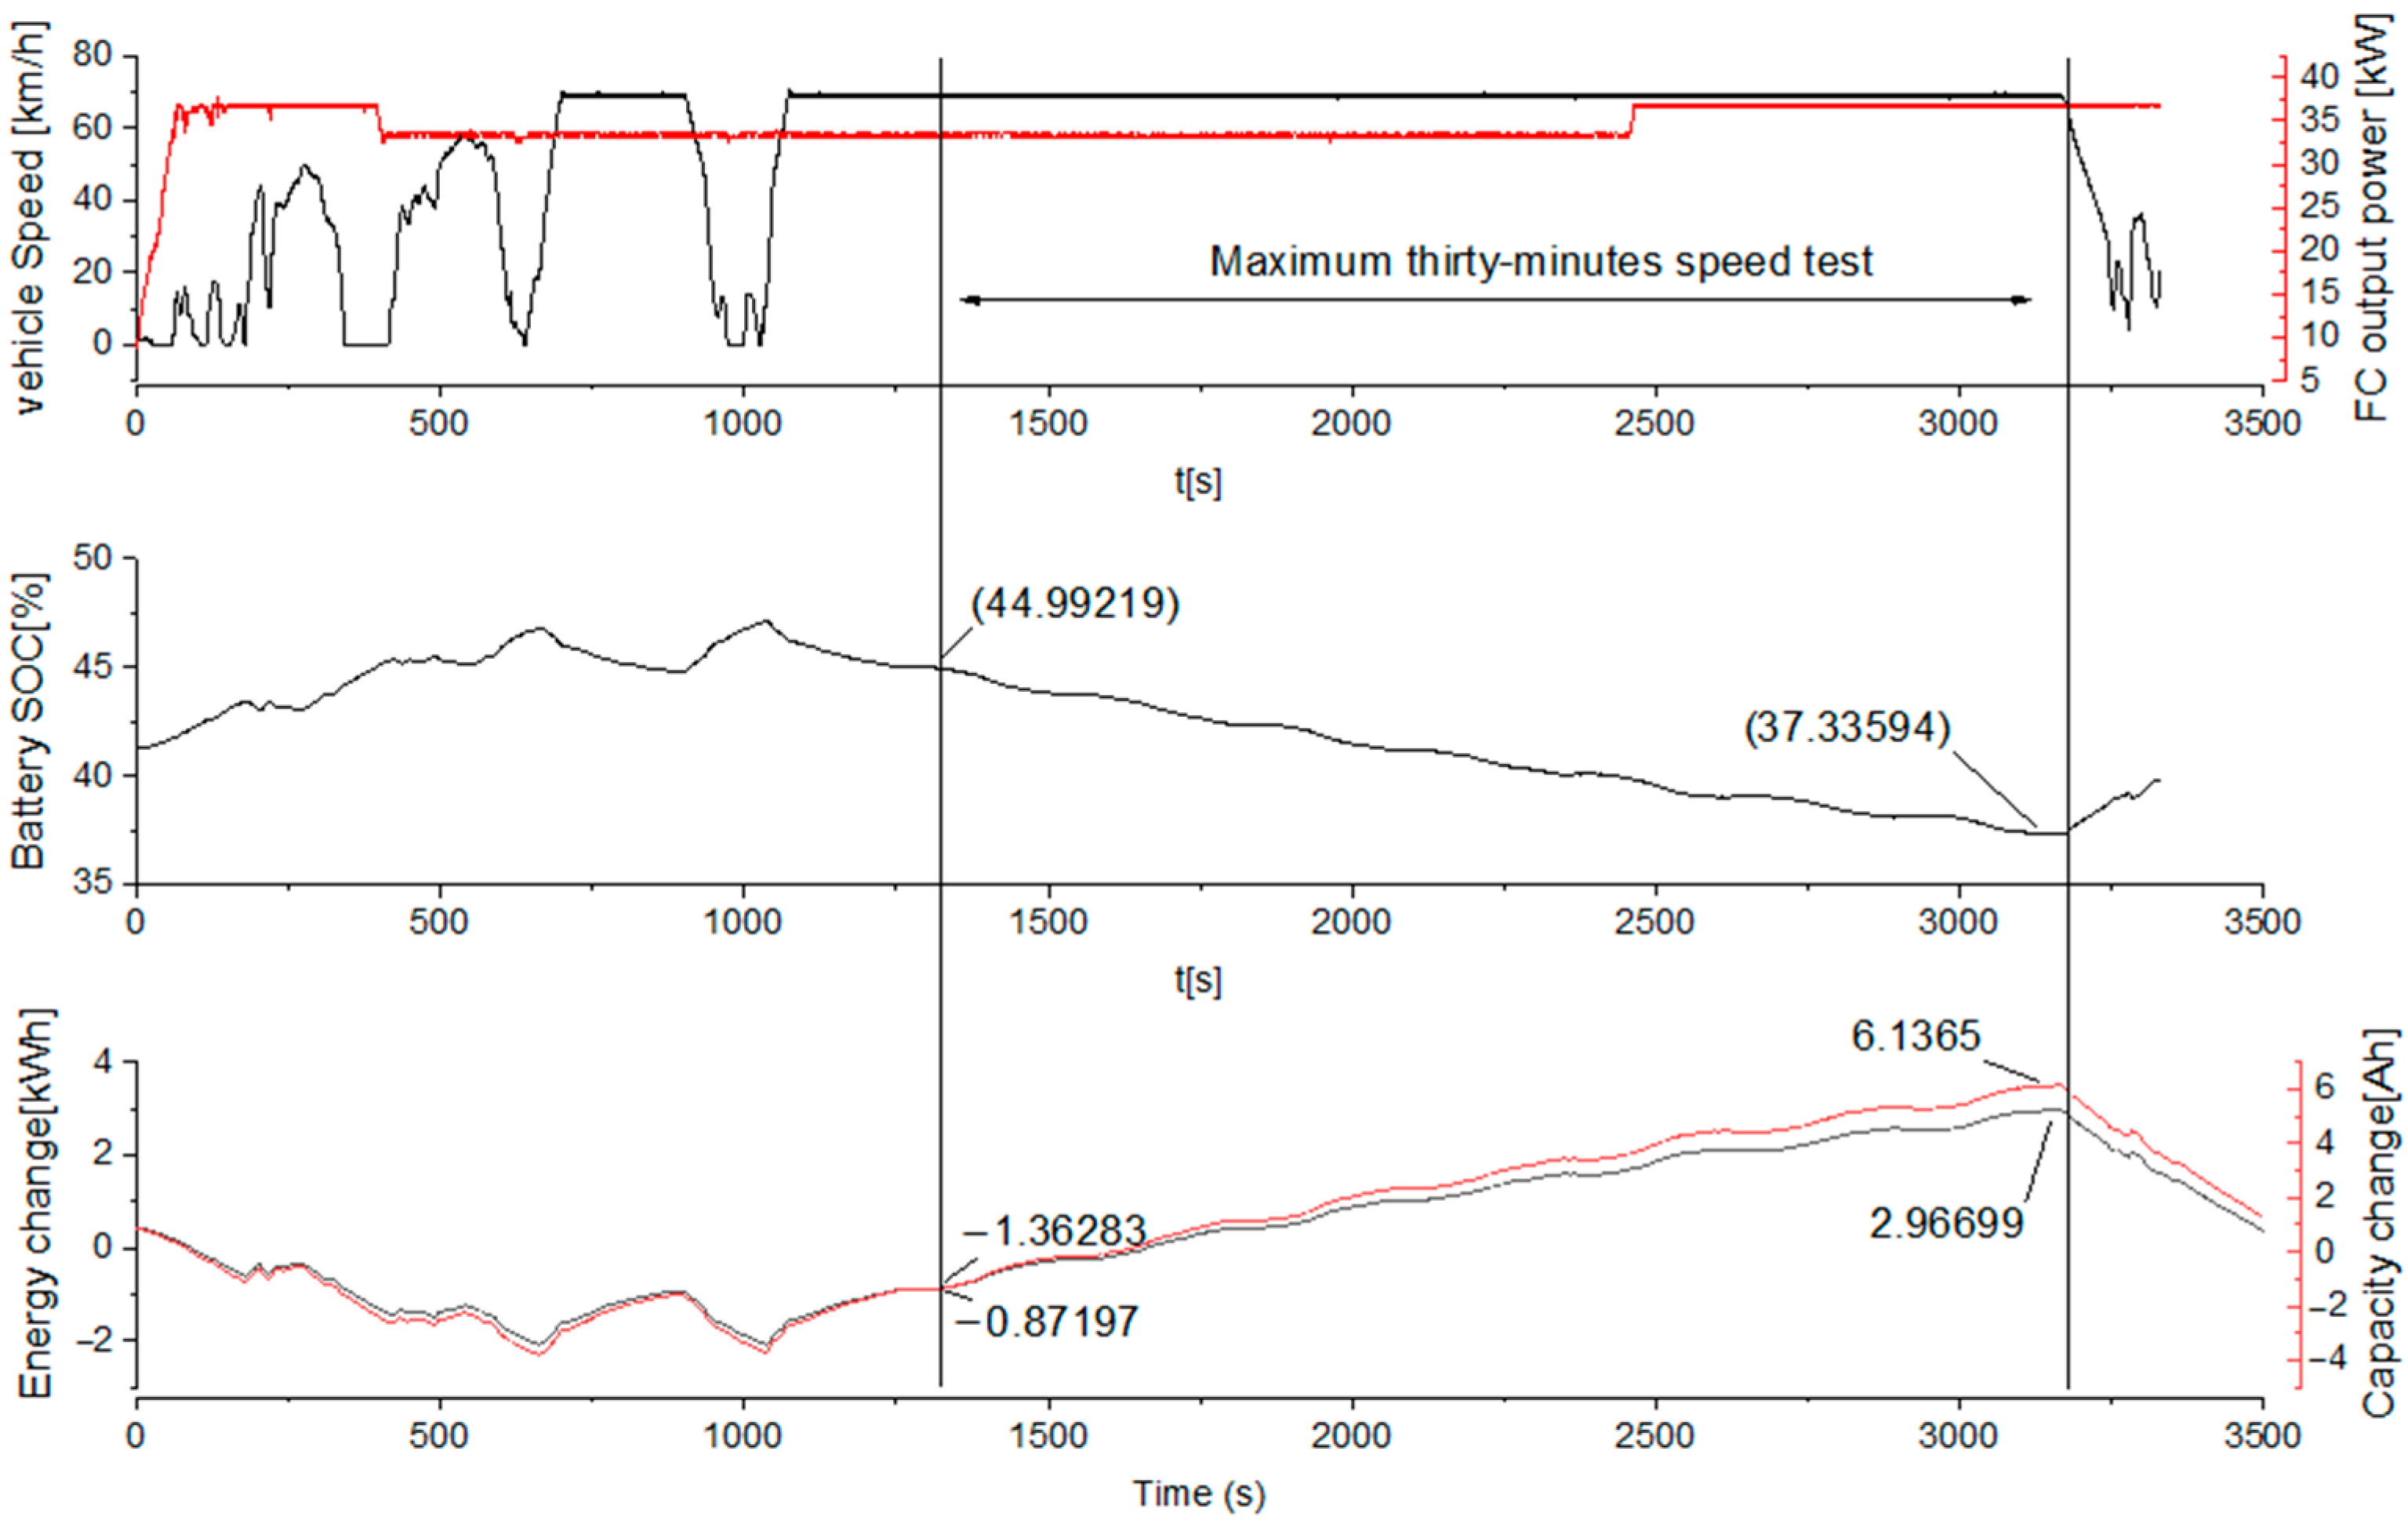
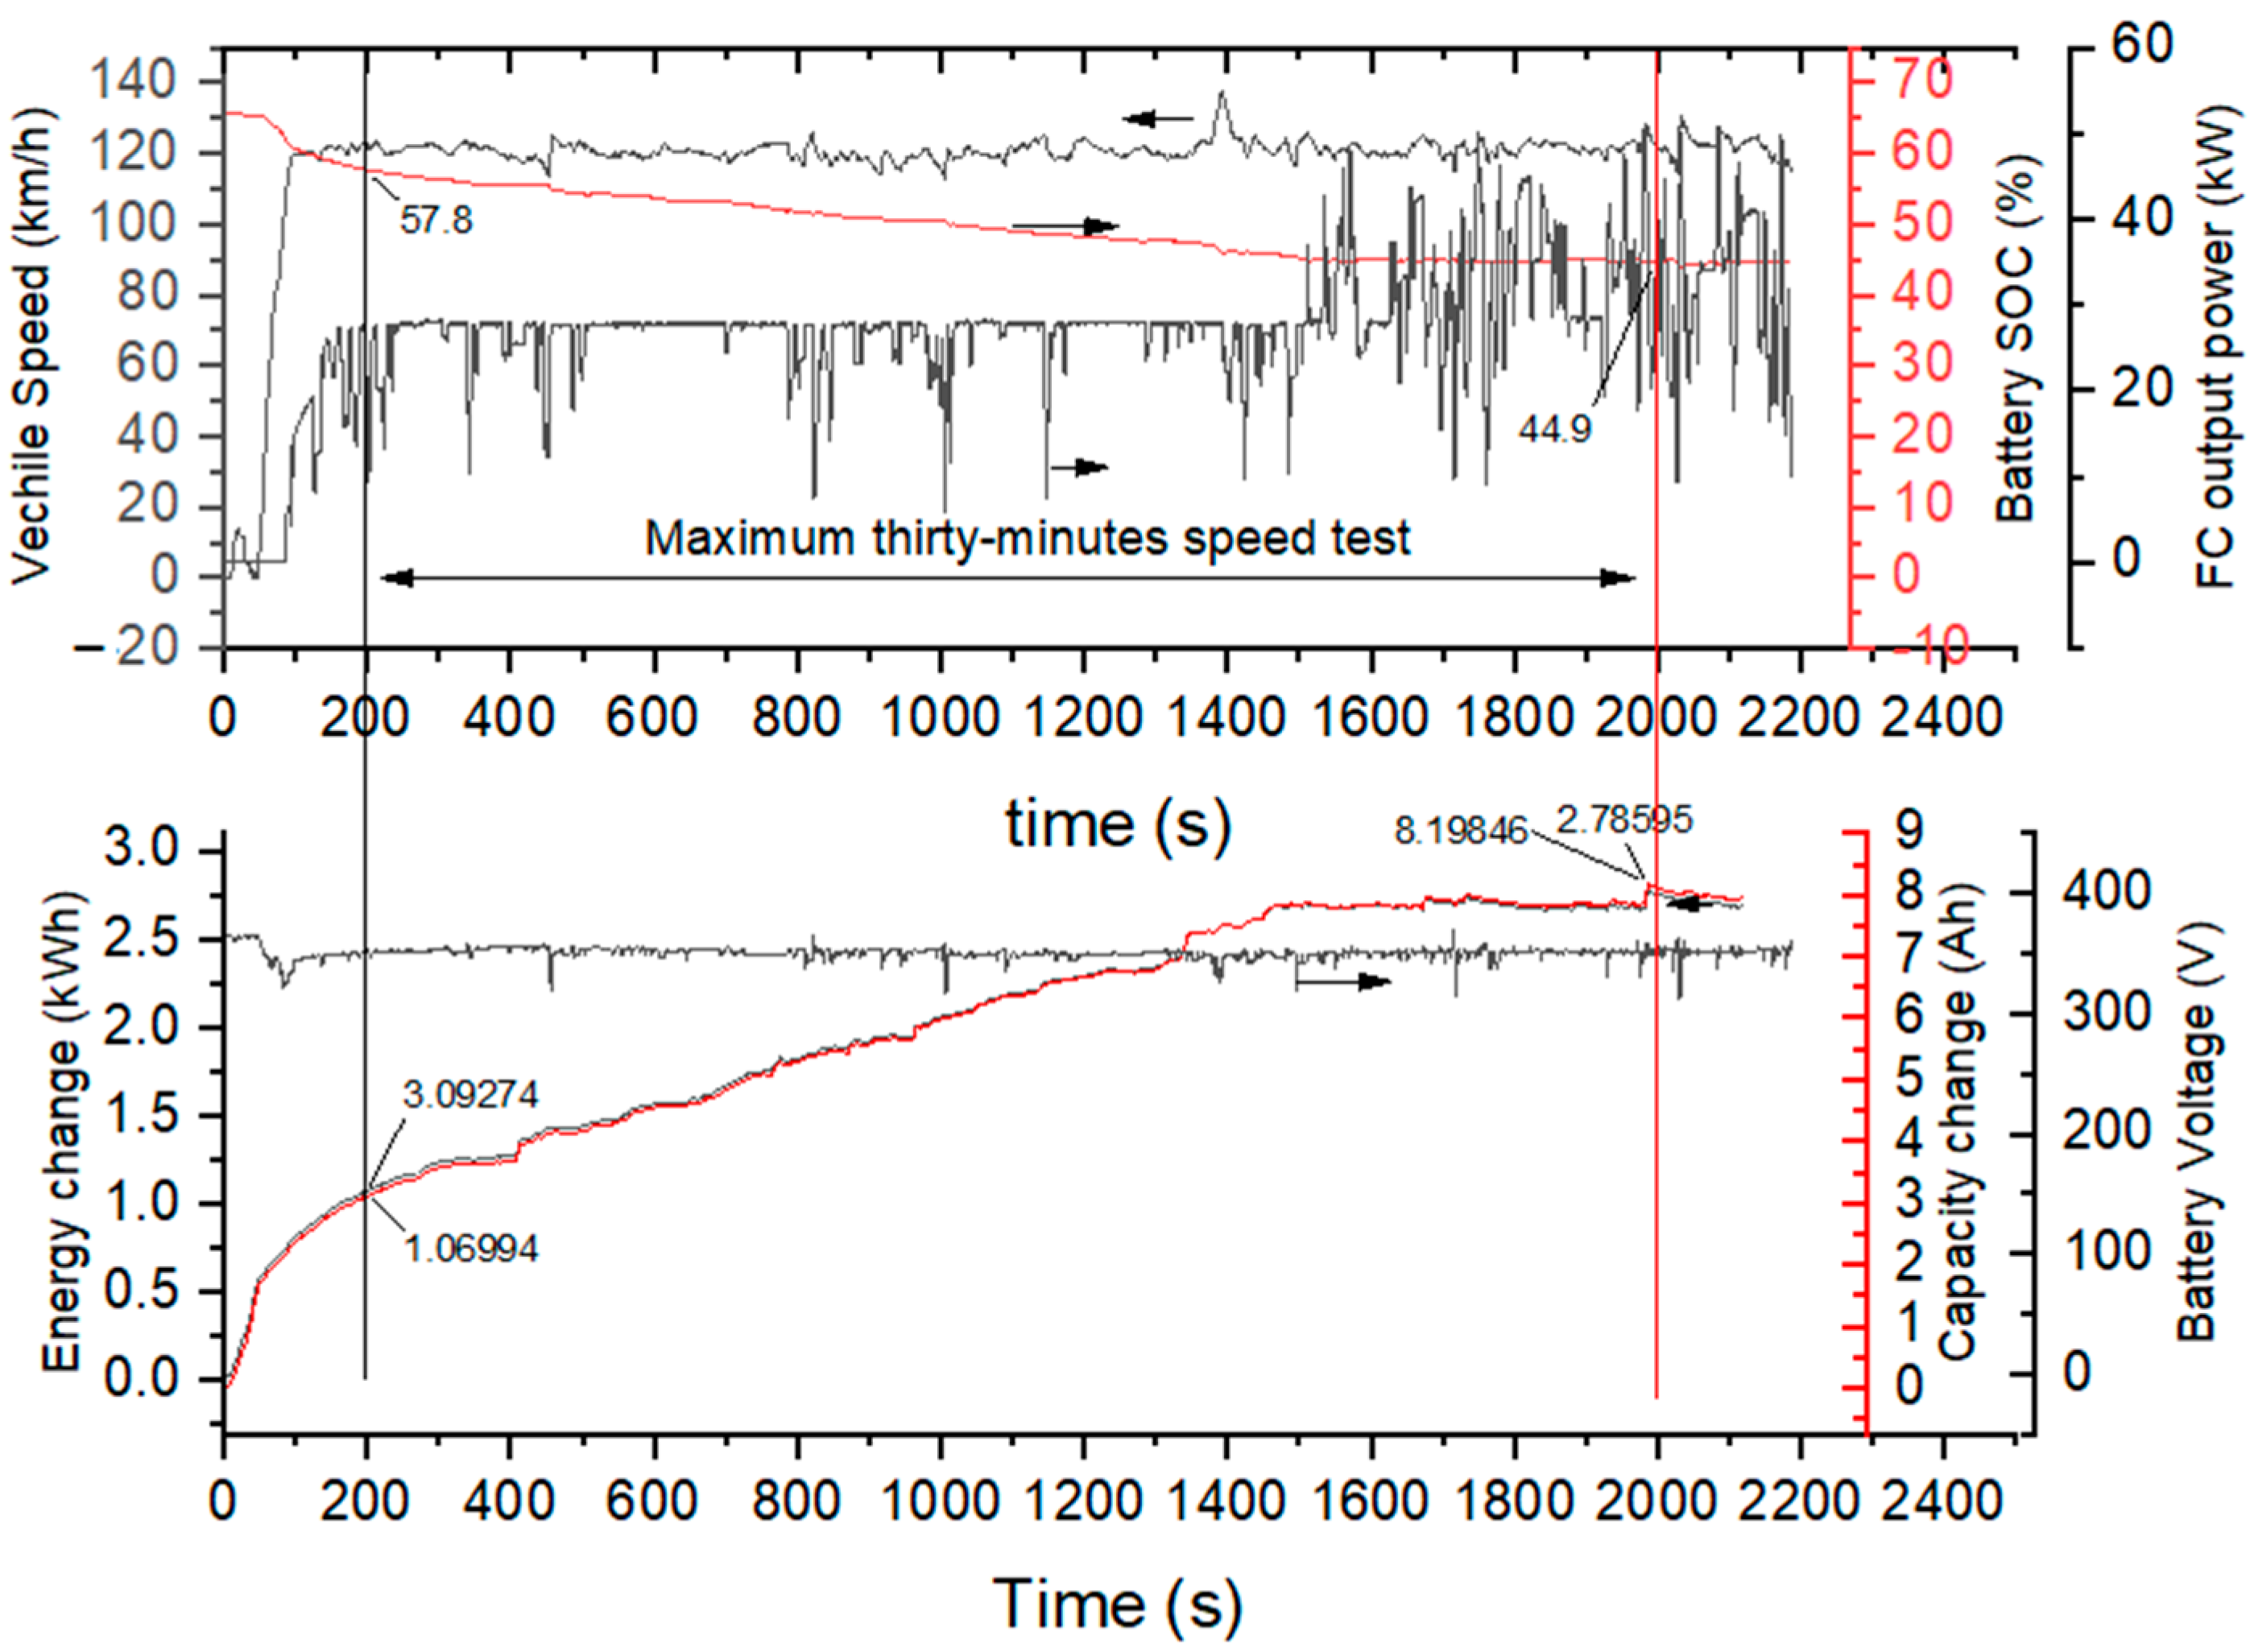
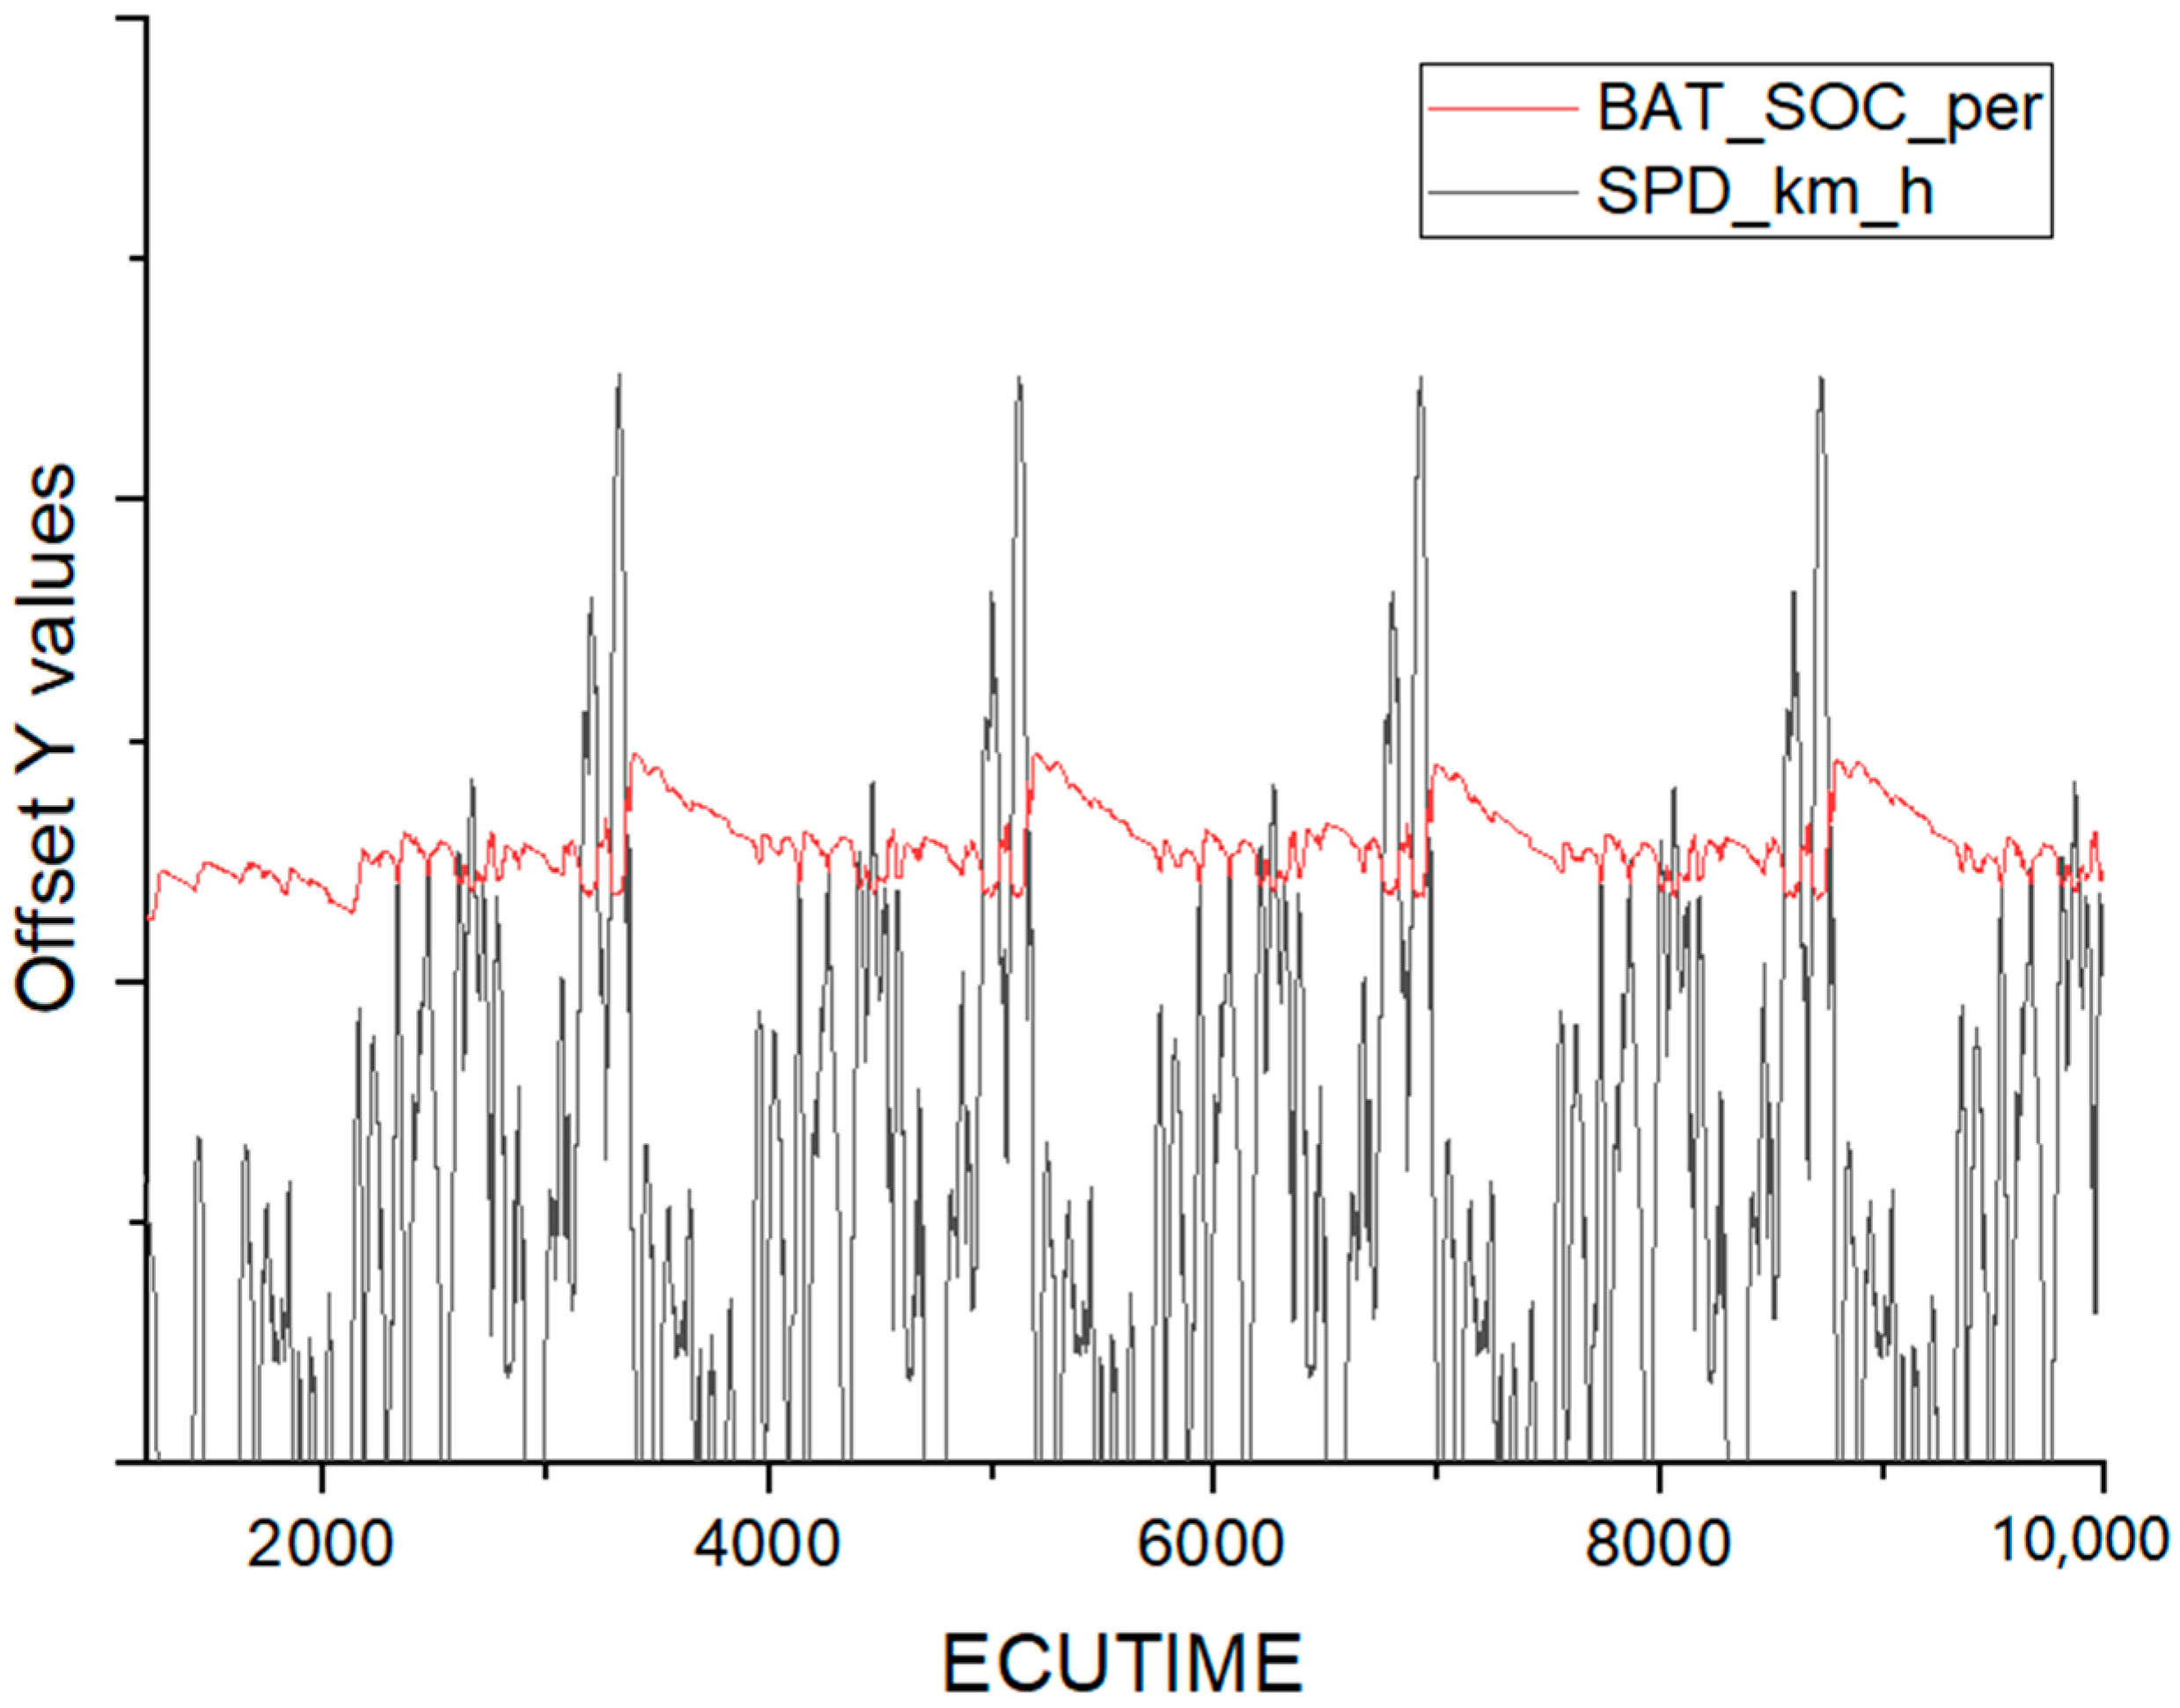
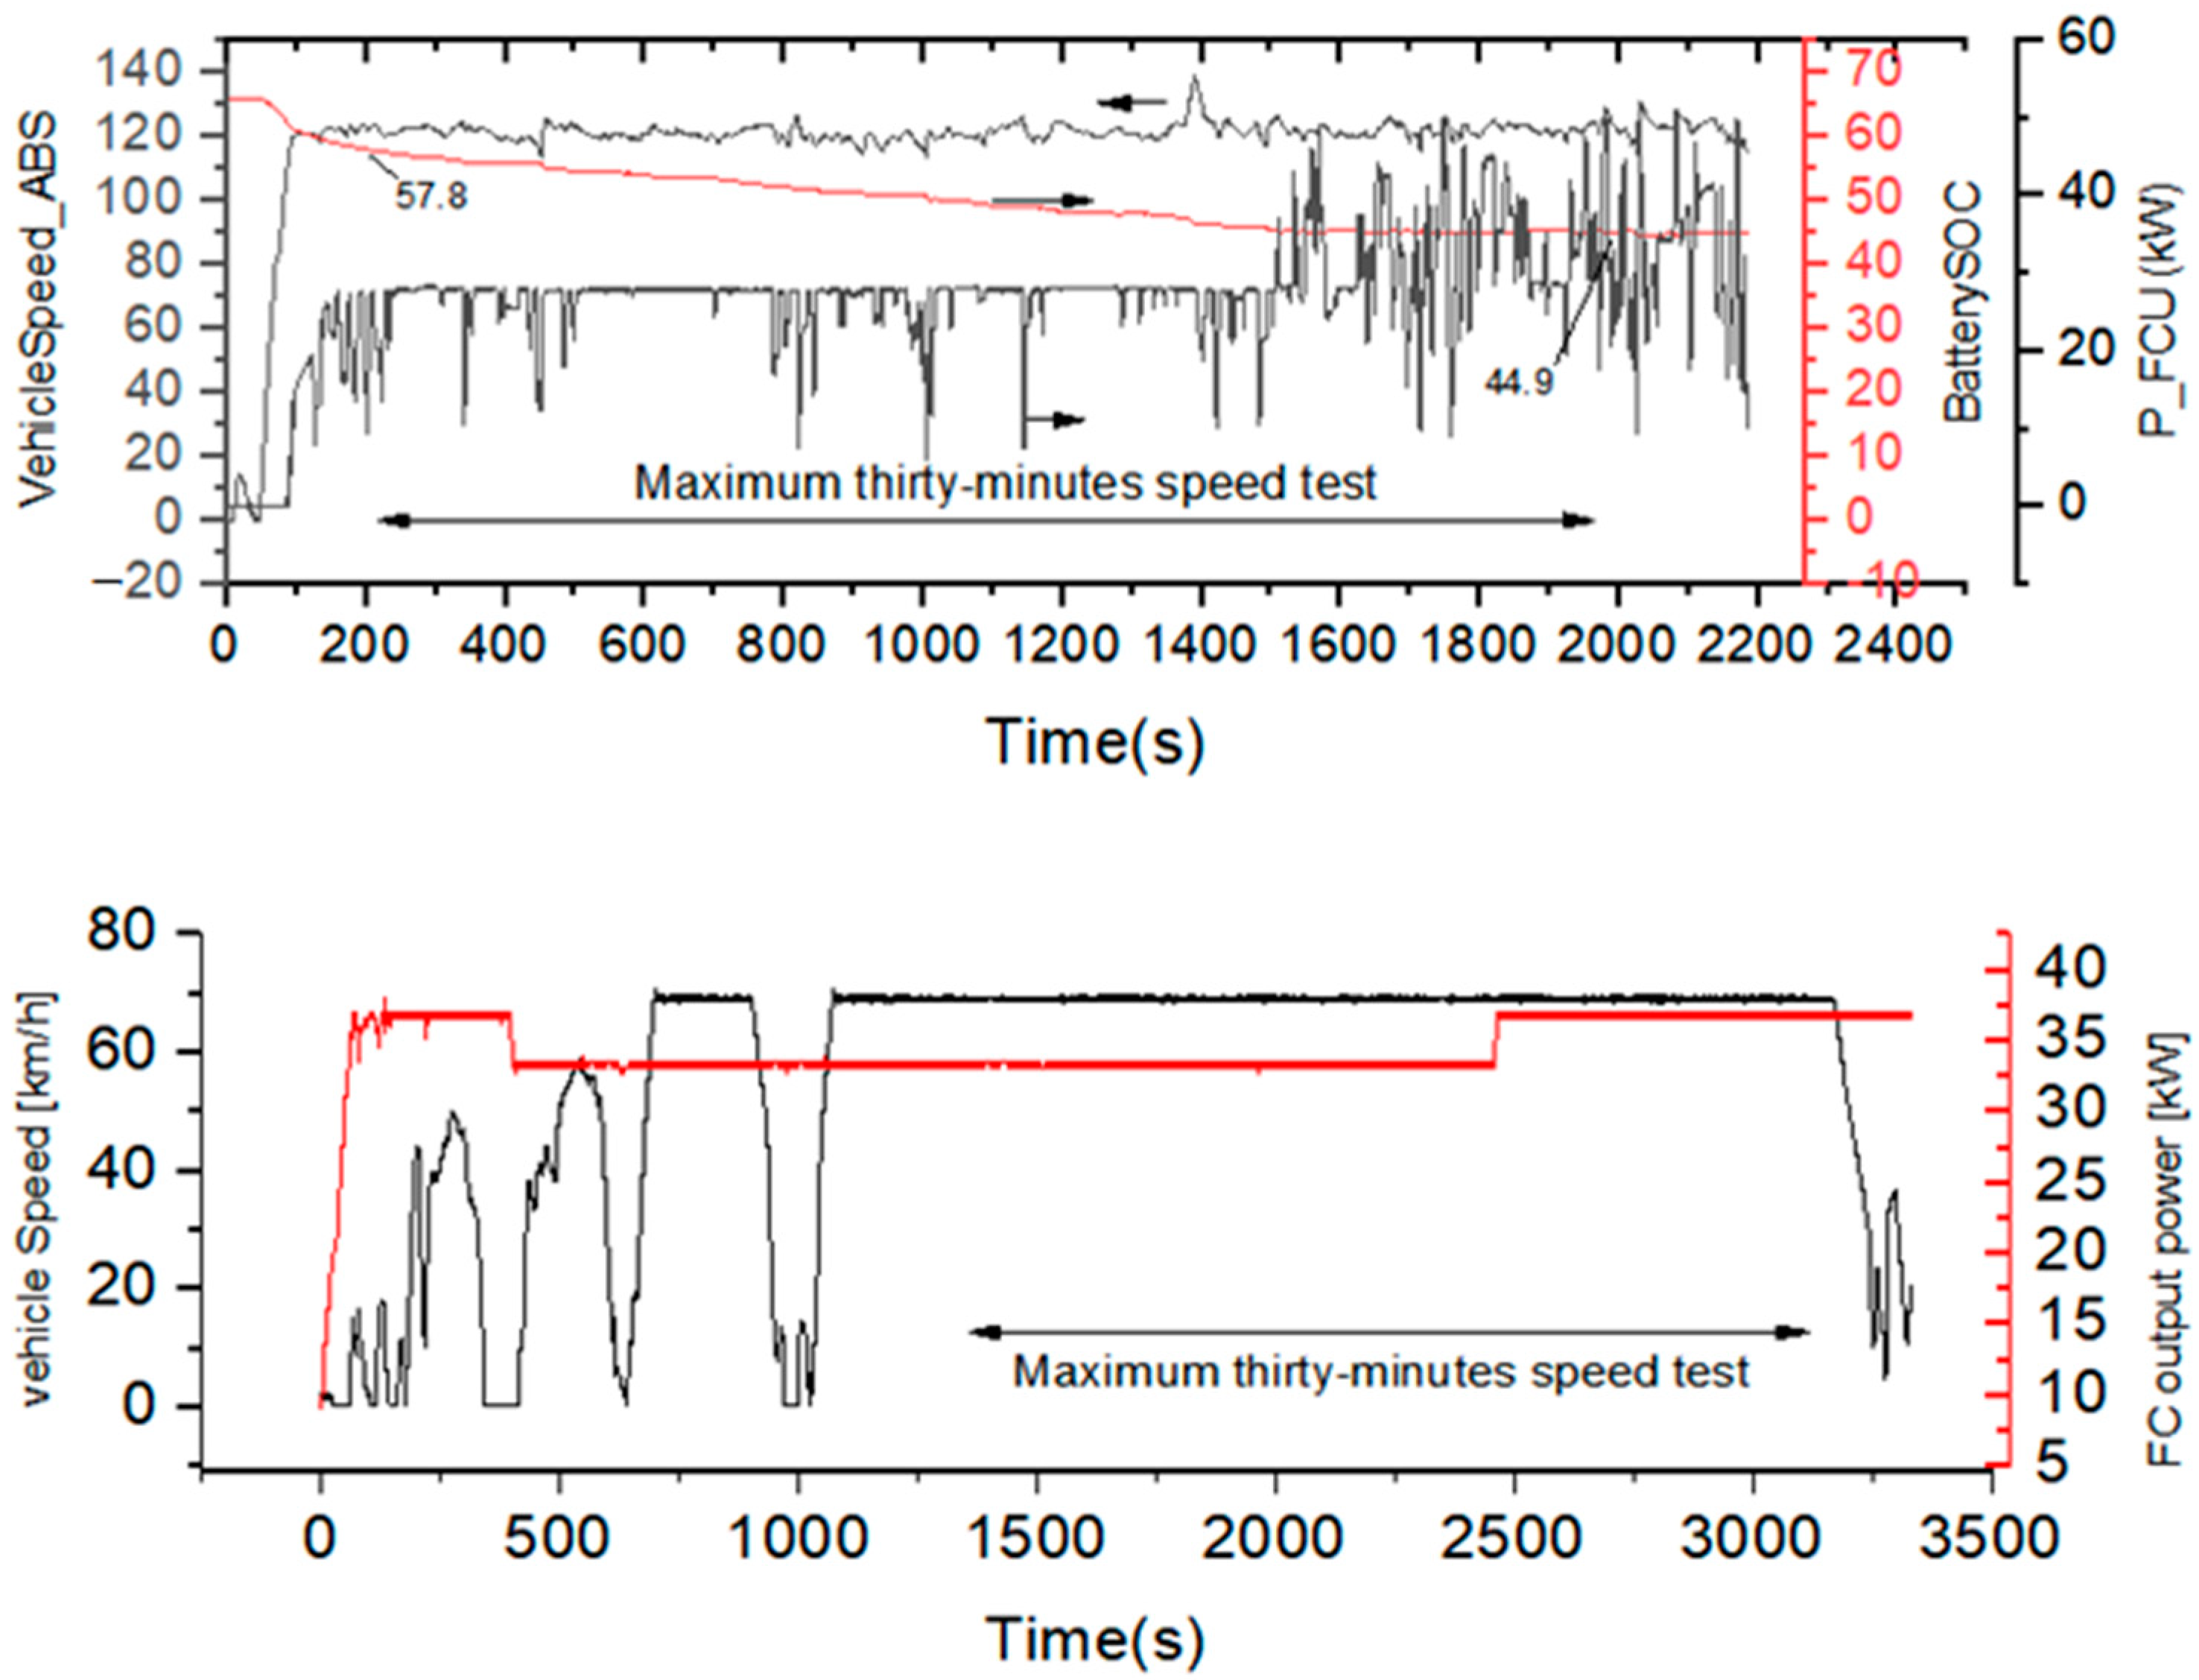
4.1.1. Maximum Thirty-Min Speed
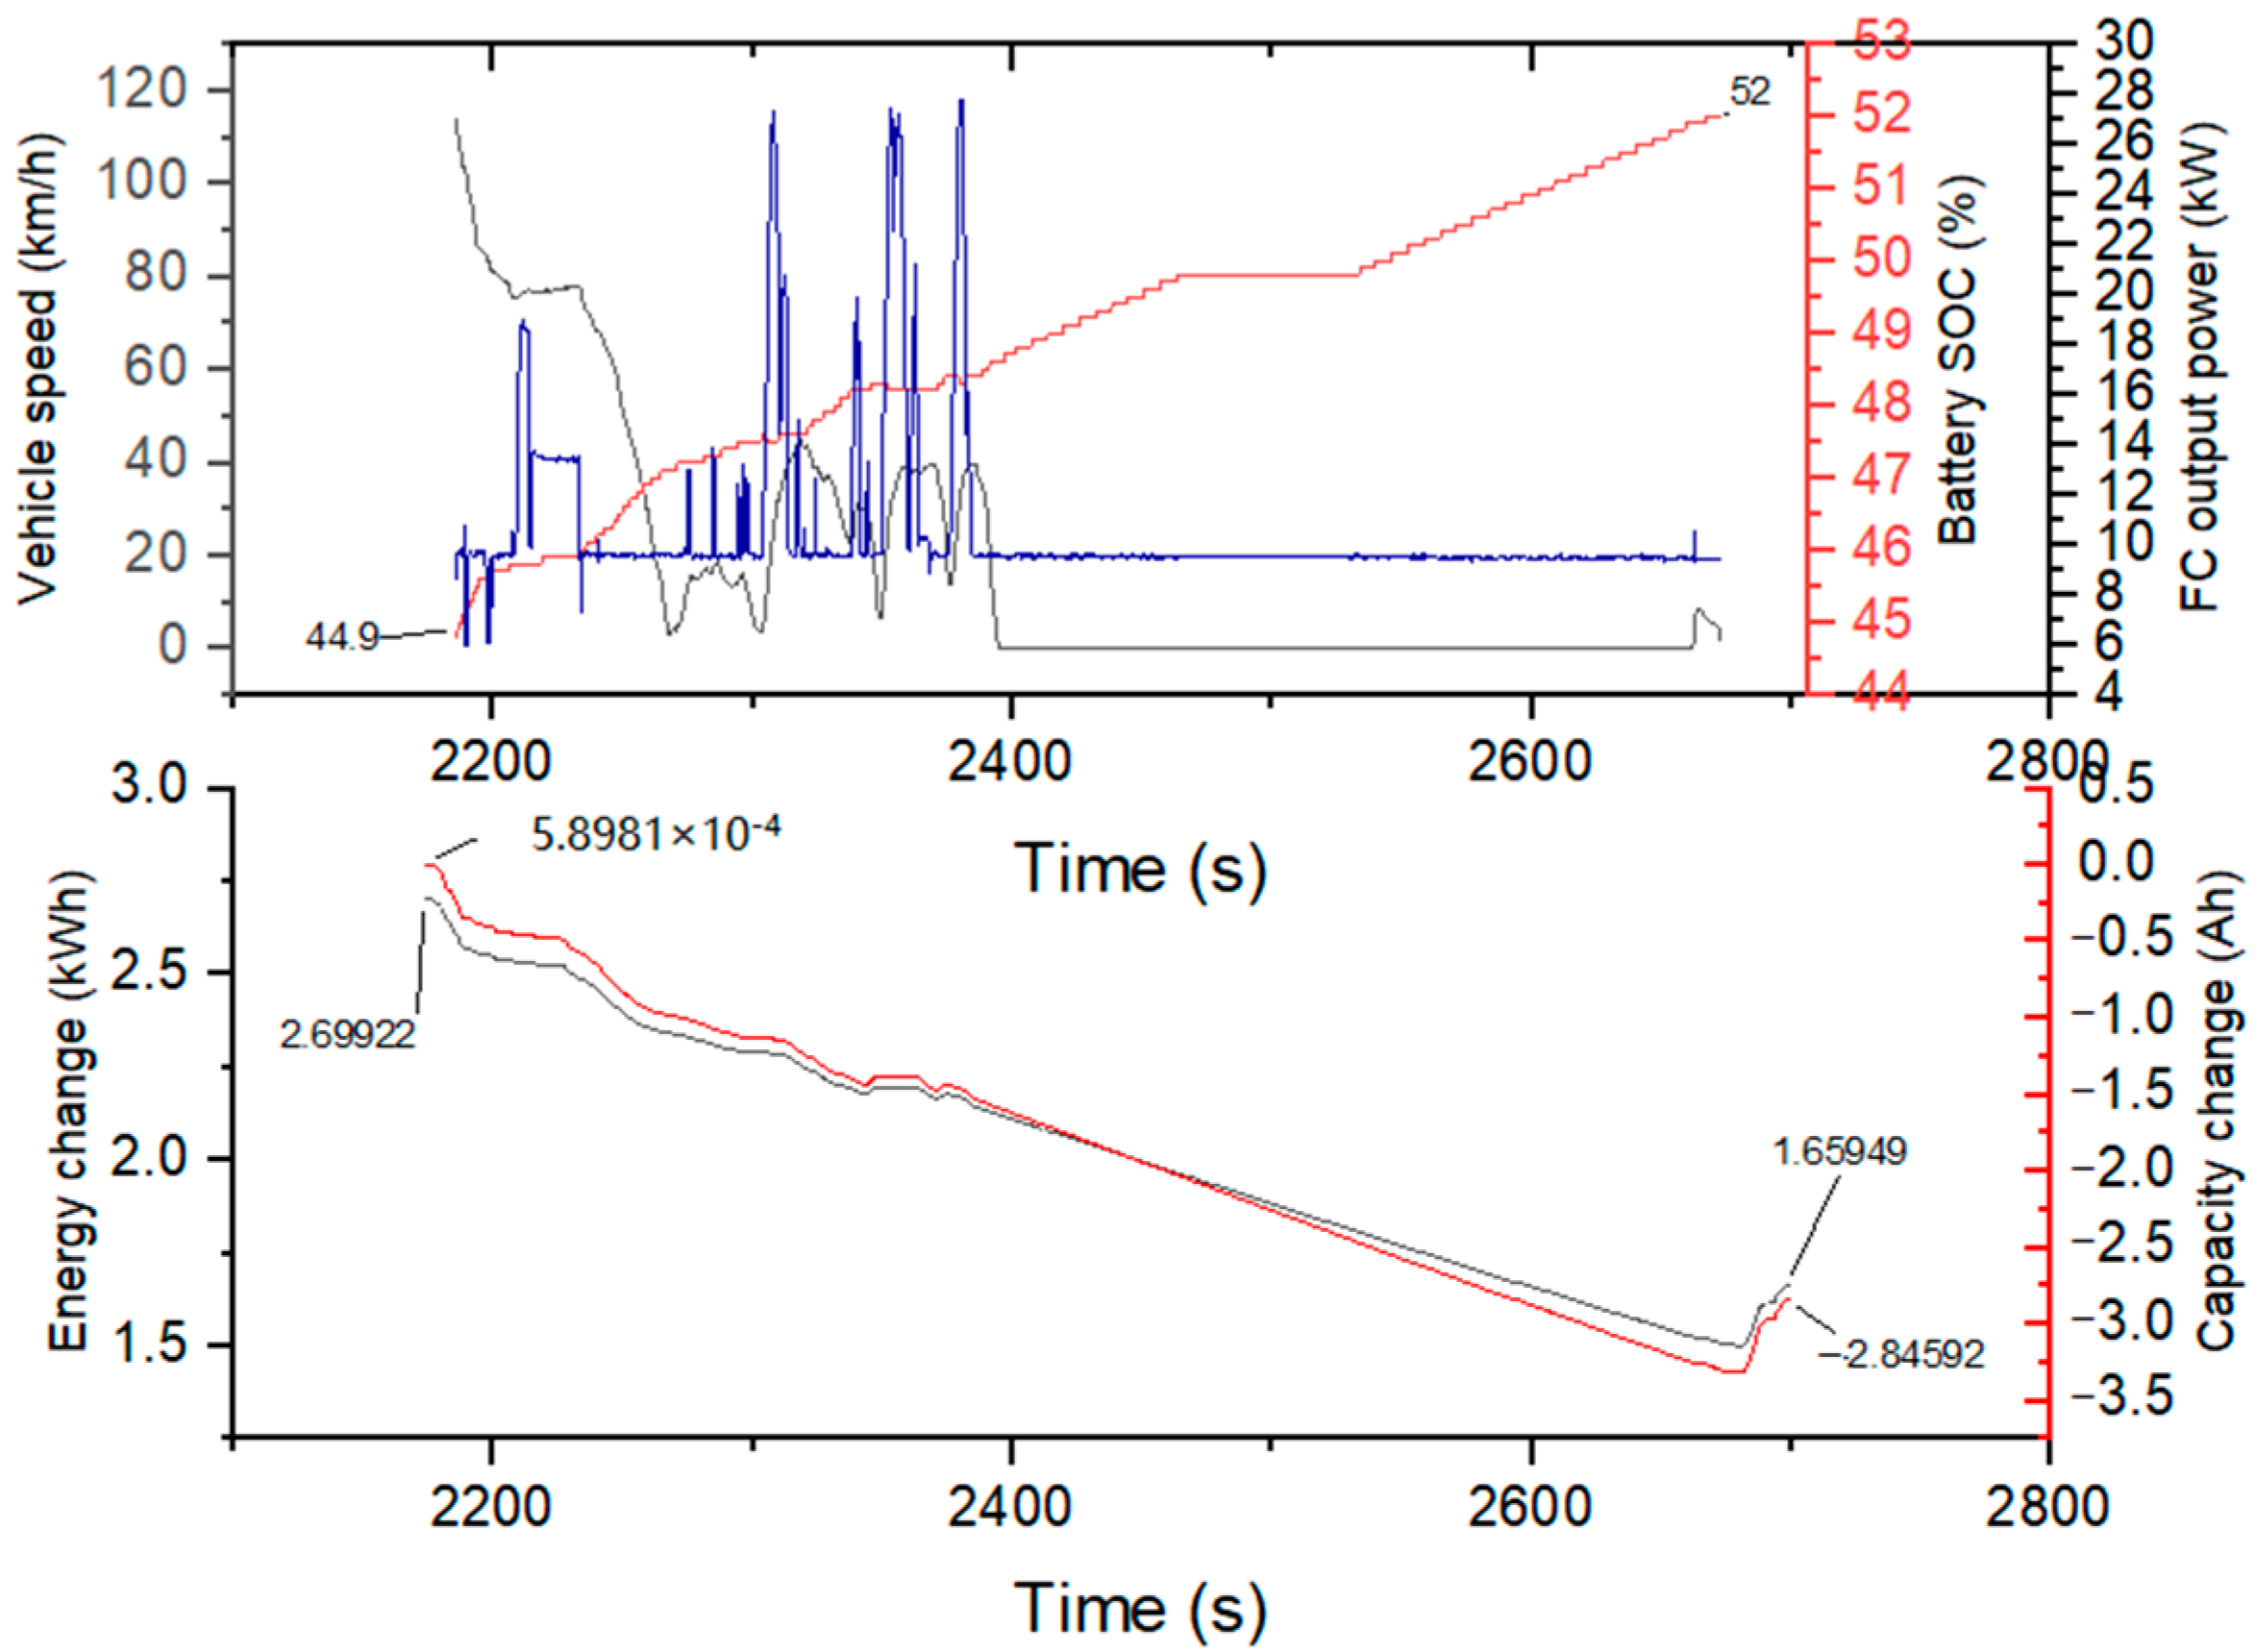
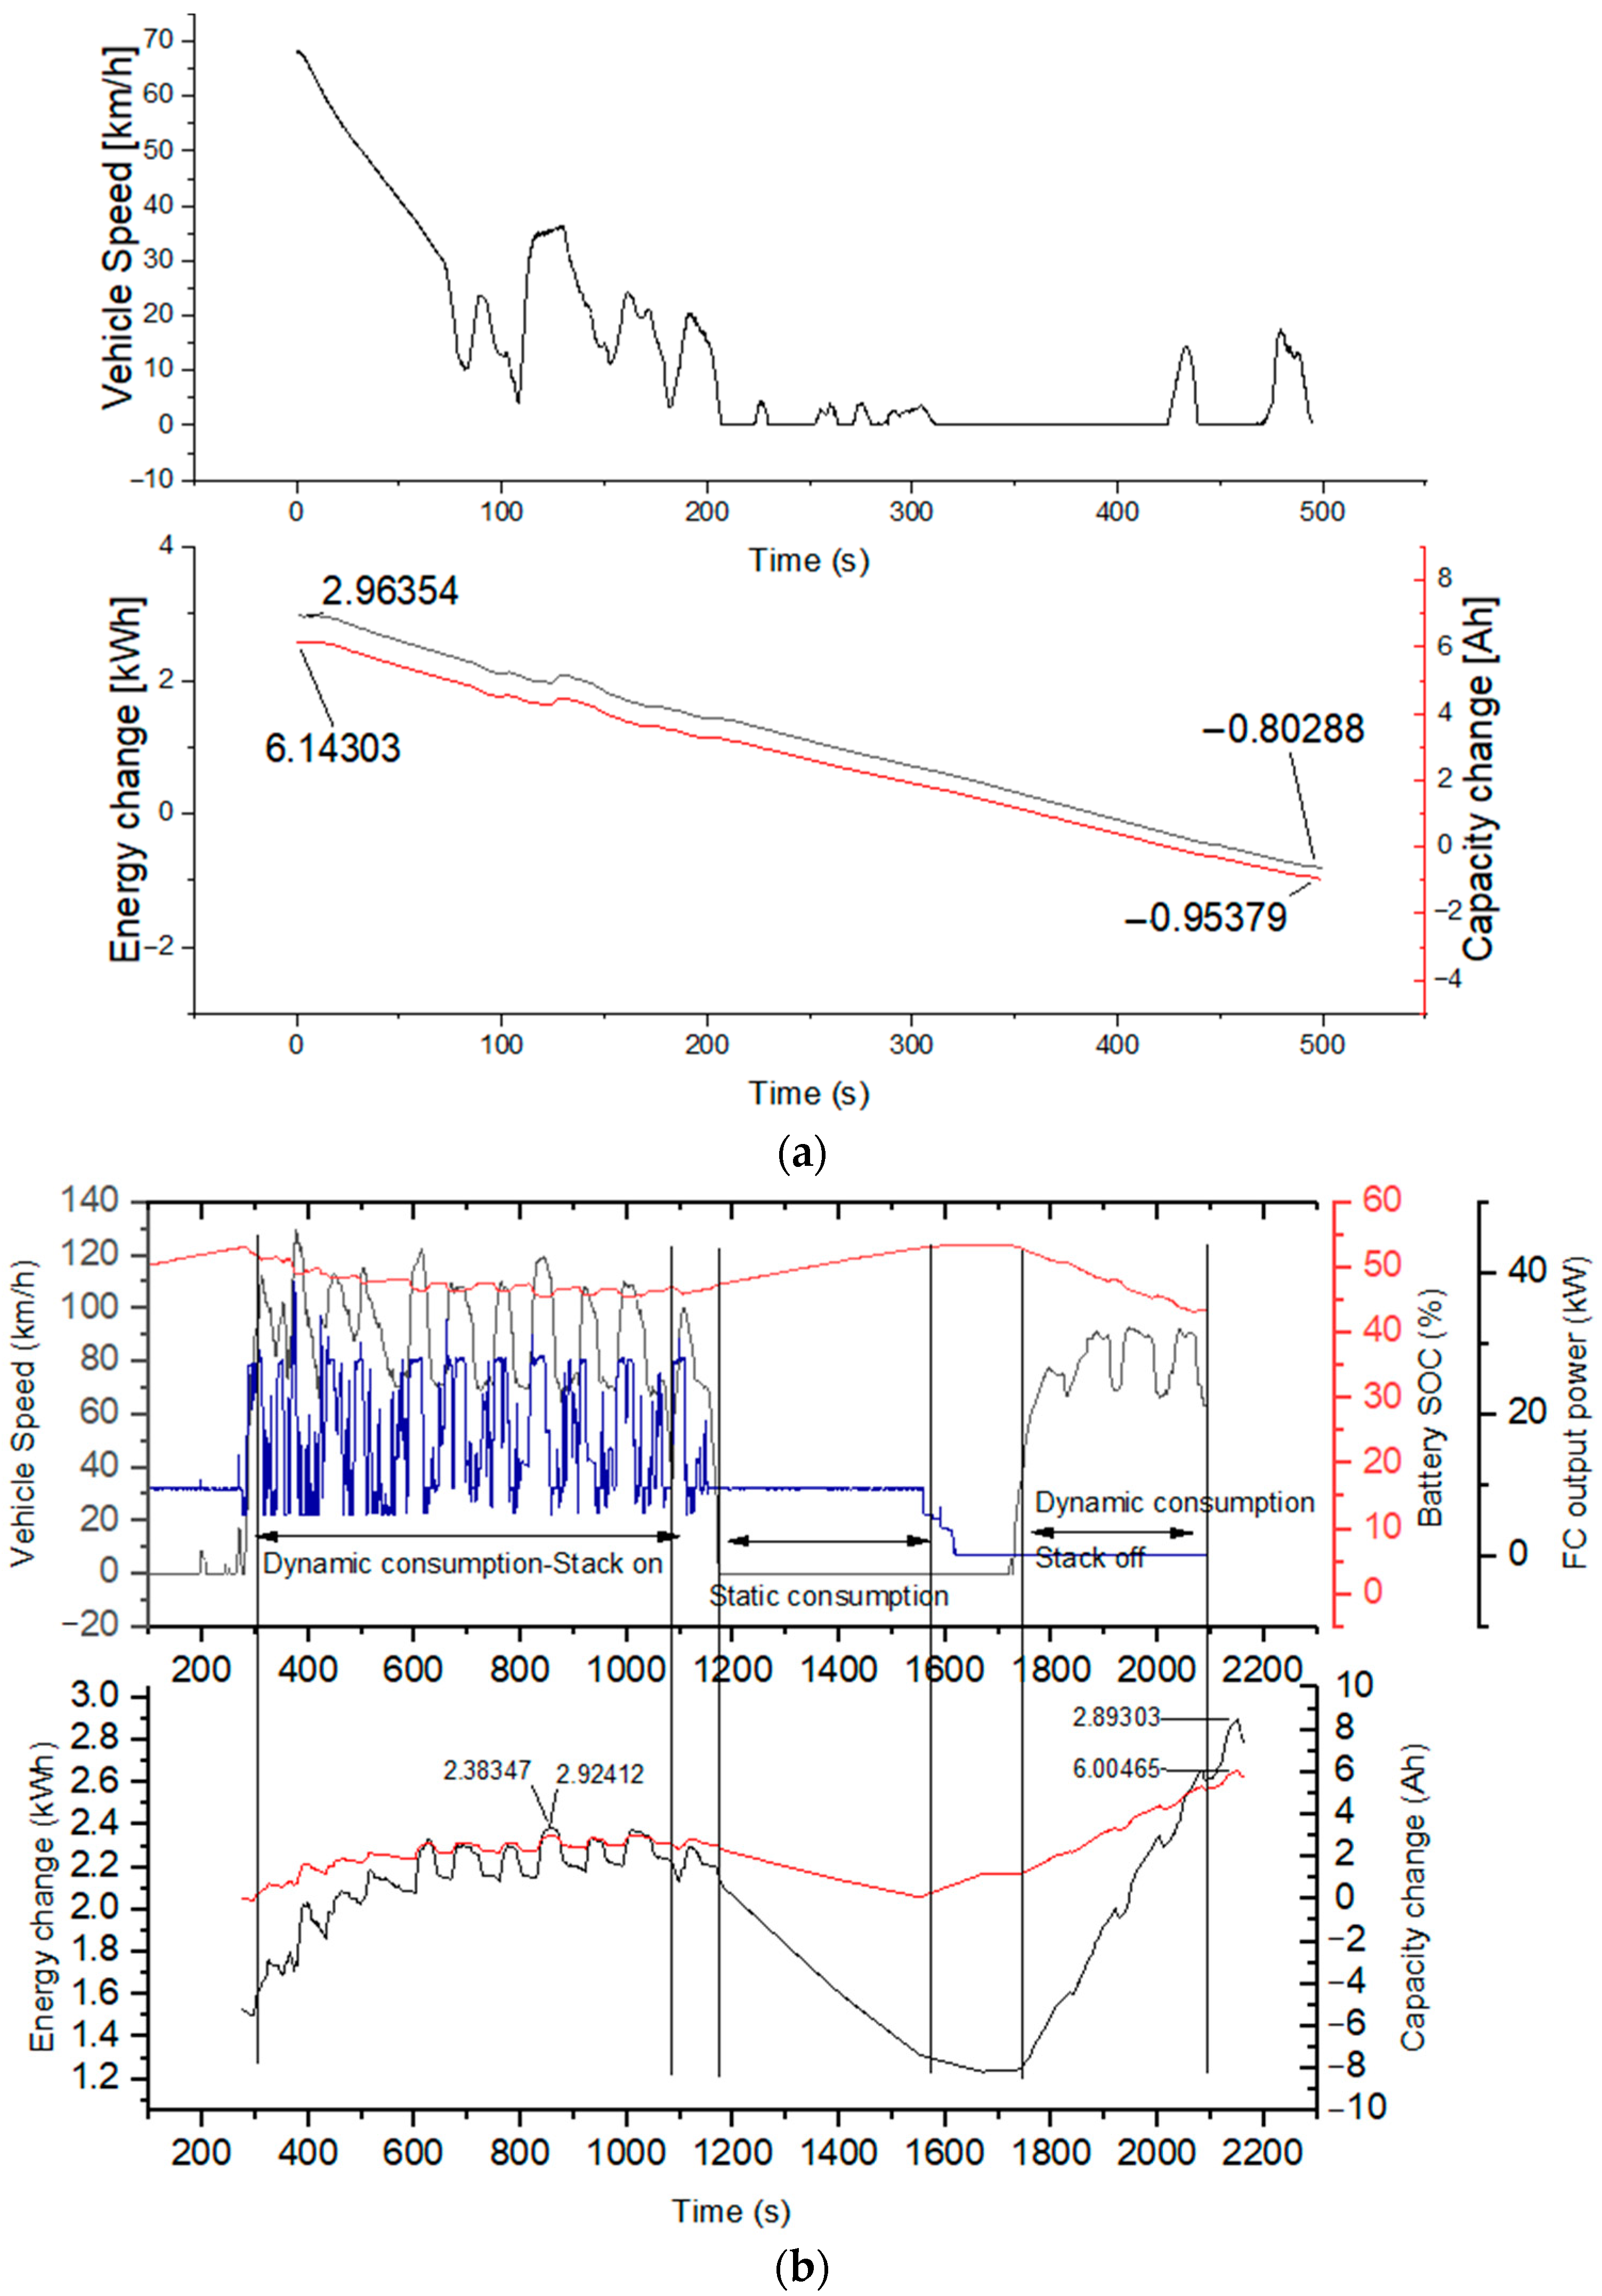
4.1.2. Adjusting SOC
4.1.3. Acceleration Test
4.1.4. Summary of the Stepped Power Control Strategy
4.2. The Following Power Control Strategy Vehicle
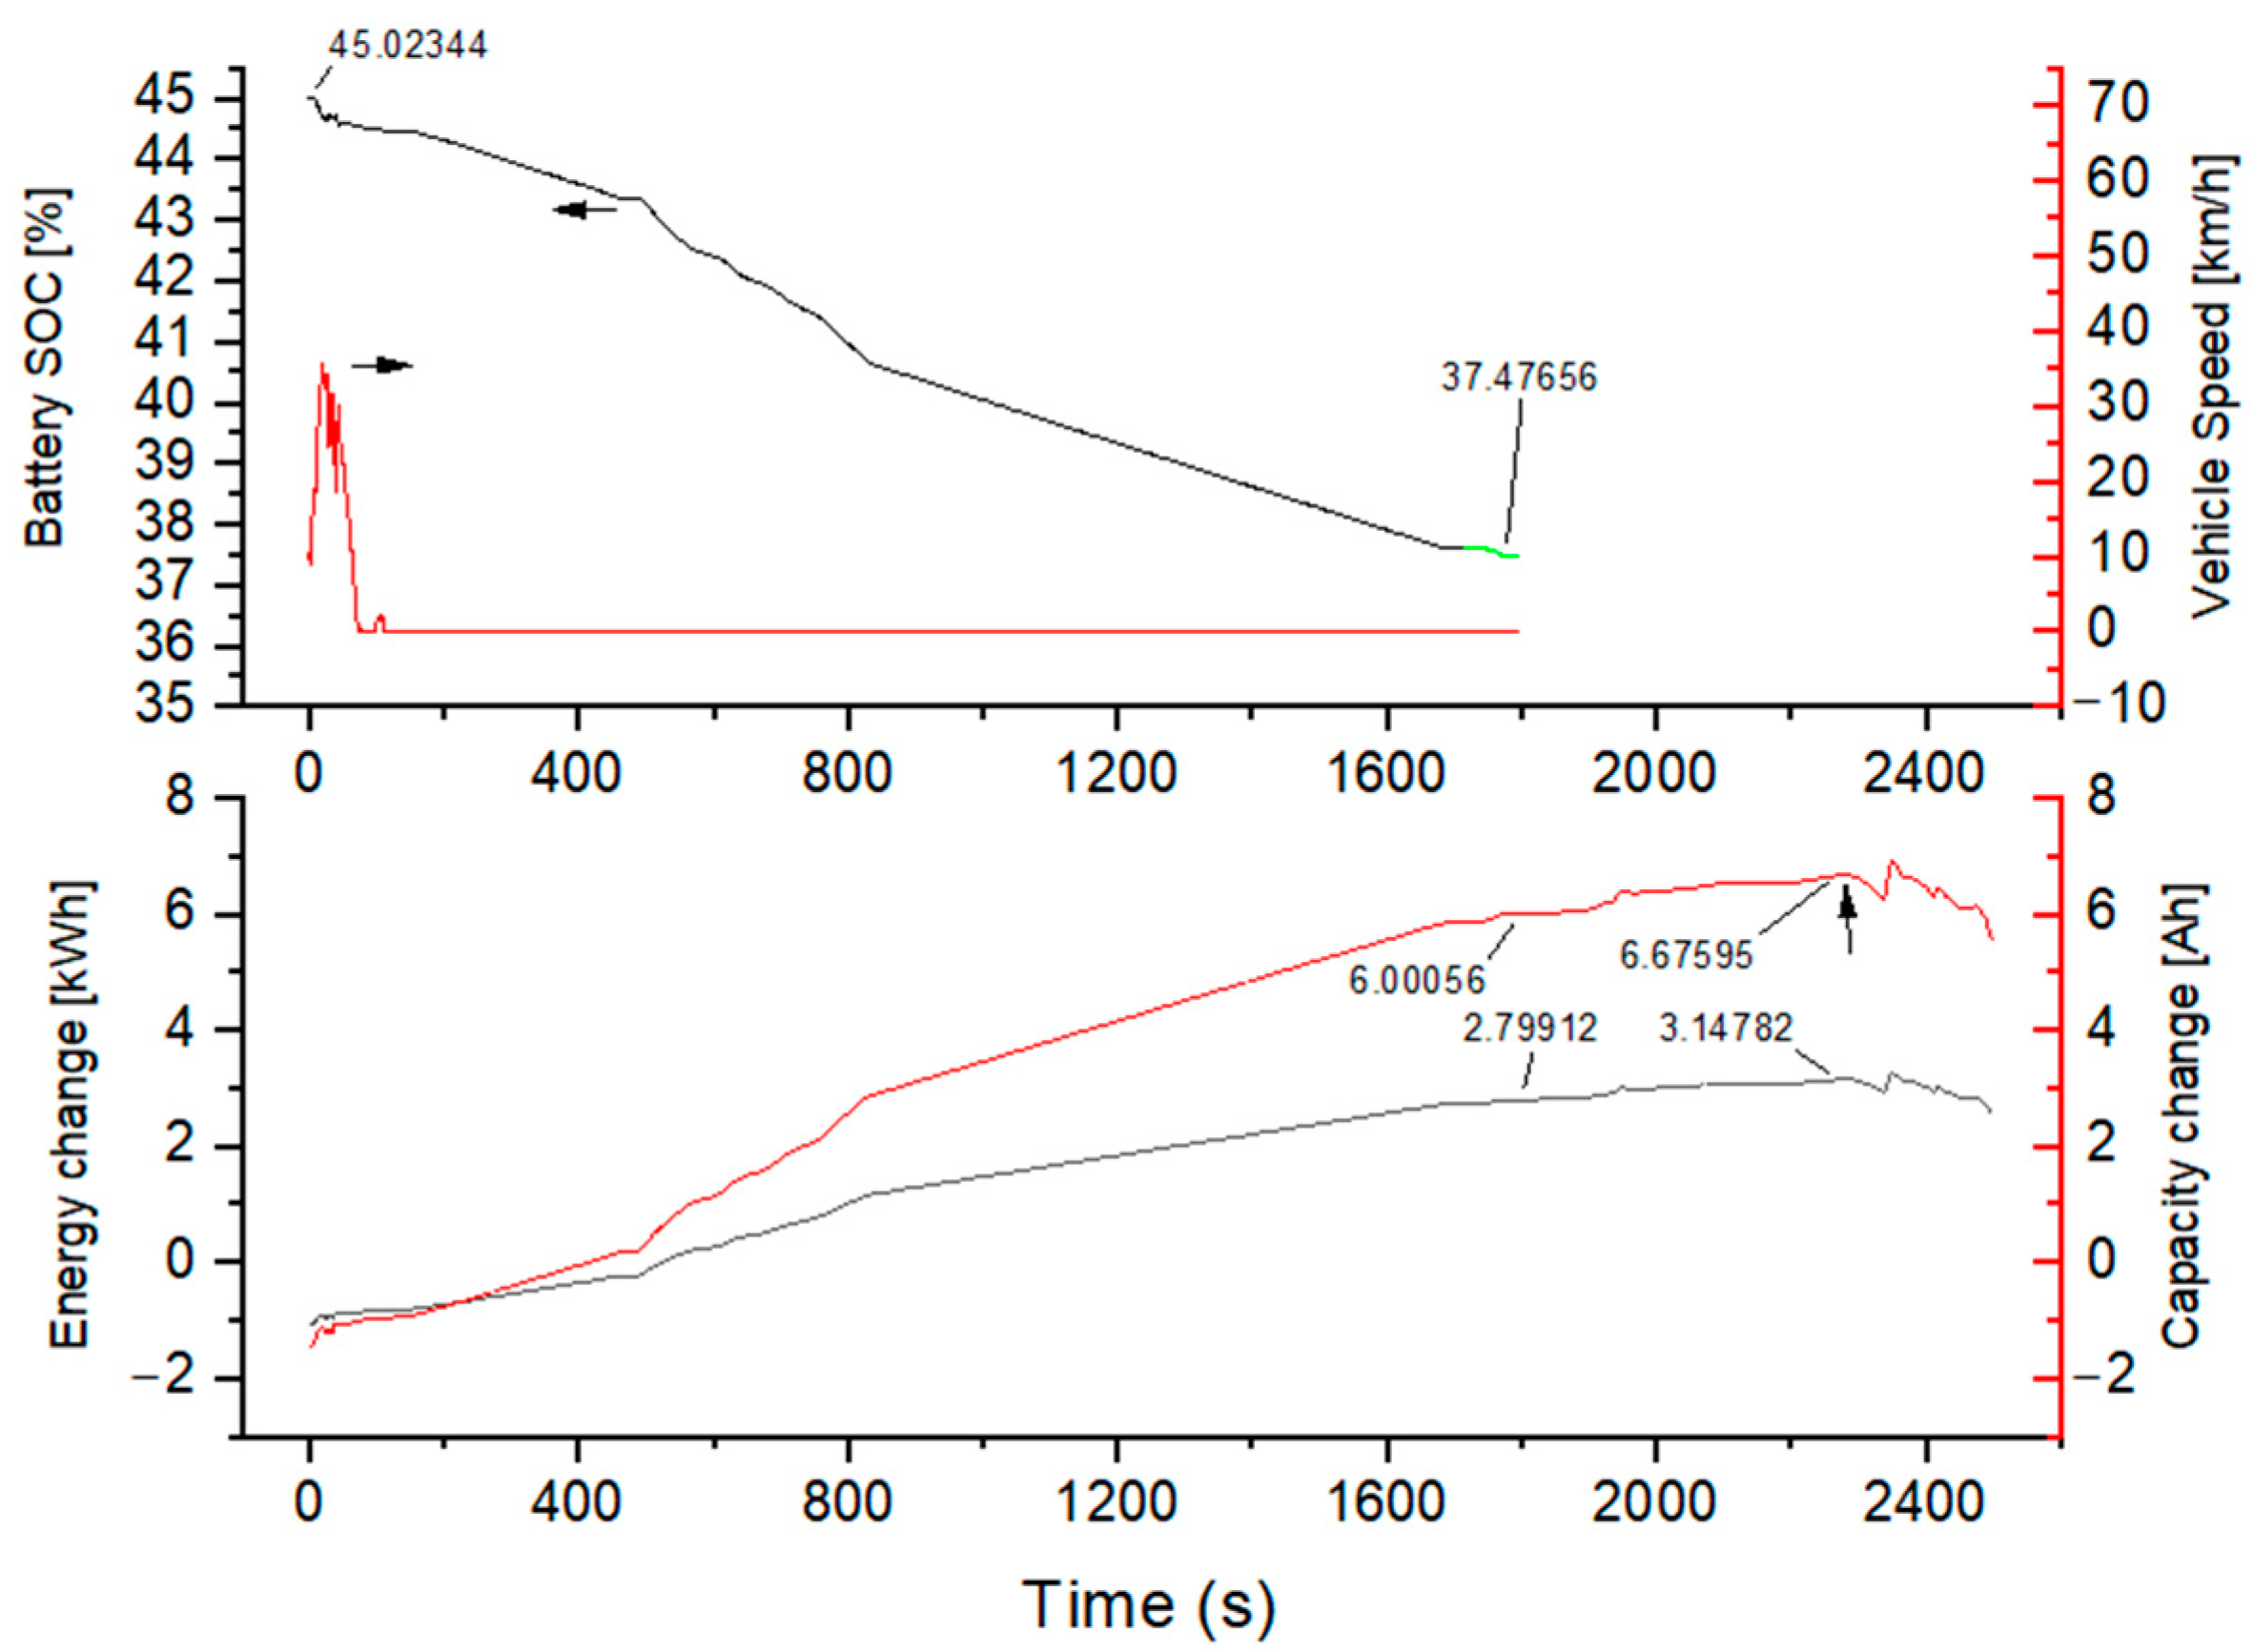
4.2.1. Maximum Thirty-Min Speed
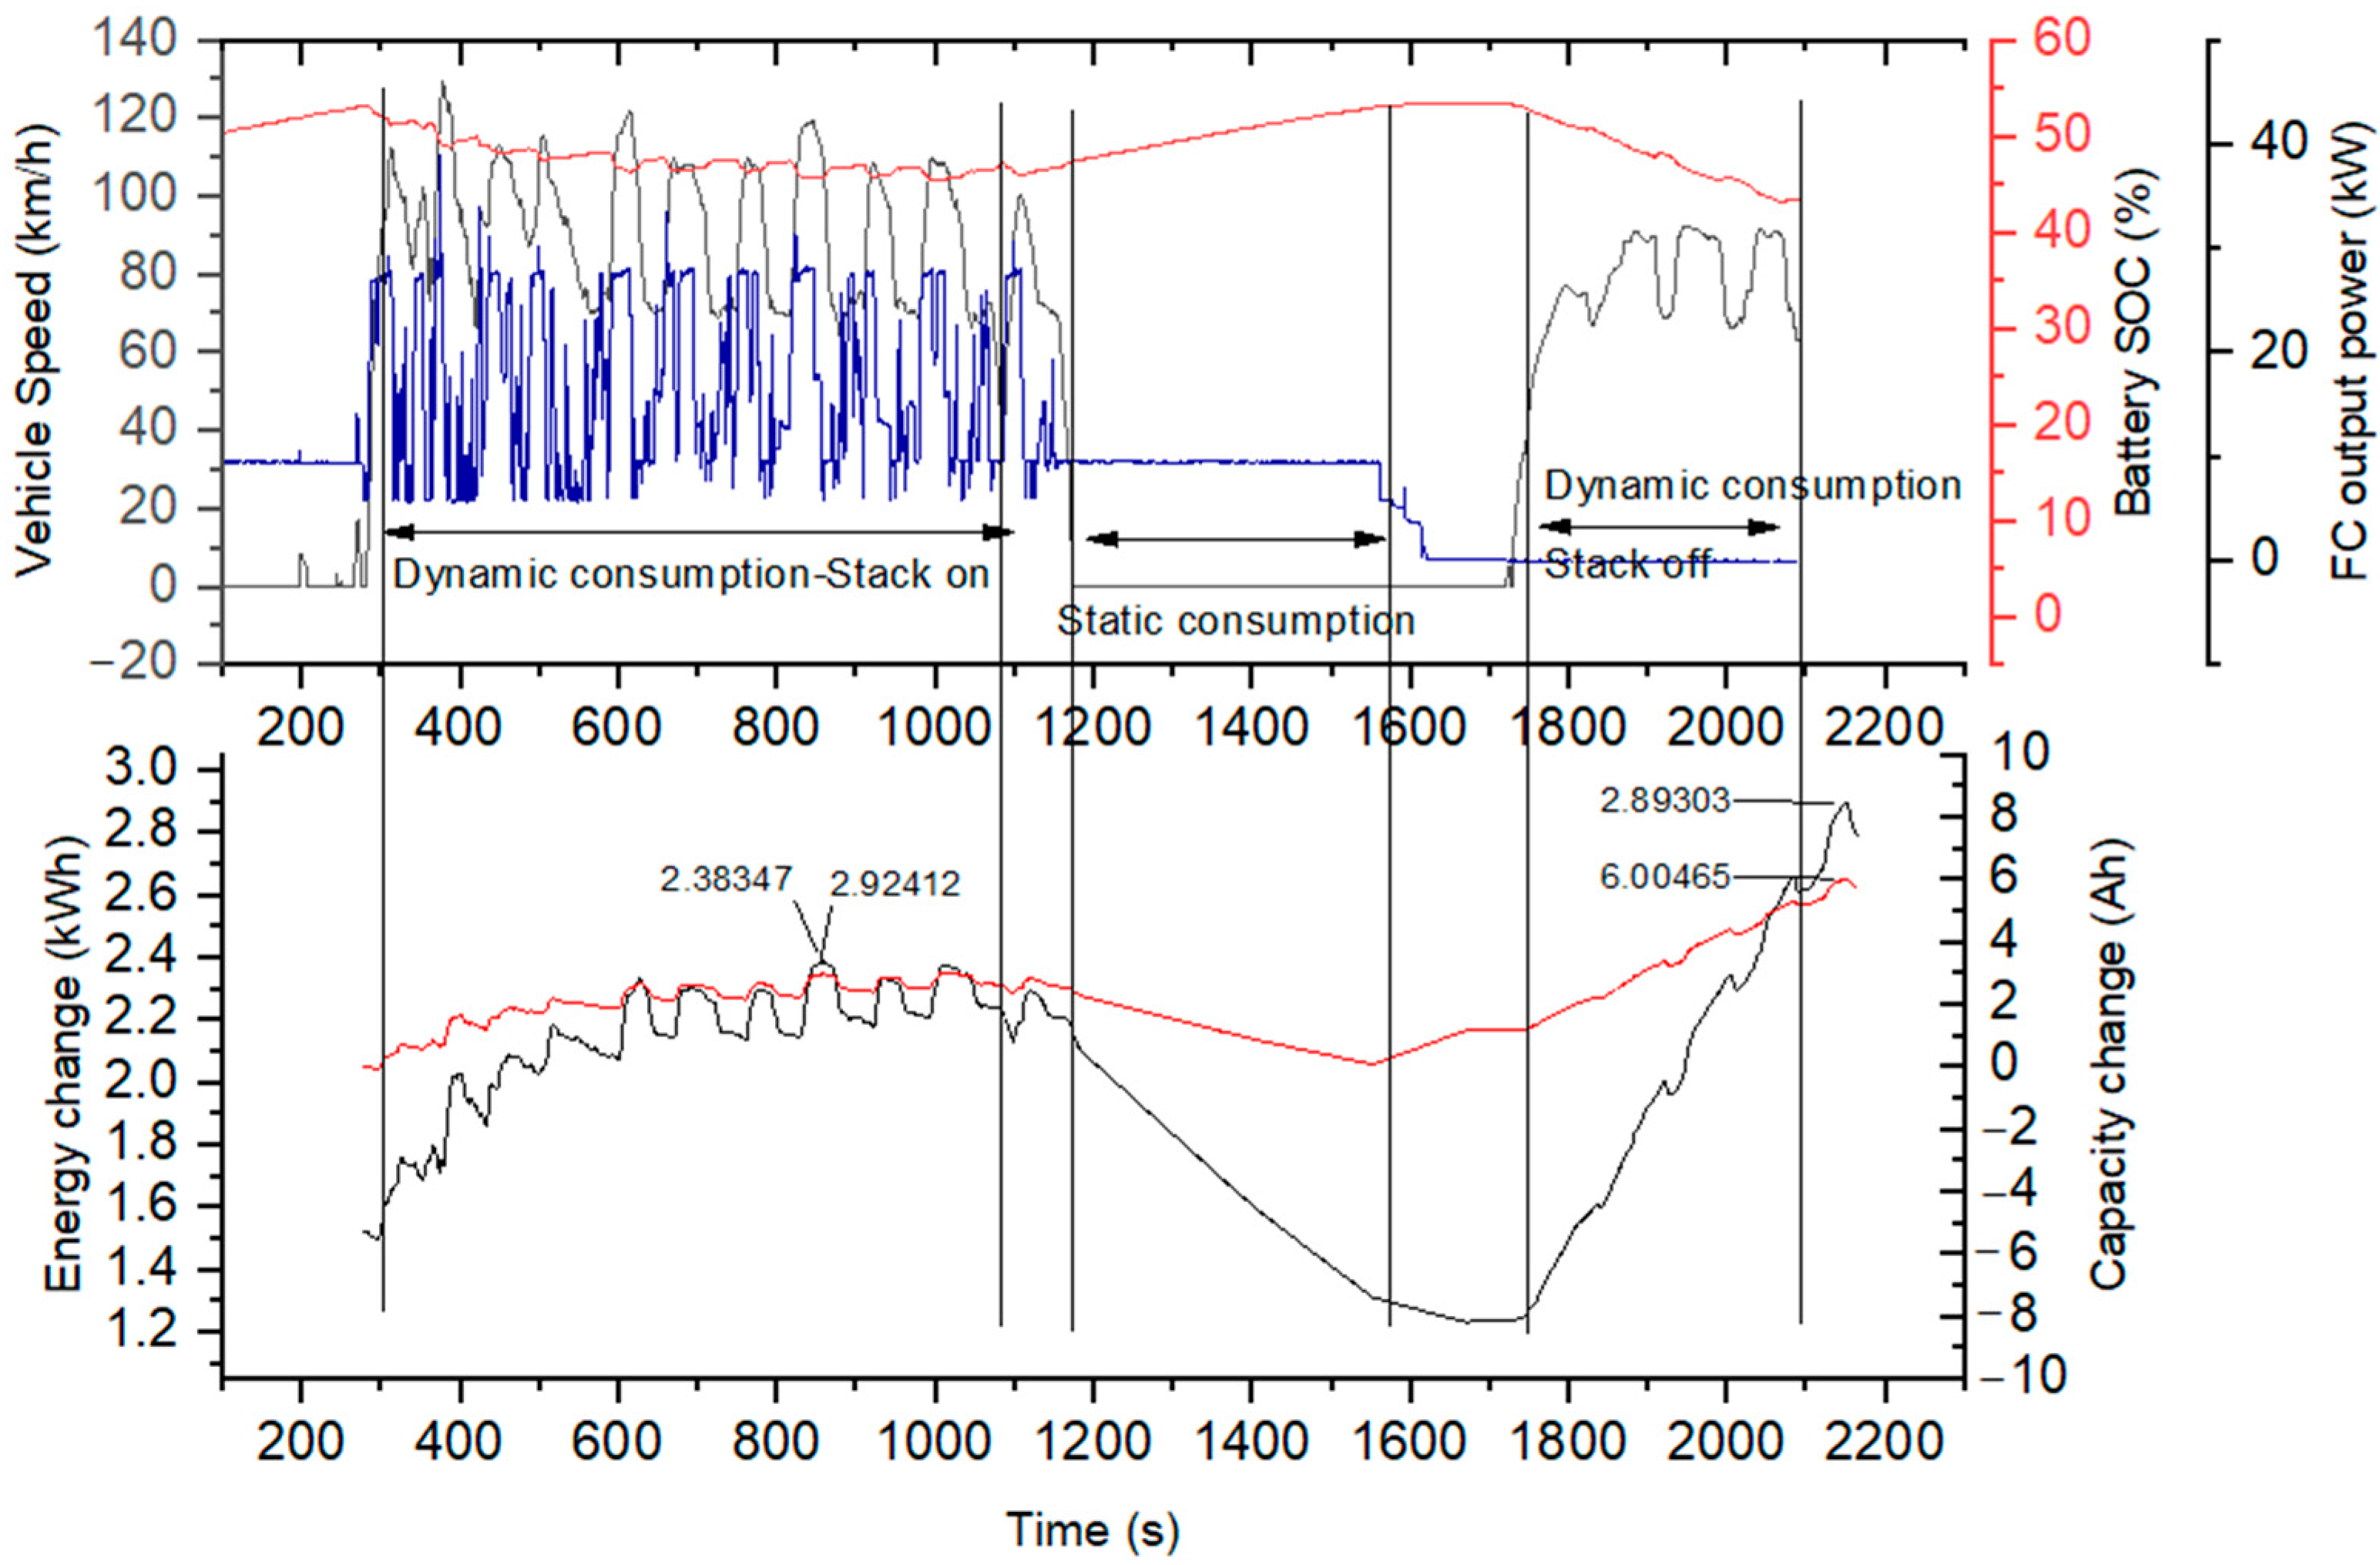
4.2.2. Adjusting SOC
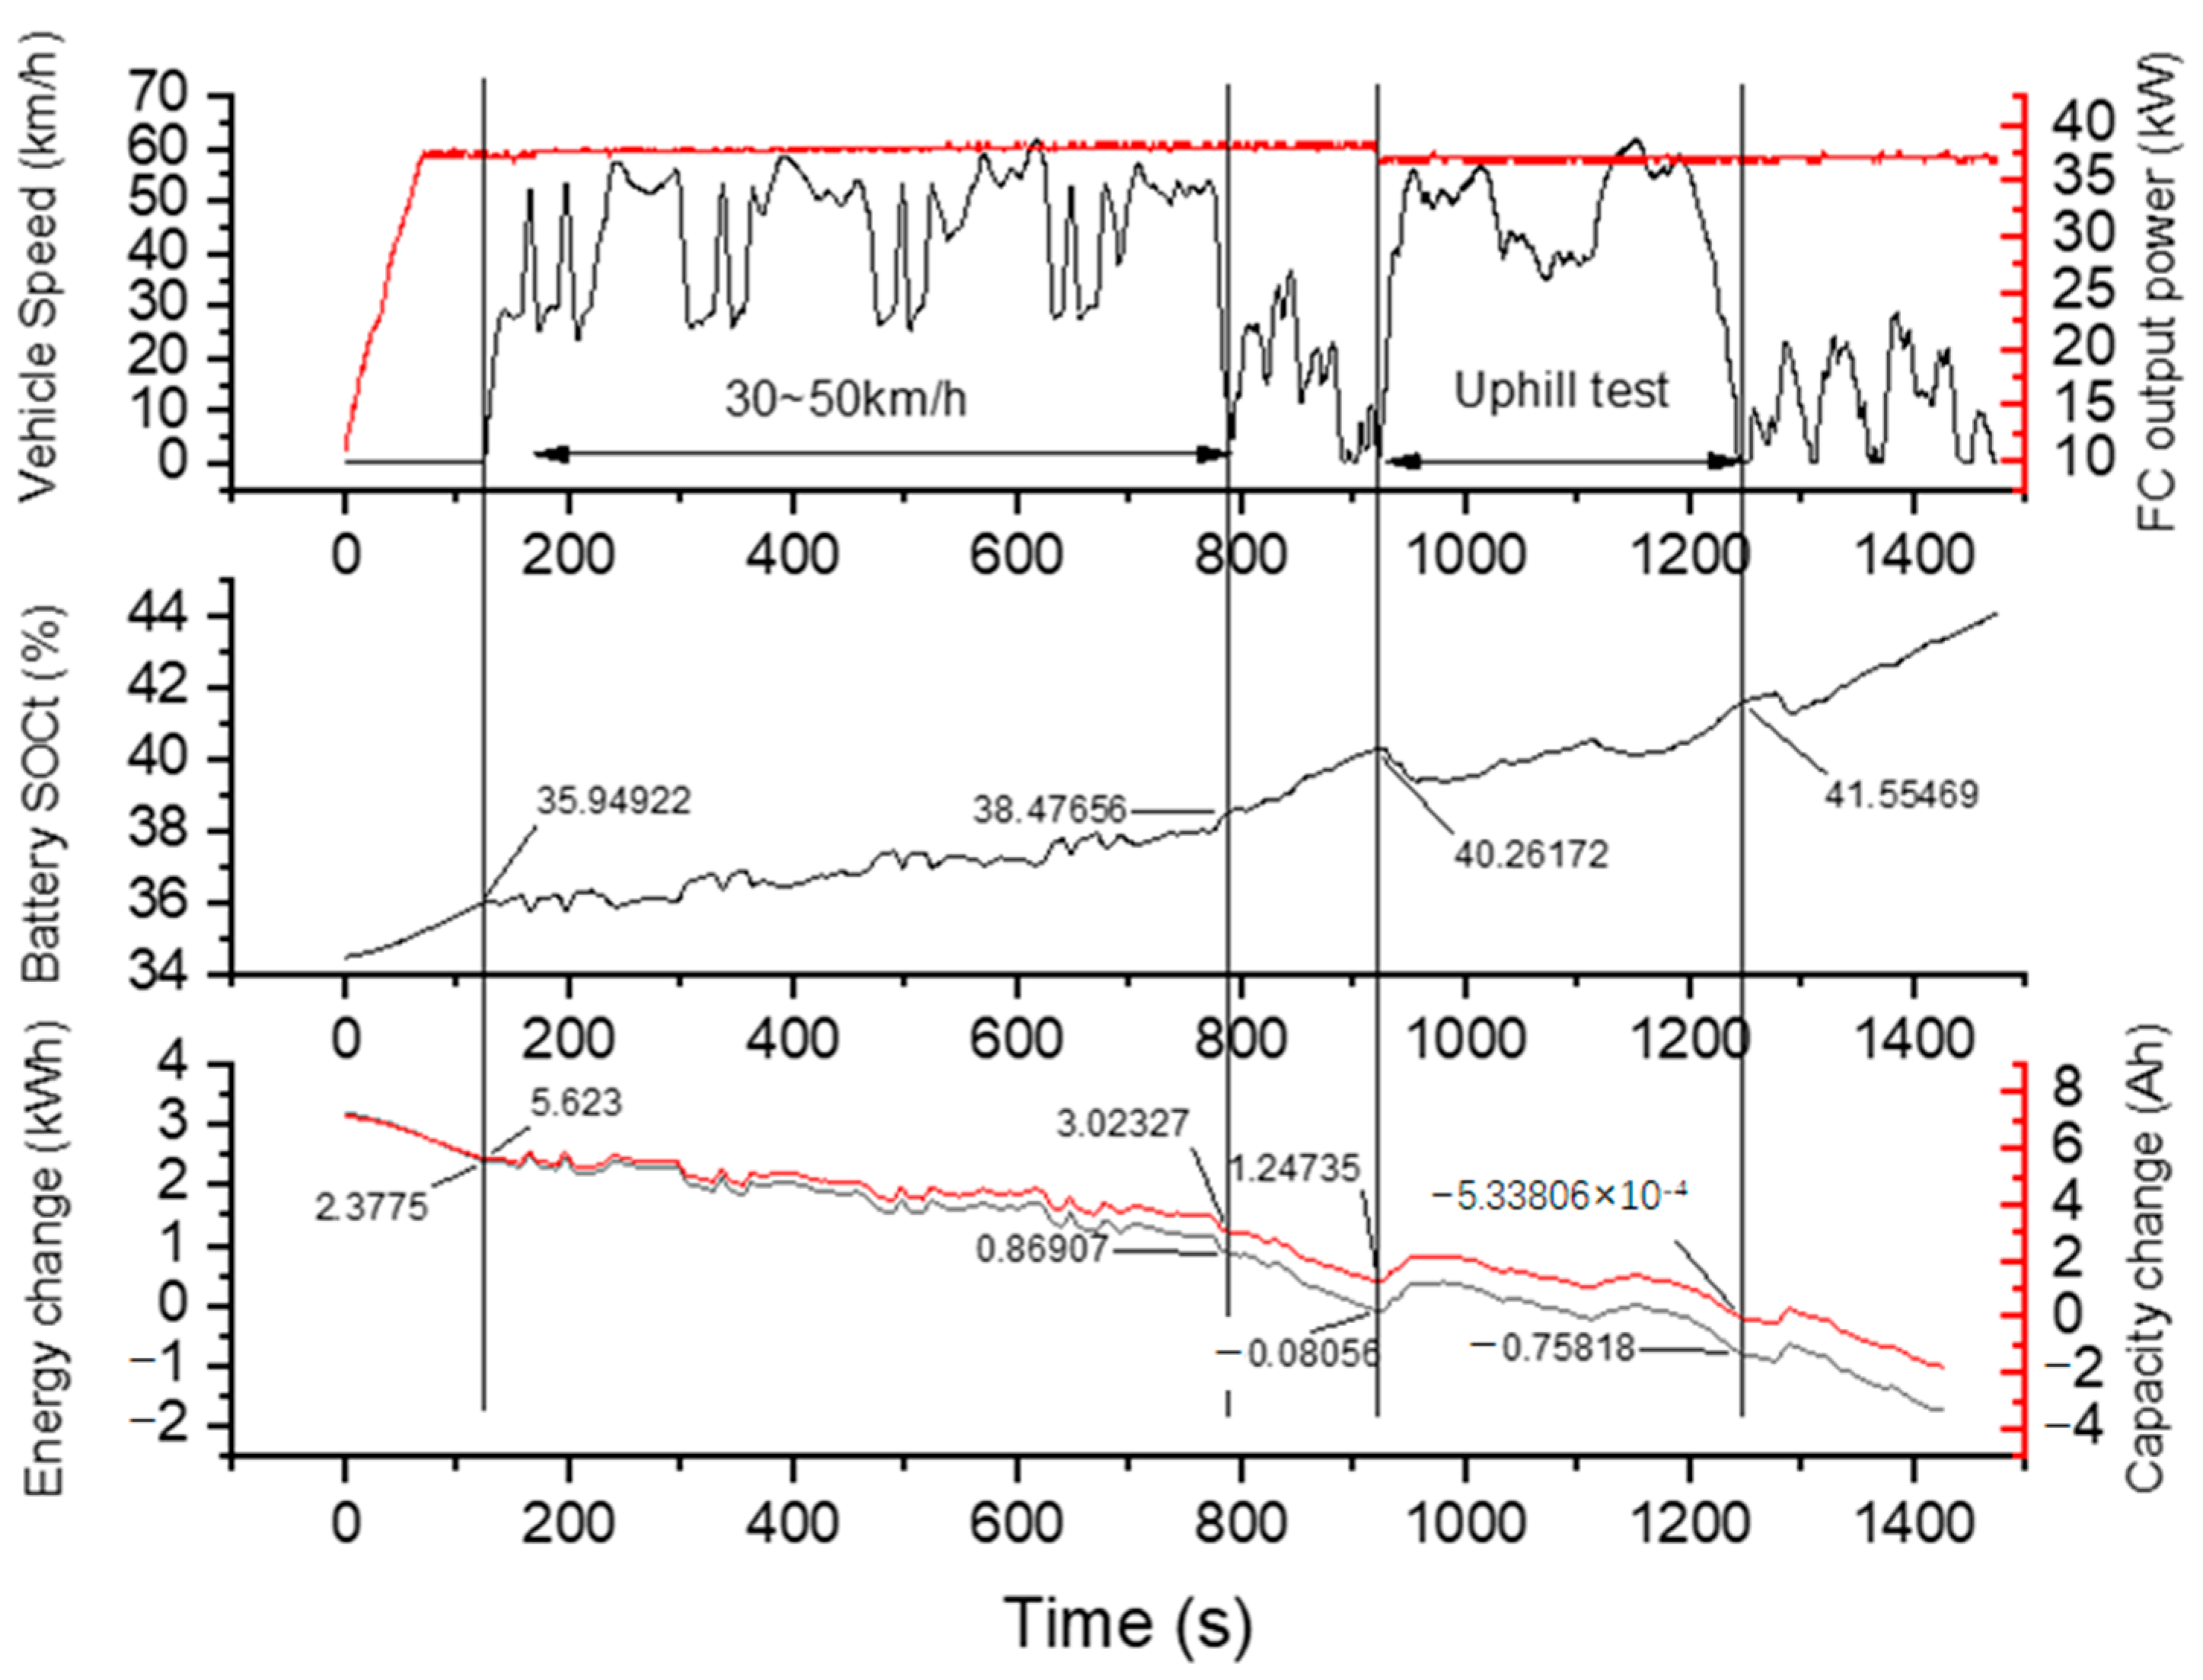
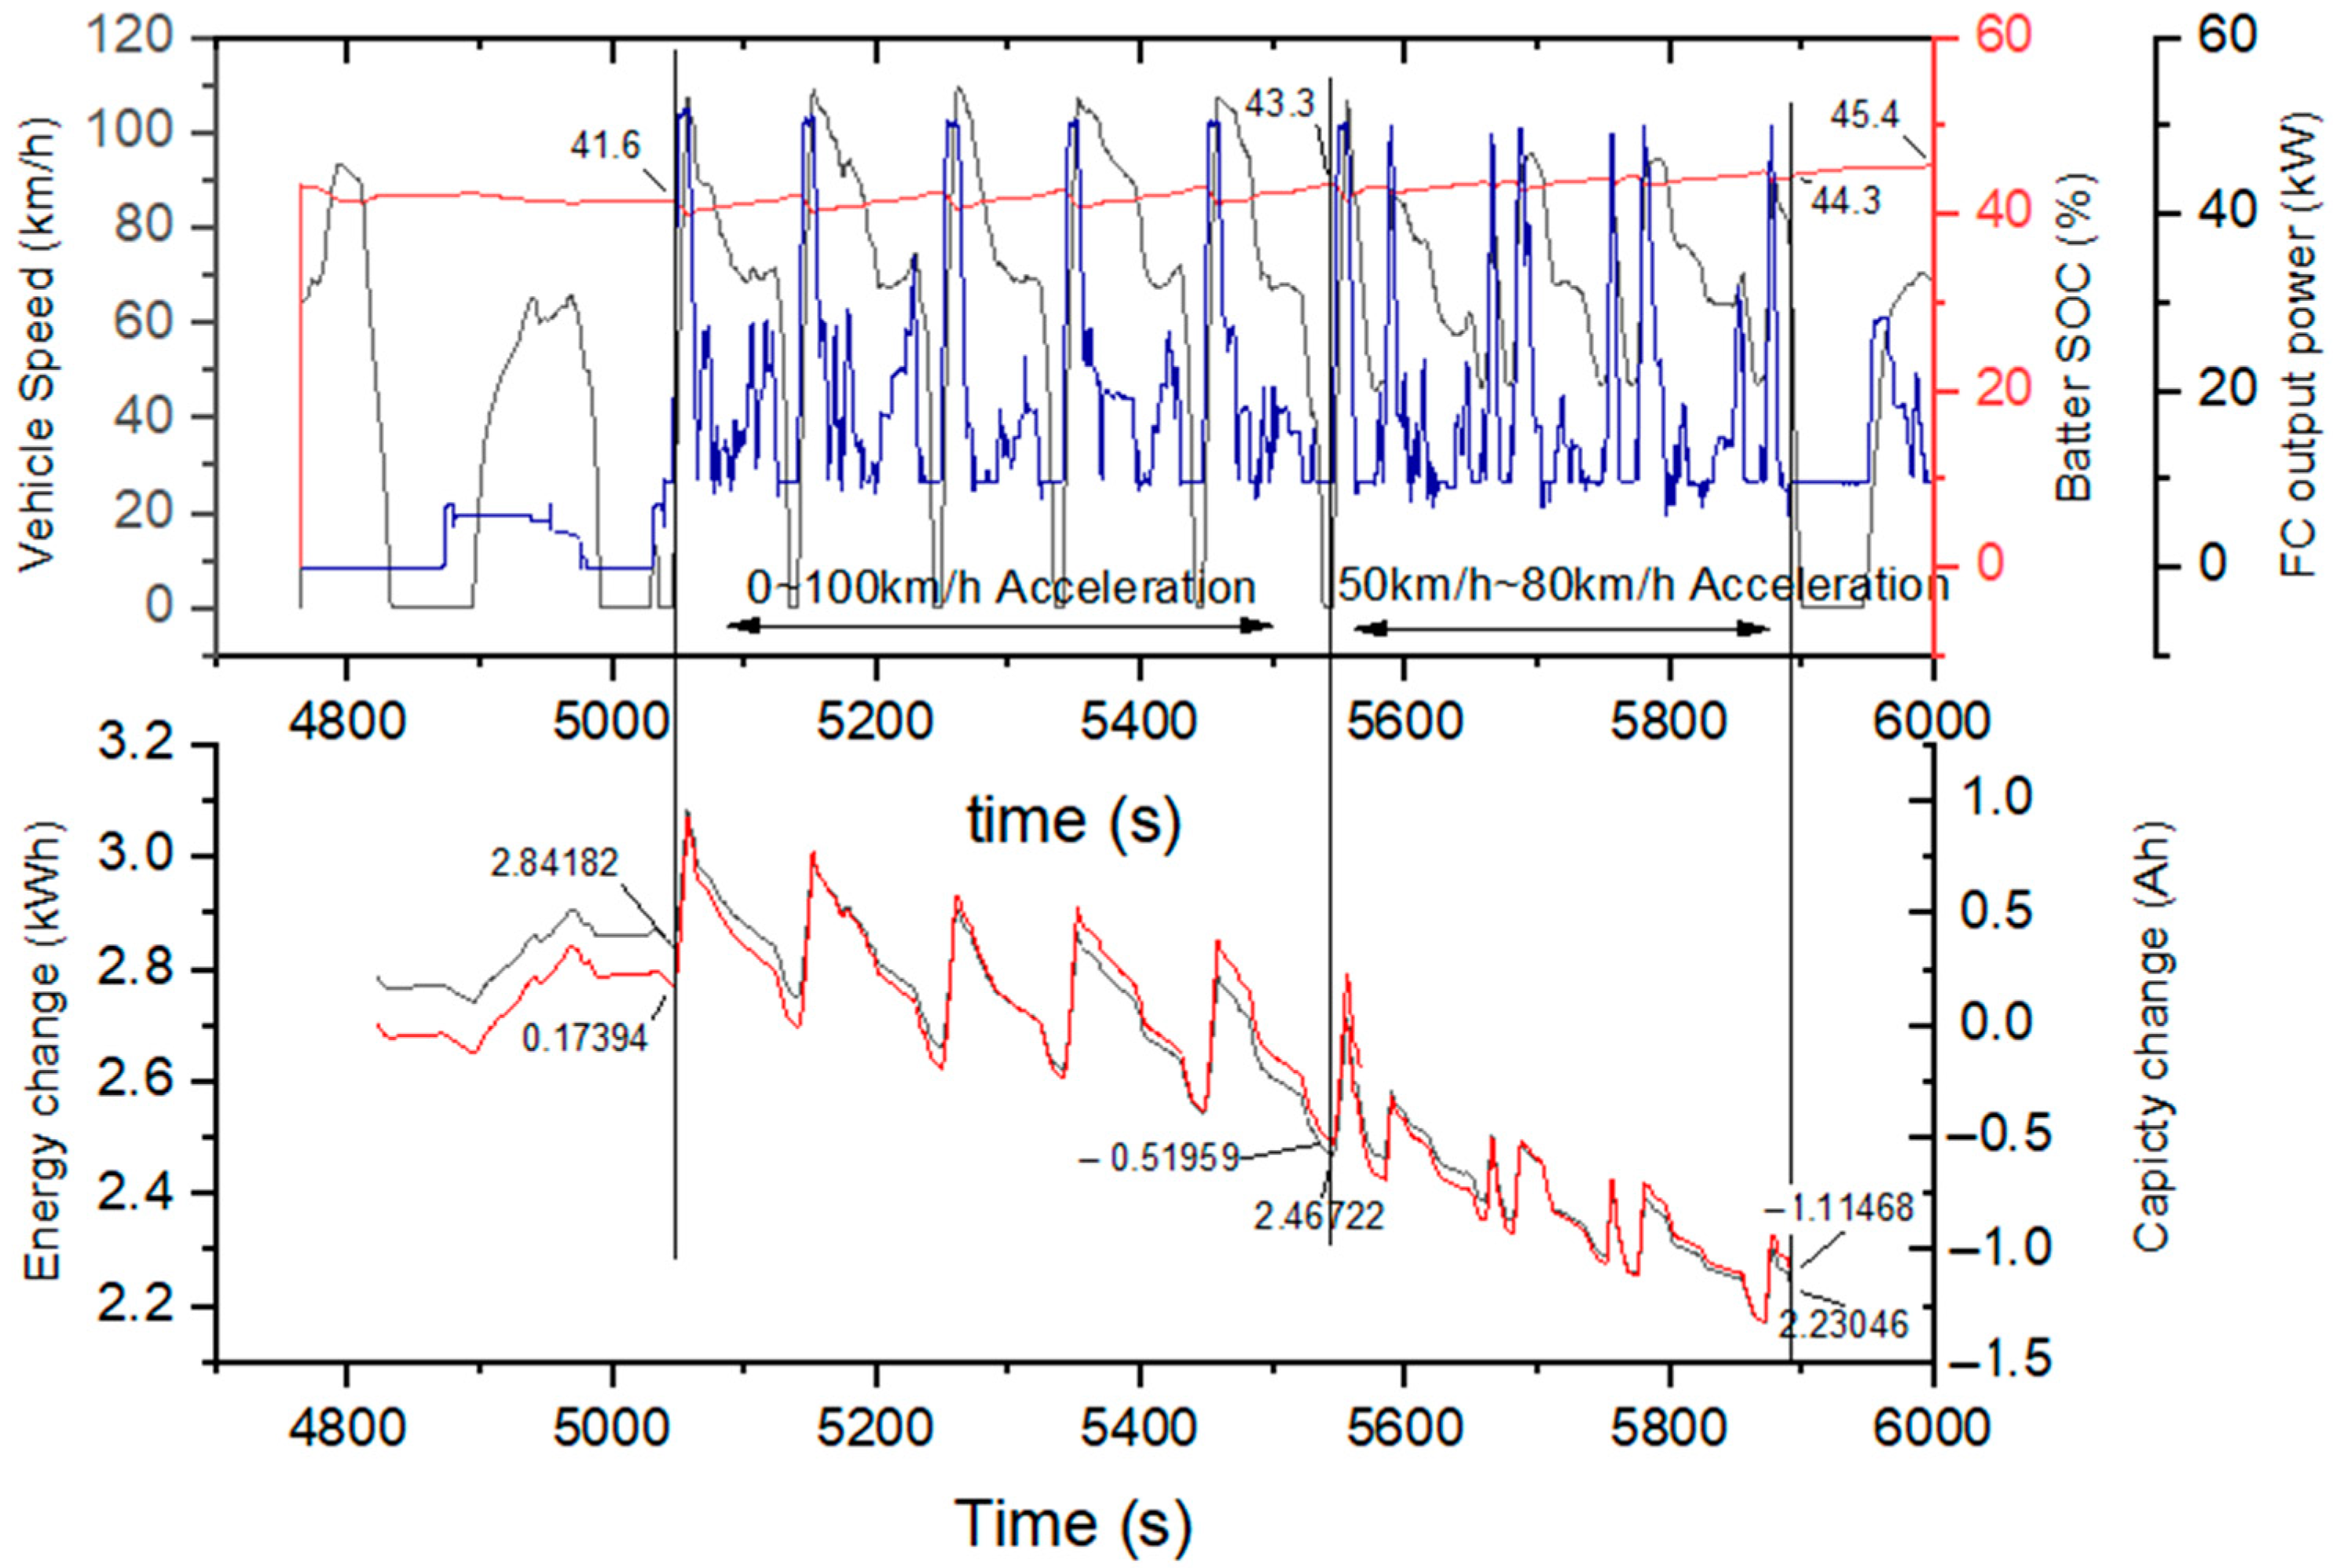
4.2.3. Acceleration Test
4.2.4. Summary of the Following Power Control Strategy
4.3. Discussion on the Performance Comparison
4.3.1. Discussion on the Test Method
4.3.2. Discussion on Maximum Thirty-Min Speed
4.3.3. Discussion on Adjusting SOC
5. Conclusions
Author Contributions
Funding
Institutional Review Board Statement
Informed Consent Statement
Conflicts of Interest
References
- Staffell, I.; Scamman, D.; Abad, A.V.; Balcombe, P.; Dodds, P.E.; Ekins, P.; Shah, N.; Ward, K.R. The role of hydrogen and fuel cells in the global energy system. Energy Environ. Sci. 2019, 12, 463–491. [Google Scholar] [CrossRef] [Green Version]
- Gröger, O.; Gasteiger, H.A.; Suchsland, J.-P. Electromobility: Batteries or fuel cells? J. Electrochem. Soc. 2015, 162, A2605. [Google Scholar] [CrossRef]
- Hydrogen Roadmap Europe: A Sustainable Pathway for the European Energy Transition. Available online: https://www.fch.europa.eu/news/hydrogen-roadmap-europe-sustainable-pathway-european-energy-transition (accessed on 12 May 2022).
- Hydrogen Supply Chain for the Realization of a Decarbonized Hydrogen Society. Available online: https://www.env.go.jp/seisaku/list/ondanka_saisei/lowcarbon-h2-sc/en/index.html (accessed on 12 May 2022).
- Medium- and Long-Term Plan for the Development of Hydrogen Energy Industry (2021–2035). Available online: https://www.ndrc.gov.cn/xxgk/zcfb/ghwb/202203/t20220323_1320038.html?code=&state=123 (accessed on 12 May 2022).
- South Korea’s Hydrogen Industrial Strategy. Available online: https://www.csis.org/analysis/south-koreas-hydrogen-industrial-strategy (accessed on 12 May 2022).
- Sulaiman, N.; Hannan, M.A.; Mohamed, A.; Majlan, E.H.; Daud, W.W. A review on energy management system for fuel cell hybrid electric vehicle: Issues and challenges. Renew. Sustain. Energy Rev. 2015, 52, 802–814. [Google Scholar] [CrossRef]
- Ouyang, M.; Xu, L.; Li, J.; Lu, L.; Gao, D.; Xie, Q. Performance comparison of two fuel cell hybrid buses with different powertrain and energy management strategies(Article). J. Power Source 2006, 163, 467–479. [Google Scholar] [CrossRef]
- Fadel, A.; Zhou, B. An experimental and analytical comparison study of power management methodologies of fuel cell-battery hybrid vehicles. J. Power Source 2011, 196, 3271–3279. [Google Scholar] [CrossRef]
- Xu, L.; Li, J.; Hua, J.; Li, X.; Ouyang, M. Optimal vehicle control strategy of a fuel cell/battery hybrid city bus. Int. J. Hydrog. Energy 2009, 34, 7323–7333. [Google Scholar] [CrossRef]
- Laiyun, Z. Research on Power System Matching and Energy Management Strategies of Range Extended Fuel Cell Vehicles. Master’s Thesis, East China University of Science and Technology, Shanghai, China, 2016. [Google Scholar]
- Qinyang, L.; Teng, T.; Baodi, Z.; Xin, Z.; Qicheng, X. Optimal control strategy for economy and durability of range extended fuel cell vehicles. J. Harbin Inst. Technol. 2021, 53, 126–133. [Google Scholar]
- Jianguo, T.; Fujian, W.; Yang, L.; Zhongming, L.; Shunlai, G. Energy distribution management strategy for fuel cell buses. Bus Technol. Res. 2020, 42, 5–7+18. [Google Scholar]
- GB/T 19596-2017; Electric Vehicle Terminology. General Administration of Quality Supervision, Inspection and Quar-antine of the People’s Republic of China; Standardization Administration of China: Beijing, China, 2017; p. 40.
- Sorlei, I.S.; Bizon, N.; Thounthong, P.; Varlam, M.; Carcadea, E.; Culcer, M.; Iliescu, M.; Raceanu, M. Fuel cell electric vehicles—A brief review of current topologies and energy management strategies. Energies 2021, 14, 252. [Google Scholar] [CrossRef]
- Fernández R, Á.; Caraballo, S.C.; Cilleruelo, F.B.; Lozano, J.A. Fuel optimization strategy for hydrogen fuel cell range extender vehicles applying genetic algorithms. Renew. Sustain. Energy Rev. 2018, 81, 655–668. [Google Scholar] [CrossRef]
- Guzzella, L.; Sciarretta, A. Vehicle Propulsion Systems; Springer: Berlin/Heidelberg, Germany, 2007; Volume 1. [Google Scholar]


| Vehicle Type | Commercial Vehicles (City Buses) | Passenger Car (Sedan) | |
|---|---|---|---|
| Mode | Default mode | Mixed mode | Mixed mode |
| Pure electric mode | Available | NA | |
| Whole vehicle | Maximum thirty-min speed (km/h) | 70 | 140 |
| BOP maximum power (kW) | NA | NA | |
| Traction battery | Type (energy/power) | Energy | Energy |
| Capacity Cap0 (Ah) | 96 | 40 | |
| Electrical energy Q0 (kWh) | 50.45 | 14 | |
| Voltage range (V) | 432–604.8 | 240–403.2 | |
| Current range (A) | <500 | NA | |
| SOC balance range (%) | 20–84 | 30–60 | |
| Pure electric mileage (km) | 65 | 30 | |
| Fuel cell system | Working mode (Stepped power type/Following power type/fixed-point power work type) | Stepped power type | Following power type |
| Rated power (kW) | 50 | 50 |
| Equipment | Recorded Data | Calculated Data | Calculation Formula |
|---|---|---|---|
| OBD Analyzer (The protocol is not public, the manufacturer offers the specialized equipment to analyze these data in this test) | Traction battery SOCOBD | - | - |
| Speed data | - | - | |
| Fuel cell system power | - | - | |
| Traction battery current | Capacity change Cap1 | Capacity change Cap1 = dt | |
| Traction battery Voltage | Electrical energy change Q1 | Electrical energy change Q1 = dt | |
| HIOKI 3390 power analyzer HIOKI 9279 current clamp | Traction battery current | Capacity change Cap2 | Capacity change Cap2 = dt |
| Traction battery Voltage | Electrical energy change Q2 | Electrical energy change Q2 = dt | |
| - | Calculate SOCcap | Calculate SOCcap = Cap2/Cap0 | |
| - | Calculate SOCQ | Calculate SOCQ = Q2/Q0 |
Publisher’s Note: MDPI stays neutral with regard to jurisdictional claims in published maps and institutional affiliations. |
© 2022 by the authors. Licensee MDPI, Basel, Switzerland. This article is an open access article distributed under the terms and conditions of the Creative Commons Attribution (CC BY) license (https://creativecommons.org/licenses/by/4.0/).
Share and Cite
Lan, H.; Ma, Q.; Chang, Z.; Wang, D.; Zheng, T. Research on the Performance Comparison of Two Fuel Cell Electric Vehicles with Typical Energy Management Strategies. World Electr. Veh. J. 2022, 13, 89. https://doi.org/10.3390/wevj13050089
Lan H, Ma Q, Chang Z, Wang D, Zheng T. Research on the Performance Comparison of Two Fuel Cell Electric Vehicles with Typical Energy Management Strategies. World Electric Vehicle Journal. 2022; 13(5):89. https://doi.org/10.3390/wevj13050089
Chicago/Turabian StyleLan, Hao, Qiuyu Ma, Zhen Chang, Dan Wang, and Tianlei Zheng. 2022. "Research on the Performance Comparison of Two Fuel Cell Electric Vehicles with Typical Energy Management Strategies" World Electric Vehicle Journal 13, no. 5: 89. https://doi.org/10.3390/wevj13050089
APA StyleLan, H., Ma, Q., Chang, Z., Wang, D., & Zheng, T. (2022). Research on the Performance Comparison of Two Fuel Cell Electric Vehicles with Typical Energy Management Strategies. World Electric Vehicle Journal, 13(5), 89. https://doi.org/10.3390/wevj13050089