Article

Electric Vehicle Deployment and Integration in the Saudi Electric Power System

by
Sulaiman A. Almohaimeed
Department of Electrical Engineering, College of Engineering, Qassim University, Unaizah 56452, Saudi Arabia
World Electr. Veh. J. 2022, 13(5), 84; https://doi.org/10.3390/wevj13050084
Submission received: 14 March 2022 / Revised: 23 April 2022 / Accepted: 29 April 2022 / Published: 11 May 2022

Abstract

:
The demand for electricity in Saudi Arabia has grown in the last few years due to the growth in the economy and the population. The country has invested in many solutions such as promoting renewable energy and shifting to generation mix to respond to this growing demand. However, Electric Vehicles (EVs) are used as an important factor in achieving the Saudi Vision 2030 in its environmental and economical parts. This work gives an overview on the Saudi electrical energy system and then investigates the impact EVs technology in the electricity sector in Saudi Arabia and its relevant consequences. A statistical analysis is used to quantify the number of EVs, travelled distance and traffic congestions, and State of Charge (SOC). The data were used to implement a daily load profile for EVs for a large population of vehicles. The obtained results show that the EVs peak loads occur during the late evening and early morning at different means. Interestingly, the work shows that the peak periods of EVs occur during the off-peak times of the daily load curve. This means that a large population of EVs can offer more flexibility and improvement to the electric grid, and the summative EV load of a large population of vehicles has a smooth pattern and will not affect the national electric system.

1. Introduction

Electricity consumption in the Kingdom of Saudi Arabia reached more than 289 TWh with a peak of 61.7 GW and 53.5 GW generation capacity [1]. Total electricity consumption in Saudi Arabia is expected to reach 90 GW in 2023 which represents more than 45% of the country’s daily oil production. Moreover, annual peak demand growth is 7% per year, resulting in an increase in the domestic consumption of oil for electricity generation which could reach eight million barrels per day by 2030 [2]. Hence, the Kingdom launched the King Salman Renewable Energy Initiative within its Vision 2030 to empower new energy resources in electricity generation such as renewable energy resources and electric vehicles (EVs). Integrating the previously mentioned technologies in the Saudi electric grid can lead to a reduction in oil consumption and dependency, system losses, and the improvement of aging equipment [3].
EVs have been seen as a key solution to climate change’s challenges. Although no greenhouse emissions come from EVs, electric power charging comes from an energy mix that involves fossil fuel power generation plants [4]. In addition, energy is still used in the production lines that manufacture EVs. Hence, the net CO2 emissions with EVs deployment still depend on the type of electric power generation plants. In a coal-intensive power generation power system, the impact of EVs integration on reducing CO2 emissions is questionable [5]. The integration of renewables in electric power systems is necessary with EVs integration to effectively reduce CO2 emissions [6]. On 5 January 2018, the SASO issued a regulation for the use of EVs. Two years later, on 28 June 2020, the Saudi Press Agency announced that importation and use of EVs would be officially allowed in Saudi Arabia according to the regulations and specifications legislated. The Kingdom’s Vision 2030 emphasizes the mitigation of emissions through increasing environmental compliance, under the strategic objective No. 2.4.1. This objective called “Reduce All Types of Pollution” aims to reduce the air pollution caused by human activities or the industrial sector [7]. According to [8], the total CO2 emissions in Saudi Arabia increased from 200 million tons to 600 million tons in the period between 1996 and 2014 of which transportation accounted for 20%. EVs choice is one of the solutions that can play an important role in reducing emissions in the transportation system. EVs contribute zero direct emissions which can improve public health and air quality and reduce ecological impact [9]. Recent research by KAPSARC shows that realistic and practical scenarios of EVs penetration result in reduction in CO2 emissions [4].
An incremental penetration of Plug-in Hybrid Electric Vehicles (PHEV) in the power grid may cause a spike in demand peaks. However, PHEV is an option to deploy energy storage and peak-shaving technology. The research in [10] studies the effect of PHEVs with vehicle to grid (V2G) capabilities on a distribution system. Modelling PHEVs in the distribution system depends on the number of PHEVs and the behavior of drivers in addition to the behavior of PHEVs, either in load mode or in distributed generator mode. Further, the paper shows a linear programming model to quantify the optimal charging patterns to reduce peak demand. The objective of the optimization problem is to achieve maximum peak-shaving by minimizing the deviation between the daily load and its average. In that regard, some constraints are applied such as battery operation, loads, and non-negative values in the algorithm. The work examines three scenarios: reference case (scenario A), 30% penetration of PHEVs with V2G capabilities (scenario B), and 30% penetration of PHEVs without capabilities of V2G (scenario C). The results show scenario B is close to the peak demand of scenario A, but there is an increase in the annual energy demand. Scenario C shows a dramatic increase in peak demand by 37% from the base case and an increase of 15.4% in annual energy demand [10].
Increasing the penetration of DER in the distribution system incorporates use of Energy Storage System (ESS), viz. EVs. In fact, efficient operation of the distribution system could defer investment in the electric power system. Therefore, ESS can store the surplus electricity generation and then use it during off-peak hours. In that regard, this paper evaluates the investment in energy storage for distribution system expansion in the presence of high solar PV penetration. It aims to find the optimal sizing and siting of battery ESS for optimal development of the distribution planning. The proposed optimization problem focuses on minimizing the total cost of expansion. The case study presents three scenarios; case A where the development includes installing power transformer in the 3rd year, case B provides investment in battery ESS, and case C that consists of the investment in ESS and deferring power transformer investment until the 7th year. The results show the expected total cost of case A is USD 3.272 million, while case B counts for USD 5.796 million. Case C which includes investment in both options costs USD 3.55 million [11].
Although the growth of EVs can save oil demand for transportation, they still lead to an incremental increase in electricity demand. Hence, the total electricity demand needed for EVs charging is expected to increase. Such a penetration will reshape the daily load profile due to:
  • Creating another peak demand to the 24-h load curve.
  • Adding more load on the main peak demand.
  • Increasing the total electricity demand.
High penetration of EVs also causes transformer overloads and distribution feeder congestions. It is important to minimize the impact of electric vehicles loading on a distribution network in order to accommodate EVs charging without upgrading the system. The Demand Response (DR) strategy is used to manage the load in a residential distribution network. Further, this work demonstrates some consumer comfort indices to evaluate the impact of DR on residential consumers. Accordingly, the consumers will have their choice to choose what kind of loads to be controlled and when. A case study was carried out in the Virginia Tech Electric Service area using different levels of electric vehicles, 3 types of electric vehicles, and various charging profiles. The results show peak loads increase as well as comfort indices violation with an increase in the penetration of electric vehicles [12].
The EVs fleet is expected to increase by 10% by 2030. Hence, EVs charging adds more load to the electric system and in turn increases power generation [13]. According to [14], the world will need about 2500 TWh in 2050 for EVs charging. Further, a study published by the National Renewable Energy Lab expects that the EVs share could increase the demand for electricity by 38% by 2050 [15].
As of 2018, The Saudi Standards, Metrology, and Quality Organization (SASO) issued a regulation for using EVs in the Kingdom [16]. In 2019, the Saudi Press Agency announced that EVs were officially allowed to be imported and used in Saudi Arabia according to the regulations and specifications [17]. In 2021, the country launched its green initiative to diminish climate change consequences. One of the projects is to increase the number of EVs in Riyadh, the capital of the country, to 30% of the total number of vehicles [18]. Therefore, the purpose of this work is to establish a framework for EVs penetration in the Saudi Arabia electric grid. The model aims to:
  • Study the impact of EVs charging on the operation of the electric grid in the Kingdom.
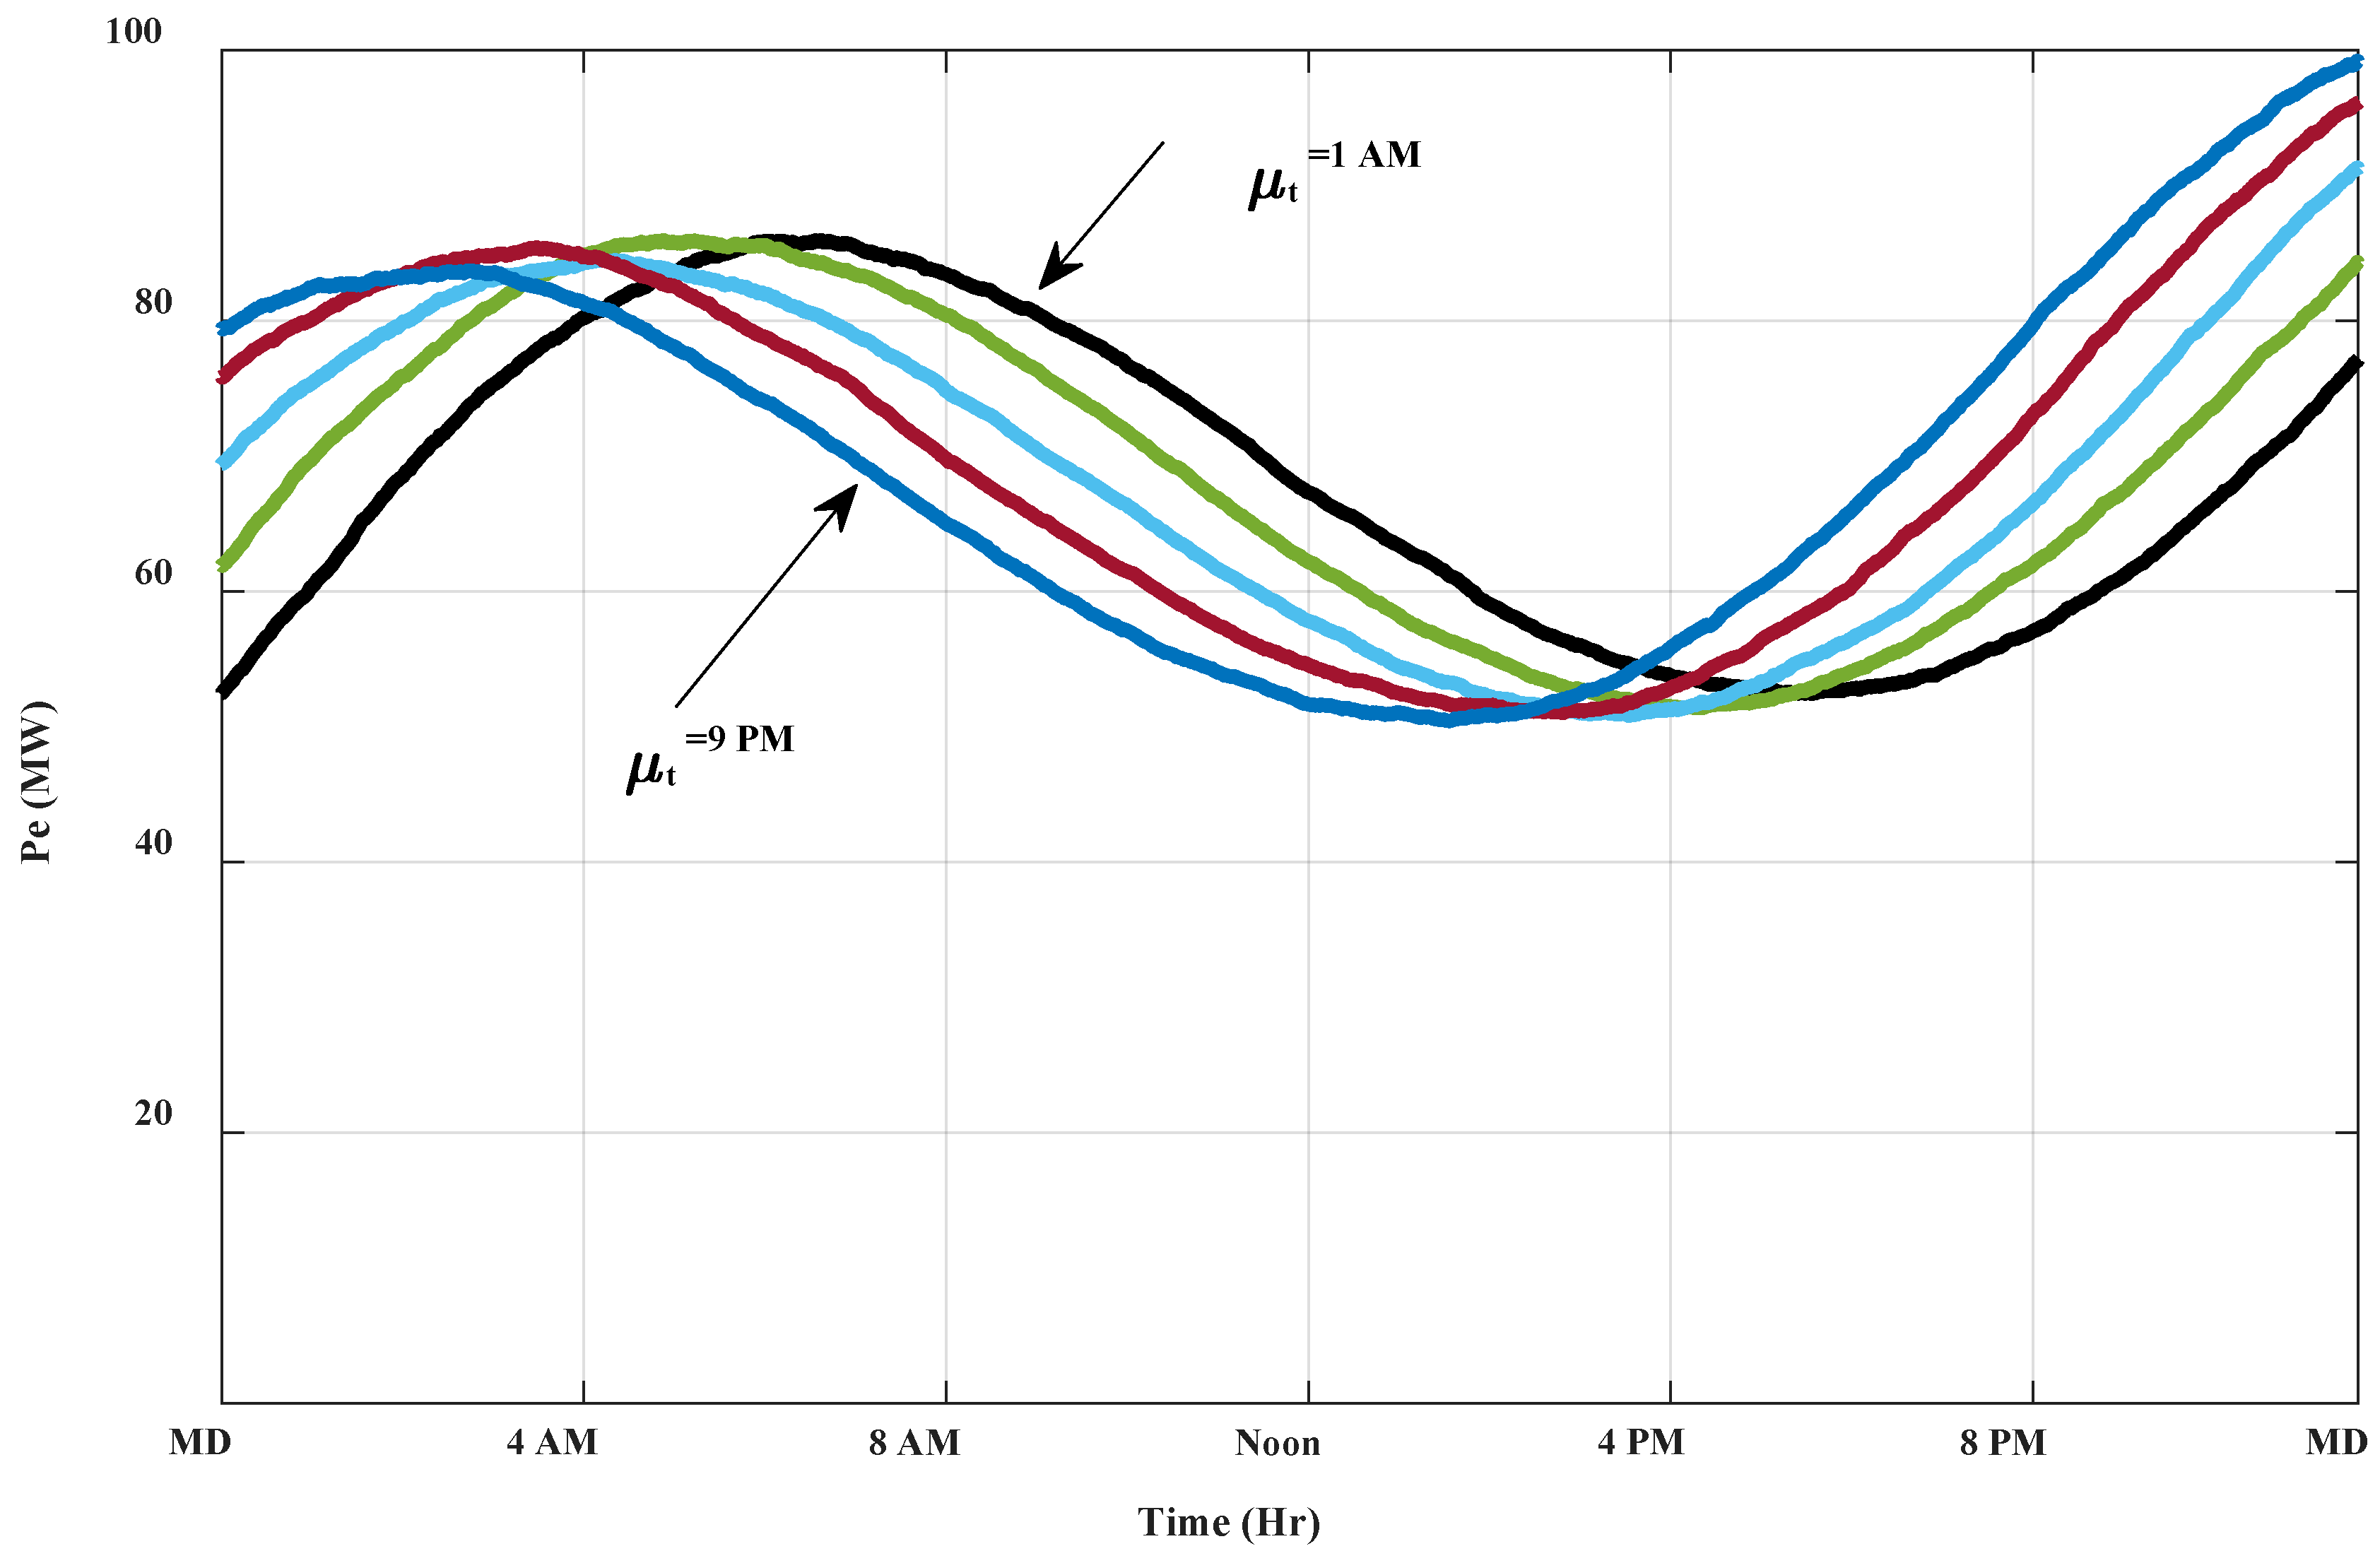
  • Understand the behavior of the daily load curve after integrating EVs.
  • Investigate the impact of daily EVs charging on the load curve patterns.

2. Developments in EVs Technology

Figure 1 shows that the EVs sales have grown rapidly in the second half of the previous decade [19]. In 2020, a total of 3.24 million EVs were sold. The Chinese and European markets are the most active markets, as shown in Figure 2. The EVs sales growth is still significant in other countries outside Europe such as USA and South Korea. It is expected to approach 20 million of EV sales by 2030 [20]. According to a recent report by the International Energy Agency (IEA), the number of battery electric-, plug-in-hybrid electric-, and fuel cell electric-light vehicles will reach 350 million in 2030 [21]. The major vehicles’ manufacturers have commercialized EVs in the global market. Table 1 shows a comparison of recent EVs models in the USA market [22]. The capacity of battery and the environmental protection agency (EPA) range are included. The EPA range is widely used in the US market to express estimated combined kilometers that an EV travels in a combined urban and highway driving using a full charge. According to the models listed in Table 1, the range of travel varies from 274 to 652 km according to the size of the battery and vehicle model. The km/kwh depends on many factors related to the electric vehicle specifications such as size, weight, battery type, motor type, wheel drive options, etc. The same table (Table 1) shows that Hyundai IONIQ electric vehicle has the highest 7.15 km/kwh.
There are a variety of charging options for EVs according to the charging connector [23,24,25,26]. EVs usually charge in three levels: slow, fast, and rapid fast charging. Figure 3 shows popular connectors that support different levels of charging. Type 1 SAE J1772 supports charging at single phase 120 V for level 1- and 240 V for level 2- charging. The Combo CCS1 IEC 62196-3 is the modified version of Type 1, and it supports DC fast charging. The CHAdeMo offers fast DC charging for many of Japanese EVs. Type 2 supports fast three-phase 400 V charging. For Tesla vehicles, DC super-fast charging is available in this type. The Combo CCS2 IEC 62196-3 is a modified version of Type 2 with additional two connectors for fast DC charging. A Tesla super charger is used only in the US market for Tesla models. The last two connectors are popular in the Chinese market and support charging using three-phase AC fast charging at 380 V or 750 V DC for GB/T 20234.2 and GB/T 20234.3 respectively. In Saudi Arabia, SASO adopted IEC 62196 for plugs in the Kingdom as shown in Figure 3.
The electric vehicle supply equipment (EVSE) is onboard for level 1 and level 2 chargers and is used for low kilowatt transfer. Hence, the onboard is used to charge vehicles and at many public places. On the other hand, the offboard EVSE allows high kilowatt transfer with a sophisticated battery management system. The original V1 and V2 Tesla offboard supercharging stations charge with power transfer up to 150 kW of power distributed between two cars with a maximum of 150 per vehicle. It takes 20 min for an empty 85 kWh model S Tesla to charge 50%, and 40 min to charge 80%. Fast charging or Type 3 charging stations are usually available at public charging stations which could be available at public parking lots in malls, hotels, hospitals, universities, etc.

3. The Saudi Electrical Energy System

The Saudi electric power system includes four main regions as shown on the Kingdom’s map in Figure 4. The total peak load observed during summer 2019 was 62.1 GW with a total generation capacity of 63.7 GW and a reserve of 1.6 GW [27]. In general, the major electric power generation producer is the Saudi Electricity Company (SEC) with an installed capacity of 55 GW through 39 power plants. There are also many independent operators or other companies having installed capacity of 30 GW. The primary fuel used in most power plants is natural gas, crude oil, heavy fuel oil, and diesel with generation capacities of 36.6, 18.2, 23.3, and 6.7 GW, respectively. The backup fuel used is crude oil, heavy fuel oil, and diesel with generation capacities of 14.5, 2.1, and 35.2 GW, respectively [27]. The contribution of electricity and heat production in the total CO2 emissions in the Kingdom is 40% according IEA reports [28]. Due to the increase in natural gas in the electric power generation sector, the overall emissions due to fossil fuel combustion decreased.
The installed amount of renewables is 0.4 GW which is still very low [29]. However, with the Kingdom’s 2030 vision, it is expected to have a remarkable growth in both wind and photovoltaic installation in the next few years [7,30]. In this context, the impact of renewables installation in reducing CO2 emissions is still limited and expected to increase in near future. On the other hand, the transportation sector contributed 28% of the total CO2 emissions in the Kingdom. In [4], peak, off-peak, and random EVs charging scenarios are studied at different penetration levels in the Saudi power system. The best scenario shows a reduction in CO2 emissions whereas the worst-case scenario with peak charging results in an overall increase in CO2 emissions. This study showed the bounds for CO2 emissions due EVs integration charging in the Saudi power system. However, more realistic scenarios are required to understand the impact of EVs on the electrical power systems daily demand cycles which in turn requires transportation surveys [31,32].
A typical daily load curves for the Saudi power system is shown in Figure 5. The data in the figure are based on data taken from the annual statistical booklet for electricity and seawater desalination industries for the year of 2019 [27]. The noticed maximum demand was observed in the first week of September which is about 62.1 GW. The daily profile shows summer and winter profiles for both working days and Fridays. Due to the hot weather during summer, the demand is almost double in comparison to the demand during winter. In the winter days, there is not much difference between working days and Fridays. However, during Summer, the demand of Fridays is about 10–15% less than that of working days. The load duration curve during the year of 2019 is exhibited in Figure 6. The peak demand requires the operation of many power plants for few hours per day to supply along the year. The peak load of 3 GW requires the operation of fast dispatch plants for only 76 h per year.

4. Modeling of EVs Demand
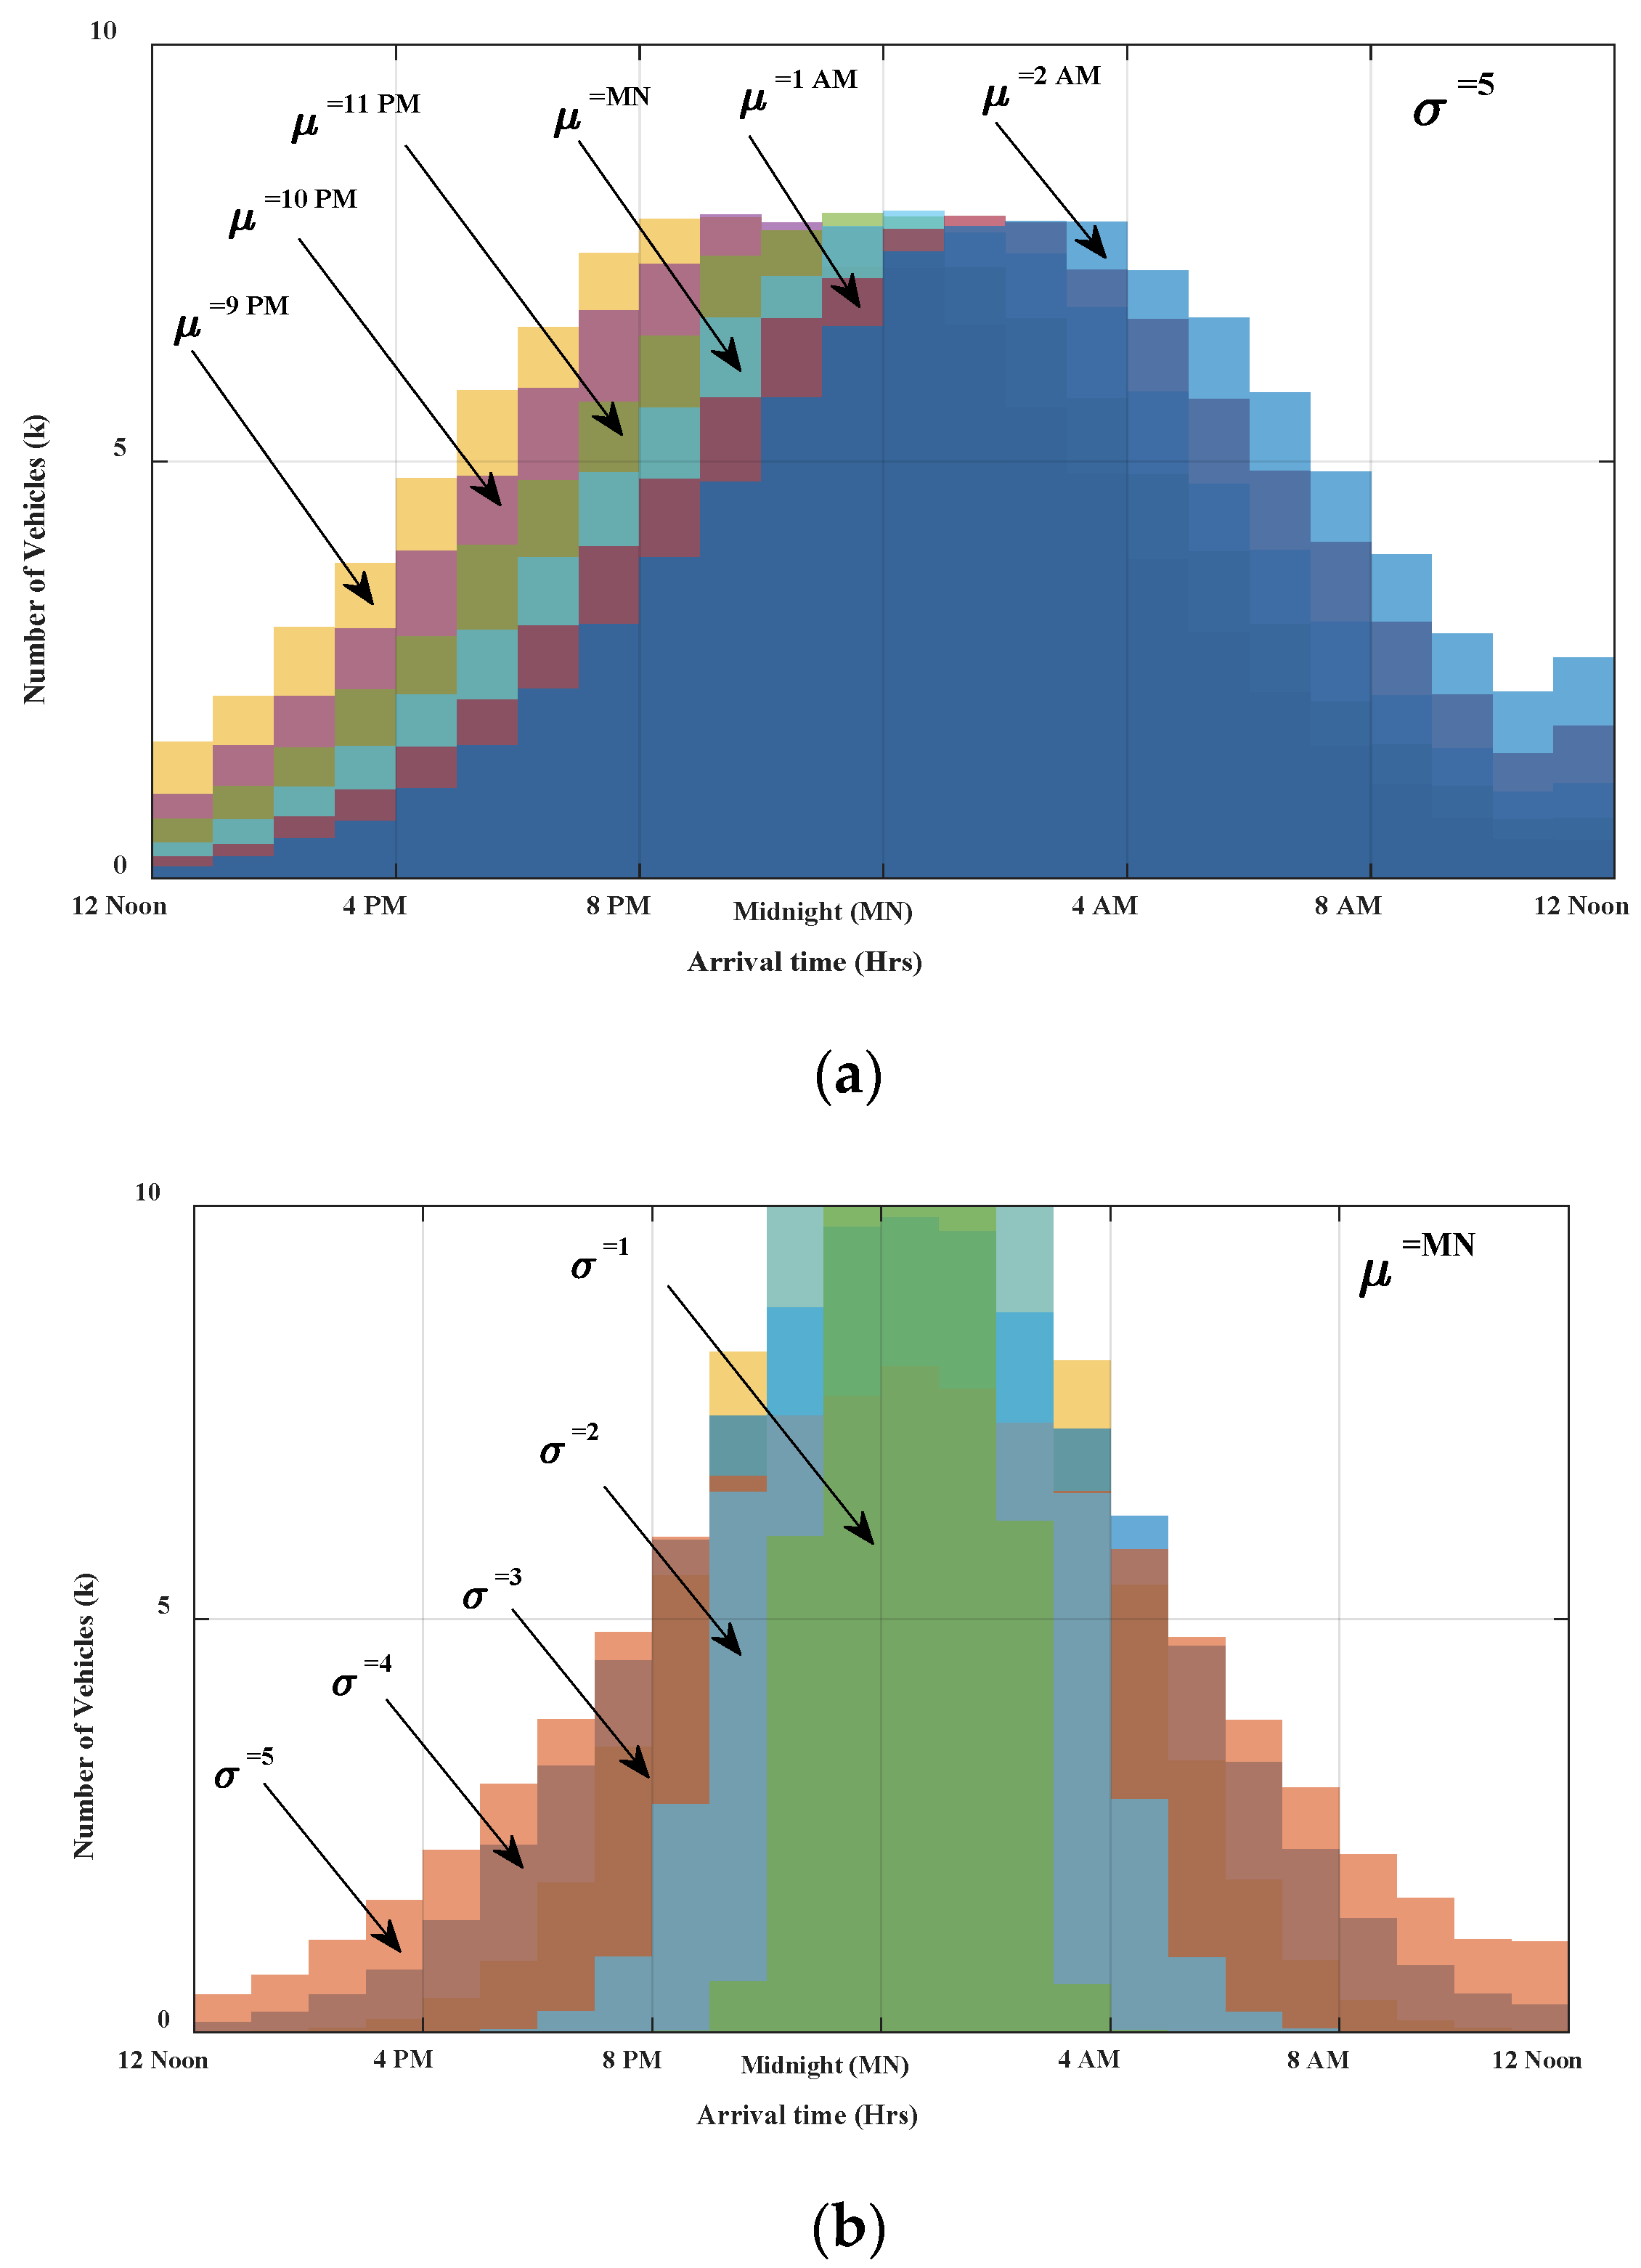
The EVs demand charging power is characterized with randomness associated with vehicle status and connectivity to the grid. In this context, EVs controlled charging is seen as one of the promising solutions to enable demand response programs in future power systems [33,34]. Generally, the following factors affect the deployment and aggregation of the EV load into the grid: (1) size of battery which depends on the model and type of EVs according to Table 1; (2) type of charger which affects the time required for charging the battery; (3) the time at which the vehicle is plugged into the grid; and (4) the initial state of the battery which is dependent on the driving cycles. In this research, probabilistic models are used to represent the EVs demand, viz., charging state into the grid [32,35,36,37].
The percentage of traffic in Riyadh city is shown in Figure 7 for working days from Sunday to Thursday as well as weekly public holidays on Friday and Saturday. During working days, the traffic congestion percentage profile is characterized mainly with two peaks: the morning peak 7 AM and the evening peak 5 PM. The second peak is slightly higher due to the lifestyle in the Kingdom where many of private sector activities reopen at 4 PM. Most of the private business and entertainment activities are closed at noon and reopen at 4 PM. In general, vehicles arrival at destination starts from the evening time at about 8 PM and is completed at parkings by 2 AM. During the last year, the traffic percentage was greatly affected by the COVID-19 pandemic due to the school and university lockdown in the Kingdom. Friday is quite different from Saturday since all activities are closed during the morning and people only go to Friday’s prayer at noon. On Saturday, private sector activities are partially open during the morning time. On both Friday and Saturday, the traffic congestion in the afternoon is quite less than in working days and becomes similar during evening time.
Based on the General Authority for Statistics (GASTAT), Table 2 shows the number of new vehicles imported during the period 2015–2019 based on type [38]. The most popular vehicles used by Saudis to go to school, university, and work are passenger cars and jeeps and the special purpose vehicles that could be classified as light duty vehicles (LDV). LDV and buses are mentioned since a considerable percentage could be replaced by electric types during the next period according to the national transformation program [7]. The total of LDVs purchased during the last five years is 2,904,133 with an average of 580,527 vehicles per year. As for busses, there were approximately about 71,312 new buses included in the transportation sector during the period 2015–2019. These statistics give insight into the new vehicles that could be purchased during the next years which could reach 3 million LDV vehicles by 2025 and 6 million LDV vehicles by 2030. Moreover, about 70 thousand new buses are expected to enter the service during the next five years, and this number could be doubled by 2030.
From the traffic congestion, which is shown in Figure 7, the periods at which the vehicles are available for charging can be identified. Figure 7 shows that the vehicles are in parking starting from the late evening until the early morning. Hence, during this time, the vehicles which are available could be charged at home using Type 1 chargers. According to the California vehicles survey conducted in May 2017 [39], the actual electric daily charging times for both plug-in-hybrid electric and electric vehicles begin at the noon period and increase slowly until reaching their peak which occurs at 1~2 AM as shown in Figure 8. The charging times almost follow a normal distribution pattern. Moreover, the traffic congestion of Riyadh city leads to similar results as most vehicles become available for charging starting from the late evening until the early morning. The only difference is that the peak number of vehicles connectivity may occur an hour later. The above practical surveys show that the arrival of vehicles and their availability for charging can be represented mathematically by a normal distribution. The probability function of the normal distribution is expressed in terms of both the mean and standard deviation values as follows [32]:
f ( t ) = 1 σ t 2 π e 1 2 ( t μ t σ ) 2
where:
  • σ t standard deviation;
  • μ t mean.
Figure 9 shows the normal distribution of the arrival time of 100 k vehicles to home at different standard deviation and mean values. From the traffic congestion records exhibited in Figure 7 and various distribution shown in Figure 8, the suitable mean and standard deviation values that are close to represent the real traffic in Riyadh city are μ = 1 ~ 3 AM and σ = 3 ~ 4 h, respectively. This result is quite similar to the values reported in the literature based on the national British survey [31,32].
The daily travelled distance per vehicle depends on human activities. Saudi drivers are usually dependent on LDV in their daily activities. At this stage, due to lack of public surveys that classify the trips of the public in the Kingdom, the national US transportation surveys data are used in this study [40,41]. The distribution of the trips classified in ranges of 8 km (5 miles) is exhibited in Figure 10 using the available public data of the US national transportation survey 2017 [42]. The average trip is about 41 km (25.9 miles) according to the transportation energy data book (TEDB) [43]. Figure 10 shows that distribution of the daily travelled distance follows lognormal distribution. In consequence, the number of vehicles for a certain traveled distance are suitably represented by a lognormal distribution [32]. The lognormal distribution is expressed as follows:
f ( d ) = 1 d σ d 2 π e ( ln d μ d ) 2 2 σ d 2
where
μ d = ln μ 2 σ 2 + μ 2
σ d = 1 + σ 2 μ 2
μ and σ are the mean and standard deviation respectively.
The distribution of 100 k vehicles according to (2) is shown in Figure 11. The distribution includes different scenarios at different values of σ and at μ = 41 km according to the survey available in the TEDB [39]. If the distance is expressed by its logarithmic values, the above distribution has a normal distribution with the parameters μ d and σ d . Based on this model, the travelled distance for all vehicles can be estimated for any number of vehicles with a specific mean and standard deviation. Figure 11 and Figure 12 are used to generate a data set for any number of vehicles with a specific arrival time and total daily travelled distance. The total number of vehicles are distributed initially according to the daily travelled distance. The number of vehicles in each range are distributed again according to their arrival time. The distribution of 100 k vehicles is shown in Figure 12. The Figure 12 shows that the arrival time follows the normal distribution whereas the travelled distance total daily trips travelled by vehicles follows a lognormal distribution.
With the knowledge of the travelled distance of a specific vehicle i, the initial SoC is computed as follows [32]:
E i 0 = ( 1 x d i d m )
where:
  • x Number of days since last charge of a battery;
  • d i Travelled distance of an electric vehicle I;
  • d m Maximum range that can an electric vehicle i travel.
The capacity of the Tesla model 3 Standard Range Plus is 60 kWh according to Table 1. The onboard charger can charge 3 kW power with the 120 V AC supply or 7 kW with the 240 AC supply. The battery takes 20 h and 8.57 h to charge at 3 kW and 7 kW, respectively. However, the fast charging utilizes an offboard charging infrastructure, and hence, the vehicle cannot be charged at home. For the DC fast charging, it takes 20 min to charge the battery up on 80%. Table 3 summarizes the approximate time required for charging this model. In this research, we consider a 240-volt AC supply, and hence, the Tesla model 3 could be charged at home using fixed power of 7 kW.
As the battery is plugged, it starts to charge at 7 kW. According to the initial state of charge, the state of charge of the battery then is expressed as follows:
E i ( t k ) = E i ( t k 1 ) + ( t k t k 1   ) P c h
where:
  • P c h Charging demand according to the type of charge;
  • K Subscript refers to the serial of specific time sample;
  • t k Time at sample k;
  • t k 1   Time at sample k − 1.
As the battery becomes fully charged, it is disconnected from the grid. Therefore, the demand due to battery i   of initial state of charge E i 0 is expressed as follows:
P i = [ u ( t t i f ) u ( t t i 0 ) ] P c h
where:
  • t Time;
  • t i 0 The time at which the vehicle is plugged to the system;
  • t i f Final time for a battery to be fully charged;
  • u ( t ) Unit step function to express the total charging time required to charge the electric vehicle.
The total power due to a specific n   vehicles could be expressed as follows:
P e = i = 1 n [ u ( t t i f ) u ( t t i 0 ) ] P c h
Assuming the 100 thousand vehicles, the total demand could be calculated using (6). A script code is developed to evaluate (6) using both normal and lognormal probability distributions of both arrival time and daily travelled distance. The daily load profile of the 100 k vehicles is shown in Figure 13. The Figure 13 shows the electric load due to electric vehicle charging from noon to noon time at different average arrival times. It is interesting to show that, in the worst case, with an average arrival time close to 9 PM, the peak of the electric vehicles demand occurs after midnight.
The electric power daily load curve is usually represented in 24 h which starts from 0 to 24, therefore, the set of daily load curves shown in Figure 13 should be modified to simulate real situation which involves the interaction between two days driving cycle as shown in Figure 14. In this scenario, it is assumed that 100 thousand vehicles start charging, usually plus the remaining vehicles, and are still connected since the previous day as exhibited in the figure. Hence, the 24 h EV daily load is introduced in a bold black line from 0 to 24 h (midnight—midnight). The final electric vehicle profile at different arrival times is shown in Figure 15. The Figure 15 shows that the peak of the EV load usually occurs between midnight and early morning. In comparison to Figure 5 which shows the Saudi Daily Load Profile, the electric vehicle demand could regulate the shape of the curve as the electric vehicle demand becomes visible to the mega grid size.
The obtained results are consistent with recent research report [43], in which the EVs demand model impact of the future national Chinese grid model (2050) is predicted. The necessary requirement to avoid excessive charging in the early evening when the grid could be congested or loaded is to apply a controlled charging mechanism to shift the EVs demand peak, as shown in Figure 15, from late evening to early morning, whatever the average arrival time of the EVs.

5. Conclusions

This work presented an overview of the Saudi electric power system. The different EVs technologies in the current market have been discussed. The EVs model quantified the impact of integrating an EVs fleet into the grid. The proposed model was obtained based on international and national public data sets such as traffic congestion and EVs daily cycle. The data were used to implement a daily load profile for EVs for a large population of vehicles. The results show that the peak load of EVs loads occurs during the late evening and early morning at different means. Further, an interesting outcome from the research is that the peak periods of the EVs occur during the off-peak time of the daily load curve. This shows that the EVs can offer more improvement to the electric grid. It is important to mention that the summative EV load of a large population of vehicles has a smooth pattern and will not affect the national electric system. Future work will discuss renewable energy coordination with EVs charging. This combination will lead to a better utilization of electricity generation from renewable energy sources. EVs smart charging is another perspective to consider in future research. Controlled charging can increase the benefit of using EVs fleet in the grid by reducing the charging price and increasing the quality and reliability of the electric grid.

Funding

This research was funded by the Deanship of Scientific Research, Qassim University, grant number 10084-enuc-2020-1-1-W.

Institutional Review Board Statement

Not applicable.

Informed Consent Statement

Not applicable.

Data Availability Statement

Not applicable.

Acknowledgments

The author gratefully acknowledge Qassim University, represented by the Deanship of Scientific Research, on the financial support for this research under the number (10084-enuc-2020-1-1-W) during the academic year 1442AH/2020 AD.

Conflicts of Interest

The authors declare no conflict of interest. The funders had no role in the design of the study; in the collection, analyses, or interpretation of data; in the writing of the manuscript; or in the decision to publish the results.

References

  1. King Abdullah Petroleum Studies and Research Center. Electric Power Generation Capacity and Number of Subscribers. Available online: https://datasource.kapsarc.org/explore/dataset/electric-power-generation-capacity-and-number-of-subscribers/information/?disjunctive.indicators (accessed on 25 May 2020).
  2. Saudi Arabia Report. 2013. Available online: https://www.eia.gov/international/analysis/country/SAU (accessed on 21 February 2021).
  3. “Saudi Vision 2023.” Vision 2030. Saudi Arabia. Available online: http://vision2030.gov.sa/en (accessed on 23 May 2020).
  4. Elshurafa, A.M.; Peerbocus, N. Electric vehicle deployment and carbon emissions in Saudi Arabia: A power system perspective. Electr. J. 2020, 33, 106774. [Google Scholar] [CrossRef]
  5. Hausfather, Z. Factcheck: How Electric Vehicles Help to Tackle Climate Change. Carbon Brief, 14 May 2019; Volume 13. Available online: https://www.eco-business.com/news/factcheck-how-electric-vehicles-help-to-tackle-climate-change/ (accessed on 13 March 2022).
  6. Bellocchi, S.; Gambini, M.; Manno, M.; Stilo, T.; Vellini, M. Positive interactions between electric vehicles and renewable energy sources in CO2-reduced energy scenarios: The Italian case. Energy 2018, 161, 172–182. [Google Scholar] [CrossRef]
  7. Vision2030. National Transformation Program Delivery Plan 2018–2020. Available online: https://www.vision2030.gov.sa/v2030/vrps/ntp/ (accessed on 18 February 2021).
  8. Wogan, D.; Carey, E.; Cooke, D. Policy Pathways to Meet Saudi Arabia’s Contribution to the Paris Agreement; Climate Change Governance: Washington, DC, USA, 2019. [Google Scholar]
  9. Office of Energy Efficiency and Renewable Energy. Electric Vehicle Benefits. Available online: https://www.energy.gov/eere/about-office-energy-efficiency-and-renewable-energy (accessed on 3 June 2020).
  10. Giráldez, J.; Roche, R.; Suryanarayanan, S.; Zimmerle, D. A Linear Programming Methodology to Quantify the Impact of PHEVs with V2G Capabilities on Distribution Systems. In Proceedings of the 2013 IEEE Green Technologies Conference (GreenTech), Denver, CO, USA, 4–5 April 2013; pp. 8–15. [Google Scholar] [CrossRef]
  11. Samper, M.E.; Vargas, A.; Eldali, F.; Suryanarayanan, S. Assessments of battery storage options for distribution expansion planning using an OpenDSS-based framework. In Proceedings of the 2017 IEEE Manchester PowerTech, Manchester, UK, 18–22 June 2017; pp. 1–6. [Google Scholar] [CrossRef]
  12. Shao, S.; Pipattanasomporn, M.; Rahman, S. Grid Integration of Electric Vehicles and Demand Response with Customer Choice. IEEE Trans. Smart Grid 2012, 3, 543–550. [Google Scholar] [CrossRef]
  13. Aljanad, A.; Mohamed, A.; Shareef, H. Impact study of plug-in electric vehicles on electric power distribution system. In Proceedings of the 2015 IEEE Student Conference on Research and Development (SCOReD), Kuala Lumpur, Malaysia, 13–14 December 2015; pp. 339–344. [Google Scholar]
  14. Inage, S.-I. Modelling Load Shifting Using Electric Vehicles in a Smart Grid Environment; OECD Publishing: Paris, France, 2010. [Google Scholar]
  15. Mai, T.T.; Jadun, P.; Logan, J.S.; McMillan, C.A.; Muratori, M.; Steinberg, D.C.; Vimmerstedt, L.J.; Haley, B.; Jones, R.; Nelson, B. Electrification Futures Study: Scenarios of Electric Technology Adoption and Power Consumption for the United States; National Renewable Energy Lab. (NREL): Golden, CO, USA, 2018. [Google Scholar]
  16. Saudi Arabia Corporate Average Fuel Economy Standard (Saudi Cafe) for Incoming Light Duty Vehicles (2016–2020); Saudi Standards, Metrology and Quality Organization: Riyadh, Saudi Arabia, 2018.
  17. The Saudi Press Agency. SASO to Organize a Virtual Workshop on Electric Vehicle Infrastructure. Available online: http://www.puntofocal.gov.ar/notific_otros_miembros/sau1046_t.pdf (accessed on 28 June 2020).
  18. Green Riyadh Initiative. Royal Commission for Riyadh City. Available online: https://www.rcrc.gov.sa/ar/projects/green-riyadh (accessed on 27 February 2022).
  19. Irle, R. Global Plug-in Vehicle Sales Reached over 3.2 Million in 2020. Available online: EV-volumes.com (accessed on 23 June 2021).
  20. Berckmans, G.; Messagie, M.; Smekens, J.; Omar, N.; Vanhaverbeke, L.; Van Mierlo, J. Cost Projection of State of the Art Lithium-Ion Batteries for Electric Vehicles Up to 2030. Energies 2017, 10, 1314. [Google Scholar] [CrossRef] [Green Version]
  21. IEA. Net Zero by 2050 A Roadmap for the Global Energy Sector. 2021. Available online: https://www.iea.org/ (accessed on 9 November 2021).
  22. Kane, M. Compare Electric Cars: EV Range, Specs, Pricing & More. Available online: https://insideevs.com/reviews/344001/compare-evs/ (accessed on 13 December 2021).
  23. Raff, R.; Golub, V.; Pelin, D.; Topić, D. Overview of charging modes and connectors for the electric vehicles. In Proceedings of the 2019 7th International Youth Conference on Energy (IYCE), Bled, Slovenia, 3–6 July 2019; pp. 1–6. [Google Scholar]
  24. Parchomiuk, M.; Moradewicz, A.; Gawiński, H. An Overview of Electric Vehicles Fast Charging Infrastructure. In Proceedings of the 2019 Progress in Applied Electrical Engineering (PAEE), Kościelisko, Poland, 17–21 June 2019; pp. 1–5. [Google Scholar]
  25. Falvo, M.C.; Sbordone, D.; Bayram, I.S.; Devetsikiotis, M. EV charging stations and modes: International standards. In Proceedings of the 2014 International Symposium on Power Electronics, Electrical Drives, Automation and Motion, Ischia, Italy, 18–20 June 2014; pp. 1134–1139. [Google Scholar] [CrossRef]
  26. Ronanki, D.; Kelkar, A.; Williamson, S.S. Extreme Fast Charging Technology—Prospects to Enhance Sustainable Electric Transportation. Energies 2019, 12, 3721. [Google Scholar] [CrossRef] [Green Version]
  27. Annual Statistical Booklet for Electricity and Seawater Desalination Industries. 2019. Available online: www.ecra.gov.sa/en-us/MediaCenter/doclib2/Pages/SubCategoryList.aspx?categoryID=5 (accessed on 22 February 2020).
  28. Luomi, T.A.S.M.; Howarth, N. Measuring to Manage: The Case for Improving CO2 Monitoring and Reporting in Saudi Arabia; King Abdullah Petroleum Studies and Research Center: Riyadh, Saudi Arabia, 2021. [Google Scholar]
  29. Almohaimeed, S.A.; Abdel-Akher, M. Power Quality Issues and Mitigation for Electric Grids with Wind Power Penetration. Appl. Sci. 2020, 10, 8852. [Google Scholar] [CrossRef]
  30. Ministry of Energy. The Kingdom of Saudi Arabia National Renewable Energy Program. Available online: https://bit.ly/35fmfet (accessed on 20 November 2020).
  31. National Travel Survey. Available online: https://www.gov.uk/government/uploads/system/uploads/attachment_data/file/8932/nts2010-01.pdf (accessed on 20 October 2021).
  32. Qian, K.; Zhou, C.; Allan, M.; Yuan, Y. Modeling of load demand due to EV battery charging in distribution systems. Power Syst. 2011, 26, 802–810. [Google Scholar] [CrossRef]
  33. Irtija, N.; Sangoleye, F.; Tsiropoulou, E.E. Contract-theoretic demand response management in smart grid systems. IEEE Access 2020, 8, 184976–184987. [Google Scholar] [CrossRef]
  34. Susowake, Y.; Masrur, H.; Yabiku, T.; Senjyu, T.; Howlader, A.M.; Abdel-Akher, M.; Hemeida, A.M. A multi-objective optimization approach towards a proposed smart apartment with demand-response in Japan. Energies 2020, 13, 127. [Google Scholar] [CrossRef] [Green Version]
  35. Tian, H.; Tzelepis, D.; Papadopoulos, P.N. Electric Vehicle charger static and dynamic modelling for power system studies. Energies 2021, 14, 1801. [Google Scholar] [CrossRef]
  36. Ul-Haq, A.; Azhar, M.; Mahmoud, Y.; Perwaiz, A.; Al-Ammar, E.A. Probabilistic modeling of electric vehicle charging pattern associated with residential load for voltage unbalance assessment. Energies 2017, 10, 1351. [Google Scholar] [CrossRef]
  37. Moeini-Aghtaie, M.; Abbaspour, A.; Fotuhi-Firuzabad, M.; Dehghanian, P. Optimized Probabilistic PHEVs Demand Management in the Context of Energy Hubs. IEEE Trans. Power Deliv. 2015, 30, 996–1006. [Google Scholar] [CrossRef]
  38. GASTAT. Statistical Yearbook. In Chapter 14 Transportation, Vehicles Imported by Model; GASTAT: Riyadh, Saudi Arabia, 2019; Volume 14. [Google Scholar]
  39. Davis, S.C.; Boundy, R.G. (Eds.) Transportation Energy Data Book, Edition 39; Oak Ridge National Laboratory: Oak Ridge, TN, USA, 2021. Available online: Tedb.ornl.gov (accessed on 19 August 2021).
  40. Chiara, B.D.; Deflorio, F.; Pellicelli, M.; Castello, L.; Eid, M. Perspectives on Electrification for the Automotive Sector: A Critical Review of Average Daily Distances by Light-Duty Vehicles, Required Range, and Economic Outcomes. Sustainability 2019, 11, 5784. [Google Scholar] [CrossRef] [Green Version]
  41. Pearre, N.S.; Kempton, W.; Guensler, R.L.; Elango, V.V. Electric vehicles: How much range is required for a day’s driving? Transp. Res. Part C Emerg. Technol. 2011, 19, 1171–1184. [Google Scholar] [CrossRef]
  42. U.S. Department of Transportation, Fedral Highway Administration. National Houshold Travel Survey, 2017 Summary Statistics for Demographic Characteristics and Travel. Available online: https://nhts.ornl.gov/ (accessed on 19 August 2021).
  43. Li, B.; Chen, M.; Kammen, D.M.; Kang, W.; Qian, X.; Zhang, L. Electric vehicle’s impacts on China’s electricity load profiles based on driving patterns and demographics. Energy Rep. 2022, 8, 26–35. [Google Scholar] [CrossRef]
Figure 1. Global yearly electric vehicles sales from 2010 to 2020.
Wevj 13 00084 g001
Figure 2. Electric vehicles sales by country in 2020.
Wevj 13 00084 g002
Figure 3. Popular EV chargers plug.
Wevj 13 00084 g003
Figure 4. Operating regions in the Kingdom of Saudi Arabia.
Wevj 13 00084 g004
Figure 5. Typical daily load curves of the Saudi electrical power system of the year 2019.
Wevj 13 00084 g005
Figure 6. Typical Load duration curve of the national Saudi power system 2019.
Wevj 13 00084 g006
Figure 7. Riyadh city traffic during the second week of February 2017.
Wevj 13 00084 g007
Figure 8. Residential Electric Vehicles charging times, California Vehicle Survey, May 2018.
Wevj 13 00084 g008
Figure 9. Normal distribution of arrival time of 100 K vehicle at various means and standard deviations values. (a) Standard deviation is 5 h and at different mean values; (b) Mean is at midnight (MN) and at different standard deviation values.
Wevj 13 00084 g009
Figure 10. Distribution of daily trips in ranges of 8 km according to the US national transportation survey 2017.
Wevj 13 00084 g010
Figure 11. Distribution of 100 k vehicles in ranges of 5 km at different standard deviations using lognormal distribution.
Wevj 13 00084 g011
Figure 12. Distribution of both arrival time and travelled distance for 100 k vehicles.
Wevj 13 00084 g012
Figure 13. EV demand of 100 thousand vehicles at different μ t values.
Wevj 13 00084 g013
Figure 14. Derivation of the 24 h demand profile of a daily 100 thousand 100 vehicles distributions.
Wevj 13 00084 g014
Figure 15. Final set of the load curve of EVs demand at different mean times.
Wevj 13 00084 g015
Table 1. Sample of recent EVs models in the US market.
ModelDriveTypeCapacity (kWh)Range (km)
2021 Tesla Model S Long Range (AWD) 19″AWDTesla100652
2021 Tesla Model S Plaid 19″AWDTesla100628
2021 Tesla Model X Long Range (AWD) 20″AWDTesla100579
2021 Tesla Model X Plaid 20″AWDTesla100547
2021 Ford Mustang Mach-E Route 1 ER RWDRWDFord98.8491
2021 Ford Mustang Mach-E Premium ER RWDRWDFord98.8483
2021 Ford Mustang Mach-E Premium ER AWDAWDFord98.8434
2021 Ford Mustang Mach-E GT ER AWDAWDFord98.8402
2021 Ford Mustang Mach-E GT Perf. ER AWDAWDFord98.8378
2021 Audi e-tronAWDAudi95357
2021 Audi e-tron SportbackAWDAudi95351
2021 Porsche Taycan (93 kWh)RWDPorsche93.4362
2021 Porsche Taycan 4S (93 kWh)AWDPorsche93.4365
2021 Porsche Taycan Turbo (93 kWh)AWDPorsche93.4341
2021 Porsche Taycan Turbo S (93 kWh)AWDPorsche93.4323
2022 Jaguar I-PACE EV400AWDJaguar90377
2021 Volkswagen ID.4 ProRWDVolkswagen82418
2021 Volkswagen ID.4 Pro SRWDVolkswagen82402
2021 Tesla Model 3 Long Range AWDAWDTesla80568
2021 Tesla Model 3 Perf. LR AWD 20″AWDTesla80507
2021 Tesla Model Y Long Range AWD 19″AWDTesla80525
2021 Tesla Model Y Perf. LR AWD 21″AWDTesla80488
2021 Porsche Taycan (79 kWh)RWDPorsche79.2322
2021 Porsche Taycan 4S (79 kWh)AWDPorsche79.2320
2021 Polestar 2AWDPorsche78375
2021 Volvo XC40 RechargeAWDVolvo78335
2021 Ford Mustang Mach-E Select SR RWDRWDFord75.7370
2021 Ford Mustang Mach-E Select SR AWDAWDFord75.7339
2022 Chevrolet Bolt EVFWDChevrolet65417
2022 Chevrolet Bolt EUVFWDChevrolet65397
2021 Hyundai Kona ElectricFWDHyundai64415
2021 Kia Niro EV (e-Niro)FWDKia64385
2021 Nissan LEAF e+ S (62 kWh)FWDNissan62364
2021 Nissan LEAF e+ SV/SL (62 kWh)FWDNissan62346
2021 Tesla Model 3 Standard Range PlusRWDTesla60423
2021 BMW i3RWDBMW42.2246
2021 BMW i3sRWDBMW42.2246
2021 Nissan LEAF S (40 kWh)FWDNissan40240
2021 Hyundai IONIQ ElectricFWDHyundai38.3274
Table 2. Number of imported vehicles by type during the period 2015–2019.
TypeNumber
20152016201720182019Total
Buses24,43111,83910,502878515,75571,312
Special Purpose Vehicles34332086111094110428612
Passenger Cars and Jeeps839,239618,382475,722422,185539,9932,895,521
Table 3. Charging options of Tesla Model 3.
TypeRapid ChargingFastSlow
Charging demand120 kW100 kW50 kW22 kW7 kW3 kW
Time (Hr)0.330.501.005.508.5720.00
Energy (kWhr)0–80%0–100%
Publisher’s Note: MDPI stays neutral with regard to jurisdictional claims in published maps and institutional affiliations.

