Abstract
During the charging process of electric vehicles (EV), the circuit inside the charger plug is connected in series, the charger input voltage does not match the rated input voltage, the temperature caused by the severe heating of the charging time is too high for too long, and other factors are very likely to trigger a fire in the vehicle charging pile. In this paper, an improved You Only Look Once v4 (YOLOv4) real-time target detection algorithm based on machine vision is proposed to monitor the site based on existing monitoring equipment, transmit live video information in real-time, expand the monitoring range, and significantly reduce the cost of use. During the experiment, the improved neural network model was trained by a homemade fire video image dataset, and a K-means clustering algorithm iwasintroduced to recalculate the anchor frame size for the specific object of flame; the existing dataset was used to perform multiple divisions by using a tenfold cross-validation algorithm, thus avoiding the selection of chance hyperparameters and models that do not have generalization ability because of special divisions. The experimental results show that the improved algorithm is fast and accurate in detecting large-size flames in real-time and small-size flames at the beginning of a fire, with a detection speed of 43 fps/s, mAP value of 91.53%, and F1 value of 0.91. Compared with YOLOv3 and YOLOv4 models, the improved model is sensitive to detecting different sizes of flames. It can suppress false alarms well in a variety of complex lighting environments. The prediction frame size fits the area where the target is located, the detection accuracy remains stable, and the comprehensive performance of the network model is significantly improved to meet the demand of real-time monitoring. It is significant for developing the EV industry and enhancing emergency response capability.
1. Introduction
New energy vehicles, especially electric vehicles (EV), have experienced explosive growth in the past few years. Vehicle safety accidents have shown a high incidence year by year, which has become one of the most urgent problems in today’s society. A total of 51 EV fires occurred in 2018; 63 EV fires occurred in 2019; 124 EV fires occurred in 2020, and charging safety has become the key to the safe operation of new energy vehicles. Most electric vehicle charging stations are built near parking lots or gas stations and are unattended. During charging piles and onboard batteries, there are problems such as line overload, short circuits, poor contact, improper charging operation, and heat dissipation failure under high-temperature conditions, which are very likely to cause fire accidents. With the further marketization of new energy, safety issues have become a significant obstacle to their promotion.
To respond quickly to electric vehicle fire incidents and stop the damage in time, researchers have proposed various real-time fire detection techniques. Machine vision algorithms based on convolutional neural networks (CNN) have shown excellent performance in vision tasks [1]. Several studies have been conducted in recent years to apply machine vision to fire detection. In [2],a TADS (target-learning and deep, wise separability) algorithm based on target-awareness and deep, wise separability was proposed, where deep feature mappings obtained through a pre-trained target-aware network are used to model these arbitrary forms of objects to distinguish them from unpredictable and complex environments. The convolution kernel is used to improve the operation speed of the algorithm and to meet the requirement of increased detection speed for real-time fire spread. The work in [3] proposed a multiscale prediction framework based on CNN networks to improve the sensitivity of detecting different sizes of flames in fire pictures with an F1 score of 0.9789, which showed outstanding performance in fire detection tasks. A new image fire detection algorithm based on the CNN model was proposed in the [4], which can automatically extract complex image fire features and successfully detect fires in different scenes with higher accuracy than other algorithms, solving the problems of low precision, detection delay, and the high computational effort of traditional algorithms.
YOLO series algorithms belong to one-stage detection algorithms. In [5], a modified YOLOv1-based neural network was proposed for object detection. In [6,7,8], the YOLOv2 lgorithm was widely used in target detection. In [9], An automatic image recognition diagnosis system was established using a YOLOv2 neural network through deep learning, the performance of the system in thyroid nodule diagnosis was evaluated, and the value of artificial intelligence in clinical practice was discussed. In [10,11,12,13], The improved YOLOv3 network was applied to visual detection tasks such as pedestrian vehicles with good detection results. In [14], an improved YOLOv3 algorithm as proposed to build a real-time fire detector camera on a Banana Pi M3 board and used the improved particular convolutional neural network model to detect the fire region. The experimental results show that the proposed method successfully detects the fire candidate region and achieves seamless classification performance.
In [15,16,17,18,19,20,21], the YOLOv4 network was applied to target detection tasks such as agricultural product inspection, industrial safety, and robot vision and achieved good detection results. In [22], a method to detect fires and PPEs to assist in monitoring and evacuation tasks was presented, using deep learning-based YOLOv4 and YOLOv4 tiny algorithms to perform the detection task, using a homemade fire dataset to train the model with a maximum average accuracy (mAP) of 76.86%. The authors of [23] verify that machine learning methods can provide seamless monitoring of red foxes in a laboratory setting, including classification of activity patterns, using surveillance video as an input source for YOLOv4 network model detection, real-time detection, and evaluation of their behavior, and experiments show that machine vision-based evaluation methods outperform other evaluation methods.
Aiming at the characteristics of flame feature target with transient, this paper proposes an improved YOLOv4 real-time target detection algorithm based on machine vision, based on the existing monitoring equipment for site monitoring, real-time transmission of live video information, and real-time detection of fire information. The improved neural network model was trained by a homemade fire video image dataset. The existing algorithm was improved by introducing a K-means clustering algorithm and tenfold cross-validation algorithm to achieve better detection results.
The main contributions of our work can be summarized as follows:
- (1)
- Invoking the tenfold cross-validation algorithm and the K-means clustering algorithm in the original algorithm, which improves the generalization ability of the model and enhances not only the training speed but also the accuracy of the detection results.
- (2)
- For the problem of the low recognition rate of small-target object detection in the YOLO series algorithm, the proportion of small-size flame images in the flame dataset was increased to improve the sensitivity density of small-flame detection at the early stage of fire.
- (3)
- The on-site monitoring video of electric vehicle charging stations were used as the input video source for neural network detection, which can realize simultaneous monitoring of multiple charging stations and significantly shorten the fire emergency response time and has a good detection effect in the application of video stream-based target detection.
2. Construction of Flame Dataset
2.1. Flame Image Selection
Most of the existing generic image/video fire databases are familiar fire images, such as forest fires, building fires, factory fires, etc. There is no large fire image dataset for electric vehicle charging stations. If a generic fire dataset is chosen as the training sample, it cannot meet the target detection accuracy requirements in a specific environment. Therefore, in this paper, we constructed our flame dataset according to the particular scenario of electric vehicle charging stations.
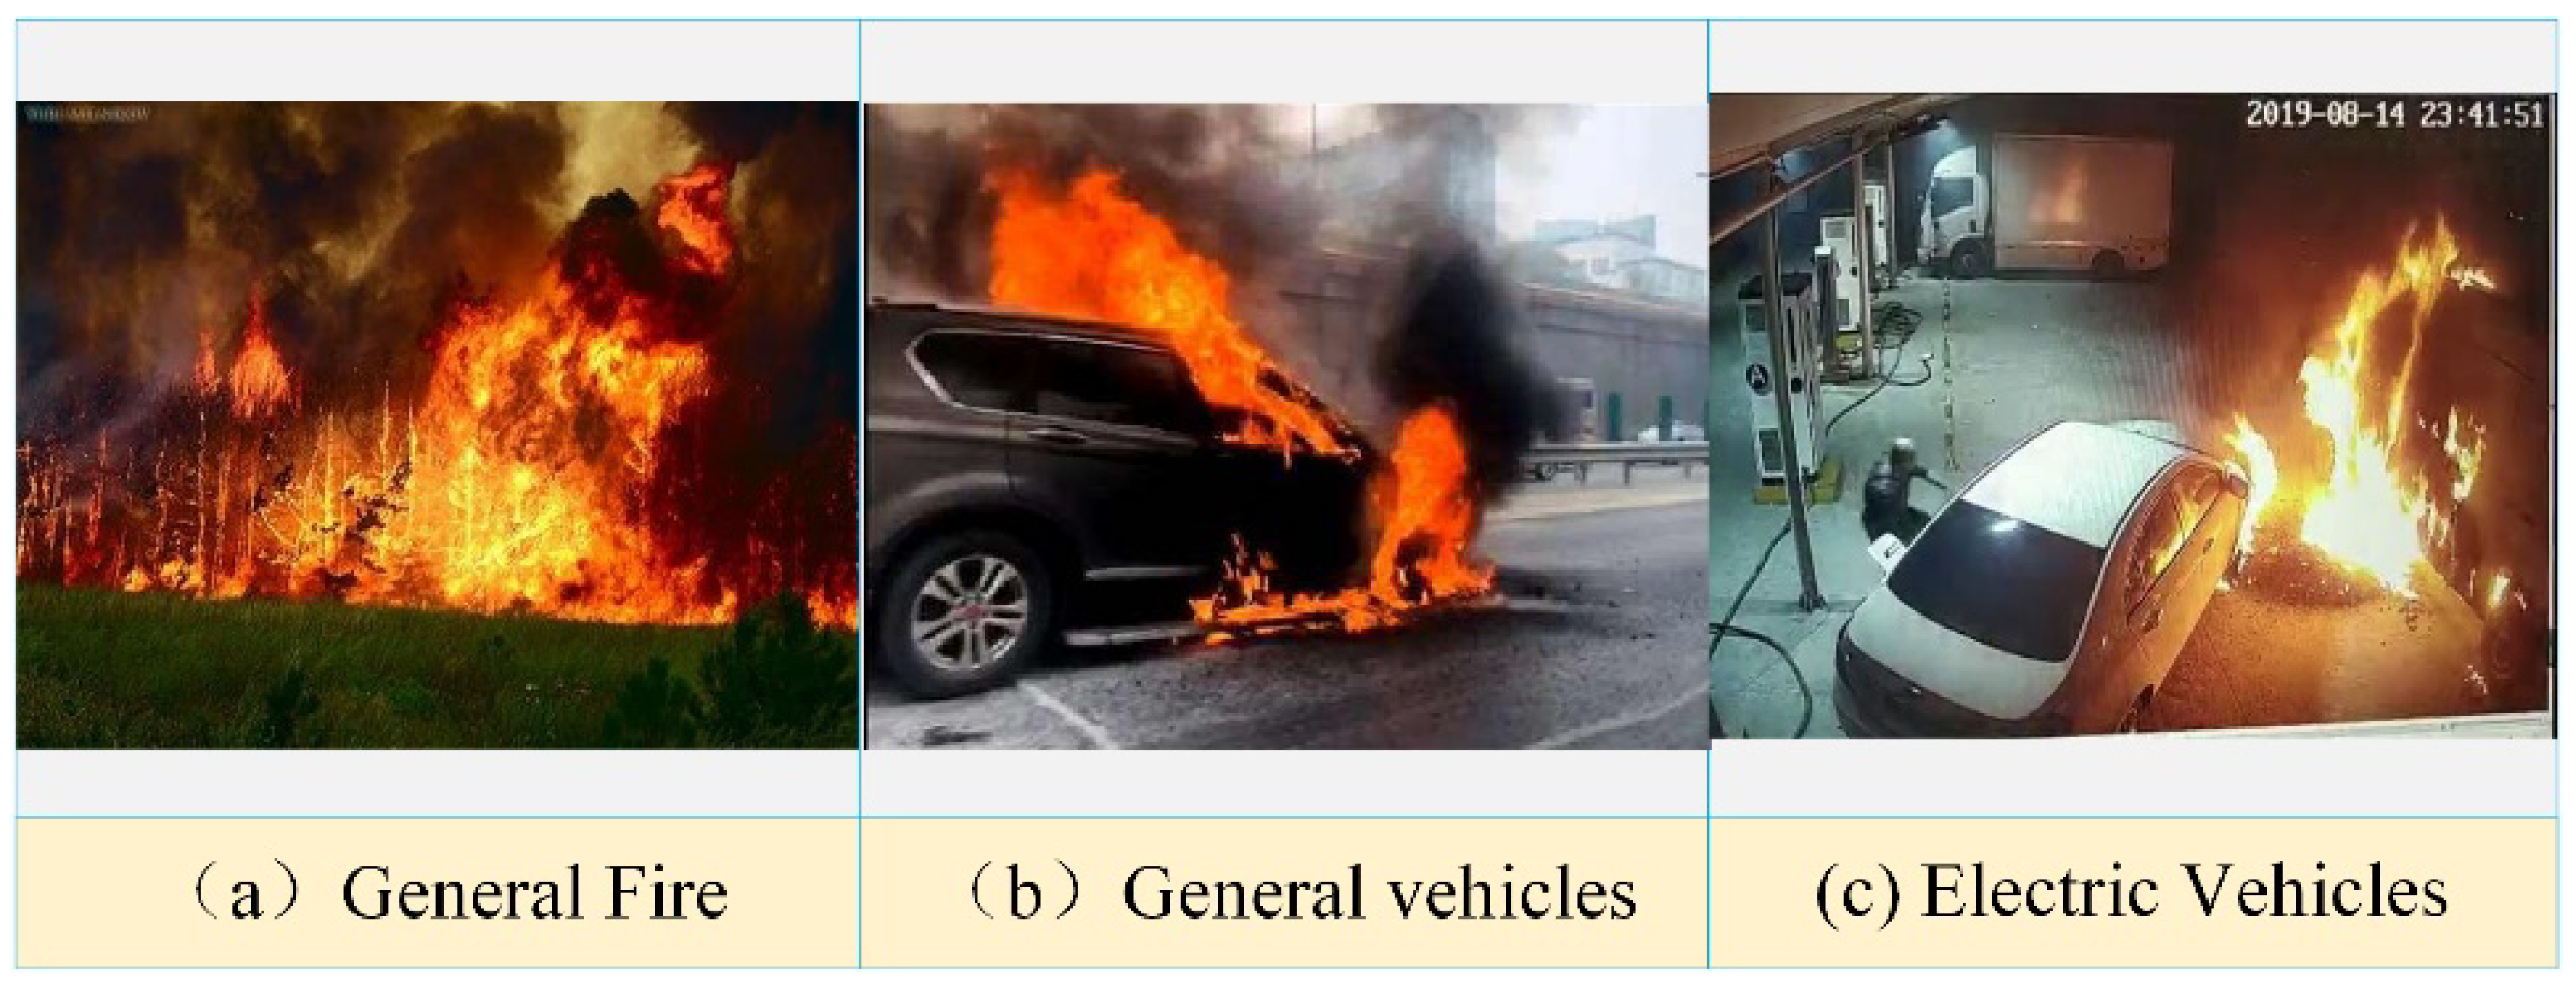
The electric vehicle charging station fire dataset consists of three parts, as shown in Figure 1 and described in the following:

Figure 1.
Dataset images.
- (1)
- A total of 1000 images of typical fires selected from the general-purpose dataset.
- (2)
- A total of 1000 images related to charging pile, electric vehicle, and charging station fires selected from existing public fire image/video databases and experimental databases of research institutions.
- (3)
- Extracting images from existing electric vehicle and charging station fire videos on the web with video clips of 1280 pixels (horizontal) × 720 pixels (vertical) and 30 frames per second (fps), and selecting a total of 1000 images.
In the dataset construction process, to ensure the quality of the images, the width or height of the selected images were set to at least 400 pixels, and all the duplicate, blurred, light pollution images were removed, to finally obtain 3000 images, as shown in Table 1. Among them, 1675 images contain a single flame, 1325 images contain multiple and overlapping flames, 1860 images are fire images under light conditions, and 1140 images are under backlight and dark conditions. labelImg software was used to label the color map of the flame in the experimental images, generate the corresponding XML file containing the coordinates of the upper left and lower right corners of the flame, and follow the VOC dataset format used for the division.

Table 1.
Electric vehicle flame dataset information.
2.2. Division of Fire Dataset
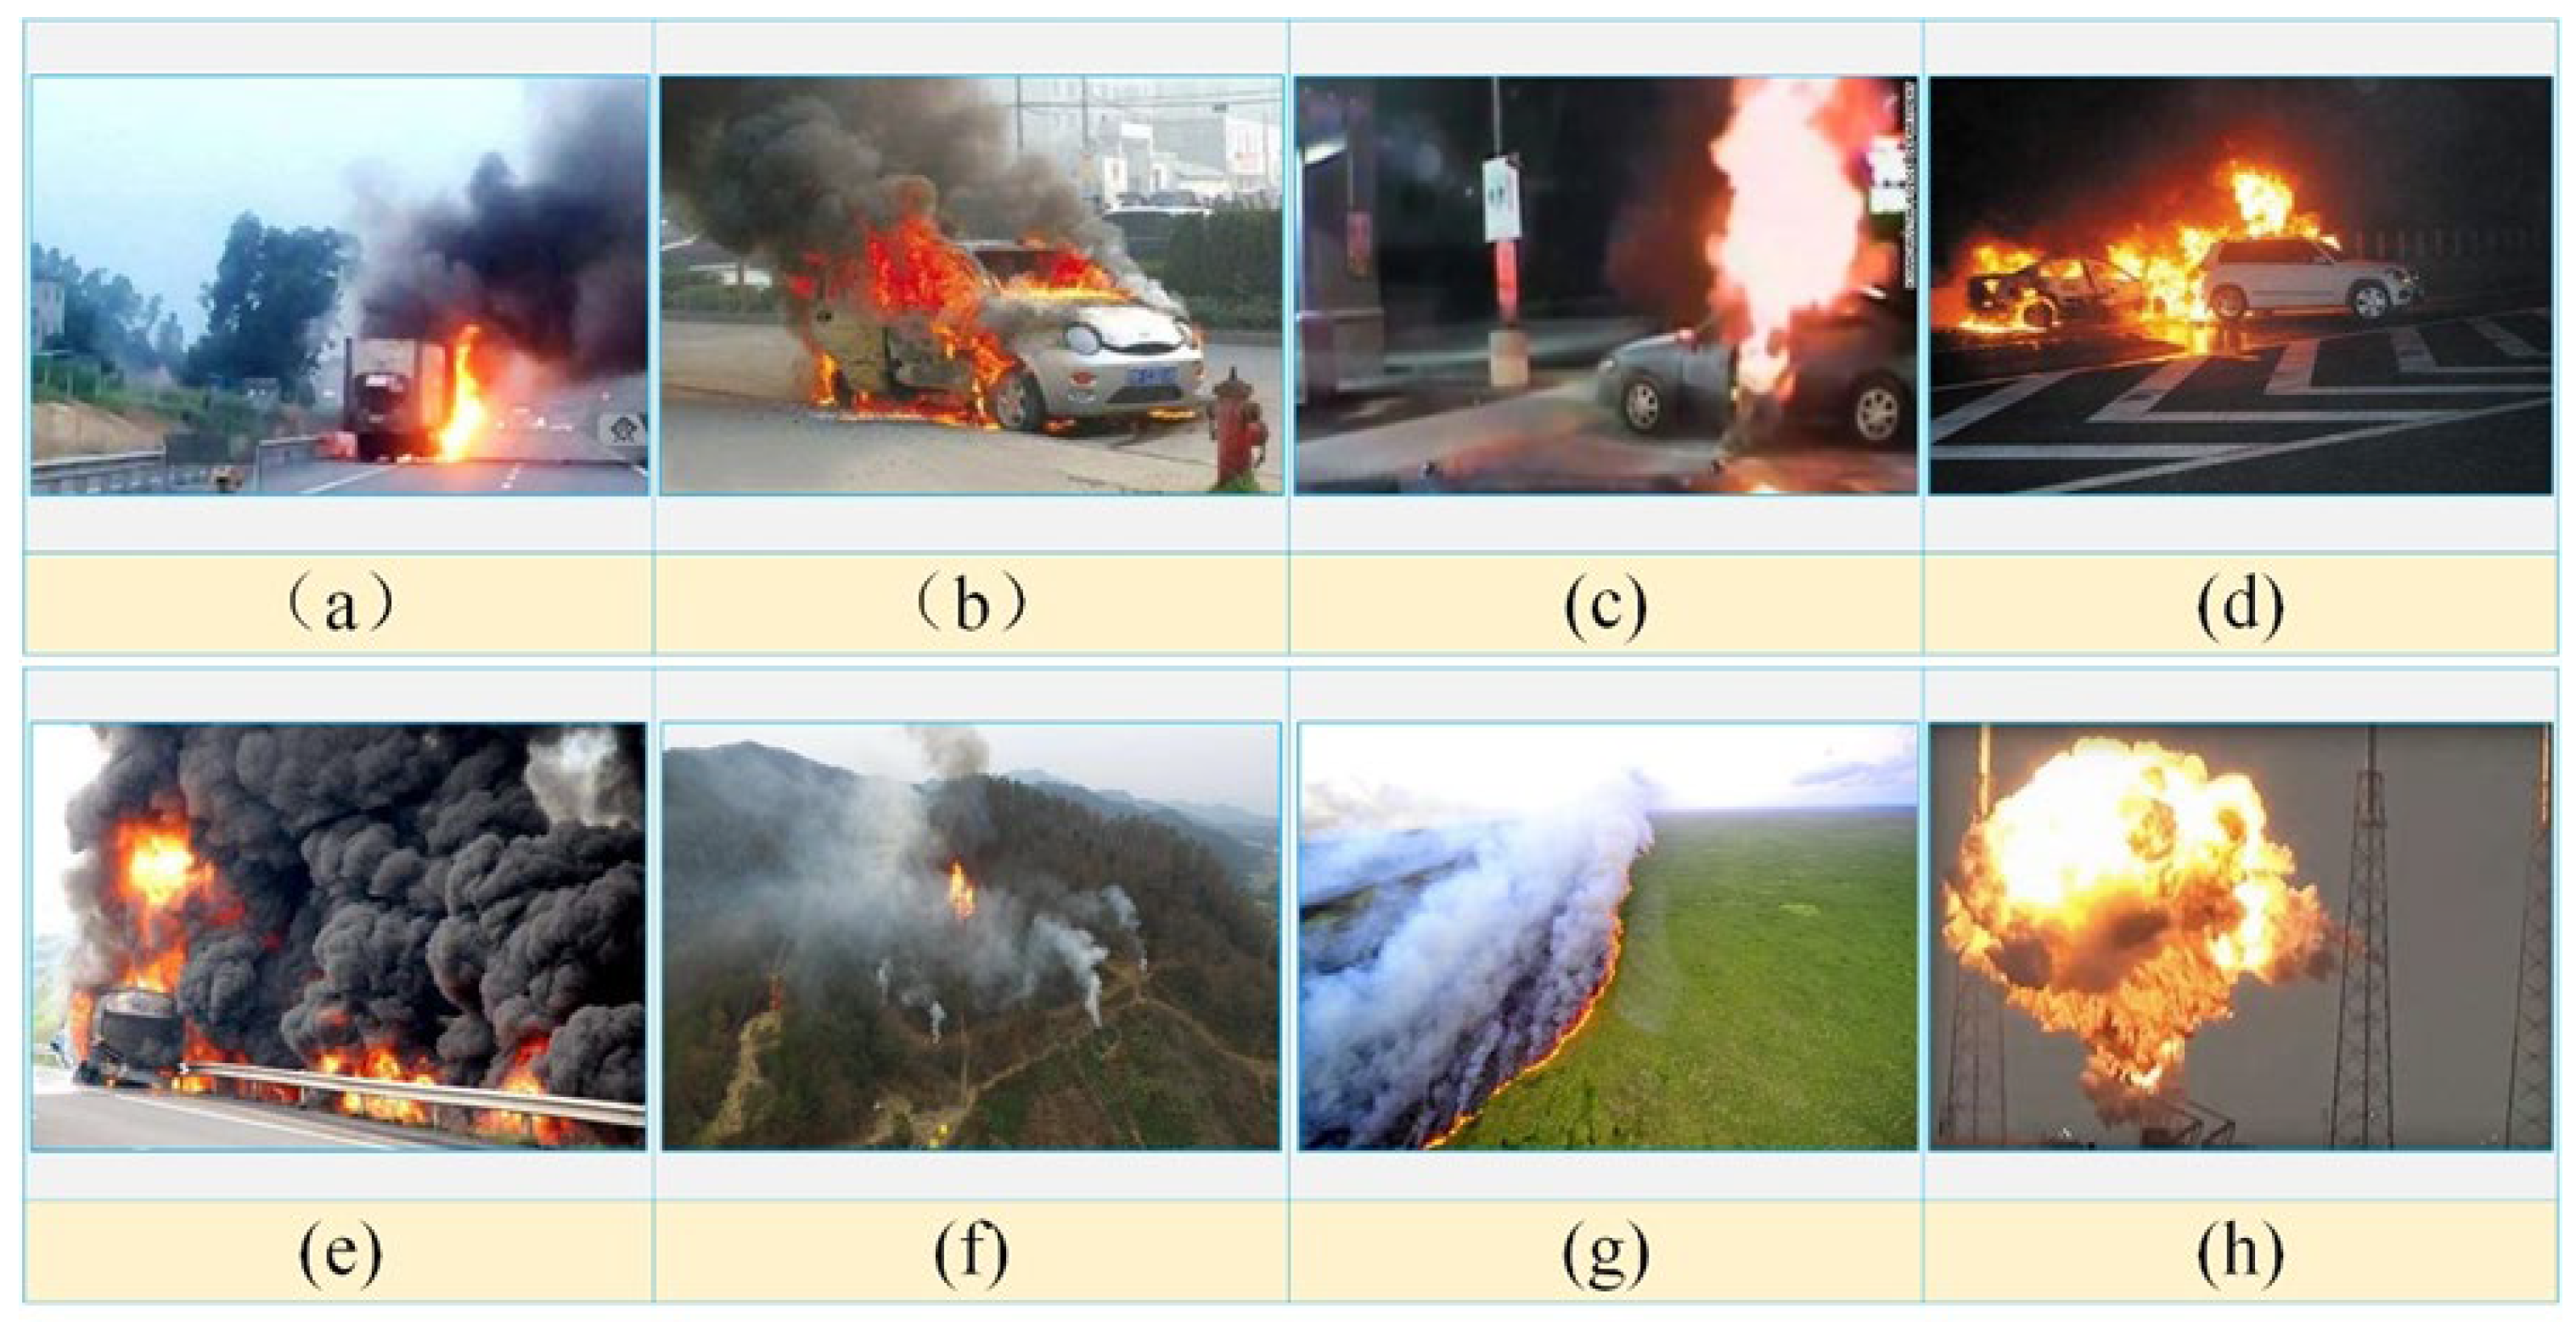
The flame combustion temperature, under usual conditions, generally does not exceed 4000 degrees Celsius, so the color of the flame typically varies in the range of red-orange to yellow-white. Still, the flame color can change significantly during the combustion process in different media. When combustion occurs in electrical equipment of electric vehicle charging stations, it is susceptible to external factors that lead to complex and variable characteristics such as the shape, area, profile, and color of the flame. Under different wind environments and airflow movement conditions around the flame, the flame profile changes rapidly and irregularly [24]. The large amount of black smoke produced by the combustion of cables in electrical equipment can lead to the fusion of smoke with the flame and affects the brightness and shape of the flame. At the same time, there is also a change in the texture of the flame inside the combustion process. The above characteristics will also change significantly at different stages of flame combustion. The pictures of flames under different conditions are shown in Figure 2.

Figure 2.
Flame characteristics under different conditions.
Figure 2a,b shows that vehicles caught fire at different distances under light conditions. Figure 2c,d shows that vehicles caught fire at various distances in dark conditions. Figure 2e represents the flame covered by dense smoke. Figure 2f represents a small flame at a long distance. Figure 2g represents a long line of irregular side flame. Figure 2h represents a spherical, irregular side flame.
In the process of conventional target detection, the shape contour of the detected object changes relatively minor, mostly in spatial angle, distance, and pose changes. The model accuracy can be improved by increasing the number of images and training iterations in dataset construction. To avoid selecting a chance parameter model without generalization capability due to the single division of the training and test sets, the existing dataset wasdivided several times according to the cross-validation principle [25] to reduce the chance and improve the generalization capability of the model. The dataset was divided into two parts, one for the training set, which was used to train the network model, and one for the test set, which was used to test the performance of the network model. The test set should not comprise too many or too few images, and the division ratio for this paper was 9:1, 2700 images in the training set and 300 images in the test set.
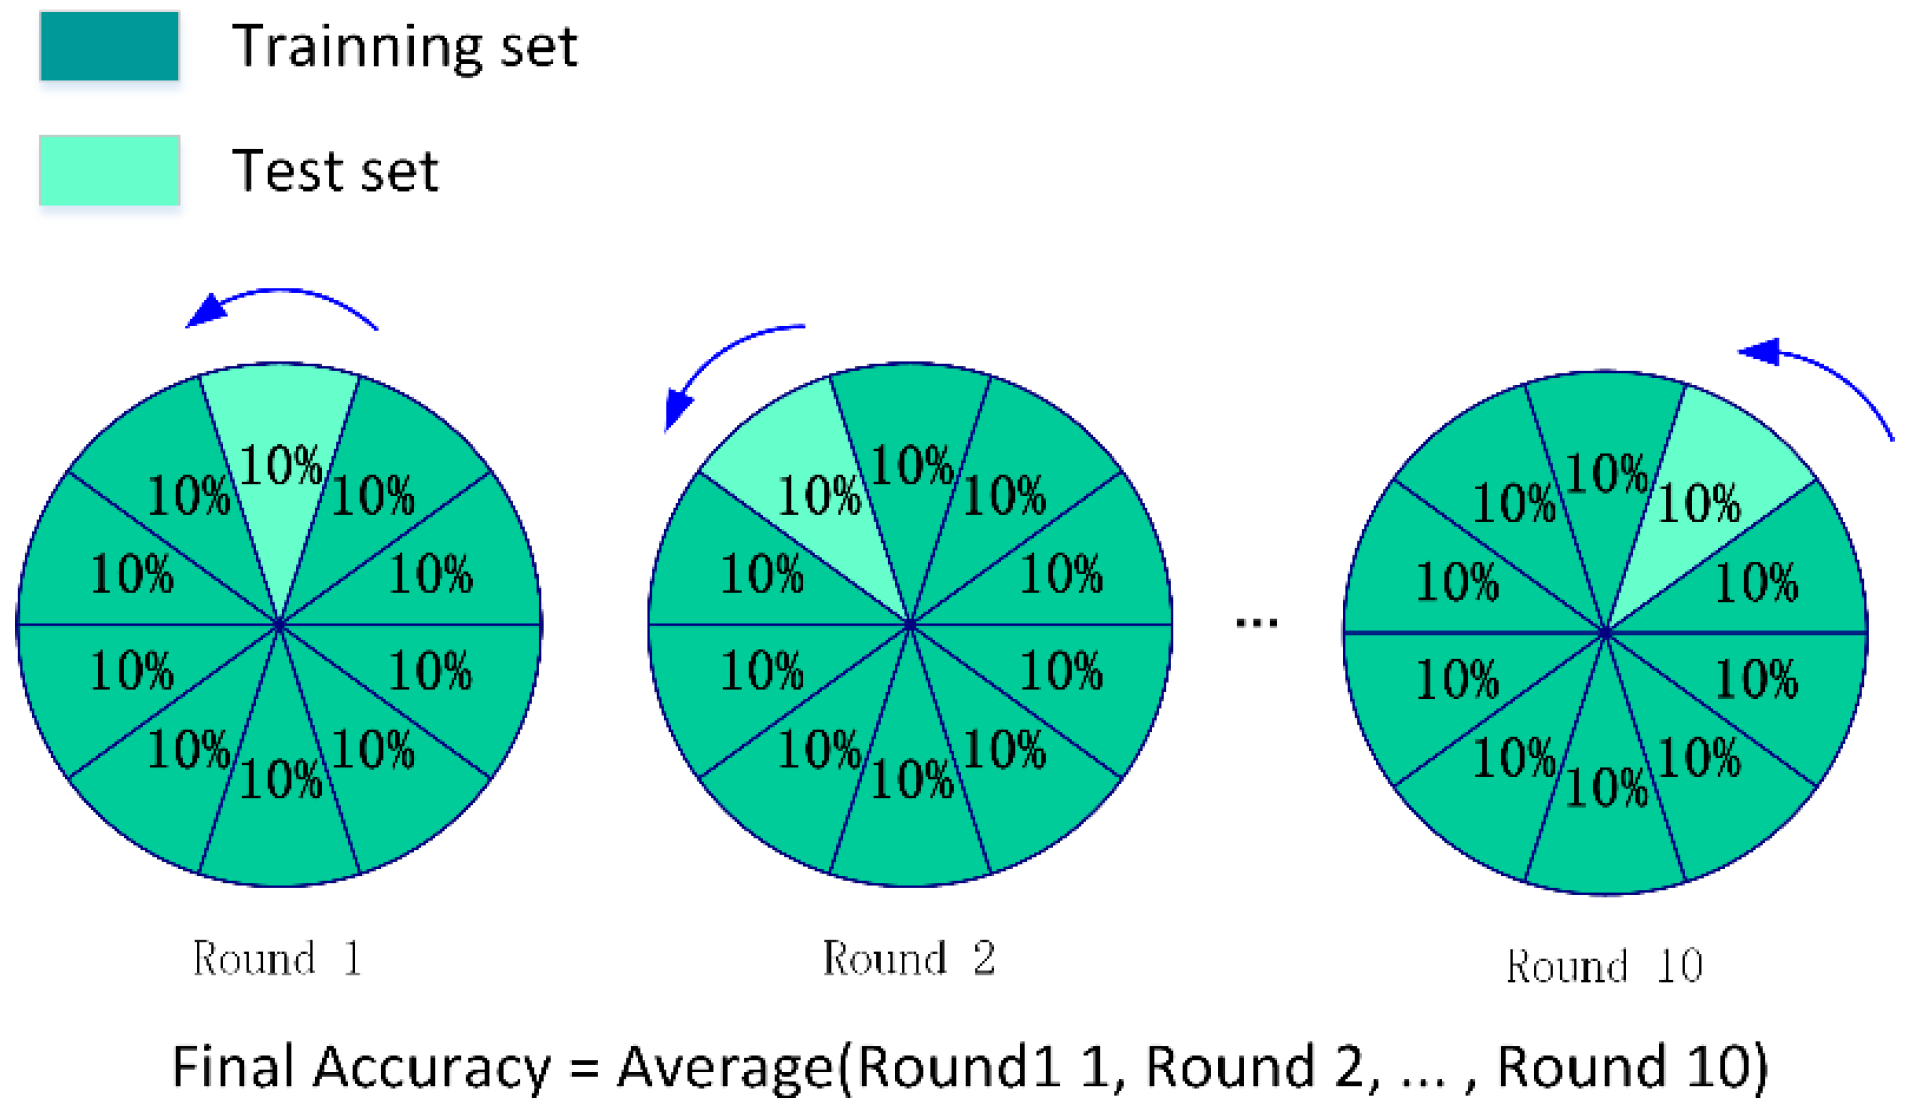
The EV charging station fire dataset was divided into ten copies, and one copy was selected as the test set and the others as the training set for training and validation. The process was performed ten times in sequence, as shown in Figure 3. In this process, the hyperparameters were kept consistent. Then, the average training loss and average validation loss of the ten models were taken to measure the goodness of the parameters. Finally, an optimal parameter was selected, and the optimal training model was obtained by using all images as the training set and training with this parameter. Compared with other methods, this improved algorithm model has lower variance and can check whether the model is over-fitted.

Figure 3.
Schematic diagram of the tenfold cross-validation algorithm flow.
3. Design of Improved YOLOv4-Based Fire Detection Model
3.1. YOLOv4 Model-Based Detection Process Design
YOLOv4 is the fourth version of the YOLO algorithm. YOLOv1 laid the foundation of the algorithm, and the subsequent algorithms improved it and enhanced its performance. YOLOv2 improved the feature extraction network to Darknet-19, and Darknet-53 was proposed for the YOLOv3 algorithm, and thus became CSPDarknet-53 in YOLOv4. The test results of different target detection algorithms on the COCO dataset are shown in Table 2. From Table 2, we can see that YOLOv4 has the best test results.
Table 2.
Test results of different target detection algorithms on the COCO dataset.
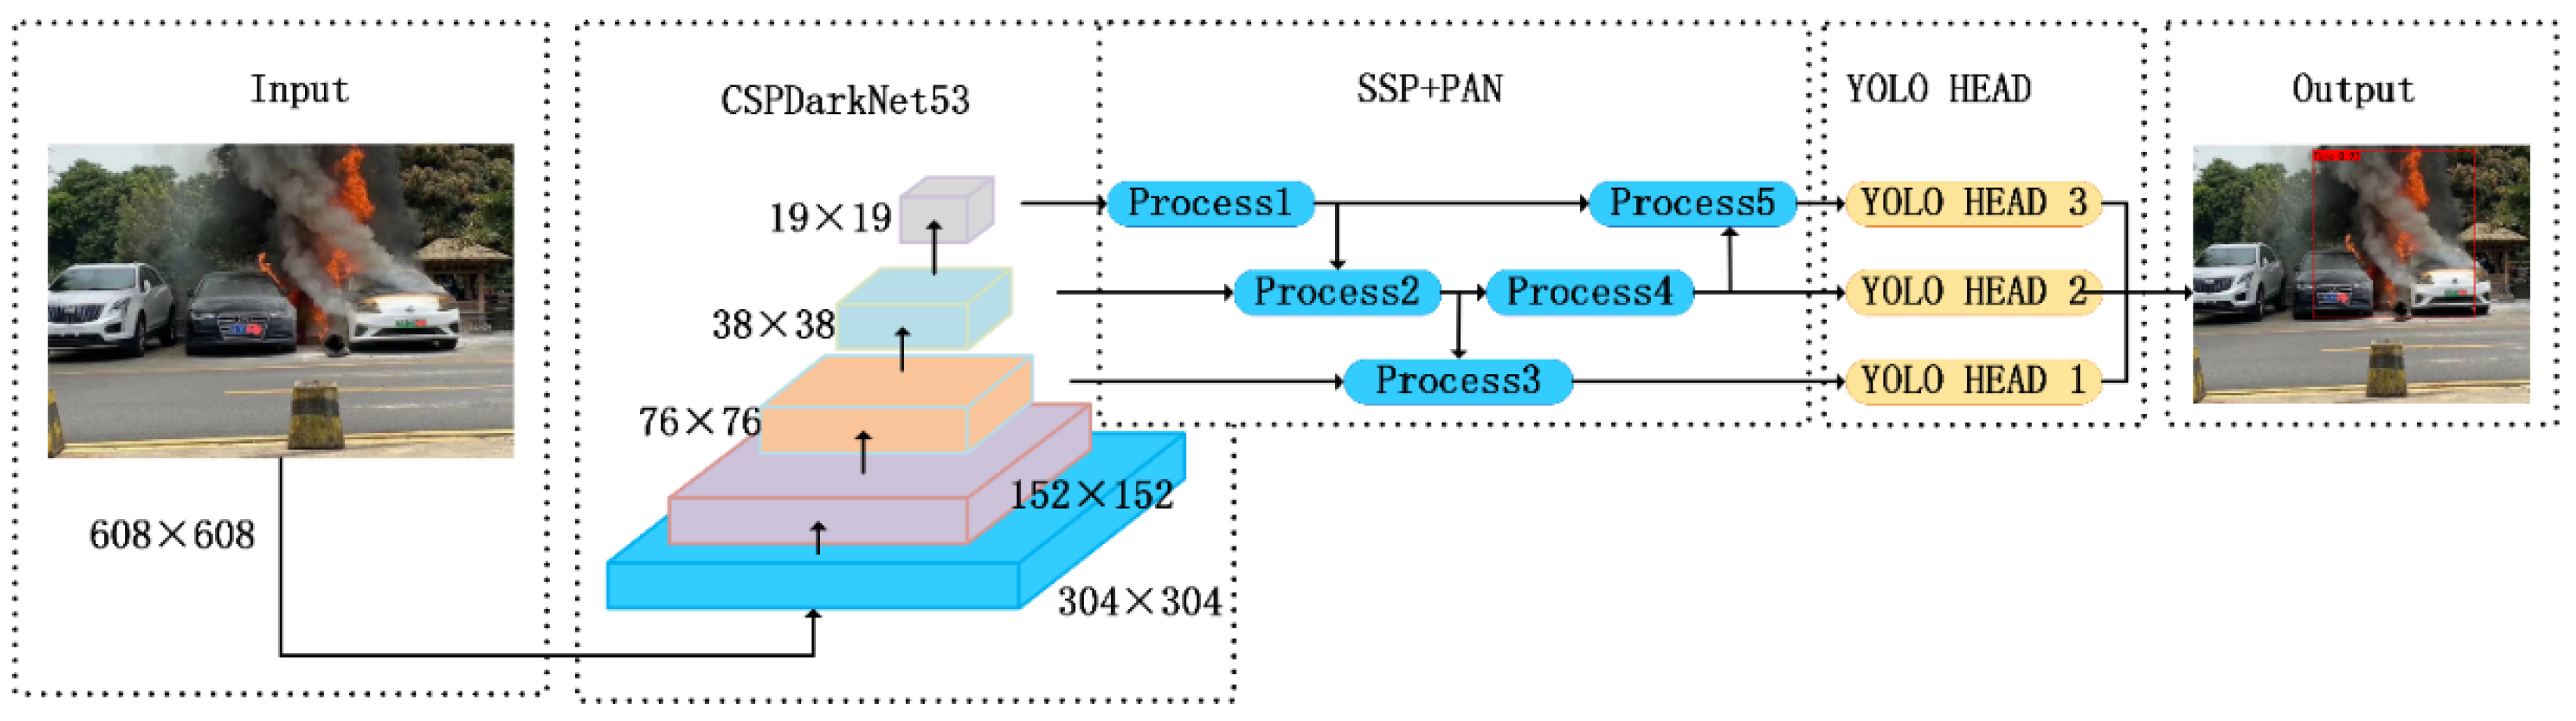
The YOLOv4 algorithm is a feature extraction network based on convolutional neural networks for feature extraction, which can directly predict the class and location of detection targets [26]. The network introduces several techniques such as the path aggregation network (PANet), spatial pyramidal pooling (SPP), mosaic data augmentation, Mish activation function, self-adversarial training, CMBN, etc. It removes all the connections and pooling operations in the original network and adds some remaining units, uses 33 and 11 convolutional layers, and a low-sampling network with a step size of 2, which significantly improves the detection accuracy. The backbone network adopts CSPDarknet53 and integrates the cross stage partial network (CSPNet), which reduces computation while maintaining accuracy and achieves the perfect combination of speed and accuracy. The input image completes feature extraction in the backbone network. The fusion of different scale feature maps is completed by SPP and PANet, and finally, the three scale feature maps are output to predict the bounding box, and finally, the detection target is output, as shown in Figure 4.
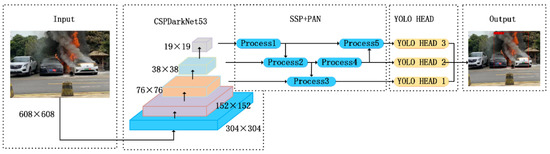
Figure 4.
Fire detection model based on YOLOv4 for electric vehicle charging stations.
The CSPDarknet53 is used in the backbone network to enhance the learning capability of CNNs, enabling them to maintain accuracy while being lightweight. The PANet structure enhances the representative capacity of the backbone network by fusing bottom-up and top-down paths. Among them, adaptive feature pooling can aggregate features between different layers to ensure the integrity and diversity of features. It is the model’s own choice to select different feature maps for predicting different objects, avoiding the complex matching of target size and network depth. The SPP structure is equivalent to a kind of standard channel layer; regardless of any size of the image, a standard set of the pool is used for the image. The SPP structure can significantly increase the perceptual field and the most significant contextual features at the partition. In addition, the SPP structure can extract spatial feature information of different sizes, which can improve the robustness of the model for spatial layout and object variability. The upper bound-free feature of the Mish activation function avoids the gradient saturation that leads to a sharp decrease in training speed. In contrast, a smoothed activation function allows better information to penetrate deeply into the neural network, which results in better accuracy and generalization ability and can improve the quality of the results.
3.2. Improved YOLOv4 Algorithm Based on K-Means
We introduced the K-means algorithm into the original YOLOv4 algorithm model to obtain the improved YOLOv4-Kmeans algorithm. The EV flame flames dataset images were clustered before being input to the training network, which can compress the training time and improve the model detection accuracy.
The original YOLOv4 algorithm network model uses nine anchor frames, and each detection frame of each detection layer is offset based on a different anchor frame. The parameter values of the original anchor frame are obtained based on the VOC2007 dataset, which has a wide variety of detection objects, including 20 types of people, cars, and cats, and the flame shape is complex and variable, so it was not appropriate to use the original anchor frame parameter values.
For the complex and variable shape of the flame and other features, the K-means algorithm was used to re-cluster the pre-labeled anchor frame parts in the dataset, as shown in Figure 5, and the anchor data based on the flame dataset were obtained and used for training to shorten the training time.
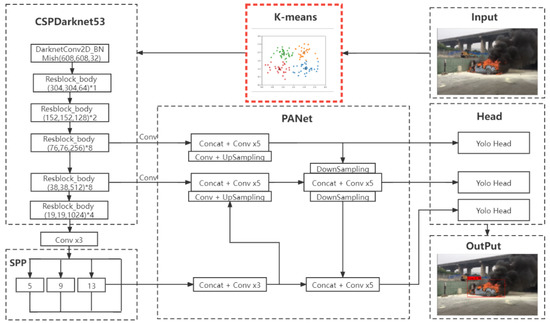
Figure 5.
Structure of YOLOv4 network based on K-means clustering algorithm.
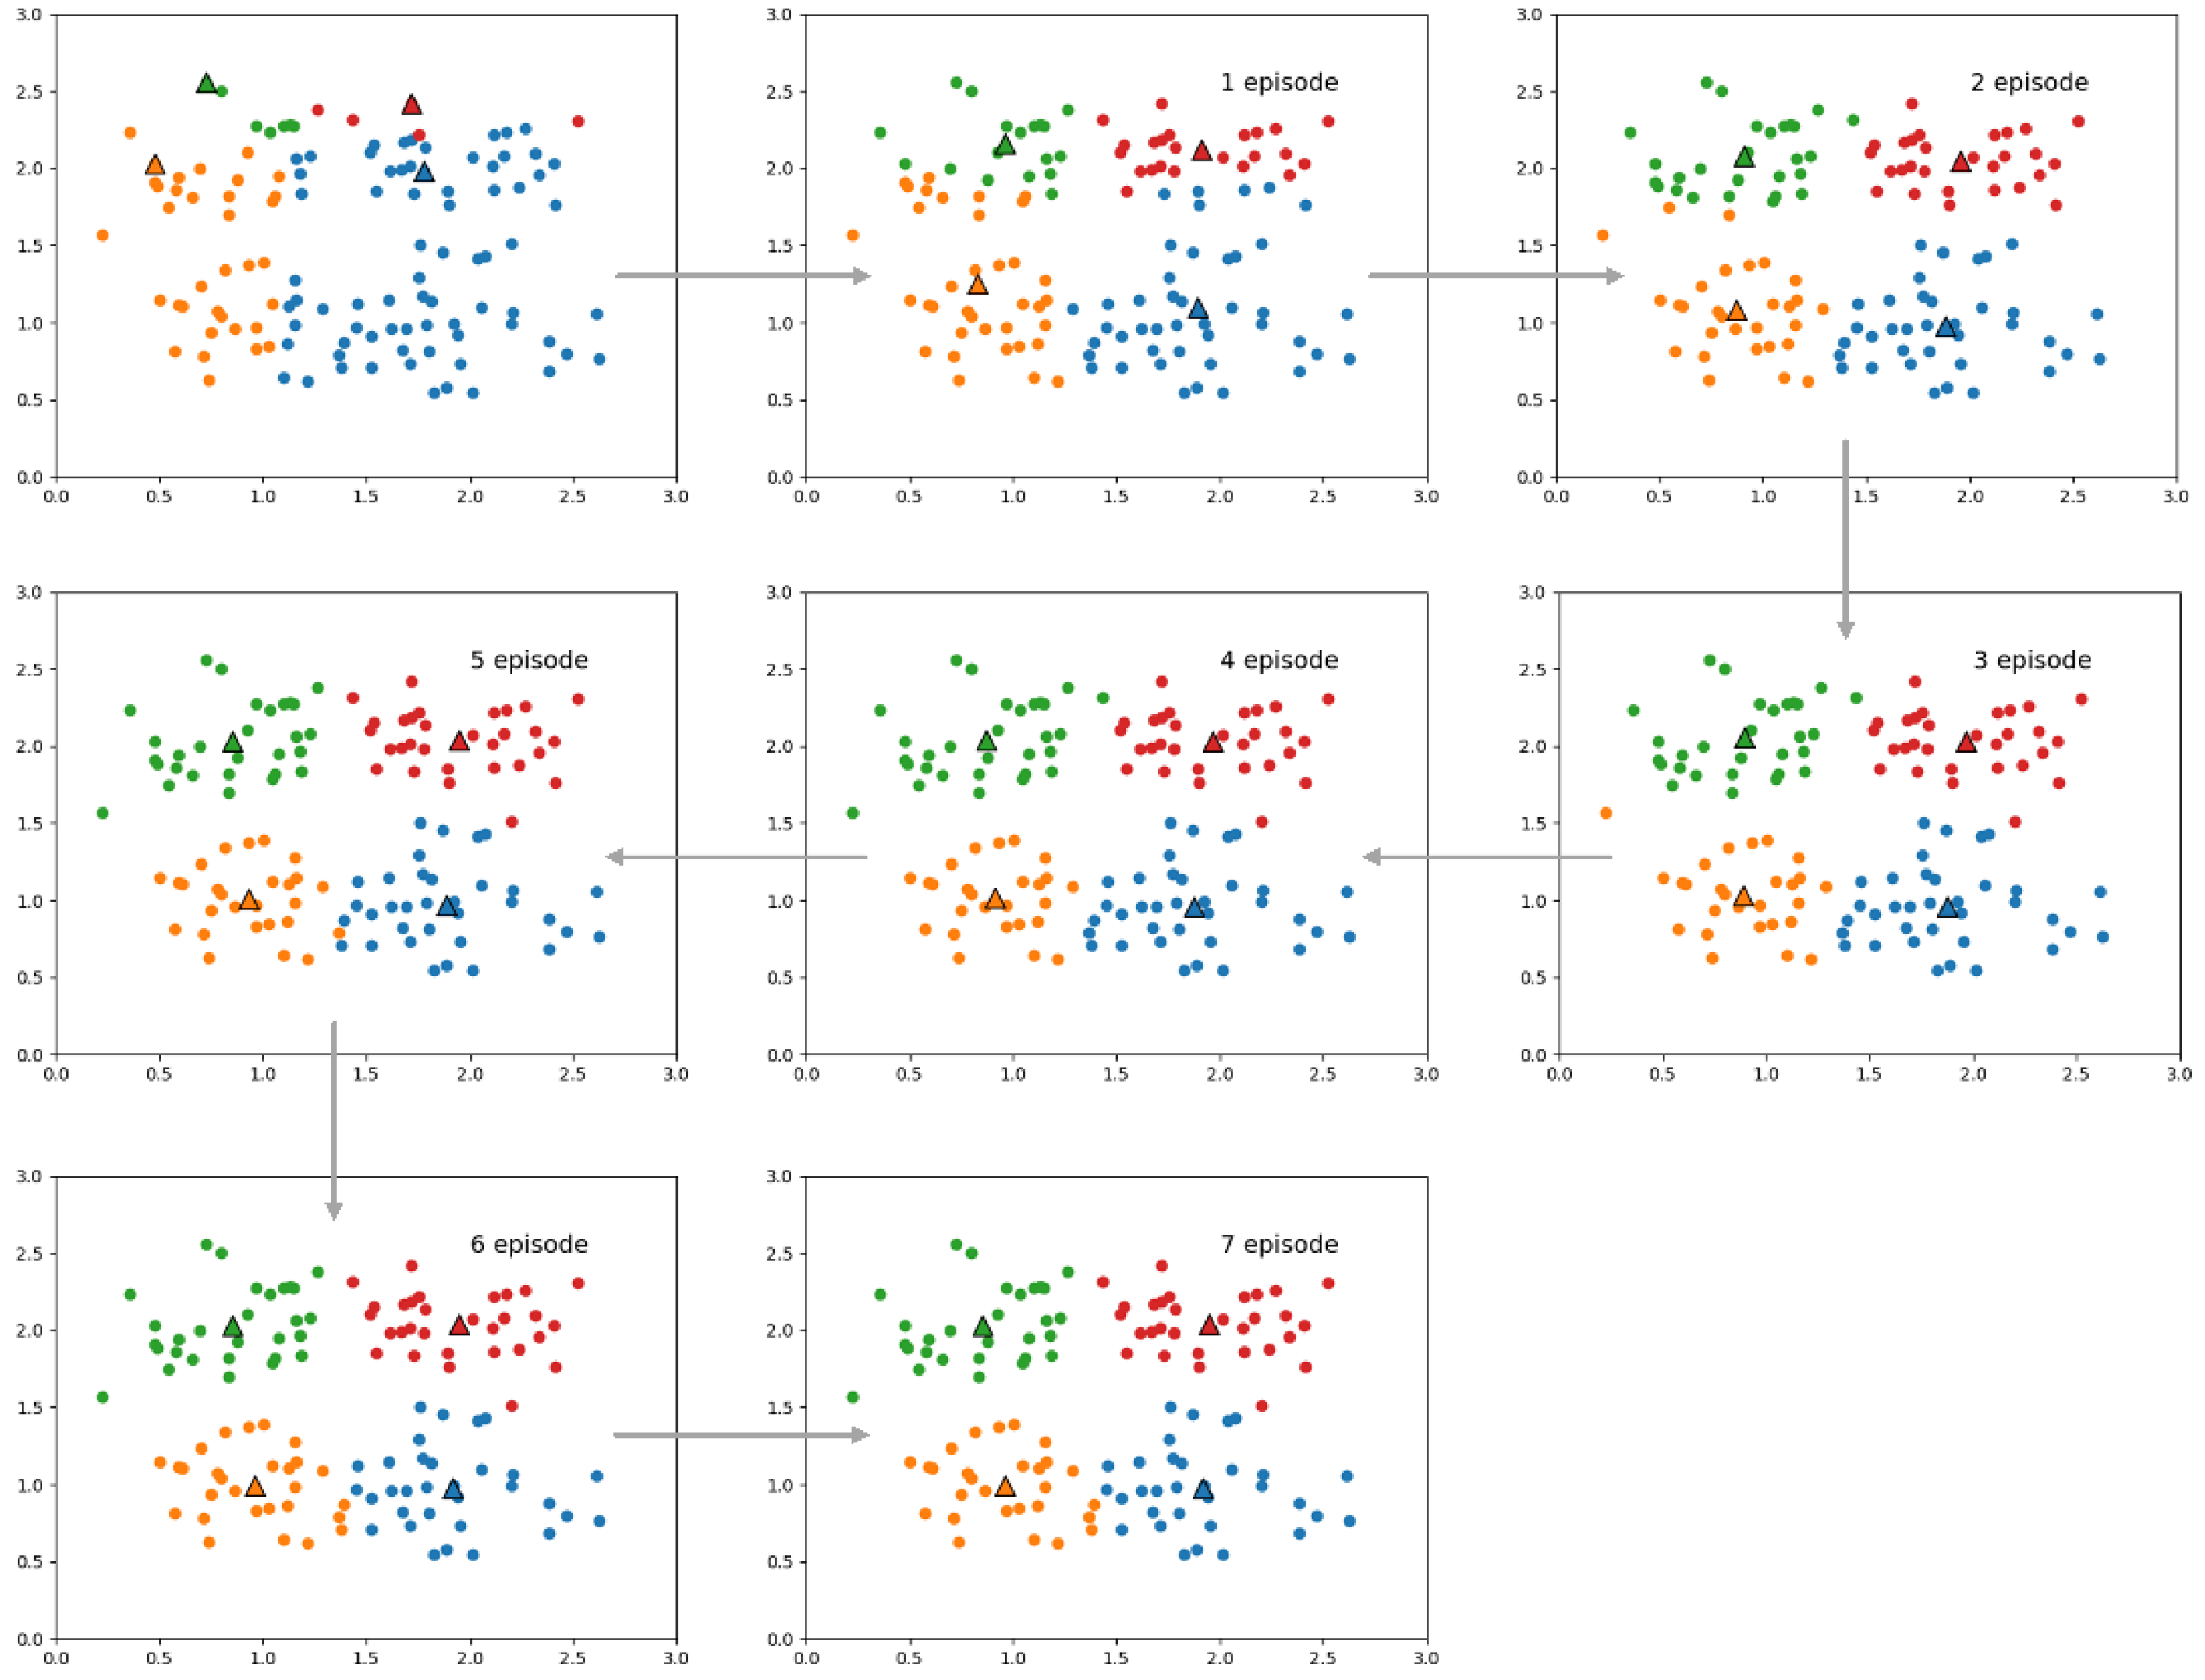
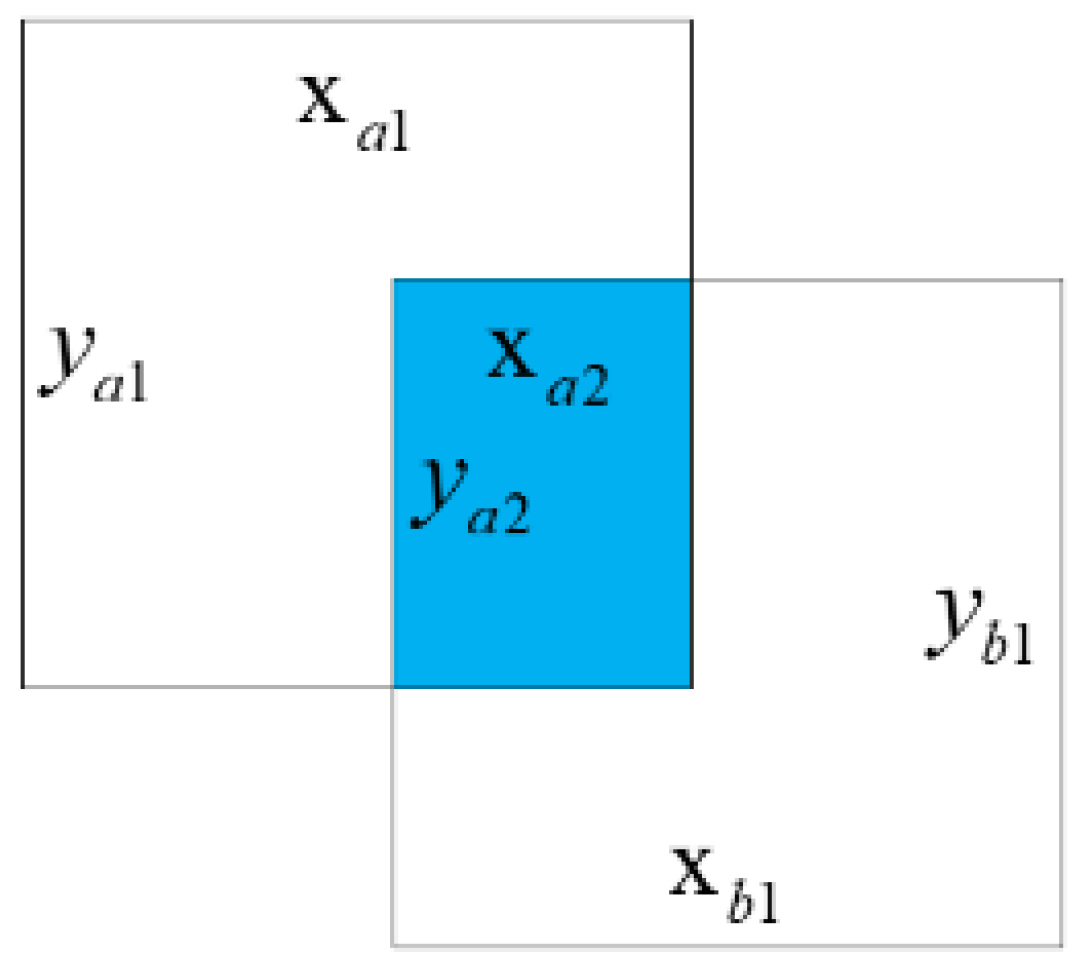
The K-means algorithm is a division-based, circular, iterative clustering algorithm that uses distance to measure similarity between data objects [27], i.e., the smaller the distance between data objects, the more similar they are, and the more likely they are to be in the same class cluster. The K-means algorithm usually uses Euclidean distance to calculate the spread between data objects, first randomly selecting K objects as the initial clustering centers. The distance between each object and each seed cluster center is calculated, and each object is assigned to the cluster center nearest to it. The cluster centers and the objects assigned to them represent a cluster, as shown in Figure 6. Once all the objects are set, the cluster centers of each group are recalculated based on the existing objects in the clusters. This process will be repeated until a termination condition is met. The average intersection over union (avg IoU) [28] is calculated by computing the IoU for each training set label, and the center is obtained by clustering, taking the most considerable IoU value as the value of this label, and finally averaging all labels to obtain the average IoU, as shown in Figure 7.
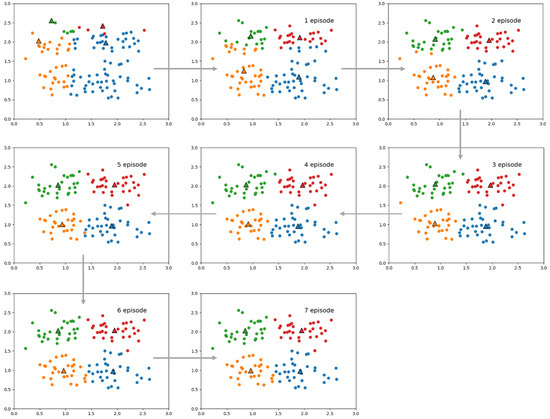
Figure 6.
K-means algorithm clustering schematic.
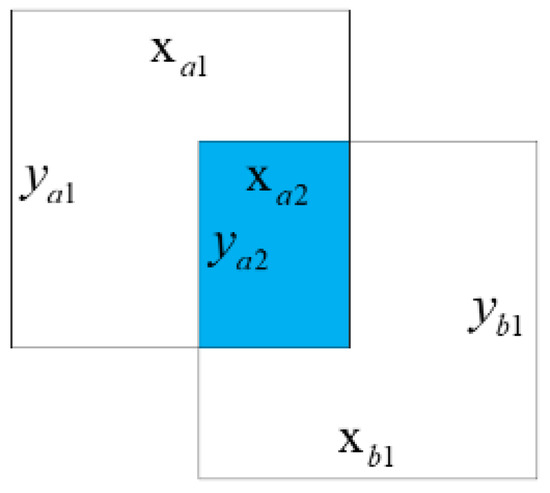
Figure 7.
K-means algorithm clustering schematic.
From Table 3, we can learn that the growth of avg IoU values almost stagnates when clusters reach 9. Additionally, the risk of overfitting the model increases as the number of clusters increases. The improved YOLOv4-Kmeans network model uses nine clustering centers, and the specific width and height parameter values of the anchor box are shown in Table 4. The width of the anchor box obtained by clustering is 1.1 to 3.5 times the height, which is consistent with the actual situation of flame features.
Table 3.
Electric vehicle flame dataset information.
Table 4.
Width and height of the anchor frame.
4. Experimental Simulation Verification
4.1. Experimental Environment and Experimental Parameter Settings
In this paper, the experimental environment was Win10, CPU was Intel i7-11800H, ROM was 12 GB, GPU was RTX3090 (24 GB), and the models were written in PyTorch. The training parameters are set as follows: the training epoch was 80, the learning rate of the first 40 epochs was 1 × 10⁻³, and the batch size was 32; the learning rate of the middle 20 epochs was 1 × 10⁻⁴, and the batch size was 16; the learning rate of the last 40 epochs was 1 × 10⁻⁵, and the batch size was 8; due to the large RAM the input image size of the YOLOv4 model was changed from 416 × 416 to 608 × 608. Table 5 shows the basic configuration of the local computer.
Table 5.
Basic configuration of the local computer.
The flow of the experimental procedure is shown in Figure 8.
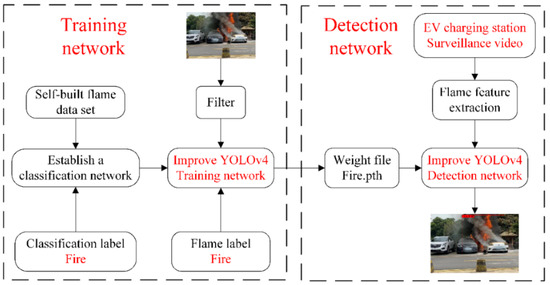
Figure 8.
Experimental flow chart.
4.2. Evaluation Indicators
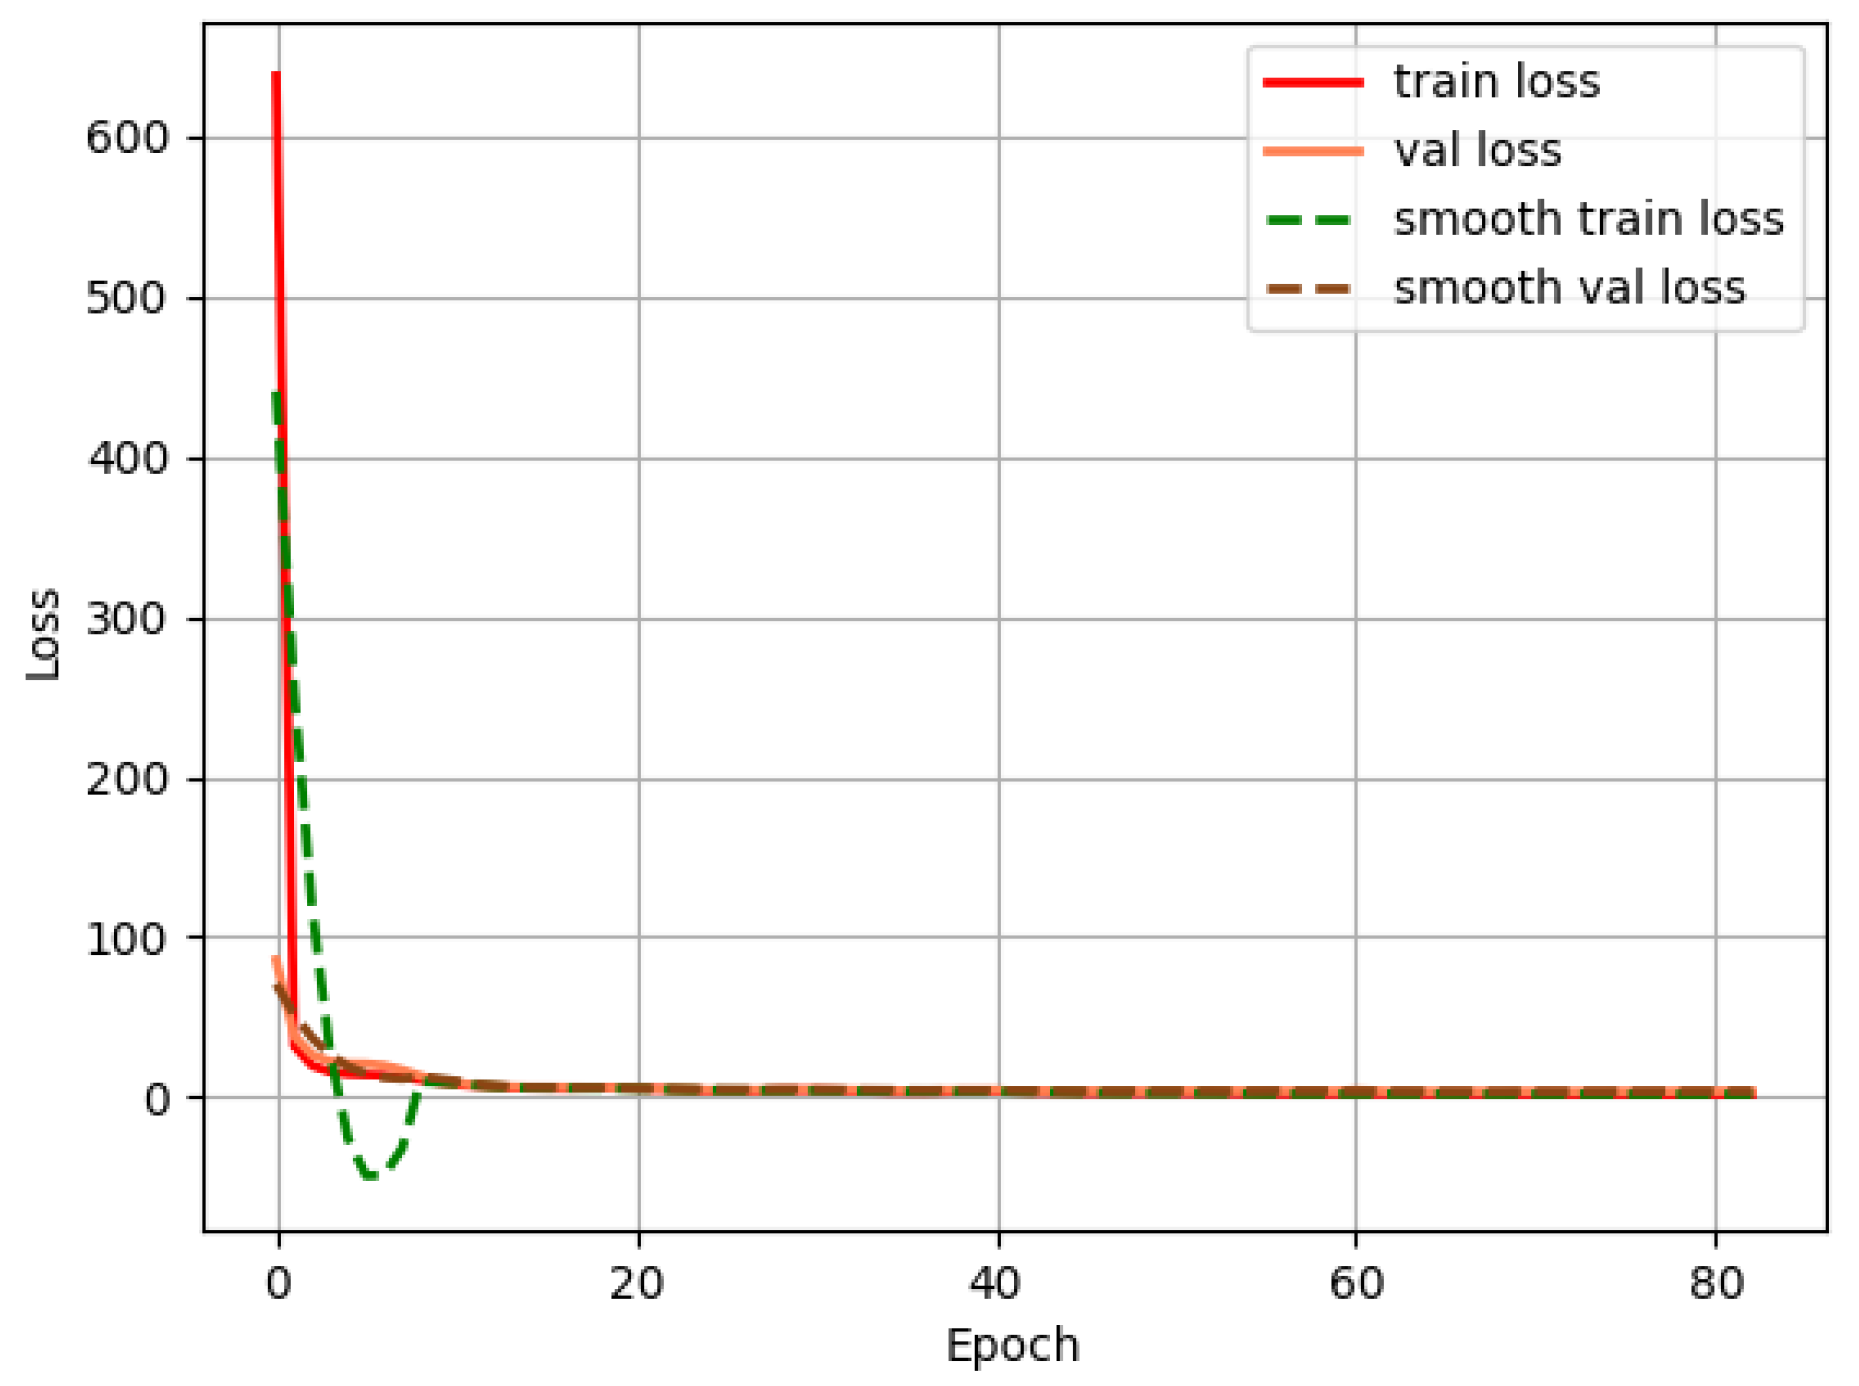
The loss curve shows the error of the training set during the training period, as shown in Figure 9, where the error dropped sharply during the first ten training iterations. After iteration 10, the loss curve tended to stabilize and eventually settled to a mistake fluctuating around 2. In a binary classification problem, samples can be classified into four categories based on their proper type and the prediction category of the model: TP, FP, TN, and FN. TP denotes true positive, i.e., actual positive and predicted positive; FP denotes false positive, i.e., real negative but predicted positive; TN denotes true negative, i.e., definite negative and predicted negative; and FN denotes false negative, i.e., definite positive but predicted negative. Precision denotes the proportion of true positive samples among all indicated positive samples; Recall denotes the ratio of predicted positive samples among true positive models. The AP value for each class is the area under the PR curve formed by Precision and Recall. The mAP value is the average of the AP values for all types. The F1 score is based on the summed average of Precision and Recall. The formula is defined as follows:

Figure 9.
Loss function diagram.
Precision:
Recall:
Average Precision (AP):
Mean Average Precision (mAP):
F1 score (F1):
4.3. Experimental Results
The loss curve shows the error of the training set during the training period, as shown in Figure 9, where the error dropped sharply during the first ten training iterations. After iteration 10, the loss curve tended to stabilize and eventually settled to an error fluctuating around 2.
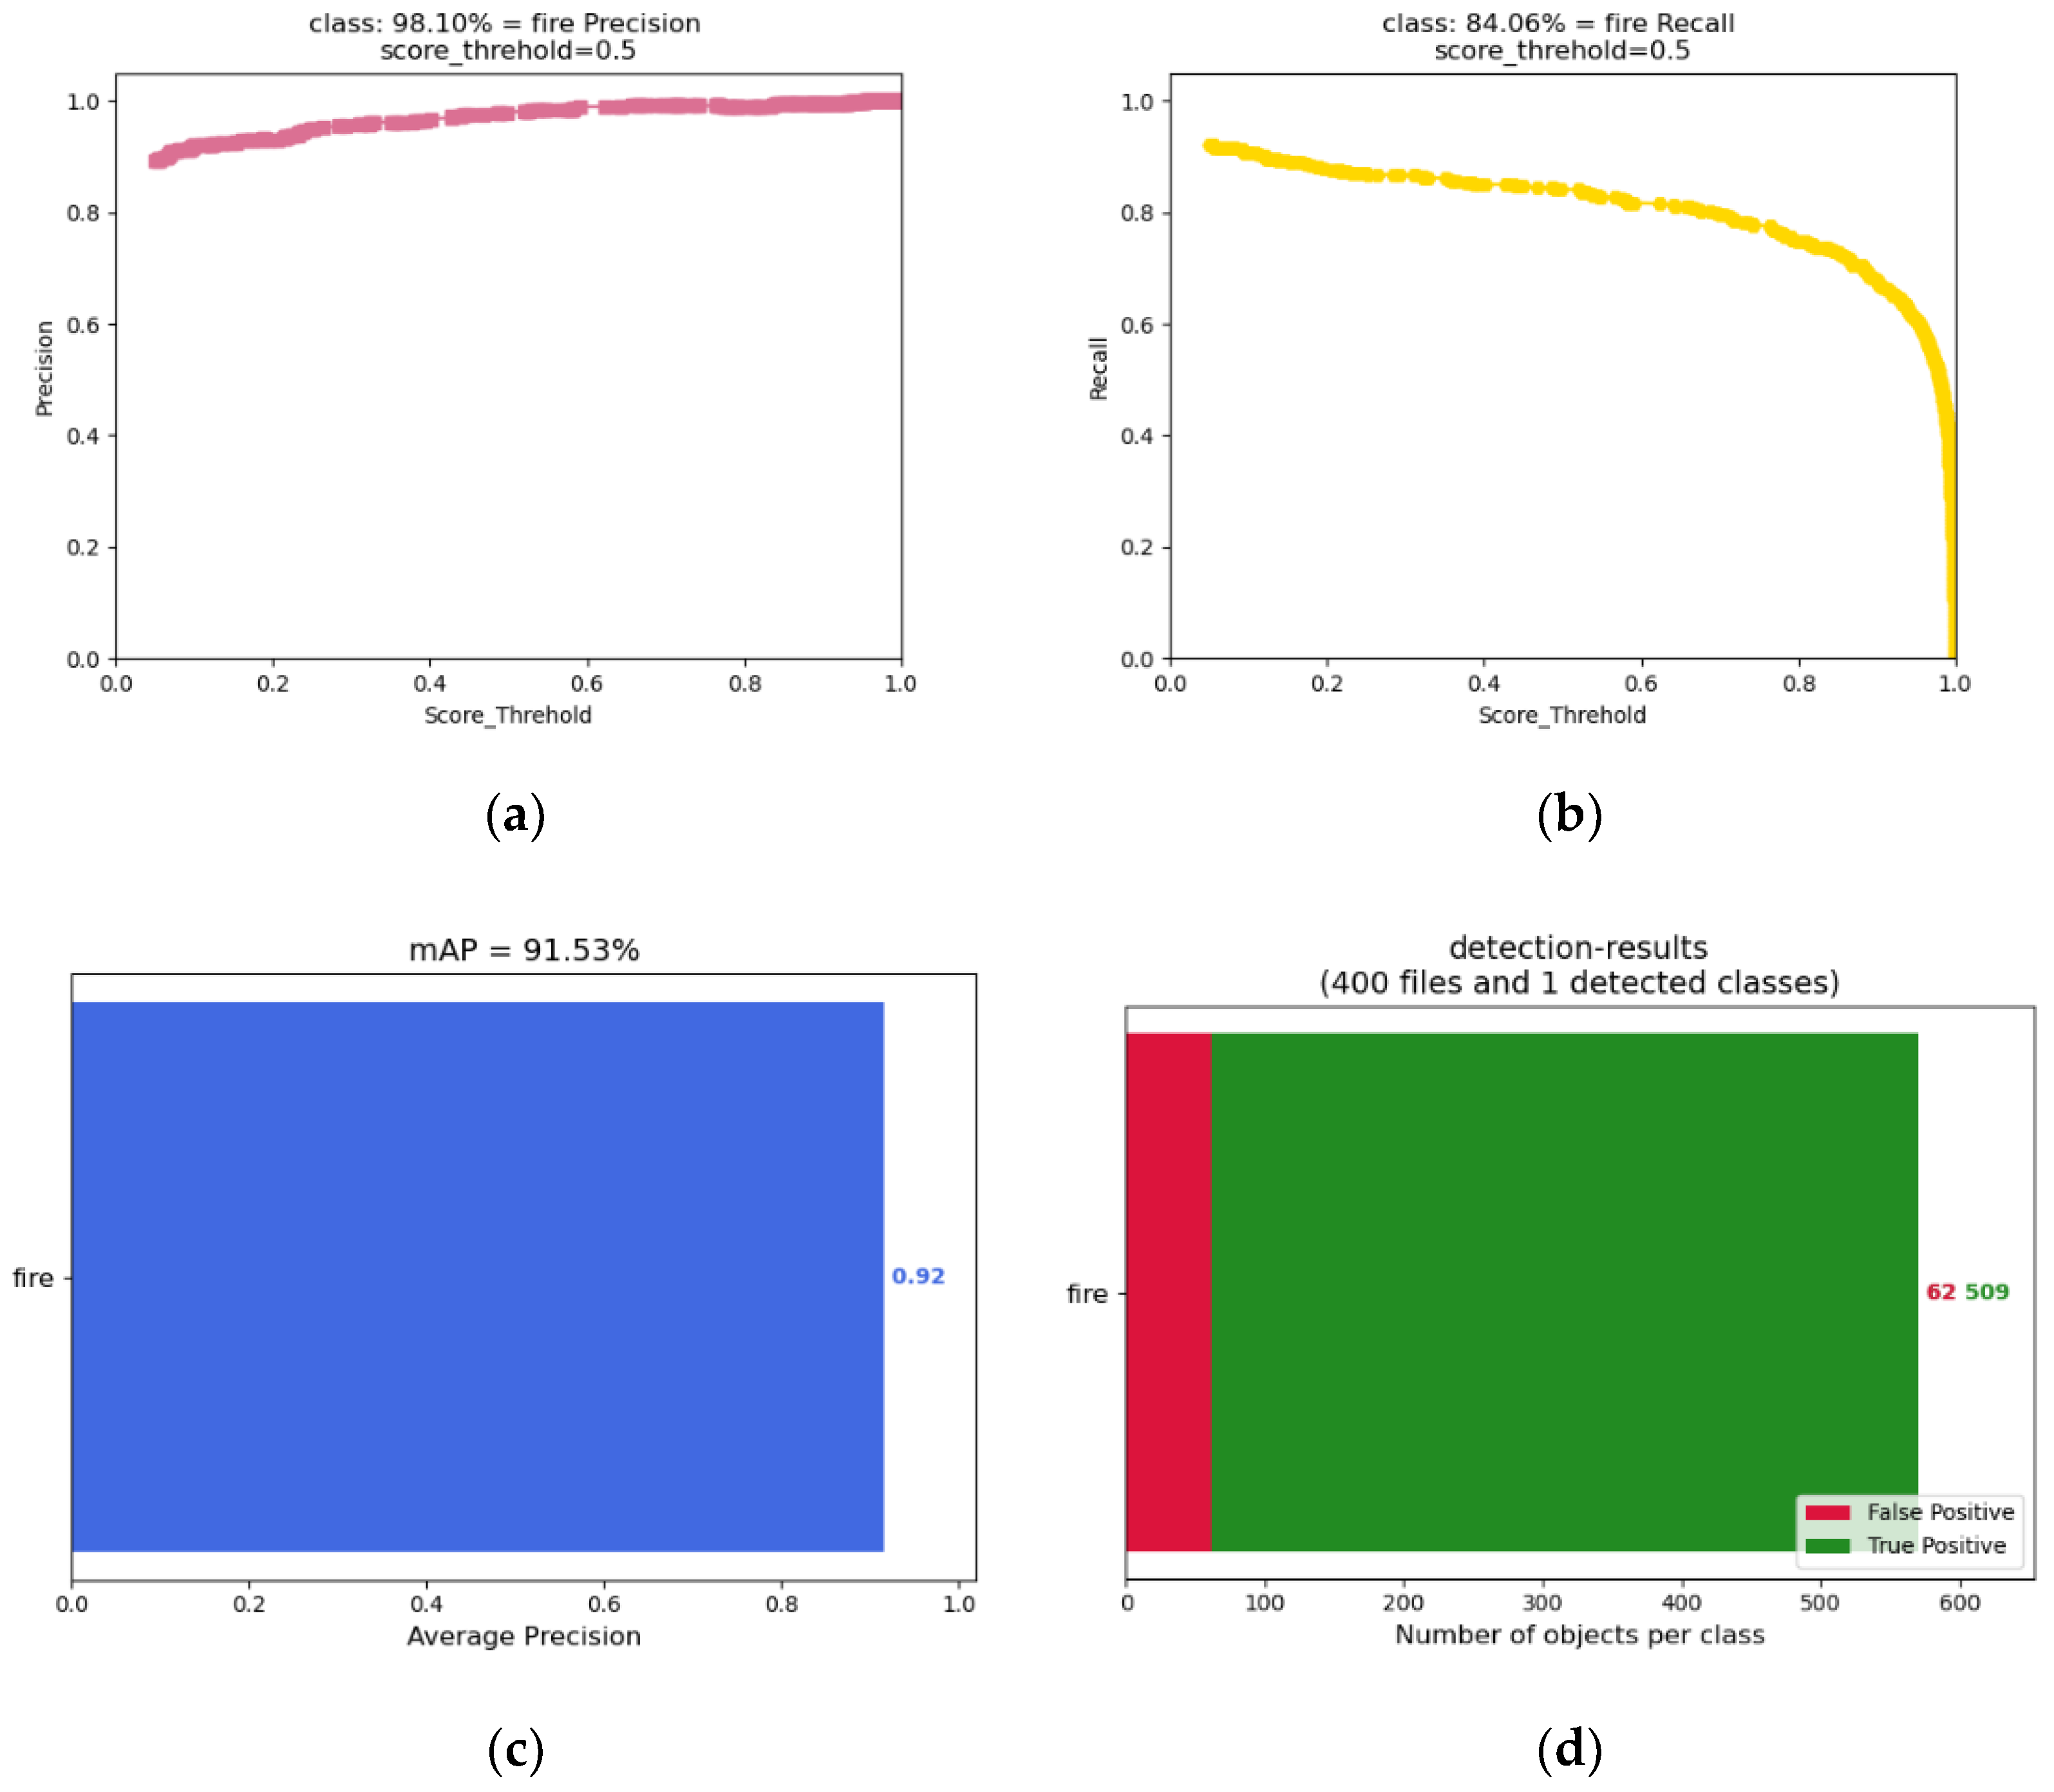
To verify the detection performance of the improved model, 400 images were randomly screened in this improved algorithm for testing and evaluation. The test results are shown in Figure 10: the precision was 98.10%, the recall rate was 84.06%, the AP and mAP were91.53%, the detection results are shown in Figure 10, the F1 value was 0.91, and the detection speed was 0.0258 s per image. This indicates that the trained model achieves a high-accuracy standard.
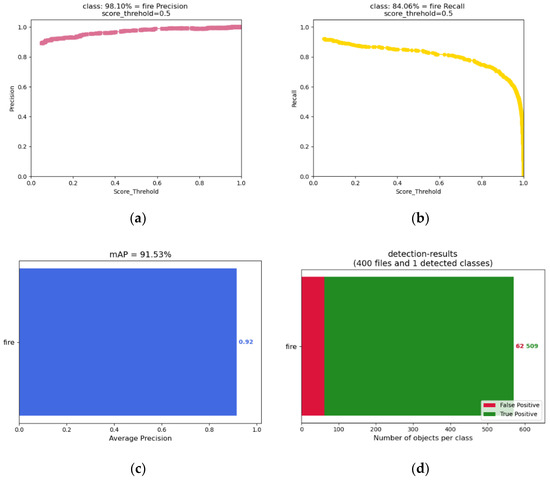
Figure 10.
Graph depicting test results for 400 pictures. (a) Precision; (b) Recall; (c) mAP; (d) Detection-results.
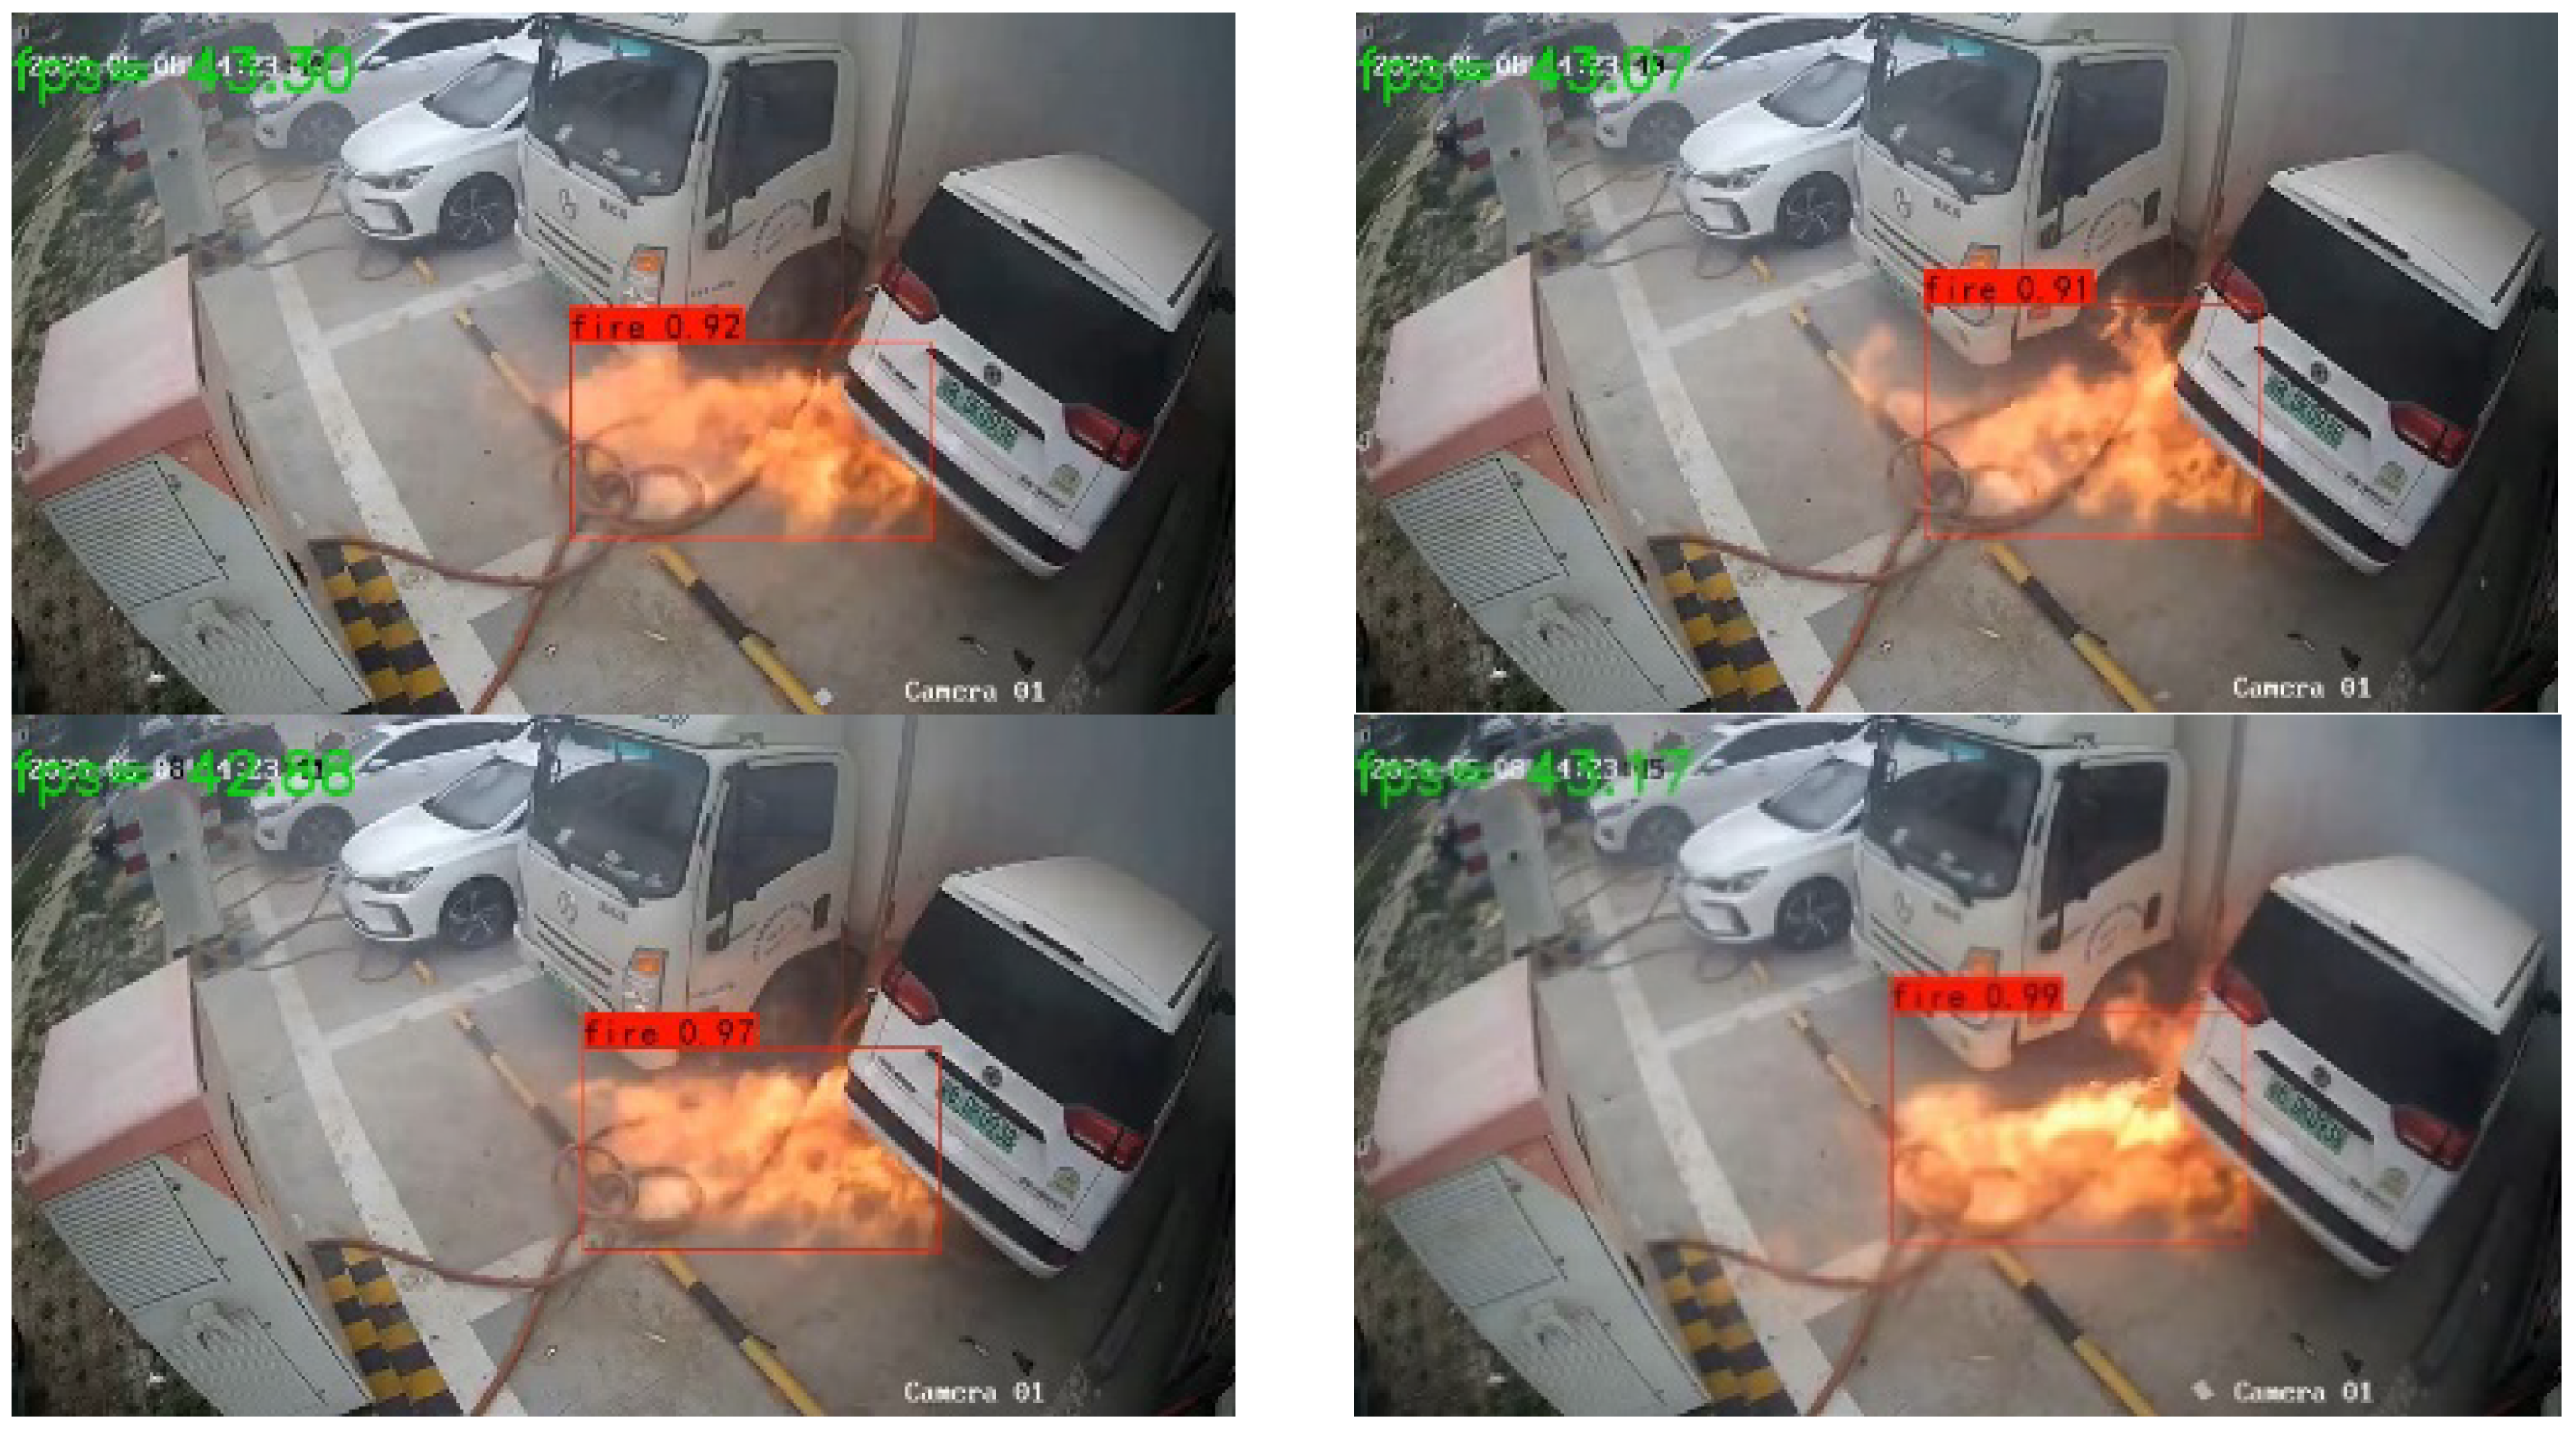
Taking an electric vehicle charging station as an example, the surveillance video was transmitted to the YOLOv4-Kmeans algorithm for real-time detection, and the detection results are shown in Figure 11. The detection speed of the model is sufficient for continuous real-time detection at 43 fps, with a high accuracy rate and strong ongoing tracking performance, which can be applied to remote dynamic video monitoring mode to meet the demand for real-time monitoring of electric vehicle charging stations.
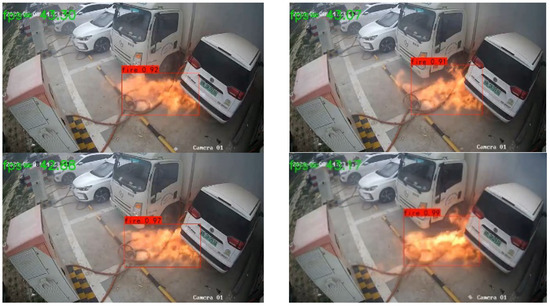
Figure 11.
Electric vehicle charging station fire real-time monitoring results.
4.4. Model Comparison
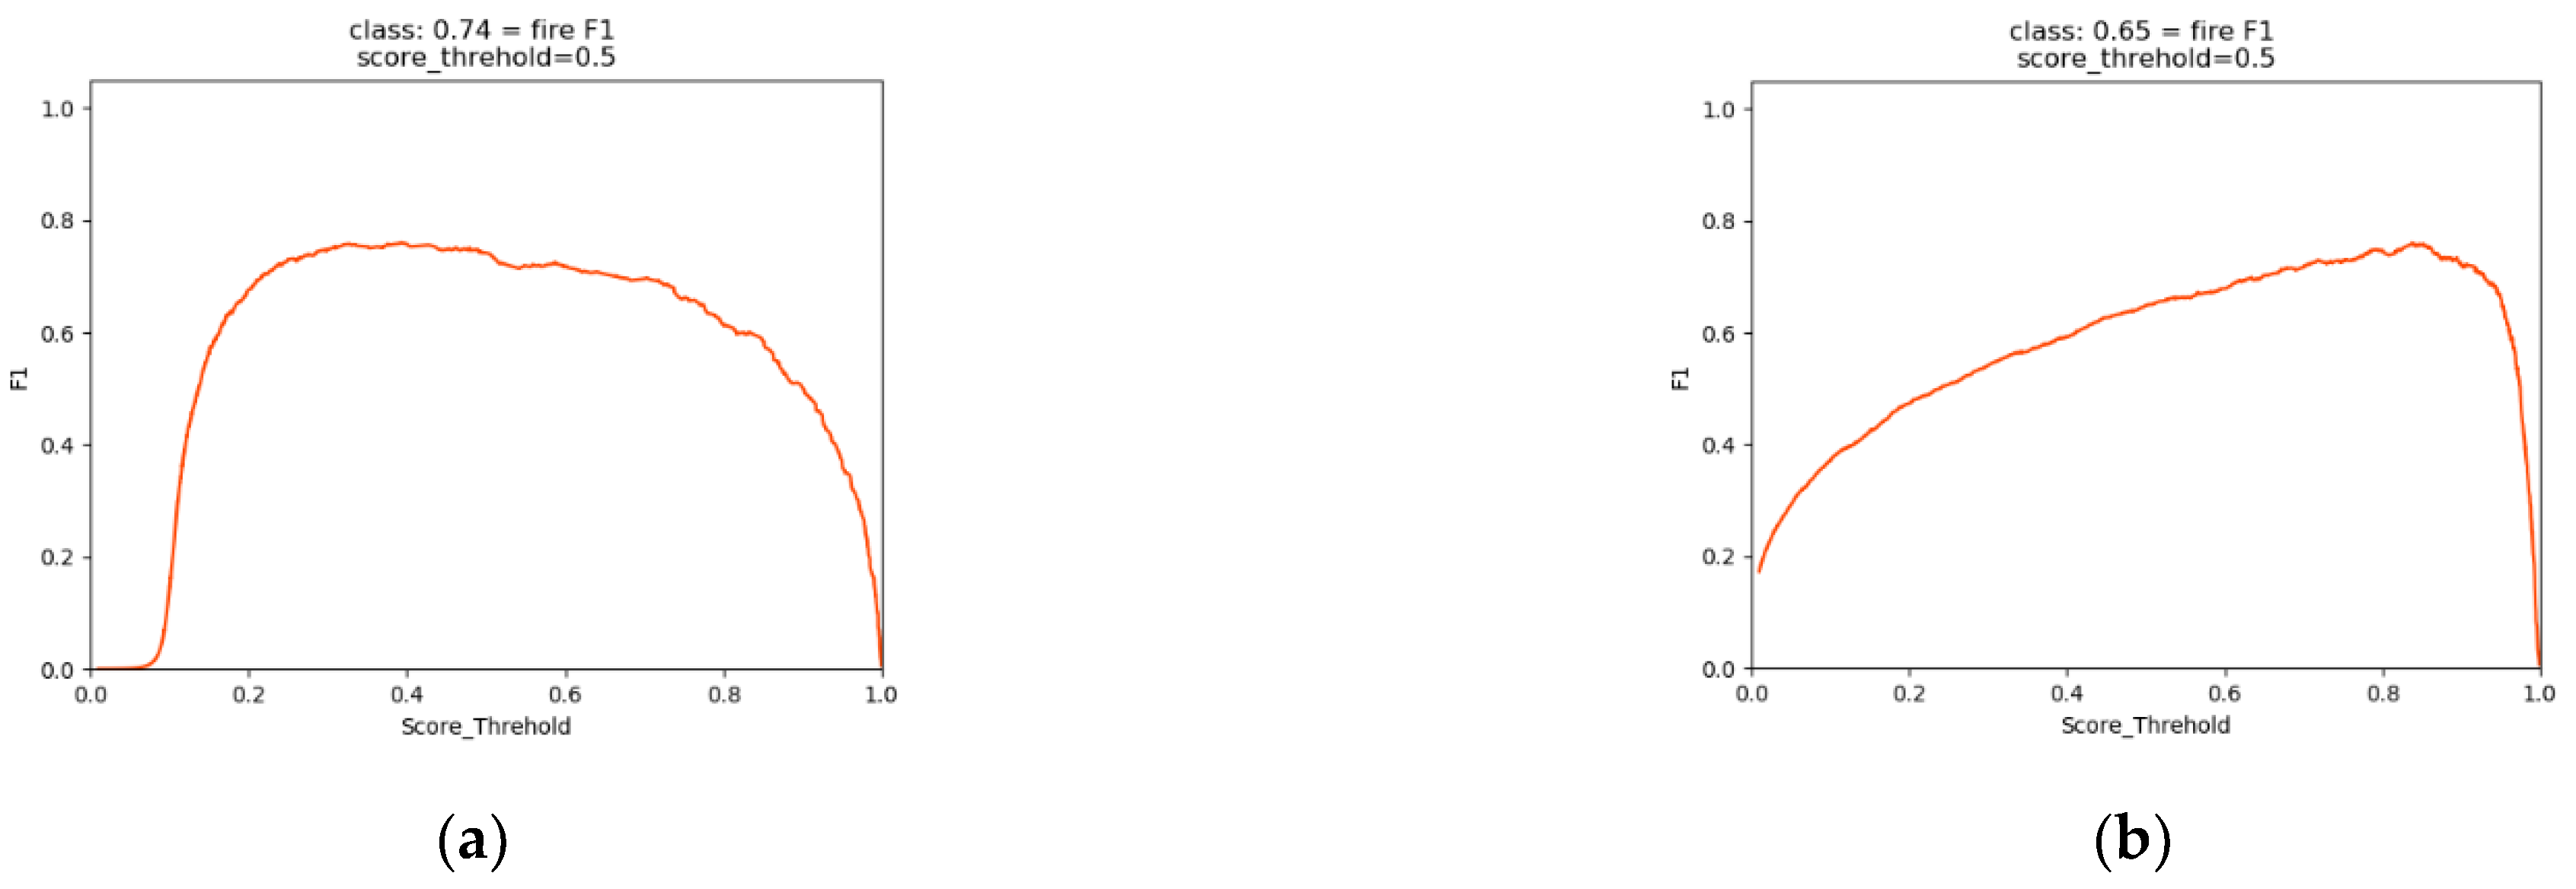
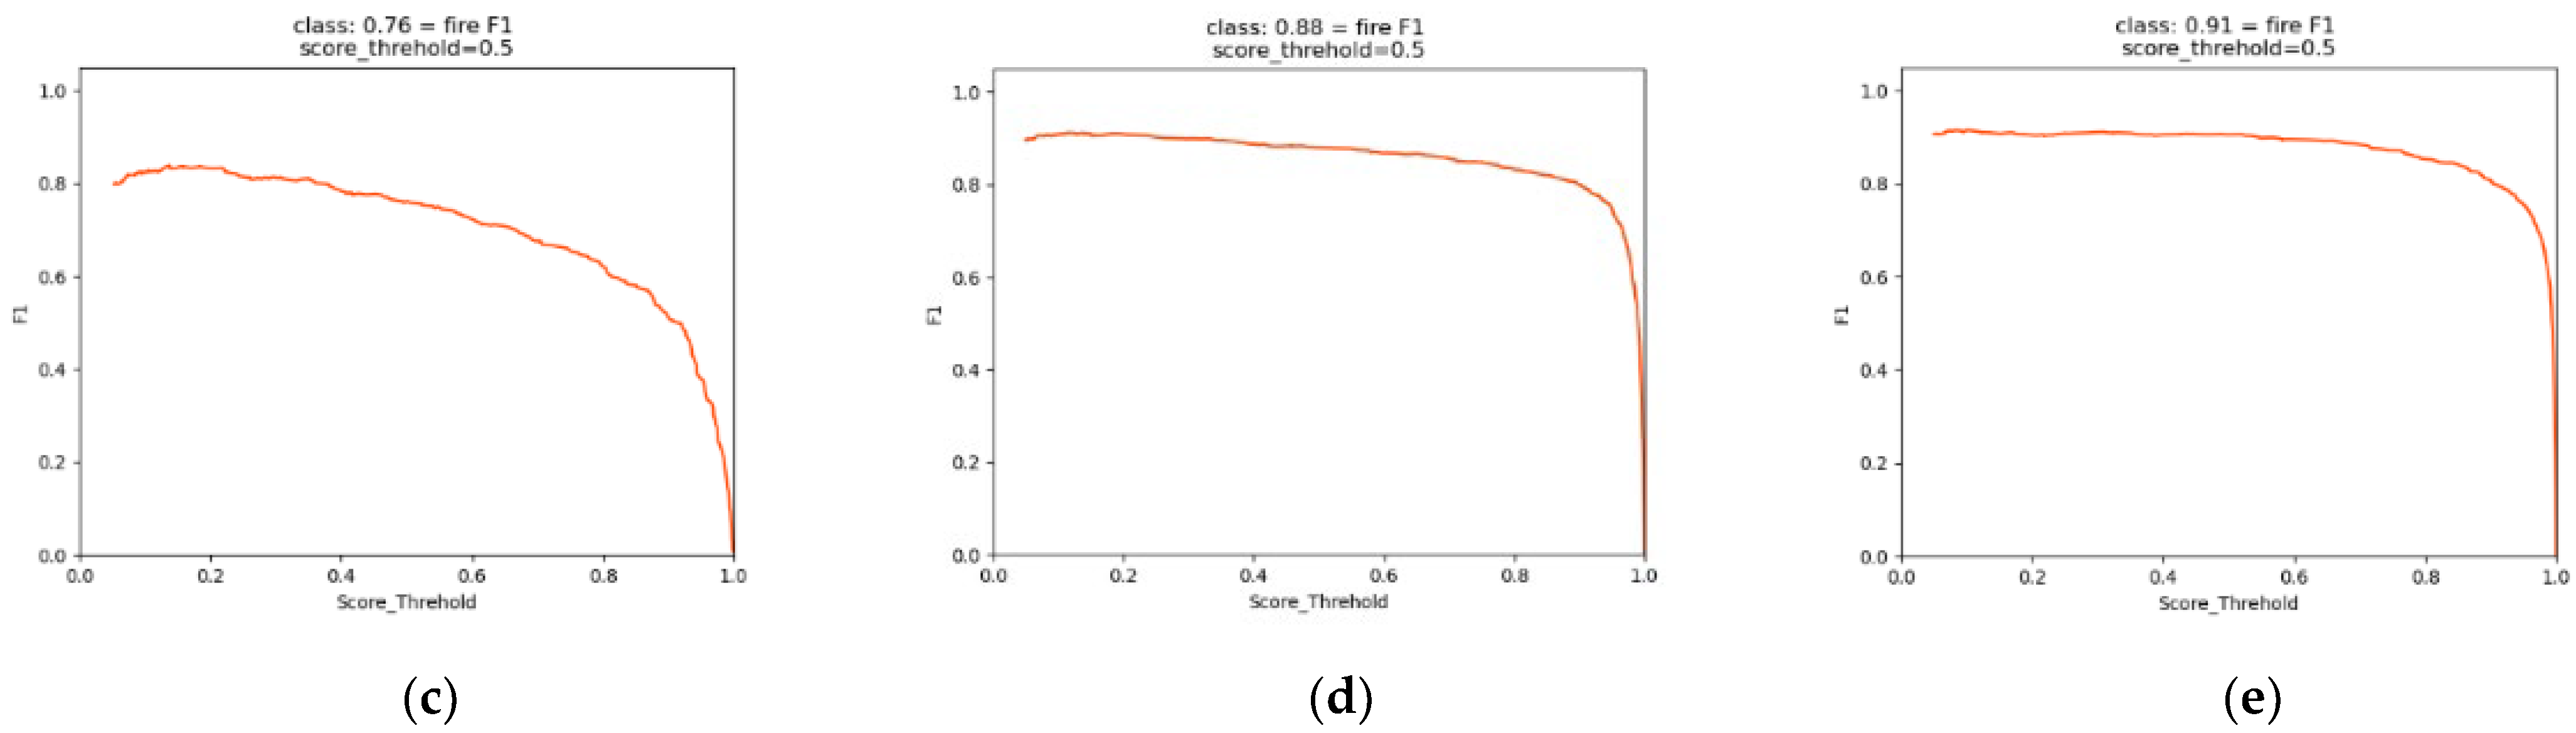
To verify the superiority of the improved YOLOv4-Kmeans model proposed in this paper, it was compared with SSD, Faster R-CNN, YOLOv3, and YOLOv4. The same test dataset was selected, and the parameters were kept the same during the experiments; Figure 12 shows the changes of F1 value curves for different models. From the curve changes, it can be seen that the improved network fluctuates less, and the curve changes are relatively smooth, indicating that the improved network performance is stable; from the F1 values, it can be seen that the comprehensive performance of the improved YOLOv4-Kmeans network model is 24.66% higher than that of YOLOv3 and 3.4% higher than that of YOLOv4.
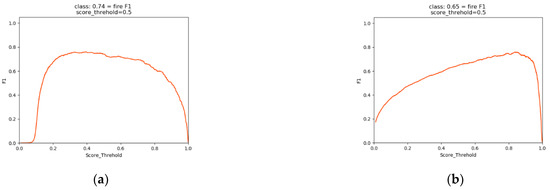
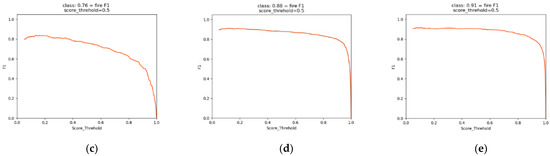
Figure 12.
F1-values of SSD, Faster R-CNN, YOLOv3, YOLOv4, YOLOv4-Kmeans. (a) SSD; (b) Faster R-CNN; (c) YOLOv3; (d) YOLOV4; (e) YOLOV4-Kmeans.
Table 6 shows the performance index parameters such as F1, mAP, Precision, and Recall for different models. Since this paper only detects one kind of flame target, the AP and mAP values were the same. From the comparison of AP, Recall, and Precision, it was concluded that the improved YOLOv4-Kmeans network model has significantly improved all parameters, and the most noticeable improvement is in Recall.
Table 6.
Comparison of different model evaluation index parameters.
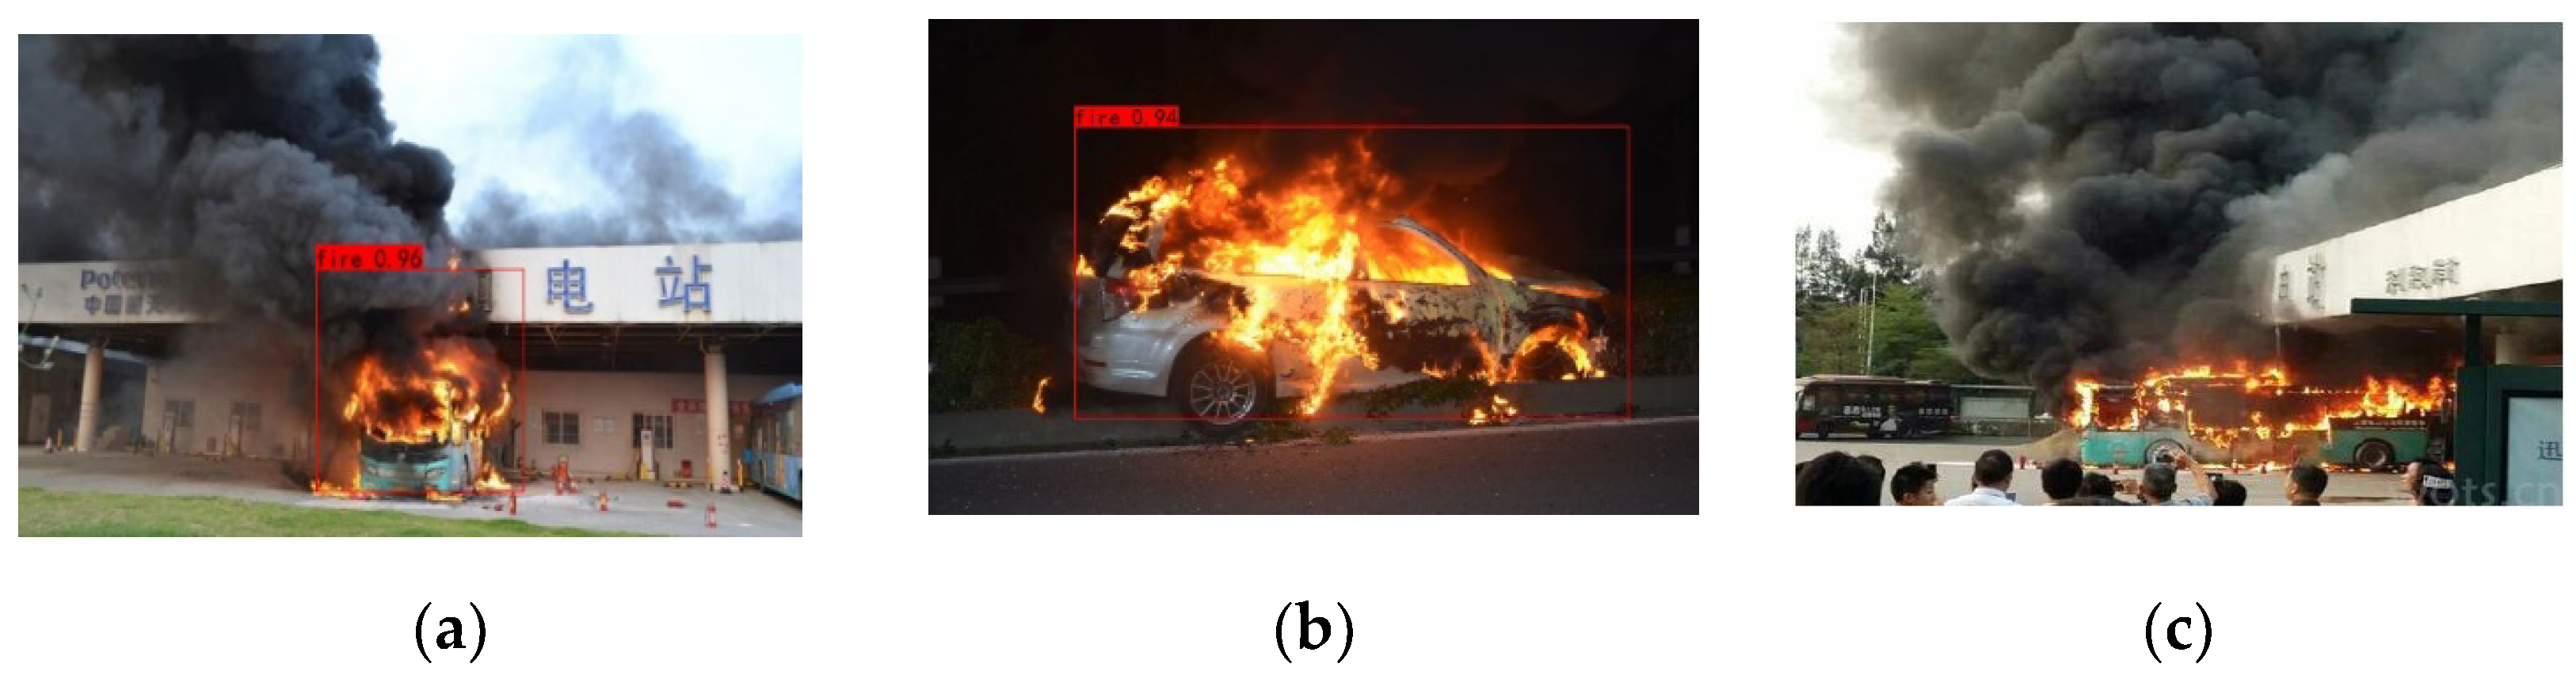
Figure 13, Figure 14 and Figure 15 show the detection results of three randomly selected pictures of EV charging station fires inputted into the three models during the experiment. Comparing the test results, we can draw the following conclusions:
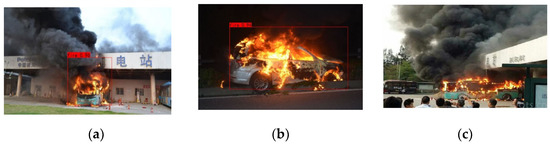
Figure 13.
Test results YOLOv3. (a) Sufficient light; (b) Insufficient light; (c) Long-range target.

Figure 14.
Test results of YOLOv4. (a) Sufficient light; (b) Insufficient light; (c) Long-range target.
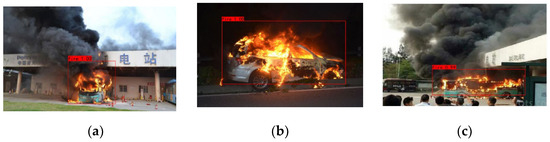
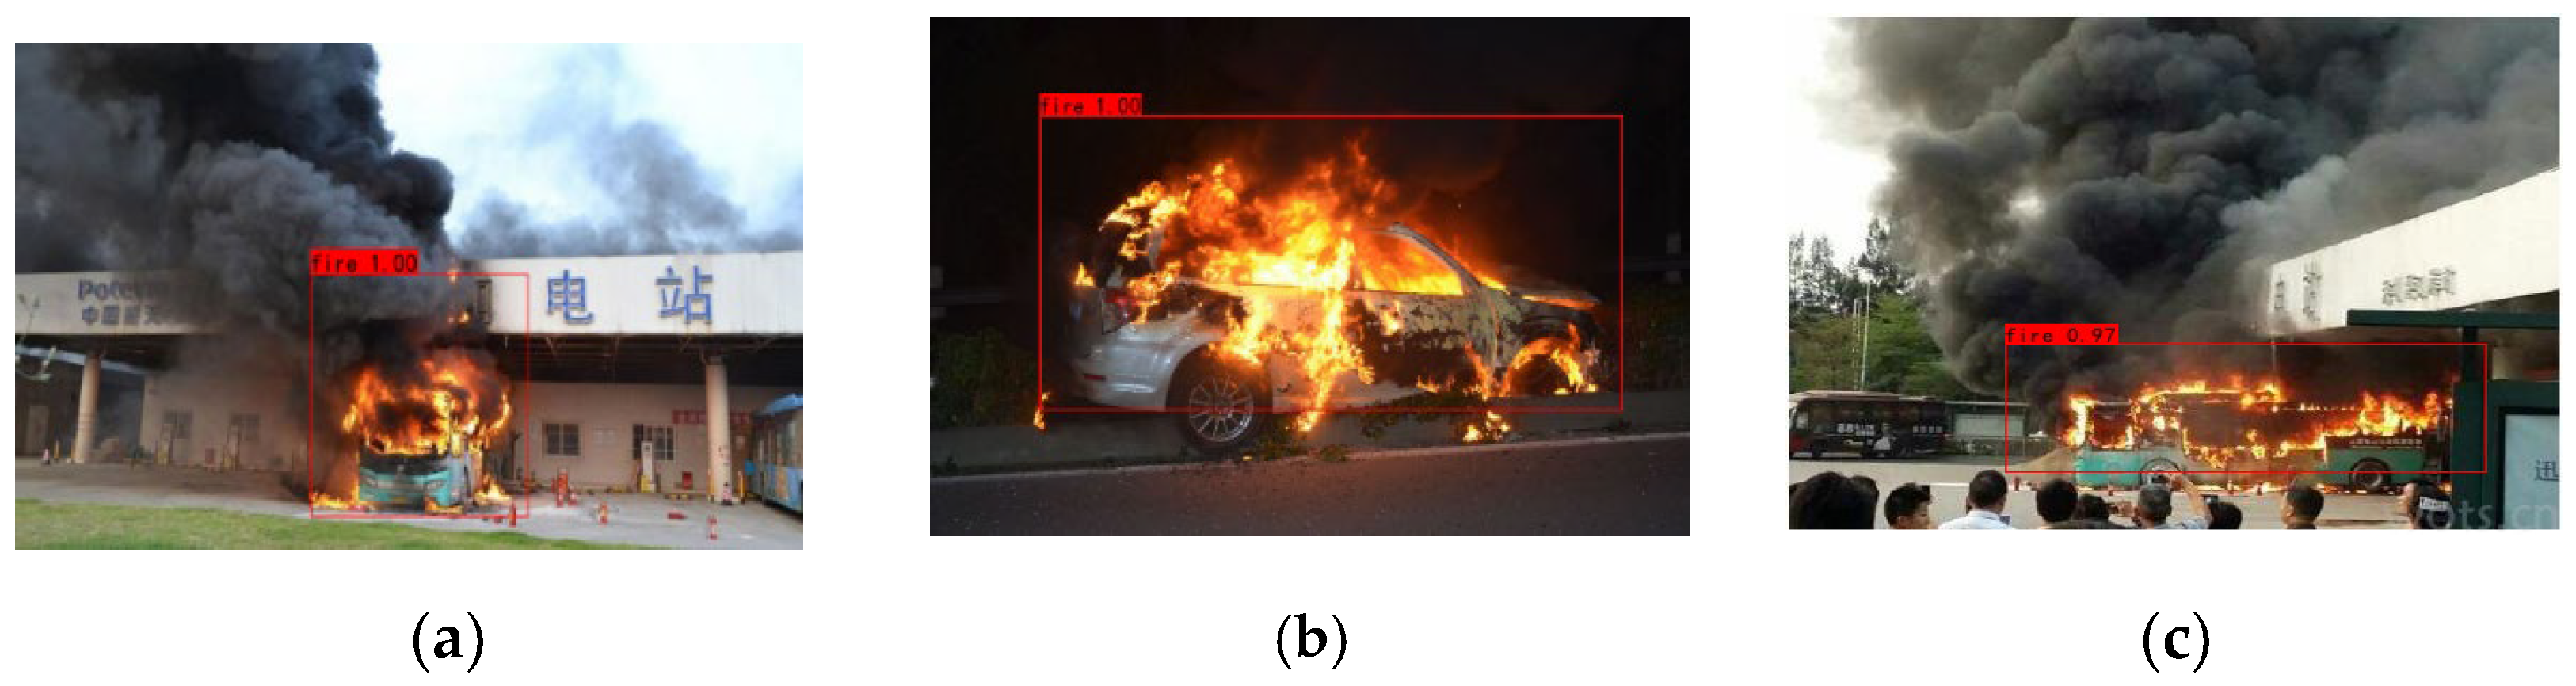
Figure 15.
Test results of YOLOv4-Kmeans. (a) Sufficient light; (b) Insufficient light; (c) Long-range target.
- (1)
- By comparing the detection results of the three methods, it can be concluded that the YOLO series target detection algorithm achieves excellent detection results in fire detection, and the detection accuracy is above 0.95.
- (2)
- (3)
- (4)
- With introducing the K-means clustering algorithm in the original YOLOv4 network, the prediction frame size fits the flame region more closely. It achieves precise localization of the detection target while improving detection accuracy.
5. Conclusions
To realize fire detection for the complex scenario of electric vehicle charging stations, this paper constructed the flame dataset. Additionally, it invoked the tenfold cross-validation algorithm during the dataset processing, which fully reduces the chance due to the single division of the training and validation sets. Given that the parameter values of each anchor frame in the original YOLOv4 model were obtained based on extensive public datasets such as the VOC dataset, they are not consistent with single-flame target detection. Therefore, the K-means clustering algorithm was implemented in the improved YOLOv4 model to recalculate the width and height values of each anchor frame for a specific flame dataset and then trained the network model. The improved YOLOv4-Kmeans model has an F1 of 0.91, mAP of 91.53%, Recall of 84.06%, average computation time per frame of 0.258 s, and FPS of 42.57. The model integrally outperforms the currently popular YOLOv3 model, YOLOv4 model, and Faster R-CNN with ResNet model. The improved YOLOv4-Kmeans algorithm model was used to detect fire in real-time surveillance videos of EV charging stations at a detection speed of 40 FPS. The algorithm can improve the fire response time to milliseconds, which helps staff take timely measures to extinguish the fire.
In future work, we will make improvements in the following three aspects: first, we will continue to build the EV charging station fire dataset, increase the number of dataset images, and improve the complexity of fire scenarios; second, we will further optimize the network model, perform channel pruning, and introduce advanced optimization algorithms to the CSPDarknet53 network to improve the detection accuracy and recall rate, so that the improved model can better respond to specific circumstances. Finally, the YOLOv4 network model requires a high-quality computer graphics card configuration during training and detection, and the output weight file size is 250 M for one training iteration, so it is not suitable for running on mobile platforms. The existing network model was lightened and improved by using the MobileNet network instead of the CSPDarknet53 network. The model is embedded into the electric vehicle charging station inspection robot to achieve autonomous inspection and alarm using machine vision to improve the detection efficiency.
Author Contributions
Conceptualization, S.Z. and Q.Y.; methodology, S.Z. and Q.Y.; software, S.Z.; validation, Q.Y.; formal analysis, Q.Y.; writing—original draft preparation, S.Z.; writing—review and editing, S.Z., Q.Y., Y.G. and D.G.; visualization, S.Z.; All authors have read and agreed to the published version of the manuscript.
Funding
This research was funded by the Natural Science Foundation of Shandong province of China (Grant No. ZR2018LF008), and the Key Research and Development Program of Shandong Province of China (Grant No. 2019GGX101012).
Conflicts of Interest
The authors declare no conflict of interest.
References
- Qi, B.; Li, B.; Chen, L.K.; Wang, W.; Dong, L.; Jia, X.; Huang, J.; Ge, C.W.; Xue, G.M.; Wang, D. Ship Target Detection Algorithm Based on Improved Faster R-CNN. Electronics 2019, 8, 959. [Google Scholar] [CrossRef] [Green Version]
- Zhao, Y.J.; Zhang, H.B.; Zhang, X.L.; Chen, X.J. Fire smoke detection based on target-awareness and depthwise convolutions. Multimed. Tools Appl. 2021, 80, 27407–27421. [Google Scholar] [CrossRef]
- Myeongho, J.; Han-Soo, C.; Lee, J.H.; Myungjoo, K. Multi-Scale Prediction For Fire Detection Using Convolutional Neural Network. Fire Technol. 2021, 57, 2533–2551. [Google Scholar]
- Li, P.; Zhao, W.D. Image fire detection algorithms based on convolutional neural networks. Case Stud. Therm. Eng. 2020, 19, 100625. [Google Scholar] [CrossRef]
- Tanvir, A.; Ma, Y.L.; Muhammad, Y.; Belal, A.; Shah, N.; Amin, U.H.; Rahman, A. Object Detection through Modified YOLO Neural Network. Sci. Program. 2020, 2020, 8403262. [Google Scholar]
- Sang, J.; Wu, Z.; Guo, P.; Hu, H.; Xiang, H.; Zhang, Q.; Cai, B. An Improved YOLOv2 for Vehicle Detection. Sensors 2018, 18, 4272. [Google Scholar] [CrossRef] [Green Version]
- Yuki, S.; Lu, H.M.; Joo-Kooi, T.; Hyoungseop, K. Recognition of surrounding environment from electric wheelchair videos based on modified YOLOv2. Future Gener. Comput. Syst. 2019, 92, 157–161. [Google Scholar]
- Sharif, M.; Amin, J.; Siddiqa, A.; Khan, H.U.; Arshad, M.M.; Anjum, M.A.; Kadry, S. Recognition of Different Types of Leu-kocytes Using YOLOv2 and Optimized Bag-of-Features. IEEE Access 2020, 8, 167448–167459. [Google Scholar] [CrossRef]
- Wang, L.; Yang, S.; Yang, S.; Zhao, C.; Tian, G.; Gao, Y.; Chen, Y.; Lu, Y. Automatic thyroid nodule recognition and diagnosis in ultrasound imaging with the YOLOv2 neural network. World J. Surg. Oncol. 2019, 17, 12. [Google Scholar] [CrossRef] [Green Version]
- Zhang, Y.; Shen, Y.L.; Zhang, J. An improved tiny-yolov3 pedestrian detection algorithm. Optik 2019, 183, 17–23. [Google Scholar]
- Wang, K.; Liu, M. YOLOv3-MT: A YOLOv3 using multi-target tracking for vehicle visual detection. Appl. Intell. 2021, 1–22. [Google Scholar] [CrossRef]
- Fang, M.-T.; Przystupa, K.; Chen, Z.-J.; Li, T.; Majka, M.; Kochan, O. Examination of Abnormal Behavior Detection Based on Improved YOLOv3. Electronics 2021, 10, 197. [Google Scholar] [CrossRef]
- Zhang, X.; Dong, X.; Wei, Q.; Zhou, K. Real-time object detection algorithm based on improved YOLOv3. J. Electron. Imaging 2019, 28, 053022. [Google Scholar] [CrossRef]
- Abdusalomov, A.; Baratov, N.; Kutlimuratov, A.; Whangbo, T.K. An Improvement of the Fire Detection and Classification Method Using YOLOv3 for Surveillance Systems. Sensors 2021, 21, 6519. [Google Scholar] [CrossRef] [PubMed]
- Li, T.; Lv, X.Y.; Lian, X.F.; Wang, G. YOLOv4_Drone: UAV image target detection based on an improved YOLOv4 algorithm. Comput. Electr. Eng. 2021, 6, 93. [Google Scholar]
- Singha, S.; Aydin, B. Automated Drone Detection Using YOLOv4. Drones 2021, 5, 95. [Google Scholar] [CrossRef]
- Fu, H.X.; Song, G.Q.; Wang, Y.C. Improved YOLOv4 Marine Target Detection Combined with CBAM. Symmetry 2021, 13, 623. [Google Scholar] [CrossRef]
- Liu, H.; Fan, K.; Ouyang, Q.; Li, N. Real-Time Small Drones Detection Based on Pruned YOLOv4. Sensors 2021, 21, 3374. [Google Scholar] [CrossRef]
- Yu, Z.; Shen, Y.; Shen, C. A real-time detection approach for bridge cracks based on YOLOv4-FPM. Autom. Constr. 2020, 122, 103514. [Google Scholar] [CrossRef]
- Kulshreshtha, M.; Chandra, S.S.; Randhawa, P.; Tsaramirsis, G.; Khadidos, A.; Khadidos, A.O. OATCR: Outdoor Autono-mous Trash-Collecting Robot Design Using YOLOv4-Tiny. Electronics 2021, 10, 2292. [Google Scholar] [CrossRef]
- Parico, A.; Ahamed, T. Real Time Pear Fruit Detection and Counting Using YOLOv4 Models and Deep SORT. Sensors 2021, 21, 4803. [Google Scholar] [CrossRef] [PubMed]
- Kumar, S.; Gupta, H.; Yadav, D.; Ansariv, I.A.; Verm, O.P. YOLOv4 algorithm for the real-time detection of fire and personal protective equipments at construction sites. Multimed. Tools Appl. 2021, 1–21. [Google Scholar] [CrossRef]
- Schütz, A.; Schöler, V.; Krause, E.; Fischer, M.; Müller, T.; Freuling, C.; Conraths, F.; Stanke, M.; Homeier-Bachmann, T.; Lentz, H. Application of YOLOv4 for Detection and Motion Monitoring of Red Foxes. Animals 2021, 11, 1723. [Google Scholar] [CrossRef] [PubMed]
- Ng, Y.W.; Chow, W.K.; Cheng, C.H.; Chow, C.L. Scale modeling study on flame color in a ventilation-limited train car pool fire. Tunn. Undergr. Space Technol. Inc. Trenchless Technol. Res. 2019, 85, 375–391. [Google Scholar] [CrossRef]
- Chik, Z.; Aljanabi, Q.A.; Kasa, A.; Taha, M.R. Tenfold cross validation artificial neural network modeling of the settlement behavior of a stone column under a highway embankment. Arab. J. Geosci. 2014, 7, 4877–4887. [Google Scholar]
- Guo, C.; Lv, X.-L.; Zhang, Y.; Zhang, M.-L. Improved YOLOv4-tiny network for real-time electronic component detection. Sci. Rep. 2021, 11, 22744. [Google Scholar] [CrossRef]
- Jie, Y.; Leonidas, L.; Mumtaz, F.; Ali, M. Ship Detection and Tracking in Inland Waterways Using Improved YOLOv3 and Deep SORT. Symmetry 2021, 13, 308. [Google Scholar] [CrossRef]
- Yan, J.; Wang, H.; Yan, M.; Diao, W.; Sun, X.; Li, H. IoU-Adaptive Deformable R-CNN: Make Full Use of IoU for Multi-Class Object Detection in Remote Sensing Imagery. Remote Sens. 2019, 11, 286. [Google Scholar] [CrossRef] [Green Version]


Publisher’s Note: MDPI stays neutral with regard to jurisdictional claims in published maps and institutional affiliations. |
© 2022 by the authors. Licensee MDPI, Basel, Switzerland. This article is an open access article distributed under the terms and conditions of the Creative Commons Attribution (CC BY) license (https://creativecommons.org/licenses/by/4.0/).