1. Introduction
Electrification is an important factor in reducing the emissions related to the road transport sector. Several European countries have announced that sales of fossil-fuelled passenger cars will be banned in the coming years [
1,
2], and furthermore, the interest from vehicle manufacturers, governments and customers in electric propulsion of vehicles has been increasing over the last few years [
3]. Reports show, however, that the general adoption of electric vehicles is restricted by the high cost of the vehicles, and more specifically, the batteries. Although the battery cost is decreasing [
4], it still is the main cost carrier of an electric vehicle (EV) [
5].
An electric road system (ERS) is an alternative to a fast charging network for enabling long trips with EVs, as the ERS reduces the need for battery capacity significantly. As long as a large enough part of the highways and regional roads are electrified, the vehicles only need the battery capacity for the last few miles to or from such roads (or longer). With ERS as the energy supply for long trips, the battery capacities of road vehicles could be reduced by 50–80%, compared to a solution with bigger batteries and a fast charging infrastructure, which would have a profound impact on the societal cost of electro-mobility [
6,
7]. Several governments, such as Germany [
8] and Sweden [
9], have acknowledged this opportunity; and Sweden in particular, has demonstrated four different modern ERS technologies on public roads, during the period 2015–2022, to build experience. Sweden has also decided to build a 2000 km ERS by 2030 and a 3000 km ERS by 2035, a globally unprecedented goal.
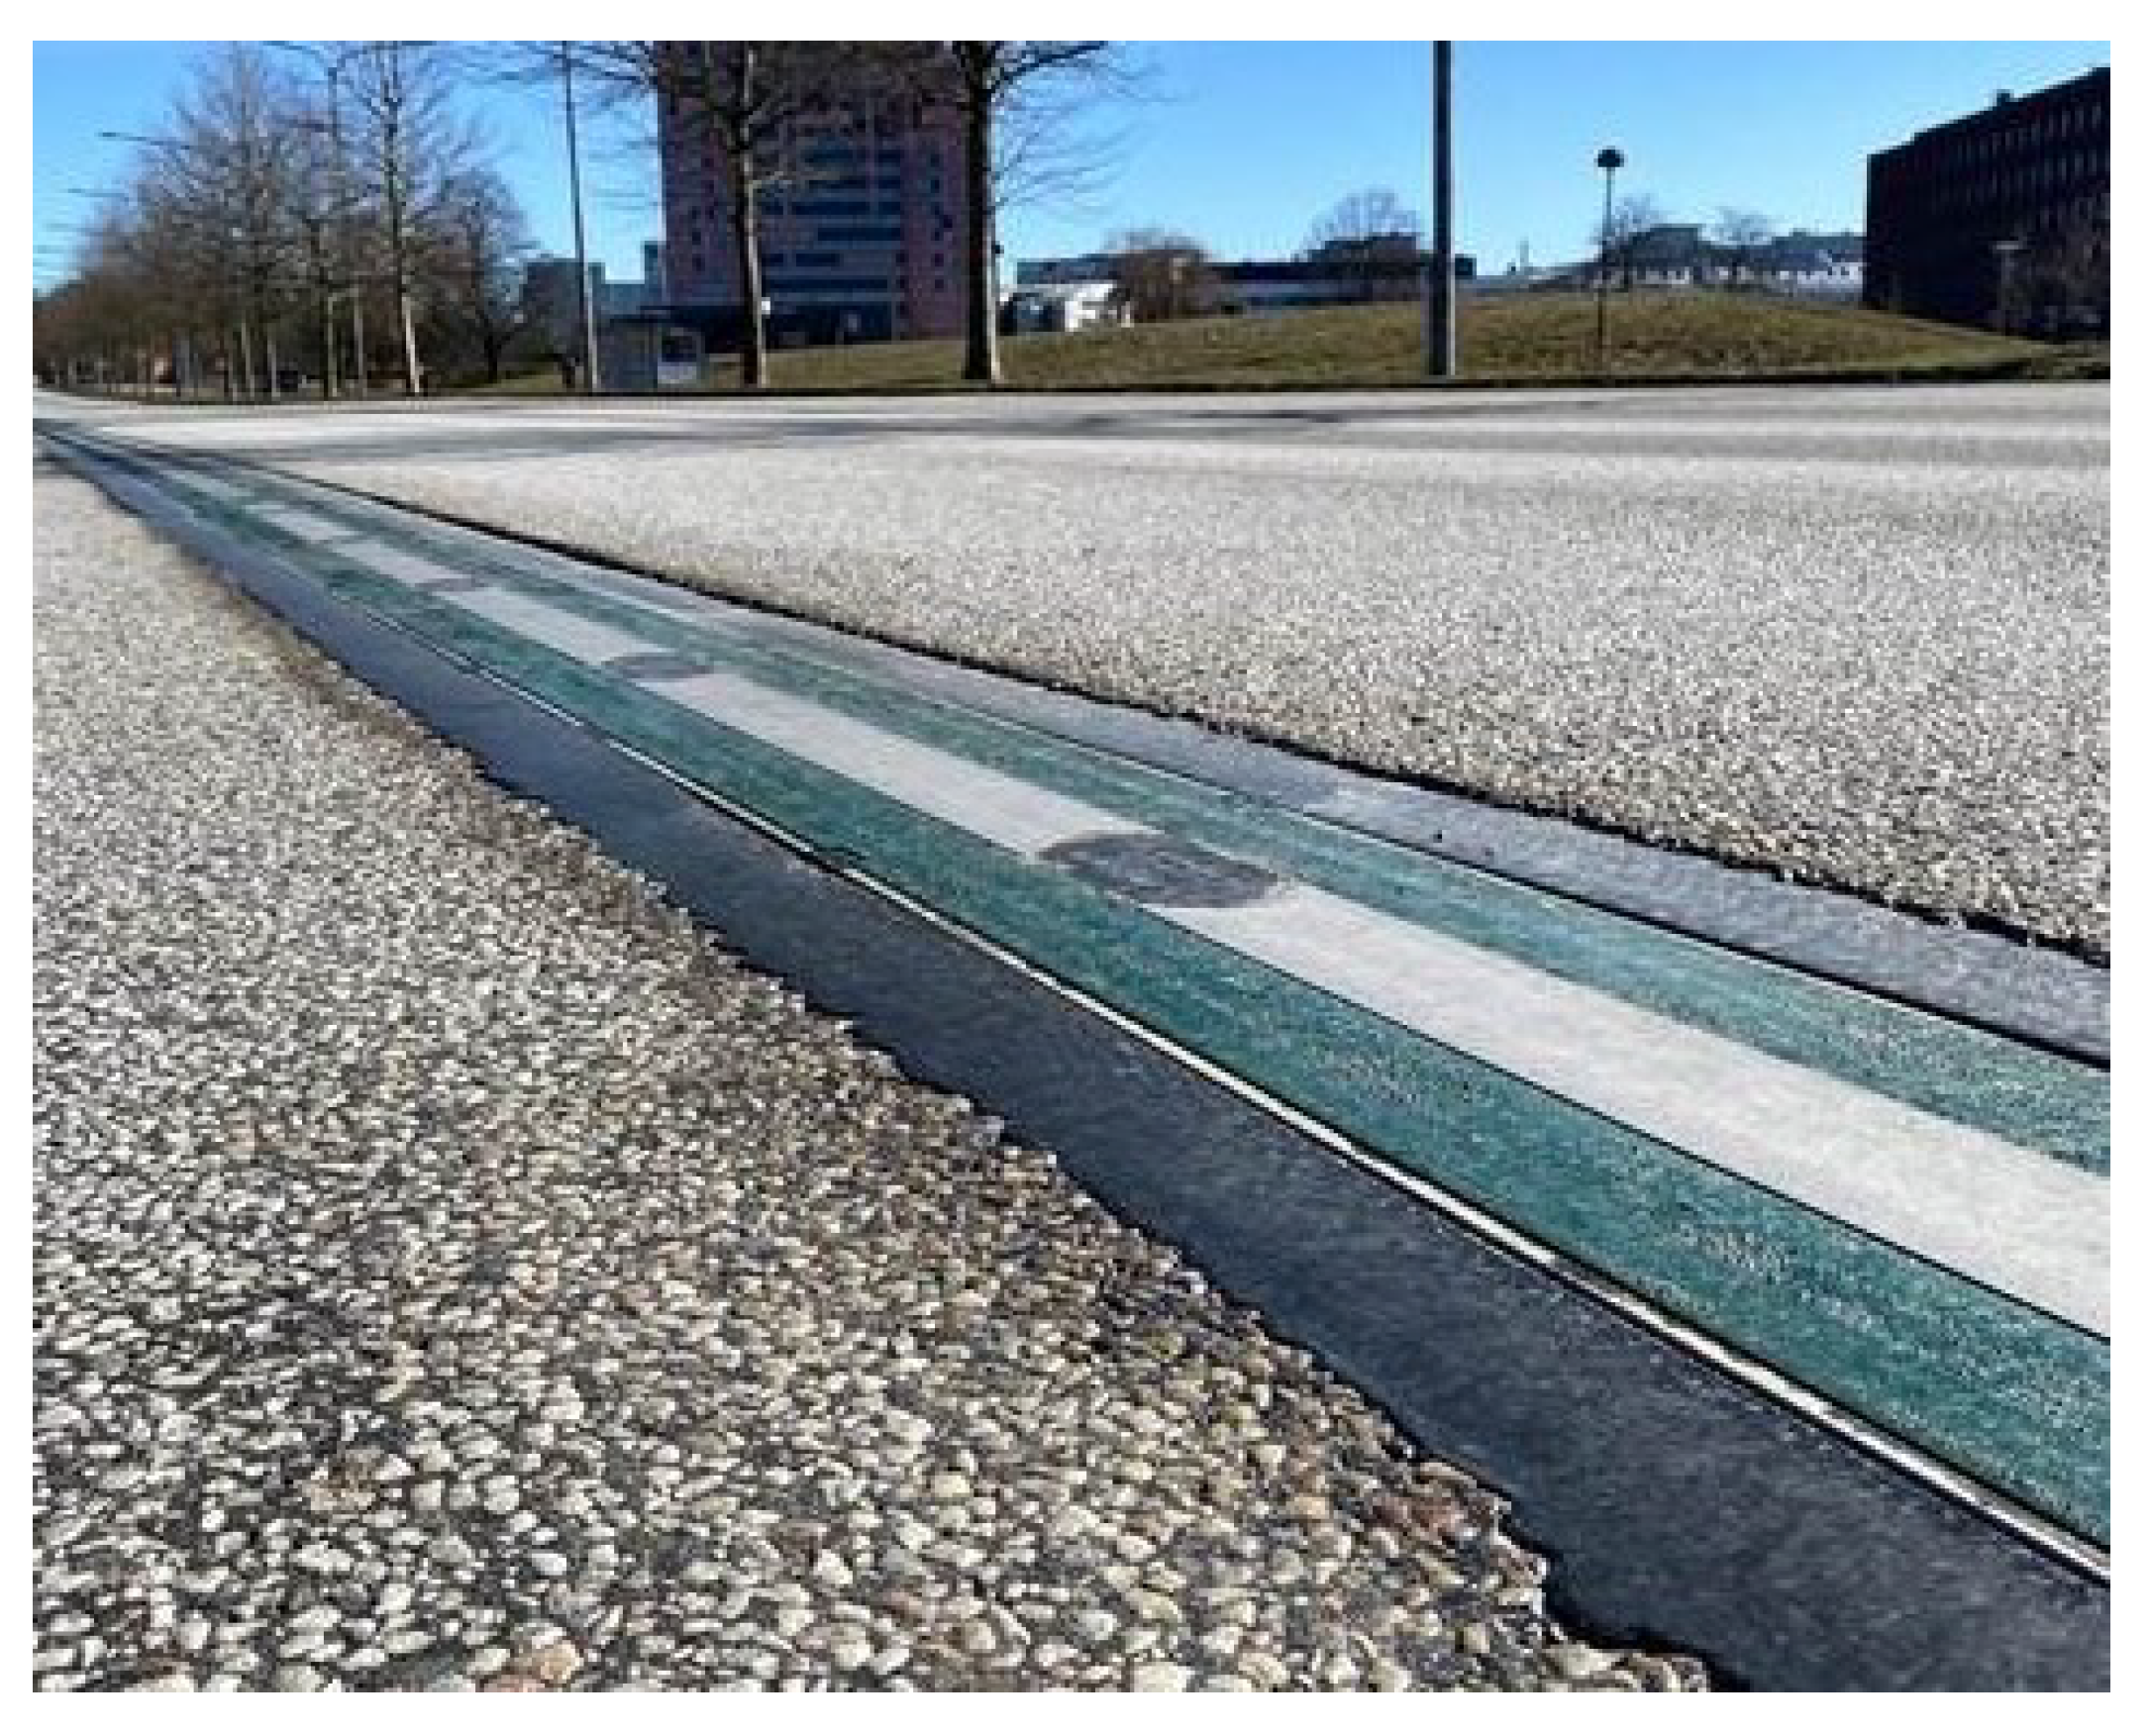
Figure 1 shows a closeup of one of the sites where a conductive ERS is being tested on public roads. The emerging technology of modern ERS presents a historically and technically unique challenge. This paper address unique technical solutions to an electric safety problem related to ERS. Both inductive (wireless) and conductive ERS solutions have been proposed, and several solutions exist on different levels of technical readiness [
10].
Charging on a conductive electric road do invoke challenges regarding safety requirements and also how the energy consumption and battery degradation of the vehicle is affected by drivetrain topology and ERS localisation. Localisation means what parts of a certain road that are equipped with ERS technology. When comparing conductive and inductive (wireless) electric road systems, it has been shown [
12] that the former is capable of higher power and higher power density than the latter, given a limited area on the vehicle for the ERS interface, often called the “pick up”. Although inductive energy transfer by nature solves one key aspect regarding safety (no galvanic connection between supply and vehicle), only conductive energy transfer is considered in this work due to its higher power capabilities within a limited area of the vehicle to be used for connection to the ERS.
With regard to safety, the main challenge with the conductive ERS solution is that, should an isolation fault occur on-board the vehicle while connected to the ERS, the body of the vehicle might have a dangerous electrical potential with respect to ground since a connection to protective earth cannot be guaranteed. There are three solutions to provide an acceptable degree of electric safety with a conductive ERS:
(1) The ERS supply voltage has a high impedance to ground (floating). In this case two simultaneous isolation faults are required—one on one pole of the supply between the supply and ground and one between another pole of the supply and the chassis. This solution is adopted by Honda [
13,
14], In this case, a
non-isolated DC/DC converter is used between the ERS and the traction voltage system (TVS = the traction battery, the traction inverter, the heating, ventilation, and air conditioning (HVAC) supply, traction machines, etc.).
(2) The supply voltage is referenced to ground with a low impedance, e.g., the minus-pole of a DC supply connected to ground in the ERS feed-in station. All systems connected to the TVS on-board the vehicle are double isolated to chassis. In this case too, a non-isolated DC/DC converter can be used between the ERS and the TVS. In trolley-buses that use a classic form of ERS with DC catenary wires, the ERS is connected directly to the TVS and uses the non-isolated DC/DC only between the TVS and the traction battery. In modern fully electric vehicles—in particular, those with large TVS, such as buses—using double isolation for all the TVS-related components and systems is undesired due to size and complexity. Instead, a solution like in case 3 should be considered:
(3) The same supply as in case (2) but with a galvanic isolation interface, e.g., an isolated DC/DC converter, inserted on-board the vehicle between the ERS supply and the TVS. Thus, all components and systems on the TVS side of the DC/DC converter do not need double isolation. The double isolated parts are those on the ERS side of the DC/DC converter, including the “pick-up” (connector to the particular ERS solution), the filters, the sub frames and the DC/DC converter itself. This provides not only a significant reduction in complexity but also reduces and contains the sources of stray capacitance to the chassis, which can affect the electromagnetic compatibility (EMC) situation.
Solution (3) is the preferred choice in all demonstrations of modern conductive ERS solutions made in the last decade [
11,
15,
16,
17]. The use of a DC/DC converter for full ERS power is, however, not desirable, since it needs to handle relatively high power levels and thus becomes big (and expensive). Thus, alternatives that utilise some form of “integrated charging”—i.e., wherein the isolated DC/DC function is accomplished with the existing drivetrain components—are interesting. These are, however, not the same integrated charging solutions as those developed for static charging.
Energy transfer from an electric road adds another level of complexity compared to charging at a standstill, since the vehicle simultaneously has to charge the battery, drive the vehicle and supply auxiliary loads whilst optimising drive cycle energy consumption. NB: In this context we use the expression “energy transfer solution” (ETS) to represent all technology included to draw power from the ERS, and feed it to the traction battery and to the wheels simultaneously. The ETS is thus a combination of a charging system and an electric drive train. Depending on the technical solution for energy transfer from ERS to TVS; the rated power of the traction drives; and (if present) the DC/DC converter, the battery capacity, the control strategy, etc.—the ETS cost, charging performance and energy consumption are affected. In this work, three different ETSs were investigated. Their advantages and disadvantages with regard to performance and energy consumption have been modelled and evaluated. The localisation of the ERS, such as how large a fraction of the stretch of the road that is covered and how far it is between each section, also plays an important role for the energy consumption and battery degradation.
This study expands upon [
18], in which a novel design of an electric powertrain with integrated energy transfer for conductive ERS was presented, experimentally designed and tested. The result from that study was used to extract an efficiency map of the electric machine, inverter and mechanical transmission, which was used to model a complete powertrain and vehicle in this study. Three different powertrains were modelled separately and evaluated in a city bus driving cycle sampled from an actual city bus route.
It was discovered that the powertrain/energy transfer solution and the amount of road covered with ERS have the largest influences on energy consumption, and that the distances between ERS sections and battery capacity have the largest influences on battery degradation.
2. Related Work and Contributions
Publications related to dynamic charging of electric vehicles that can be found in the literature mostly concern wireless, inductive methods of transferring energy from the stationary supply to the moving vehicle. Of these, several studies have analysed the shape and layout of the coils [
19,
20,
21]. In [
22], a stochastical method of placing the charging sections of a dynamic charging system was proposed (again, aimed at inductive energy transfer), and in [
23] a system-level approach to finding the amount of battery capacity that can be reduced thanks to (wireless) dynamic charging availability was presented. The study presented in [
24] investigated how the relative coverage of dynamic energy supply and its maximum power transfer capability affect the driving range of a vehicle; however, the energy transfer method is inductive and little concern is given to the on-board part of the charging system. A summary of
conductive dynamic charging systems that are under development is presented in [
25]; however, it does not provide a system-level approach in conjunction with the vehicles operating the conductive electric road. References [
13,
14] present a validated method of transferring high power levels through a conductive dynamic charging solution, but do not discuss alternative ETSs on-board the vehicle, and thus not how these would impact the energy consumption or battery degradation.
Different methods and solutions to
static integrated charging can be found in the literature, and [
26] presents a comprehensive summary of typical characteristics of said chargers in the recent literature. In most of the solutions reported in [
26], the charger is either low-power or non-isolated; only a few feature both high power and isolation. Although it was not the intention, there are a few charger topologies presented that could relatively easily be adapted for dynamic charging, namely, those which feature two separate electrical machines or one six-phase machine, by separating the DC-link to one for each machine or pair of three phases, i.e., one separate three phase converter per three phases. This way, one DC-link can be connected to the battery and one to a DC-supply. If there are two separate machines, they do need to be mechanically connected. There are publications presenting solutions to isolated, high-power charging where either a six phase machine and/or inverter is required [
27,
28] or where reconfiguration of the motor windings is required [
29]. The integrated charging solutions described in [
26,
27,
28,
29] are all intended for
static charging, and
none of the solutions described are suitable for dynamic energy transfer. This is because the scientific and engineering field of dynamic conductive ERS is very young.
Based on the above, where a gap in related research concerning
conductive ERS and on-board charging topology was established, this paper presents a study on high-power, conductive dynamic energy transfer in the context of a real-world city bus route. Both relative coverage of the ERS and the distances between ERS sections were part of the study; and driving range, energy consumption and battery degradation were the outcomes of interest. Besides the ERS characteristics investigated, different topologies of on-board ETS were part of the evaluation to investigate their effects on the aforementioned outcomes. The novel ETS featuring galvanic isolation and integrated charging capabilities presented in [
18] was benchmarked against two (arguably) more conventional approaches towards dynamic energy transfer.
4. Modelling
To evaluate the different ETS with respect to energy consumption and battery wear as functions of the ETS and ERS specifications, some modelling is needed. In the following sections subsystem models of the ETS, the ERS and the vehicle models are described. The drive cycle used was a City Bus Cycle called CBR85, recorded from the quite demanding Bus line 85 in Gothenburg. Data of the drive cycle are shown in
Table 1. The drive cycle (A to B and return to A) was repeated three times in order to emulate one shift’s worth of work. The characteristics correspond well with the drive cycles compiled in [
30], validating the legitimacy of the drive cycle utilised in this study. The parameter (
aggressiveness) is defined as in [
30]. The modelling of the vehicle and ERS was performed with Matlab/Simulink.
4.1. Traction Converter and Machine and Mechanical Transmission
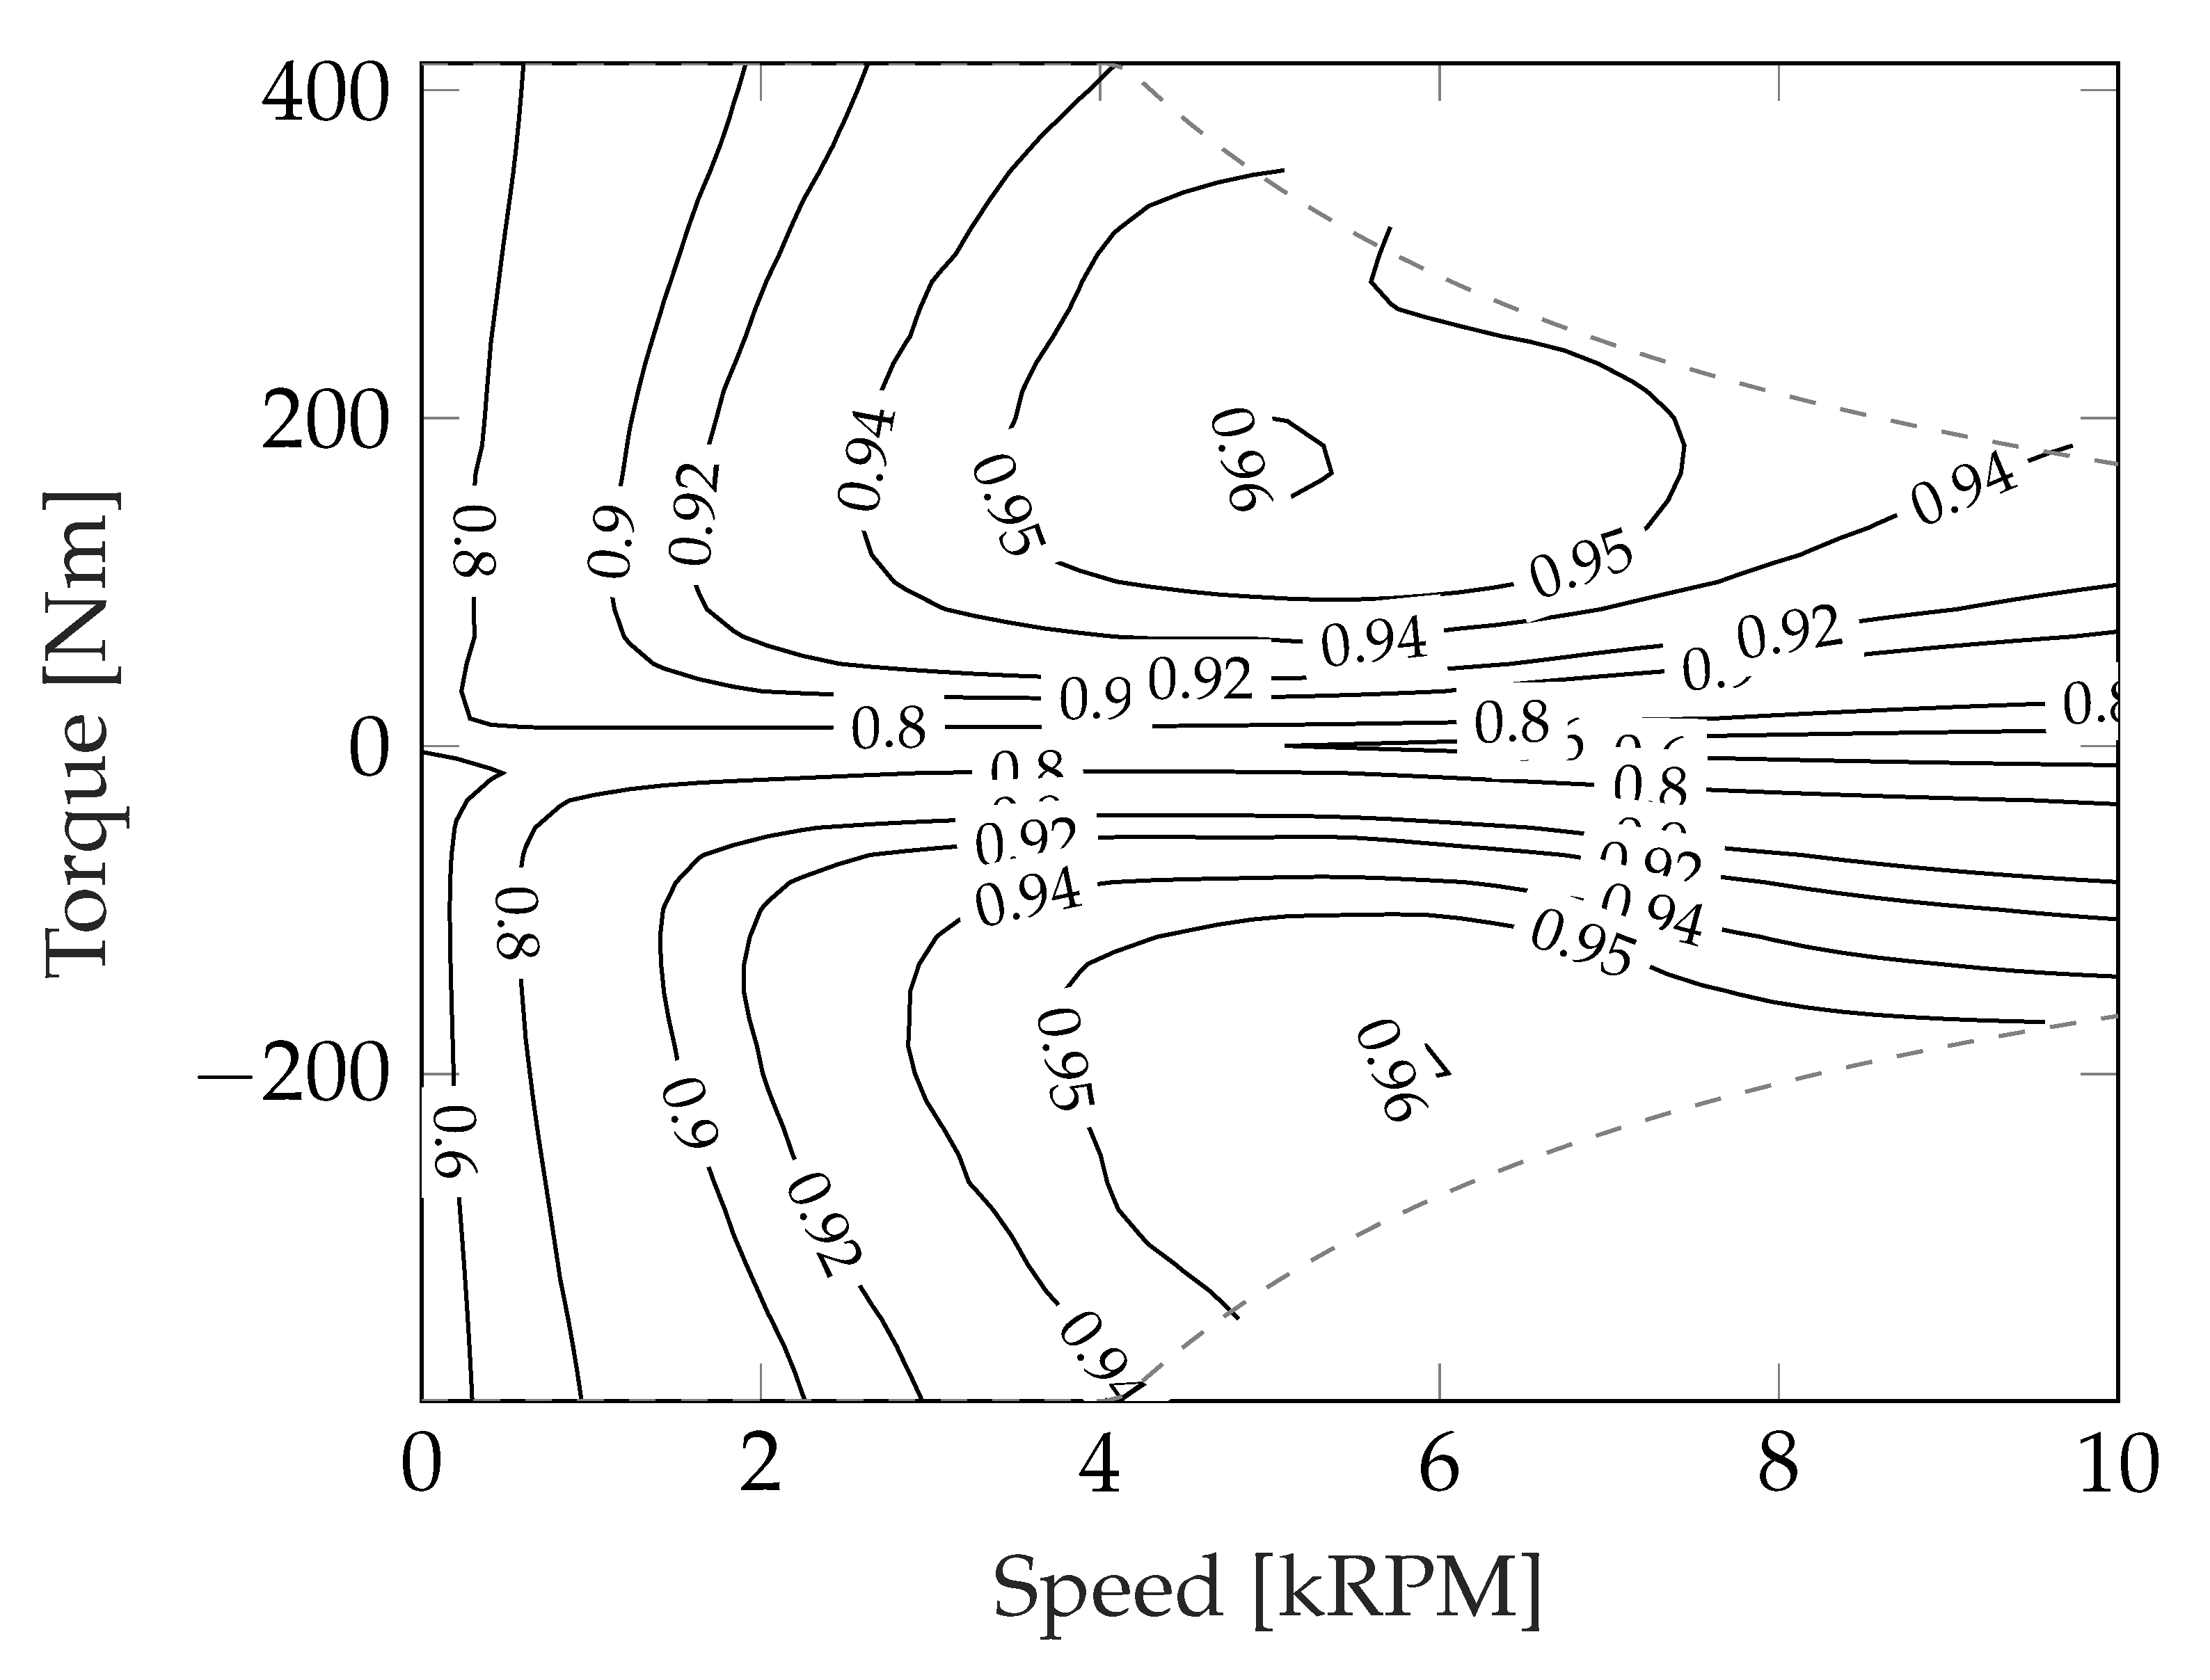
The DC to DC charging efficiency map of the FIETS,
Figure 2, is illustrated in
Figure 5. As presented in [
18], an experimental setup of the FIETS was commissioned in order to verify dynamic behaviour and charging performance. The DC to DC efficiency was calculated by measuring the electrical power at the DC side of each machine converter while one was motoring and one was regenerating. No torque was delivered to the output shaft of the mechanical transmission from this measured data. The efficiency of the individual traction drives can be calculated as follows.
In order to extend the speed/torque map slightly, the input and output power were extrapolated using the Matlab “gridfit” tool [
31] to 10,000 rpm and 400 Nm, respectively. The gear ratios and loss of the mechanical transmission as functions of input speed and torque are provided by the manufacturer. With these known, the total loss of both traction drives can be expressed as
The total losses of one traction drive is divided into two parts:
where the first term denotes the copper losses, dependant on the current, and the second term the frequency-dependant losses, dependant on the rotational speed of the machine. The copper loss is calculated by
where
is measured at room temperature, compensated for at the temperature at which the machines are operating according to
, where
is the temperature coefficient of copper. For each measurement point of the input and output power, the current of each traction drive is also stored, making it possible to calculate the resistive losses individually. The
total frequency-dependant losses can be calculated by
where the last term is the sum of the resistive losses from both traction drives. As the machines do not rotate at the exact same speed, the total frequency-dependant losses are distributed between the traction drives at the same ratio as the difference in rotational speed [
18]:
where the subscripts
and
denote the motoring and generating traction drive, respectively; and the scaling factor represents that at every rotational speed, the motoring machine rotates approximately 4% slower than the generating machine. The total amount of losses for each of the traction drives then becomes
As the total amount of losses for each of the traction drives is established, the loss distribution between the traction drives and mechanical transmission can be deduced. The resulting distribution is shown in
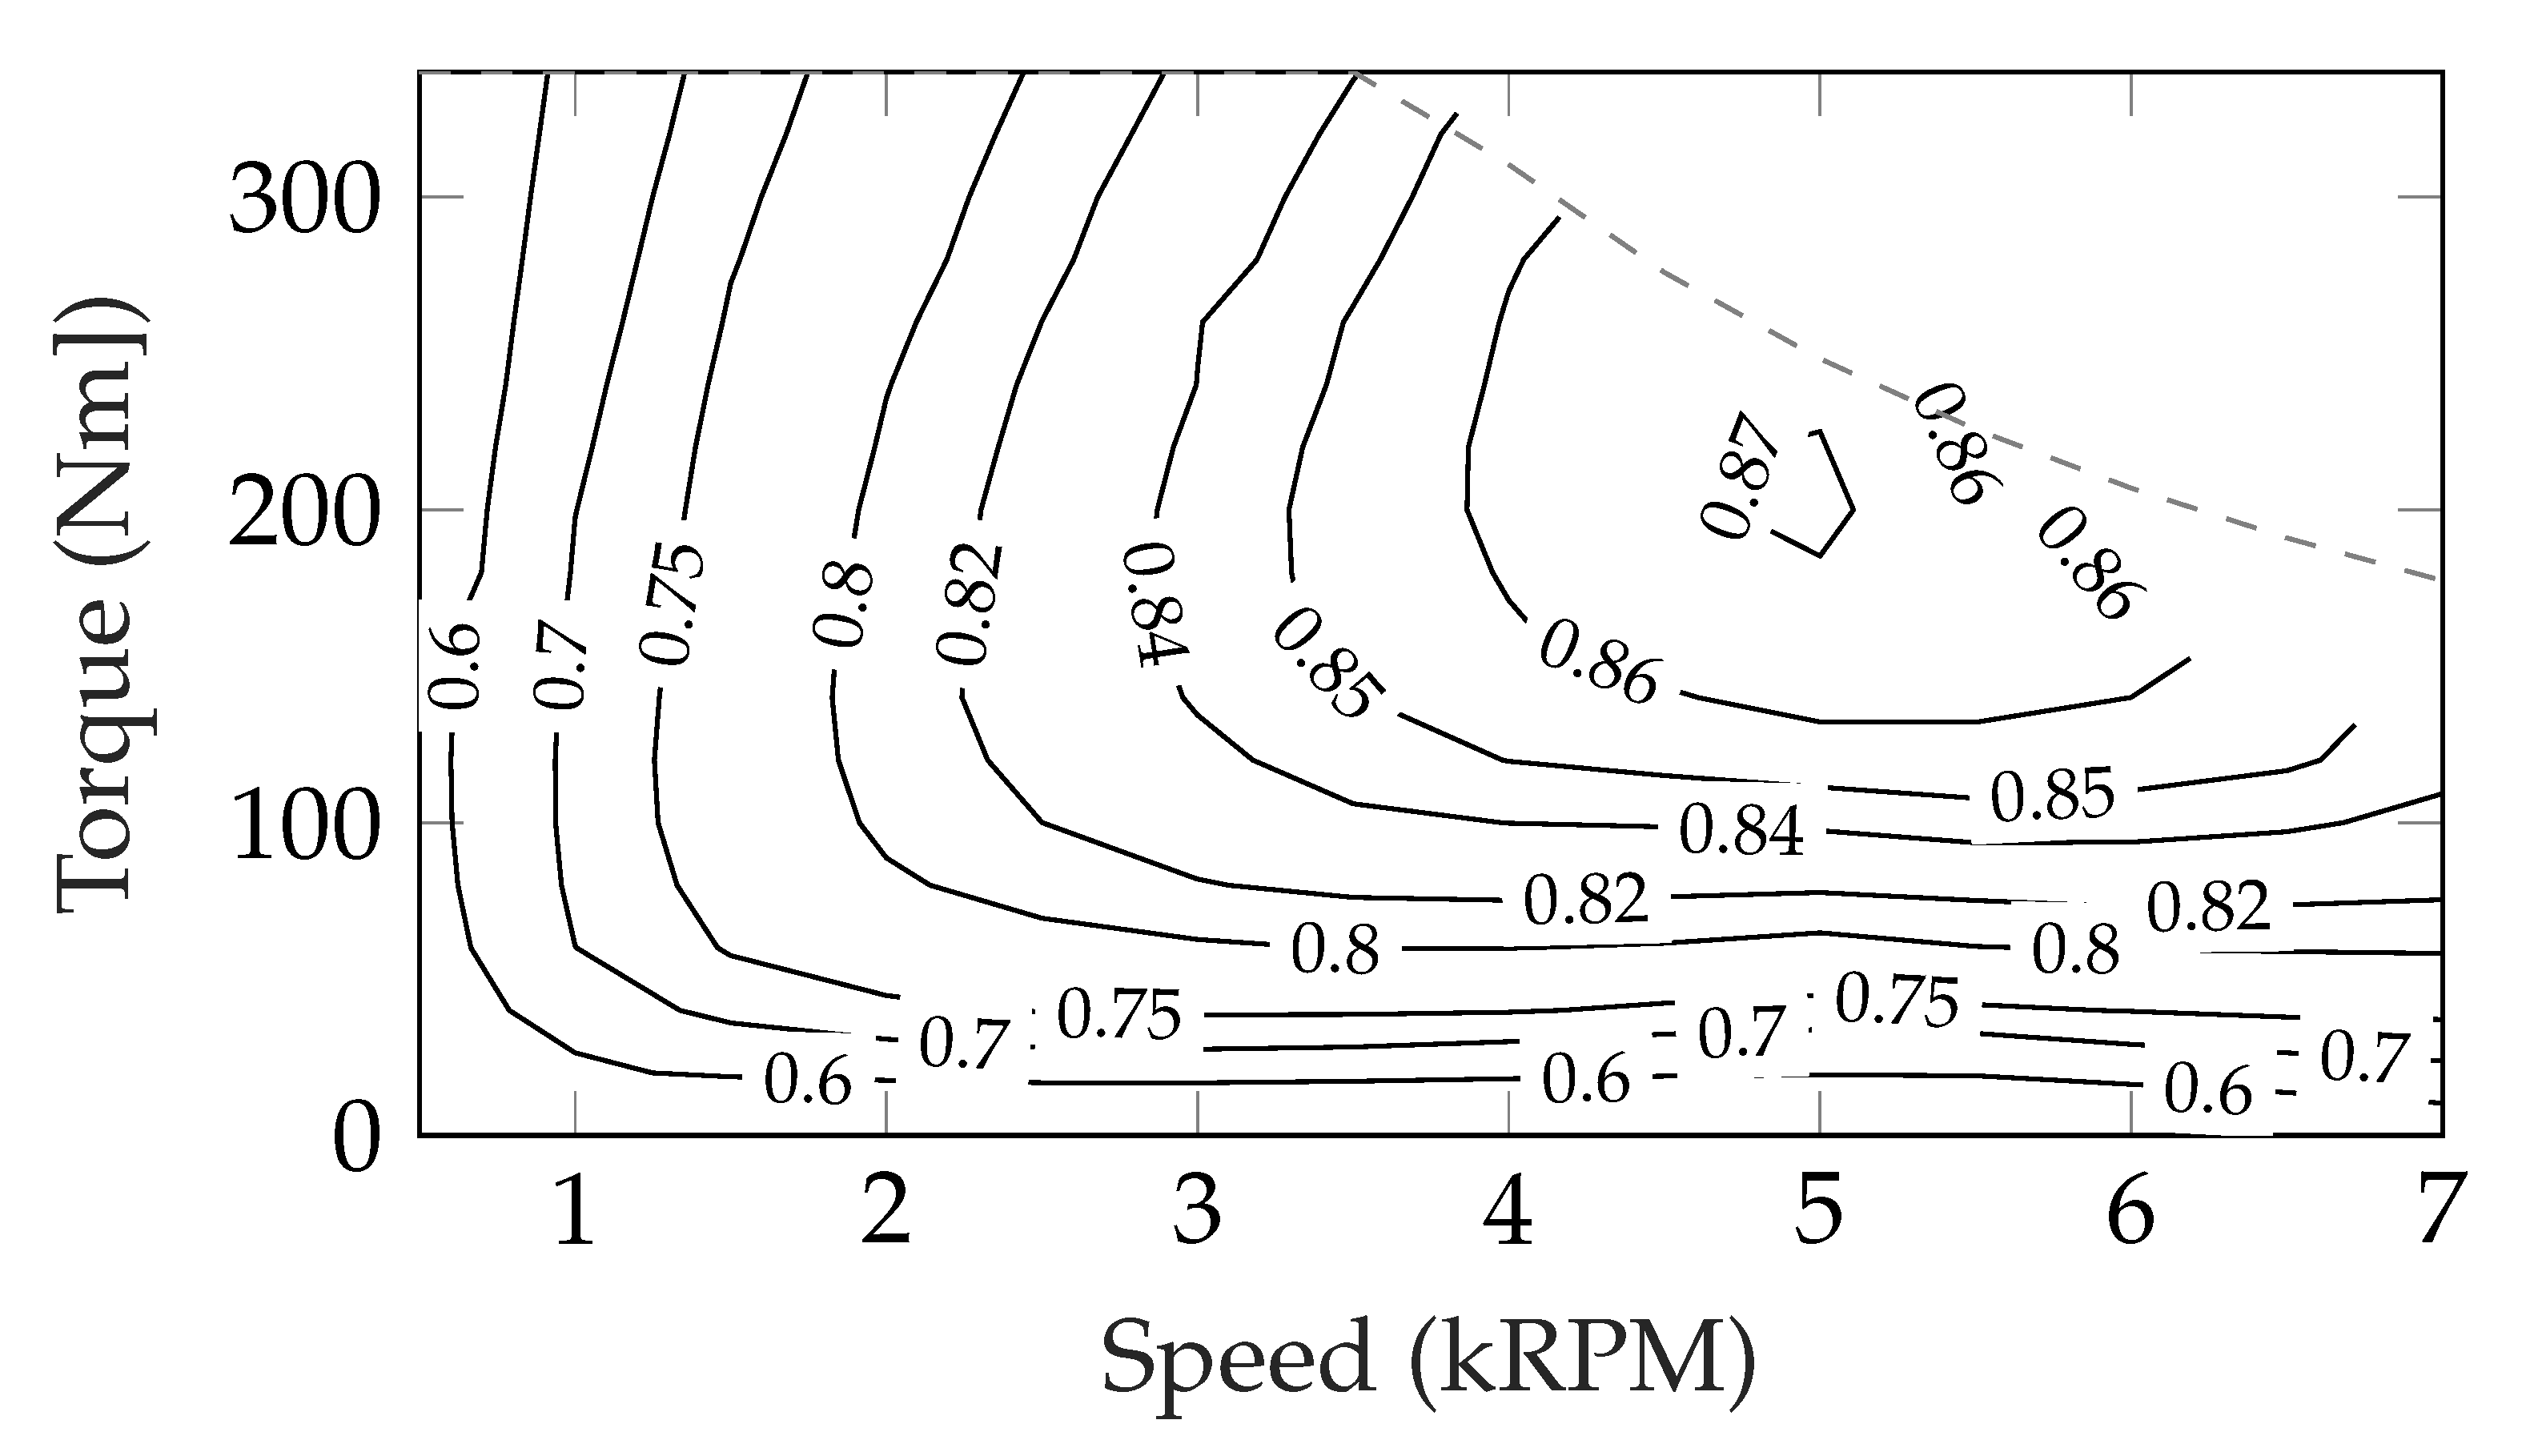
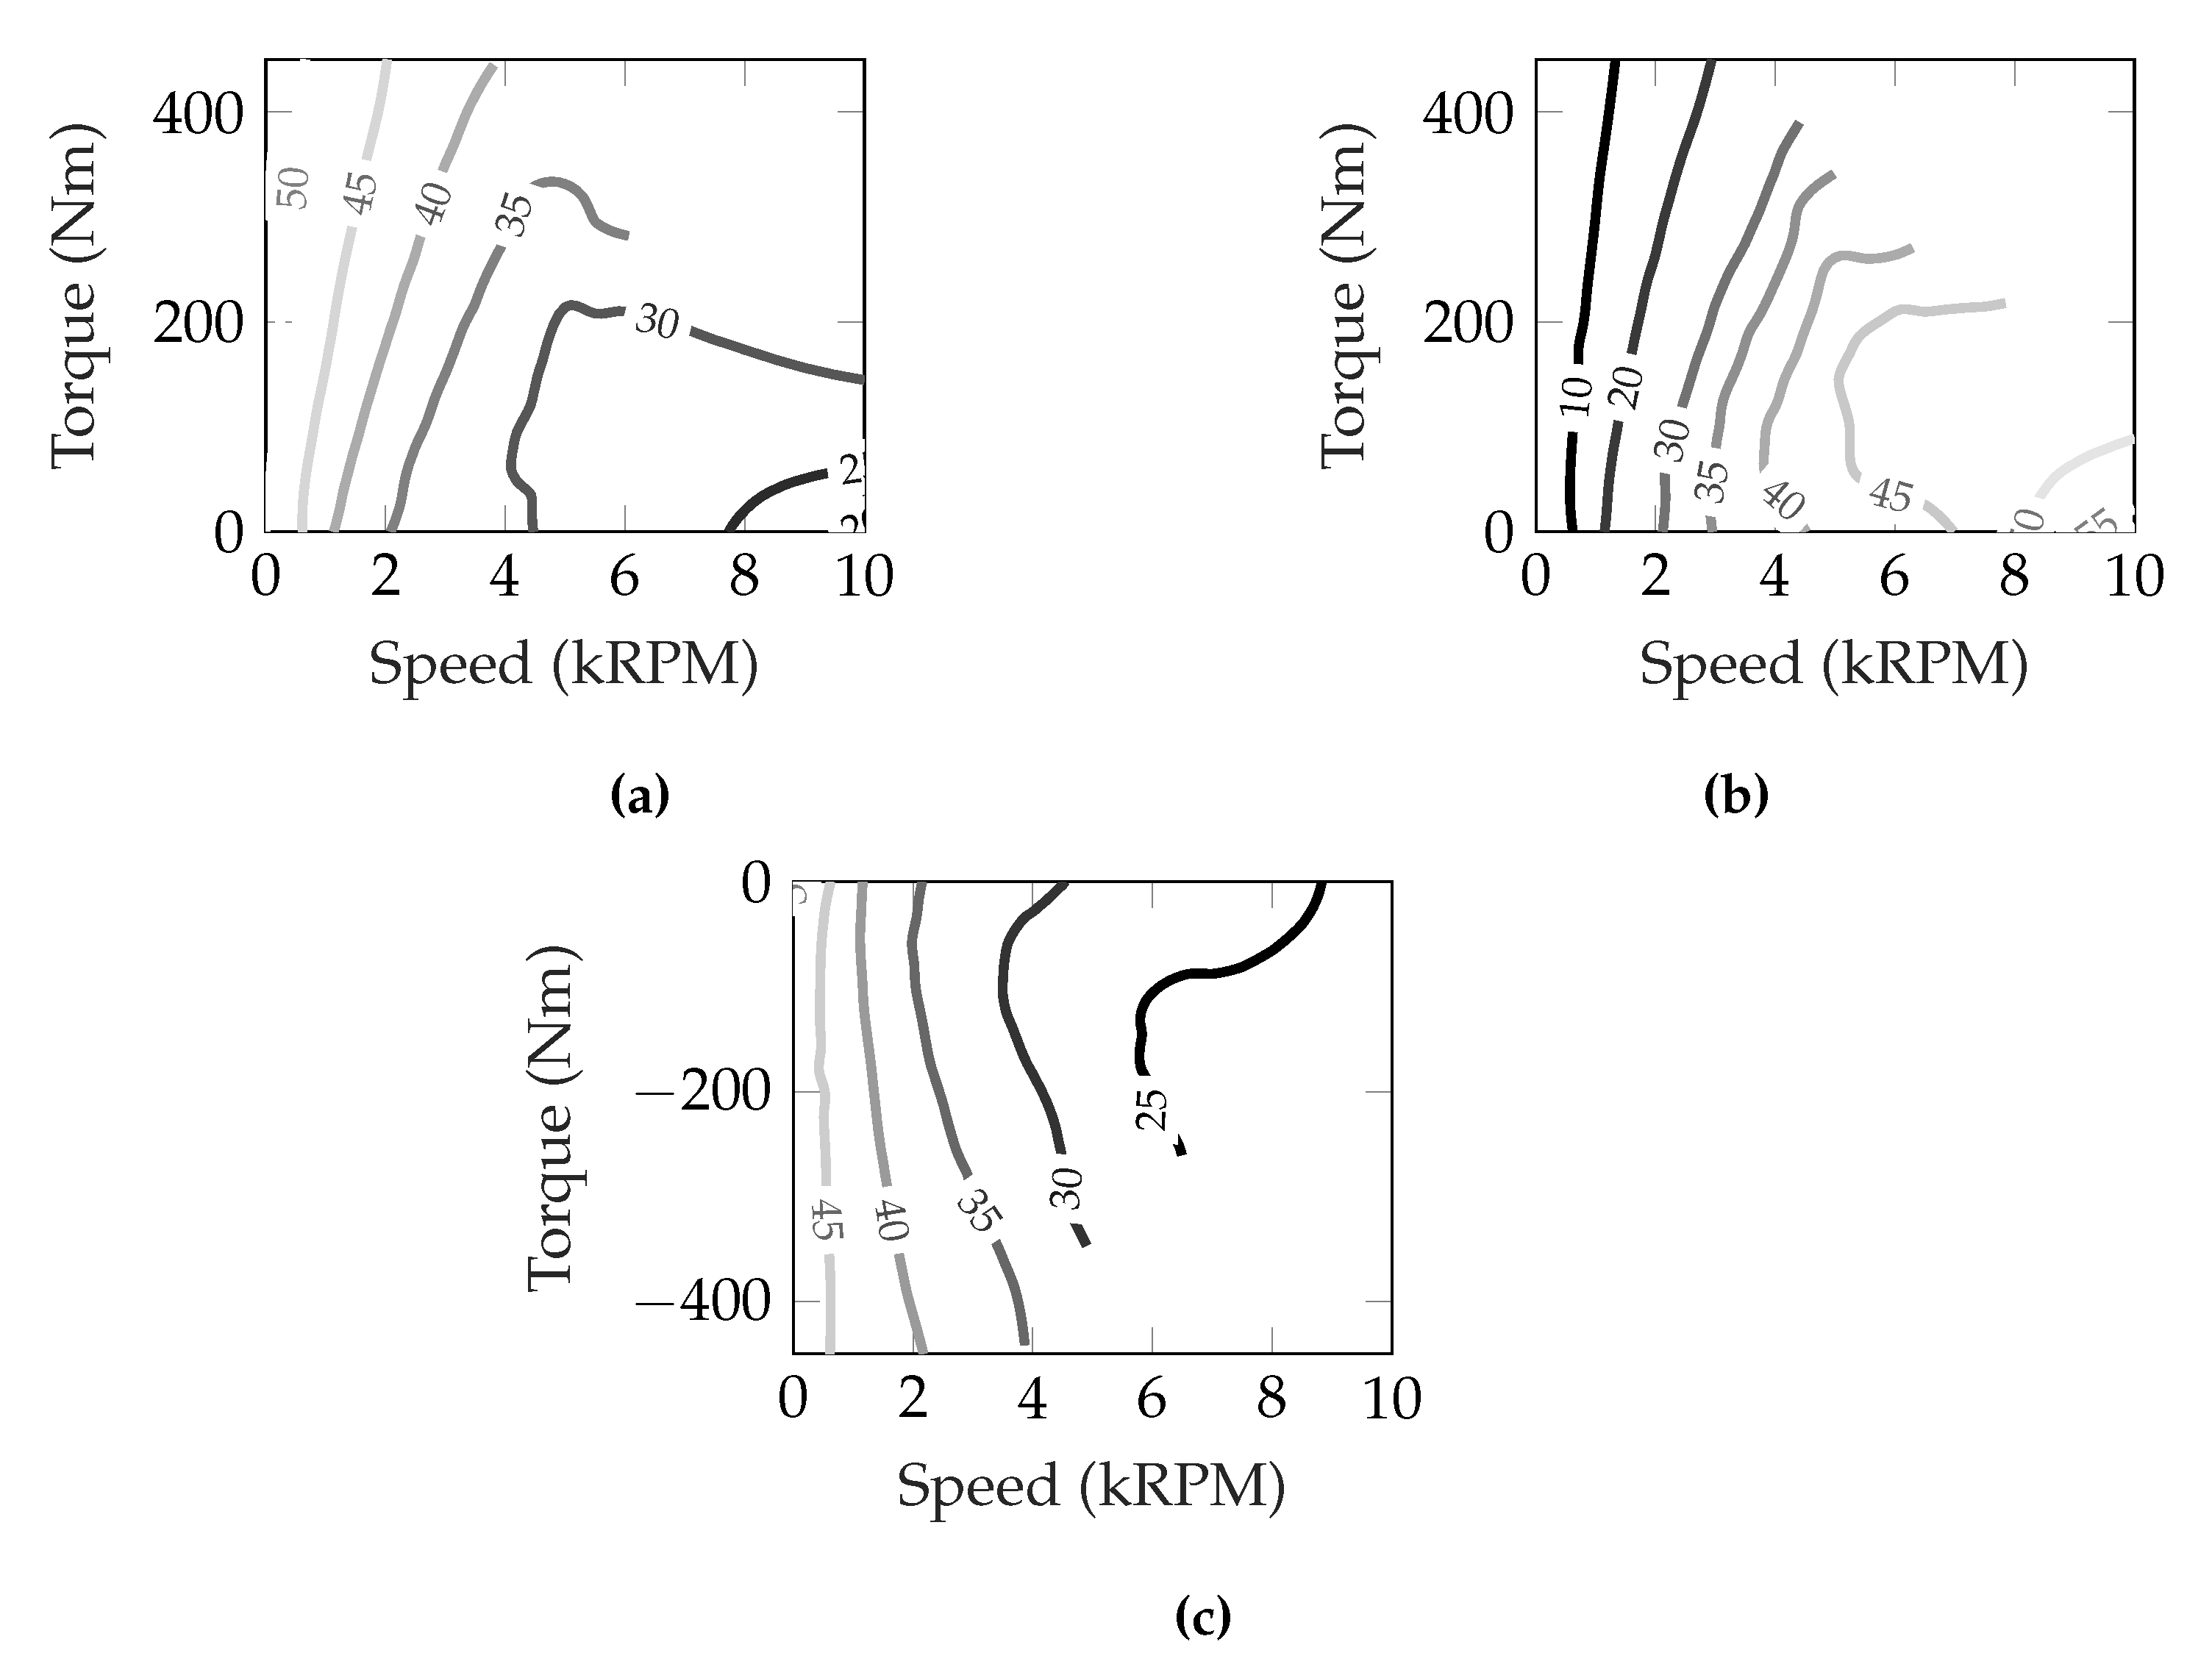
Figure 6. An efficiency map of the traction drive can now be created by calculating the efficiency of the traction drive in motoring and generating mode according to
where
is the corresponding loss term of Equation (
7). The final efficiency of the traction drive (machine + converter) in motoring and generation mode is shown in
Figure 7.
Traction drives of different levels of rated power were evaluated in the drive cycle simulations. In order to achieve this, the efficiency map shown in
Figure 7 was used though the y (torque) axis and rescaled to represent traction drives of different power ratings. In the following simulation study, this variation was extended from the measured machine (180 kW) +/− 40 kW.
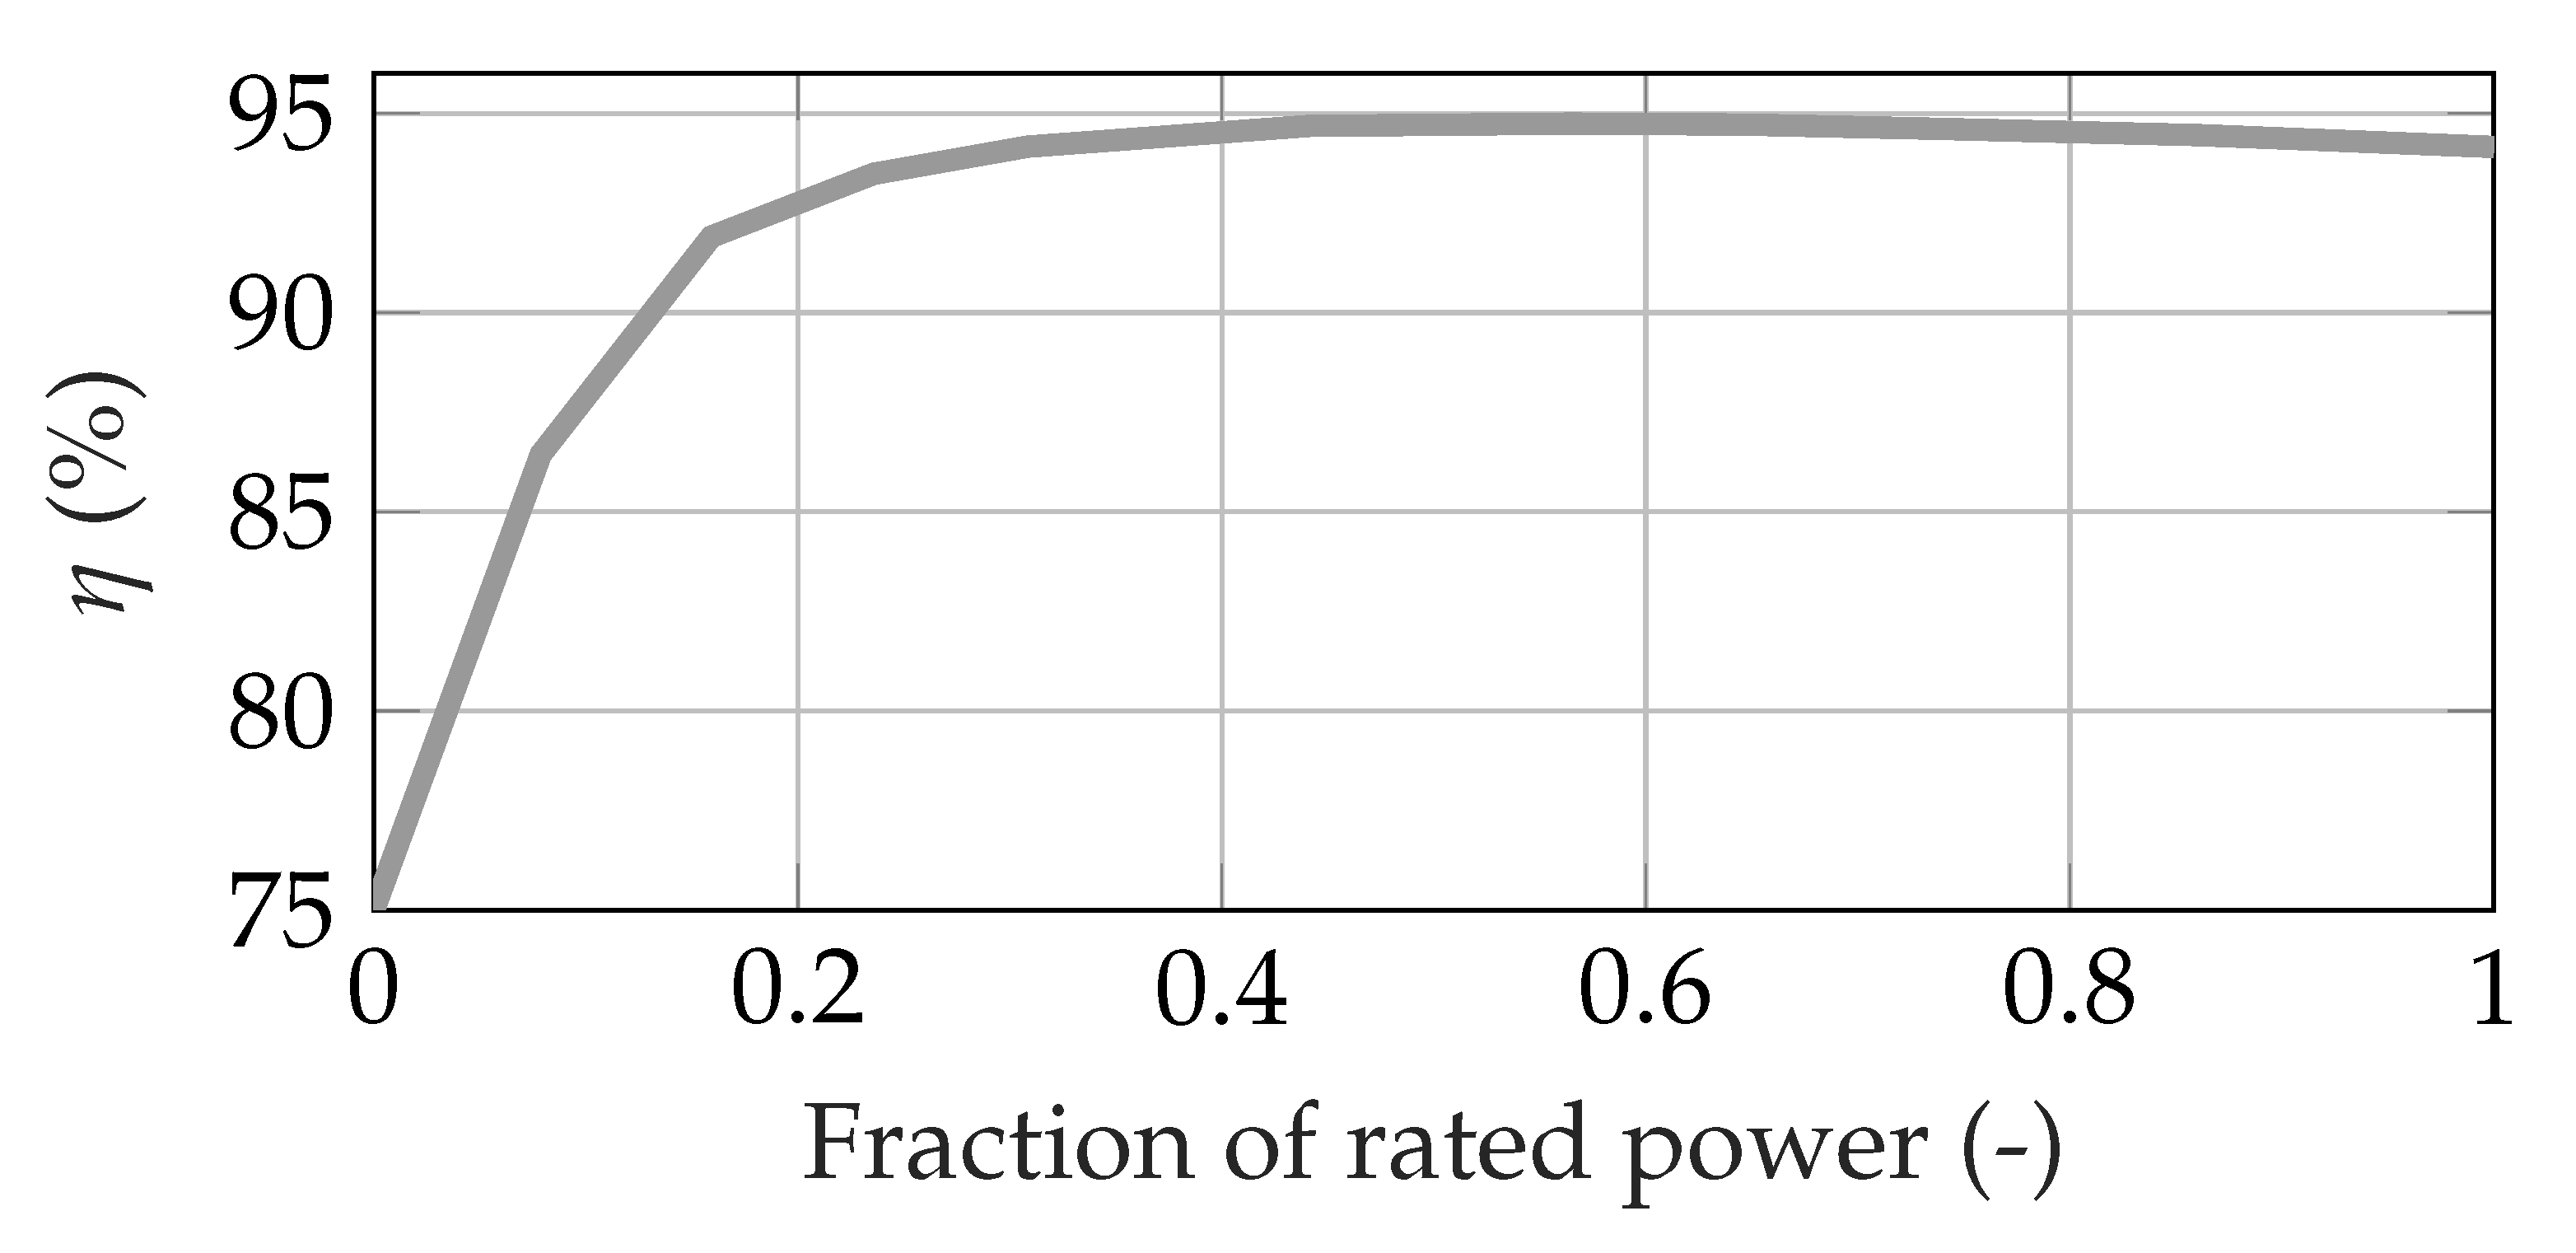
4.2. DC/DC Converter Model
The DC/DC converter, regardless of rated power, was modelled with power-dependant efficiency as shown in
Figure 8. The limited accuracy of this model is based on what could be found in the literature [
32,
33,
34]. Since the purpose of this paper was
not to make a final system design but to
compare system designs, the accuracy was deemed acceptable.
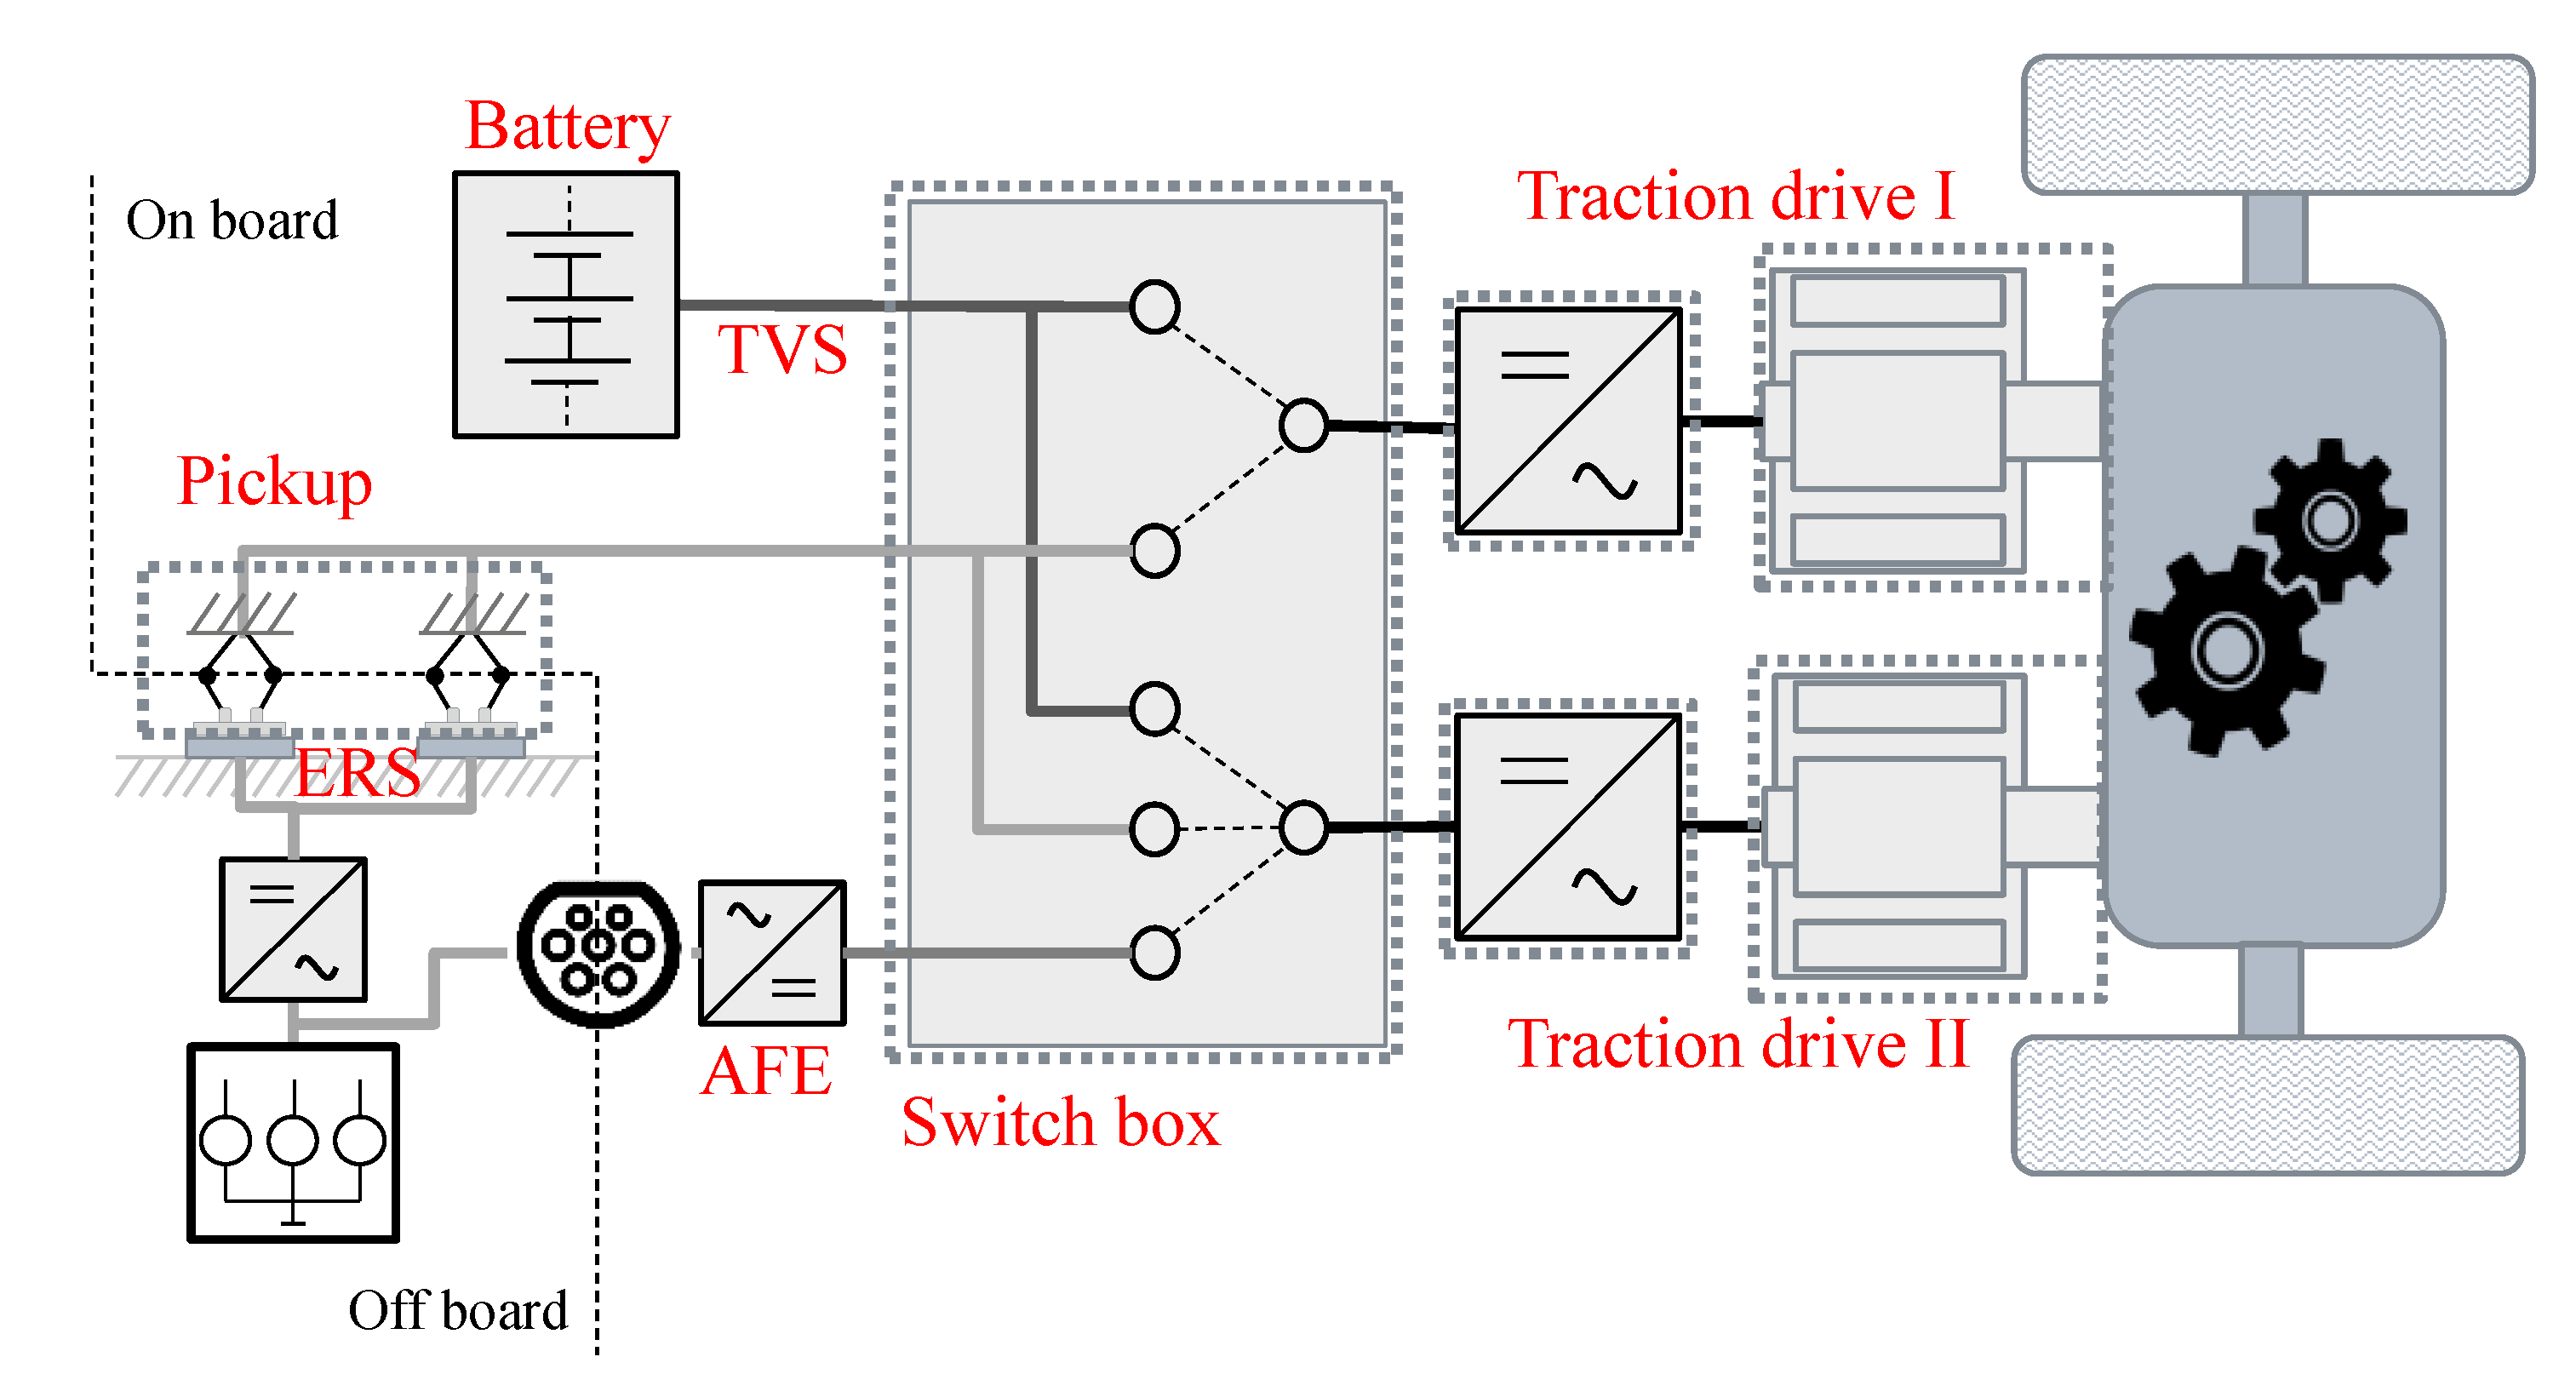
4.3. Switch Box
The switch box of the FIETS,
Figure 2, (and the LSETS,
Figure 4, albeit of lower complexity) was modelled as a state machine which directed from which power source (battery or ERS) the power was drawn/provided. A dead-time was implemented when switching states of the switch box; the requested torque of the traction drive that was switched was set to zero for 300 ms before the switching occurred, and kept to zero for another 300 ms after the switching was complete until a torque was again requested. These assumptions were experimentally verified on the target system in [
18].
4.4. Battery Model
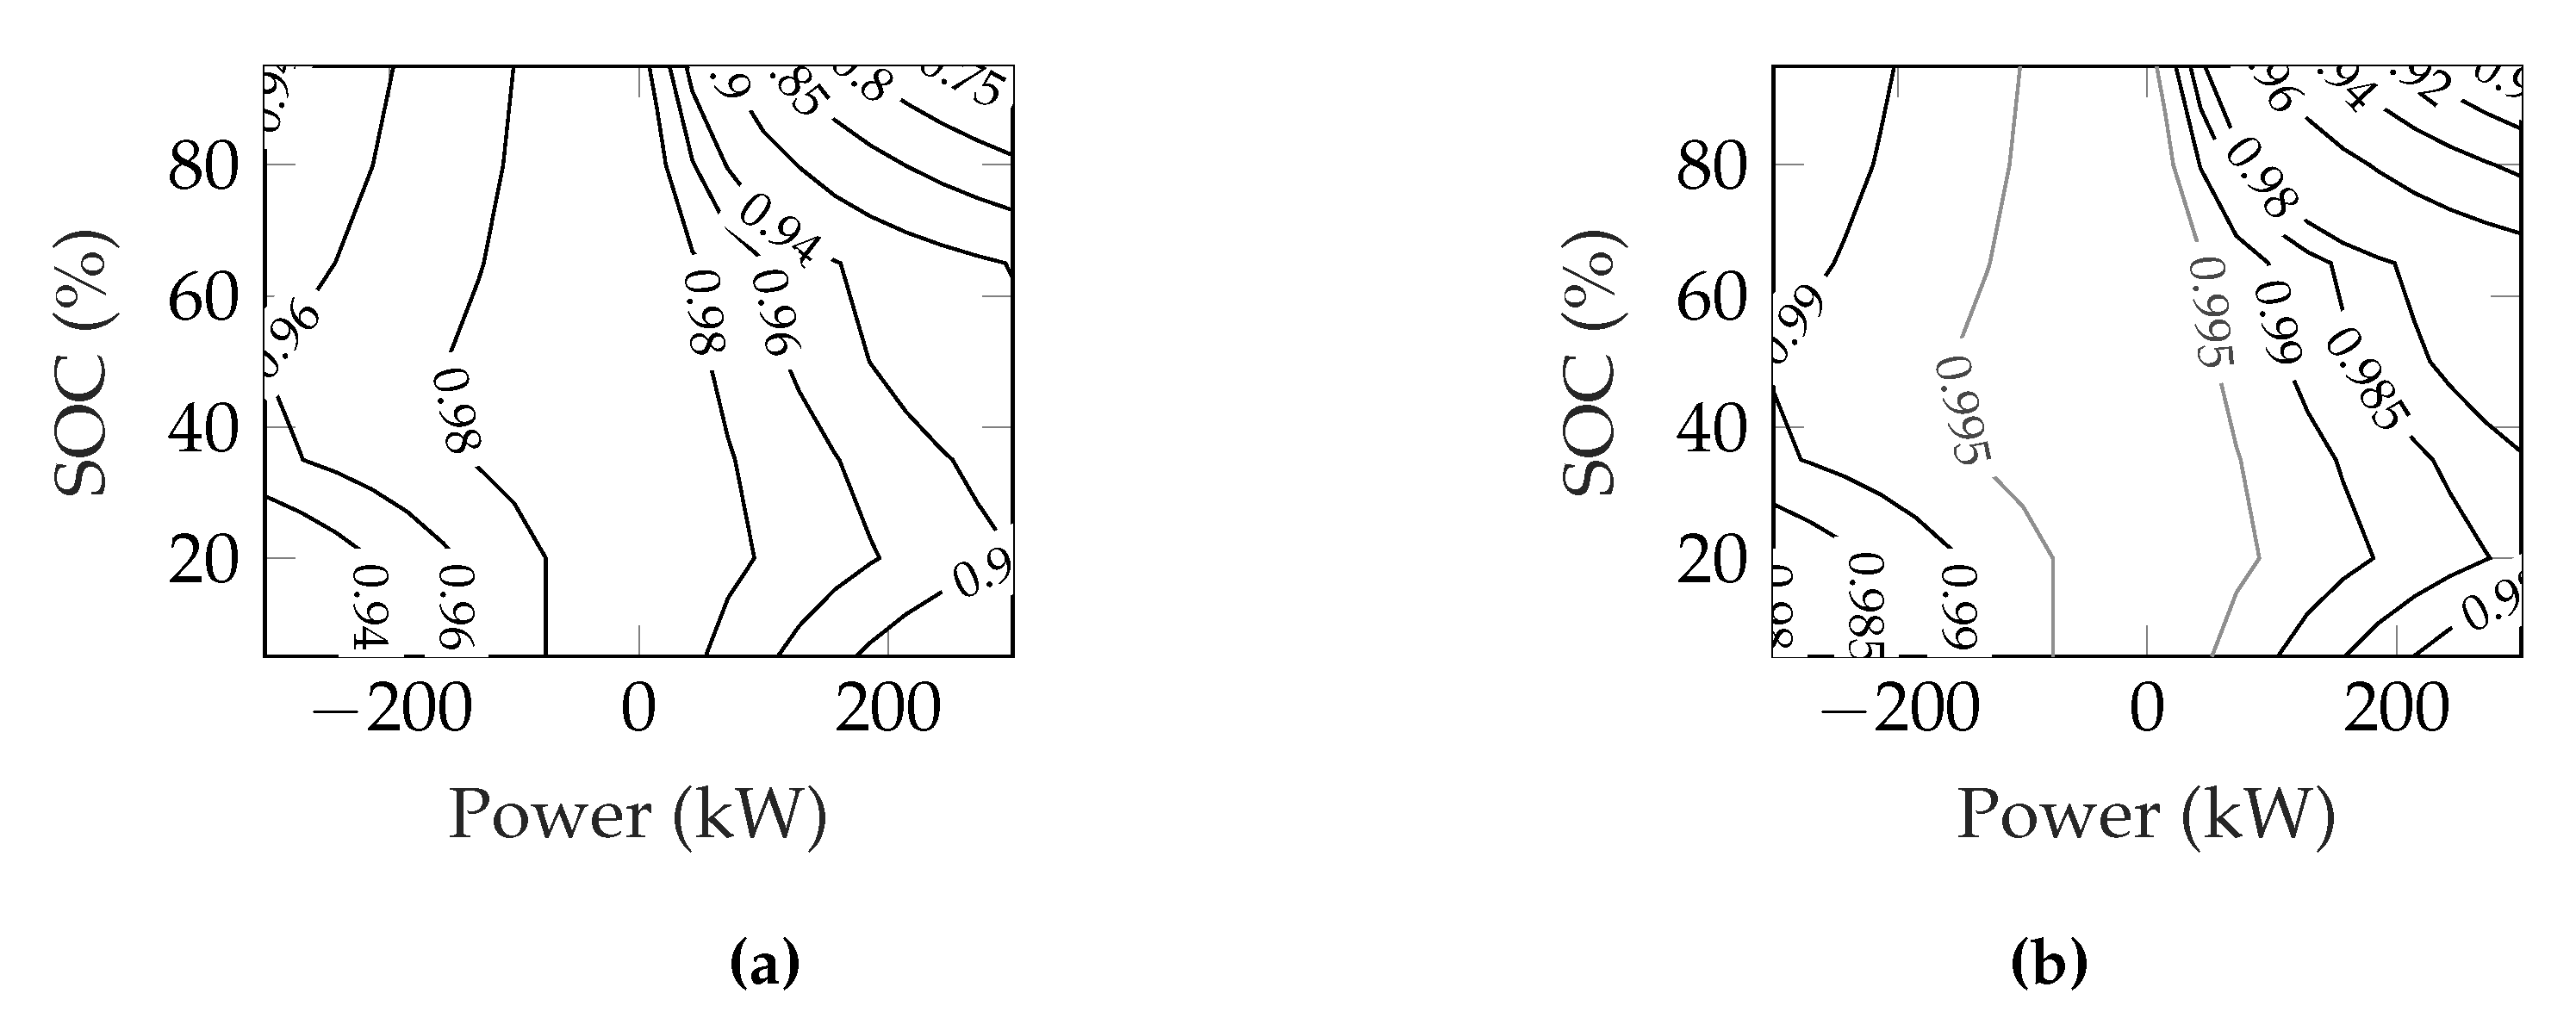
For each required battery pack capacity, a specific battery model was created based on one type of Li-ion cell. The battery was modelled as an ideal voltage source with a series resistance. The resistance was dependent on the state of charge (SOC) but not dependant on the temperature of the battery, as presented in [
35,
36]. The nominal voltage was set to approximately 400 V in all cases, meaning the number of cells in series was fixed, meaning in turn that the resistance of each string was fixed. The number of strings was then altered in accordance with the desired capacity of the battery pack, affecting the total resistance of the pack. The efficiency map of the battery at two different levels of capacity is shown in
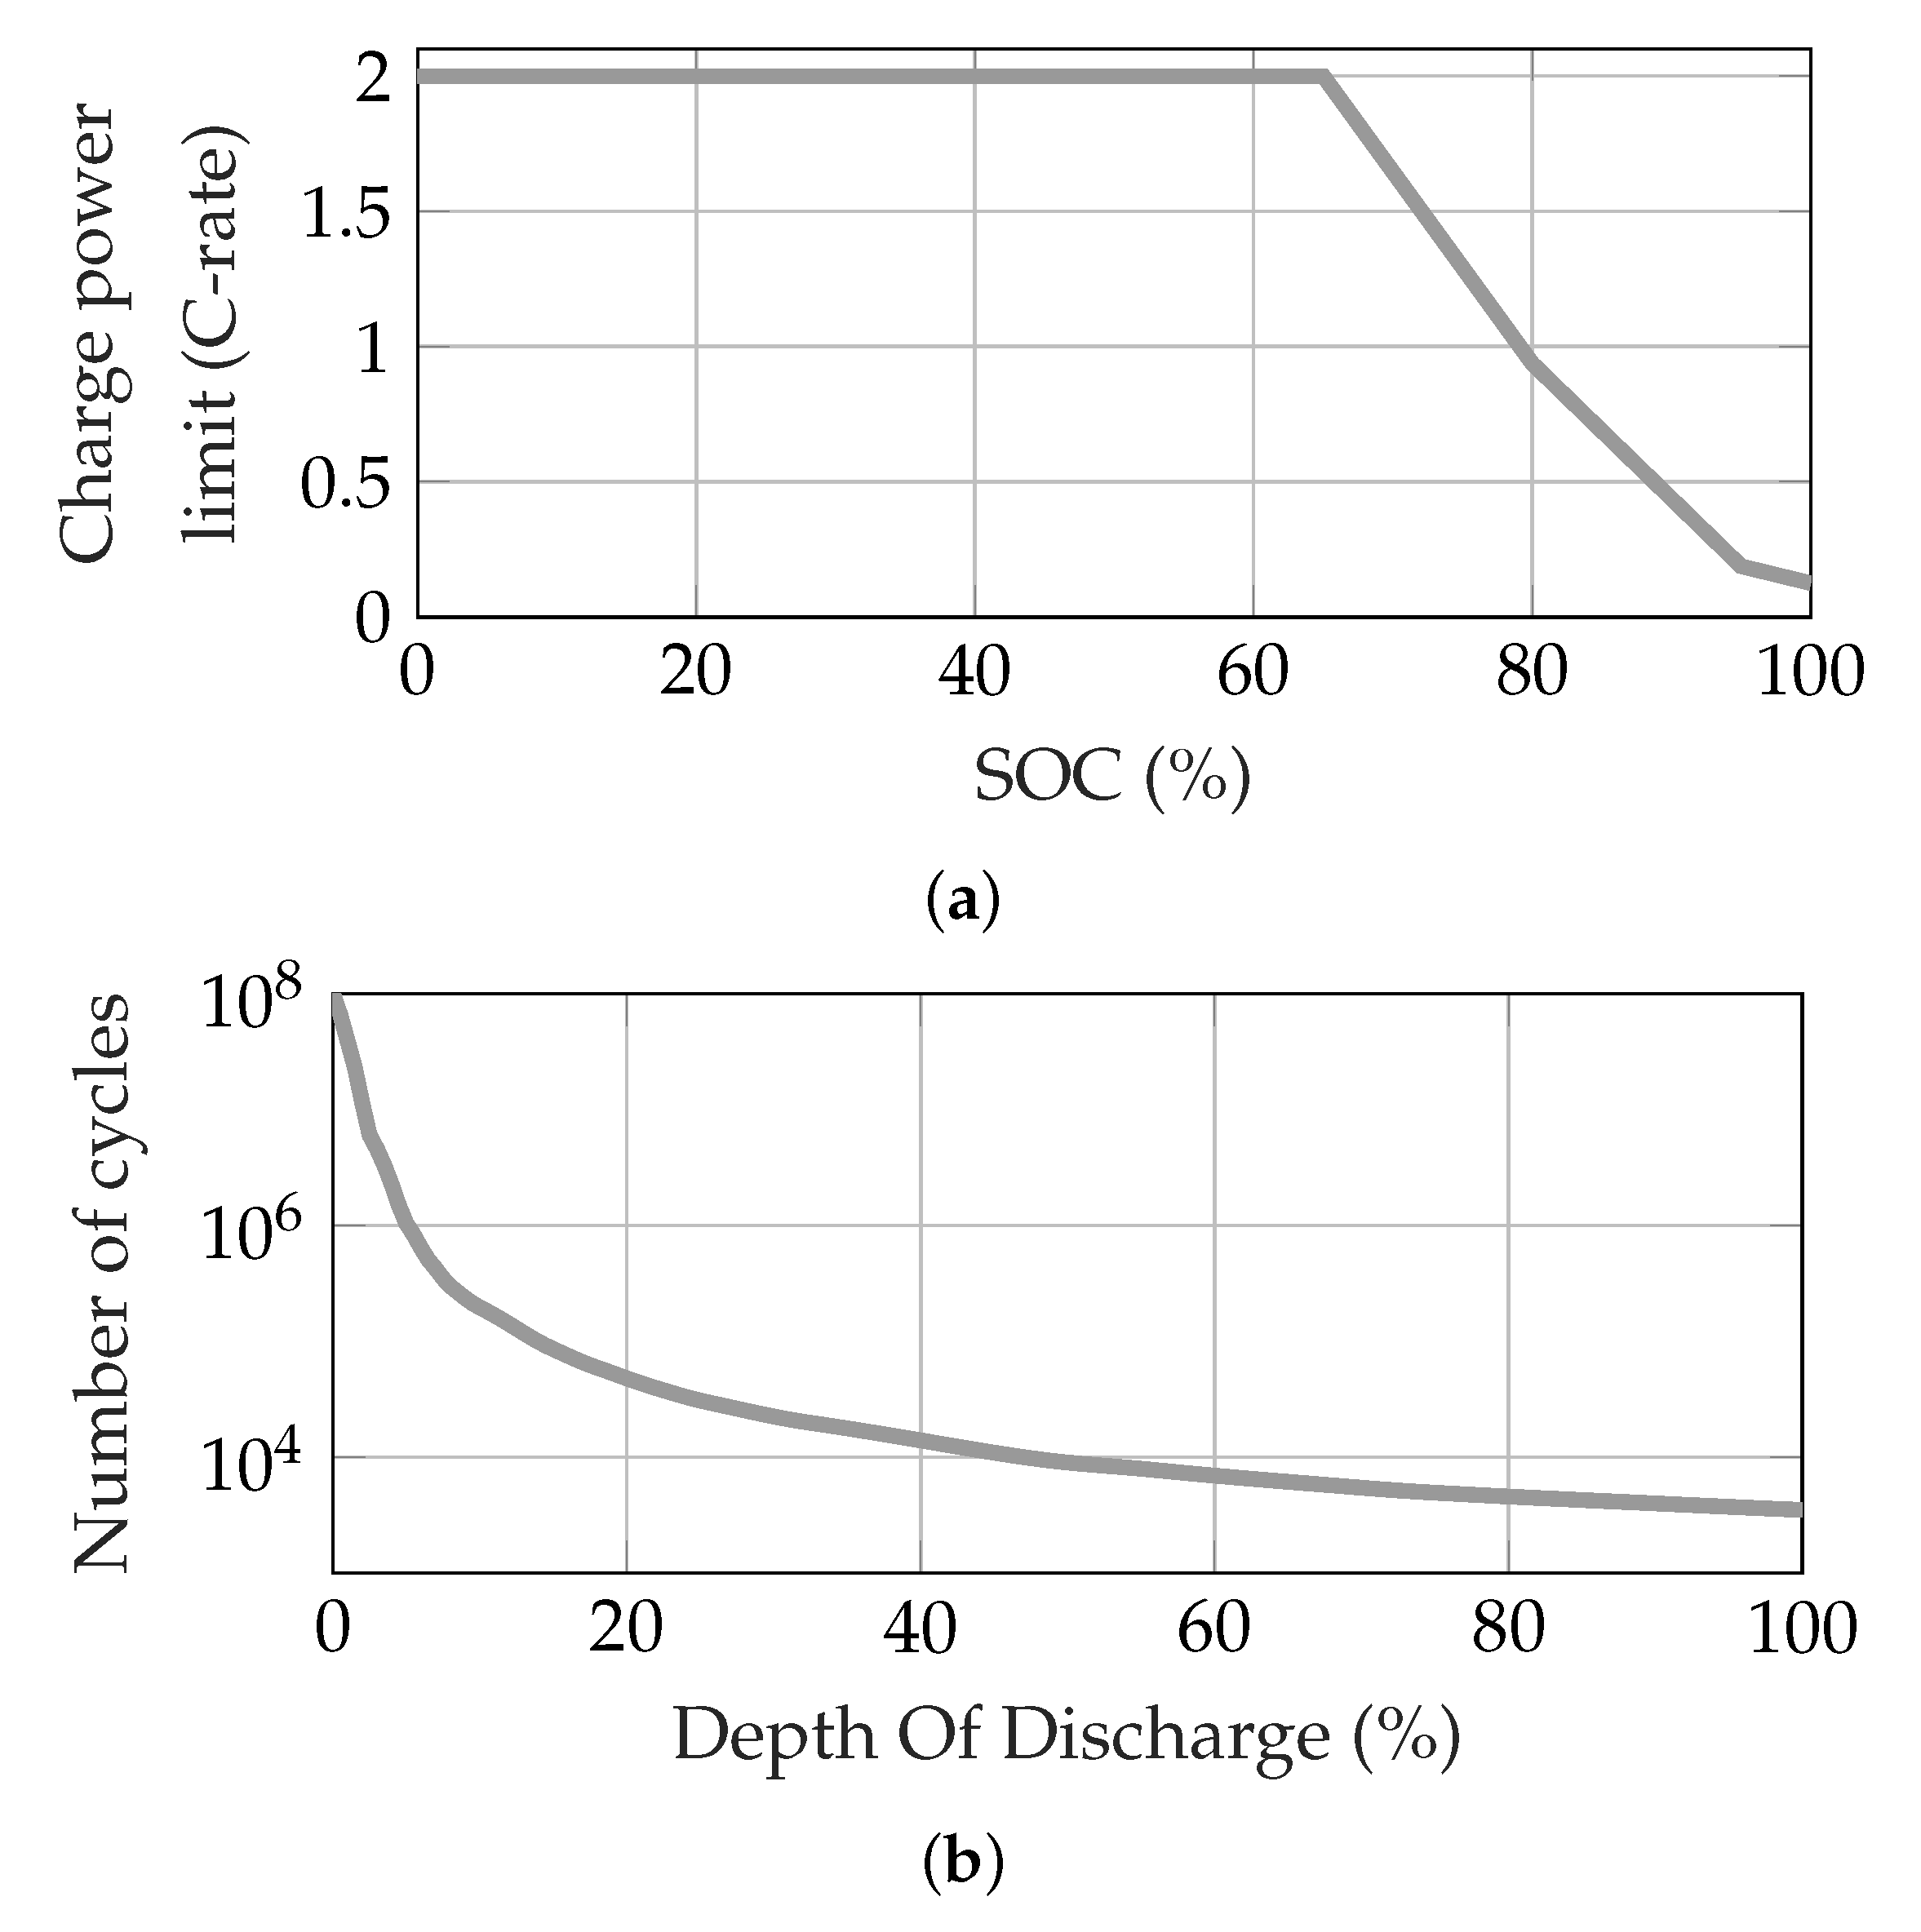
Figure 9. It can be seen that most losses are generated at high charging power combined with high levels of SOC. In order to reduce the losses, the charging power was limited as a function of SOC, as shown in
Figure 10a.
The ageing of the battery was evaluated after each drive cycle simulation in order to assess how much of the lifetime of the battery was consumed. The simulation produced a time series of the SOC which was then analysed by a rainflow algorithm [
37] in order to count the number of cycles at a specific depth of discharge (DoD) [
38]. Cycles below 0.5% were not deemed to age the battery.
Figure 10b shows the relation between the number of total cycles of the battery at a certain level of DoD. Evaluating this relation together with the output from the rainflow algorithm resulted in finding how large a fraction of the life of the battery was consumed in each drive cycle.
The authors do not make the claim that the battery model used was an as accurate as possible model of a battery of this sort. Additionally, there are many different aspects to the ageing of Li-ion batteries [
39,
40], not just the cycling based on usage which was used here. However, as the aim in this study was to find out whether the ETS or ERS characteristics affect battery ageing, it was deemed that valuable information could still be gathered by estimating the ageing this way.
4.5. Mechanical Dynamics and Driver Model
The vehicle was modelled as a one-dimensional moving object affected by rolling and air resistance forces, and force related to the slope of the road according to
and
where
(-) and
(-) are the coefficients of rolling and drag resistance, respectively;
(m
2) and
(kg) are the vehicle frontal area and mass, respectively;
(kg/m
3) and
g (m/s
2) are the air density and gravitational constant, respectively. The vehicle speed is denoted by
v (m/s), and the slope of the road surface is denoted by the angle
. Specific data are shown in
Table 2. The mass of the vehicle can be perceived as on the high side when considering a city bus; however, there is a reason for this. The mass for the vehicle represents a “worst case” scenario where the properties of the ETS are put through a tough evaluation. A realistic application could, for instance, be an articulated bus with one driven axle, which, in Sweden, is associated with a maximum allowed weight of 28 tonnes [
41].
The ETS was fed by a torque reference calculated by a driver modelled as a PI-controller, which in turn was fed by a pre-defined speed reference originating from the drive cycle time series.
4.6. Traction and Charging Torque Control
Since all the powertrains featured two traction drives, the referenced traction torque was prioritising one drive as long as it alone could supply the requested torque. The previous statement was at all times valid for the HSETS and LSETS, and the FIETS while not charging. Should the requested torque exceed the capability of one traction drive, the other drive is referenced with the exceeding amount. The reason for using this strategy is that it can be advantageous, if not optimal, from an energy consumption point of view rather than splitting the torque reference equally between the drives.
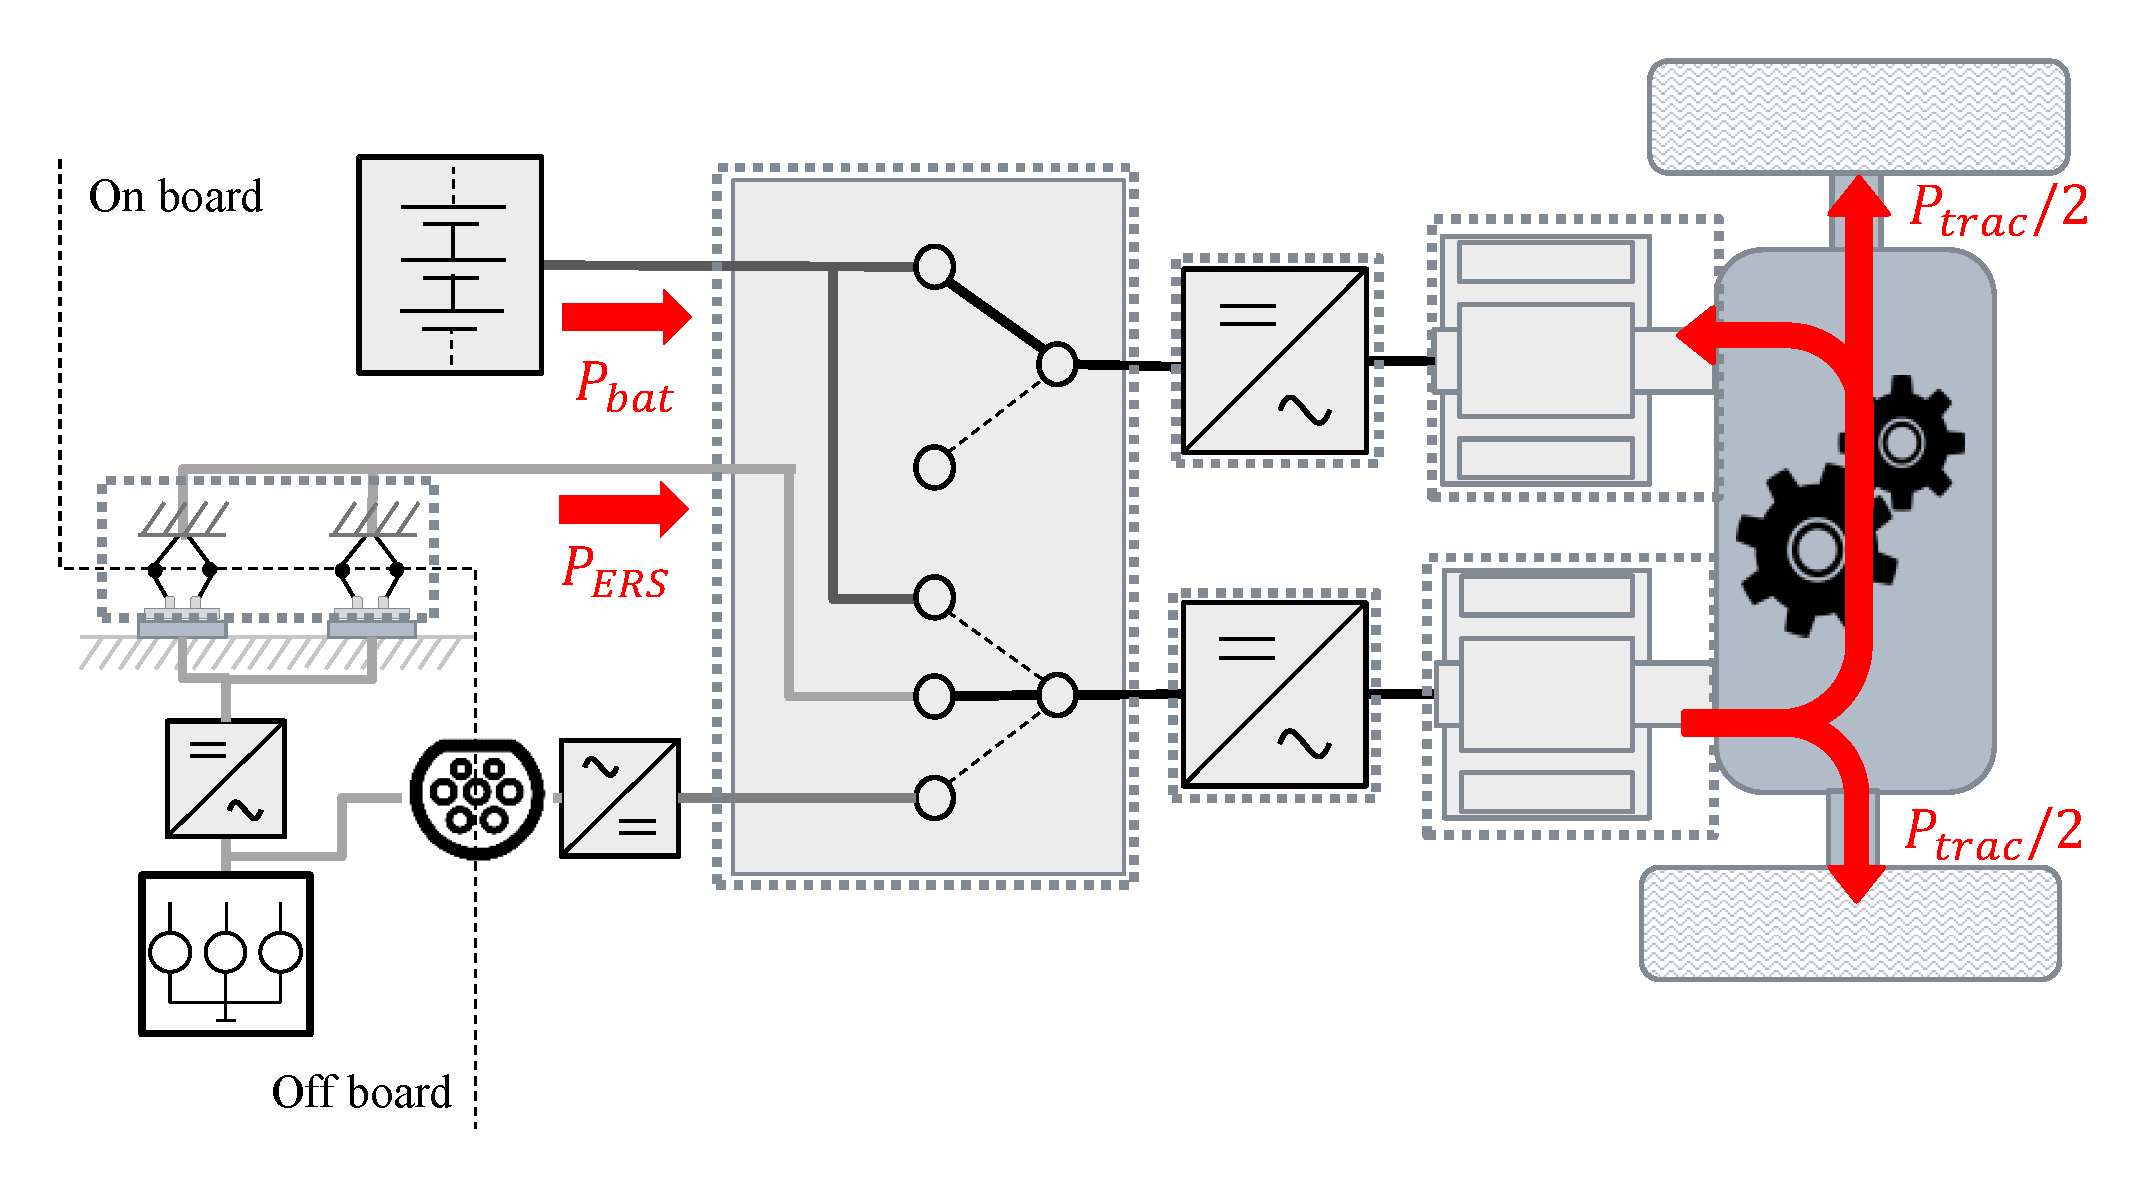
In our model, when charging, the FIETS circulates power through the traction drives, meaning that the control of these components is more complex than in the other two cases (HSETS and LSETS), where the traction drives only care for the traction power. When ERS is available and charging of the battery is required, one of the drives is connected to the ERS and the other to the battery. Each of the drives then referenced with
and
This is illustrated in
Figure 11, where the lower drive is connected to the ERS, providing power for both traction and charging, and where the upper drive is connected to the battery, providing the charging power to the battery. The nature of this charger topology implies that charging of the battery is not possible if the required traction power exceeds the rated power of one drive, since traction is at all times prioritised over charging. Furthermore, the charging power is also limited with the speed of the vehicle, since the rated power of the drives is reached at base speed (approximately 4000 rpm), which represents a certain speed of the vehicle (depending on gear), below which speed the available charging power will be lower. However, charging at rated power whilst the vehicle is at a standstill is possible if the mechanical transmission features a neutral gear.
The ETSs comprising a switch box, the FIETS and LSETS, were evaluated with two different control strategies with regard to their ability to regenerate braking power.
4.6.1. Minimum Switching, MnSW
When connected to an ERS, the FIETS has only one traction drive connected to the traction battery and the LSETS has none (above a certain minimum speed; see
Section 3.3. This limits the ability of these two powertrains to regenerate power while connected to an ERS, to the rated power of one machine for the FIETS and to no regeneration at all for LSETS. This will negatively affect the energy consumption. In this paper, this control method is denoted as “dashed lines and lightg”, MnSW.
4.6.2. Maximum Regen, MxRE
An alternative is to, when connected to an ERS and when applying a negative wheel torque, change the switch states of the switch box such that both traction drives are connected to the traction battery until positive wheel torque is again required. This will maximise the regenerative power capability at the expense of higher number of switching events, and consequently a shortened switch box lifetime. In this paper, this control method is denoted “maximum regen”, MxRE.
4.7. ERS Modelling
The electric road was modelled as an external loss less power supply localised as equidistant sections along the drive cycle. The ERS was assumed to be able to supply 200 kW per pickup on the vehicle, meaning that large vehicles such as long haul trucks could make use of two pick ups and double the power. The ERS was modelled as a supply only, meaning no power could be fed back to the grid through the ERS.
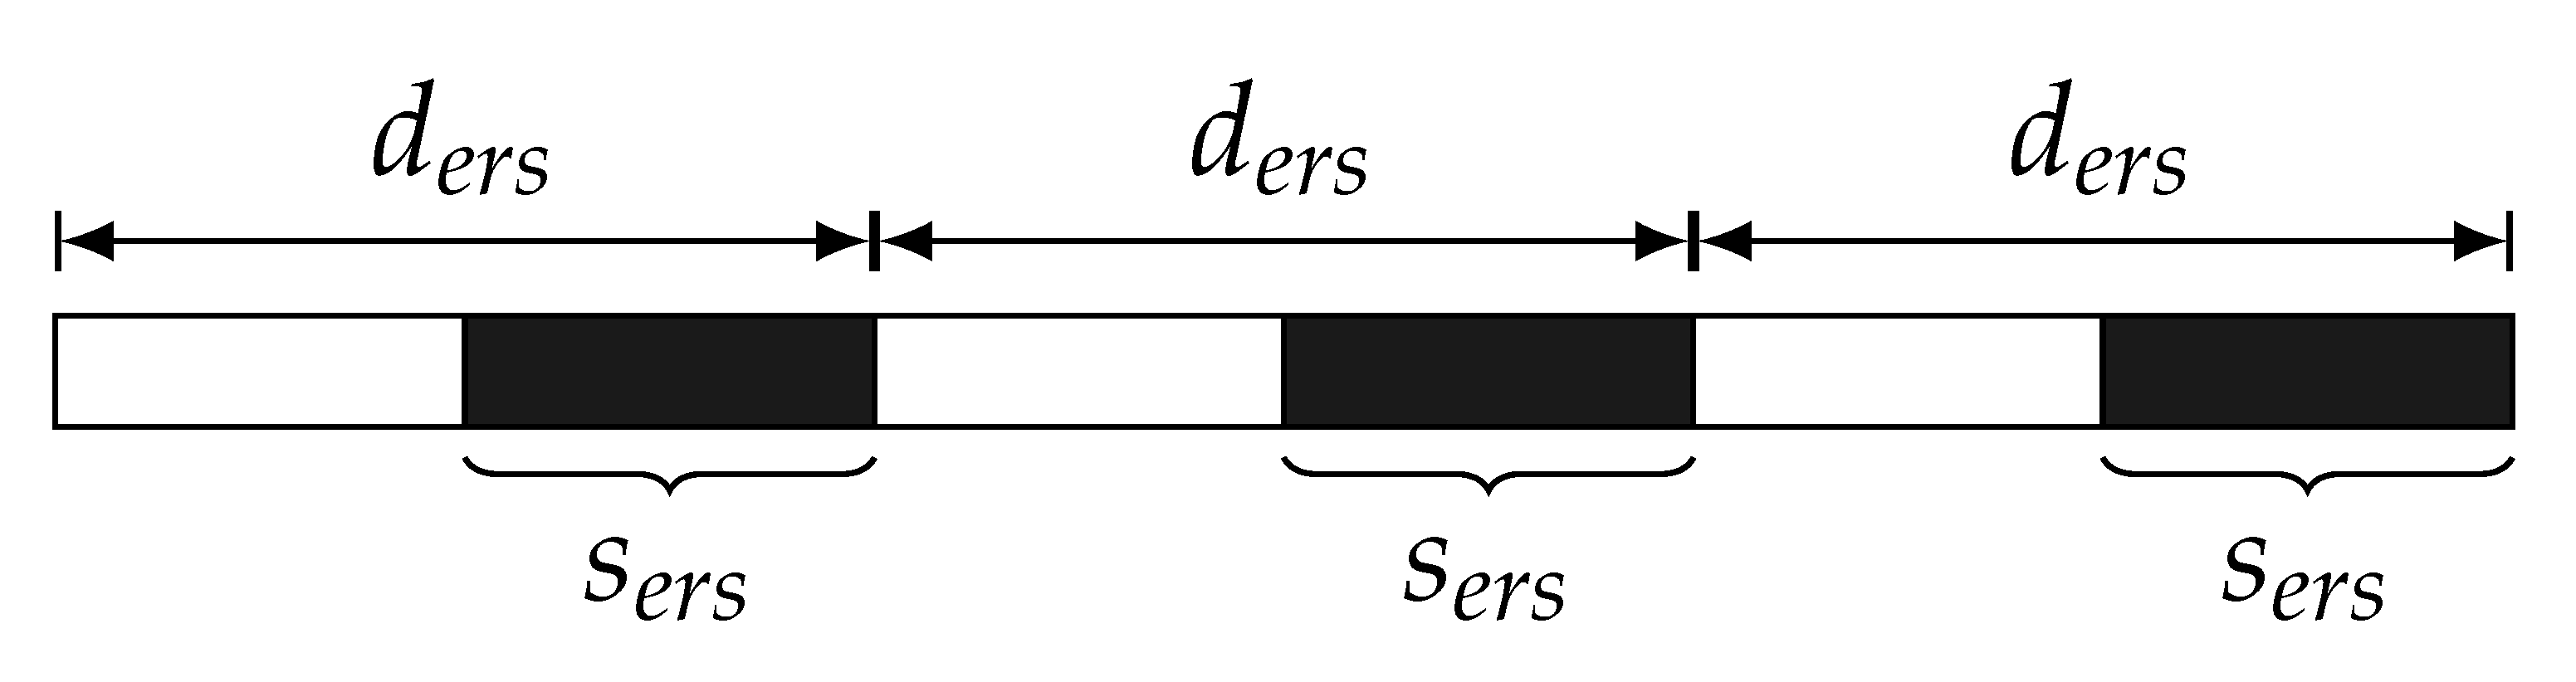
In order to evaluate the influence of the placing of the ERS, two parameters are of interest,
kers and
ders. The former describes the size of the relative part of the drive cycle that is covered with ERS, and the latter is the absolute distance between the starts of two consecutive sections of ERS. The two parameters,
sers and
ders, are illustrated in
Figure 12, where
sers illustrates the length of the road where ERS is present. The relation between the three is
5. Result and Discussion
In order to evaluate how the different ETSs perform with different ratings of traction and charging power, ERS parameters and battery capacities, a multidimensional matrix was defined according to
Table 3: every combination was simulated using the drive cycle, system components and control methods described in
Section 3 and
Section 4. The power rating range of the electric machine and DC/DC converter is displayed in the fashion of lowest:increment:highest.
In the following subsections, the energy consumption and battery ageing are shown for the city bus. In the figures presented, only the data points where the vehicle and its specifications are able to finish the drive cycle are shown; i.e., if the energy ran out before the end of drive cycle, that simulation was deemed not successful, and hence is not shown. Due to the fact that the vehicle most likely not would end its drive cycle at the same level of SOC as it began with, the energy consumption was compensated appropriately. If the SOC was lower at the end of the drive cycle than at the start (each simulation starts with SOC = 80%), it was assumed that the SOC was brought back to its start level by static charging. The losses generated in doing this were added to the calculation of the energy consumption presented below. The powertrains with separate chargers and the powertrain with the integrated charger were assumed to generate 5% and 15% losses, respectively, while charging statically [
18].
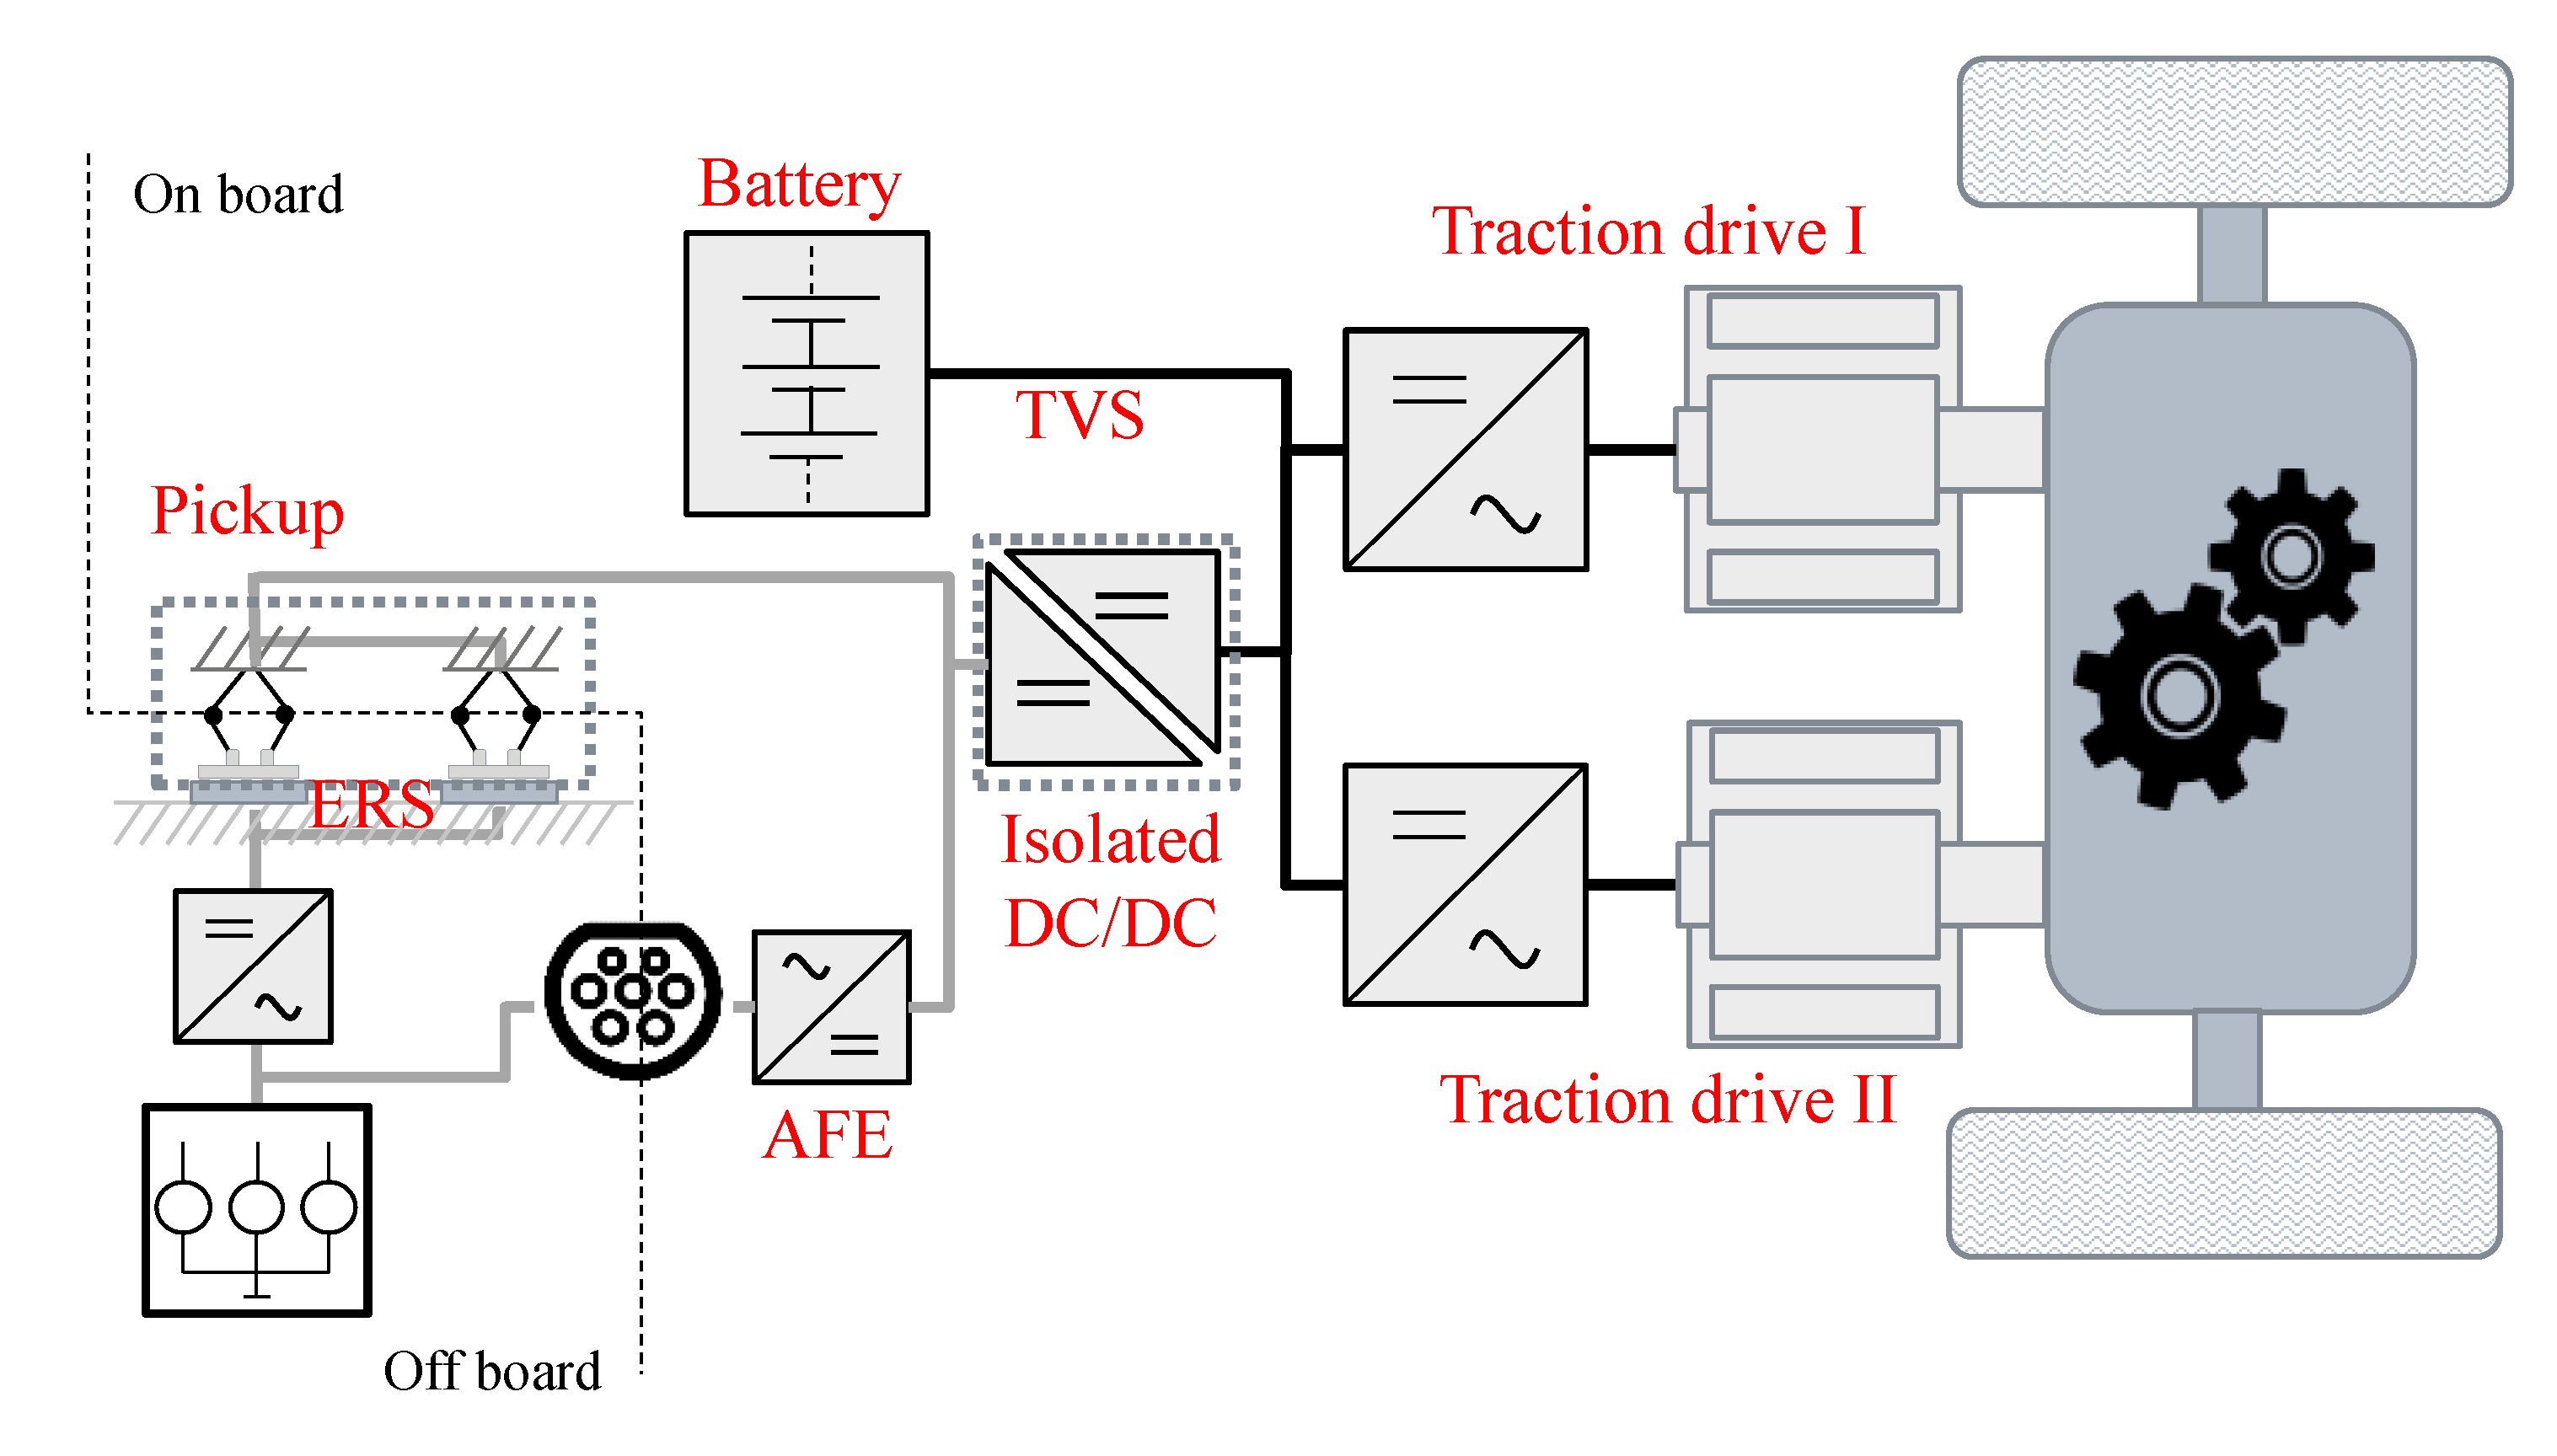
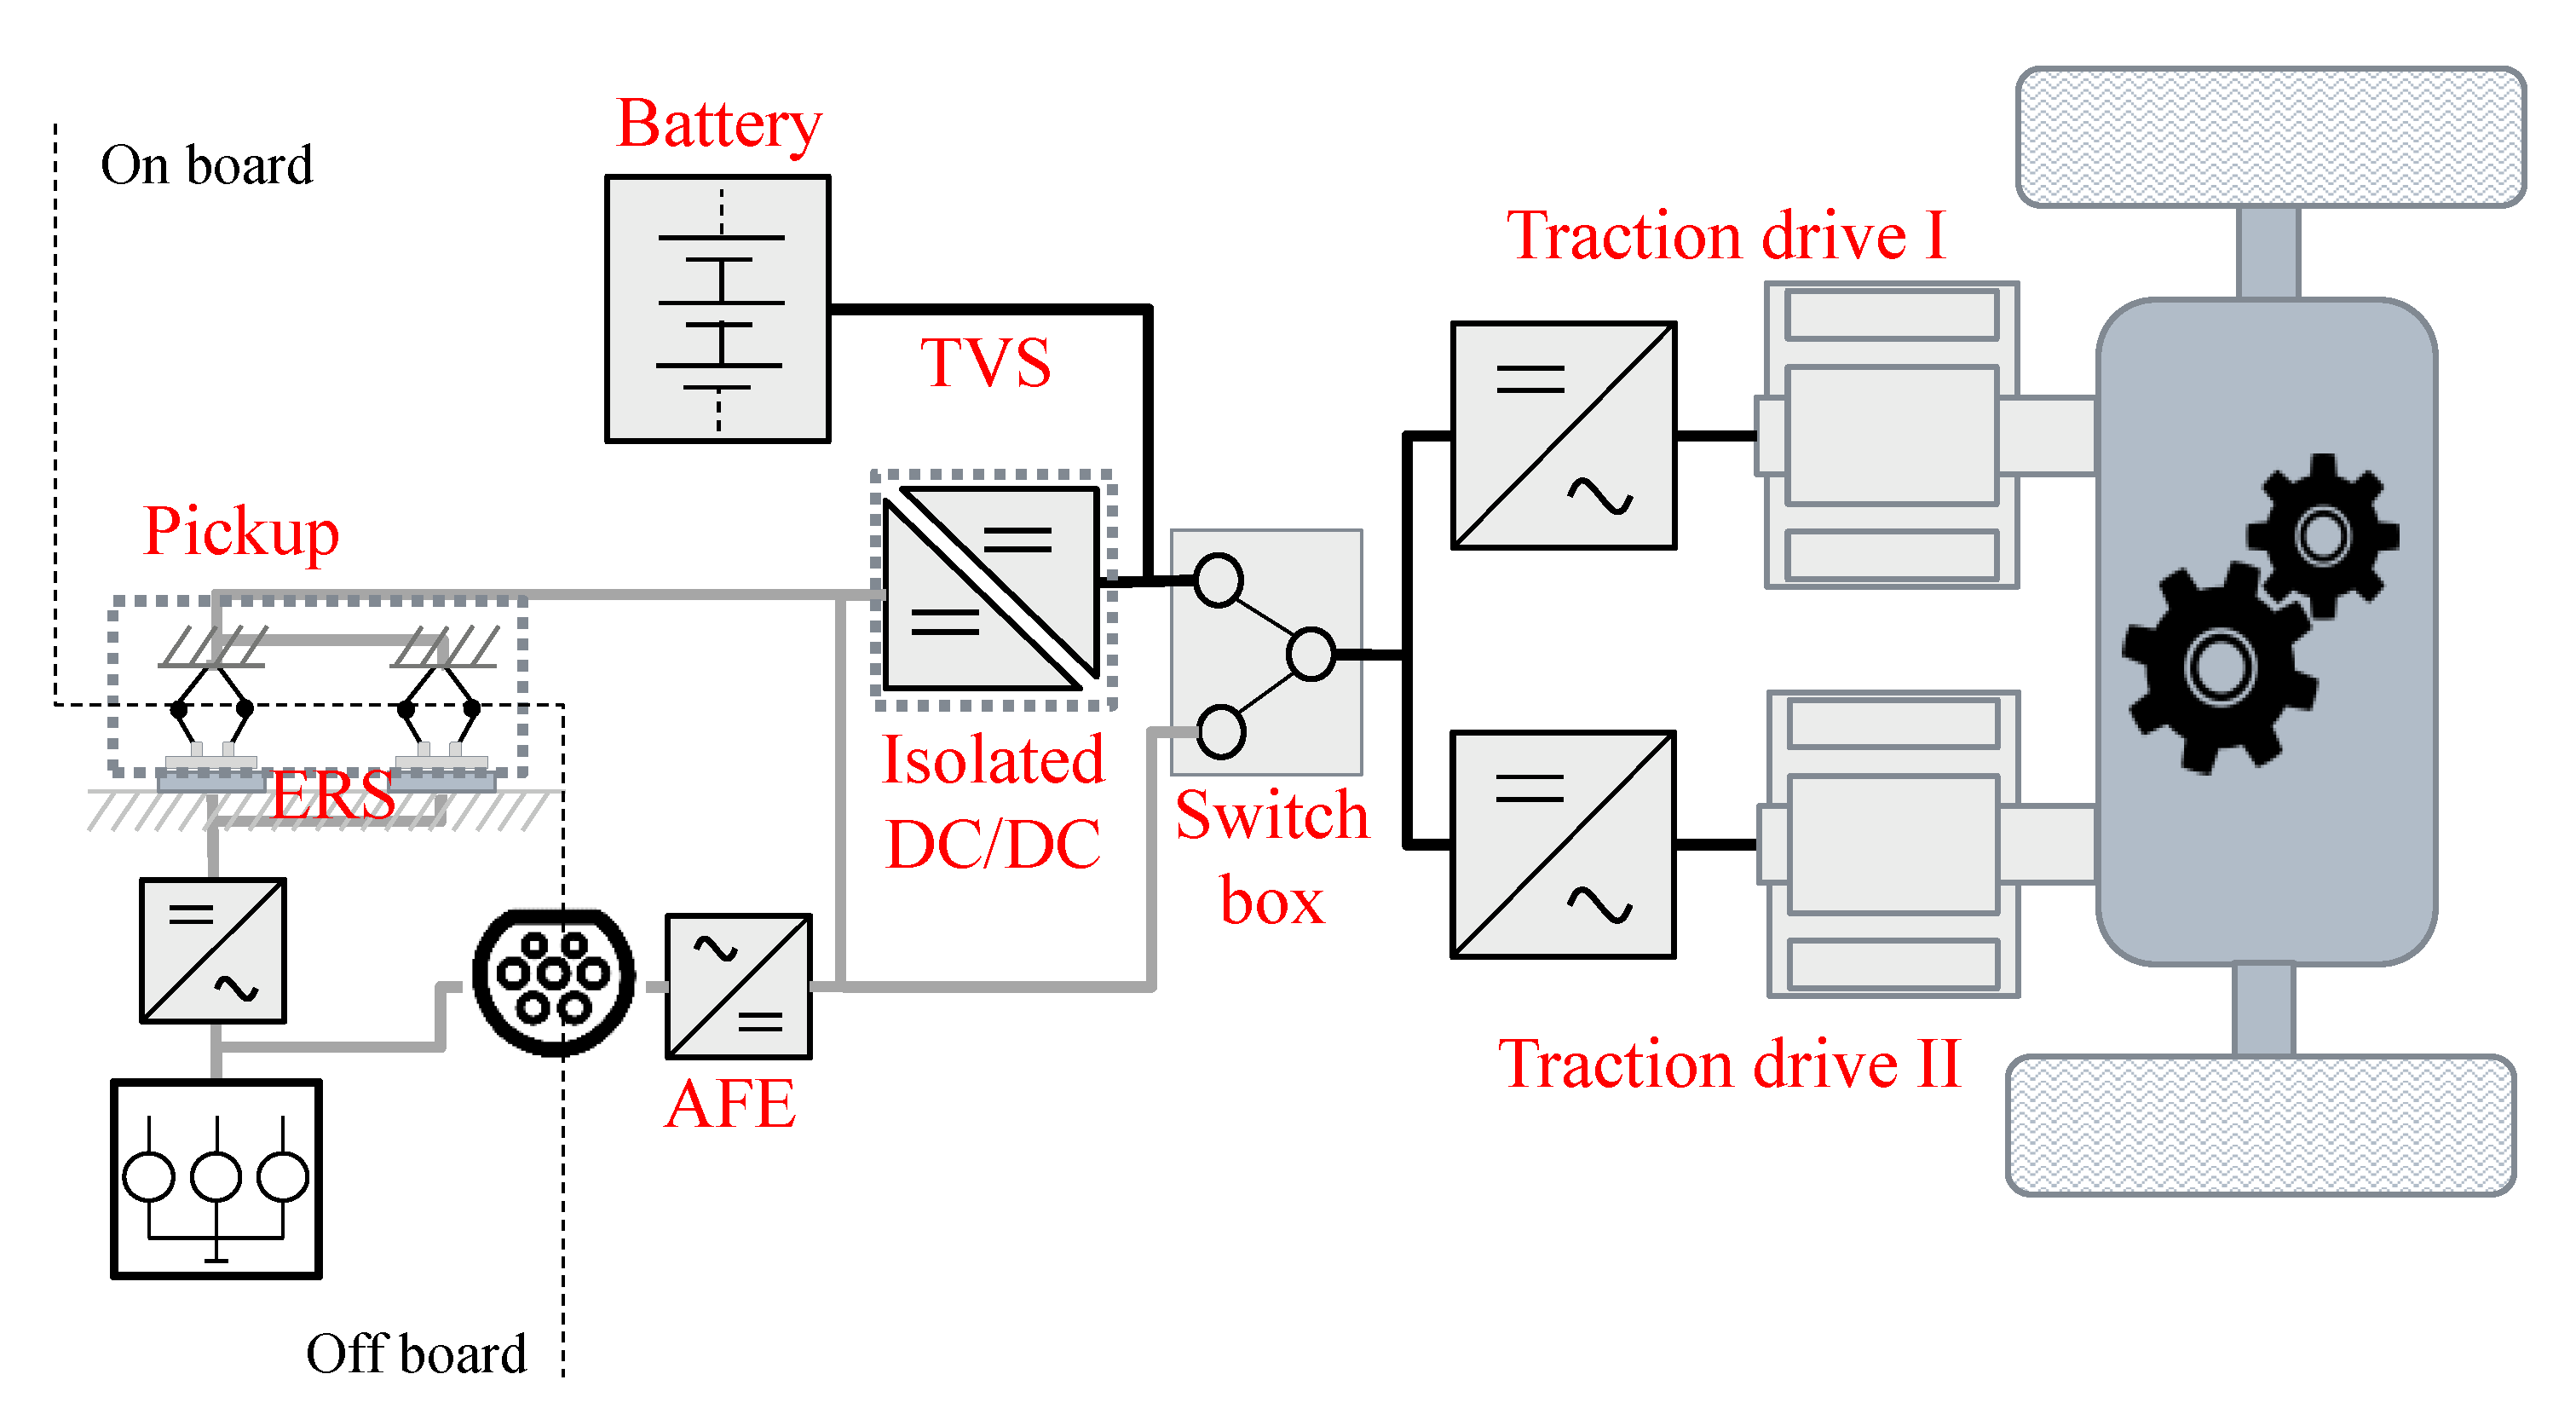
Consistently, in the following figures, the solid lines and dark grey denotes the FIETS (
Figure 2); the dotted lines and light grey, the HSETS (
Figure 3); and the dashed lines and light grey, the LSETS (
Figure 4).
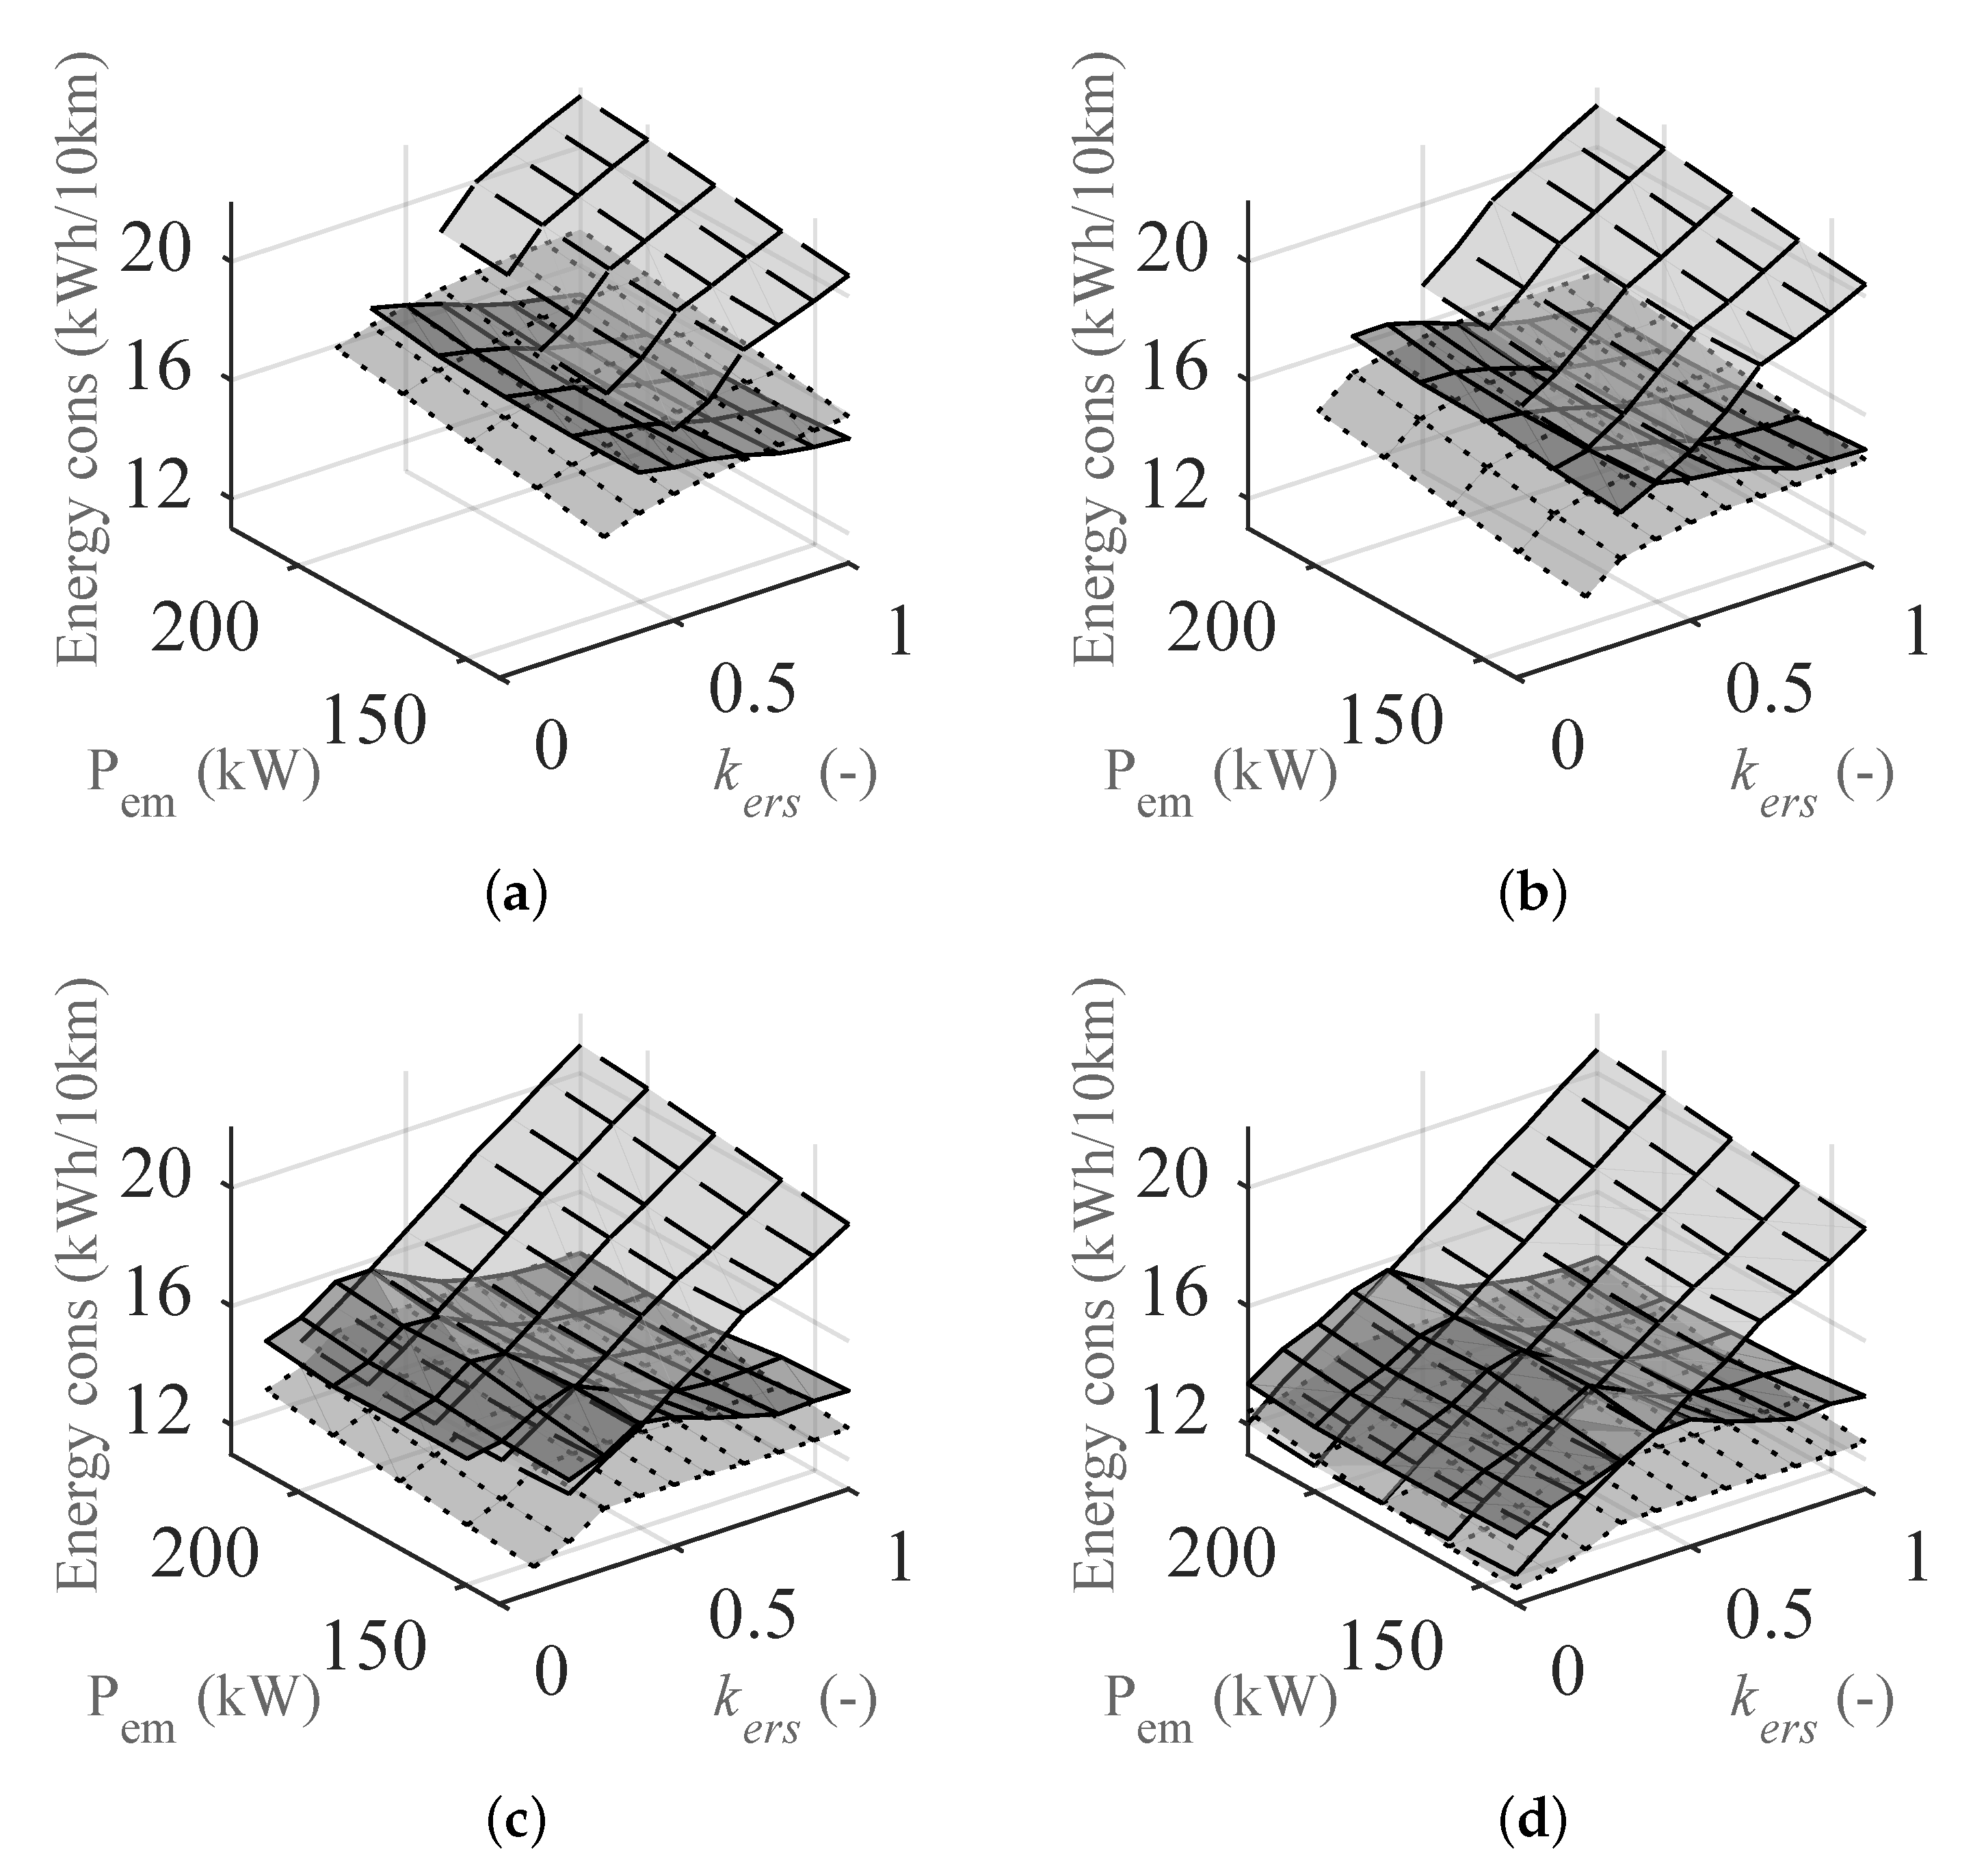
Figure 13 shows the energy consumption of a city bus along the “City bus route 85” at different levels of battery capacity,
Figure 13a–d, and with different ETSs. The conventional control strategy does not make use of all possible regeneration power. The rated powers of the DC/DC converters were set to 140 kW (HSETS) and 40 kW (LSETS), respectively. It was found that the parameter
ders did not significantly influence energy consumption, which is why only the result with
ders = 1 km is shown. It can be seen that the FIETS and the HSETS benefit the most from a larger battery; the energy consumption decreased as the battery capacity increased. This is due to the fact that, (1) a larger capacity battery has lower losses than a lower capacity one; and (2) a smaller capacity battery is cycled more deeply, emphasising its higher losses; and (3) regenerative braking is limited with a smaller capacity battery due to a lower power limit with the assumed C-rate (
; see
Figure 10a).
The LSETS, dashed lines and light grey surface, behaves in the opposite way, with increasing kers compared to the other two surfaces. As kers increased, the energy consumption increased. This was due to the assumption that no electric energy can be regenerated to the ERS, meaning in turn that—since this charger always connected to the ERS if it was present—it could not make use of any braking energy, as all was wasted in the friction brakes. Regarding the other two ETSs, at least one machine was always connected to the battery, thereby enabling the regeneration of braking power.
Generally, the HSETS powertrain showed the lowest energy consumption except at very high
kers, where the FIETS made use of its ability to operate one or two machines directly from the ERS. The high-power DC/DC converter did, however, carry a substantial cost of the powertrain [
42,
43].
The rated power of the traction drives does not affect the energy consumption to a large extent. The energy consumption of the ETSs with DC/DC converters generally showed behaviour of increasing with increasing rated power. This was due to the fact that, as the rated power increased, the operating points were moved in the loss map of the machine to areas with slightly lower efficiencies. For the FIETS, the same behaviour could not be observed, which was due to the fact that the machines are such an integral part of the charging procedure that the operating points differ substantially from the two other ETSs.
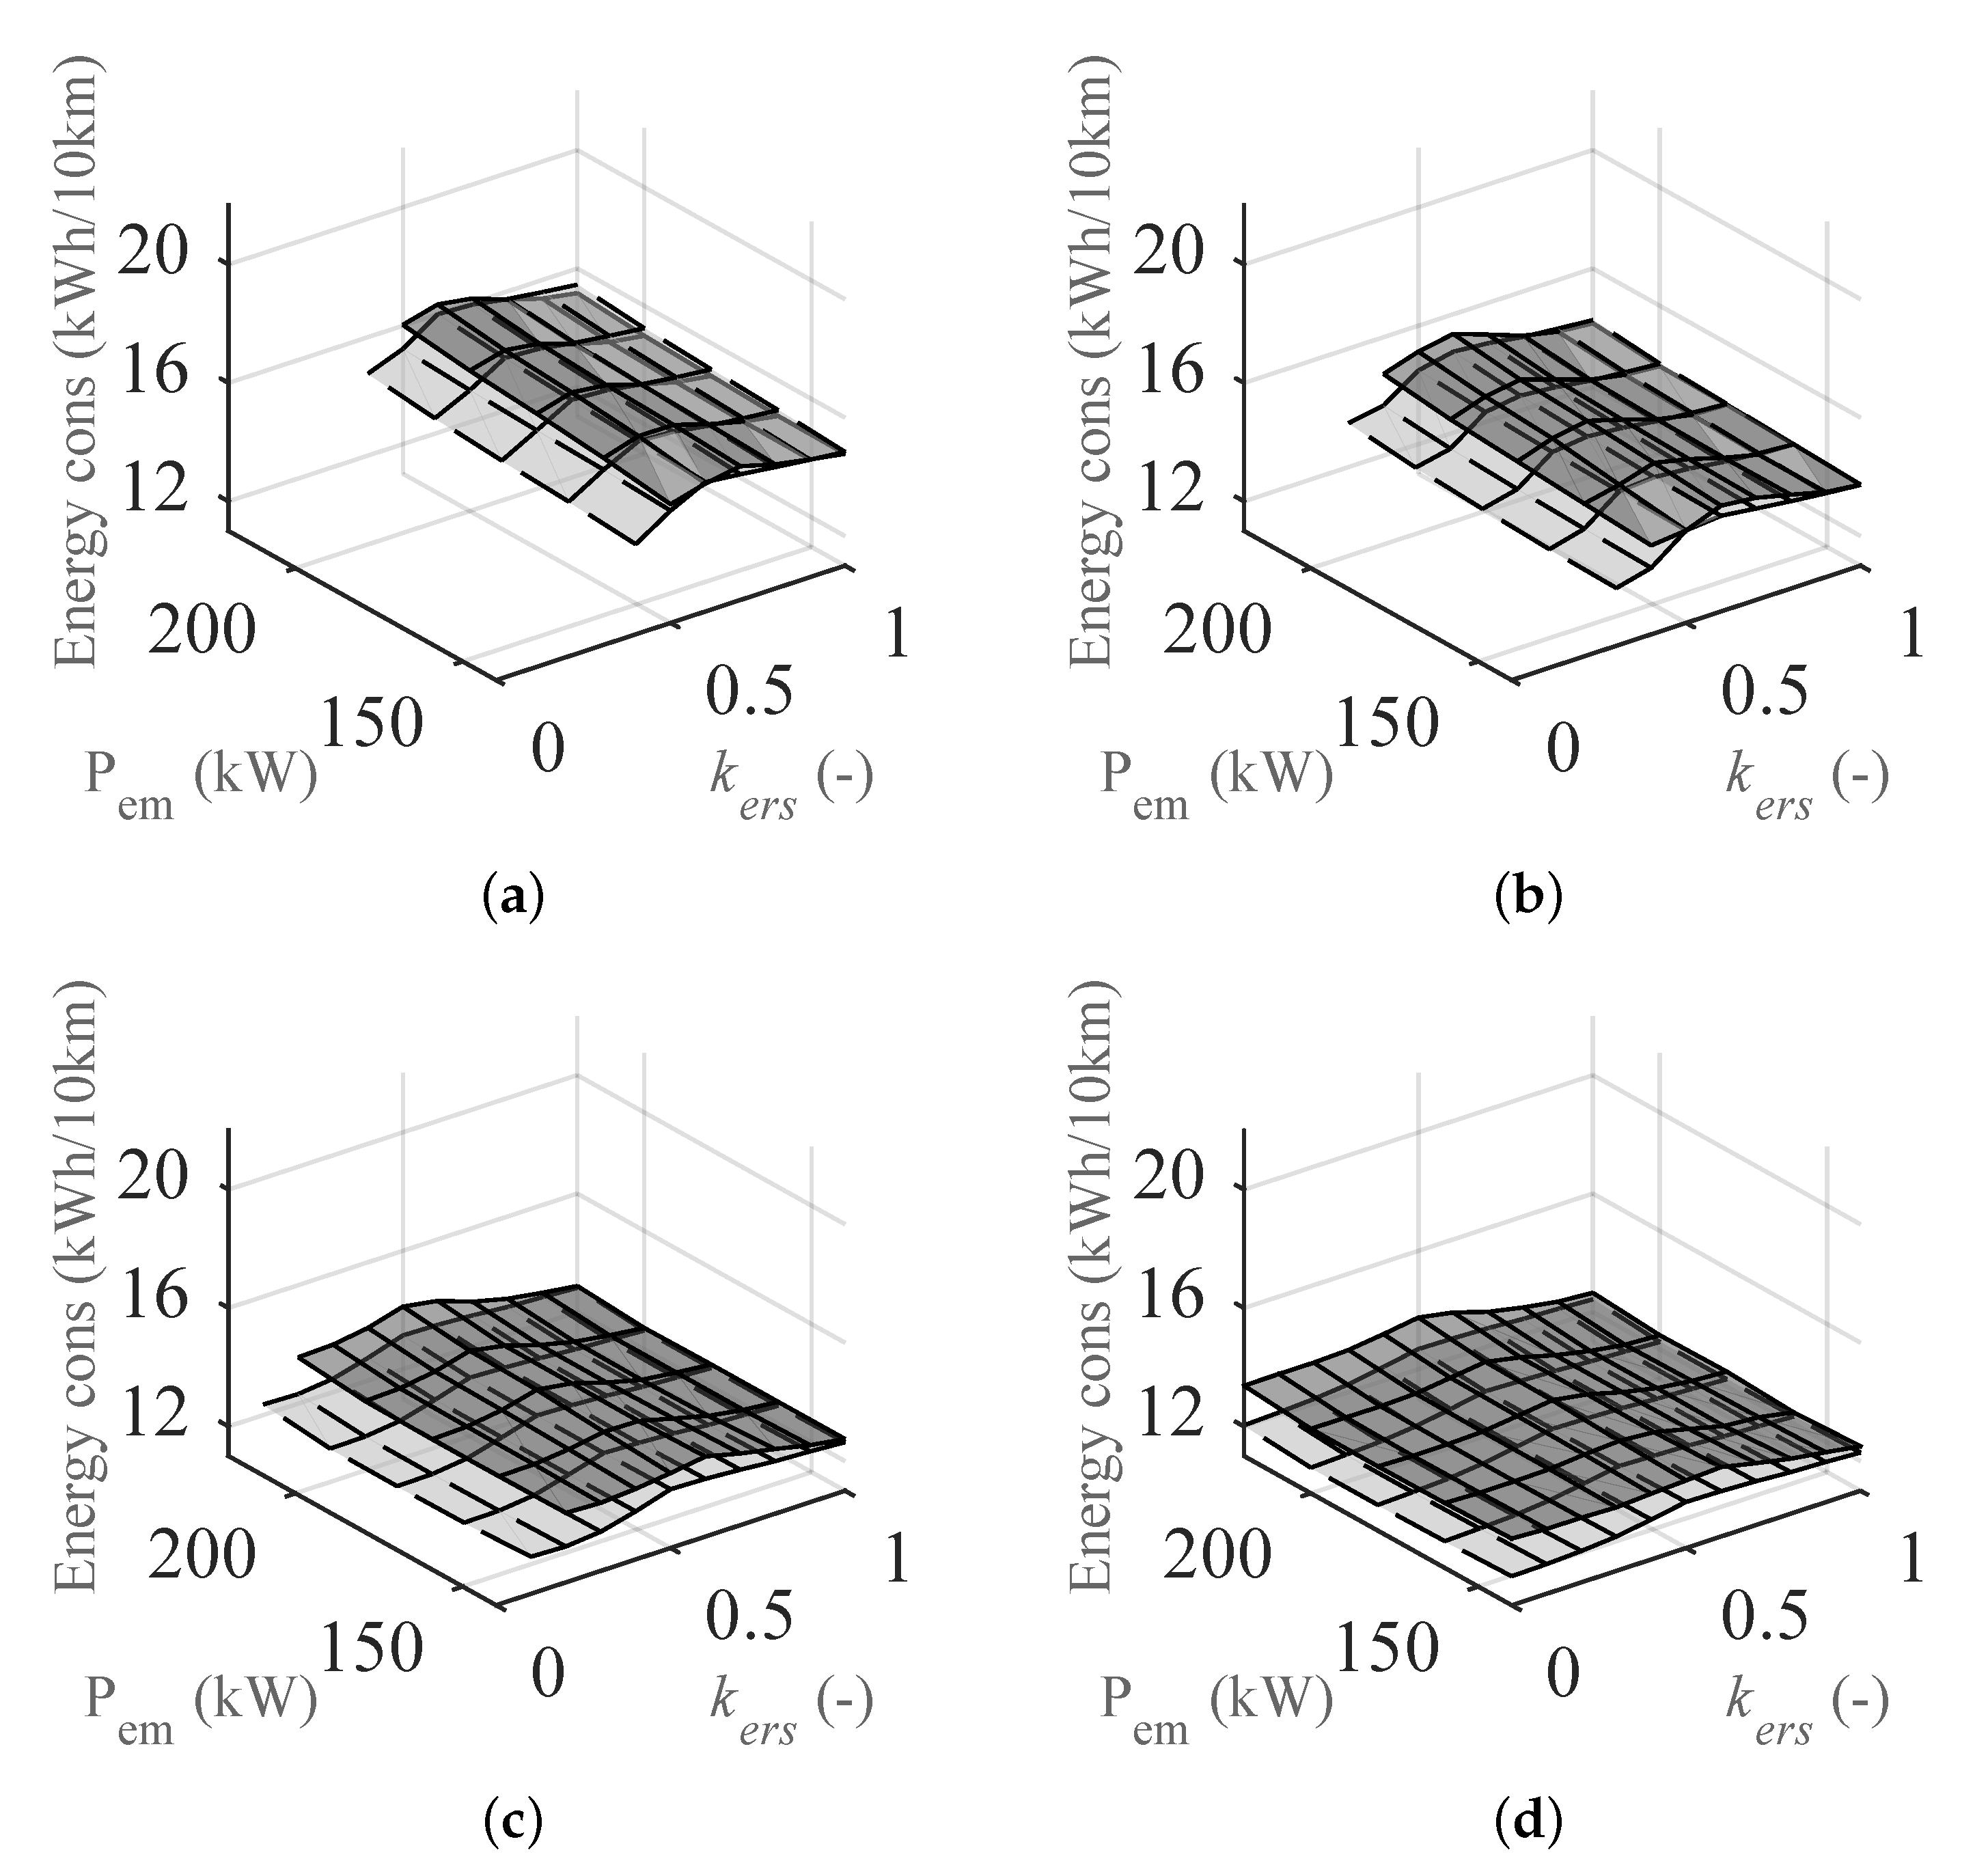
As another control strategy was also investigated, the MxRE control approach, where the ETSs comprising a switch box are allowed to make use of braking power to a larger extent, a comparison between these ETSs are shown in
Figure 14. Since the HSETS was not affected by this kind of potential loss of braking energy, it was left out of the figure. In general, with regard to the battery capacity’s and ERS coverage’s influences on energy consumption, the same behaviour was seen as in
Figure 13. It is, however, clearly shown that the reduction in energy consumption was substantial, especially in the LSETS. This does, however, imply more use of the switching devices inside the switch box. A result from the simulation is that the mean time between switching events in the LSETS decreased from approximately every 40–70 s to every 15–35 s, meaning two to three times more switching events, expected to decrease the lifetime of the device proportionally. The FIETS showed a larger difference in number of switching events between the two control strategies, since switching was allowed regardless of vehicle speed. The MnSW control approach demonstrated a switching event approximately every 85 s, whereas the MxRE control approach decreased this time to approximately every 11 to 30 s. It was also discovered that the control strategy does not affect the battery ageing to a significant extent.
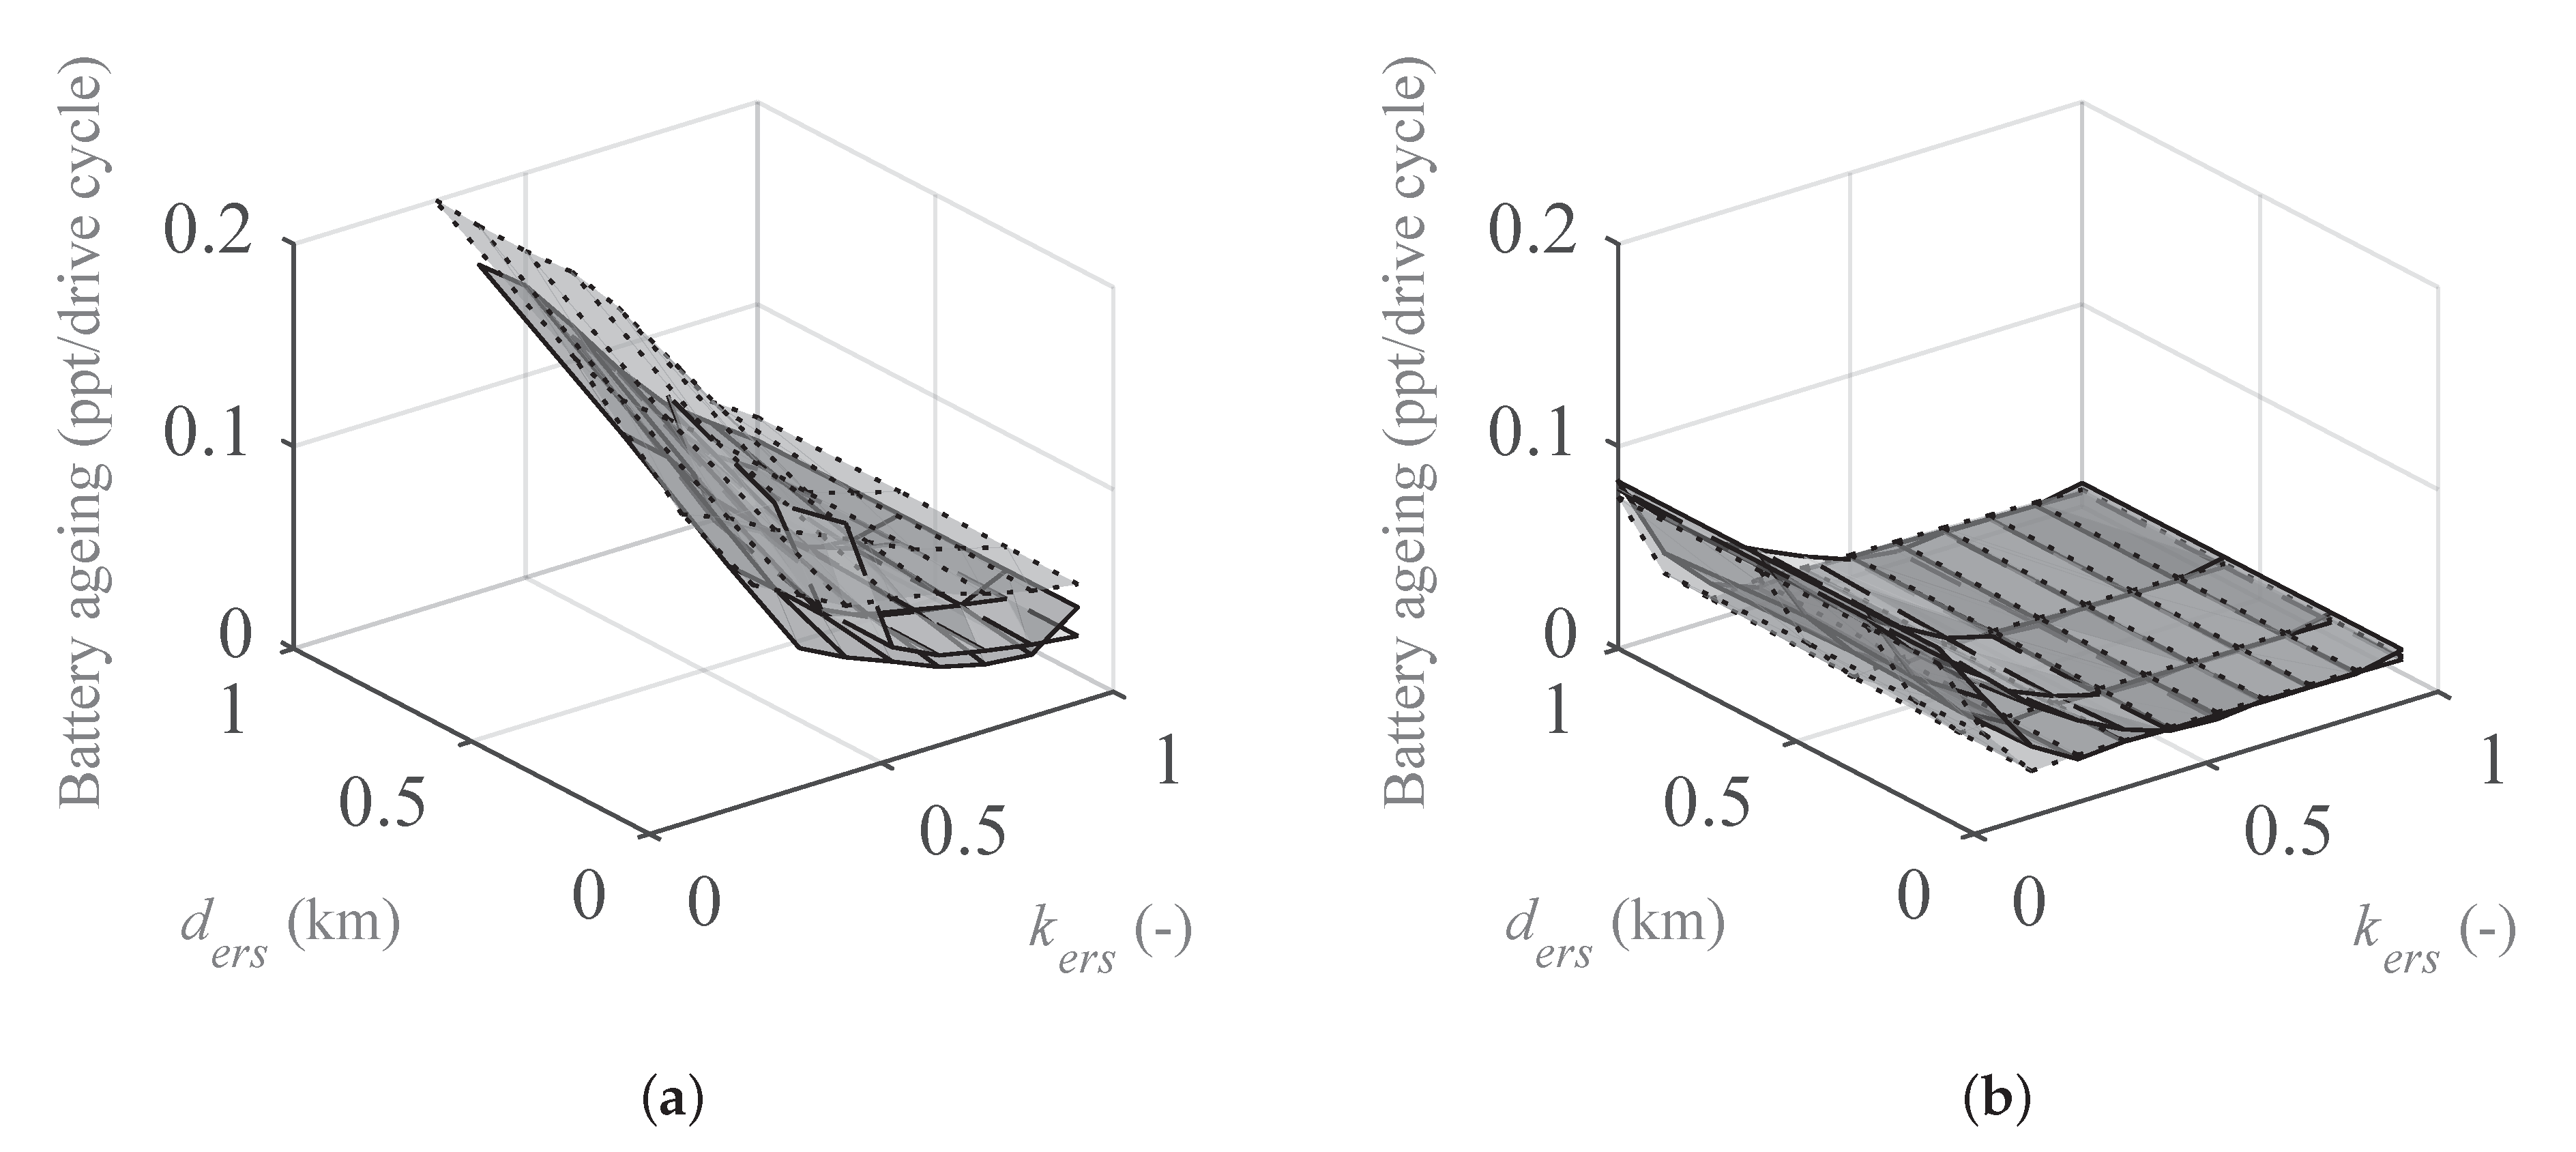
The ageing of the battery is shown in
Figure 15 at different levels of battery capacity as a function of the parameters
ders and
kers. As the battery capacity increased, a smaller fraction of life was consumed. This was expected, since with a given amount of energy cycled, the larger the battery, the smaller swing in state of charge. The results also show that for higher values of
kers a smaller fraction of battery life was used. This was also as expected, since as
kers increase, a lesser amount of energy is needed to cycle the battery. For the smaller battery capacities investigated,
Figure 15a, the longer the
ders, the higher the level of ageing. This was due to the longer distances between ERS sections, meaning there was more time for the battery to discharge to a lower level of SOC and then again recharge to a high level of SOC. The overall implications of the battery ageing result are that there is a cost trade-off with regard to initial cost versus battery ageing. Furthermore, it is clearly shown that the particular ETS topology does not have a significant influence on the battery ageing.
6. Conclusions
Three different energy transfer systems (ETSs) suited for transferring electric power to fully electric vehicles on an electric road system (ERS) were modelled and evaluated in a hypothetical city bus, simulated with a real drive cycle. The energy consumption and the battery ageing were the main outcomes of interest from this evaluation. The models of the electric machines, the inverters and the mechanical transmission were based on experimental results established from measurements on one of the powertrains in a laboratory environment [
18]. One ETS (FIETS) featured a novel design of integrated energy transfer capability (from ERS to battery and wheels), meaning that the equipment used for traction purposes also was used for energy transfer from the ERS. This can reduce the cost and complexity of the ETS. The two other ETSs—LSETS and HSETS—each featured a DC/DC converter, the former an isolated, low-power DC/DC one only used at lower speeds (with no galvanic isolation interface at higher speeds), and the latter an isolated higher-power DC/DC one that transfered all energy from the ERS. Besides the overall topology of the ETS, the ratings of the ingoing components, such as rated power levels of the traction machines and the DC/DC converters, and the battery capacity, were changed in order to investigate their effects on the energy consumption and battery ageing. Furthermore, two different control strategies were evaluated in order to investigate how braking energy can be recovered as much as possible, considering the wear of the switches that reconfigure the ETS of the FIETS and LSETS in different operating conditions. In addition, characteristics of the ERS were also evaluated with regard to energy consumption and battery ageing of the vehicle, particularly how much of the travelled distance is covered by the ERS and how far apart the ERS sections are placed. The reason this study was not validated experimentally is that the technology is not yet in place, as several vehicles and a significant number of ERSs would be required.
It was shown that the battery ageing is not, to a large extent, affected by the powertrain/charger topology and drive cycle, but rather more by the layout of the ERS, such that the smaller the battery capacity, the shorter the ders should be; 1–2 km is a good recommendation. The energy consumption was, however, shown to be affected by the ETS topology and control strategy. The LSETS is especially affected by the control strategy, since it was discovered that enabling the vehicle to regenerate braking power even though the ERS is present decreases the energy consumption significantly. This does, however, lead to a greater usage of the switching devices in the switch box which, in turn, is expected to affect its lifetime. Similar behaviour could be observed in the FIETS, through less pronounced than with the LSETS. One can, though, conclude that it might very well be worthwhile to choose, or design, switching devices that can cope with a great deal of usage in order to reduce the energy consumption.
Research carried out to establish whether a different approach to ERS layout should be used will be published in a subsequent paper. The sections shall be placed primarily where traction power is needed, and this can positively affect the energy consumption and/or battery degradation.


