1. Introduction
The emergence of electric vehicles (EV) is inevitable. EVs in various forms have been intensively introduced in some countries. However, the adoption of EV is still very low compared to the internal combustion engine (ICE) vehicles [
1,
2]. In countries that have introduced EV, such as China, the United States, France, Germany, Switzerland, and South Korea, EV sales in each country are still below 5% of total vehicle sales [
2,
3].
In Indonesia, battery electric vehicles (BEV) have been introduced by several well-known manufacturers. However, their adoption is still limited to a handful of people, considering the price of vehicles is still very high and not affordable for most car drivers. In addition, the availability of public infrastructure for battery charging stations is still very limited.
The Indonesian government has issued the government regulation No. 55/2019 to accelerate the development of the electric vehicle business ecosystem [
4]. This ecosystem will include the infrastructure for charging stations, nickel raw material providers, battery manufacturers, components makers, and EV assemblers/manufacturers. Several foreign investors have expressed their interest in becoming an important player in the electric vehicle business ecosystem in Indonesia.
The seriousness of the Government of the Republic of Indonesia and the interest of foreign investors to develop the electric vehicle industry cannot be separated from the large car market in Indonesia. In Indonesia, four-wheeled vehicles are still a product of people’s dreams. Previous studies show that cars not only function as a means of transportation to facilitate one’s mobility, but have become a tool to fulfill emotional needs such as self-expression [
5,
6,
7,
8,
9].
As an emerging market, Indonesia offers an attractive automotive market. In the last ten years, there has been an increase in vehicle sales with a CAGR of 3.03% from 764,710 units in 2010 to 1,030,486 units in 2019 [
10]. The global economic downturn did have an impact on stagnant national economic growth and slowing growth in car sales. The COVID-19 pandemic has further exacerbated the level of car sales in the Indonesian market. According to the Association of Indonesia Automotive Industry/Gaikindo [
11], there was a significant decrease in sales of 48.37% from 1,030,486 units in 2019 to 532,027 units in 2020. However, large manufacturers continue to offer their new products to increase their market share. In the midst of the current sluggish demand, several manufacturers have introduced electric vehicles in Indonesia.
Toyota was the first to introduce electric vehicles in the Indonesian market through hybrid vehicles. Only recently have other manufacturers, such as Nissan, Hyundai, BMW, and Tesla, begun to introduce their battery electric cars. However, the sales of electric cars are still negligible compared to the total vehicle sales. It is understandable, given the vehicle market being dominated by cars priced at less than 300 million rupiah (USD 20,833), that the presence of electric cars starting from the cheapest to close to 650 million Indonesian rupiahs (approximately USD 45,138) will be almost impossible to own for the majority of car users in Indonesia.
The slow diffusion of electric vehicles also occurs in countries that have already introduced electric cars. In China, for example, in 2016 with sales of 510,000 units, EV penetration was still very small compared to total sales of 23 million units [
12]. The high price of electric vehicles is indeed an obstacle for most ICE car owners to switch to electric cars. However, with policies that provide subsidies for the purchase of electric cars in several countries, electric cars are more affordable and adopted by the public more quickly [
13,
14,
15,
16].
People will adopt a new product after going through the consumption chain process [
17]. The intention to purchase a product is an important stage of the consumer consumption process. Starting from the awareness of the presence of a new product and the willingness to evaluate the product, the consumer then decides to purchase or not to purchase the new product. It is important for companies to know the main factors that influence the decision to purchase a product. By knowing these factors, product makers can prepare products that are acceptable to users.
There are two main factors that determine the success of a new product, namely motivational factors and barriers [
18]. Customers will be motivated by the benefits and product prices. The more benefits offered at affordable price, the product has a greater chance of success. The success of new product can happen if the product offers ease of use and high availability in the market. To motivate potential buyers in the automotive market, manufacturers and retailers offer various advantages of their products at affordable prices. Retailers also prepare financing packages to facilitate cost acquisition. Retailers also reduce all barriers in terms of convenience and affordability with added service and maintenance.
This typical practice has been carried out by every manufacturer and retailer. However, in reality, only vehicles from certain brands and models are accepted by the market. Faced with the large number and choice of vehicles in the midst of people’s restrained purchasing power, the car market has become a buyers’ market. The bargaining position of buyers is stronger than that of car manufacturers and retailers. Manufacturers and retailers must be able to offer vehicle ownership packages that have a higher benefit to cost of ownership ratio than competitors.
The dynamics of the automotive market demands an understanding from manufacturers and retailers about how consumers’ purchasing decisions are made [
19,
20]. Several papers explain the factors that underlie the decision to purchase a vehicle in the European market [
19,
20,
21,
22,
23,
24]. For the Asian market, several studies have also been conducted to study the factors that influence vehicle purchasing decisions [
9,
25,
26,
27]. Specifically for electric vehicles, previous studies have focused on exploring the factors that influence purchase intention [
16,
28,
29,
30,
31].
While numerous works have been done on the exploration of factors influencing purchase intention towards electric vehicle, there are still limited studies on why consumers prefer certain electric vehicles more than the others. In an effort to accelerate the adoption of EV, it is necessary to know consumers’ purchase intentions towards a certain electric vehicle that will be introduced to the market. Therefore, this paper intends to develop a decision model that can make an early prediction of consumers’ purchase intentions towards electric vehicles in Indonesia, particularly battery electric vehicles. This research is expected to help EV stakeholders in Indonesia to find the BEV product-market fit in order to accelerate the adoption of electric vehicles.
The paper is organized as follows.
Section 2 addresses previous works in the area of consumers’ intentions to purchase electric vehicles. In
Section 3, the methodology of developing a framework for predicting purchase intention is presented. The analytic network process (ANP) approach is used in this study.
Section 4 shows how the proposed decision model is used to predict consumers’ purchase intentions towards battery electric vehicles.
Section 5 presents discussions and practical implications. Finally,
Section 6 presents the conclusion and recommendations for further research.
2. Literature Review
Electric vehicles can be seen as an innovation that offers an increase in the ratio between benefits received by customers and costs incurred [
29,
32]. Among the various types of electric vehicles, battery electric vehicles (BEV) are the most environmentally friendly vehicles [
29]. In addition to environmental benefits, electric vehicles also offer economic advantages due to lower operational costs and purchase incentives [
33,
34].
Despite better benefits and economics of use offered by BEV, the acceptance of BEV in the market in many countries is still low [
35]. In Indonesia, electric vehicles have been introduced in the last 10 years in the form of hybrid electric vehicles by Toyota. However, the diffusion is still very slow. It seems that people are still not interested in purchasing electric vehicles.
There have been quite a number of previous studies investigating the consumers’ purchase intentions. One of the theoretical models that is widely adopted in research on purchase intention is the theory of planned behavior (TPB) [
36,
37], which explains that attitude, subjective norms, and perceived behavioral control are the main determinants of consumer purchase intention. In previous works on purchase intention for EV, attitudes are related to consumers’ positive or negative evaluations of purchasing EV. Perceived behavioral control explains the ability of consumers to purchase EV, and the subject norm is related to the perception of people who influence consumers who influence the decision to purchase EV [
38].
Based on TPB, Simsekoglu and Nayum [
30] used regression analysis to assess the role of perceived accident risk, perceived car attributes, subjective norm, and perceived behavioral control on purchase intention towards BEV. Their study showed that environmental-economic attributes, subjective norms, and perceived behavioral control are positively related to purchase intention.
Also based on the TPB, Ye et al. [
2] developed a framework of three psychological attributes (i.e., attitude, subjective norms, and perceived behavioral control) and four policy attributes (i.e., purchase subsidies, license plate control, preferential usage, and preferential driving). Using a fuzzy-set qualitative comparative analysis (fsQCA) approach, the empirical results in China showed that high purchase intention of EV involves at least one psychological attribute.
Realizing that EV adoption is still low in China, He et al. [
39] introduced a personality perception-intention framework to study EV adoption in society. Their empirical study showed that two types of personality attributes, namely personal innovativeness and environmental concerns, significantly affect EV purchase intention. Another study used a purchase intention model that considers demographic characteristics and attitude factors [
31]. The results showed that attitude factors including network externality, price acceptability, government subsidies, vehicle performance, environmental concerns, and demographic characteristics, such as gender, age, and marital status, have a strong impact on purchase intention.
The provision of a purchase subsidy is considered to be able to influence purchase intention. Dong et al. [
16] proposed an extended TPB with the norm activation model to explore whether cost factors affect purchase intention in the context of providing subsidies. The results showed that cost factors in the context of subsidies do not significantly affect the purchase intention of urban communities in China. Cruising power and the availability of charging facilities are more of a concern for them. In addition, subjective norms, feelings and emotions, personal norms, and perceived behavioral control also affect purchase intention.
Departing from the consumption value theory, Han et al. [
40] employed functional (monetary, performance, and convenience) and non-functional (emotional, social, and epistemic) values in explaining consumer purchase intentions towards EV. The results showed that perceived functional values have direct and indirect effects on purchase intention. Meanwhile, non-functional values have an indirect effect on purchase intention, which is mediated by attitude.
Numerous studies on EV purchase intention explain product factors and also individual or social factors that determine the occurrence of EV purchases [
41]. Sierzchula et al. [
42] stated that there are three sets of factors that influence EV intention: personal factors, product attributes, and context factors. Degirmenci and Breitner, 2017 [
29] investigated the role of environmental performance as compared to price value and the vehicles’ distance range in influencing consumers’ purchase intentions. The results showed that environmental performance is a stronger predictor of purchase intention. Car ownership is also carried out as an explanation of the user’s status. Studies conducted by Zhao and Zhao [
9] showed that pride in vehicles is positively correlated with vehicle use and very expensive vehicle price.
Other demographic segmentation, such as by age group, has also been the concern of several studies. The adolescent age group was investigated to find out the factors that influence them in choosing a car [
43]. There are three factors that influence purchasing decisions, namely safety, which includes features of fuel economy, airbags, electronic stability control, anti-brake system (ABS) system, and insurance price; sportiness, which includes engine power, speed, and extra highlights; and comfort, which includes Bluetooth/infotainment, leather seats, design, and air conditioning.
Many previous researches on EV purchase intention were more focused on exploring factors that influence people’s purchase intention towards EV. Although the theory of planned behavior (TPB) is widely used as a theoretical framework, it does not take into account the importance of BEV attributes in predicting purchase intention [
44,
45]. Also, people who are respondents do not know specifically or have direct experience using EVs. The study of Schmalfuß et al. [
46] showed that direct driving experience with EV has the potential to change the evaluation of BEV and psychological factors that influence purchase intention.
This research will not extend TPB with additional attributes to determine the factors influencing purchase intention towards EV. Since the Indonesian EV market is still in the infancy stage, consumers still have little information and experience about EV. Therefore, their attitudes, subjective norms, and perceived behavioral control towards EV are still not fully formed. It is thus evident that people with no previous experience in using EV will have difficulty in accurately expressing their purchase intention [
47]. Instead, this research will start with the framework of how the existing ICE vehicle owners make their purchasing decision.
Among the owners of ICE vehicles, their attitudes, subjective norms, and perceived behavioral control have been formed. Thus, together with the factors influencing purchase intentions towards EV from previous studies, the research purpose is then to develop a decision model that can predict consumers’ purchase intentions towards a battery electric vehicle being introduced to the market. This research is also expected to be able to explain the criteria that influence consumers’ purchase intentions towards BEV. This research is also expected to help electric vehicle makers select the right BEV for their target customers.
3. Methodology
The problem of projecting purchase intention is approached as a multi-criteria decision making (MCDM) problem. One of the widely used approaches to solving MCDM is the analytic hierarchy process (AHP). In ranking decision alternatives, the AHP uses a hierarchical decision structure consisting of at least three levels: The top level or level 1 contains the objective, followed by level 2 that contains the criteria, and the last level contains a set of alternatives [
48]. Based on the decision structure, the pairwise comparisons process is carried out where two objects or entities at one level are compared together with respect to another object at the upper level using a ratio scale, as shown in
Table 1 [
48].
With a hierarchical decision structure, there is a one-way relationship from elements at the top level to objects at the bottom level. But in practice, there are many cases where dependencies occur between elements at different levels. For cases like this, the analytic network process (ANP) is an option.
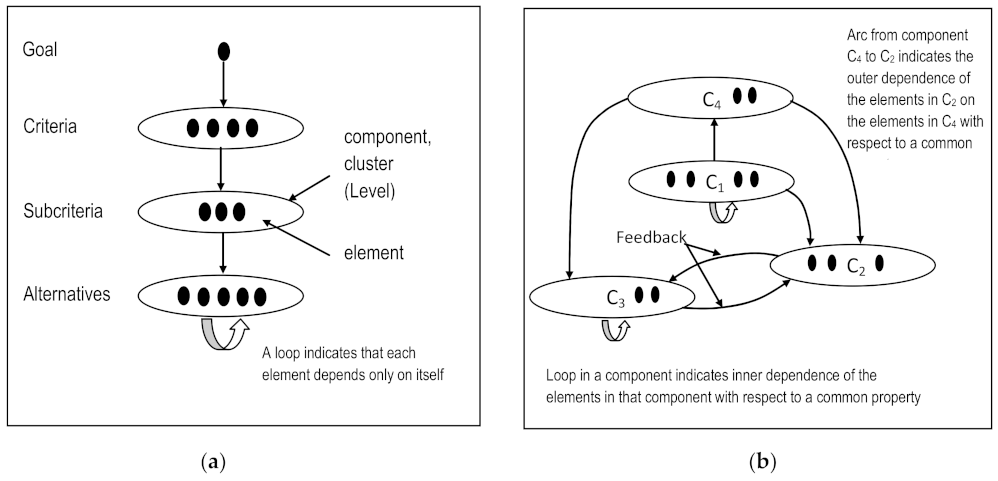
Figure 1 shows the hierarchical decision structure in AHP and networks in ANP [
48,
49]. In contrast to the hierarchical decision structure in the AHP, in the ANP, each element or node in one cluster can affect other nodes in other clusters. For example, nodes in C4 can affect other nodes in C2 and C3 clusters. This is called the case of outer dependence. When there is a two-way interaction between nodes in two clusters, e.g., C2 and C3 clusters, a case of feedback occurs. In other cases, a certain node in one cluster can be a reference for other nodes in the same cluster to compare. This cluster is indicated by a loop link. This is called inner dependence. As in AHP, ANP uses the ratio scale of 1–9 when performing pairwise comparisons.
In the ANP network model, the existence of dependencies and feedback needs a large matrix so-called the supermatrix that consists of sub-matrices. This unweighted supermatrix
W is the representation of all influences of nodes or elements in a network on other nodes or elements in that network. By normalizing and synchronizing each column of the supermatrix
W, the stochastic matrix is obtained. Finally, by raising this weighted supermatrix to a large power, the limit matrix is obtained [
49,
50]. After normalizing each block of the limit matrix, the synthesized results comprising the final priorities of all the elements are obtained.
3.1. Developing the ANP Model
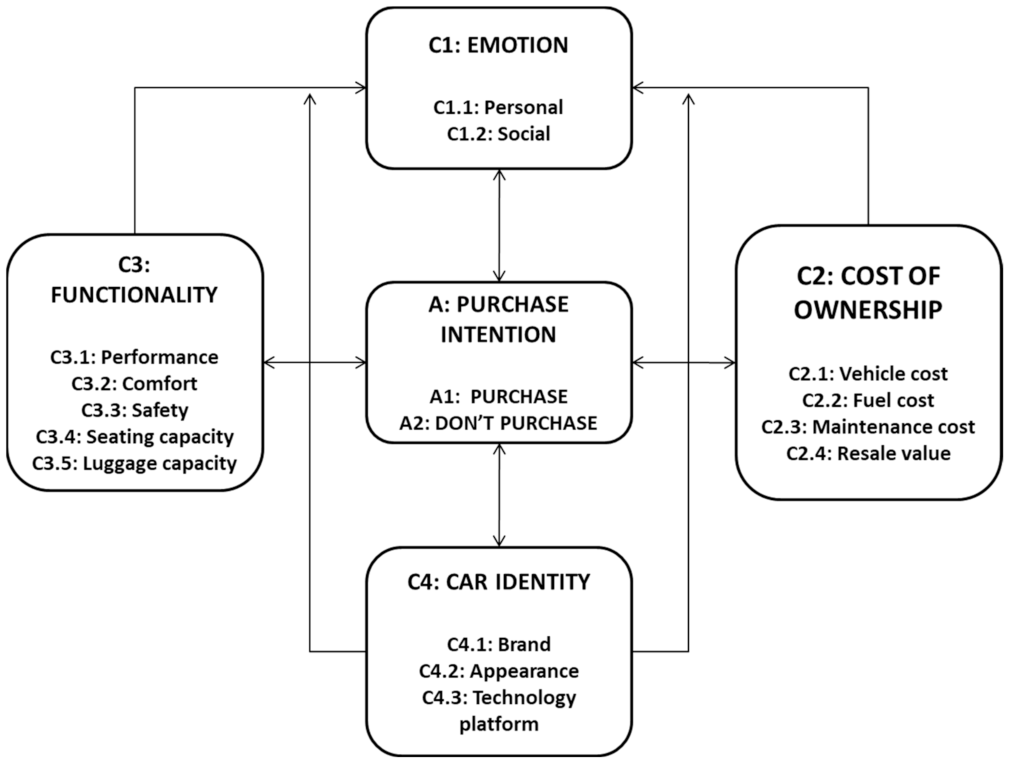
Since there are the dependencies and feedback between nodes of the criteria cluster, the problem of predicting purchase intention towards electric vehicles is approached with the analytic network process (ANP) model as shown in
Figure 2. In the ANP model developed in this research, there are five clusters consisting of four criteria clusters, including emotion (C1), cost of ownership (C2), functionality (C3), and car identity (C4), and one alternative cluster, namely purchase intention (A). The selection of these four criteria clusters follows the requirements of innovation which must provide benefits to customers at an affordable cost [
32].
Regarding environmentally friendly vehicles, perceived attributes related to usability and functionality are critical for the adoption of electric vehicles [
30]. Especially for electric vehicles, the cost-performance ratio is the main factor determining vehicle purchases [
29]. The benefits or performance obtained by customers are in the form of emotion, functionality and car identity. Meanwhile, the costs incurred during vehicle ownership are included in the cost of ownership. In the alternative cluster contains the intention to purchase, either purchase (A1) or don’t purchase (A2).
Emotion is one of the most important factors influencing purchase intention towards pro-environmental products [
51]. This emotion is related to the symbolic meaning obtained from the use of electric vehicles [
52]. In the emotion cluster there are two sub-criteria, namely personal (C1.1) and social (C1.2). The emotion criterion explains that car users want the benefits or value of the vehicle they use. These benefits have both personal and social dimensions [
53]. The personal benefits of using EVs are felt by the drivers themselves, such as pleasure, pride and negative embarrassment [
45]. Social benefits are obtained if electric vehicle users can express and show their identity to others [
7,
44,
54]. Cui et al. [
55] showed that environmental concern, social influence, self-esteem are factors that motivate people to purchase electric vehicles.
As shown in
Figure 2, there is an interaction between the emotion cluster and the other clusters. The emotion cluster and its sub-criteria are influenced by the cost of ownership, functionality, and car identity clusters. The existence of this interaction explains that the emotional benefits, both personal and social, can be obtained by vehicle users from its high price, great performance, or very strong brand. Furthermore, there is a two-way interaction between emotion and alternative clusters. The personal and social sub-criteria influence purchase or don’t purchase, and vice versa.
In the cost of ownership cluster, there are 4 sub-criteria used, including vehicle price (C2.1), fuel cost (C2.2), maintenance cost (C2.3), and resale value (C2.4). In the case of electric vehicles, vehicle price can be a determining factor for the diffusion of electric vehicles [
29,
40,
56,
57]. The still high price of electric vehicles is an obstacle for people to buy them [
44,
58].
In some countries, purchase incentive policies are implemented to make the price of electric vehicles affordable [
13,
14,
15,
16,
41]. The price factor also has a major influence on consumers in adopting products [
59,
60,
61]. The fuel cost is also a determining factor that influences people to purchase electric vehicles [
62,
63]. In the context of electric vehicles, the fuel cost is related to the availability of electric car battery charging infrastructure. Easy access to battery charging infrastructure will accelerate the adoption of electric cars [
28].
The next sub-criterion of cost of ownership is maintenance cost. The vehicle maintenance costs on a regular basis can also be obtained from service centers affiliated with showrooms selling the vehicles. Finally, resale value can be the determining sub-criteria that influence purchase intention. Overall, these economic benefits have a strong impact on EV purchase intention [
64]. This cost of ownership cluster has a one-way interaction with the Emotion cluster. Meanwhile, with alternative clusters, there is a two-way interaction.
In the functionality cluster, there are 4 sub-criteria, namely performance (C3.1), comfort (C3.2), safety (C3.3), seating capacity (C3.4), and luggage capacity (C3.5). Several studies show that performance, comfort, and safety have a positive effect on purchase intention [
43,
56,
65]. Performance describes the functional benefits received by vehicle users related to vehicle performance. Vehicle performance here can be in the form of engine power, speed and toughness in various road conditions. Comfort can be explained according to the following features such as the air conditioning, audio video device, connectivity, and an ergonomic chair. Seating capacity describes the number of passengers that can be seated in the vehicle. Luggage capacity describes the capacity of goods that can be brought in the vehicle. This functionality cluster has a one-way relationship with the Emotion cluster, in the sense that there are sub-criteria in functionality that affect the sub-criteria in the Emotion cluster. The functionality cluster has a two-way interaction with the alternatives cluster.
Finally, in the car identity (C4) cluster, there are 3 sub-criteria, namely brand (C4.1), appearance (C4.2), and technology platform (C4.3). The identity of the vehicle is undeniably the main factor that prospective buyers consider before making a purchase decision. For buyers, the identity of the vehicle can be explained by the brand of the vehicle. Brand can increase the perceived benefits of electric vehicles; make consumers more interested in EVs and influence their purchase intentions [
66]. For some people, the identity of the vehicle is explained by the unique appearance of the vehicle, different from the crowd. The identity of the vehicle is also explained by the technology platform used, whether it is fuel-based, hybrid, or electric. Green technology platforms will be inevitable in the future and become an important factor considered by car users [
67]. Perceived technology also has a significant impact on purchase intention [
68]. Intention to adopt new technology is also related to consumer’s acceptance behavior of a technology [
69]. The car identity criteria cluster has a hierarchical relationship with the emotion cluster. This shows that the brand sub-criteria for example can affect the personal and social sub-criteria in the emotion cluster. Like other criteria clusters, the car identity cluster also has a two-way relationship with the alternatives cluster.
The main processes in using the ANP-based decision model are pairwise comparisons in which the invited experts/interviewees compare two objects at one cluster with respect to one object at another cluster. In performing pairwise comparisons, experts use a ratio scale of 1–9 as previously shown in
Table 1.
3.2. Algorithms for Predicting Purchase Intention
The algorithms for predicting purchase intention of electric vehicles are as follows:
Step 1—Build a decision model for predicting purchase intention of electric vehicle
A decision model based on ANP to predict consumers’ purchase intention towards electric vehicle has been presented and is previously shown in
Figure 2.
Step 2—Performing pairwise comparisons between criteria
All C1, C2, C3, and C4 criteria are compared to each other with respect to purchasing a vehicle. An example of the following question, “Which is more important in the decision to purchase a vehicle, is it C1 or C2 and by how much using a ratio scale of 1–9?” Completing all pairwise comparisons at this level will result in the local priority or weight of each criterion with respect to the vehicle purchase decision.
Step 3—Performing pairwise comparisons between sub-criteria in one criterion cluster with respect to one sub-criterion in another criterion cluster
As shown in
Figure 2, there is a one-way interaction or outer dependence between the sub-criteria in the cost of ownership, functionality and car identity criteria cluster and the sub-criteria in the emotion cluster. Hence, the sub-criteria in the emotion cluster will be compared in pairs with respect to certain sub-criterion in the other criteria clusters. Examples of questions for pairwise comparisons of sub-criteria in the C1 cluster with respect to a sub-criterion in the C3 cluster are as follows: “Which is more influenced by C3.1, is it C1.1 or C1.2, by how much using a ratio scale of 1–9?”. For pairwise comparisons based on the sub-criterion in the C4 cluster, an example of the question is as follows: “Which is more influenced by C4.1, is it C1.1 or C1.2, by how much using a ratio scale of 1–9?”. For pairwise comparisons based on the sub-criterion in the C2 cluster, an example of the question is: “Which is more influenced by C2.1, is it C1.1 or C1.2, by how much using a ratio scale of 1–9?”.
Step 4—Performing pairwise comparisons between the sub-criteria in the criteria cluster with respect to Purchase or Don’t purchase decision in the Alternative cluster.
Before performing pairwise comparisons, all information about the BEV being evaluated will be given to the interviewees. The product information is related to the benefits and costs of the BEV that they will receive as users. Here, it is of great interest to know the sub-criteria that have the most influence on the alternative A1: Purchase or A2: Don’t Purchase. Examples of questions in pairwise comparisons between sub-criteria in the C2 cluster: “With respect to A1 or A2, is it more on C2.1 or C2.2, by how much using a ratio scale of 1–9?” For pairwise comparisons between the sub-criteria in the C3 cluster, an example of the question is “With respect A1 or A2, is it more on C3.1 or C3.2, by how much using a ratio scale of 1–9?”. For pairwise comparisons in the C4 cluster, an example of the question is “With respect to A1 or A2, is it more on C4.1 or C4.2, by how much using a ratio scale of 1–9?” For pairwise comparisons in the C1 cluster, an example of the question is “With respect to A1 or A2, is it more on C1.1 or C1.2, by how much using a ratio scale of 1–9?”
Step 5–Performing pairwise comparisons of Purchase and Don’t Purchase decisions with respect to all sub-criteria of all criteria clusters.
The following is an example of a question in a pairwise comparison between the alternatives A1 and A2 with respect to a sub-criterion in the C3 cluster: “With respect to C.1, do you prefer A1 or A2, by how much using a ratio scale of 1–9?”
Step 6—Synthesizing all pairwise judgments for obtaining the priorities of alternatives
In this step, the Superdecisions software is used to synthesize all pairwise judgements of each expert to get the priorities of the alternatives A1 and A2.
Step 7—Aggregating individual priorities
When performing pairwise comparison, each interviewee may have his/her own attitude, subjective norms, and perceived behavioral control [
2] that result in different individual’s priorities. After having each individual’s priorities, it is of interest to have an aggregated priority for each alternative by calculating the weighted (un-normalized) geometric mean of priorities [
70] as follows:
where
Pg(
Aj) refers to the aggregated priority of alternative
j,
Pi(
Aj) to the individual
i’s priority of alternative
j and
n the number of interviewees/target customers.
4. Implementation
Having developed the ANP-based model, we now can start implementing the model to make a prediction of consumers’ purchase intention towards battery electric vehicles. To solve a multi-criteria decision problem employing the AHP/ANP methods, experts are needed to perform pairwise comparisons [
48,
49,
50]. Performing pairwise comparisons does not require a large number of experts [
71]. Previous studies also stated that the methods are subjective methods requiring experts for research on specific issues [
72]. Since the AHP/ANP depends on the quality of experts’ judgment, judgment coming from few qualified experts can be considerably representative [
73].
4.1. Data Collection
In an effort to have an early prediction of consumers’ purchase intentions towards BEV, some target customers consisting of senior-level executives and higher from various industries in Indonesia were invited as interviewees. These senior-level executives are chosen based on previous studies on early adopters of EV, namely highly educated [
8,
74,
75] and with a high income [
74,
75,
76,
77] so that they have purchasing power to purchase a BEV evaluated in this study. Beside the ability to buy a BEV, the invited interviewees should have the job to be done (JTBD) that can be fulfilled by a BEV. Their JTBD mainly concerns improving their mobility. A JTBD is used as a unit of analysis and a customer segment as well in this research as it explains why consumers use or hire a product [
78]. Hence, a JTBD and an ability to buy a BEV become the prerequisite for interviewees to participate in this study.
Those invited interviewees or target customers are as follows:
The first interviewee is a CEO at an agribusiness and renewable energy company and has a job to be done (JTBD) and desired outcomes in the form of reaching work locations inside and outside the city easily and safely. Functionality is the most important criterion in purchase intention.
The second interviewee is a director at a leading multinational company in the information technology sector. Jobs to be done include facilitating mobility in work and travel. The most important criterion in purchasing a vehicle is car identity.
The third interviewee is the CEO of a leading corporation in the automotive industry sector. His JTBD is to facilitate mobility and reduce dependence on public transportation. Car identity is the most important criterion in purchasing a vehicle.
The fourth interviewee is the Senior Manager at the Ministry of Health Republic of Indonesia and has a JTBD in the form of facilitating mobility in working comfortably. Car identity is the most important criterion in purchasing a vehicle.
The fifth interviewee is a senior manager in a reputable state-owned company in the engineering, procurement and construction sector and has a JTBD in the form of facilitating mobility in work so that it is easy to meet clients at any time. Functionality is the most important criterion in purchasing a vehicle.
The sixth interviewee is a CEO in a manufacturing company and has a JTBD to move people and goods anywhere and anytime safely and comfortably. Cost of ownership is the most important criteria in purchasing a vehicle.
The seventh interviewee is a senior manager in a well-known heavy equipment financing company in the country and has a JTBD for easy mobility. The most important criterion in purchasing a vehicle is emotion.
The eighth interviewee is the project manager in a construction company and has a JTBD to facilitate family mobility. Functionality is the most important criterion in purchasing a vehicle.
Table 2 shows all the interviewees invited in this research. Of course, these 8 interviewees do not represent all target customers that can be acquisitioned by BEV makers. The invited interviewees only represent target customers coming from senior-level executives who have same the JTBD and have the ability to purchase the most affordable BEV in Indonesian market. It is of great interest to have the results coming from these target customers as an early prediction of consumers’ purchase intention towards a BEV. A series of interview processes were conducted on-line due to the COVID-19 pandemic from the middle through to the end of 2020. Before conducting the interview, all the interviewees were informed about how the pairwise comparisons process is performed. All information about the BEV being evaluated were also given to them. This was to ensure that they could perform pairwise comparisons consistently.
The key process in using the ANP approach is pairwise comparisons in which the invited interviewees are asked with a series of questions as presented previously in Steps 2–5. All answers from interviewees are then inputted to the Superdecisions software. Using the Superdecisions software, the inconsistency of each interviewee in performing pairwise comparisons can be monitored and controlled. If the inconsistency ratio is still below 10%, the pairwise comparison is still acceptable [
48]. If it is higher than 10%, the pairwise comparison process should be corrected.
4.2. Performing Pairwise Comparisons between Criteria
The following data collection comes from Interviewee #1. The first pairwise comparison was carried out on 4 main criteria: Functionality, Emotion, Car Identity and Cost of Ownership.
Table 3 shows the Interviewee #1’s pairwise comparison matrix of criteria with respect to (
w.r.t) the objective of purchasing a vehicle. After completing pairwise comparisons, the weights of criteria are obtained.
From the pairwise comparison matrix above, it can be seen that Interviewe #1 placed Functionality as the most important criterion in purchasing a vehicle, followed by car identity, cost of ownership and finally emotion. From the Superdecisions software, the pairwise comparison above gives the importance of the main criteria used by Interviewee #1 as follows: functionality with a degree of importance or weight of 58.38%, followed by car identity of 26.88%, cost of ownership of 9.99% and emotion of 4.75%.
The pairwise comparison process continues to find out the dependencies of the sub-criteria in one criterion with respect to sub-criteria in another criterion.
4.3. Performing Pairwise Comparisons between Sub-Criteria in One Criterion Cluster with Respect to Sub-Criteria in Another Criterion Cluster
From
Figure 2, it can be seen that there are influences from the sub-criteria in the functionality, car identity and cost of ownership criteria to the “personal” and “social” sub-criteria in the EMOTION criteria. This explains that the sub-criteria of functionality, car identity, and cost of ownership will provide personal and emotional benefits to EV users. For example, the high price of EV vehicles will provide social benefits where EV drivers can show their identity to the public. Likewise, performance such as instant acceleration will provide personal benefit enjoyed only by EV users.
Table 4 shows a pairwise comparison matrix of the dependencies between the sub-criteria of the EMOTION criteria and the FUNCTIONALITY sub-criteria of Interviewee#1.
The pairwise comparison process continues by comparing Personal and Social with respect to the sub-criteria of Car Identity.
Table 5 shows the pairwise comparison matrix of personal and social with respect to the sub-criteria of car identity.
Finally, the pairwise comparison process of personal and social continues with respect to vehicle price from the cost of ownership criteria.
Table 6 shows the pairwise comparison matrix of personal and social with respect to the sub-criteria of cost of ownership. Only vehicle price has an influence on personal or social benefit that can be obtained by users.
4.4. Performing Pairwise Comparison between Sub-Criteria in All Four Criteria with Respect to the PURCHACE Decision
The interviewees were then asked to conduct an assessment of an electric vehicle. The chosen electric vehicle is a battery electric vehicle (BEV) from a well-known car maker that will be introduced to the Indonesian market. This vehicle is currently the most affordable BEV in the Indonesian market. All information related to the benefits and costs of the vehicle was given to the interviewee; and they were asked to study all the information about the BEV before performing the pairwise comparisons.
The pairwise comparison process continued with the pairwise comparison of the sub-criteria of all the criteria with respect to the purchase decision. In this pairwise comparison, at least 1 of the two sub-criteria being compared is affected by the “purchase” decision. If the two sub-criteria being compared are not affected by the “purchase” decision, then the pairwise comparison is not carried out and is stated as “No Comparison” or No comp in the Superdecisions software.
Table 7,
Table 8,
Table 9 and
Table 10 show the pairwise comparison matrix of the sub-criteria of the functionality, cost of ownership, car identity, and emotion criteria with respect to the purchase decision in the Superdecisions software.
4.5. Performing Pairwise Comparison between Sub-Criteria in All Four Criteria with Respect to the DON’T PURCHASE Decision
The pairwise comparison process continues with the pairwise comparison of the sub-criteria of all criteria with respect to the “don’t purchase” decision. In this pairwise comparison, at least 1 of the two sub-criteria being compared is affected by the “don’t purchase” decision. If the two sub-criteria being compared are not affected by the “don’t purchase” decision, then the pairwise comparison is not carried out and is stated as “No Comparison” or No comp in the Superdecisions software.
Table 11 shows the pairwise comparison matrix in the Superdecisions software of the sub-criteria of the cost of ownership criteria that affect the “don’t purchase” decision.
4.6. Performing Pairwise Comparisons of Purchase and Don’t Purchase with Respect to All Sub-criteria of All Criteria
Here, pairwise comparison is performed by comparing the purchase and don’t purchase decisions with respect to each sub-criterion of all criteria.
Table 12,
Table 13,
Table 14 and
Table 15 show the pairwise comparison matrix of purchase and don’t purchase with respect to the sub-criteria of functionality, cost of ownership, emotion, and car identity
4.7. Results
After Interviewee #1 performed pairwise comparisons, his/her pairwise judgments were inputted to the Superdecision software and the results are finally obtained and shown in
Table 16. It can be seen that Interviewee #1 has a slightly moderate preference for purchasing a BEV with a ratio scale of purchase of 68.41% over don’t purchase of 31.59%. The same pairwise comparison processes were also carried out by the other seven interviewees. The results of purchase intention of all interviewees are tabulated in
Table 17.
Using Equation (1) to obtain the geometric mean of the purchase intentions of all interviewees and normalizing the results, finally, the purchase intention of the target customers is obtained as follows:
Considering that the ANP uses a ratio scale, it is shown from the aggregated purchase intention above that the interviewees prefer purchase to don’t purchase with the ratio scale of 0.7689/0.2311 or 3.3. Meanwhile, based on pairwise comparisons at the criteria level by each interviewee before EV evaluation, the results are shown in
Table 18.
Using Equation (1) to obtain the geometric mean of aggregated weights of criteria of all interviewees and normalizing the results, the weights of criteria of interviewees are as follows:
The results show that, before evaluating the product, functionality is the most important criterion with a weight of 39.77% followed by car identity with 32.88%, cost of ownership with 14.41%, and emotion with 12.94%.
With the ANP model, it can be seen that decision makers have dependencies between elements in one cluster with other elements in other clusters. Therefore, after performing all pairwise comparisons, it turns out that there are changes in the weights of the criteria that affect purchase intention.
Table 19 shows the criteria weights for each interviewee and the aggregate weight values for each criterion when performing pairwise comparison.
Using Equation (1) to obtain the geometric mean of aggregated weights of criteria of all interviewees and normalizing the results, the weights of criteria of interviewees when performing pairwise comparisons are as follows:
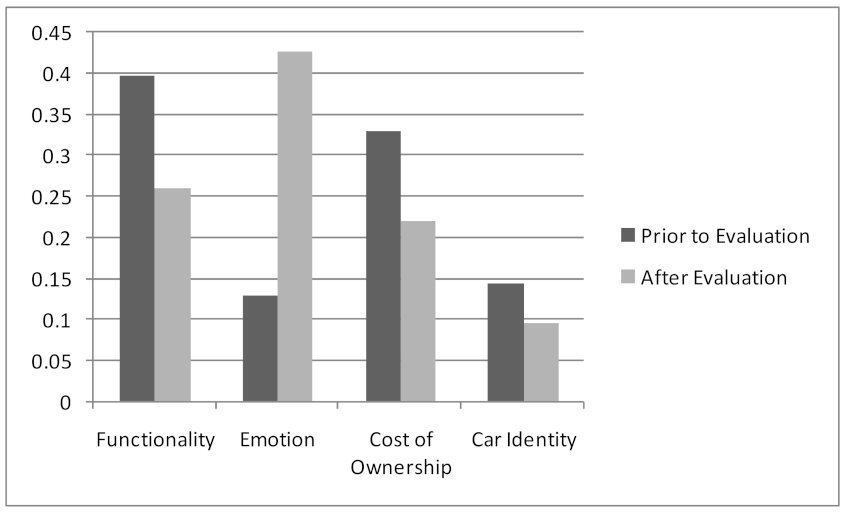
Figure 3 shows changes in the weight of the criteria before and after the assessment of the tested vehicles. Initially they put Functionality as the most important criterion with a weight of 39.77%, followed by car identity 32.88%, cost of ownership 14.41% and emotion 12.94%. However, when evaluating the BEV, it appears that emotion became the most important criterion with a weight of 42.64%, followed by functionality 25.94%, car identity 21.87%, and cost of ownership 9.55%.
The results obtained from the ANP depend on the quality of the interviewees who perform pairwise comparisons. In this research on purchase intention of electric vehicles, interviewees or the target customers have the jobs to be done that can be solved by a BEV and have the ability to own an electric vehicle. The quality of the results of pairwise comparison in the ANP also depends on the level of inconsistency of the interviewees. By using the Superdecisions software, we can see check whether or not pairwise comparison has been done consistently. If the inconsistency ratio is still below 10%, the pairwise comparison is still acceptable [
48]. It was found that the inconsistency ratio of the pairwise comparison processes performed by the interviewees were still below 10%. Therefore, it can be concluded that the results of the pairwise comparison demonstrate good consistency.
5. Discussion and Practical Implications
Predicting consumers’ purchase intention has always been the ultimate challenge for companies developing new products. A lot of research has been done to explore and explain the determinants of purchase intention of consumers towards electric vehicles. Previous research has mostly referred to the theory of planned behavior [
35] in exploring factors influencing consumers’ purchase intentions. Generally, previous works on EV purchase intention studied people who live in countries that already have electric vehicles in the market. Thus, people who were being studied had developed attitudes, subjective norms, and perceived behavioral control related to purchase intention of EV. In the context of Indonesian market, the EV adoption is still negligible so that people are still not developing a sense of attitude, subjective norms, or perceived behavioral control towards electric vehicles. Asking people whether or not they have a purchase intention towards EV will likely give inaccurate results, since they have no prior experience with EV [
47]. Most of previous studies explored factors influencing purchase intention towards electric vehicles without giving them people a chance to try out the electric vehicles in the market.
This research is intended to assess how to predict the purchase intention of consumers in Indonesia towards a BEV that will be introduced to the market. BEV makers need to prepare electric vehicles that can satisfactorily perform consumers’ jobs to be done. In this study, a BEV from a well-known manufacturer is selected. The selected vehicle is the cheapest of all vehicles that have been introduced in the Indonesian market. An affordable electric vehicle is a prerequisite for a faster EV adoption [
44,
57,
58]. The selected BEV price is around IDR 700 million or approximately USD 48,600 with 1 USD = IDR 14,400. Although the government has nullified the value-added (VAT) tax for BEV, the vehicle price is still beyond the ability of the majority car owners with vehicles priced below Rp 300 million or USD 20,833.
Considering the price of the available cheapest BEV in the market, a number of target customers with the ability to purchase the vehicle were selected. This prerequisite is taken considering that intention is an immediate predictor of the actual purchase behavior according to TPB. The interviewees invited in this research are senior executives from well-known companies and institutions in Indonesia. It can also be explained that BEV as an innovation product must continue to offer affordability even though there is an increase in benefits [
32].
Realizing that price is still a barrier for people to adopt an EV in Indonesia, the ANP approach that uses a number of selected target customers is justified. With this approach, it is of great interest to know how strong they prefer purchase over don’t purchase decisions, or vice versa. The ANP model developed in this study uses the main criteria commonly used in selecting a vehicle, namely functionality, emotion, car identity and cost of ownership. Interviewees have different priorities for the criteria that influence purchase intention. As previously shown in
Table 18, the interviewees’ aggregated priorities for criteria are as follows: functionality as the most important criteria with a weight of 39.77% followed by car identity 32.88%, cost of ownership 14.41% and emotion 12.94%.
In the ANP-based model developed in this study, there is an outer dependence of the sub-criteria in functionality, the sub-criteria in car identity and the sub-criteria in the cost of ownership that affect the personal and social sub-criteria in emotion. This is in accordance with the fact that the sub-criteria in functionality such as performance, comfort, and seating capacity can affect the personal and social benefits of the emotion criteria. The sub-criteria in car identity that consists of strong brand, appearance or vehicle design and vehicle platform technology will affect the personal and social benefits of emotion. Vehicle price in the cost of ownership also affects the personal and social benefits.
The outer dependence of the functionality, car identity and cost of ownership criteria on the emotion criteria shows changes in the weight of the criteria as previously shown in
Table 19. When a BEV was given to interviewees or target customers to be assessed, emotion becomes the most important criterion with a weight of 42.64%, followed by functionality with 25.94%, car identity with 21.87%, and cost of ownership with 9.55%. There is a drastic increase of 2.3 times from the original weight of Emotion. This is in line with previous works that showed that vehicles become a tool that can bring emotional benefits to users [
5,
6,
7,
8]. The emotional benefit can be something personal to the drivers such as pleasure, pride and negative embarrassment [
45]. The emotional benefit can also have a social dimension in that drivers can express and show their identity to others [
7,
44,
54].
The synthesis of pairwise comparisons carried out by all target customers indicates that there is purchase intention towards BEV with different levels of preference. Considering that ANP uses a ratio scale, it can be inferred that for Interviewee #6 purchase decision is more preferred than don’t purchase with a ratio scale of 0.63/0.37 or 1.7. Meanwhile, interviewee #2 prefers more purchase decision than don’t purchase with a ratio scale of 0.86/0.14 or 6.14.
The results of the aggregation of purchase intentions from all interviewees are 0.77 for purchase and 0.23 for don’t purchase or purchase are more preferred than Don’t Purchase with a ratio scale of 3.35. It should be noted that this result does not mean that 77% of the target customers will purchase BEV and 23% will not. From
Table 1, the results of this study model indicate that the target customers who come from senior executives at companies in Indonesia have a moderate preference towards purchasing BEV.
This result is quite encouraging for the BEV manufacturers. It is interesting to note that although the availability of public infrastructure for charging batteries is still practically non-existent, the target customers already have purchase intentions towards BEV. This can be explained by their middle-up economic status so that they can easily have home charging in their own homes [
79]. For those with lower-middle income who do not have a garage or apartment, home charging will be difficult to install, and this can be a major barrier for EV adoption in an emerging economy like Indonesia.
This research also has a practical impact for the middle up segment, as BEV manufacturers can focus on vehicles that can fulfill order winners for users, starting with the main emotional benefits, followed by functionality and car identity. Meanwhile, the order qualifier from the middle up target customers is the cost of ownership.
6. Conclusions and Further Research
An ANP-based decision model that can be used to make an early prediction of consumers’ purchase intentions towards BEV in the Indonesian market has been presented. Having considered the fact that the price of BEV in the Indonesian market is still not affordable to the majority of existing car owners, the target customers coming from senior level professionals in Indonesia were selected to participate as interviewees. This selection is in accordance with the previous studies on the characteristics of early adopters of EV, namely highly educated [
8,
74,
75] and with a high income [
74,
75,
76,
77].
In using the ANP-based model developed in this research, companies only need to invite a few target customers, considering that what we are looking for is the level of preference towards purchasing a battery electric vehicle and not the proportion of those who choose the purchase or don’t purchase decision. As the ratio of purchase over don’t purchase decisions equals 3.3, it means that the purchase decision is more moderately preferred by the target customers than don’t purchase. With a 1–9 ratio scale used in AHP/ANP, the result of this research provides enough confidence for the car maker that the BEV being evaluated will likely be adopted by the target customers selected in this study.
Indeed, the senior professionals invited in this study do not represent the entire target customers. However, with their jobs to be done in performing mobility and ability to purchase the BEV, their judgment can provide an early indication of purchase intention towards BEV in the Indonesian market. In the case of the most affordable BEV at this time, the invited interviewees show that they have a moderate preference towards the BEV. With this result, the BEV manufacturer can choose this group of early wealthy, highly-educated consumers as their early adopters.
The multi criteria decision model developed in this research can also help BEV makers determine which criteria mostly influence the purchase intention of target customers towards their products. The results of this research show that, for the target customers coming from senior level professionals, the criterion of emotion becomes dominant in influencing the purchase intention of target customers. Emotional benefits, both personal and social, explain the symbolic and emotive meanings of the purchase intention of electric vehicles [
52,
53,
80,
81].
This research is still limited to the target customers who come from senior level professionals that represent the early wealthy, highly-educated consumers in Indonesia. Even though the invited target customers can have a certain level of influence on the mass market, they can by no means represent the majority adopters of BEV. This limitation could be extended to a larger target customer with different groups in the market as long as they have the same JTBD and the ability to purchase the most affordable BEV in the Indonesian market. This research is still limited to those with the middle-up economic status considering that the price of BEV in the Indonesian market is still not affordable for the majority of car users. For further research, it will be of great interest to explore other EV products, such as e-bike, e-scooters, and e-motorcycles, and whether they are a good fit with the other target customers in the market. Even though the interviewees in this research were allowed to learn all benefits and costs related to the BEV being evaluated, they still have no prior experience with EV. Hence, further research should allow people to have experience driving the EV being evaluated to find out whether or not their purchase intentions towards EV changes.
Moreover, the adoption of electric vehicles can be supported by businesses. The use of electric vehicles, such as e-trucks and e-vans, will be able to reduce the operating costs of logistics companies. Research on e-mobility as a service (EMaaS) is also a possibility when people do not really want to own an electric vehicle but prefer to use it as a transportation service. If e-mobility as a service becomes a feasible option in the future, a question on which EVs are suitable to use in EMaaS is worth considering for further research.


