Article

Mining Electric Vehicle Adoption of Users

by
Rui Rodrigues
1,
Vitória Albuquerque
2,
João Carlos Ferreira
1,3,*,
Miguel Sales Dias
1 and
Ana Lúcia Martins
4
1
Instituto Universitário de Lisboa (ISCTE-IUL), ISTAR, 1649-026 Lisbon, Portugal
2
NOVA Information Management School (NOVA IMS), Campus de Campolide, Universidade Nova de Lisboa, 1070-312 Lisbon, Portugal
3
Inov Inesc Inovação, Instituto de Novas Tecnologias, 1000-029 Lisbon, Portugal
4
Business Research Unit (BRU-IUL), Iscte-Instituto Universitário de Lisboa, 1649-026 Lisbon, Portugal
*
Author to whom correspondence should be addressed.
World Electr. Veh. J. 2021, 12(4), 233; https://doi.org/10.3390/wevj12040233
Submission received: 9 October 2021 / Revised: 22 October 2021 / Accepted: 26 October 2021 / Published: 11 November 2021

Abstract

:
The increase of greenhouse gas emissions into the atmosphere, and their adverse effects on the environment, have prompted the search for alternative energy sources to fossil fuels. One of the solutions gaining ground is the electrification of various human activities, such as the transport sector. This trend has fueled a growing need for electrical energy storage in lithium batteries. Precisely knowing the degree of degradation that this type of battery accumulates over its useful life is necessary to bring economic benefits, both for companies and citizens. This paper aims to answer the current need by proposing two research questions about electric motor vehicles. The first focuses on habits EV owners practice, which may harm the battery life, and the second on factors that may keep consumers from purchasing this type of vehicle. This research work sought to answer these two questions, using a methodology from data science and statistical analysis applied to three surveys carried out on electric vehicle owners. The results allowed us to conclude that, except for the Year variable, all other factors had a marginal effect on the vehicles’ absolute autonomy degradation. Regarding obstacles of the adoption of electric vehicles, the biggest encountered was the insufficient coverage of the network of charging stations.

1. Introduction

The central topic of this research work is aligned with the urgent need to electrify most human activities [1], which is part of ongoing European and national policy. For example, the European Green Deal of 2020 [2] aims to reduce greenhouse gases (GHG) in 2030 to at least 55% of 1990 values. Likewise, the Portuguese National Plan for Energy and Climate PNEC 2030 (2019) [3] foresees, by 2030, a reduction between 45% and 55% in greenhouse gas emissions of 2005 levels and a 20% incorporation of renewable energies in the transportation sector.
Human activities have been emitting considerable amounts of GHG into the atmosphere, notably in the last century, from trade to transportation, industry, and agriculture. The 2021 Intergovernmental Panel on Climate Change (IPCC) [4] report recently stated with high confidence that there is a near-linear relationship between cumulative anthropogenic CO2 emissions and global warming consequences. Therefore, the current living generations of people must take a decisive step to accelerate the transition of powering our energy needs with renewable sources.
Hence, the theme of this research work focuses on a small part of the bigger problem, the transition to electric passenger vehicles. Any energy storage solution developed with optimization can diminish the importance of the current lackluster battery capacities. Moreover, this study aims to find the critical factors regarding the usage and charging of an electric vehicle (EV) that can most negatively influence its battery’s remaining useful life (RUL).
To tackle this problem and answer the following research question, which will be detailed in on the next page, we adopted a traditional exploratory statistical analysis that was used on a dataset with Tesla vehicles to the results of three surveys.
Additionally, a systematic literature review was performed based on the Preferred Reporting Items for Systematic Reviews and Meta-Analysis (PRISMA) methodology [5], which focused on Machine Learning (ML) classification models, later applied in our analysis. Additionally, three surveys were created in the research work framework and shared online with current and prospective EV users to further enrich and diversify the Tesla dataset’s answers. Data from these three surveys were merged with the Tesla dataset and were subject to statistical analysis with Statistical Product and Service Solutions (SPSS) software from IBM. The aim was to uncover valuable insight into the satisfaction degree of the current charging network in Portugal.
The main results from the battery degradation analysis showed that factors such as the frequency of charging an EV in fast-charging stations, such as the Tesla Supercharger network, may not have a measurable impact on battery degradation. Instead, based on the results of this sample, the car’s age may be the central factor. Future research can produce more precise and detailed models and better explain these factors’ impact on car range.
Regarding the systematic literature review (SLR), it was possible to identify a gap in the current state of the art: a single article [6] referred to the degradation of batteries from the standpoint of EV user behavior and battery charging patterns. All other articles mentioned battery degradation solely from the point of view of the electrochemistry field, explaining in detail how the batteries’ components and the environmental conditions affected battery longevity. Furthermore, they also mentioned that Li-ion batteries lose capacity depending on the intensity of their use or lack thereof. These drawbacks add to the list of disadvantages mentioned previously. They may further deepen hesitancy to adopt EVs by EV users in Portugal, which is an exciting topic for further research.
To answer these research gaps about battery degradation that constitute the dissuasive factors preceding the purchase of electric vehicles, the following research question (RQ) was formulated:
RQ: Which factors may present themselves as a hindrance to the adoption of EV vehicles by citizens?
The main objective of this paper is to identify and understand user satisfaction and how it may hinder the adoption of EVs. In Table 1, the methodology to answer the identified research question is presented. To address the objective proposed in Table 1, a descriptive statistical analysis in SPSS was developed to obtain a general exploratory overview of the dataset distribution.

2. Literature Review
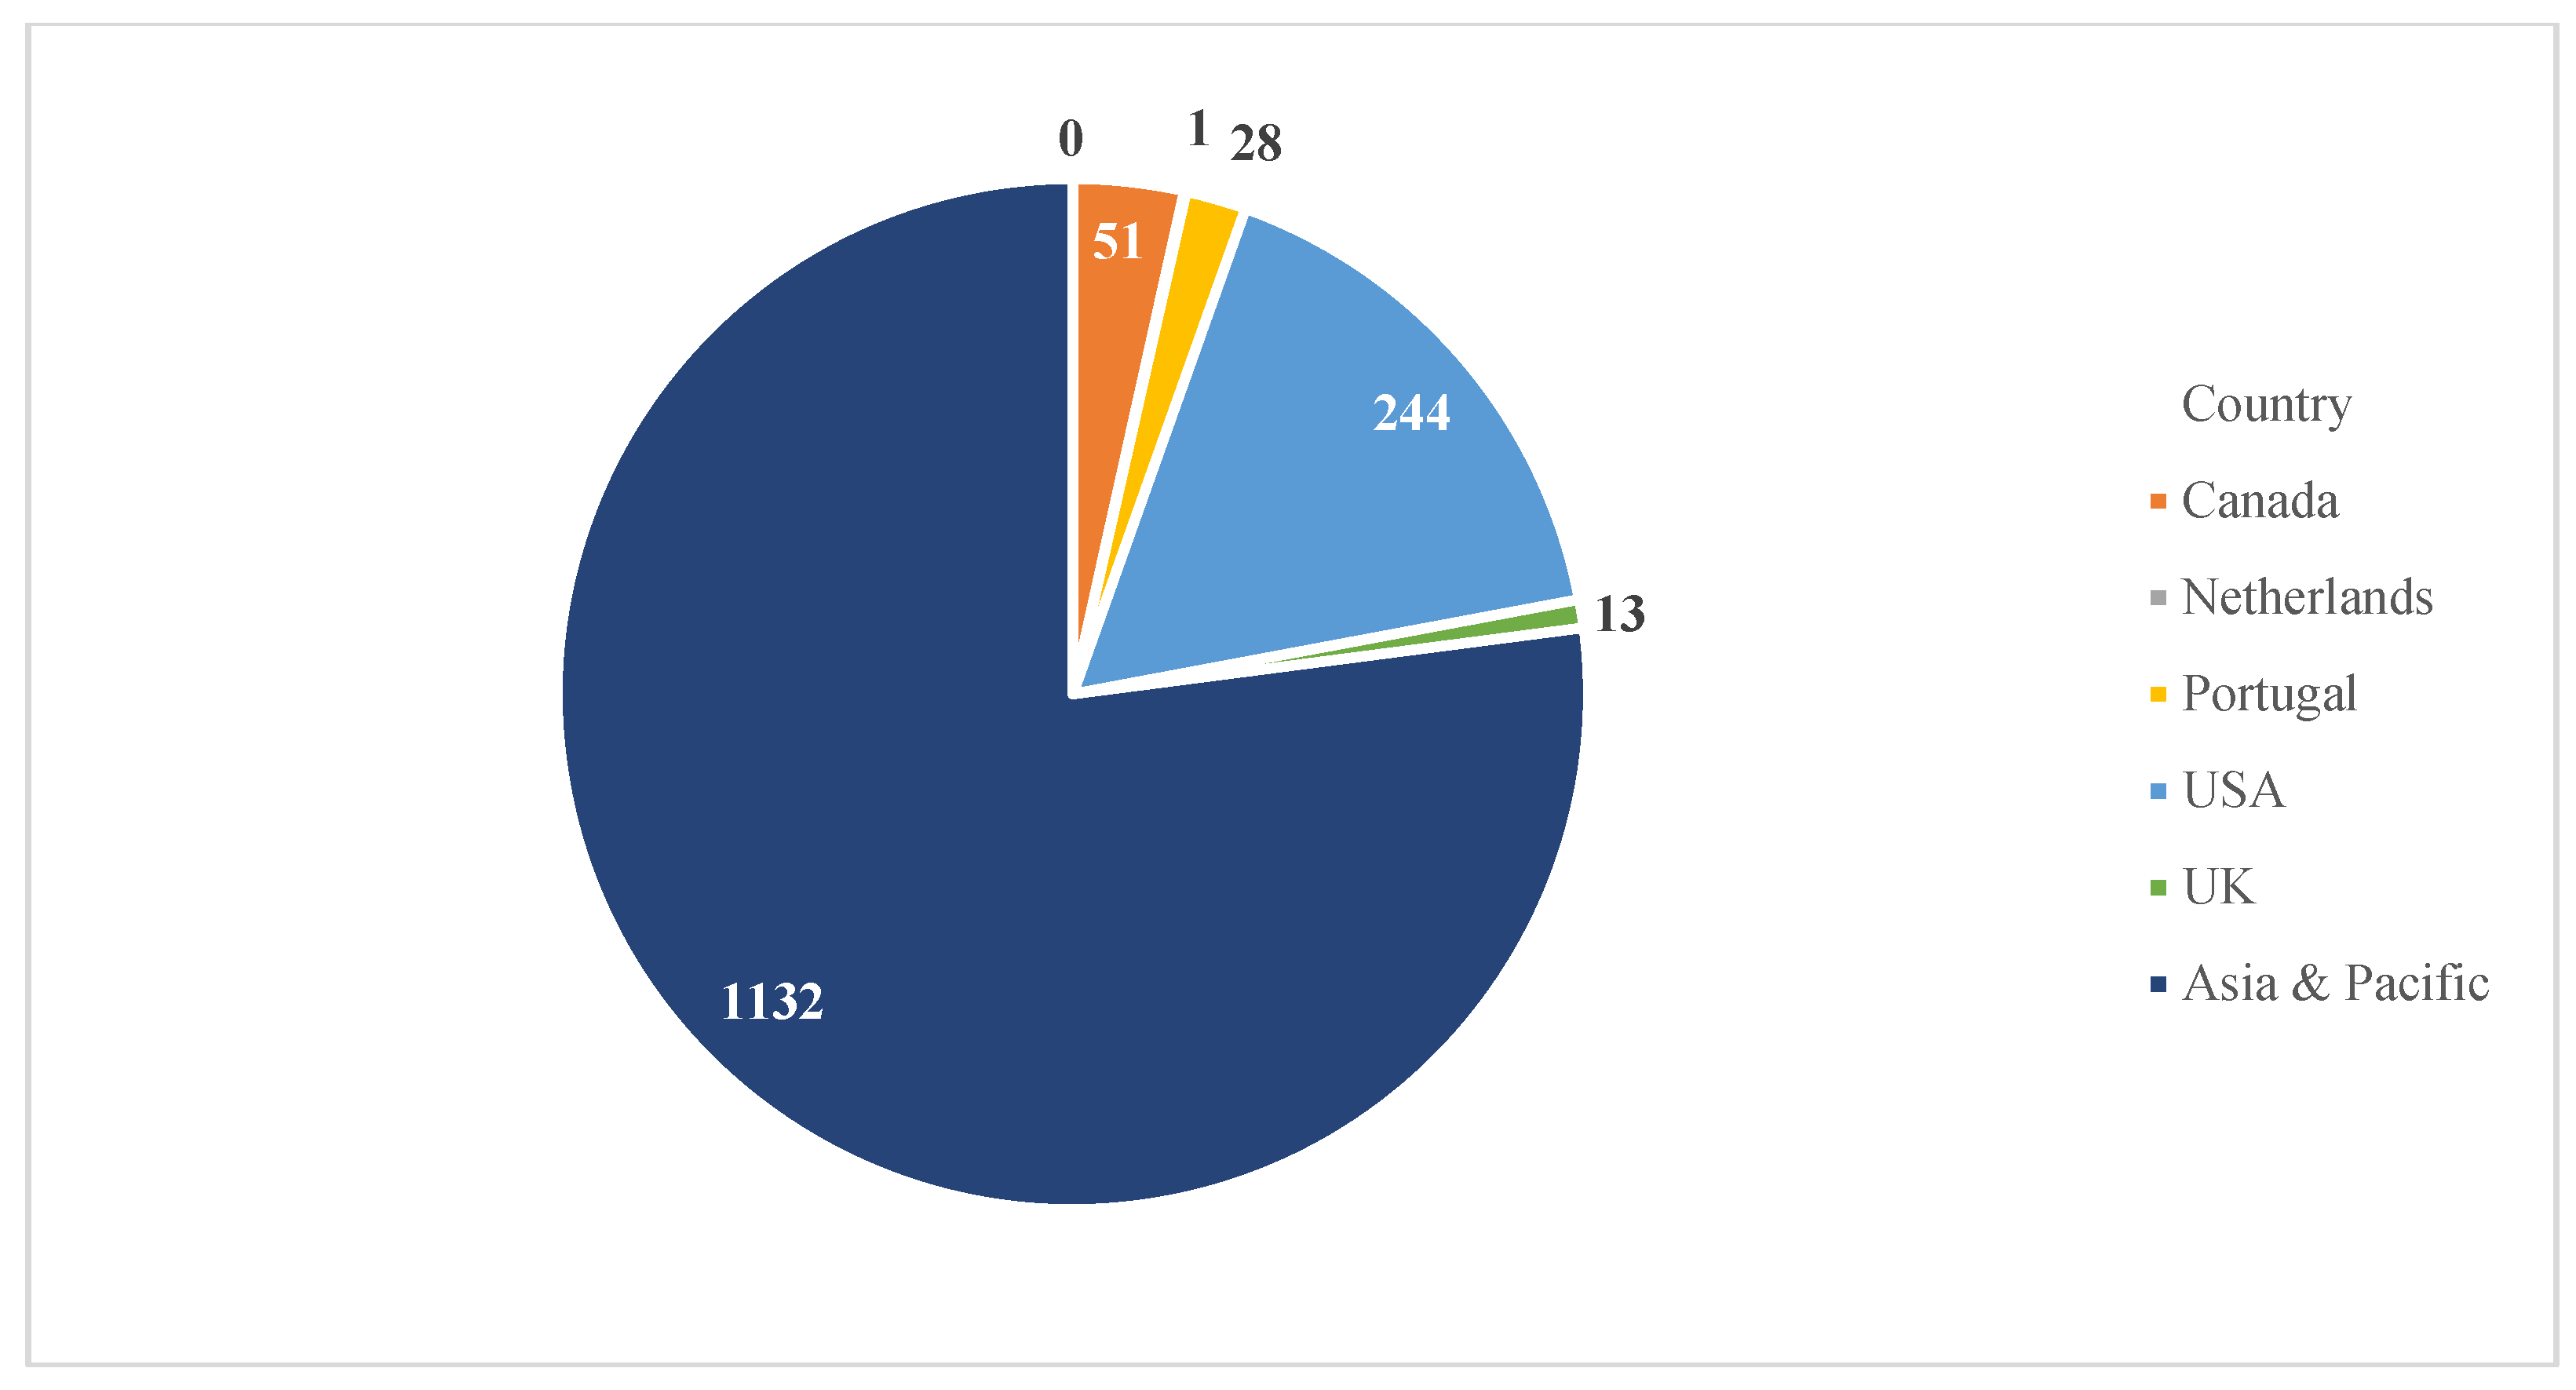
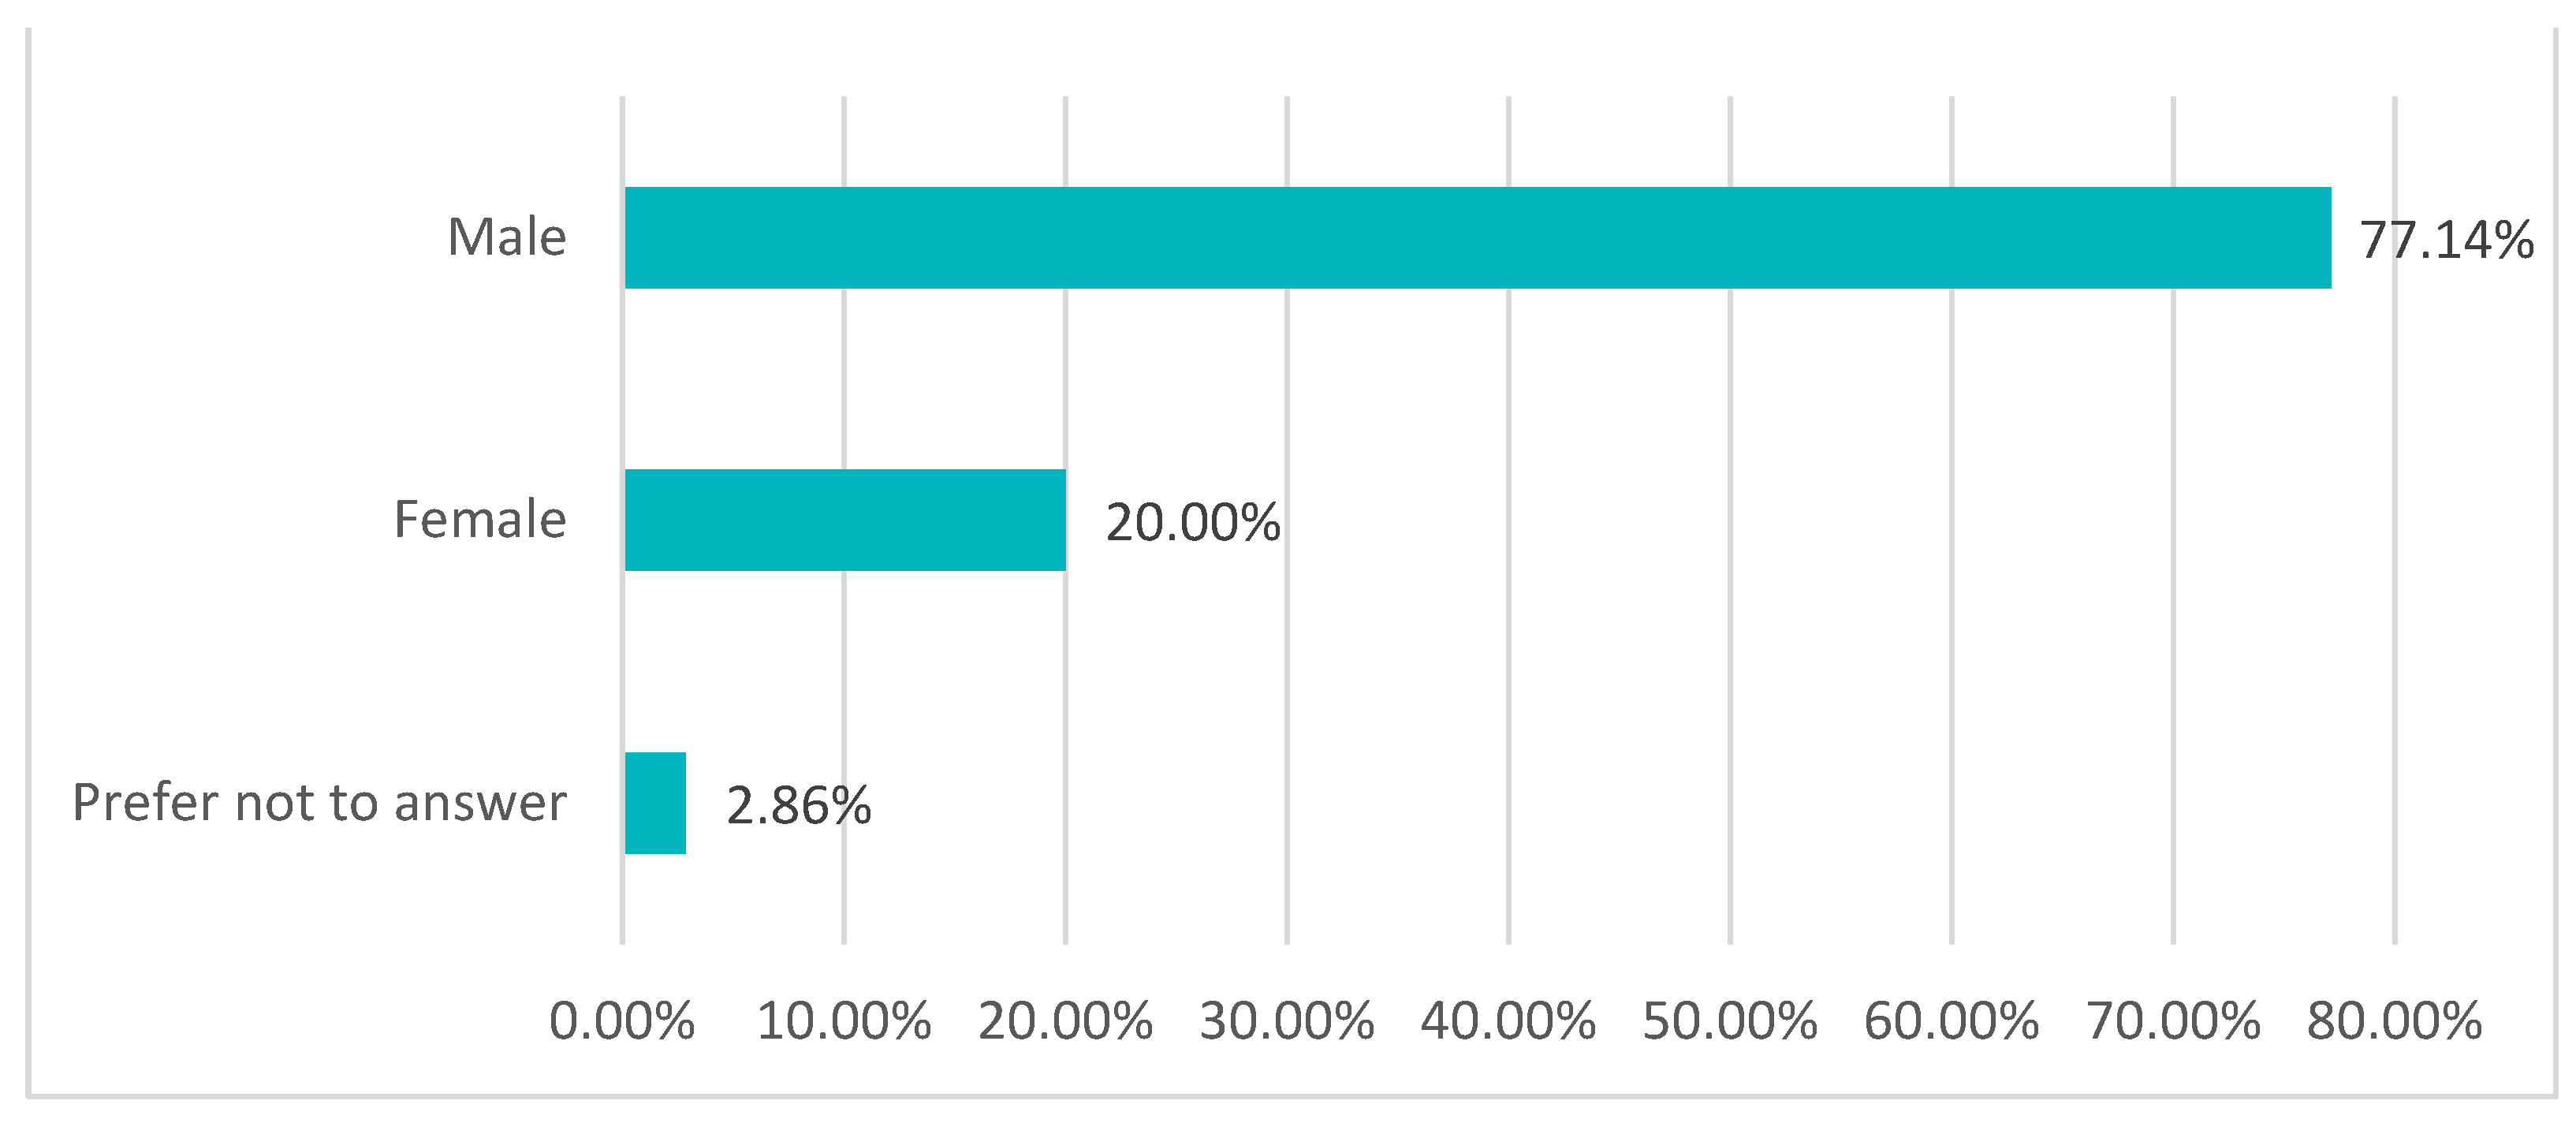
The upcoming sub-sections describe the process of our systematic literature survey. Although the topic of EVs is recent, there is much interest in it, and as a result, there is considerable pertinent, available literature online. Therefore, it was necessary to employ a systematic analysis method to efficiently filter out the works less relevant and highlight the ones most related to the theme of the research work.
The Preferred Reporting Items for Systematic Reviews and Meta-Analyses (PRISMA) [5] is a method for obtaining literature reviews with systematic and objective results. It is a method where findings can be reproduced and verified easily by other researchers. PRISMA is used to write systematic reviews of research, particularly in the Medicine, Social Sciences, and Exact Sciences areas.
It thus presents as a set of recommendations followed by authors who wish to publish and report comprehensively and transparently about how they reached their conclusions at the time of their bibliographic research. In other words, the PRISMA guidelines help authors to describe the conducted literature work best, findings achieved, and what they are planning to do.
Keyword identification is the first step of PRISMA and was performed by an iterative search for specific keywords on the collected articles from the selected repositories. The final set of collected academic papers was determined through the following logical query on their metadata:
“Electric vehicle” AND “predictive model” AND “aging” AND” degradation” AND “battery” OR “SoH.”
The search for keywords was performed on known academic repositories: Scopus, Institute of Electrical and Electronics Engineers (IEEE), and Web of Science.
The same query parameters mentioned were used on all three repositories to obtain relevant and comparable results.
By applying PRISMA, we end with a paper set for further quantitative and qualitative analysis: our SLR collection. This one was structured using the Mendeley reference manager tool [7] that allowed the extraction of papers’ metadata and duplicated entries. The following metadata elements were extracted from each publication: author’s name, number of publications, publication data, references, and number of citations.
We used VOSviewer [8], a tool to map and visualize bibliometric networks of the SLR publications. This allowed us to identify network properties, such as clusters and node centrality, and derive characteristics of the SLR papers. These networks were built based on the number of common citations, bibliographic coupling, co-citations, and co-authorship relations, representing the bibliographic data of our scientific literature survey, visually.
The PRISMA flow diagram in Figure 1. illustrates our SLR process for further quantitative and qualitative analyses. In the first step, we identified the publications through a database search, using the logical query described previously, resulting in a total of 149 publications (Scopus: 30; IEEE: 69; Web of Science: 50).
The two main factors for selection were papers written in English and published by peer-reviewed journals during the last five years, i.e., the 2017–2021 period. Additionally, we manually added 12 extra papers that proved to be relevant for this paper’s scope. Finally, the research did not include review papers, conferences, position papers, and reports.
In the next step, we removed the exact duplicates. In this case, there were none (n = 0). Afterward, we performed vetting of the collected abstracts. In the first review, the methodology excluded articles from our research scope (n = 80). The second review excluded articles not related to prediction models (n = 4). Finally, the remaining 47 papers’ full texts were read, assessed, and fitted on the research scope. In the full-text screening phase, all papers were considered and were eligible for a systematic review and analysis. As such, this eligibility phase excluded a total of zero of such remaining papers.
Based on the systematic literature review mentioned in the previous sub-section, a total of 47 academic articles were subjected to full-text reading and analysis. The themes were closely linked to the chosen keywords. Table 2 shows the collected articles and the methods applied.
The identified journal papers covered a broad spectrum of research fields that were ranked by importance, as follows: engineering, energy, computer science, materials science, chemistry, physics, and mathematics, as shown in Table 3. This demonstrates a broad interest in this dissertation subject across many fields of research.
From an initial collection of 149 papers, 47 journal papers were analyzed, including from IEEE Access (25) and IEEE Transactions on Industrial Electronics (5). As shown in Table 2, most journals were SCImago journals [55] ranked as Q1-quartile (45), representing 96%, while the remaining (2) were Q3 articles. The five primary areas of expertise identified in the analysis were computer science, engineering, environmental science, transportation, and mathematics.
Publishers from the 46 selected articles originate from two countries, with the most extensive set coming from the United States (40), followed by the Netherlands (7). The top publishers identified are Elsevier Ltd. (6), Institute of Electrical and Electronics Engineers Inc. (3), the American Institute of Physics (1), Academic Press Inc. (1), and SAE International (1). The most frequent keywords used in the titles and abstracts of the articles collected are represented in Figure 2. It is possible to assess three distinct groups, in three assorted colors, related to different subjects: in red, we show words linked with the theme of forecasting models, in green, the keywords related to the second model that refers to the theme of electric batteries, and in blue color, the third model associated with the temperature conditions under which the batteries operate. In this case, the most relevant topic present in the literature is “model.”
In Figure 3, we depict the paper’s authors. To have a fitted representation of the authors, we performed an initial visualization with all 1826 authors. The visualization of all the authors showed a too crowded and convoluted network, making it difficult to picture. Hence, we selected authors with a minimum of five published works, resulting in 60 authors. This analysis showed that the scientific community is mostly of Chinese origin. No filtering on nationality was applied in the papers screening.
Figure 4 shows the different keywords present in the text of the consulted articles. There are four distinct themes highlighted by different colors: a less prevalent theme is linked to electronics. There is a second cluster, a slightly more important theme, colored in blue on the theme of ML; the third theme colored in green focuses on EVs; and finally, a fourth theme displayed in red on Li-ion batteries.
In Table 4, the most important contributors are listed, coupled with their quartile rank and the insight they provided to this paper:
The most significant contributions retained from this literature review were those of the following authors: Zhang [6] proposed a hybrid model of electric buses powered by two types of batteries: one Lithium iron phosphate and one Lithium-titanate-oxide battery, which would enable buses to be charged in 20 min at fast-charging stations. Thus, Zhang predicted the buses would suffer a maximum degradation of 20% of total capacity after eight years of service. Similar studies [56,57,58] have addressed the same topic in the scope of passenger and freight mobility with electrical.
Vidal [42] reinforced the importance of applying ML techniques to ascertain the SoH of the batteries with precision. In addition, he frequently mentioned how there are few studies about the battery pack performance under cold temperatures. This is of notable consequence in, for example, colder regions and, to a lesser degree, to vehicles directly exposed to the elements, i.e., parked outside [42].
Saldaña [37], similar to Vidal [42], also alluded to the essential nature of knowing the rate of battery degradation. Furthermore, he stated that battery endurance depends not only on electrochemical factors such as the temperature to which the batteries are subjected, on operational aspects such as the degree to which EV users allow their packs to discharge, but also on the total number of charging/discharging cycles that are completed throughout the useful life of the car. Finally, he mentioned that the driving environments where the cars are used are of great relevance to determine how well the batteries will mitigate their decay.
The convergence point among the paper topics is the relevance that the authors gave to the application of ML techniques to determine, with higher precision, the batteries’ SoC and SoH.

3. Surveys

Following the work and analysis performed in the previous sections with the Tesla dataset, we conducted three surveys to find the habits of electric vehicles drivers. However, after evaluating the results of the CRISP-DM methodology, we concluded that this methodology partially answered the RQ. Furthermore, after cleaning its data, we had to work with a dataset that was reduced to a third of its original size. Thus, we decided to obtain more data through surveys to seek more confident conclusions drawn from a dataset with a more significant number of observations.

3.1. Survey Creation

These questionnaires were developed in either Portuguese or English languages, depending on their target audiences. The surveys were created on Qualtrics [59], a survey software tool, and comprised an introduction for the study objectives and its scope and the questionnaire. Unfortunately, personal data from the respondents was scrubbed from the database following the European Union General Data Protection Regulation [60]. Overall, all three surveys had, in everyday choice, eleven multiple items, three of which were on a Likert scale, scored from 1 to 8 (1—never; 2—once or twice a year; 3—a few times a year; 4—monthly; 5—twice a month, 6—weekly, 7—twice a week and 8—daily).
In the first survey, the target audience was members of the Portuguese Association of Electric Vehicle Users (UVE—Utilizadores de Veículos Elétricos) [61]. This institution’s mission is to promote electric mobility and inform the public about the use of electric vehicles. This association plays an essential role in the success of the adoption of electric vehicles in Portugal. It has one thousand associated members, and for this reason, it was considered a potentially attractive data source.
At the suggestion of authors J.C.F and M.S.D, we contacted a representative of the association to better understand its mission and possibilities of cooperation. Since there was an agreement between their mission and the purpose of this work, we requested them to disclose the survey on their associates’ loading and parking habits.
The survey’s decision to disclose to this group was taken because the original dataset only had Tesla vehicles. With the contribution of this community, we aimed to obtain more recent data on the same types of vehicles. Likewise, the Tesla survey, the UVE survey, was shared in the last week of February 2021, two months available to collect responses, resulting in 54 valid responses.
The second survey reached a more international and broader audience of Tesla drivers to complement the original dataset for this study that included Tesla vehicles only. Most of the Tesla vehicles of this group were mainly from before 2017 and exclusively Model S vehicles. In order to minimize this sample imbalance of Tesla Model S vehicles, an attempt was made to diversify the data by querying specific Tesla fan groups to obtain a more diverse and newer sample of new Tesla models owners. The aim was to obtain responses from owners of the newer Model 3 vehicles, which have improvements to their range from previous generations, and some occasional responses from Model Y owners; the most recent model was released in early 2020, before the CoVID-19 pandemic. The second survey’s target audience comprised the Reddit online platform subscribers, namely the TeslaMotors [62] and TeslaLounge [63] Reddit subgroups. By the end of February 2021, the first Reddit group mentioned had about one million subscribers (equivalent to the Cyprus population), and the second group had around thirty thousand subscribers. Due to the international nature of the previously mentioned Reddit groups, the Tesla survey was performed in English. Therefore, some of the original questions were removed, such as inquiring about the EV car manufacturer. This step was necessary since these two Reddit group forums were exclusive for fans of Tesla vehicles.
The TeslaMotors group had strict publication rules, prohibiting the sharing of surveys within their group. For this reason, this specific survey was limited to the Tesla Lounge group only. Conversely, several questions were added to the Tesla survey. An example was an additional question regarding the distance units used by the car. Some car owners were originally from the United States of America; thus, this specific question was added to cater to them. This survey was created at the end of February 2021, was published in the Internet and publicly available for two months, and resulted in 30 valid responses.
A third survey was created and shared with subscribers of the Portuguese magazine DECO-Proteste [64], a magazine in Portugal. This magazine has a leading role in informing and advising consumers in Portuguese about the quality and price of various types of services and goods marketed in Portugal. The DECO survey was created because of the identified need to obtain more diverse data and more participation. In addition, this survey was more extensive and sought to obtain answers on electric batteries and the degree of satisfaction that current EV owners have about the charging infrastructure operating in Portugal. There was a suspicion that the charging network’s coverage would hinder the massification of electric vehicles adoption by the public.
The dissertation supervisors contacted a representative of DECO, a journalist, and scheduled an interview. Their objective was to raise DECO awareness on the relevance and growing international interest that this topic has sparked. Before the interview, we had preparation meetings to discuss the specific questions and details of the survey, tailoring them specifically to DECO’s userbase. As in the previous surveys, the DECO canvas was also created with the Qualtrics platform. The inquiry was tested on its quality, length, and conciseness.
The survey had the following requirements: it had to be in Portuguese to satisfy DECO’s readers; it had to be shared online due to the ongoing Covid pandemic; user anonymity needed to be assured by The Qualtrics platform by not registering the answerers’ IP addresses; the questionnaire had to be completed in eight or fewer minutes for user convenience; it had to be answerable on both desktop and mobile devices to assure easy access. After the requirements were met, we had a meeting with DECO. The DECO survey was performed after the previous two and published on the last week of March 2021, with availability through a link. This link was open until the date of writing this research work (June 2021). This survey yielded ten valid responses, despite being available online for more time and published in a national reference magazine.
During the past months, several efforts have been made to circumvent the scarcity of data. The publication of an article by DECO magazine, coupled with a link to the survey, was an excellent opportunity to populate and diversify the replies of the original dataset. At the same time, it served the purpose of raising awareness in society on this subject. The objective was to obtain a substantial number of answers that can lead to more solid conclusions, which it managed to accomplish, but with modest results.

3.2. Survey Shared Questions

The three surveys followed the same structure process, although they were created in different stages of the research. The surveys had a different number of questions, but all had eleven common questions. These common questions were tailor-made and matched among all three questionnaires for future comparisons and aggregations.
The list below shows the 11 questions in common between all three surveys and the reasoning behind their inclusion. These questions were inserted into the SPSS file as variables or dimensions:
Country—This was a critical variable, which was included due to the international nature of the Tesla survey with responses from foreign users. However, it is a nominal qualitative variable, constituted as a simple list of countries—no direct relationship between a vehicle’s country and its expected mileage.
Year—A continuous quantitative variable, included due to the need to distinguish different versions of identical EVs. Its values ranged from the year 2010 to 2021. It was expected that this variable would find a direct relationship between the age of a vehicle and increasing battery degradation.
Maker—The carmaker was a nominal qualitative variable included in the UVE and DECO surveys. It was conjectured that this variable would pose some degree of effect over the cars’ mileage because most cars were from the Tesla manufacturer.
Model—A nominal qualitative variable, which collected data specific to each electric vehicle model. Similar to the previous variable, it was qualitative and nominal. It distinguishes different models such that each car manufacturer was not treated as a homogeneous group. It was expected that different models, even from the same car brand, would have different behaviors.
Charging Place—This was a nominal qualitative variable that asked people where they recharged their vehicles. Charging options included their garage, a condominium garage or a box, public charging stations, or a company’s station. This variable was expected to explain in part whether vehicles parked outside, and therefore exposed to more significant variations in ambient temperatures, had a more remarkable degradation of their range.
Freq. Fast—This categorical qualitative variable gave the respondent the chance to give one of eight answers, following the Likert scale (answers ranged from 1 to 8, where 1 meant a sporadic event, and eight a recurring occurrence). This variable asked people about the frequency with which they charged their vehicle at a fast public charging station. In Portugal, fast-charging stations are when power delivery exceeds the 22 kW mark [65].
Freq. Full—A categorical qualitative variable with the same Likert scale as the previous question. This question asked people how often they charged to the maximum charge their vehicle battery would allow. It was expected that the vehicles most frequently charged to their maximum capacity would have worse results in their range.
Freq. Empty—A categorical qualitative variable, with a Likert scale of eight answers, similar to the previous two questions. This question asked EV owners how often their vehicle battery is discharged below the ten percent charge threshold. The purpose of including this variable was to assess how this discharging practice can negatively impact the battery charge.
Parking Place—The Parking Place column sought to capture the different solutions that EV owners had found to park their vehicles during the day when they were not on the road. The purpose of this question was to find a relationship between the vehicles being parked and a hypothesized degenerative effect on their batteries’ longevity since Li-ion batteries do not fare well in extreme temperatures.
Mileage—Mileage was a nominal, continuous variable that gauges the vehicles’ current mileage, measured in kilometers. This variable was expected to have an inverse relationship with vehicles’ range.
Max Range—was a continuous nominal variable representing the maximum range of electric vehicles, measured by their owners, and expressed in kilometers. This variable was used as a dependent variable. Through linear regressions, attempts were made to find relationships between it and all the previously mentioned variables.
It was questioned if the frequency of charging and vehicle age variables would impact the maximum range, at the least. This assumption would translate into a significant diminishing effect on the vehicle range.
In Section 3, the data cleaning process reduced the Tesla dataset from 1425 initial responses to a small sample of 500 useable observations. This lower number of observations was the outcome of the removal of null values and outliers. Due to the shortage of useable observations and alternative data sources, it was necessary to conduct additional surveys to provide more data and substance to the conclusions.
Based on our literature review, a gap in state of the art was identified: few articles [6,37,66,67] referred to the degradation of batteries from the point of view of electric vehicles user behavior. In most cases, articles only mentioned the point of view of Electrochemistry. It is known that lithium batteries lose capacity depending on their use if they are not in use [68]. These drawbacks may constitute a barrier to the adoption of electric vehicles by EV users.

3.3. Survey Unique Questions

Some surveys had to include specific questions tailored to their different target audiences to their purposes:
UVE survey—this survey was prepared while thinking of a national public that is more familiar with the reality of Portuguese charging stations. Thus, their specific questions were more related to satisfaction with the current service provided by the various charging stations. In addition, it tried to know their enthusiasm for a possible expansion of the network through financing a charging station in the garages of their condominiums. Therefore, the questions included were as follows:
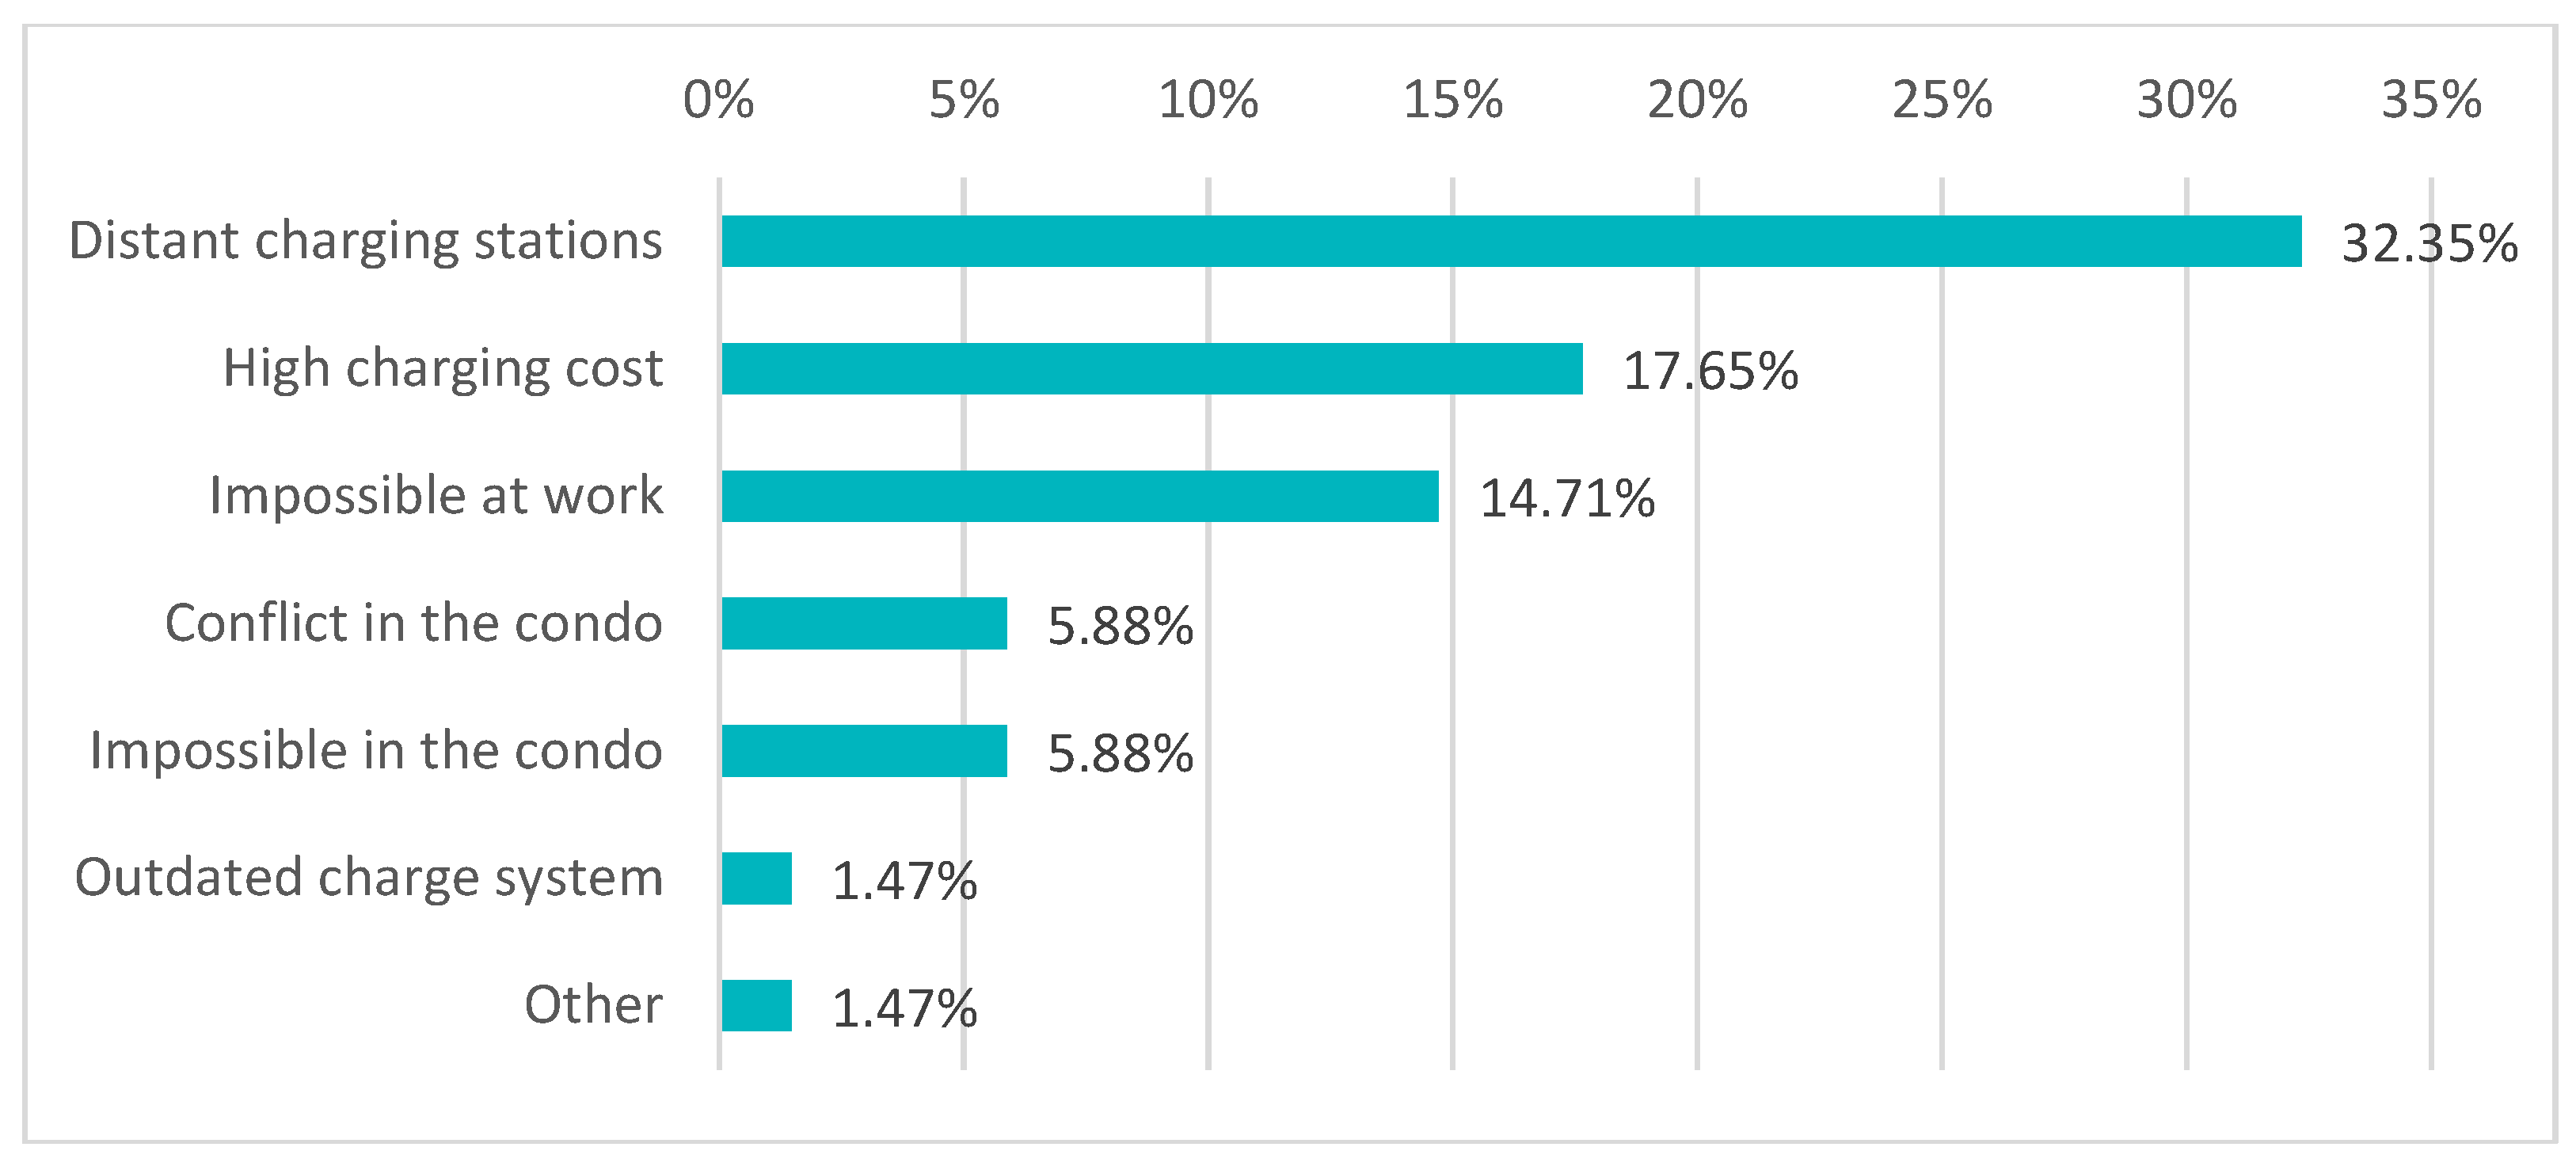
  • What are the biggest obstacles you face when loading?
  • Indicate the degree of satisfaction with the following charging options for Electric Vehicles.
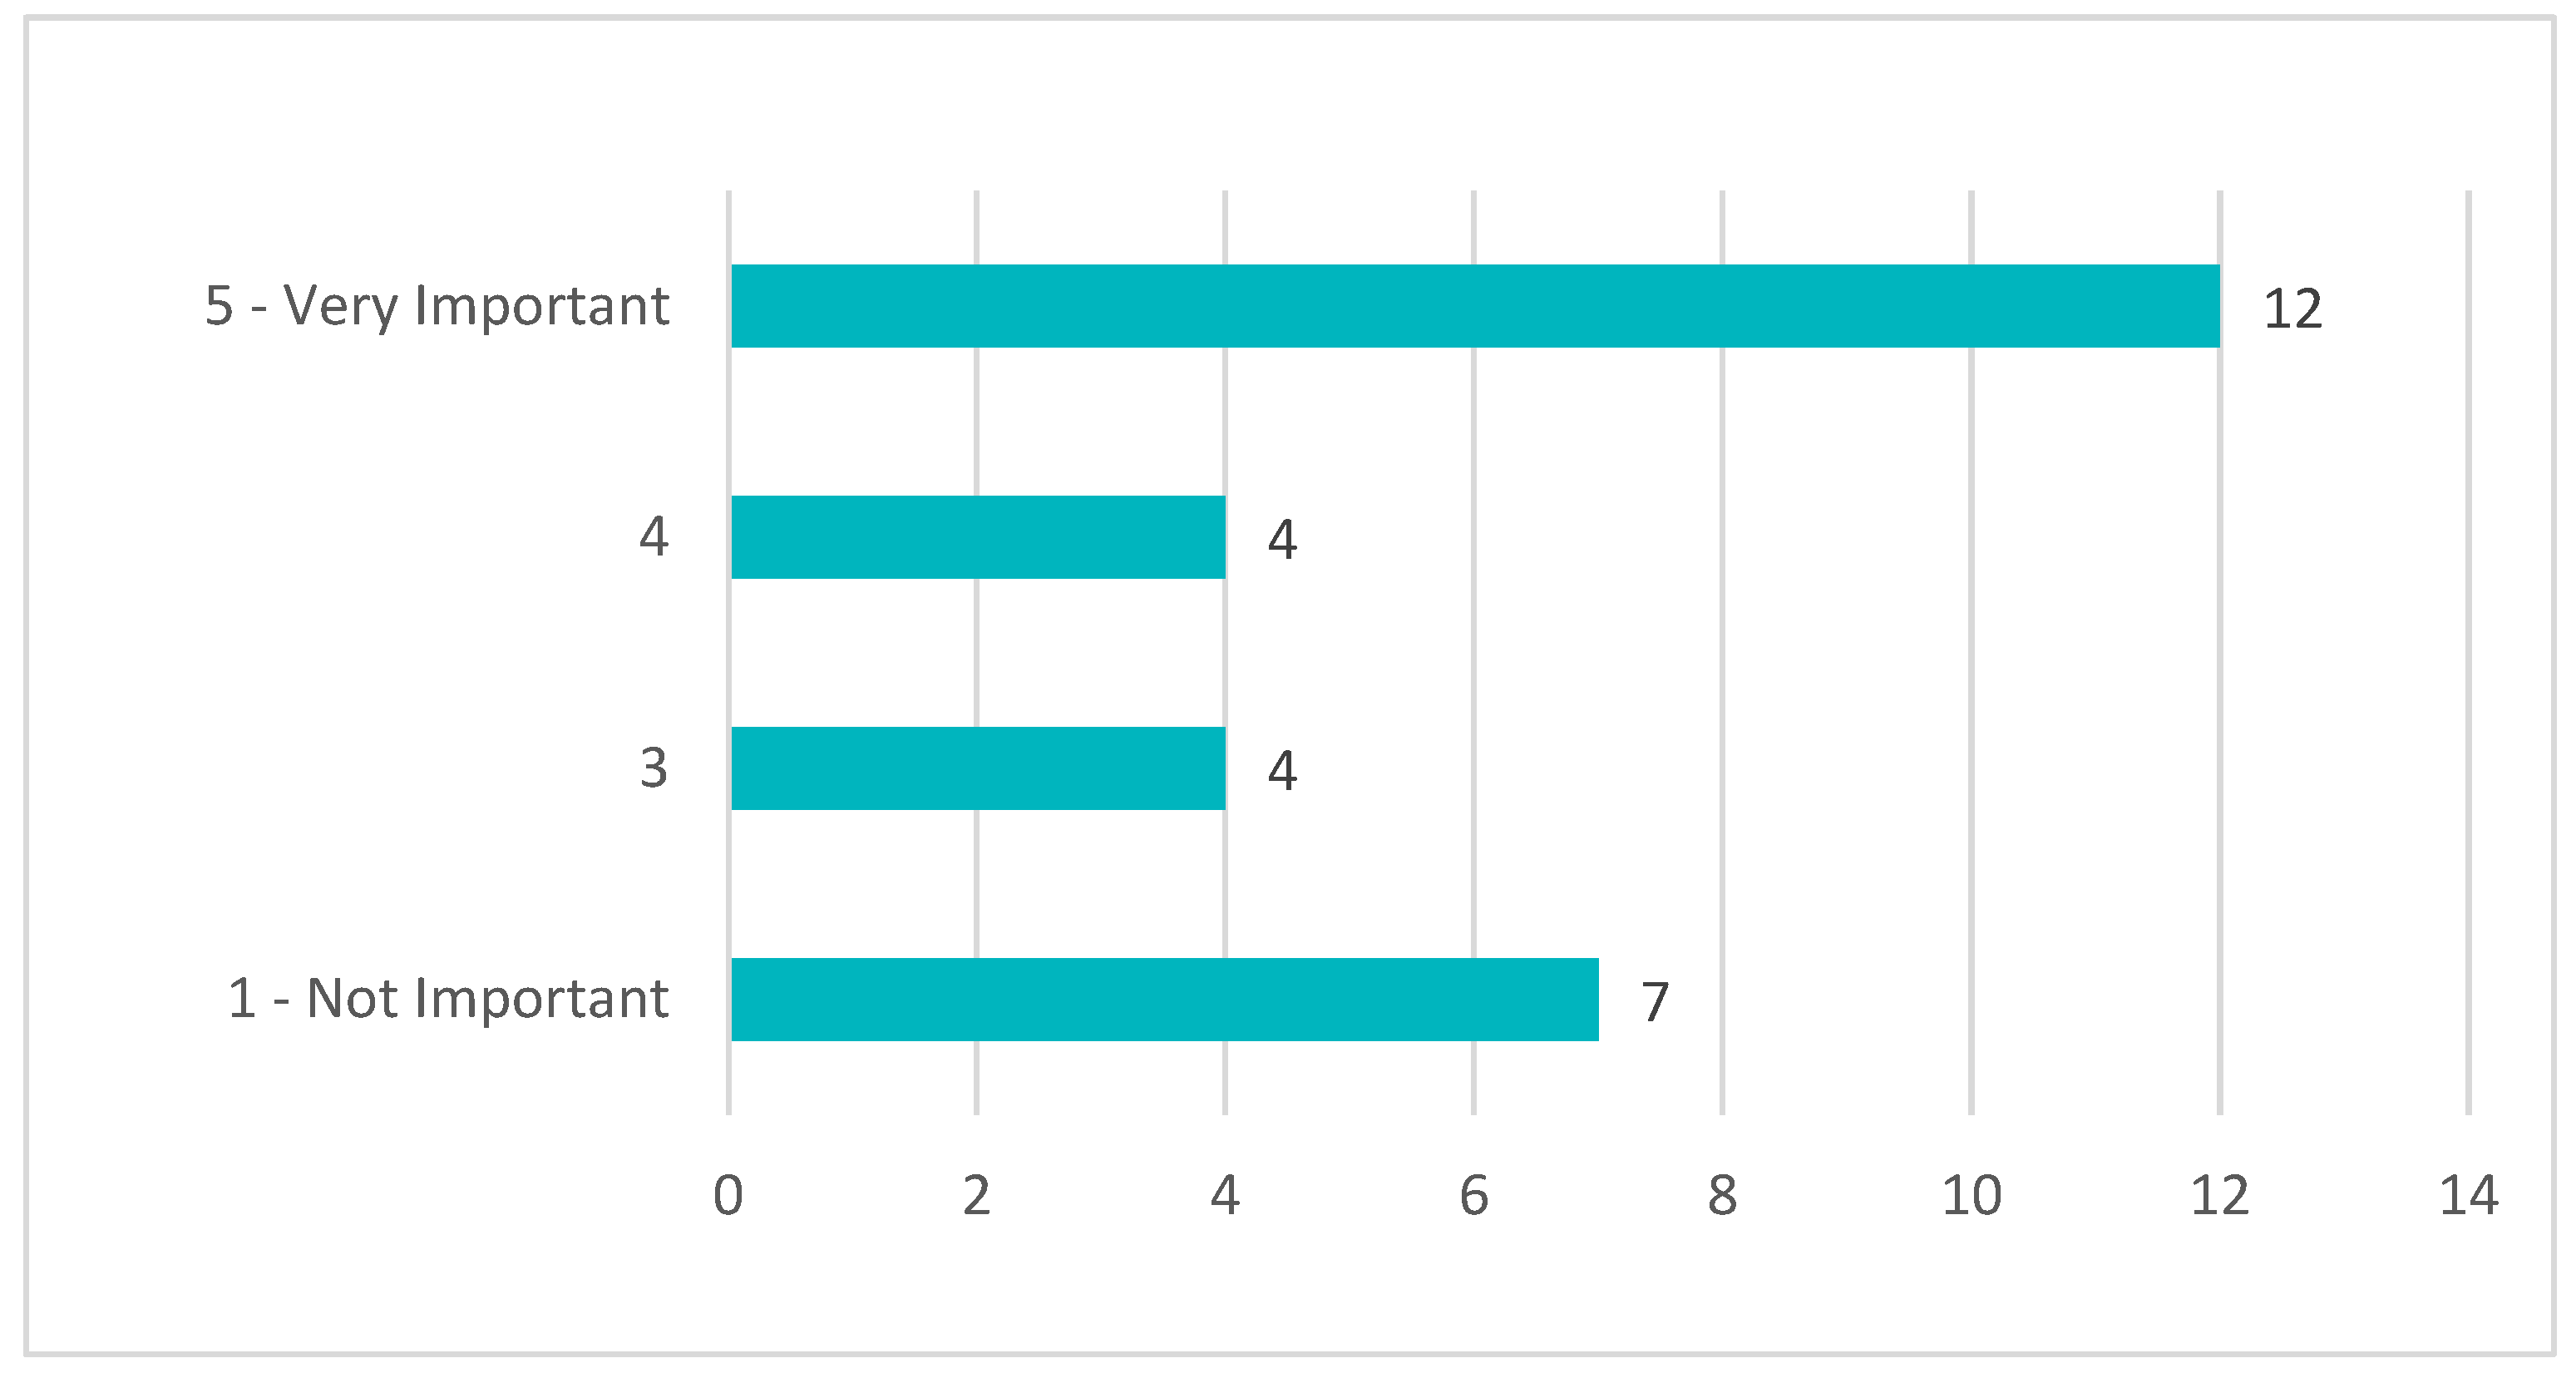
  • How do you see the possibility of having a shared charging system in your condominium’s garage with personal consumption accounting (through the condominium account)?
  • How much would you be willing to pay to install a charging system that would make your day-to-day easier?
  • How much would you be willing to pay for the monthly fee for a charging system that would make your day-to-day easier?
  • How do you see the possibility of having a shared charging system in your company’s garage with personal consumption accounting (through the company’s account)?
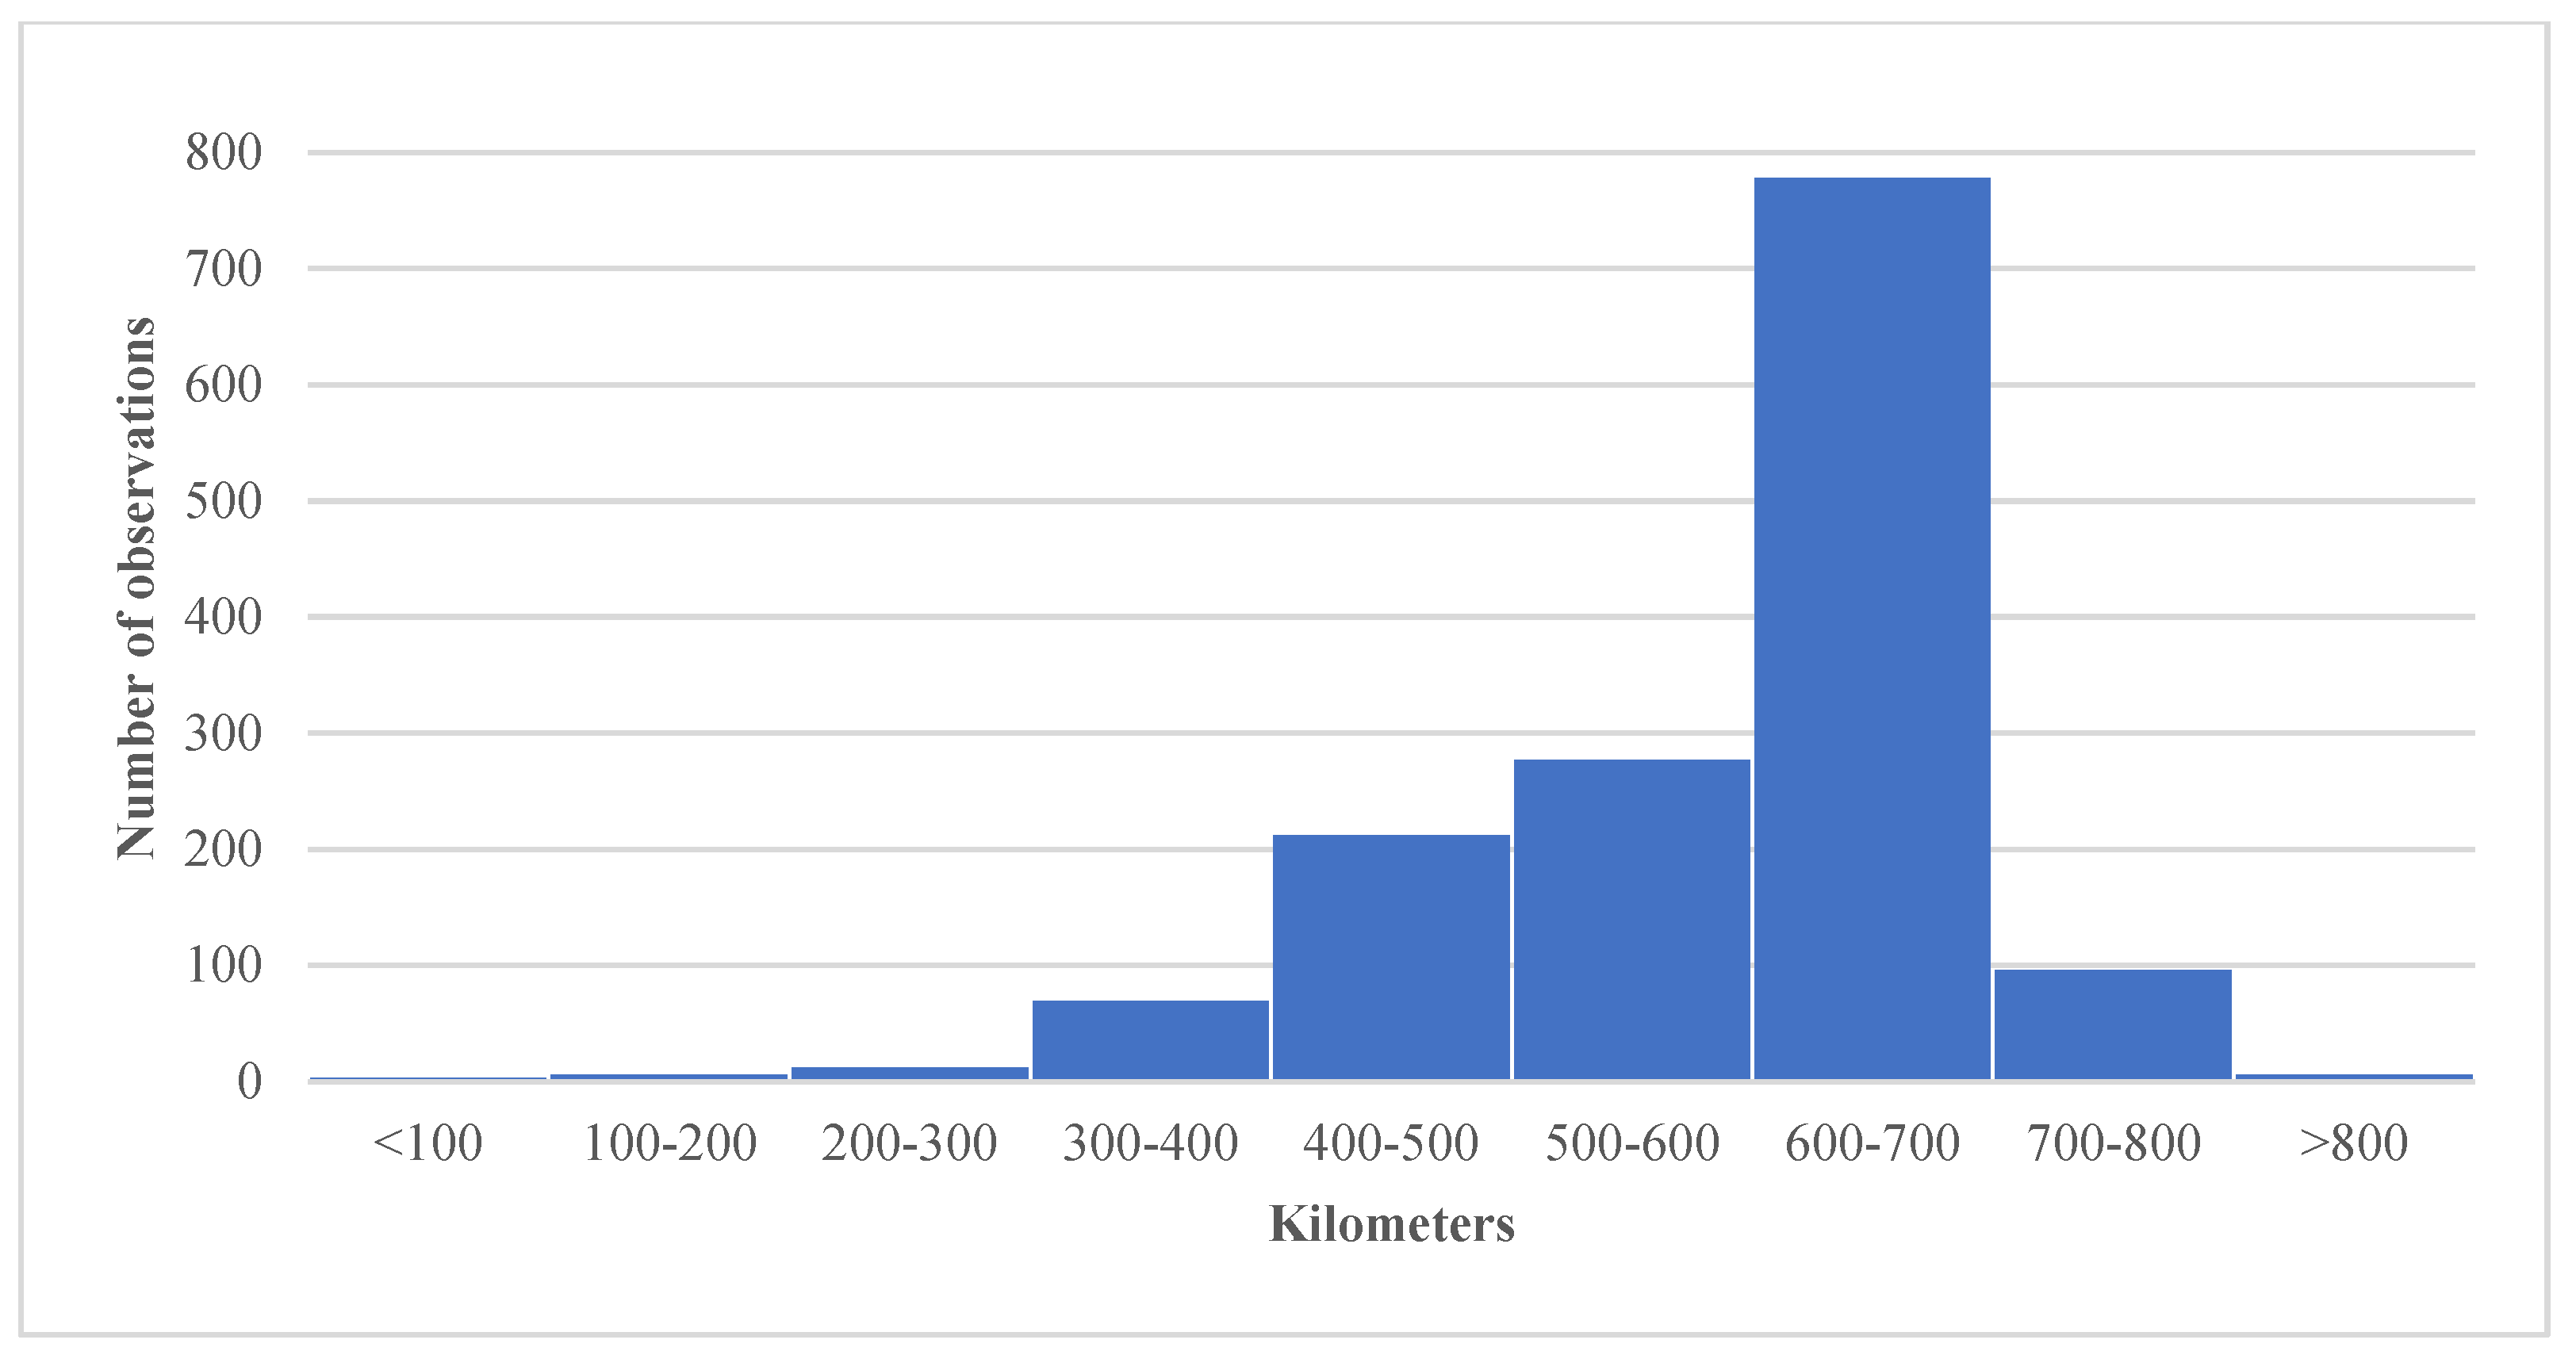
  • How often do you take the following types of trips?
Tesla Survey—The Tesla inquiry was aimed at an international audience. For that reason, there was a high probability of obtaining responses from American respondents. Hence, the Tesla survey included the following question to lead respondents to answer in their favorite measurement system: How many Miles/Kilometers does your car have, roughly? Later, unit conversions were performed in Python and SPSS.
DECO Survey—The DECO survey sought to obtain responses from a wider audience, both from enthusiastic and experienced users of electric vehicles, as well as from people who have never tried them. He also tried to capture their feelings and beliefs about this type of vehicle, particularly the advantages and disadvantages. The following questions were more opinionated than the reports of their habits or the counting of kilometers traveled with their vehicles, as in the previous surveys:
  • Do you have an electric vehicle?
  • Have you ever driven an electric vehicle?
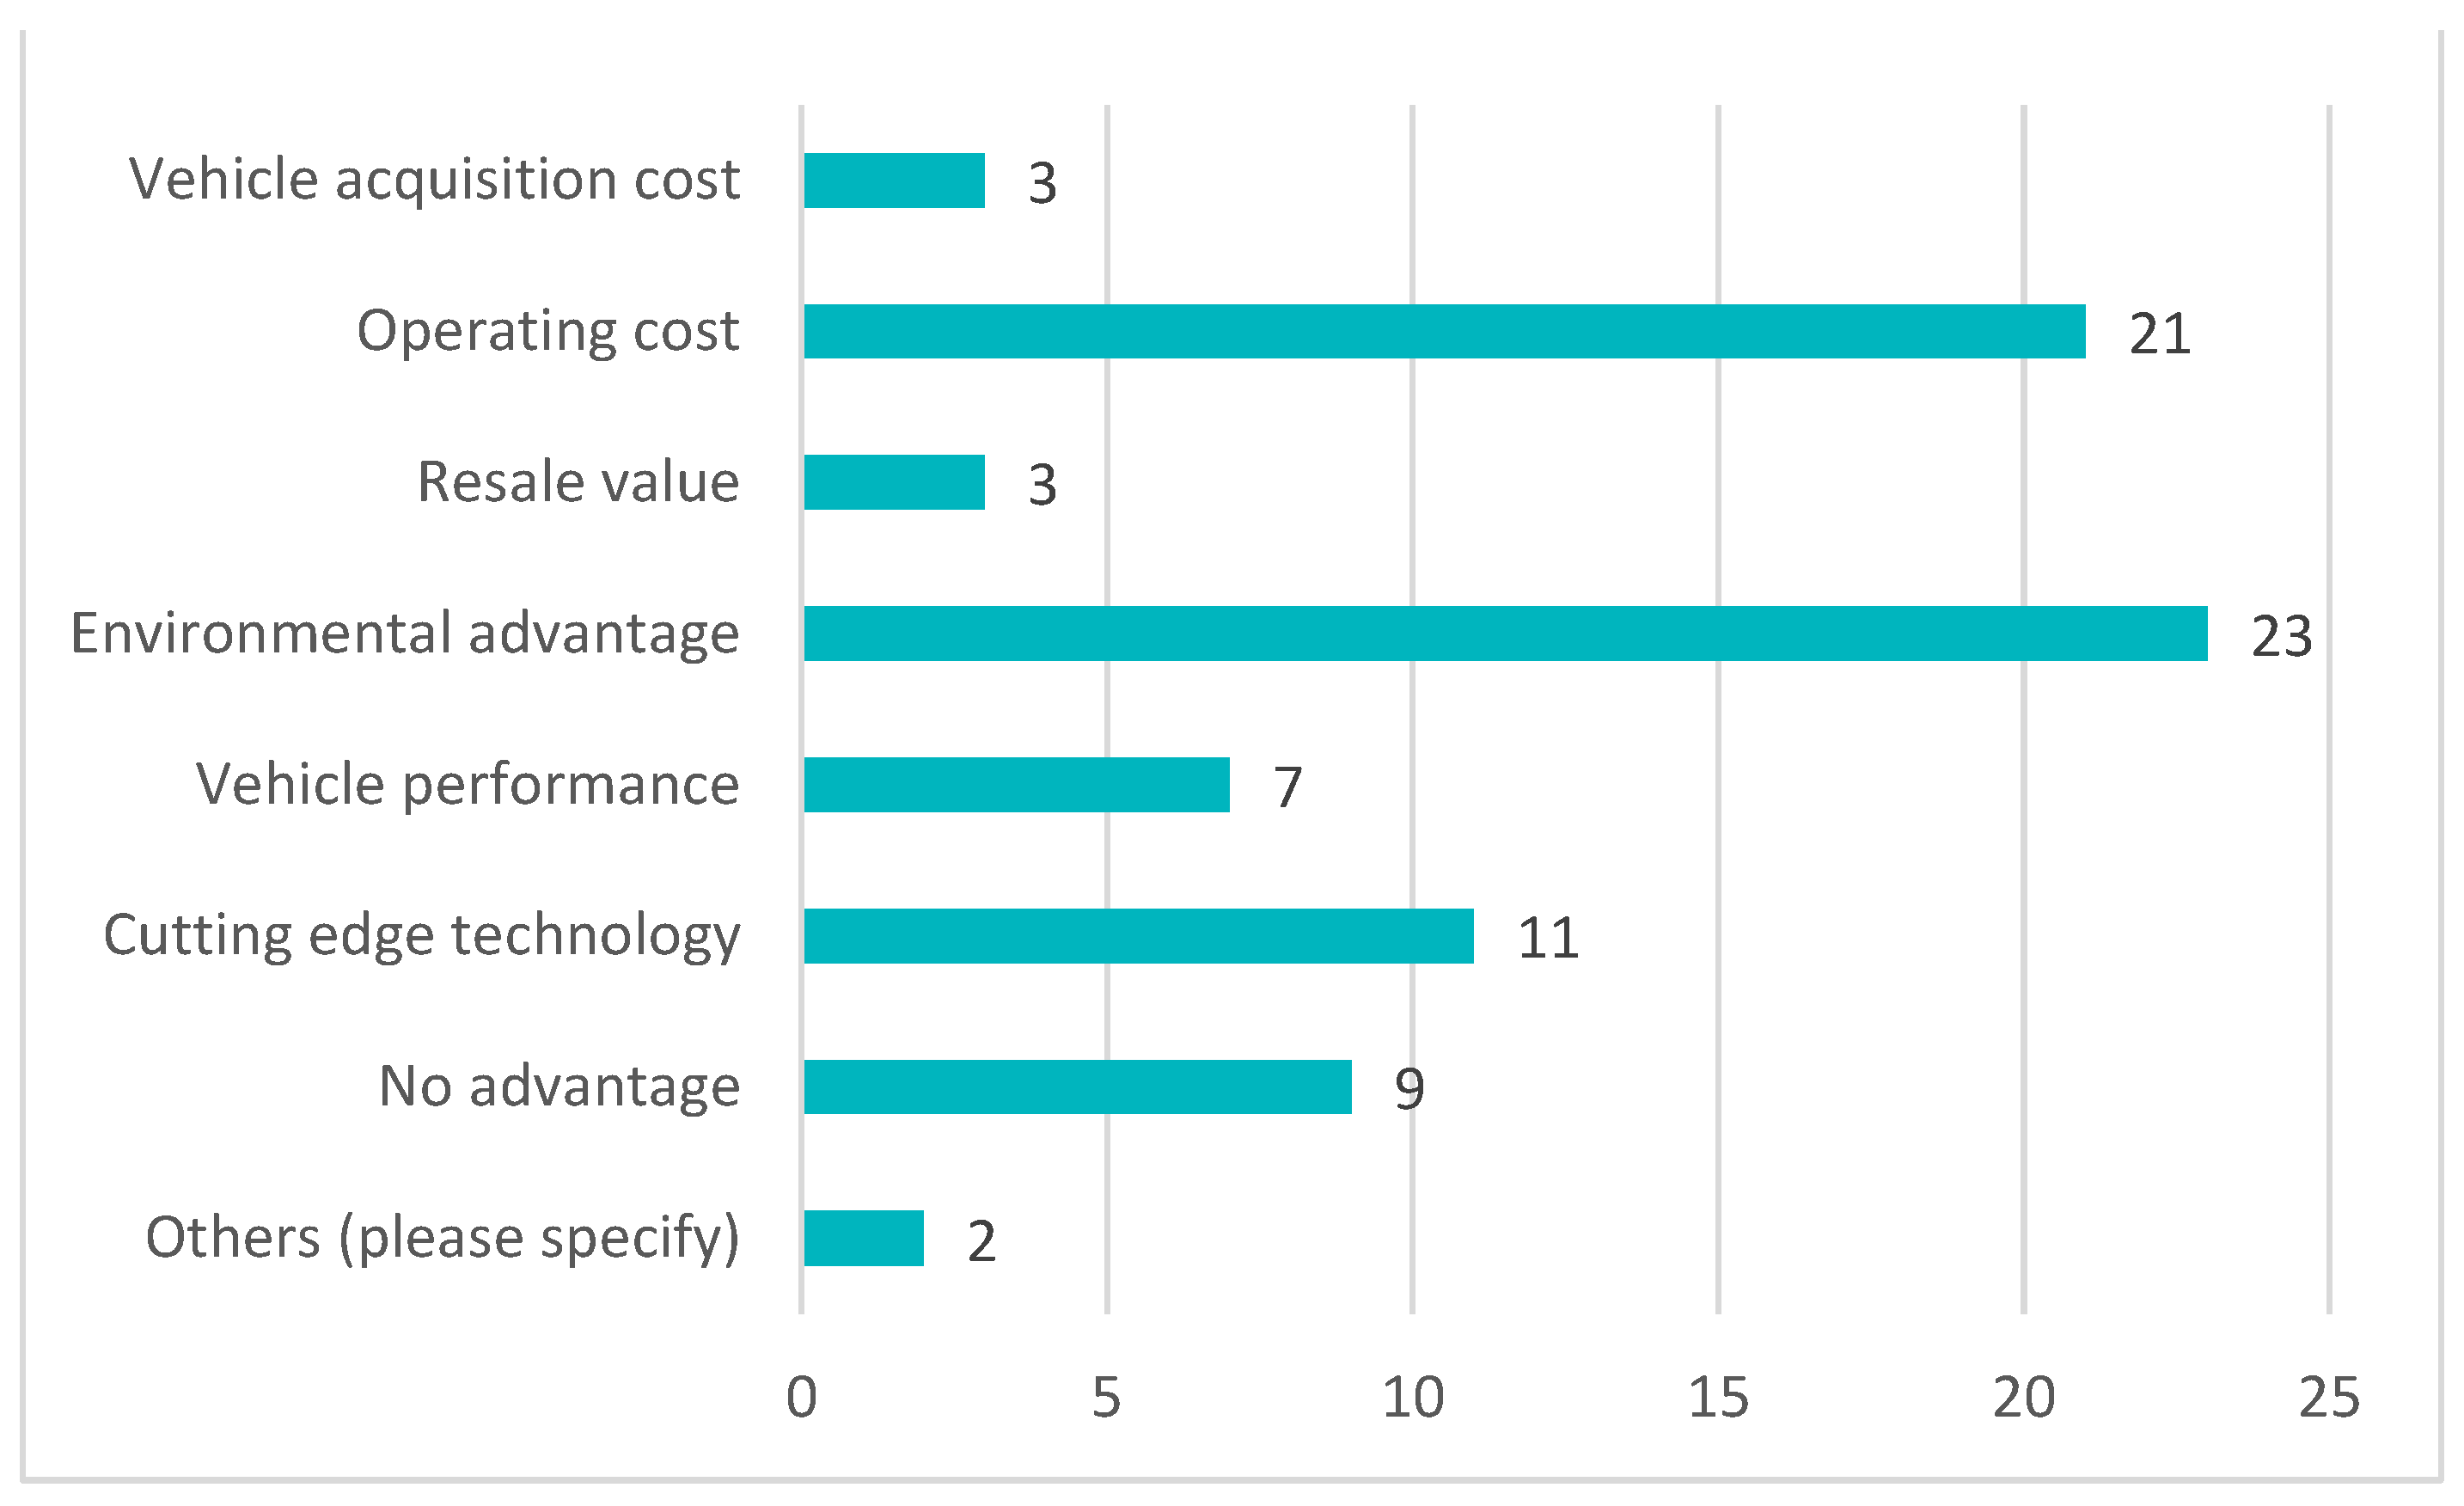
  • What are, in your opinion, the main advantages of a 100% electric vehicle?
  • Indicate your degree of agreement on each of the following statements:
    EVs are quieter than other vehicles.
    EVs have great acceleration.
    EVs are environmentally friendly because they produce zero direct emissions.
    The cost of charging an EV is less than the fuel cost of internal combustion vehicles.
    EVs cost the same as ICE vehicles.
    The technology of electric vehicles has improved, and now they have a much longer range.
    Charging EVs is difficult.
  • What is the probability that the next vehicle you buy will be an electric vehicle?
  • Please indicate the importance you place on each of the following factors when purchasing an Electric Vehicle:
    EV environmental benefits
    EV performance
    EV looks
    Number of available charging stations
    Operating costs
    Charging costs
    EV maximum range
    EV purchase cost
    Ease of buying a second-hand electric vehicle
  • What is the maximum charging time you consider acceptable in an electric vehicle (in hours)?
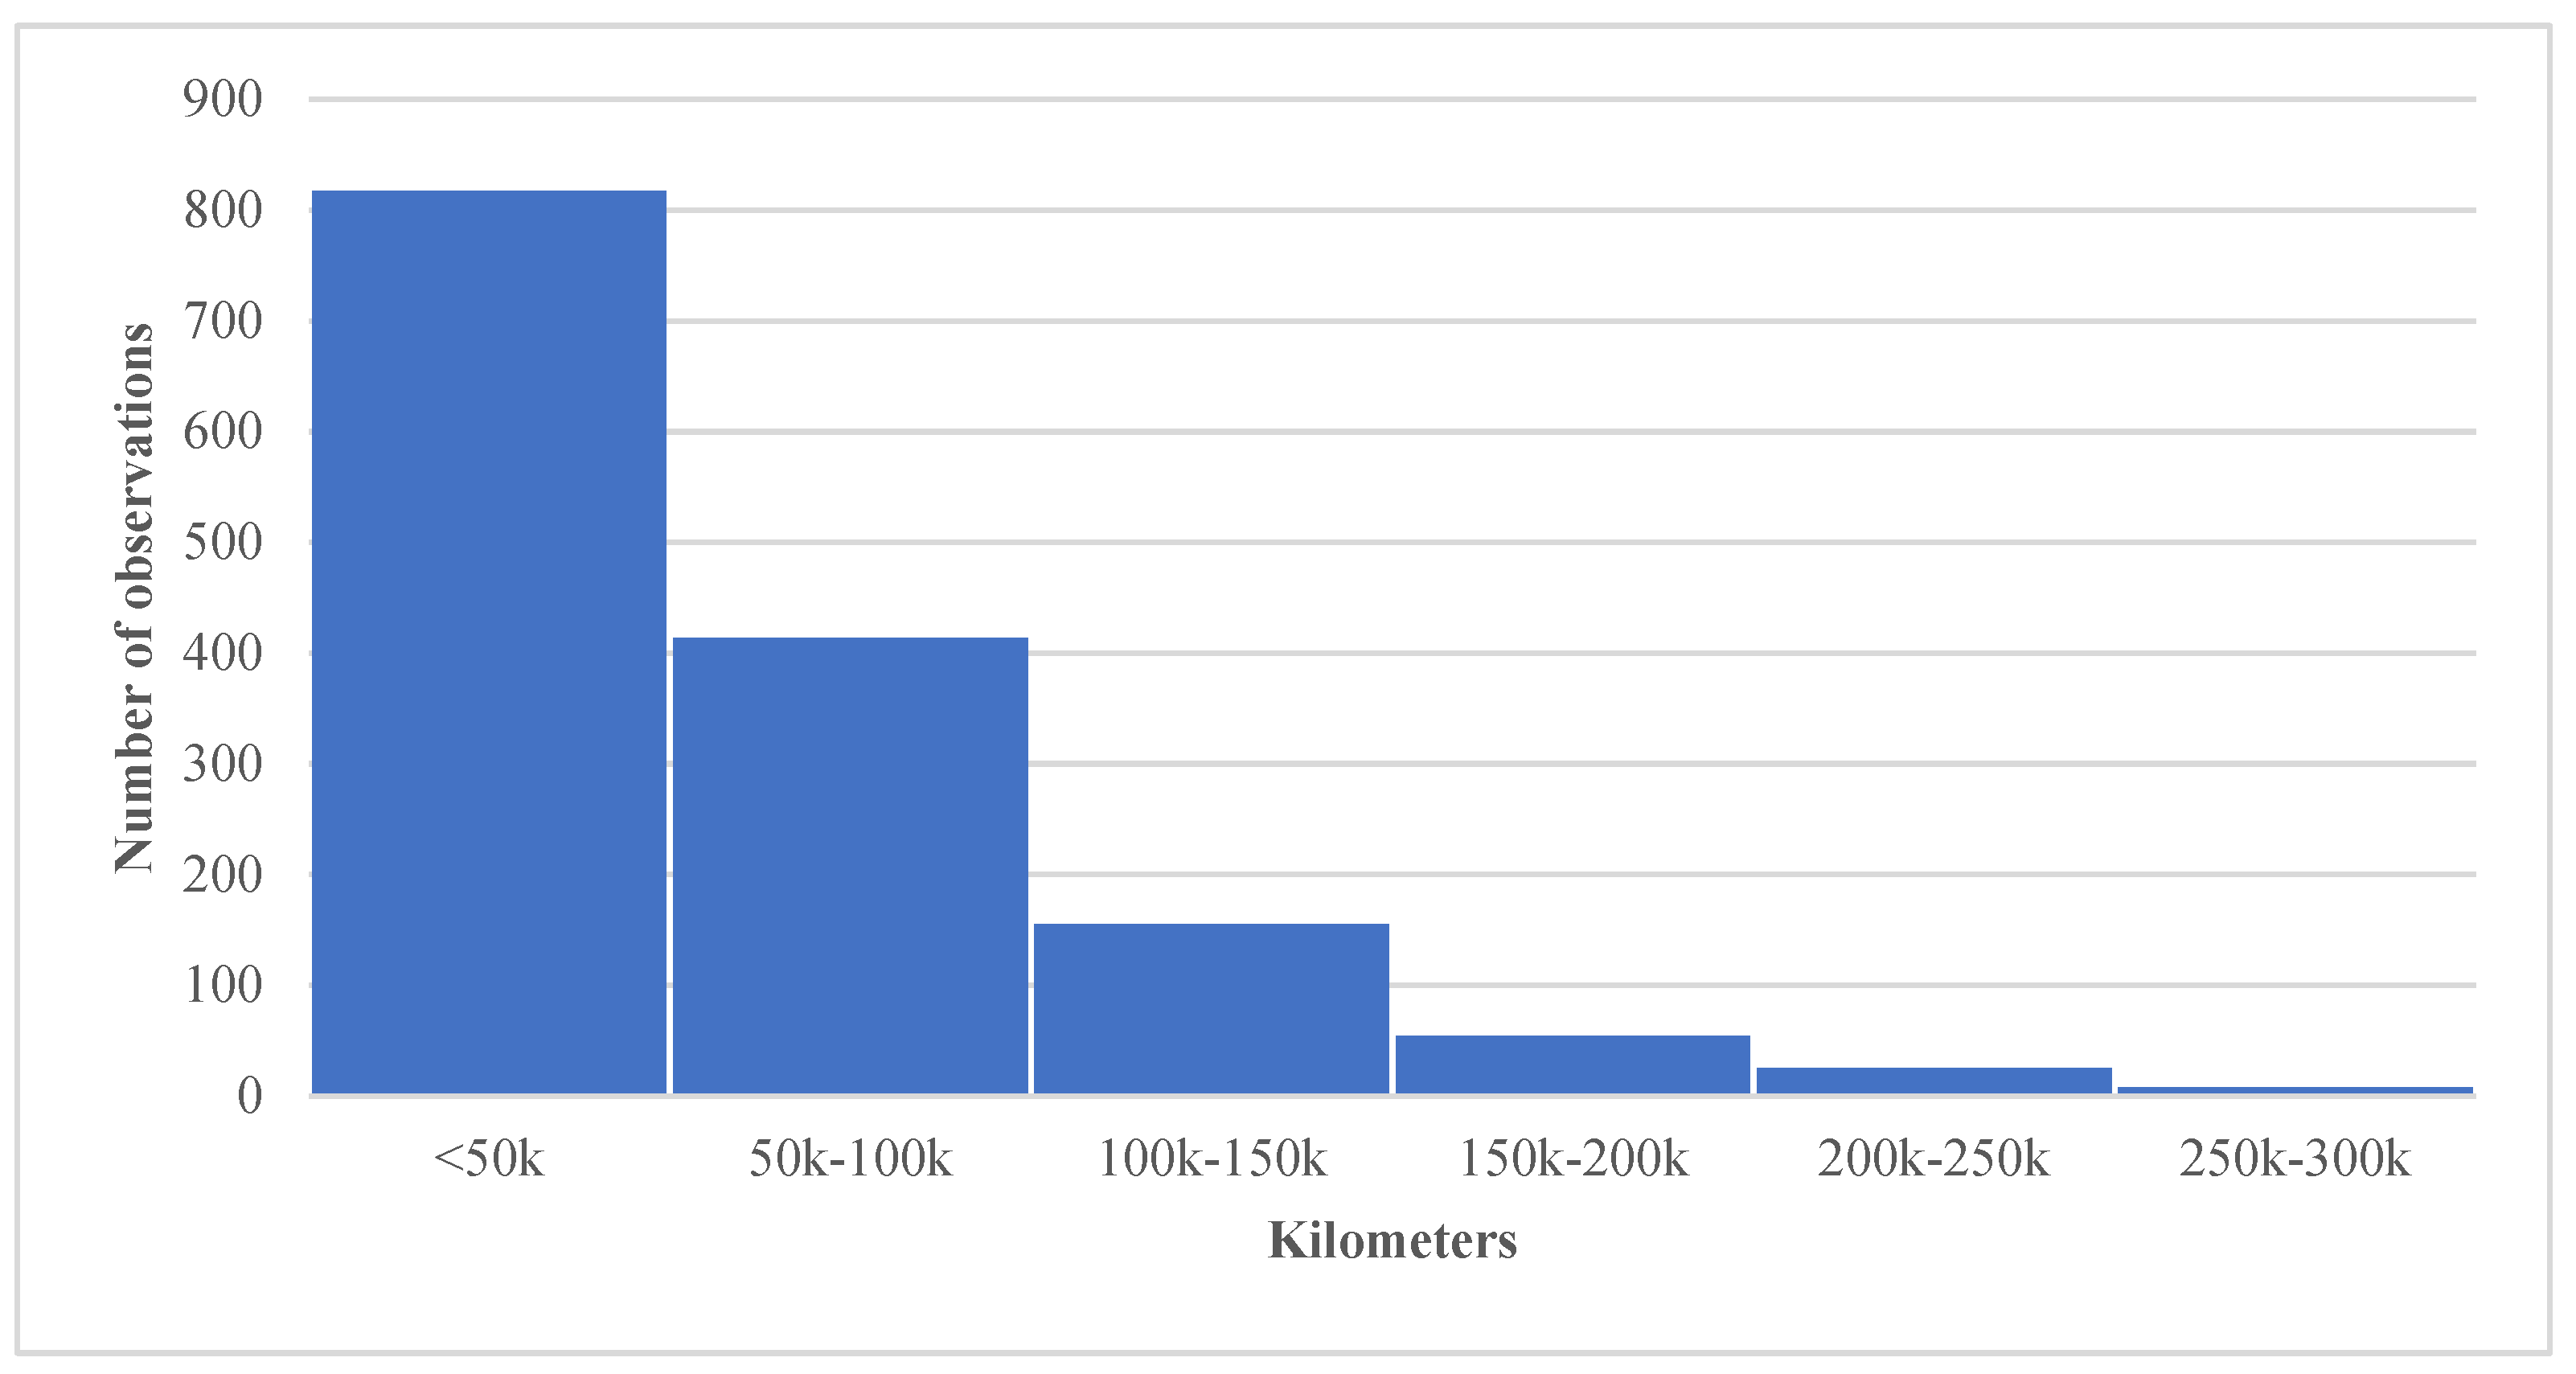
  • How far must an electric vehicle be able to travel on a single charge for you to consider buying one (in kilometers)?

3.4. Surveys Data Cleaning and Merging Process

The methodology for processing these three datasets in SPSS followed the steps before the analysis. The steps accomplished were the following:
Standardization of units and formats: Values of dates and distances appeared in indifferent units. This step focused mainly on the variable Mileage conversion from the Imperial system to the metric system.
Variable Type adjustments: Importing some variables into SPSS resulted in data type errors. It was necessary to manually adjust its type according to its nominal, categorical, and continuous data.
Elimination of null records: Some of the observations from the original dataset had missing fields. These cases were extracted without content and can be excluded from the dataset.
Removal of outliers: naturally, some values were too distant from the others, hence the need to remove them. The outlier removal process focused on the sample percentiles was also performed in Python as in the data cleaning. All observations outside the interval, formed by the 5th and 95th percentiles, were considered potential outliers and removed.

3.5. Results and Discussion

The results obtained from the three conducted surveys were focused on the topic about the EV users’ degree of satisfaction with Portugal’s current EV charging options. The results of both topics are presented in this section using a similar methodology, both performed with SPSS program, software owned by IBM, and dedicated to statistical analysis.
After obtaining and processing the data from the three surveys, an analysis was carried out on the distribution of vehicles according to their mileage.
As seen in Figure 5, most vehicles from the sample traveled few kilometers because the vast majority have a mileage below 100,000 km. This aligned with the fact that most vehicles in the sample were less than ten years old. Thus, it came with no surprise that the least populated group of vehicles were the vehicles with more mileage, in this case, with more than 300 thousand kilometers. In contrast, the most numerous vehicles were precisely the group with less mileage, which is below fifty thousand kilometers.
Regarding the distribution of the studied vehicles, it follows a normal distribution (see Figure 6). Many of the vehicles in this sample have a range between three hundred and eight hundred kilometers. This significant autonomy is explained as most of the vehicles in this sample are Tesla’s Model S, a specific model with greater autonomy than most EVs.
The distribution of vehicles in the sample by country, the original dataset has a disproportionate representation of Asia and the Pacific vehicles. This is because there are mainly vehicles from mainland China. The three surveys conducted aimed to add new vehicles to the sample and thus obtain vehicles from other continents/countries, with different ages and miles traveled. However, due to the low participation in the survey responses, this objective was not successfully achieved.
Figure 7 shows the sample composition by country. It is possible to see that the surveys carried out managed to add 28 observations to the dataset for Portugal’s country. However, this number was small due to the necessary data processing that included, for instance, the removal of outlier values and duplicates.
After studying the distribution of variables, an analysis was made of how the various variables influenced the continuous variable Mileage. Then, using the SPSS program, a linear regression was performed. According to the specifics of the problem at hand, it is the most suitable approach to measure the future values of a continuous variable. Linear regression is of the most basic types of regression in Machine Learning. Logistic Regression needs a predictor variable and a dependent variable (Mileage) linearly related to each other, and it involves the use of a best-fit line.
Linear regression is instrumental in this case because the variables are related linearly. Thus, the more significant the effect of charging, the bigger should be the battery degradation effect. In addition, linear regression analysis is particularly susceptible to outliers; thus, it should not be used to analyze big data sets. Fortunately, this dataset is small of observations, and it was cleaned of outliers; thus, it should not pose any problems. In Table 5, we can observe that many variables positively correlate with the dependent variable, Mileage. Those variables were Country, Year, Maker, Charging Place, and Parking Place.
However, there is a smaller group of variables, Model, Freq. Fast, Freq. Empty, that scaled inversely to the Mileage variable. This means the more prominent the values of these variables were, the less mileage the car was likely to achieve. However, it was not significant enough to explain the mileage variance verified on all vehicles.
Finally, one direct variable with enough significance confirmed the null hypothesis: the variable Year. This hinted that the older a vehicle was, most likely it had less available mileage on a full charge.
The model’s effectiveness was analyzed, considering all the variables shown below in Table 6.
The Max Range variable was defined as the dependent variable and juxtaposed against the remaining ones who acted as independent variables. By employing a linear regression method, results were obtained and expressed above in Table 6 It shows that the ten dependent variables can obtain an R Squared of 63.9%, meaning these variables explain two-thirds of the Max Range variability. Conversely, around one-third of the Max Range variable remains unexplained due most likely to external factors not considered.
The model summary results shown in Table 6 do not account for each variable’s weight on the model and achieve such a high level of performance. It treats all variables as a monolith. A new analysis of variance (ANOVA) test was created to determine the relative weight of each variable, which considered the variation of the R squared value. This way, it was possible to discover the change in R Squared for each predictor. All was performed without the need for extra computations and fitting every variable on a single model. Table 7 below shows in the Sig column the individual importance each variable has.
Regarding the significance of the variables studied, the Maker variable has not proven to be significant on the variability of the Max Range variable. The Maker variable reached a value of 0.52, directly below the significance threshold, as illustrated in Table 7.
The R Square Change column displays the change in R Square resulting from a new predictor (or block of predictors). It highlights the reduction in the explanatory power of the model if each of the variables is removed. It is a helpful way to assess the unique contribution of new predictors (or blocks) to explaining variance in the outcome. In the case of this sample, the most impactful variable was the variable Year.

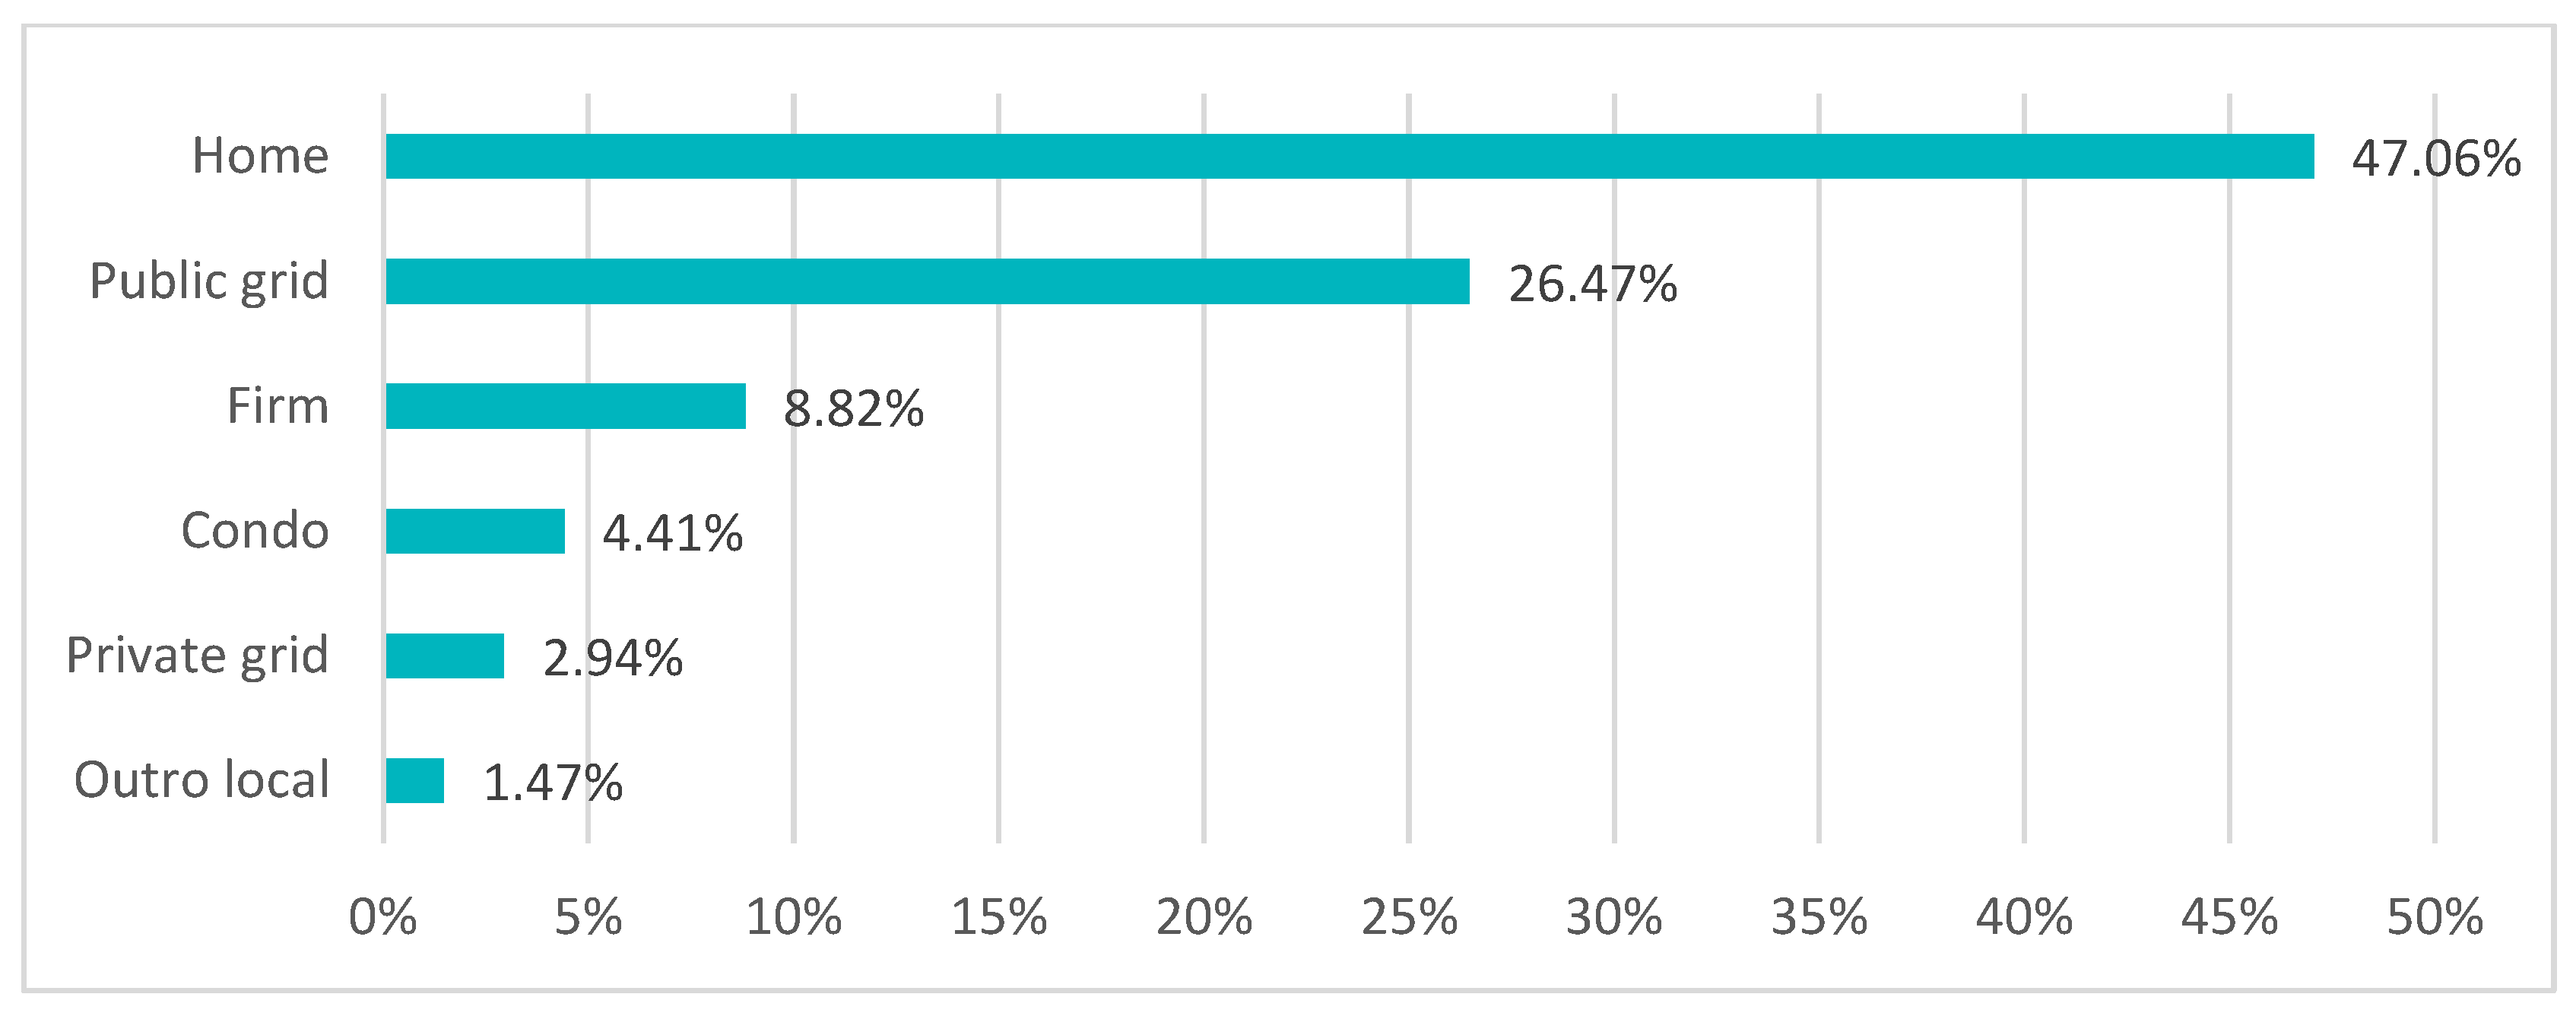
3.5.1. EV Adoption Obstacles—UVE and DECO Surveys

The UVE and DECO surveys were carried out to understand how satisfied respondents were with electric vehicles. The objective of this sub-section was to obtain data and to answer the research question— “Which factors might present themselves as a hindrance to the adoption of EV vehicles by citizens”?
A demographic analysis of the people surveyed was carried out. Ranging from Figure 8, Figure 9, Figure 10 and Figure 11 show representations of the demographic distribution results. Most people that responded to the survey were male, representing 77% of the responses.
Concerning age distribution, Figure 9 shows that nearly two-thirds were between 40 and 59 years old. The second-largest group was young adults aged between 26 and 39 years old. Lastly, adults over 60 years of age represent 14.29% of the total respondents.
The following distribution was obtained regarding the household size of the people surveyed, shown in Figure 9. First, the majority, comprising more than half of the responses received, referred to people whose households had three or more members, second came households with two elements per household, and finally, people living alone. Therefore, Figure 9 may indicate a need for more than one vehicle per household, confirmed in Figure 10.
As expected, more people per household is equivalent to more vehicles per household. Figure 10 corroborates this assumption: a majority between homes with two and three vehicles and a small minority of households with only one vehicle.
This survey showed that the public is becoming sensitive to environmental issues. For instance, in a multiple-choice question on the main advantages of an electric vehicle, the most voted answer (23) was the environmental advantage (see Figure 12). The second most selected answer was the low operating cost that an EV has. These results are encouraging because they suggest a will for EV adoption and savings opportunities for the consumer. Opposite to this trend, a minority of nine people responded that EVs do not have any advantage over internal combustion vehicles.
Figure 13 below reports the main difficulties that current electric vehicles users face during the daily operation of their vehicles. The most frequent problem was the great distance to the charging stations (public and private networks). It indicates a significant deficit in national infrastructure. “Range anxiety” is a frequent problem mentioned by the scientific community [69,70], referred to as a source of stress due to the combination of reduced autonomy with inefficient charging stations network.
Second, the high price of these stations was indicated as an obstacle. However, it is impossible to confirm with the surveys which would be a more suitable price for Portuguese consumers. It was also not mentioned on which of the available charging networks these costly charging sessions were made.
Third, 15.38% of the users indicated the impossibility of loading EVs at their workplace. This indicates that Portuguese companies still resist transitioning to EVs and providing the necessary charging infrastructure to their employees. Instead, companies should install electric charging stations in their car park facilities, and municipalities should install stations in nearby car parks to office buildings.
Other inconveniences reported were conflicts in the condominium, which indicate a lack of conditions for installing this type of infrastructure in Portuguese condominiums. The prominent loading locations preferred by UVE members are presented in Figure 14. Half of the respondents prefer to make their shipments from home. Allied to the previous graph, which denounced a considerable distance between charging stations and perhaps an insufficient national coverage, this preference for domestic charges is not surprising. The second largest group preferred to upload in the public network, Mobi.E network, which has a greater expression in the country.
There is a preference for collective solutions, such as loading at the firm (8.82%) and the condominium garage (4.41%). However, these solutions still show low levels of adherence. The least used solution is charging in a private network (2.94%), with few users. The Tesla network, an example of a private grid, has few charging stations in Portugal. For example, when this research work was performed, there were no Tesla charging stations operating in the country’s two main cities, Lisbon, and Oporto. Despite that, it has eight stations that allow the country’s crossing from end to end with Tesla vehicles.
Drivers’ driving habits can perhaps explain the preferred use of charging at home. Most drivers travel short distances. Figure 15 below shows that most drivers (61.76%) make daily trips less than 50m in length that may be the commuting route from home to work. For this reason, in the survey, most expressed the need to have a charging station close by, and in the absence, they preferred to charge their vehicles at home.
Regarding the users’ satisfaction with the existing charging solutions, the consumers’ preferences are represented in Figure 16. In first and second places are Mobi.E network (20.41%) and its Miio application (19.39%), an optional service, followed by the recent charging network of the Continente group and by other undifferentiated service stations not belonging to any of the leading suppliers (16.33%).
Figure 16 below represents users and their degree of satisfaction with the country’s different available charging station networks. Again, most users were disappointed with the quality of the charging stations networks, and only a tiny minority is happy or does not use them at all.
Below 7% are the least popular options in this study: the Tesla-branded charging network, private charging solutions at home, collective garage solutions, workplace solutions, or startup ChargeSurfing’s app.
There is a relationship between the number of charging stations that a network has available to its customers and its popularity: the Mobi.E network, the most popular solution, has 2390 charging stations in mainland Portugal [71], the most significant number of stations per network. In addition, there is also their proprietary application, the Miio app, which allows users to locate charging stations. Furthermore, the Miio app informs users in real-time about whether the station is available or has any impediment, such as breakdowns or users occupying the station. In addition, the application allows the user to make payments and integrates all steps in the same platform as an extra convenience.
Respondents’ second most popular option is the Continente network, the solution with the second broadest national coverage, with roughly 27 charging stations operating throughout the country, strategically installed next to Continente supermarkets.
Tesla’s network has the lowest coverage of all the networks listed and has only eight superchargers operating in the country. This number of Tesla chargers may seem low, but the spacing between them is enough to drive across the country, both transversely and longitudinally. In addition, Tesla has a network of partner stations compatible with Tesla vehicles, called Destination Chargers, usually located in hotels and supermarkets to complement the superchargers, but with the added drawback of providing a lower voltage and thus a slower charging speed.

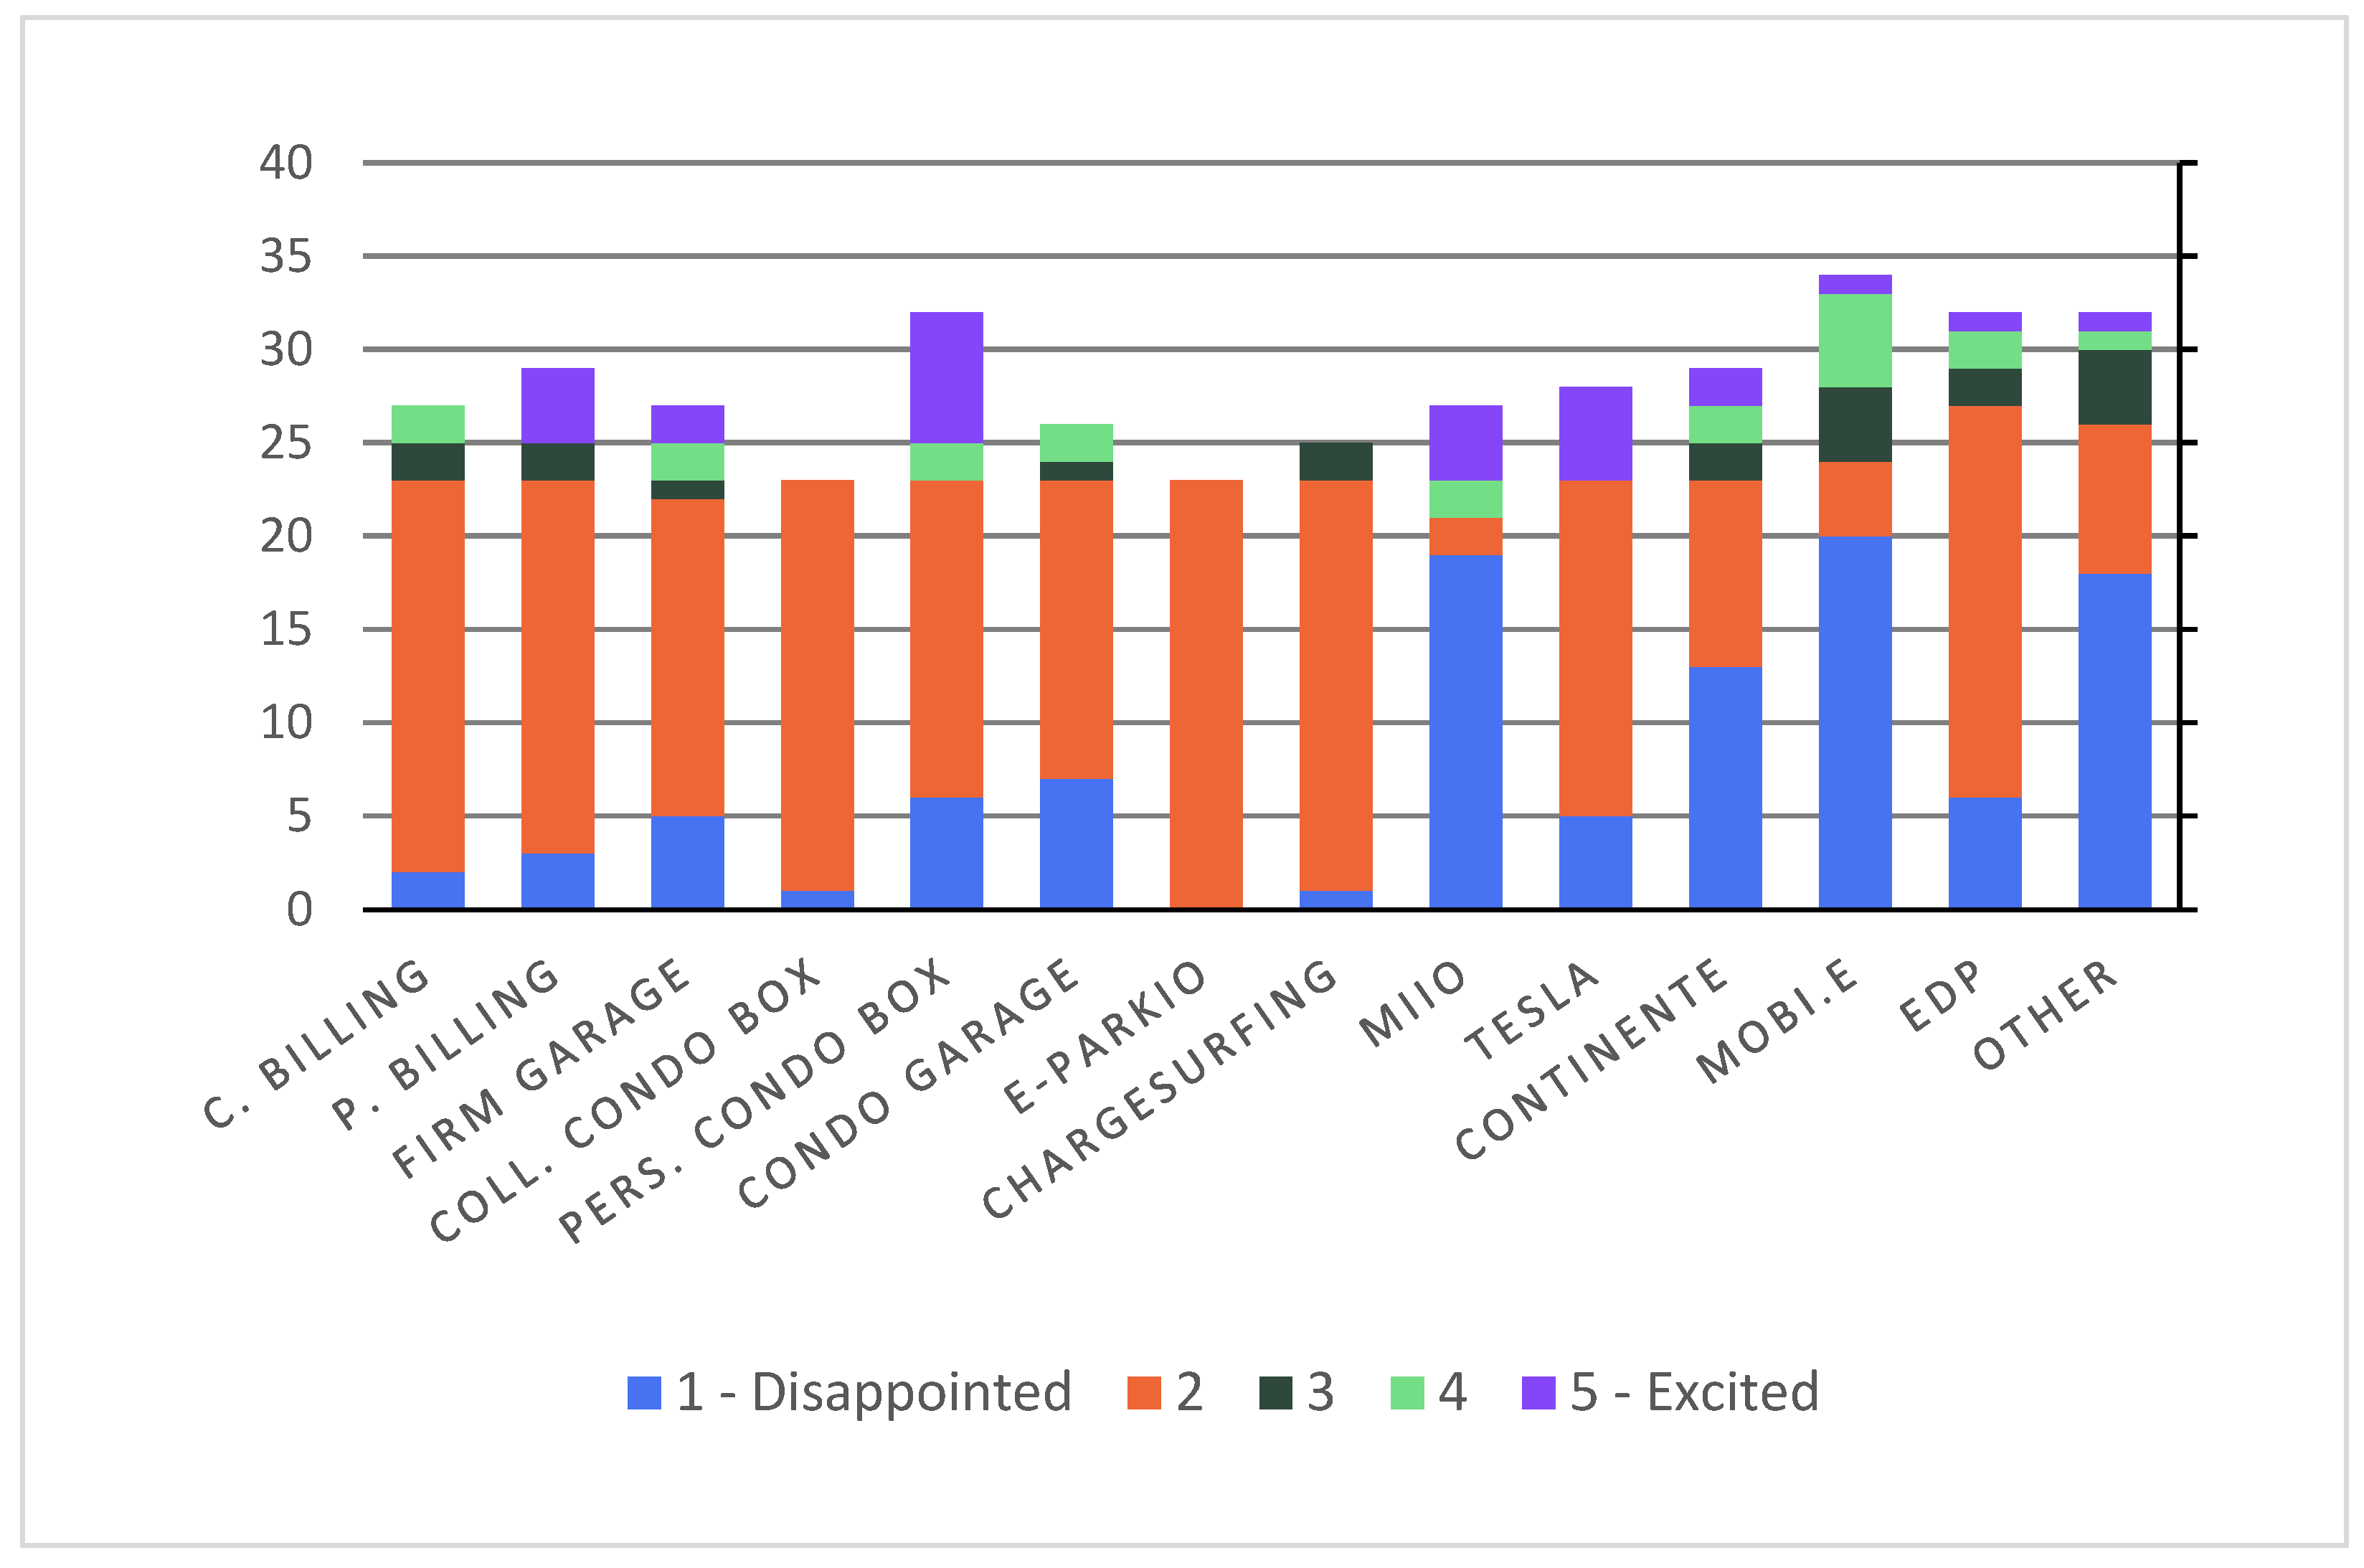
3.5.2. Potential for Expansion—DECO Survey

DECO asked us to include a different subject in our study, tangential to this dissertation’s topic and to document the respondents’ answers: EV owners’ opinion regarding the current service provided by the Portuguese EV charging networks, their acceptance of future network coverage expansions, and an overall improvement of the user charging experience. These different topics do not aim to answer any of the two research questions. Instead, they were included as a compromise to obtain our survey published to their subscriber base.
Regarding the attractiveness of the existing network expansion, Figure 17 shows that most survey participants expressed a high interest in having a shared charging system installed in their condominium’s garage. All that had a positive feeling were added to this first group. People with a favorable opinion represent most reported cases, meaning they had a greater interest in adopting this domestic solution. However, the second biggest group voiced no significant interest in receiving this technology for unspecified reasons. It can probably be because of this offshoot of people charging their EV cars elsewhere, other than their homes/condominiums. Still, it is worthy to mention the interest this solution raised among the respondents. Furthermore, it tried to quantify this interest in costs for users.
Another common topic among respondents was the importance that people gave to charging stations in the vicinity of their homes. In Figure 18, most people responded positively to this question, suggesting a need to be fulfilled to potential buyers of EV. It confirms the previous Figure interpretation that EV owners of this sample are charging their vehicles more at any charging station near the condominiums. This outcome indicates considerable interest in the expansion and densification of charging networks, notably in public roads.
Next, people were asked what monetary amount they would consider acceptable for installing a charger in their condominium garage, regardless of other existing factors. Most respondents (46%) replied that they would not accept to pay any amount. This response had a dominant expression and was expected when the survey was launched. However, these answers may be related to multiple factors that the DECO survey did not predict, such as the economic situation of respondents or simply a pure lack of interest in the announced solution. Thus, we are interested in analyzing the people willing to pay for this service, representing 54%. A smaller group of 31% declared that they would accept a one-time expenditure of up to 200 euros, and a more favored minority declared willingness to pay above 1000 euros, as shown in Figure 19.
Nevertheless, the installation of a charger is one of the expenses involved. It is also necessary to account for the monthly cost of its everyday use. This cost is a monthly fee that each owner must pay for the service maintenance. Responses to the following survey question, “How much would you be willing to pay for the monthly fee for a charging system that would make your day-to-day easier?”, show that most people do not want to pay again for this service. Only a third of people declared that they would accept to pay a monthly fee, according to the distribution made in Figure 20 below.
Furthermore, only 5% would agree to pay more than €40 extra per month. This reluctance in spending makes it challenging to accept the service as a first step.
Following this descriptive statistical study, a search was performed between all variables for strong, positive, and statistically significant correlations. To this end, several correlations were found that can attest to the potential and market to expand the current EV station coverage.
The first correlation found was between the Indoor/Outdoor variable, a new variable created through feature engineering, and the variables Importance: of EV maximum range, Agreement: Charging EVs is difficult, and Importance: number of charging stations.
The Indoor/Outdoor variable expresses in percentage the probability that the user prefers to charge at public stations rather than at home. Values of this variable closer to zero represent a greater appetence to charging the car with solely domestic solutions (wall chargers at home or the condominium). In contrast, values closer to 1 represent the probability of using domestic, public, and private charging solutions.
In Table 8, the model summary compares the dependent variable Indoor/Outdoor against all its predictors. SPSS reached an R Squared value of 0.444. This value means that the model had a positive and moderate correlation and can explain 44.4% of the variability between its independent and dependent variables.
By analyzing variance (see Table 9 below), the model reached a significance or p value of 0.012, a value below 0.05, which confirms it is statistically significant. A value of 0.012 signals evidence against the null hypothesis (that the variables are not correlated), as there is less than a 5% probability of being correct. Therefore, the null hypothesis is rejected, and the alternative hypothesis is accepted (the dependent and independent variables are correlated).
After experiments, we found another correlation between a dependent variable Importance: having a shared charging system, and the following variables as independent ones: Age distribution, Agreement: Charging EVs is difficult, Agreement: EV charging cost is low, Frequency of trips between 50 and 100 Km per day, Frequency of trips up to 50 Km per day, Frequency of trips with more than 100 Km per day, Gender distribution, Importance: EV maximum range, Importance: operating costs, Importance: operating costs, Maximum acceptable charging time for an EV (Hours), Number of elements per household, Minimum range in kilometers to consider buying an EV and lastly Number of vehicles per household. With this selection of independent variables, this model obtained an R Squared of 69.0%, suggesting a positive and strong correlation, as shown in Table 10.
As with the previous model, it is necessary to analyze its variance to determine whether the results of the surveys are significant. In addition, we need to know whether we reject the null hypothesis (whether the predictor elements explain the dependent variable) or not. The results of this analysis are shown in Table 11 below.
As shown in Table 11, the analysis of variance obtained a p value of 0.019, and therefore below 0.05, which allows us to confirm that this model has a positive, strong, and significant correlation.
It is possible to gauge which variables had the most significant weight in the correlation found. Studying the coefficients represented in Table 12 makes it possible to determine which variables are most important. However, only two variables from this model were statistically significant, with a significance value below 0.05. These variables were: Agreement: EV charging cost is lower and 100 Km per day and Frequency of trips with more than 100 Km per day.
Therefore, this allows us to state that respondents’ importance to having a joint charging system is even more significant as they agree that EVs are cheaper to use than internal combustion vehicles. Moreover, this seems more critical; the greater the frequency of trips a person makes corresponds to a longer distance of more than 100 km a day.

4. Conclusions

This research work aimed to identify the main behavioral factors that impact Li-ion battery performance by studying everyday human actions when interacting with EVs. Based on the three surveys created, it was possible to conclude that charging and parking habits are negligible at best and may even be irrelevant, at least for the sample of EVs (Electric vehicles) studied. Furthermore, charging habits did not negatively impact the batteries’ longevity as initially speculated. The results have shown that the cars’ increasing age is by far the most significant variable. Vehicles from this sample who were regularly fully charged did not display a significantly lower max range than the other vehicles that avoid that practice.
The research question focused on the lack of EV massification in Portuguese society. Its objective was to ascertain the factors that may be present and hinder EV adoption by citizens. To this end, the respondents of the three surveys were asked questions that sought to measure their degree of satisfaction with the current electrical charging network in Portugal, identify the main obstacles they encountered while using these charging networks, and measure their acceptability in funding the installation of smaller chargers in their condominiums. First, the results from the statistical analysis showed that the users were satisfied with the service quality provided by Mobi.E network. Second, the main obstacles pointed out were the long distance between public and private chargers. Finally, a large portion of the EV userbase was willing to fund in part the installation of chargers in their condominiums.

Contributions

This paper sought answers to the research question: RQ— “What are the factors that present themselves as barriers to the adoption of EV vehicles?” The question was answered by analyzing the Tesla dataset and the three questionnaire results. It was shown in Section 3.5.2 that the most significant variable for this disappointment was the high distance between charging stations.
Concerning the literature review conducted in Section 3, the work clarifies that only one scientific paper [6] quantified the battery degradation from the drivers’ charging and operating habits of this type of vehicle. Most of the papers collected by employing the PRISMA methodology were centered around the electrochemistry field of expertise. These studies focused primarily on physical factors the batteries were subjected to, such as voltage, materials composition, and the varying range of temperatures.
During the research, it was possible to reach several conclusions that challenged some initial questions we had. First, the question of a higher frequency of using a fast-charging station harms the vehicle’s range was questioned. Likewise, the assumption that the frequency with which drivers allowed the batteries to charge to 100% or discharge below 10% would each hurt autonomy was also challenged. For the sample studied, these two theories seem to have had no adverse effect on battery autonomy. The effect of these three categorical variables (Freq. Fast, Freq. Full, and Freq. Empty) was unexpected, as it was anticipated that they would affect full range to some degree of significance. Instead, the values of these three variables in this sample seemed to disprove that belief. Finally, the idea that Li-ion batteries in EVs degrade in the same way as cell phone lithium batteries after several years pass by or after several hundred cycles are completed seems to be refuted. Additional evidence on this will be needed to draw definitive conclusions.
Conversely, the research allowed to state that the price of EVs is the main factor preventing the purchase of these types of vehicles. However, while the price is a vital factor since EVs and ICE cars have not yet reached price parity, it was found that there were other factors at play, specifically the EV’s short-range and the high distance between charging stations. These observations can be confirmed in Section 3.5.2, where a correlation was found between the following questions: 1—EVs cost the same as ICE vehicles, 2—EVs have great acceleration, and 3—The cost of charging an EV is less than the fuel cost of internal combustion vehicles, and the probability that the respondents’ next car will be an EV.

Author Contributions

R.R. performed all state of art, survey definitions and implementation. V.A. performed all management interfaces and contributed to the writing of the article. A.L.M. performed survey review and implementation. J.C.F. and M.S.D. coordinated the research and contributed to the writing of the article. All authors have read and agreed to the published version of the manuscript.

Funding

This research was funded by the Foundation for Science and Technology (FCT) through ISTAR-IUL’s project UIDB/04466/2020 and UIDP/04466/2020.

Data Availability Statement

Data is available on request.

Acknowledgments

J.C.F. received support from the Portuguese National Funds through FITEC—Programa Interface, with reference CIT INOV—INESC INOVAÇÃO—Financiamento Base.

Conflicts of Interest

The authors declare no conflict of interest.

References

  1. Chan, C.C. The state of the art of electric, hybrid, and fuel cell vehicles. Proc. IEEE 2007, 95, 704–718. [Google Scholar] [CrossRef]
  2. European Comission. European Green Deal. 2021. Available online: https://ec.europa.eu/info/strategy/priorities-2019-2024/european-green-deal_en (accessed on 18 August 2021).
  3. ”Plano Nacional de Energia e Clima 2021–2030”, Conselho de Ministros. 2019. Available online: https://www.portugalenergia.pt/setor-energetico/bloco-3/ (accessed on 16 August 2021).
  4. Masson-Delmotte, V.; Zhai, P.; Pirani, A.; Connors, S.L.; Péan, C.; Berger, S.; Caud, N.; Chen, Y.; Goldfarb, L.; Gomis, M.I.; et al. Climate Change 2021: The Physical Science Basis. Contribution of Working Group I to the Sixth Assessment Report of the Intergovernmental Panel on Climate Change; Cambridge University Press: Cambridge, UK, 2021; Available online: https://www.ipcc.ch/report/ar6/wg1/downloads/report/IPCC_AR6_WGI_Full_Report.pdf (accessed on 16 August 2021).
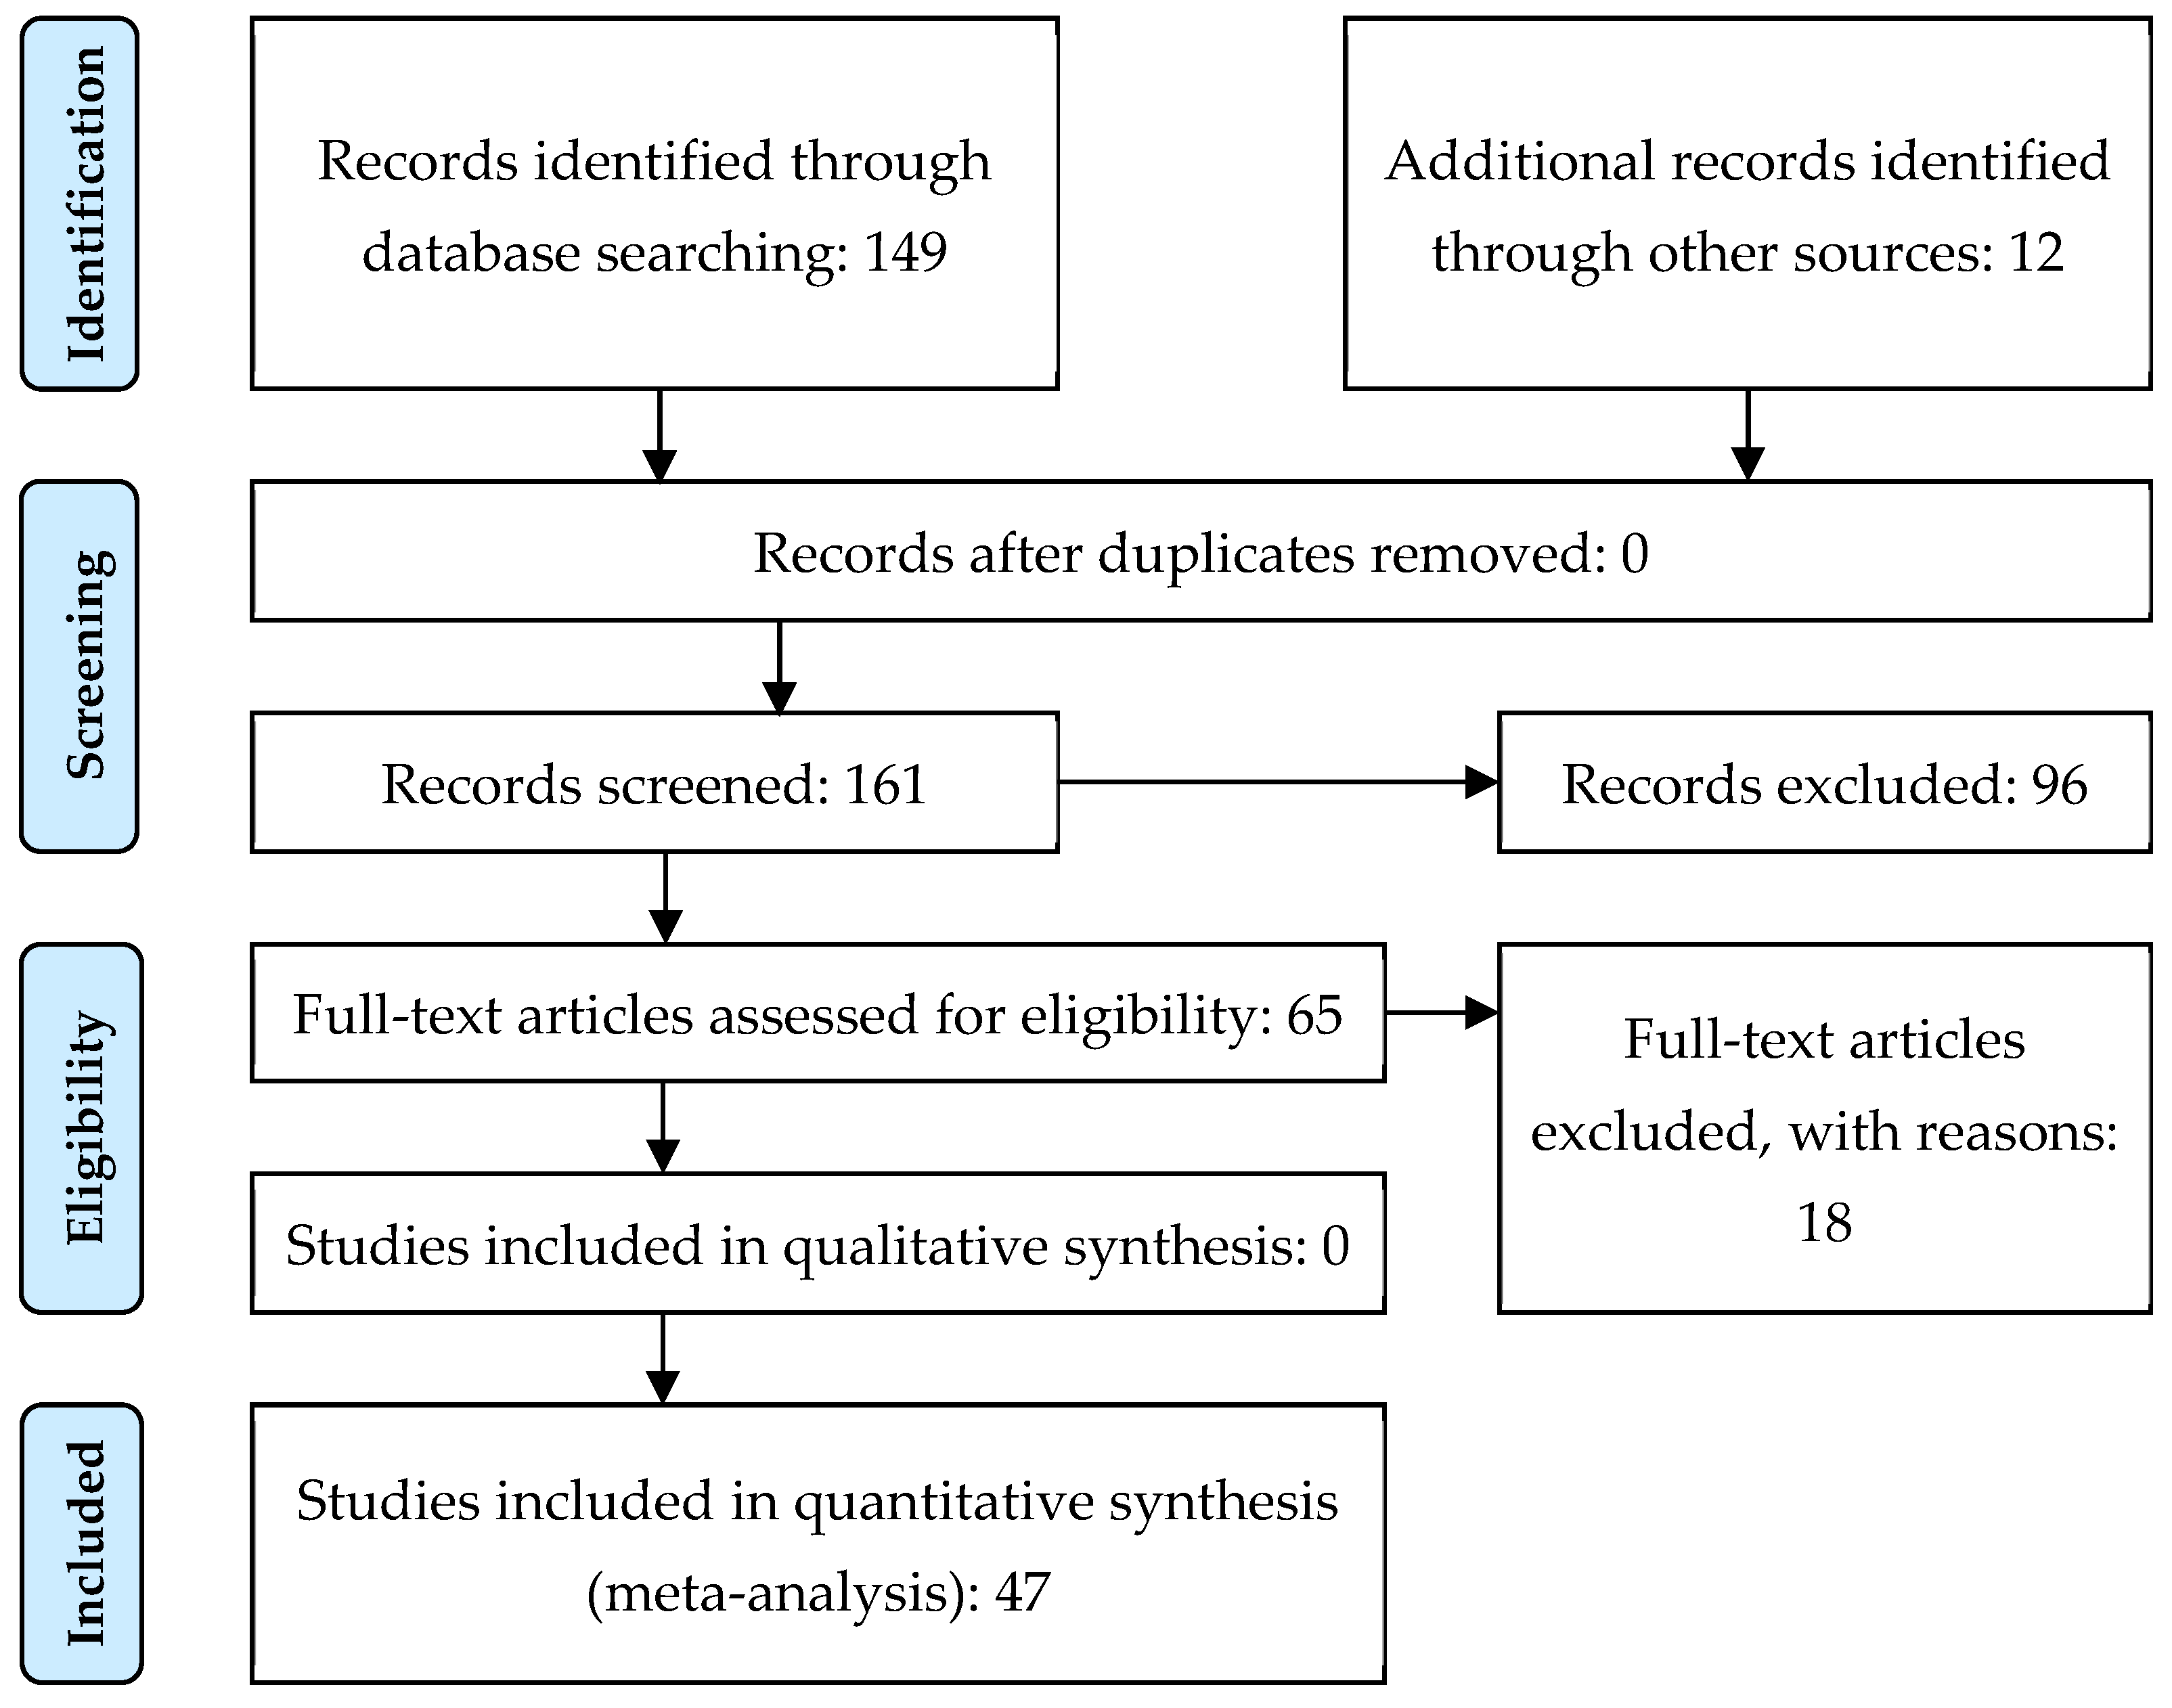
  5. Page, M.J.; McKenzie, J.E.; Bossuyt, P.M.; Boutron, I.; Hoffmann, T.C.; Mulrow, C.D.; Shamseer, L.; Tetzlaff, J.M.; Akl, E.A.; Brennan, S.E.; et al. The PRISMA 2020 statement: An updated guideline for reporting systematic reviews. BMJ 2021, 372, 9. [Google Scholar] [CrossRef]
  6. Zhang, X.; Peng, H.; Wang, H.; Ouyang, M. Hybrid Lithium Iron Phosphate Battery and Lithium Titanate Battery Systems for Electric Buses. IEEE Trans. Veh. Technol. 2018, 67, 956–965. [Google Scholar] [CrossRef]
  7. Mendeley. Available online: https://www.mendeley.com/search/ (accessed on 22 May 2021).
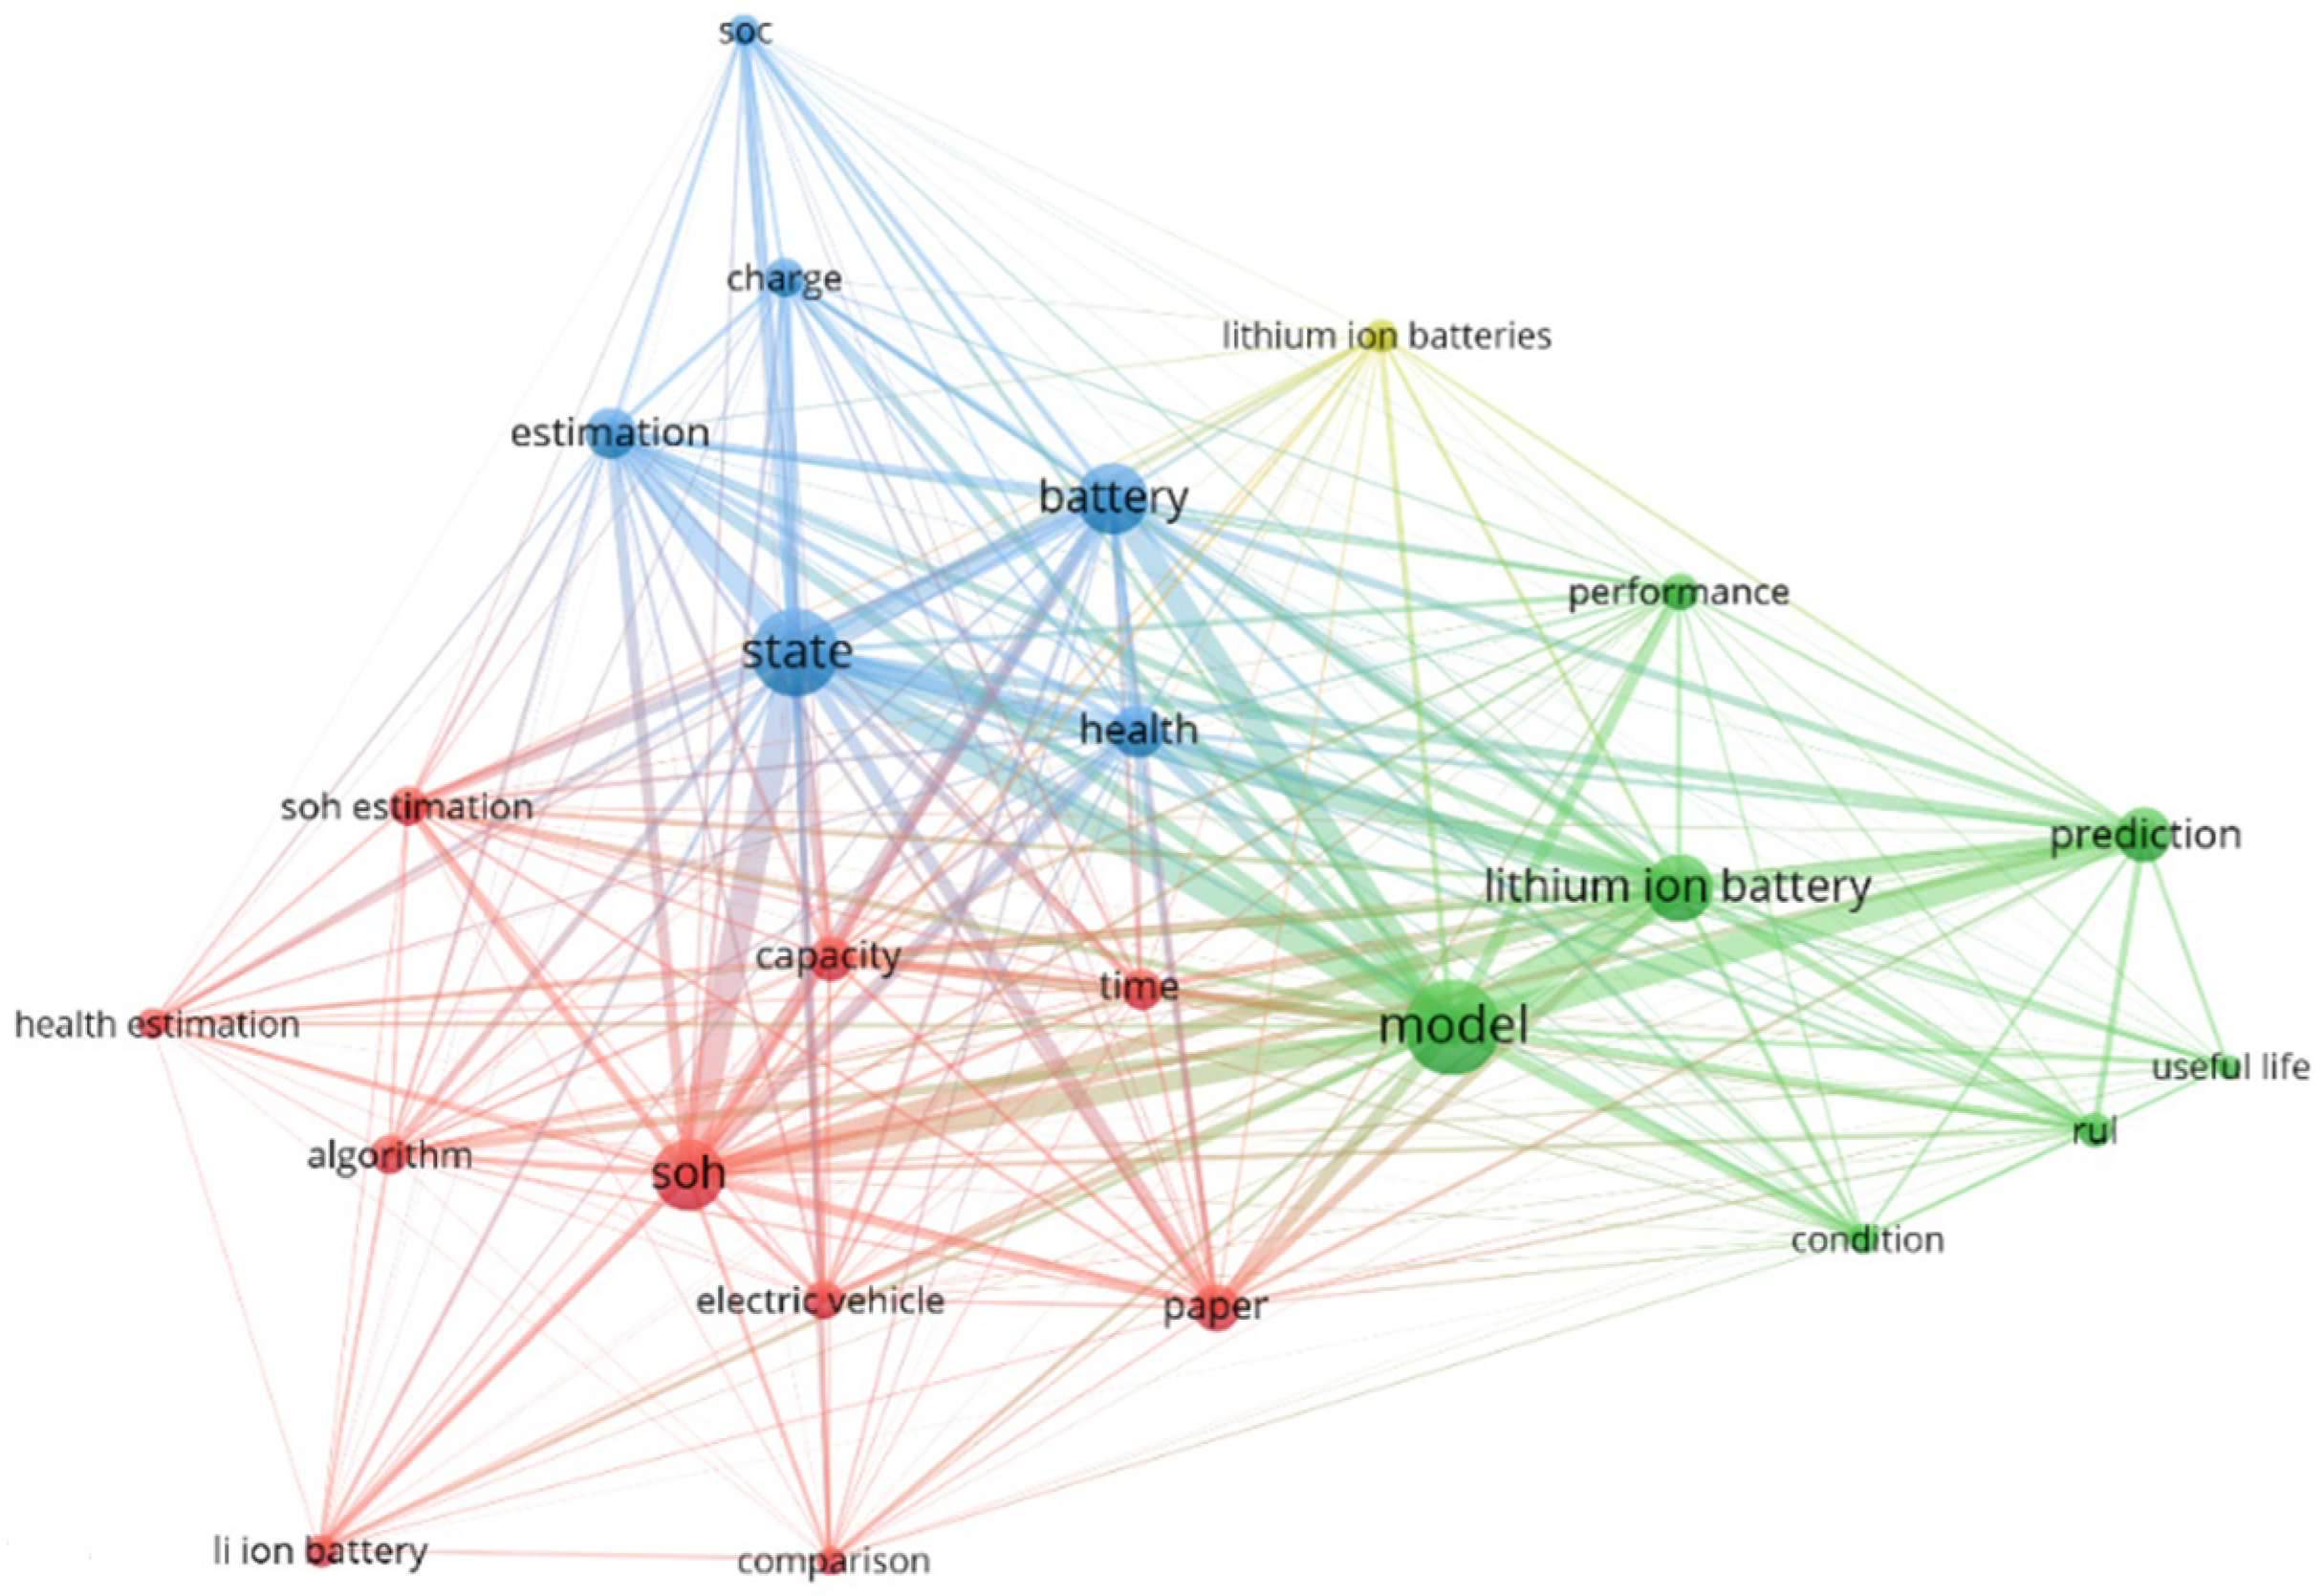
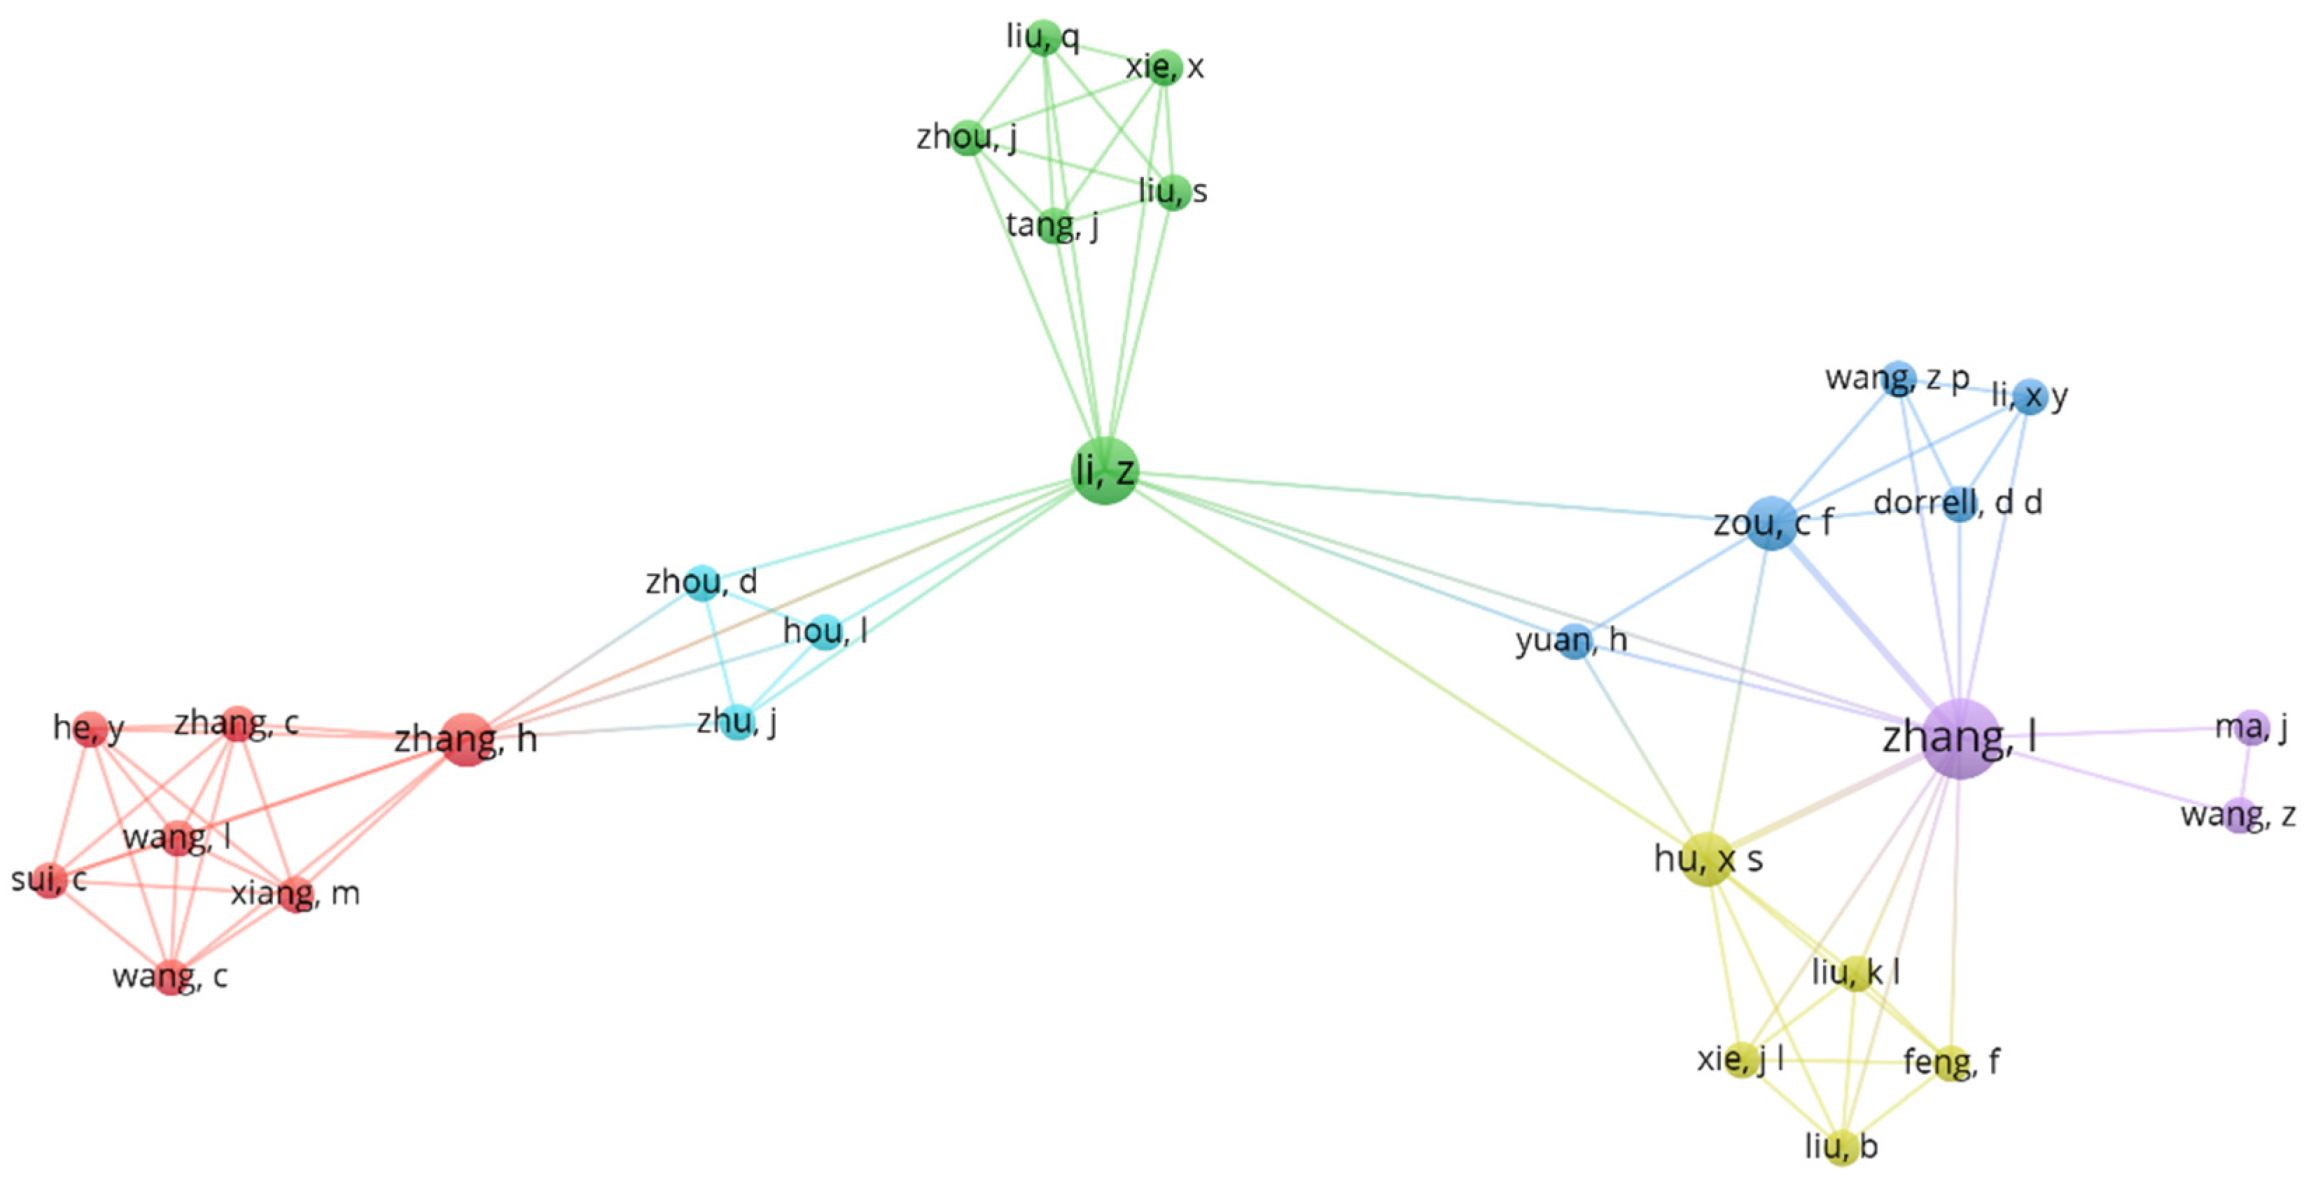
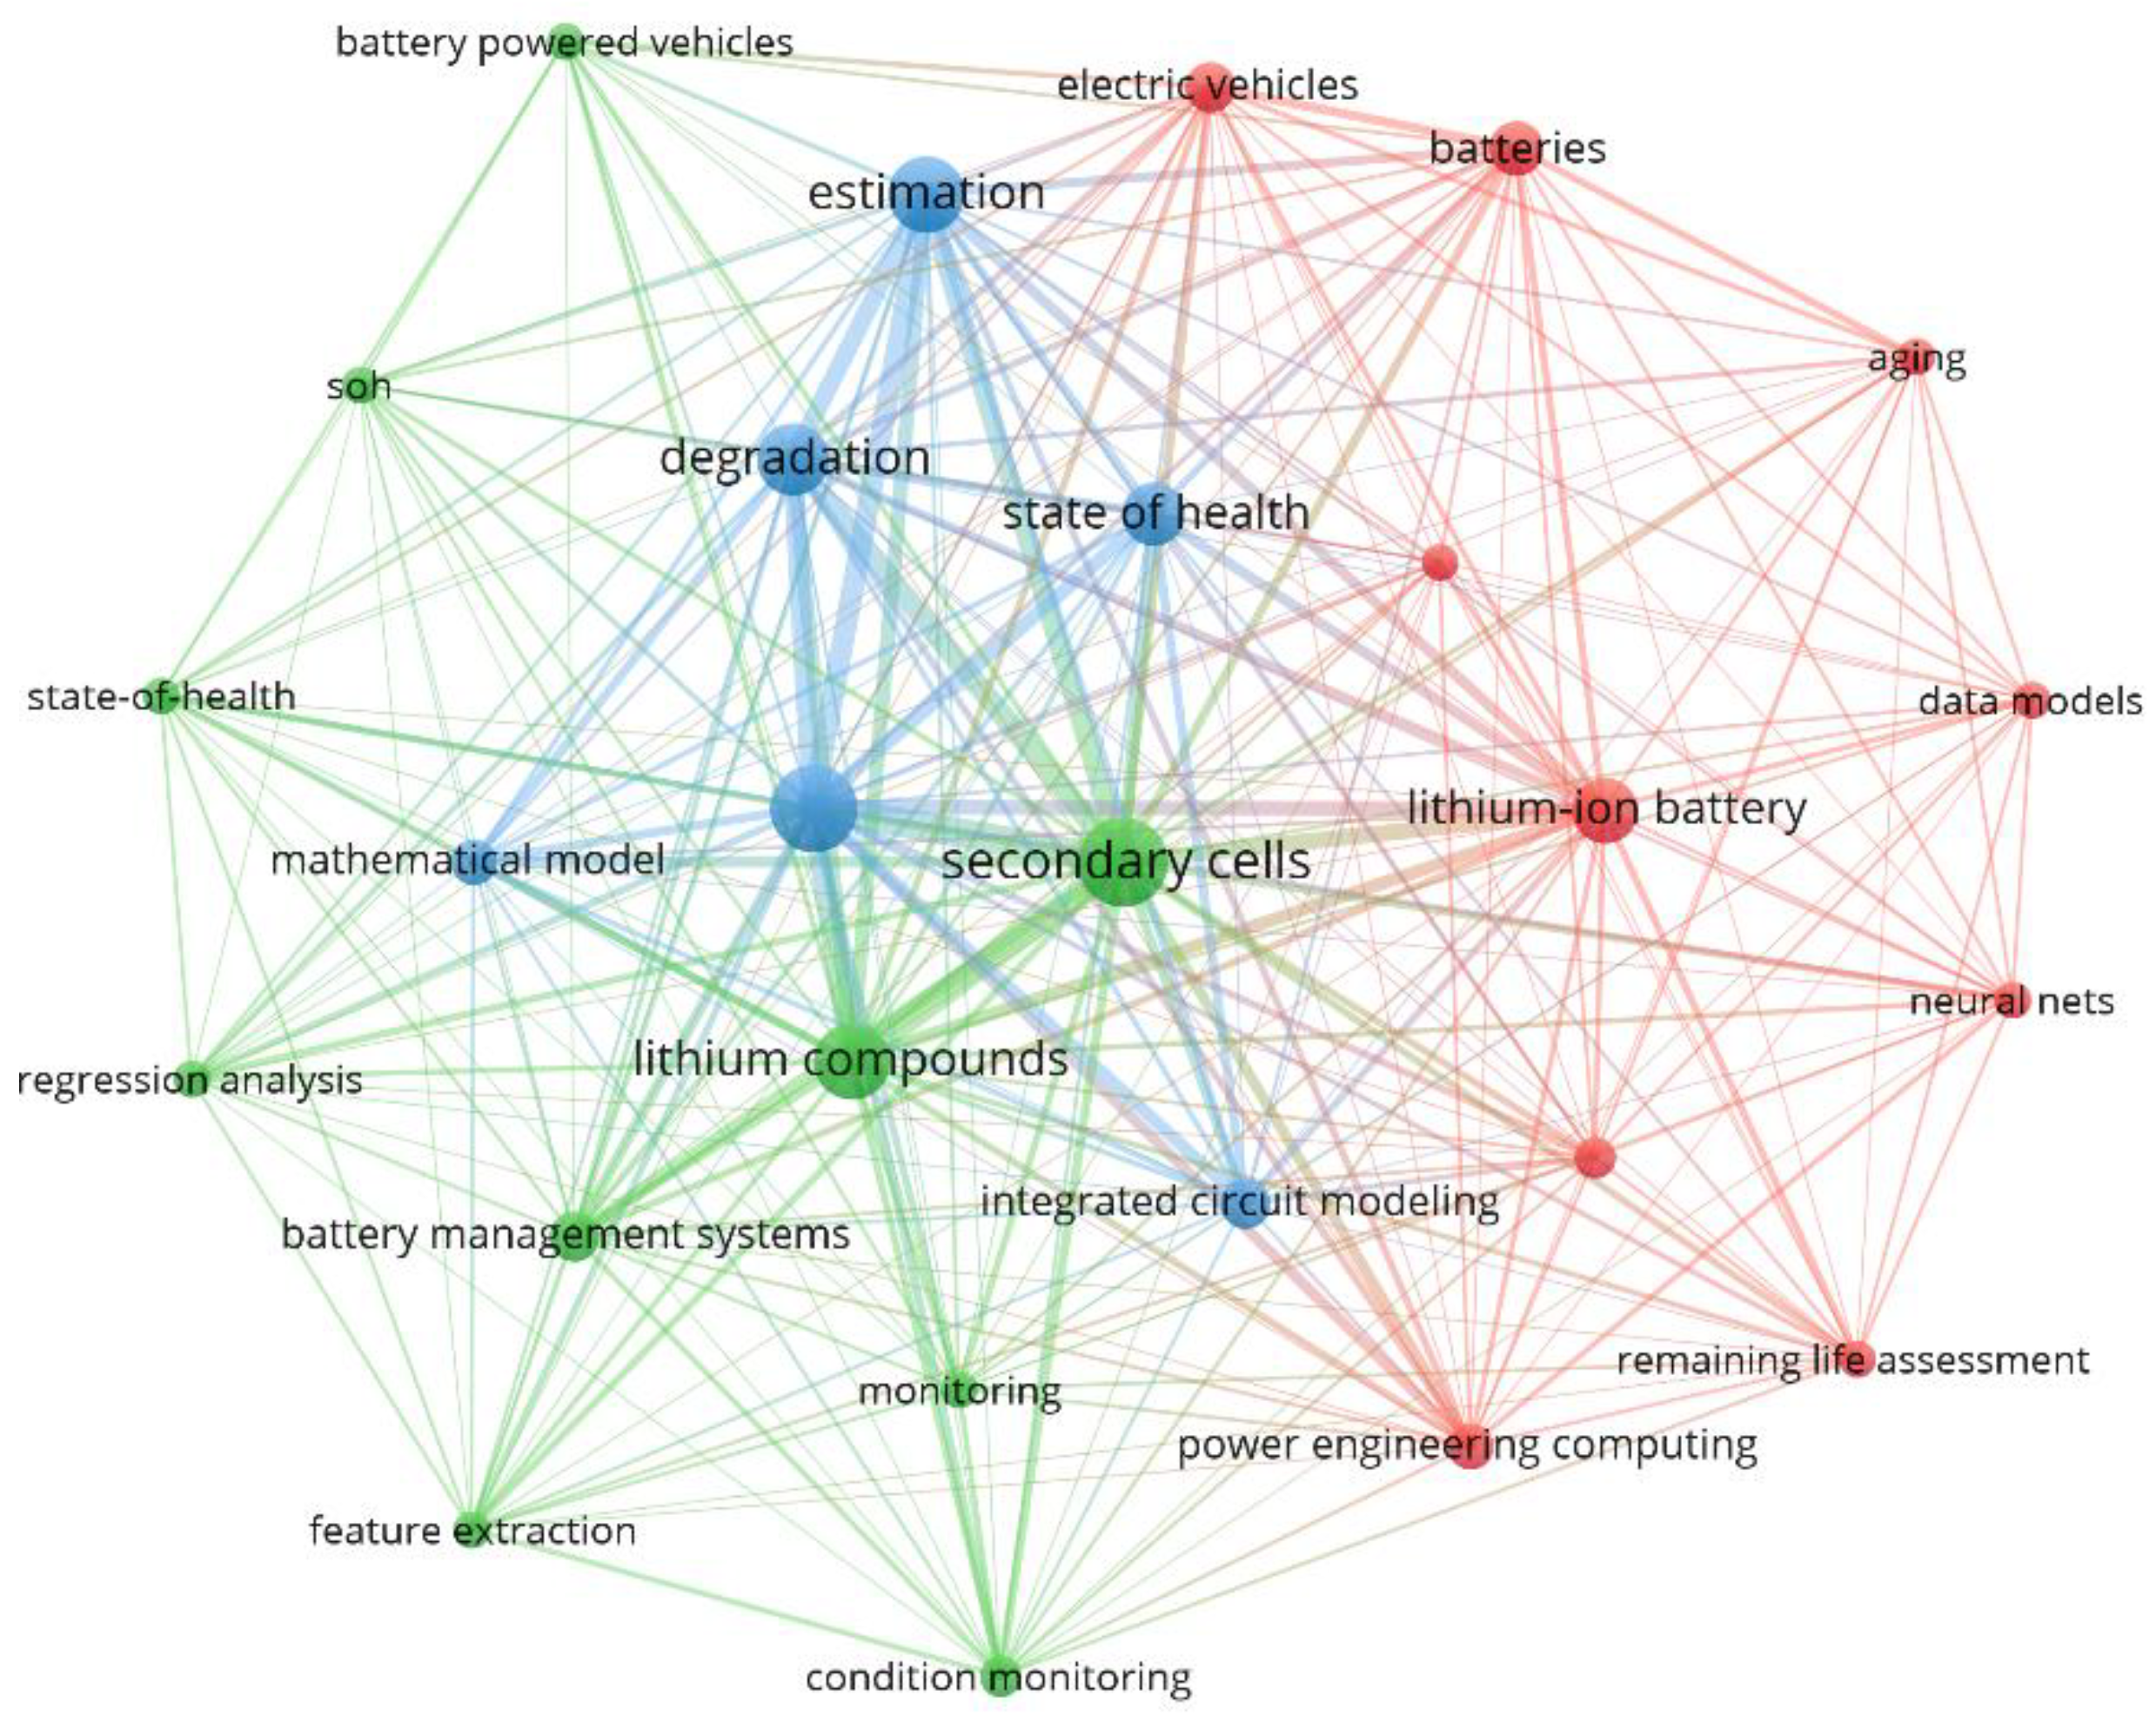
  8. Waltman, L.; van Eck, N.J. VOSviewer—Visualizing Scientific Landscapes. Available online: https://www.vosviewer.com/ (accessed on 18 July 2021).
  9. Bouchhima, N.; Gossen, M.; Schulte, S.; Birke, K.P. Lifetime of self-reconfigurable batteries compared with conventional batteries. J. Energy Storage 2018, 15, 400–407. [Google Scholar] [CrossRef]
  10. Caliwag, A.C.; Lim, W. Hybrid VARMA and LSTM Method for Lithium-ion Battery State-of-Charge and Output Voltage Forecasting in Electric Motorcycle Applications. IEEE Access 2019, 7, 59680–59689. [Google Scholar] [CrossRef]
  11. Ceng, M.S.; Reddy, K.J. Predicting Life-Cycle Estimation of Electric Vehicle Battery Pack through Degradation by Self Discharge and Fast Charging. In SAE Technical Report; SAE: Warrendale, PA, USA, 2020. [Google Scholar] [CrossRef]
  12. Chen, Z.; Xue, Q.; Xiao, R.; Liu, Y.; Shen, J. State of Health Estimation for Lithium-ion Batteries Based on Fusion of Autoregressive Moving Average Model and Elman Neural Network. IEEE Access 2019, 7, 102662–102678. [Google Scholar] [CrossRef]
  13. Crawford, A.J.; Huang, Q.; Kintner-Meyer, M.C.; Zhang, J.-G.; Reed, D.M.; Sprenkle, V.L.; Viswanathan, V.V.; Choi, D. Lifecycle comparison of selected Li-ion battery chemistries under grid and electric vehicle duty cycle combinations. J. Power Sources 2018, 380, 185–193. [Google Scholar] [CrossRef]
  14. Cui, X.; Hu, T. State of Health Diagnosis and Remaining Useful Life Prediction for Lithium-ion Battery Based on Data Model Fusion Method. IEEE Access 2020, 8, 207298–207307. [Google Scholar] [CrossRef]
  15. Dong, G.; Chen, Z.; Wei, J.; Ling, Q. Battery health prognosis using brownian motion modeling and particle filtering. IEEE Trans. Ind. Electron. 2018, 65, 8646–8655. [Google Scholar] [CrossRef]
  16. Feng, X.; Weng, C.; He, X.; Han, X.; Lu, L.; Ren, D.; Ouyang, M. Online State-of-Health Estimation for Li-Ion Battery Using Partial Charging Segment Based on Support Vector Machine. IEEE Trans. Veh. Technol. 2019, 68, 8583–8592. [Google Scholar] [CrossRef]
  17. Hu, X.S.; Yuan, H.; Zou, C.F.; Li, Z.; Zhang, L. Co-Estimation of State of Charge and State of Health for Lithium-Ion Batteries Based on Fractional-Order Calculus. IEEE Trans. Veh. Technol. 2018, 67, 10319–10329. [Google Scholar] [CrossRef]
  18. Hu, X.; Martinez, C.M.; Yang, Y. Charging, power management, and battery degradation mitigation in plug-in hybrid electric vehicles: A unified cost-optimal approach. Mech. Syst. Signal Process. 2017, 87, 4–16. [Google Scholar] [CrossRef]
  19. Hu, X.S.; Feng, F.; Liu, K.L.; Zhang, L.; Xie, J.L.; Liu, B. State estimation for advanced battery management: Key challenges and future trends. Renew. Sustain. Energy Rev. 2019, 114, 109334. [Google Scholar] [CrossRef]
  20. Huo, Q.; Ma, Z.; Zhao, X.; Zhang, T.; Zhang, Y. Bayesian Network-Based State-of-Health Estimation for Battery on Electric Vehicle Application and its Validation through Real-World Data. IEEE Access 2021, 9, 11328–11341. [Google Scholar] [CrossRef]
  21. Jiang, Y.; Zhang, J.; Xia, L.; Liu, Y. State of Health Estimation for Lithium-Ion Battery Using Empirical Degradation and Error Compensation Models. IEEE Access 2020, 8, 123858–123868. [Google Scholar] [CrossRef]
  22. Khan, N.; Ullah, F.U.M.; Afnan; Ullah, A.; Lee, M.Y.; Baik, S.W. Batteries State of Health Estimation via Efficient Neural Networks with Multiple Channel Charging Profiles. IEEE Access 2021, 9, 7797–7813. [Google Scholar] [CrossRef]
  23. Kim, J.; Chun, H.; Kim, M.; Yu, J.; Kim, K.; Kim, T.; Han, S. Data-Driven State of Health Estimation of Li-Ion Batteries with RPT-Reduced Experimental Data. IEEE Access 2019, 7, 106987–106997. [Google Scholar] [CrossRef]
  24. Kim, M.; Kim, K.; Han, S. Reliable Online Parameter Identification of Li-Ion Batteries in Battery Management Systems Using the Condition Number of the Error Covariance Matrix. IEEE Access 2020, 8, 189106–189114. [Google Scholar] [CrossRef]
  25. Li, K.; Wei, F.; Tseng, K.J.; Soong, B.-H. A Practical Lithium-Ion Battery Model for State of Energy and Voltage Responses Prediction Incorporating Temperature and Ageing Effects. IEEE Trans. Ind. Electron. 2018, 65, 6696–6708. [Google Scholar] [CrossRef]
  26. Li, X.Y.; Wang, Z.P.; Zhang, L.; Zou, C.F.; Dorrell, D.D. State-of-health estimation for Li-ion batteries by combing the incremental capacity analysis method with grey relational analysis. J. Power Sources 2019, 410, 106–114. [Google Scholar] [CrossRef]
  27. Li, Y.; Zhong, S.; Zhong, Q.; Shi, K. Lithium-Ion Battery State of Health Monitoring Based on Ensemble Learning. IEEE Access 2019, 7, 8754–8762. [Google Scholar] [CrossRef]
  28. Lipu, M.S.H.; Hannan, M.A.; Hussain, A.; Saad, M.H.M. Optimal BP neural network algorithm for state of charge estimation of lithium-ion battery using PSO with PCA feature selection. J. Renew. Sustain. Energy 2017, 9, 064102. [Google Scholar] [CrossRef]
  29. Lipu, M.S.H.; Hannan, M.; Hussain, A.; Hoque, M.; Ker, P.J.; Saad, M.; Ayob, A. A review of state of health and remaining useful life estimation methods for lithium-ion battery in electric vehicles: Challenges and recommendations. J. Clean. Prod. 2018, 205, 115–133. [Google Scholar] [CrossRef]
  30. Liu, D.; Yin, X.; Song, Y.; Liu, W.; Peng, Y. An On-Line State of Health Estimation of Lithium-Ion Battery Using Unscented Particle Filter. IEEE Access 2018, 6, 40990–41001. [Google Scholar] [CrossRef]
  31. Liu, K.; Hu, X.; Wei, Z.; Li, Y.; Jiang, Y. Modified Gaussian Process Regression Models for Cyclic Capacity Prediction of Lithium-Ion Batteries. IEEE Trans. Transp. Electrif. 2019, 5, 1225–1236. [Google Scholar] [CrossRef]
  32. Ma, Y.; Chen, Y.; Zhou, X.W.; Chen, H. Remaining Useful Life Prediction of Lithium-Ion Battery Based on Gauss-Hermite Particle Filter. IEEE Trans. Control Syst. Technol. 2019, 27, 1788–1795. [Google Scholar] [CrossRef]
  33. May, G.; El-Shahat, A. Battery-degradation model based on the ANN regression function for EV applications. In Proceedings of the GHTC 2017—IEEE Global Humanitarian Technology Conference, Proceedings, San Jose, CA, USA, 19–22 October 2017; pp. 1–3. [Google Scholar] [CrossRef]
  34. El Mejdoubi, A.; Chaoui, H.; Gualous, H.; van den Bossche, P.; Omar, N.; van Mierlo, J. Lithium-ion batteries health prognosis considering aging conditions. IEEE Trans. Power Electron. 2019, 34, 6834–6844. [Google Scholar] [CrossRef]
  35. Moye, D.G.; Moss, P.L.; Chen, X.J.; Cao, W.J.; Foo, S.Y. A design-based predictive model for lithium-ion capacitors. J. Power Sources 2019, 435, 226694. [Google Scholar] [CrossRef]
  36. Qu, J.; Liu, F.; Ma, Y.; Fan, J. A Neural-Network-Based Method for RUL Prediction and SoH Monitoring of Lithium-Ion Battery. IEEE Access 2019, 7, 87178–87191. [Google Scholar] [CrossRef]
  37. Saldaña, G.; Martín, J.I.S.; Zamora, I.; Asensio, F.J.; Oñederra, O.; González, M. Empirical Electrical and Degradation Model for Electric Vehicle Batteries. IEEE Access 2020, 8, 155576–155589. [Google Scholar] [CrossRef]
  38. Shen, P.; Ouyang, M.G.; Lu, L.G.; Li, J.Q.; Feng, X.N. The Co-estimation of State of Charge, State of Health, and State of Function for Lithium-Ion Batteries in Electric Vehicles. IEEE Trans. Veh. Technol. 2018, 67, 92–103. [Google Scholar] [CrossRef]
  39. Tan, X.; Tan, Y.; Zhan, D.; Yu, Z.; Fan, Y.; Qiu, J.; Li, J. Real-Time State-of-Health Estimation of Lithium-Ion Batteries Based on the Equivalent Internal Resistance. IEEE Access 2020, 8, 56811–56822. [Google Scholar] [CrossRef]
  40. Tang, J.; Liu, Q.; Liu, S.; Xie, X.; Zhou, J.; Li, Z. A Health Monitoring Method Based on Multiple Indicators to Eliminate Influences of Estimation Dispersion for Lithium-Ion Batteries. IEEE Access 2019, 7, 122302–122314. [Google Scholar] [CrossRef]
  41. Tian, J.P.; Xiong, R.; Yu, Q.Q. Fractional-Order Model-Based Incremental Capacity Analysis for Degradation State Recognition of Lithium-Ion Batteries. IEEE Trans. Ind. Electron. 2019, 66, 1576–1584. [Google Scholar] [CrossRef]
  42. Vidal, C.; Malysz, P.; Kollmeyer, P.; Emadi, A. Machine Learning Applied to Electrified Vehicle Battery State of Charge and State of Health Estimation: State-of-the-Art. IEEE Access 2020, 8, 52796–52814. [Google Scholar] [CrossRef]
  43. Wang, Z.; Ma, J.; Zhang, L. State-of-Health Estimation for Lithium-Ion Batteries Based on the Multi-Island Genetic Algorithm and the Gaussian Process Regression. IEEE Access 2017, 5, 21286–21295. [Google Scholar] [CrossRef]
  44. Wei, J.W.; Dong, G.Z.; Chen, Z.H. Remaining Useful Life Prediction and State of Health Diagnosis for Lithium-Ion Batteries Using Particle Filter and Support Vector Regression. IEEE Trans. Ind. Electron. 2018, 65, 5634–5643. [Google Scholar] [CrossRef]
  45. Wu, Y.; Xue, Q.; Shen, J.; Lei, Z.; Chen, Z.; Liu, Y. State of Health Estimation for Lithium-Ion Batteries Based on Healthy Features and Long Short-Term Memory. IEEE Access 2020, 8, 28533–28547. [Google Scholar] [CrossRef]
  46. Xiang, M.; He, Y.; Zhang, H.; Zhang, C.; Wang, L.; Wang, C.; Sui, C. State-of-Health Prognosis for Lithium-Ion Batteries Considering the Limitations in Measurements via Maximal Information Entropy and Collective Sparse Variational Gaussian Process. IEEE Access 2020, 8, 188199–188217. [Google Scholar] [CrossRef]
  47. Xu, X.; Yu, C.; Tang, S.; Sun, X.; Si, X.; Wu, L. State-of-Health Estimation for Lithium-Ion Batteries Based on Wiener Process with Modeling the Relaxation Effect. IEEE Access 2019, 7, 105186–105201. [Google Scholar] [CrossRef]
  48. Yao, H.; Jia, X.; Zhao, Q.; Cheng, Z.; Guo, B. Novel Lithium-Ion Battery State-of-Health Estimation Method Using a Genetic Programming Model. IEEE Access 2020, 8, 95333–95344. [Google Scholar] [CrossRef]
  49. Yun, Z.; Qin, W. Remaining Useful Life Estimation of Lithium-Ion Batteries Based on Optimal Time Series Health Indicator. IEEE Access 2020, 8, 55447–55461. [Google Scholar] [CrossRef]
  50. Zhang, C.; He, Y.; Yuan, L.; Xiang, S. Capacity Prognostics of Lithium-Ion Batteries using EMD Denoising and Multiple Kernel RVM. IEEE Access 2017, 5, 12061–12070. [Google Scholar] [CrossRef]
  51. Zhang, L.; Mu, Z.; Sun, C. Remaining Useful Life Prediction for Lithium-Ion Batteries Based on Exponential Model and Particle Filter. IEEE Access 2018, 6, 17729–17740. [Google Scholar] [CrossRef]
  52. Zhang, Y.; Xiong, R.; He, H.; Pecht, M.G. Lithium-Ion Battery Remaining Useful Life Prediction with Box-Cox Transformation and Monte Carlo Simulation. IEEE Trans. Ind. Electron. 2019, 66, 1585–1597. [Google Scholar] [CrossRef]
  53. Zheng, X.; Deng, X. State-of-Health Prediction For Lithium-Ion Batteries with Multiple Gaussian Process Regression Model. IEEE Access 2019, 7, 150383–150394. [Google Scholar] [CrossRef]
  54. Zhou, D.; Li, Z.; Zhu, J.; Zhang, H.; Hou, L. State of Health Monitoring and Remaining Useful Life Prediction of Lithium-Ion Batteries Based on Temporal Convolutional Network. IEEE Access 2020, 8, 53307–53320. [Google Scholar] [CrossRef]
  55. Scimago Journal & Country Rank. Available online: https://www.scimagojr.com/ (accessed on 20 October 2021).
  56. Croce, A.I.; Musolino, G.; Rindone, C.; Vitetta, A. Energy consumption of electric vehicles: Models’ estimation using big data (FCD). Transp. Res. Procedia 2020, 47, 211–218. [Google Scholar] [CrossRef]
  57. Fiori, C.; Marzano, V. Modelling energy consumption of electric freight vehicles in urban pickup/delivery operations: Analysis and estimation on a real-world dataset. Transp. Res. Part D Transp. Environ. 2018, 65, 658–673. [Google Scholar] [CrossRef]
  58. Musolino, G.; Rindone, C.; Vitetta, A. Passengers and freight mobility with electric vehicles: A methodology to plan green transport and logistic services near port areas. Transp. Res. Procedia 2019, 37, 393–400. [Google Scholar] [CrossRef]
  59. Qualtrics XM//The Leading Experience Management Software. Available online: https://www.qualtrics.com/uk/ (accessed on 1 September 2021).
  60. General Data Protection Regulation (GDPR)—Official Legal Text. Available online: https://gdpr-info.eu/ (accessed on 19 August 2021).
  61. UVE—Associação de Utilizadores de Veículos Eléctricos. Available online: https://www.uve.pt/page/ (accessed on 19 August 2021).
  62. r/TeslaMotors—Your Tesla Community on Reddit. Available online: https://www.reddit.com/r/teslamotors/ (accessed on 1 September 2021).
  63. r/TeslaLounge—Your Relaxed Tesla Community on Reddit. Available online: https://www.reddit.com/r/TeslaLounge/ (accessed on 1 September 2021).
  64. Defesa do Consumidor | DECO PROTESTE. Available online: https://www.deco.proteste.pt/ (accessed on 1 September 2021).
  65. Como Carregar um Veículo Elétrico—UVE. Available online: https://www.uve.pt/page/como-carregar-um-veiculo-eletrico/ (accessed on 7 June 2021).
  66. Du, J.; Zhang, X.; Wang, T.; Song, Z.; Yang, X.; Wang, H.; Ouyang, M.; Wu, X. Battery degradation minimization oriented energy management strategy for plug-in hybrid electric bus with multi-energy storage system. Energy 2018, 165, 153–163. [Google Scholar] [CrossRef]
  67. Cui, Q.; Du, S.; Liu, C.; Zhang, L.; Wei, G. A stochastic optimal energy management strategy considering battery health for hybrid electric bus. Proc. Inst. Mech. Eng. Part D J. Automob. Eng. 2020, 234, 3112–3127. [Google Scholar] [CrossRef]
  68. Qiao, H.; Wei, Q. Functional nanofibers in lithium-ion batteries. In Functional Nanofibers and Their Applications; Woodhead Publishing: Sawston, UK, 2012; pp. 197–208. [Google Scholar] [CrossRef]
  69. Tang, X.; Liu, K.; Wang, X.; Gao, F.; MacRo, J.; Widanage, W.D. Model Migration Neural Network for Predicting Battery Aging Trajectories. IEEE Trans. Transp. Electrif. 2020, 6, 363–374. [Google Scholar] [CrossRef]
  70. Wu, X.; Li, X.; Du, J. State of Charge Estimation of Lithium-Ion Batteries over Wide Temperature Range Using Unscented Kalman Filter. IEEE Access 2018, 6, 41993–42003. [Google Scholar] [CrossRef]
  71. Rede Mobi.e—Mobi.e. Available online: https://www.mobie.pt/ (accessed on 28 August 2021).
Figure 1. PRISMA methodology flowchart.
Wevj 12 00233 g001
Figure 2. Title and abstract fields analysis in the literature review.
Wevj 12 00233 g002
Figure 3. Most crucial authors in the literature review.
Wevj 12 00233 g003
Figure 4. Keyword co-occurrence in the literature review.
Wevj 12 00233 g004
Figure 5. Car sample mileage distribution.
Wevj 12 00233 g005
Figure 6. Car maximum range distribution.
Wevj 12 00233 g006
Figure 7. Car sample distribution by country.
Wevj 12 00233 g007
Figure 8. Gender distribution of survey respondents.
Wevj 12 00233 g008
Figure 9. Age distribution of survey respondents.
Wevj 12 00233 g009
Figure 10. Total family members per household.
Wevj 12 00233 g010
Figure 11. Number of vehicles owned by the household.
Wevj 12 00233 g011
Figure 12. Perceived main advantages of an electric vehicle.
Wevj 12 00233 g012
Figure 13. Predominant charging obstacles identified by UVE users in Portugal.
Wevj 12 00233 g013
Figure 14. Preferred charging locations.
Wevj 12 00233 g014
Figure 15. Frequency of trips up to 50 Km per daily.
Wevj 12 00233 g015
Figure 16. Satisfaction with EV charging solutions in Portugal.
Wevj 12 00233 g016
Figure 17. Importance given to a shared charging system in the condominium’s garage.
Wevj 12 00233 g017
Figure 18. Importance of nearby available charging stations.
Wevj 12 00233 g018
Figure 19. Amount accepted for the installation of chargers.
Wevj 12 00233 g019
Figure 20. Acceptable monthly fee for the installation of a charger.
Wevj 12 00233 g020
Table 1. Research question methodology.
Research QuestionObjectiveMethodology
RQ—Which factors may present themselves as a hindrance to the adoption of EV vehicles by citizens?OBJ—To identify and understand user satisfaction and how that may hinder the adoption of electric vehicles.Descriptive Statistics and Content Analysis
Table 2. Literature results obtained with PRISMA tool.
TitleAuthorMethod
Lifetime of Self-Reconfigurable Batteries Compared with Conventional Batteries [9]Bouchhima, N., Gossen, M., Schulte, S., Birke, K.P.Semi-empirical aging model.
Hybrid VARMA and LSTM Method for Lithium-Ion Battery State-of-Charge and Output Voltage Forecasting in Electric Motorcycle Applications [10]Caliwag, A.-C., Lim, W.Neural Networking State of Charge (SoC) prediction method.
Predicting Life-Cycle Estimation of Electric Vehicle Battery Pack through Degradation by Self Discharge and Fast Charging [11]Singh Ceng, M., Janardhan Reddy, K.Battery pack SoC estimation of self-discharge simulation.
SoH Estimation for Lithium-Ion Batteries Based on Fusion of Autoregressive Moving Average Model and Elman Neural Network [12]Chen, Z., Xue, Q., Xiao, R., Liu, Y., Shen, J.Neural Network prediction method.
Lifecycle Comparison of Selected Li-Ion Battery Chemistries under Grid and Electric Vehicle Duty Cycle Combinations [13]Crawford, A.J., Huang, Q., Kintner-Meyer, M.C.W., Zhang, J.-G., Reed, D.M., Sprenkle, V.L., Viswanathan, V.V., Choi, D.Neural Network State of Energy prediction method.
SoH Diagnosis and RUL Prediction for Lithium-Ion Battery Based on Data Model Fusion Method [14]Cui, X., Hu, T.Neural Network prediction method.
Battery Health Prognosis Using Brownian Motion Modeling and Particle Filtering [15]Dong, G., Chen, Z., Wei, J., Ling, Q.Particle Filtering prediction model.
Online State-of-Health Estimation for Li-Ion Battery Using Partial Charging Segment Based on Support Vector Machine [16]Feng, X., Weng, C., He, X., Han, X., Lu, L., Ren, D., Ouyang, M.SoH and SVM prediction model.
Co-Estimation of SoC and the SoH for Lithium-Ion Batteries Based on Fractional-Order Calculus [17]Hu, X.S., Yuan, H., Zou, C F., Li, Z., Zhang, L.SoC and SoH estimation model.
Charging, Power Management, and Battery Degradation Mitigation in Plug-in Hybrid Electric Vehicles: A Unified Cost-Optimal Approach [18]Hu, X., Martinez, C.M., Yang, Y.Battery Management System (BMS) estimation model.
State Estimation for Advanced Battery Management: Key Challenges and Future Trends [19]Hu, X.S., Feng, F., Liu, K.L., Zhang, L., Xie, J.L., Liu, B.BMS estimation model.
Bayesian Network-Based State-of-Health Estimation for Battery on Electric Vehicle Application and Its Validation Through Real-World Data [20]Huo, Q., Ma, Z., Zhao, X., Zhang, T., Zhang, Y.Bayesian Network SoH estimation model.
SoH Estimation for Lithium-Ion Battery Using Empirical Degradation and Error Compensation Models [21]Jiang, Y., Zhang, J., Xia, L., Liu, Y.SoH predictive model.
Batteries SoH Estimation via Efficient Neural Networks with Multiple Channel Charging Profiles [22]Khan, N., Ullah, F.U.M., Afnan, Ullah, A., Lee, M.Y., Baik, S.W.SoH Neural Network prediction model.
Data-Driven SoH Estimation of Li-Ion Batteries with RPT-Reduced Experimental Data [23]Kim, J., Chun, H., Kim, M., Yu, J., Kim, K., Kim, T., Han, S.SoH prediction model.
Reliable Online Parameter Identification of Li-Ion Batteries in Battery Management Systems Using the Condition Number of the Error Covariance Matrix [24]Kim, M., Kim, K., Han, S.SoH prediction model.
A Practical Lithium-Ion Battery Model for the State of Energy and Voltage Responses Prediction Incorporating Temperature and Ageing Effects [25]Li, K., Wei, F., Tseng, K.J., Soong, B.H.SoE predictive model.
State-of-Health Estimation for Li-Ion Batteries by Combing the Incremental Capacity Analysis Method with Grey Relational Analysis [26]Li, X.Y., Wang, Z.P., Zhang, L., Zou, C.F., Dorrell, D.D.SoH and RUL predictive model.
Lithium-Ion Battery SoH Monitoring Based on Ensemble Learning [27]Li, Y., Zhong, S., Zhong, Q., Shi, K.Grey Relational Analysis model.
Optimal BP Neural Network Algorithm for SoC Estimation of Lithium-Ion Battery Using PSO with PCA Feature Selection [28]Hossain Lipu, M.S., Hannan, M.A., Hussain, A., Saad, M.H.M.SoC estimation Back-Propagation Neural Network model.
A Review of SoH and RUL Estimation Methods for Lithium-Ion Battery in Electric Vehicles: Challenges and Recommendations [29]Lipu, M.S.H., Hannan, M.A., Hussain, A., Hoque, M.M., Ker, P.J., Saad, M.H.M., Ayob, A.SoH prediction model.
An On-Line SoH Estimation of Lithium-Ion Battery Using Unscented Particle Filter [30]Liu, D., Yin, X., Song, Y., Liu, W., Peng, Y.Neural Networking SoH prediction model.
Modified Gaussian Process Regression Models for Cyclic Capacity Prediction of Lithium-Ion Batteries [31]Liu, K., Hu, X., Wei, Z., Li, Y., Jiang, Y.Gaussian Process Regression model.
RUL Prediction of Lithium-Ion Battery Based on Gauss-Hermite Particle Filter [32]Ma, Y., Chen, Y., Zhou, X W., Chen, H.RUL and SoH prediction model.
Battery-Degradation Model Based on the ANN Regression Function for EV Applications [33]May, G., El-Shahat, A.Neural Network-based prediction model.
Lithium-Ion Batteries Health Prognosis Considering Aging Conditions [34]El Mejdoubi, A., Chaoui, H., Gualous, H., Van Den Bossche, P., Omar, N., Van Mierlo, J.RUL predictive model.
A Design-Based Predictive Model for Lithium-Ion Capacitors [35]Moye, D.G., Moss, P.L., Chen, X.J., Cao, W.J., Foo, S.Y.A predictive model of Capacitors.
A Neural-Network-Based Method for RUL Prediction and SoH Monitoring of Lithium-Ion Battery [36]Qu, J., Liu, F., Ma, Y., Fan, J.Neural Network-based model.
Empirical Electrical and Degradation Model for Electric Vehicle Batteries [37]Saldaña, G., Martín, J.I.S., Zamora, I., Asensio, F.J., Oñederra, O., González, M.Degradation model based on actual LG battery cell.
The Co-Estimation of SoC, SoH, and State of Function for Lithium-Ion Batteries in Electric Vehicles [38]Shen, P., Ouyang, M.G., Lu, L.G., Li, J.Q., Feng, X.N.SoH predictive model.
Real-Time State-of-Health Estimation of Lithium-Ion Batteries Based on the Equivalent Internal Resistance [39]Tan, X., Tan, Y., Zhan, D., Yu, Z., Fan, Y., Qiu, J., Li, J.SoH and SoC predictive model.
A Health Monitoring Method Based on Multiple Indicators to Eliminate Influences of Estimation Dispersion for Lithium-Ion Batteries [40]Tang, J., Liu, Q., Liu, S.,Xie, X., Zhou, J., Li, Z.SoH estimation of Lithium-ion batteries.
Fractional-Order Model-Based Incremental Capacity Analysis for Degradation State Recognition of Li-Ion Batteries [41]Tian, J.P., Xiong, R., Yu, Q.Q.SoH predictive model.
ML Applied to Electrified Vehicle Battery SoC and SoH Estimation: State-of-the-Art [42]Vidal, C., Malysz, P., Kollmeyer, P., Emadi, A.ML-based prediction model.
State-of-Health Estimation for Lithium-Ion Batteries Based on the Multi-Island Genetic Algorithm and the Gaussian Process Regression [43]Wang, Z., Ma, J., Zhang, L.SoH estimation of Lithium-ion batteries.
RUL Prediction and SoH Diagnosis for Lithium-Ion Batteries Using Particle Filter and Support Vector Regression [44]Wei, J.W., Dong, G.Z., Chen, Z.H.RUL and SoH estimation model.
SoH Estimation for Lithium-Ion Batteries Based on Healthy Features and Long Short-Term Memory [45]Wu, Y., Xue, Q., Shen, J., Lei, Z., Chen, Z., Liu, Y.Neural Network SoH estimation model.
State-of-Health Prognosis for Lithium-Ion Batteries Considering the Limitations in Measurements via Maximal Information Entropy and Collective Sparse Variational Gaussian Process [46]Xiang, M., He, Y., Zhang, H., Zhang, C., Wang, L., Wang, C., Sui, C.Neural Network SoH estimation model.
State-of-Health Estimation for Lithium-Ion Batteries Based on Wiener Process with Modeling the Relaxation Effect [47]Xu, X., Yu, C., Tang, S., Sun, X., Si, X., Wu, L.SoH estimation of Lithium-ion batteries.
Novel Lithium-Ion Battery State-of-Health Estimation Method Using a Genetic Programming Model [48]Yao, H., Jia, X., Zhao, Q., Cheng, Z., Guo, B.SoH estimation model.
RUL Estimation of Lithium-Ion Batteries Based on Optimal Time Series Health Indicator [49]Yun, Z., Qin, W.Bayesian Monte Carlo prediction model.
Capacity Prognostics of Lithium-Ion Batteries Using EMD Denoising and Multiple Kernel RVM [50]Zhang, C., He, Y., Yuan, L., Xiang, S.Monte Carlo prediction model.
RUL Prediction for Lithium-Ion Batteries Based on Exponential Model and Particle Filter [51]Zhang, L., Mu, Z., Sun, C.RUL prediction model.
Lithium-Ion Battery RUL Prediction with Box-Cox Transformation and Monte Carlo Simulation [52]Zhang, Y., Xiong, R., He, H., Pecht, M.G.RUL prediction model.
Hybrid Lithium Iron Phosphate Battery and Lithium Titanate Battery Systems for Electric Buses [6]Zhang, X., Peng, H., Wang, H., Ouyang, M.Novel hybrid battery system accounting for behavior.
State-of-Health Prediction for Lithium-Ion Batteries with Multiple Gaussian Process Regression Model [53]Zheng, X., Deng, X.SoH Grey Relational Analysis.
SoH Monitoring and RUL Prediction of Lithium-Ion Batteries Based on Temporal Convolutional Network [54]Zhou, D., Li, Z., Zhu, J., Zhang, H., Hou, L.RUL prediction model.
Table 3. Description of literature review.
JournalNo.RankPublisherCountryField
IEEE Access25Q1IEEE Inc.United StatesComputer Science
IEEE Transactions on Industrial Electronics5Q1 United StatesComputer Science, Engineering
IEEE Transactions on Vehicular Technology4Q1IEEE Inc.United StatesAerospace Engineering, Applied Mathematics, Automotive Engineering, Computer Networks and Communications, Electrical and Electronic Engineering
Journal of Power Sources3Q1ElsevierThe NetherlandsChemistry, Energy, and Engineering
Journal of Energy Storage2Q1ElsevierThe NetherlandsEnergy and Engineering
IEEE Global Humanitarian Tech. Conference1 United StatesBusiness, Engineering, Management and Accounting
IEEE Transactions on Control Systems Technology1Q1IEEE Inc.United StatesEngineering
IEEE Transactions on Transportation Electrification1Q1IEEE Inc.United StatesEnergy, Engineering and Social Sciences
Journal of Cleaner Production1Q1Elsevier Ltd.The NetherlandsBusiness, Energy, Engineering and Environmental Science
Mechanical Systems and Signal Processing1Q1Academic Press Inc.United StatesComputer Science, Engineering
Renewable and Sustainable Energy Reviews1Q1Elsevier Ltd.The NetherlandsEnergy
Table 4. List of most important papers and their specific contributions.
AuthorTitleRankContributions
Qu, J., Liu, F., Ma, Y., Fan, J.A Neural Network-based Method for RUL Prediction and SoH Monitoring of Li-Ion Battery [36]Q1Data-driven methods are faster and less complex than model-based methods.
ML methods can improve model accuracy.
Saldaña, G., Martín, J.I.S., Zamora, I., Asensio, F.J., Oñederra, O., González, M.Empirical Electrical and Degradation Model for EV Batteries [37]Q1Knowing the rate of battery degradation is necessary for technology delivery and performance improvement.
Aging depends on the level of electrical current, the depth of discharge, and the number of cycles made.
Temperature, current level, and the number of cycles are the variables that have the most significant impact on battery degradation.
The driving environment is also considered to be of great relevance to battery degradation.
Singh Ceng, M., Janardhan Reddy, K.Predicting Life-Cycle Estimation of Electric Vehicle Battery Pack through Degradation by Self Discharge and Fast Charging [11]Q1Rising need to increase the working life of battery packs used in electric vehicles.
Vidal, C., Malysz, P., Kollmeyer, PEmadi, A.ML Applied to Electrified Vehicle Battery SoC and SoH Estimation: State-of-the-Art [42]Q1AI and ML have actively contributed to an increase in research and development of new methods to estimate the states of EVs.
Few studies focus on SoC and SoH at negative temperatures.
Zhang, X., Peng, H., Wang, H., Ouyang, M.Hybrid Li Iron Phosphate Battery and Lithium Titanate Battery Systems for Electric Buses [6]Q1Novel hybrid battery system.
Accounts for driving behavior and charging patterns.
Table 5. SPSS coefficients table with all variables.
ModelUnstandardized BCoefficients Std.
Error
Standardized Coefficients
Beta
tSig.
(Constant)−57,621.01622,213.139 −2.5940.14
Country18.18728.6680.0800.6340.530
Year28.62611.0150.4822.5990.014
Maker7.2493.6030.2752.0120.052
Model−0.5434.627−0.016−0.1170.907
Charging place6.2558.6000.0980.7270.472
Freq. Fast−12.1539.883−0.142−1.2300.228
Freq. Full6.2946.3720.1140.9880.331
Freq. Empty−5.9347.133−0.097−0.8320.411
Parking place27.39117.1420.1811.5980.120
Mileage0.0000.000−0.068−0.3830.704
Table 6. Model Summary—Variable: Max Range.
ModelRR SquareAdjusted R SquareStd. Error of the Estimate
10.799 a0.6390.529102.80863
a Predictors: (Constant), Mileage, Model, Freq. Fast, Freq. Full, Parking Place, Freq. Empty, Charging Place, Maker, Year.
Table 7. Analysis of Variance test—ANOVA—Variable: Max range (km).
Sum of SquaresdfMean SquareFSig.R Square Change
Subset TestsCountry4253.86314253.8630.4020.530 a0.004
Year71,381.357171,381.3576.7530.014 a0.074
Maker42,770.419142,770.4194.0470.052 a0.044
Model145.6191145.6190.0140.907 a0.000
Charging place5592.19515592.1950.5290.472 a0.006
Freq. Fast15,981.447115,981.4471.5120.228 a0.017
Freq. Full10,310.086110,310.0860.9750.331 a0.011
Freq. Empty7315.52317315.5230.6920.411 a0.008
Parking Place26,985.191126,985.1912.5530.120 a0.028
Mileage1548.50811548.5080.1470.704 a0.002
Regression 616,605.5931061,660.5595.8340.000 b
Residual 348,797.2723310,569.614
Total 965,402.86543
a Tested against the entire model. b Predictors in the Full Model: (Constant), Mileage, Model, Freq. Fast, Freq. Full, Country, Parking Place, Freq. Empty, Charging place, Maker, Year.
Table 8. Model Summary—Usage of outdoor charging solutions and obstacles found.
ModelRR SquareAdjusted R SquareStd. Error of the EstimateChange Statistics
R Square ChangeF Changedf1df2Sig. F Change
10.667 a0.444−1.2221.632990.4440.267310.852
a Predictors: (Constant), Importance: EV maximum range, Agreement: Charging EVs is difficult, Importance: number of charging stations.
Table 9. Analysis of variance—Importance of the number of available charging stations.
Model Sum of Squares df Mean Square F p Value
Regression2.13330.7117.2670.012 a
Residual2.66712.667
Total4.8004
Dependent Variable: Indoor/Outdoor charging. a Predictors: (Constant), Importance: EV maximum range, Agreement: Charging EVs is difficult.
Table 10. Model Summary—Shared charging system b.
ModelRR SquareAdjusted R SquareStd. Error of the EstimateChange Statistics
R Square ChangeF Changedf1df2Sig. F Change
10.831 a0.6900.4501.3170.6902.86714180.019
a Predictors: (Constant), Number of vehicles per household, Frequency of trips between 50 and 100 Km per day, Maximum acceptable charging time for an EV (Hours), Frequency of trips up to 50 Km per day, Gender distribution, Agreement: Charging EVs is difficult, Frequency of trips with more than 100 Km per day, Agreement: EV charging cost is lower, Number of elements per household, Importance: operating costs, Age distribution, Minimum range in kilometers to consider buying an EV, Importance: EV maximum range, Importance: charging costs. b Dependent Variable: Importance of having a shared charging system in the condominium’s garage with individual consumption accounting (through the condominium account)?
Table 11. Analysis of Variance—Importance of having a shared charging system.
ANOVA a
ModelSum of SquaresdfMean SquareFp Value
1Regression69.667144.9762.8670.019 b
Residual31.242181.736
Total100.90932
a Dependent Variable: Importance of having a shared charging system in the condominium’s garage with individual consumption accounting (through the condominium account)? b Predictors: (Constant), Number of vehicles per household, Frequency of trips between 50 and 100 Km per day, Maximum acceptable charging time for an EV (Hours), Frequency of trips up to 50 Km per day, Gender distribution, Agreement: Charging EVs is difficult, Frequency of trips with more than 100 Km per day, Agreement: EV charging cost is lower, Number of elements per household, Importance of operating costs, Age distribution, Minimum range in kilometers to consider buying an EV, Importance of EV maximum range, Importance of charging costs.
Table 12. Coefficients table—Importance of having a shared charging system.
Coefficients a
ModelUnstandardized
Coefficients
Standardized CoefficientstSig.Correlations
BStd. ErrorBetaZero-OrderPartialPart
(Constant)−5.6935.288 −1.0770.296
Agreement: Charging EVs is difficult−0.3190.259−0.199−1.2330.233−0.270−0.279−0.162
Importance: charging costs0.7520.7760.2690.9680.3460.3820.2220.127
Importance: EV maximum range−0.2420.514−0.117−0.4710.6440.045−0.110−0.062
Maximum acceptable charging time for an EV (Hours)0.0590.1370.1030.4290.6730.1130.1010.056
Agreement: EV charging cost is lower0.5930.2300.4652.5770.0190.4350.5190.338
Importance: operating costs1.0330.7910.3571.3070.2080.4430.2940.171
Minimum range in kilometers to consider buy an EV−0.0010.002−0.119−0.6050.552−0.286−0.141−0.079
Frequency of trips up to 50 Km per day0.2040.2650.1140.7710.451−0.0680.1790.101
Frequency of trips between 50 and 100 Km per day0.0090.1380.0120.0680.9460.0750.0160.009
Frequency of trips with more than 100 Km per day0.2750.1260.3272.1850.0420.4290.4580.287
Gender distribution0.1780.7080.0470.2510.805−0.1100.0590.033
Age distribution−0.1850.515−0.068−0.3590.723−0.143−0.084−0.047
Number of elements per household−0.0620.425−0.025−0.1460.886−0.241−0.034−0.019
Number of vehicles per household0.1070.4250.0500.2530.803−0.2210.0600.033
a Dependent Variable: Importance: having a shared charging system in the condominium’s garage with individual consumption accounting (through the condominium account)?
Publisher’s Note: MDPI stays neutral with regard to jurisdictional claims in published maps and institutional affiliations.

