Article

Research on Establishment of Vehicle Energy Distribution Model and Energy Consumption Optimization Based on Electric Hybrid System

Automotive Engineering Research Institute, BYD Auto Industry Co., Ltd., Shenzhen 518118, China
*
Author to whom correspondence should be addressed.
World Electr. Veh. J. 2021, 12(4), 213; https://doi.org/10.3390/wevj12040213
Submission received: 20 August 2021 / Revised: 17 September 2021 / Accepted: 29 September 2021 / Published: 1 November 2021

Abstract

:
In order to improve the adaptability and accuracy of the system average efficiency model in energy consumption analysis of working conditions, this paper presents a vehicle energy distribution model based on the layout and powertrain operation features of the electric hybrid system, and presents a vehicle energy consumption optimization method for control strategy and hardware quality optimization based on the guidance of the energy distribution model.

1. Introduction

Environmental degradation and energy crisis are the key issues of spherical consumption and emission regulation. Hybrid power systems is one of the important directions of automobile marker. The average fuel consumption limit of new passenger car is stipulated in the “Energy-Saving and New Energy Vehicle Roadmap 2.0” [1], prompting major car companies to introduce their hybrid power systems one after another. Among them are Honda i-MMD, Toyota THS, and BYD P3+P4 configurations. The i-MMD configuration is small in size, convenient in arrangement, deep mixing of motor and engine, and has remarkable fuel saving effect. Toyota THS configuration has obvious fuel saving effect, but the matching and calibration of planetary gear system and motor is difficult, the control complexity is high, and the patent coverage is high [2,3]. BYD P3+P4 configuration structure is simple, easy to control and with excellent acceleration performance [4]; this architecture of hybrid electric vehicle emphasizes power, and economy performance is slightly weak.
Based on this severe internal and external competitive pressure, a company (hereinafter referred to as A Company) introduced a new dual-mode hybrid powertrain system named electric hybrid system (EHS). The vehicle has excellent economy which, equipped with the electric hybrid system at the same time, provides a driving experience similar to pure electric vehicle. Due to the high integration and coupling degree of EHS, and the complexity of control and match debugging, it is difficult to study the vehicle energy management and optimization.
Zeng presented a power loss model and used it for energy consumption analysis [5]; based on the working mode and working time of the hybrid system under working conditions, a general average power loss model can be established, and then the energy consumption of the hybrid system is optimized from the aspects of optimizing the regeneration and adjusting the working mode. After that, Zeng presented an energy calculation model and used it for energy consumption analysis [6], this model integrates the research results of the internal energy flow of the hybrid system, conventional fuel-saving methods, regenerative braking, and engine fuel consumption rate, etc., and then calculates the average comprehensive transmission efficiency, and the feasibility of the model is verified in the research of the power split hybrid system. Whether it is power loss model or energy calculation model, it is closely related to the working conditions and duration of the hybrid system, so the adaptability to operating conditions is poor, the adaptability of the condition and accuracy of analysis needs to be improved. Morteza studied optimal energy management methods for various configuration of plug-in and hybrid electric vehicles [7]; this article is based on the method of MATLAB and ADVISOR co-simulation, which showed that battery model, transmission system, hybridization, driving cycle, and control strategies had varying degrees of impact on energy consumption. For example, the fuel consumption and exhaust emissions with regard to HEV driving performance requirements reduce by about 14% and 12%, respectively. Gokce presented an instantaneous optimization algorithm based on the knowledge of the efficiency maps of the engine and the generator for the energy management system in hybrid electric vehicles [8], it is crucial that the engine operating points were determined by assessing not only the efficiency map of the engine but also the efficiency map of the generator and the charge/discharge efficiency of the battery pack in order to maximize the efficiency of the energy delivered from the hybrid energy source to the drive system. Jeong presented a power management strategy for a parallel hybrid electric bus based on the Pontryagin’s minimum principle [9], and proved the most efficient performance with respect to the fuel economy is the maintenance of the battery SOC, while the application of PMP-based power management strategy to a conventional vehicle has a difficulty due to the fuel vehicles do not need to discuss the issue of SOC maintenance, and the applicability of new energy vehicles in other architectures is also unknown.
In this paper, an energy distribution model based on the architecture and mode switching strategy of the electric hybrid system is proposed, and a method which integrates software (control strategy) optimization and hardware upgrade for vehicle energy consumption reduction is proposed. Among them, most important is to study the longitudinal dynamic model, engine model, electric drive model, battery model, control models, and other models, and establish the vehicle energy distribution model. Then, based on the energy distribution model and the energy flow state of the hybrid system, MATLAB is used to quantitatively analyze the energy consumption of each module of the system, and the modules with lower efficiency are found in order to explore ways to reduce energy consumption. Simultaneously with the simulation calculation, the vehicle bench test was also carried out to verify the accuracy and adaptability of the model. This paper synthesizes previous research experience, points out the way and mechanism of reducing energy consumption, and verifies the rationality of theoretical calculation method and result by bench test, which could promote vehicle economy to a new level.

2. Powertrain Layout and Powertrain Operation Features of Electric Hybrid System

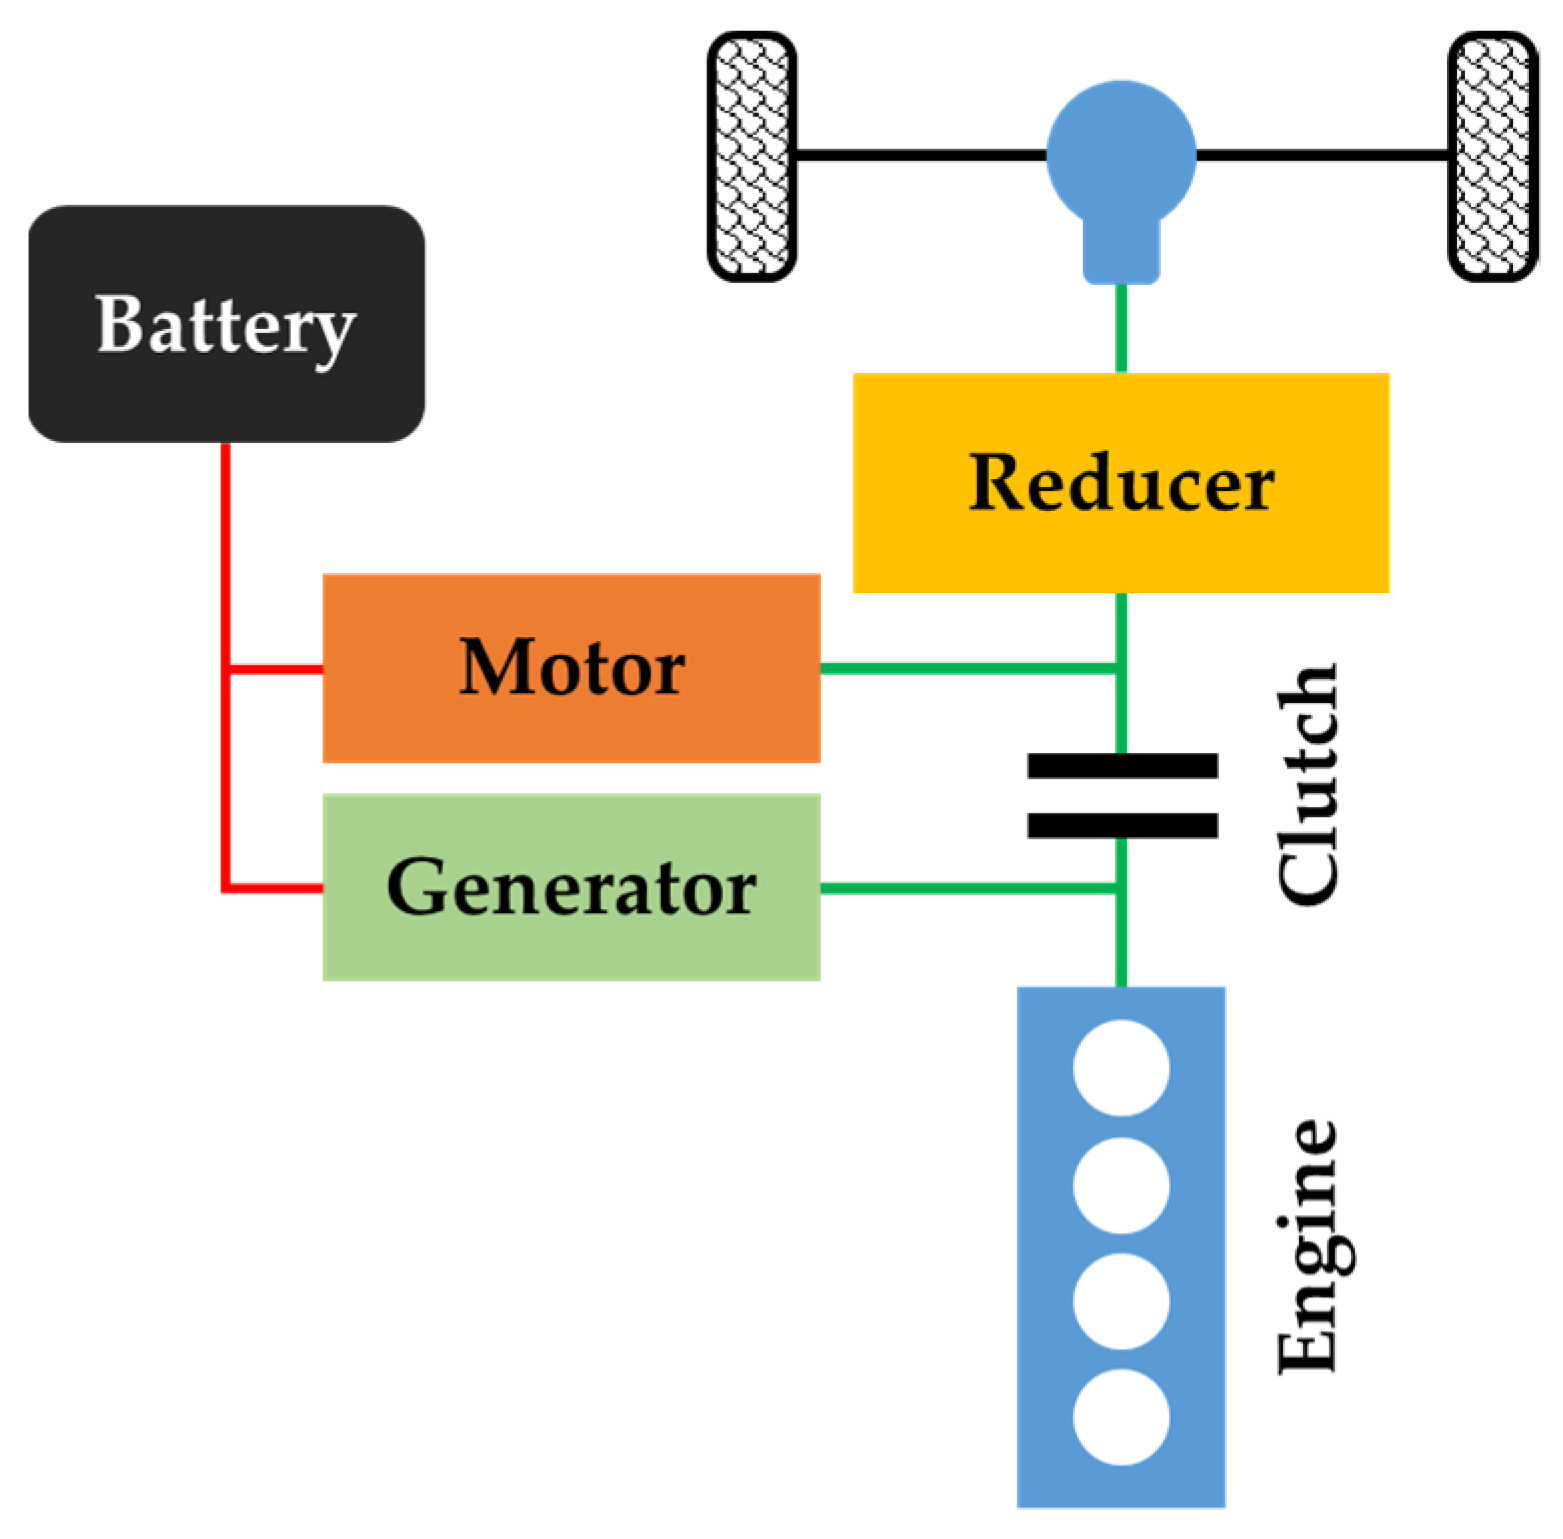
2.1. Powertrain Layout of Electric Hybrid System

The electric hybrid system is mainly composed of Atkinson cycle engine, dedicated hybrid transmission (DHT) system which integrates the forming winding generator and traction motor, and dual electric control system. As shown in Figure 1, the important characteristic parameters of the components of the EHS are shown in Table 1. The engine and generator are driven by gears, and the engine can be fully decoupled from the wheel by the clutch, while the traction motor is connected with the wheel by the single-stage reducer and differential. The generator is mainly used for power absorption in the process of engine starting, series generation, and mode shifting. The traction motor is used for forward and backward motion, and generation in the state of parallel hybrid driving mode, and the energy recovery during braking.

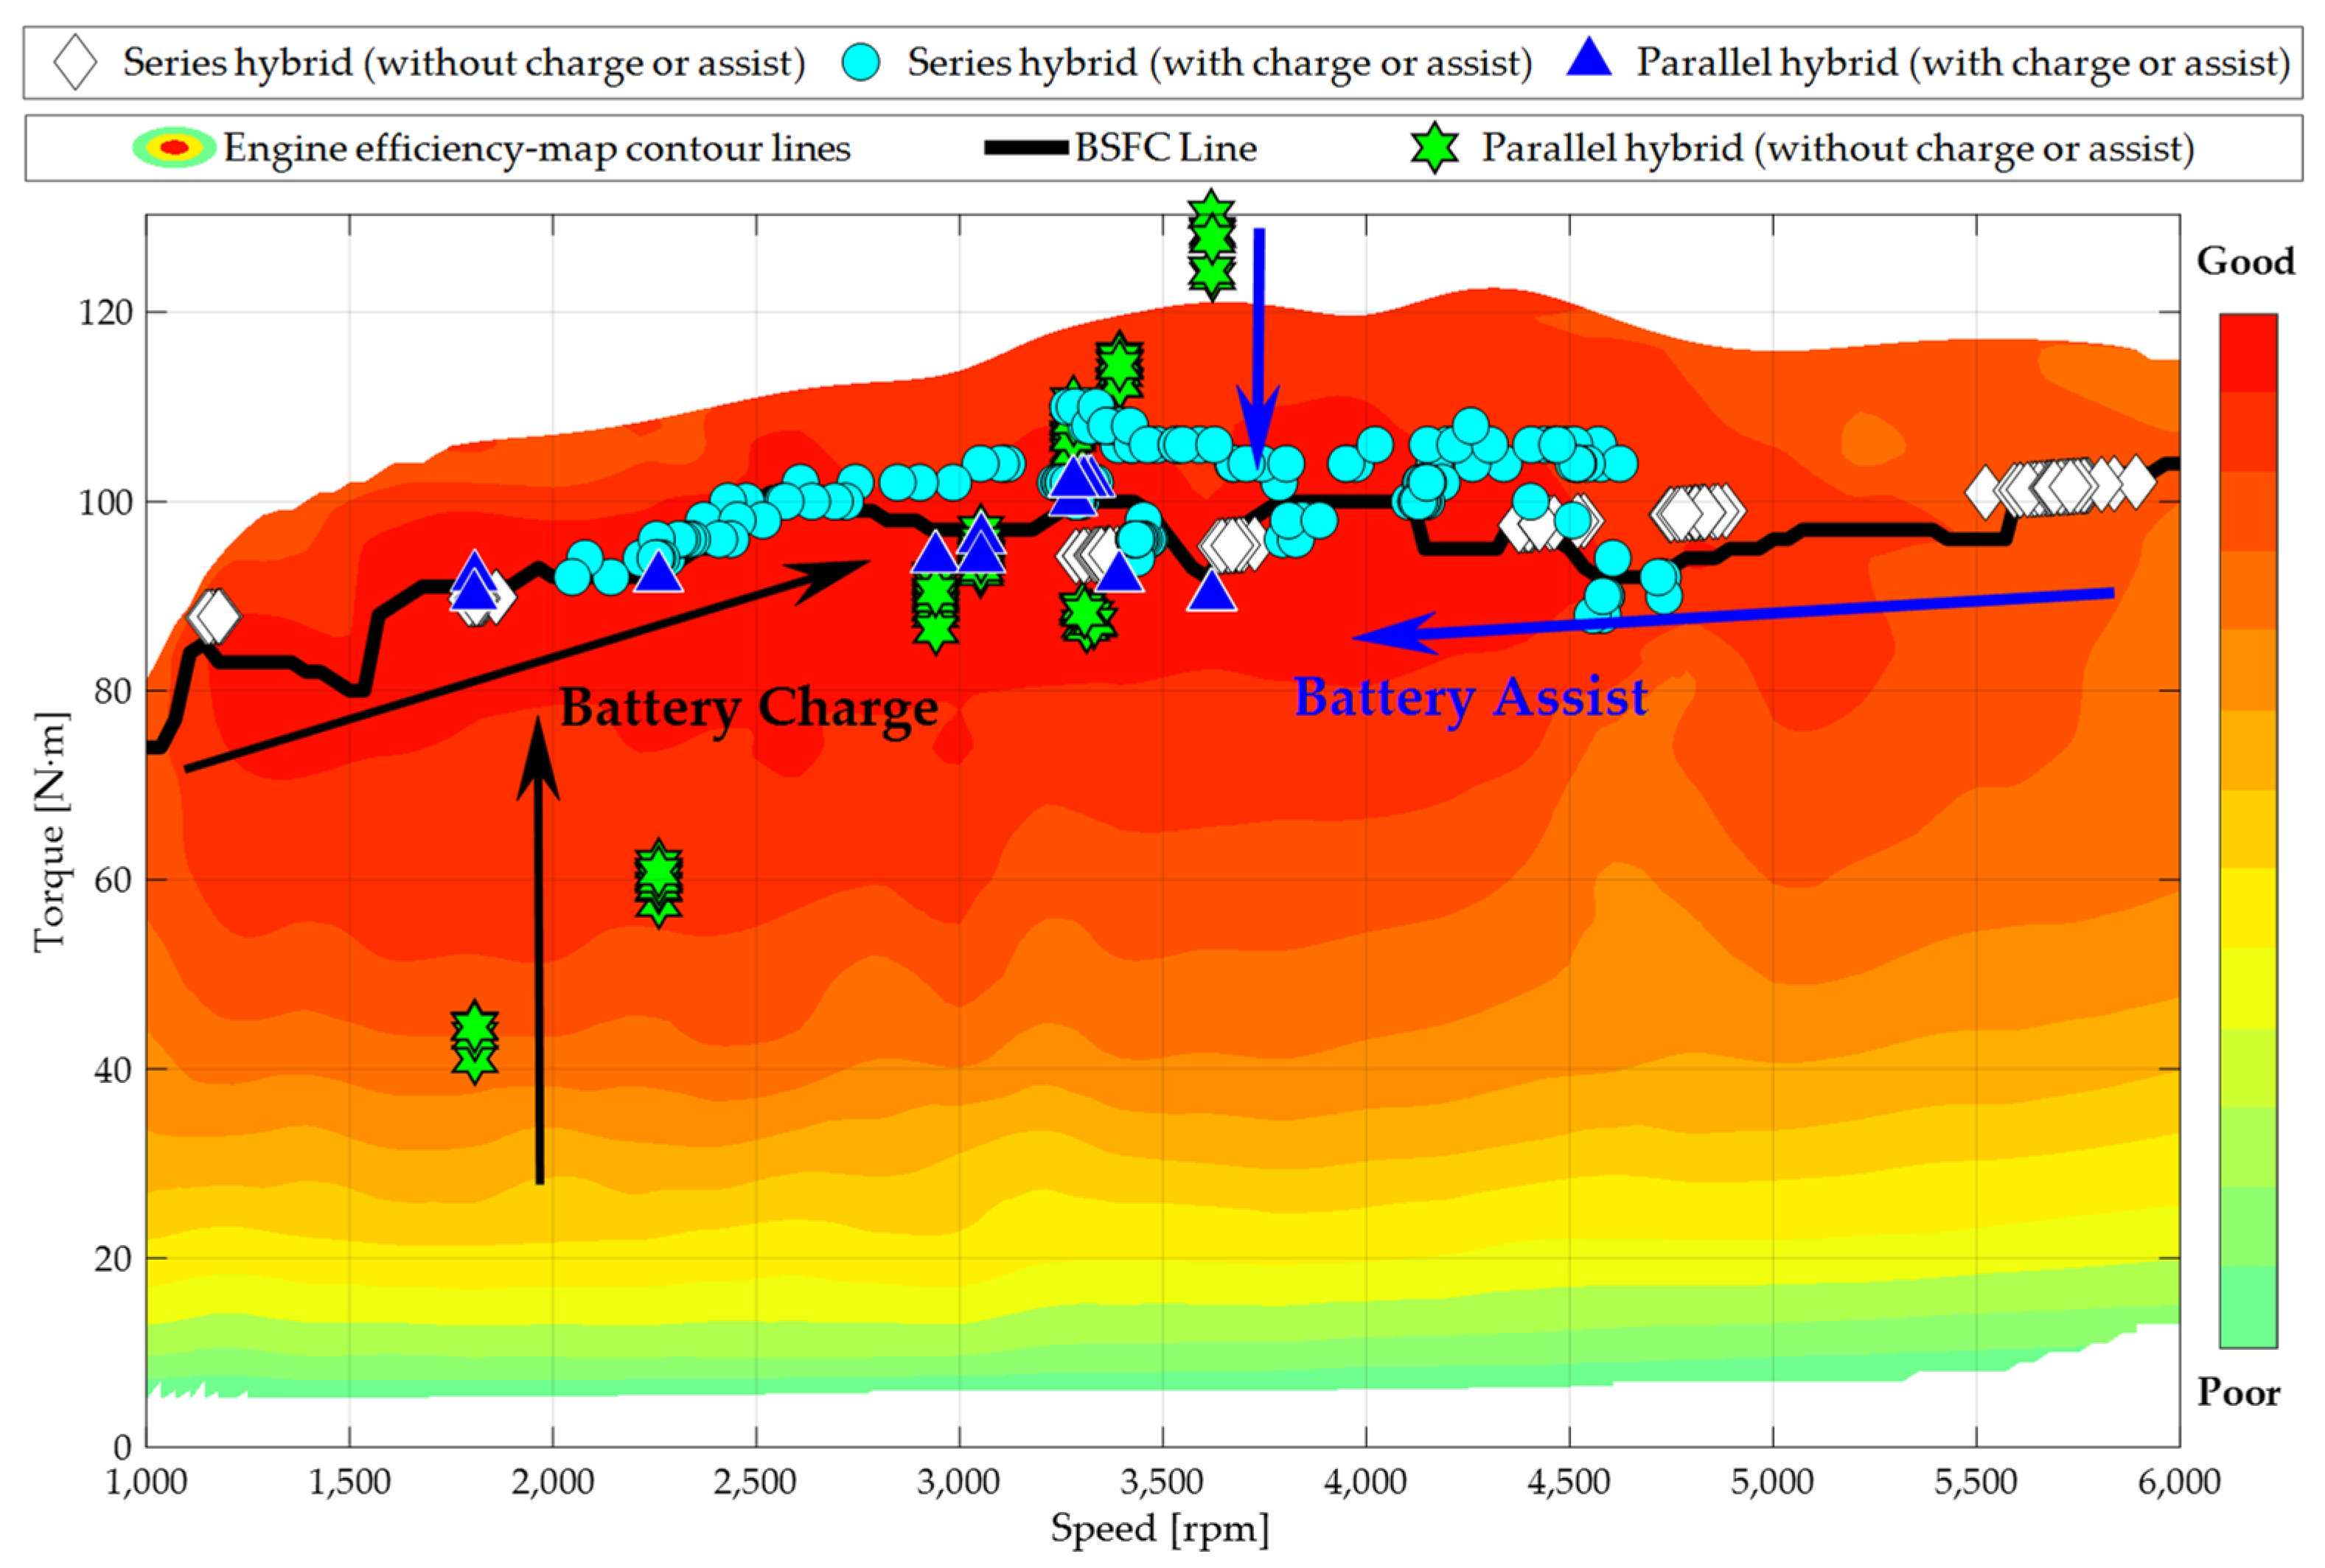
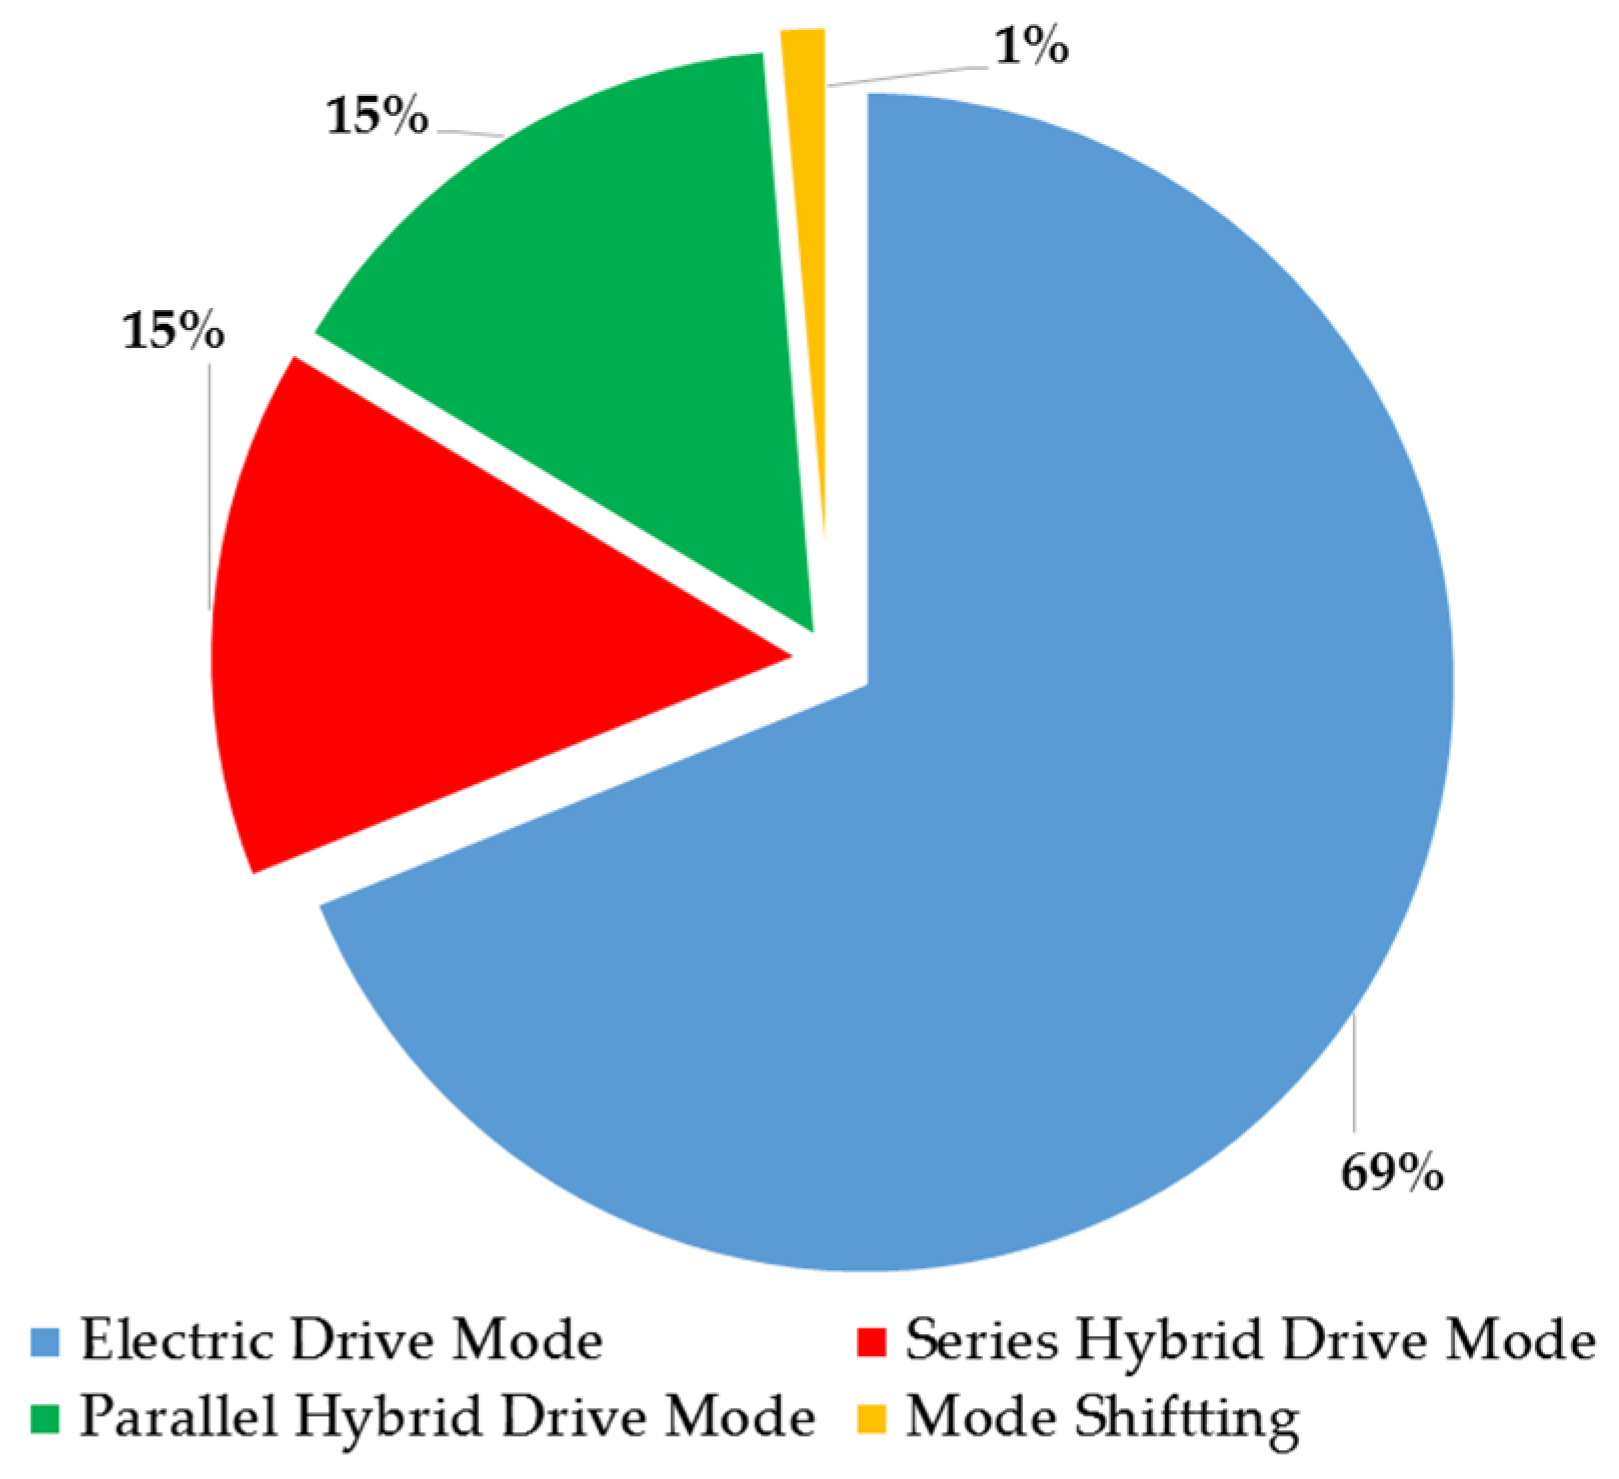
2.2. Powertrain Operation Features of Electric Hybrid System

The electric hybrid system can be configured in plug-in hybrid electric vehicle (PHEV) and hybrid-electric vehicle (HEV). In this paper, we only analyze the deployment of the electric hybrid system in PHEV models, according to the difference of engine working state, the working mode of the whole vehicle can be divided into two types: CD (Charged Deploying) and CS (Charge Sustaining) phase. In CD mode, the vehicle is powered by the electric energy from the OBC (Onboard Charger), and driven by the traction motor. At the same time, the vehicle is an electric vehicle (EV). CS mode means that, when the SOC (State of Charge) value of high voltage battery is lower than the power balance point of the vehicle, the engine works and generates electricity to maintain the SOC within a specific range, at the same time, the vehicle is a hybrid-electric vehicle.
According to the characteristics of energy flow, the driving modes of an electric hybrid system can be divided into electric drive mode, series hybrid drive mode and parallel hybrid drive mode, as shown in Figure 2. According to different driving requirements and road conditions, the system can dynamically change the drive mode to improve the driving economy.
Electric drive mode: When the electric energy stored in the power battery is sufficient (i.e., the SOC is high), the battery discharge power can meet the power demand of the driver. When the vehicle operates in the electric drive mode, the electric stored in the power battery pack is used as the energy source to drive the motor, so as to realize the forward or backward motion of the vehicle.
Series hybrid drive mode: When the battery discharge power cannot meet the power demand of the vehicle, or the battery charge is low. The generator starts the engine, waits until the engine operation is stable, and works in its efficient area; the output mechanical energy is converted into electrical energy, and the vehicle is driven by the traction motor, which is the series hybrid driving mode. In this mode, the main energy source of the vehicle is the engine. When the electric power converted by the generator cannot meet the work rate demand of the vehicle, some electric power is obtained from the battery as supplement. Conversely, the excess electrical energy is stored in the battery.
Parallel hybrid drive mode: When the vehicle operates at the high speed cruise condition of engine start, or slight acceleration and deceleration, the demand power of the driver is small. The hydraulic system acts to combine the clutch so that the curved shaft of the engine is directly connected to the wheel, and the engine output directly drives the wheel to rotate. At this time, the vehicle is in parallel hybrid mode; in this mode, in order to enhance the robustness of the control system, ensure the dynamic response level of the vehicle, and improve the driving efficiency, the generator turns to reduce the reactive load of the engine, and the traction motor plays the role of power converter or power generation, at the same time, the battery acts as a discharge or charging state; its function is a buffer.
The main energy source of PHEV is the engine during the state of electric power deficiency, and the battery plays the role of reducing the peak and valley of the output power of engine. Therefore, the main logic of engine control in hybrid vehicles is to control the engine works in its high efficiency zone, and to ensure that the SOC is in a set range of fluctuation, as is the engine control strategy of the electric hybrid system (EHS). When the vehicle is in hybrid driving state after the engine starts, the dynamic adjustment of its driving mode, so that the vehicle driving efficiency is at a high level, as shown in Figure 3.
Compared with traditional energy vehicles, the main advantages and characteristics of new energy vehicles are that they provide fuel and other power sources, improve fuel economy, and improve emission performance. The special braking kinetic energy recovery technology of new energy vehicles can improve energy utilization efficiency and extend vehicle driving range without raising the cost of vehicle hardware and the braking reliability of transmission energy vehicles [2,3,10]. A Company has introduced the vehicle equipped with electric hybrid system and integrated power brake (IPB) system, which has all the functions of new energy vehicle braking system. Moreover, it has the function of motor regenerative braking and hydraulic braking fully decoupling control, which makes the braking response level of the vehicle significantly improved, and the brake pedal is linearly adjustable, which lays a firm foundation for the OTA (over-the-air) technology upgrade of other driving assistance or automatic driving systems. At the same time, under the effect of the optimal brake coupling control strategy, the brake force distribution between each shaft of the vehicle and the electric-hydraulic brake force on each axle are orderly and controllable, enabling the vehicle to achieve maximum kinetic energy recovery control under all operating conditions, thereby helping the vehicle reduce energy consumption to a certain extent, as shown in Figure 4.

3. Vehicle Energy Distribution Model

3.1. Energy Distribution Model

The energy consumption optimization method of hybrid vehicle has been widely verified and recognized, mainly from engine/electric drive system optimization, engine start/stop control, and energy recovery control method, etc. In this paper, according to the characteristics of driving mode of energy flow state division of the electric hybrid system (EHS), an energy distribution model based on the efficiency model interpolation calculation of each module of the system is proposed, and the theoretical energy consumption calculation is carried out using this model. The EHS is carried on the vehicle, except for the component models of the powertrain system, and also needs to introduce a battery model, accessory model, energy recovery model, vehicle control strategy model, and vehicle longitudinal dynamics model; their characteristics described as below.

3.1.1. The Longitudinal Dynamic Model
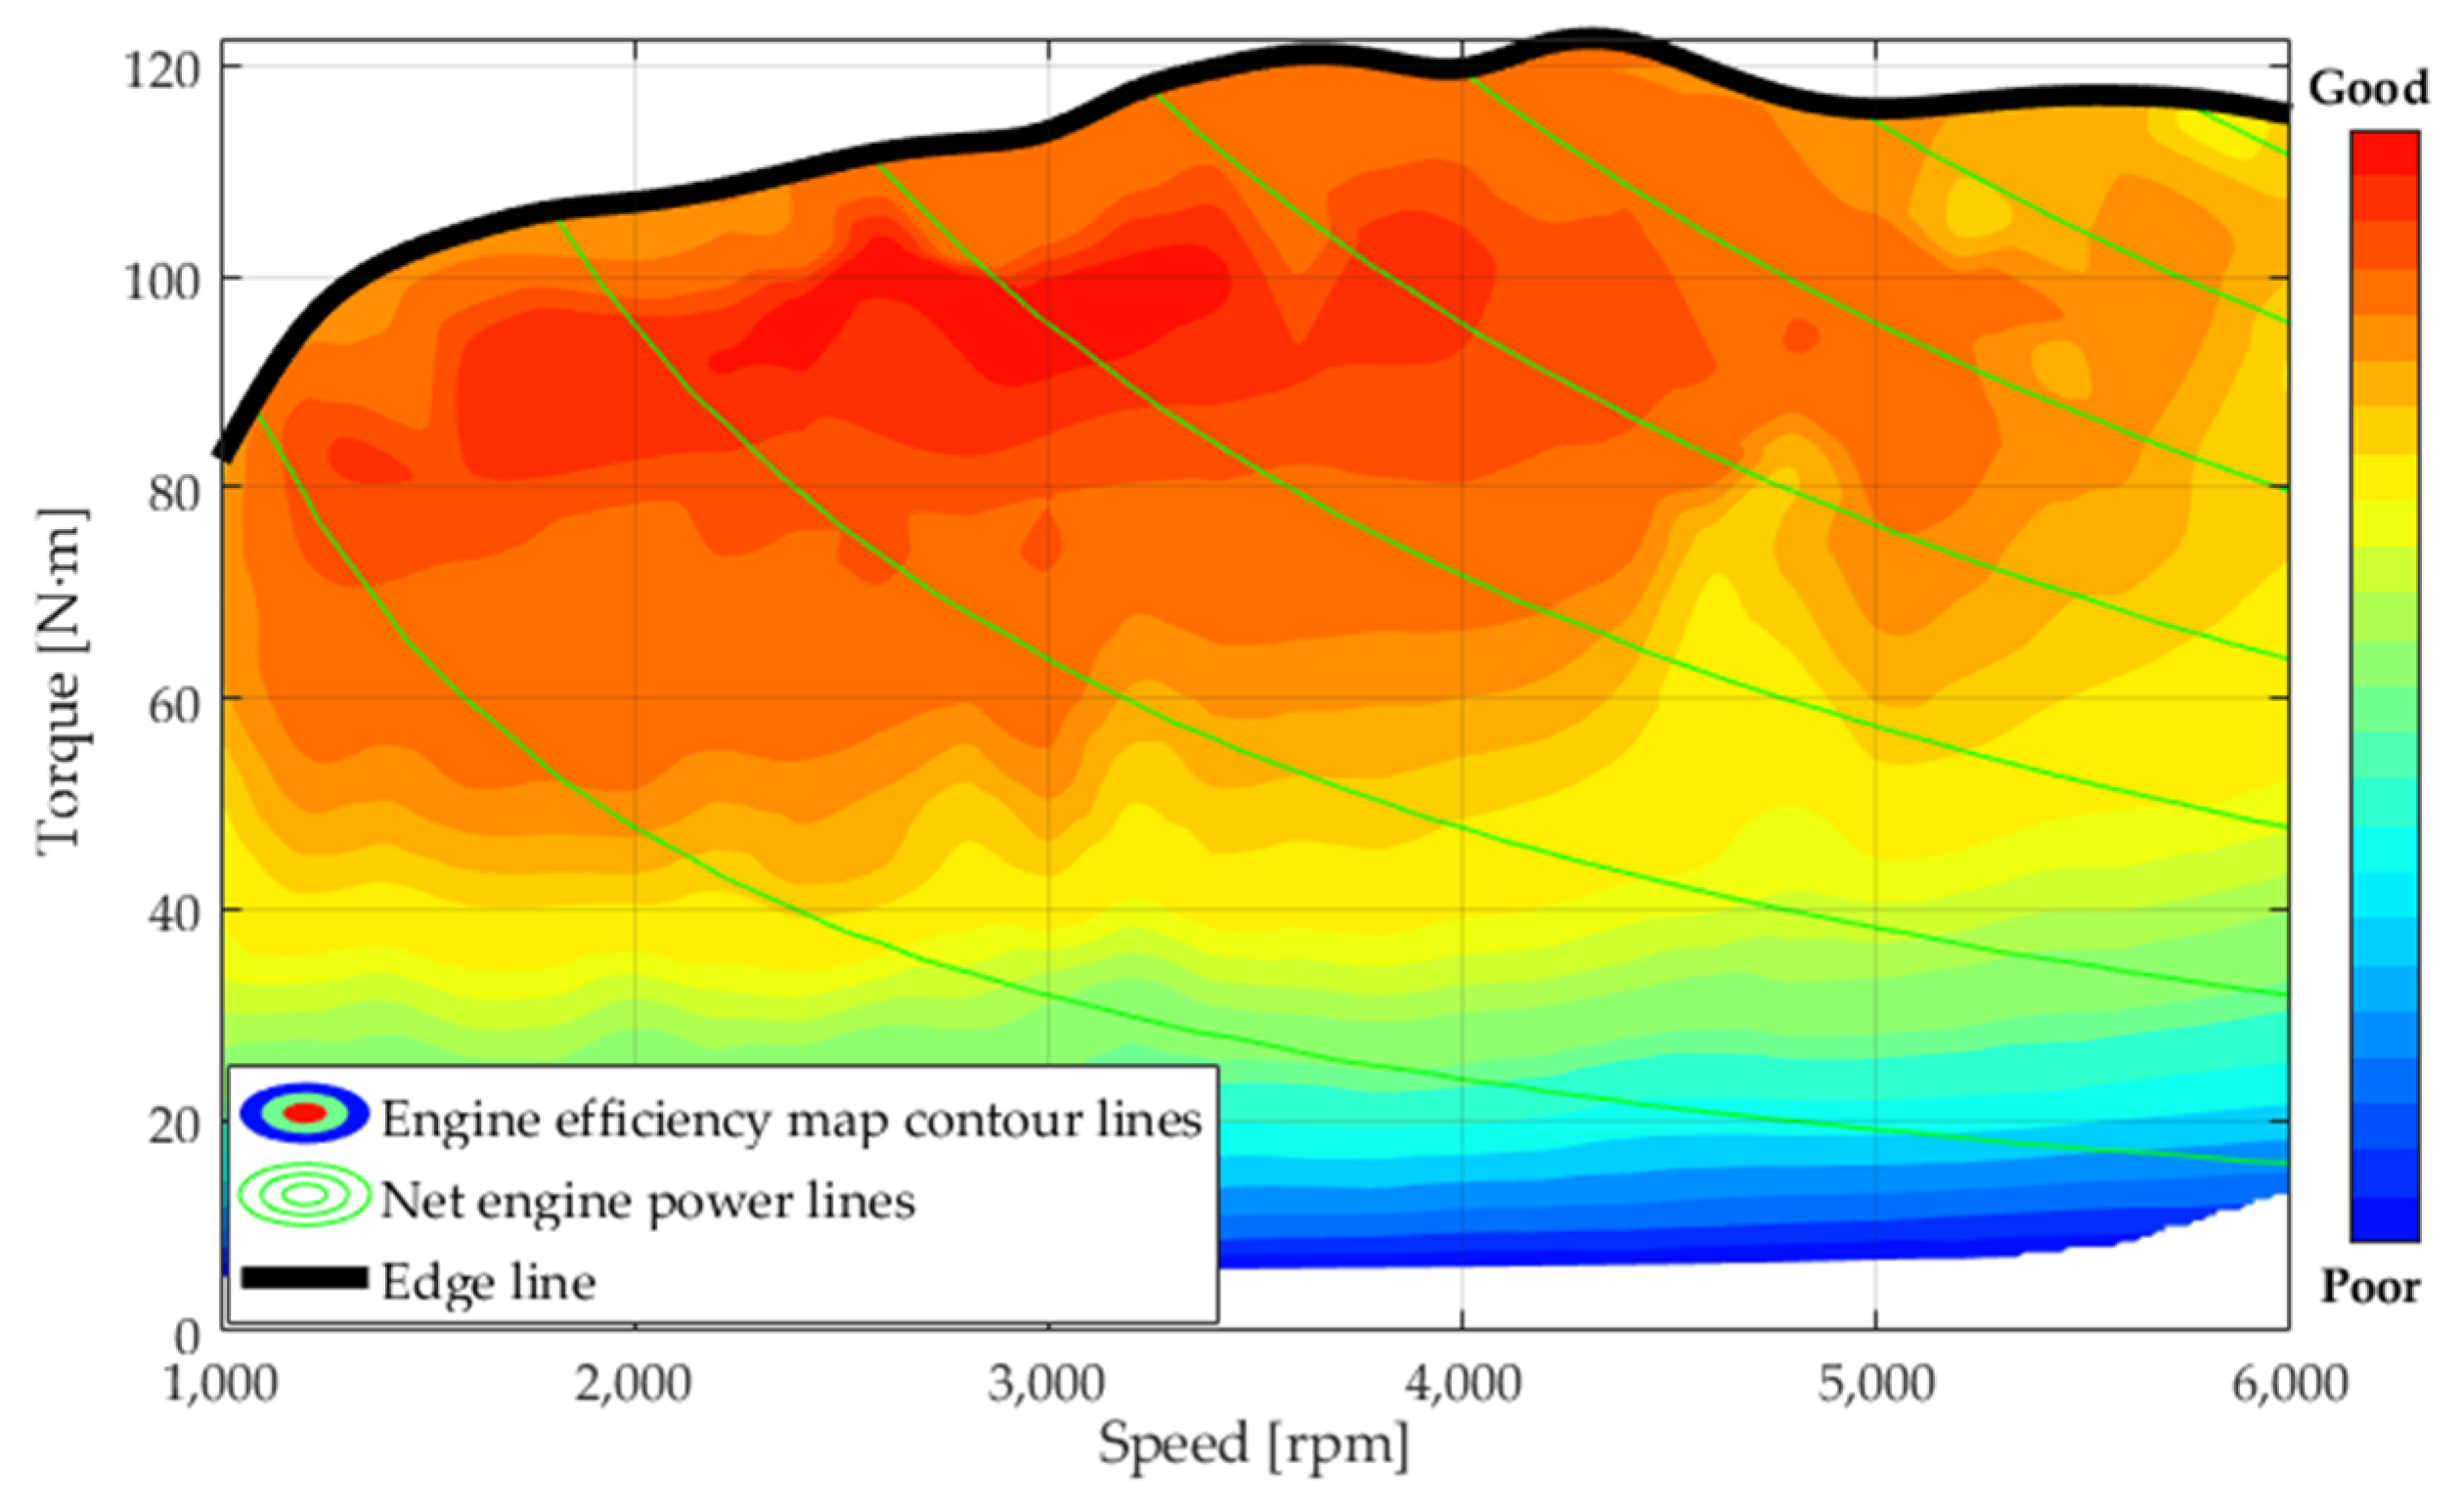
For hybrid vehicles, the research is mainly focused on the power system, so the handling stability and ride comfort are generally neglected. At the same time, the vehicle in the driving process is mainly influenced by driving resistance, driving force, or braking force together; the driving resistance generally includes acceleration resistance, rolling resistance, ramp resistance, air resistance, and inertial resistance. The longitudinal dynamic model is shown in Equation (1).
F t = F f + F w + F i + F j
In Equation (1), F t   is the driving force at the wheel of vehicle, F f   is rolling resistance, F w   is air resistance, F i   is slope resistance, and F j   is accelerated resistance. As the balance characteristics of driving force and driving resistance, and the slide resistance (including rolling resistance, air resistance, and slope resistance) can be obtained by a road test of the vehicle, and the resistance decomposition test of the vehicle is performed at the same time, the drag resistance of hub, bearing, driving wheel shaft, brake caliper, and motor can be obtained, so as to realize the conversion calculation of driving force from wheel to traction motor.

3.1.2. Engine Model

An engine is a combination of chemistry, power machinery, thermal physics, electrical, and other disciplines of the epochal products; the response characteristics, accuracy, and complexity of the engine model should be taken into account. Meanwhile, the precision of an engine’s torque identification has a great influence on the accuracy of the engine model. Therefore, the common engine modes are mainly based on the engine bench test data by fitting and interpolation or polynomial regression analysis. The models are shown in Equations (2) and (3).
m F u e l = f F u e l ( S E ,   T E )
T E _ m a x = f T _ E _ m a x ( S E )
In Equations (2) and (3), m F u e l is fuel consumption rate, which is related to engine speed and engine torque. At the same time, the engine output torque is also limited by the maximum engine torque. In this paper, the interpolation method is used to obtain the above fuel consumption and the output torque of the engine, the engine efficiency map is shown in Figure 5.

3.1.3. Electric Drive Model

For the electric hybrid system, both the traction motor and the generator should have dual functions of driving and generating, corresponding to the driving and brake recuperation of the vehicle, as well as the starting of the engine and the generation function of the series hybrid driving mode; the permanent magnet synchronous motor of shaped winding type is studied in this paper. The model of an electric drive system consists of two parts: motor and dual electric control. Due to the complexity of theoretical derivation and modeling, the model is developed by experimental modeling, the steady state efficiency map model is established, and the efficiency values at each working point of the electric drive system can be obtained by fitting and interpolation method. The models are shown in Equations (4) and (5).
η = f η ( S , T )
T m a x = f T _ m a x ( S )
In Equations (4) and (5), η is the system efficiency and T m a x is the maximum output torque of the system at a certain speed. The efficiency map of generator electric drive system and motor electric drive system are shown in Figure 6 and Figure 7.

3.1.4. Battery Model

A battery is an important energy storage unit of new energy vehicles, and plays the role of energy regulator in hybrid system, the second order RC model is used to characterize the battery, and state of charge is often used to describe the energy state of battery. The purpose of this paper is to study the characteristics of electric hybrid system (EHS) and the energy flow analysis method; therefore, the change of SOC value after charging or discharging is estimated by ampere hour integral method [11,12], and the influence of aging of battery is ignored. I battery models shown in Equations (6)–(9).
Δ S O C = 0 t K I d t Q N
K = K t × η
K t = 1 + 0.008 ( T a T )
S O C t = S O C 0 + Δ S O C
In Equations (6)–(9), K represents a constant related to temperature and charge/discharge efficiency factors, I represents the current during charging or discharging state, Q N represents capacity of battery at a standard temperature, K t represents a temperature-dependent coefficient, according to the big data analysis of bench test of A Company, the average value of η is 95%, T a represents the standard temperature, and T represents the ambient temperature. In order to simplify the analysis and facilitate the analysis during bench testing, Equation (6) can be converted to Equation (10).
Δ S O C = 0 t K P d t E N
In Equation (10), P represents the battery power during charging or discharging, E N   represents the battery energy at a standard temperature.
P D i s _ m a x = f P _ D i s _ m a x ( S O C )
P C h r _ m a x = f P _ C h r _ m a x ( S O C )
In Equations (11) and (12), P D i s _ m a x and P C h r _ m a x   are the maximum discharge/charge power at each SOC.

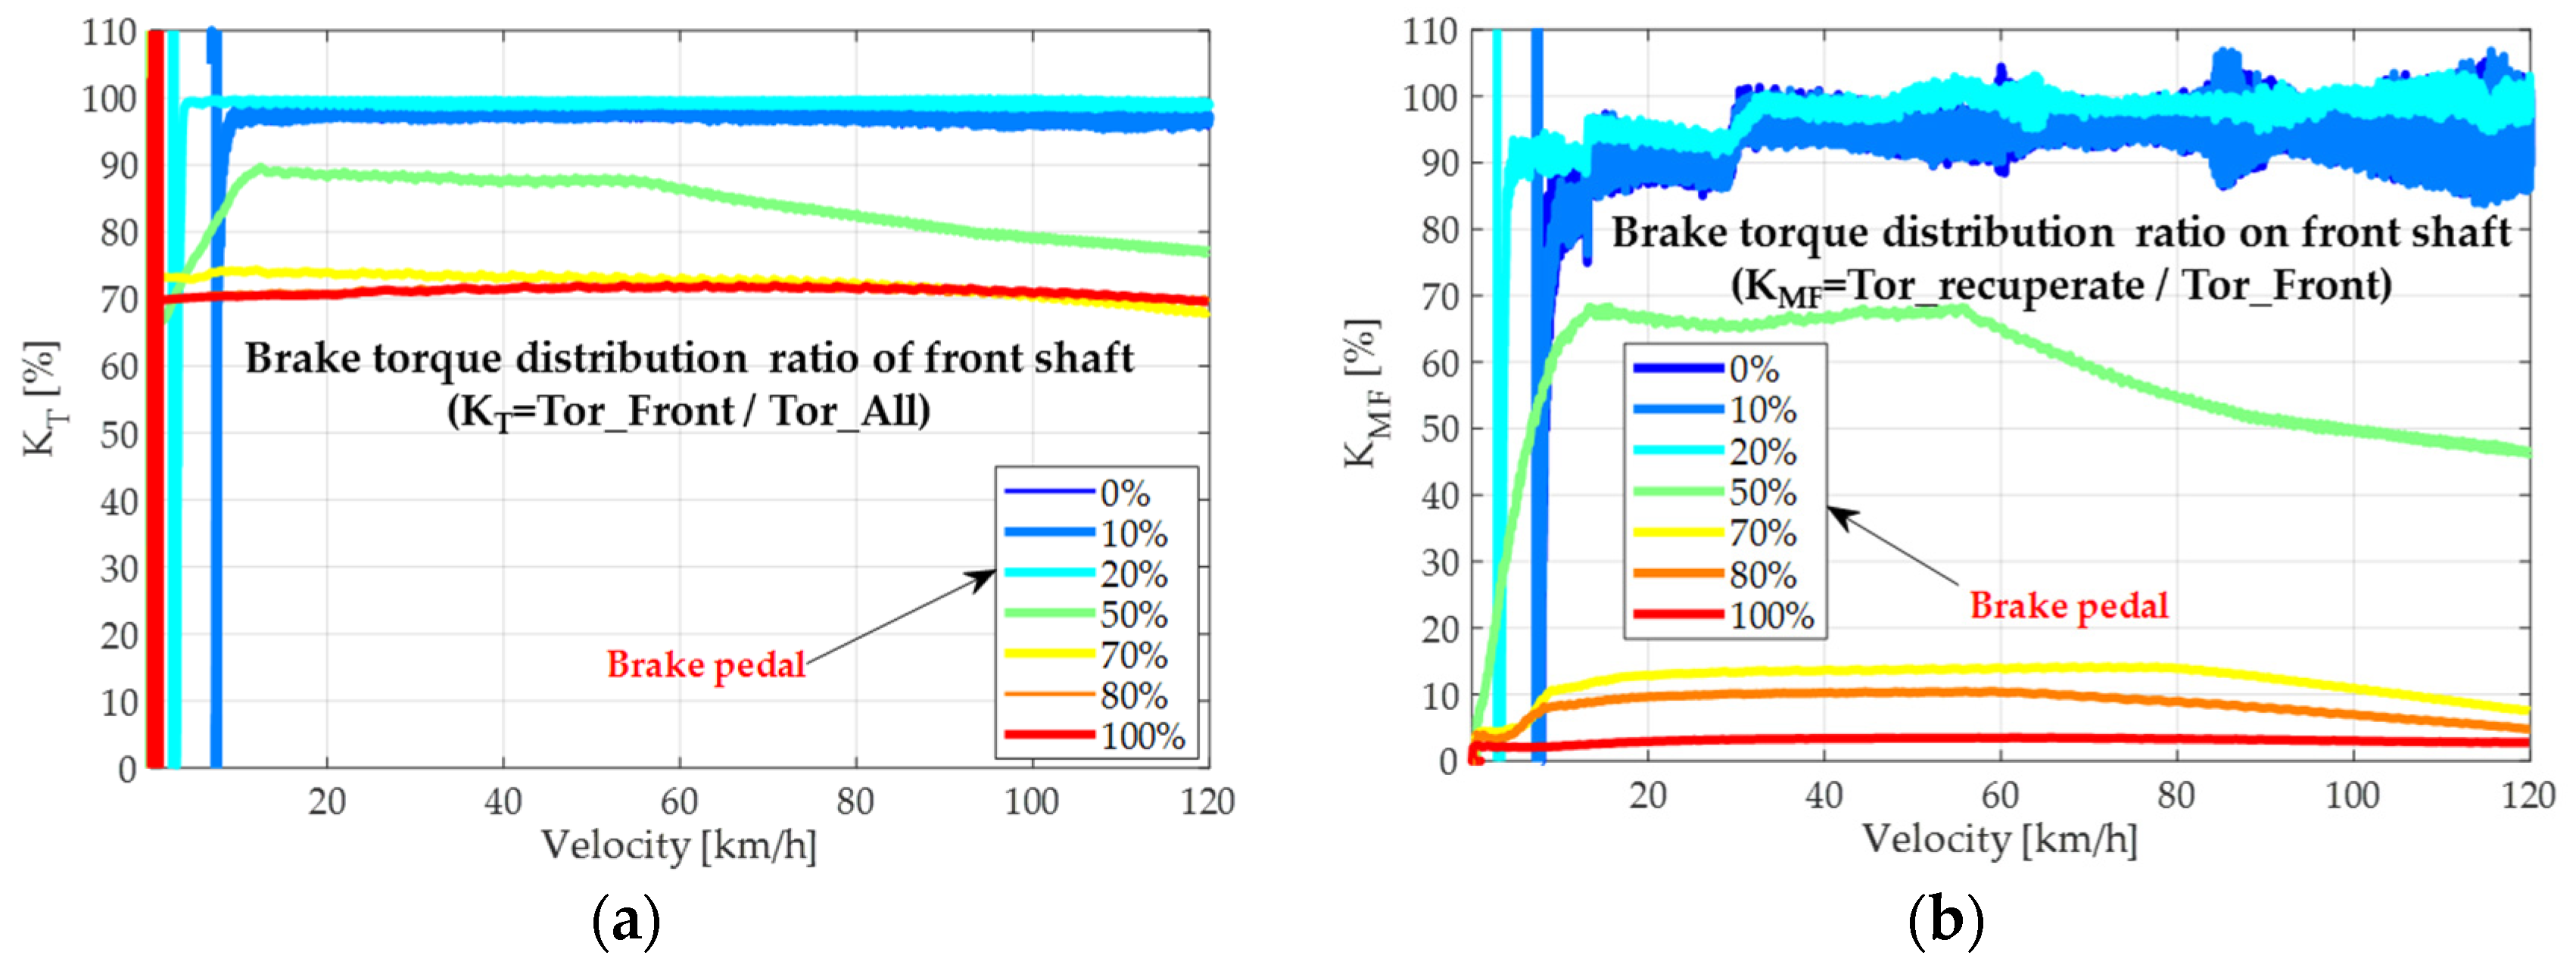
3.1.5. Recuperation Model and Accessory Model

In the braking process of hybrid vehicles, there exists energy recovery of the motor recuperation, brake caliper friction brake, and full recovery of the kinetic energy during braking and sliding. While taking the comfort and safety of the braking process into account, its influence on the research of vehicle energy consumption reduction should be noted. In this paper, the experimental modeling method is used to establish the energy recovery model, as shown in Equation (13).
T R e = f T _ R e ( V , B , S O C )
In Equation (13), T R e represents the recuperation torque of the traction motor during braking or sliding operation, which is affected by velocity, brake pedal depth, and SOC. In in order to achieve the optimal energy consumption of the vehicle under every typical operating condition, that is, the maximum recuperation torque for energy recovery at all velocity, Equation (13) can be transformed into Equation (14).
T R e = f T _ R e ( V )
Accessories are the basis of vehicle function or strategy, and have certain energy consumption; in order to improve the accuracy of energy consumption research, the power consumption level of the accessories with big data of a bench test of A Company was used, and the average power was used as the accessory model of energy distribution model.

3.1.6. Control Strategy Model

The vehicle equipped with an electric hybrid system is an organic whole of engine, generator/motor electric drive system, battery, and accessories. The research on the control strategy is the most important to realize the energy flow analysis; it mainly includes engine start/stop control, mode shifting control, energy recovery control, and battery SOC balance control. In this paper, only the economy model research and calculation are used.
In particular, the steady-state efficiency map is used to interpolate the efficiency, and when we need to calculate the energy consumption we revise the model to make the result right. In this paper, the efficiency map of each component is weighted according to the test data of A Company. The influence of the engine working environment is also taken into consideration, the cooling temperature, oil temperature, and fuel calorific value have certain influence on its thermal efficiency, according to the test experience, and a specific coefficient is taken to revise the model. The engine thermal efficiency correction model is shown in Figure 8.

3.2. The Usage of Energy Distribution Model

When the vehicle is in a power deficit state, according to the “GB/T 19753-2021 Test methods for energy consumption of light-duty hybrid electric vehicles”, the energy consumption performance test under WLTC condition was conducted. At this time, the net consumption or generation energy of the battery was much less than the energy contained in fuel. In the development of engine technology to date, the maximum thermal efficiency of the mass-produced engine is still less than 45% [13], with rapid development of permanent magnet synchronous motors. According to A Company’s years of testing and analysis results of competing cars and its own models, we found that the efficiency of electric drive system has exceeded 93%, so whether the engine works efficiently or not will directly affect the performance of the vehicle energy consumption. How to make the engine work in the high efficiency zone as much as possible is another difficult problem in the energy management of hybrid vehicle. Due to the innate advantage of the unique system architecture of the electric hybrid system (EHS), the engine can be completely decoupled from the wheel, that is, the working point of the engine may be controlled actively. Therefore, when the vehicle equipped with electric hybrid system adopts the control strategy of the main series generation of the engine in the power deficit state, an optimal performance of energy consumption can be achieved. Based on the vehicle system model combined with the control strategy, the performance of the vehicle energy consumption is shown in Table 2. The driving mode distribution ratio of the vehicle under WLTC condition is shown in Figure 9, which shows that when the hybrid vehicle equipped with the EHS is in the state of power deficit, the optimal mode allocation strategy is “electric drive mainly”, and can achieve better economy, while the vehicle is close to a pure electric vehicle, and enjoys the quiet and comfort driving experience. According to Figure 9, the energy consumption optimization of the electric hybrid system can be carried out mainly from the efficiency improvement of electric drive system and the optimization of control strategy.

4. Analysis of Energy Consumption Reduction Based on Software and Hardware Optimization

4.1. Optimization Methods

One of the important contents of hybrid vehicle control strategy is optimizing the torque distribution of hybrid system to ensure that the engine and motor work in the high efficiency region, so as to obtain better fuel economy and emission performance. The research on energy reduction in newly developed hybrid vehicles can be carried out from two aspects: hardware performance improvement and control strategy optimization.

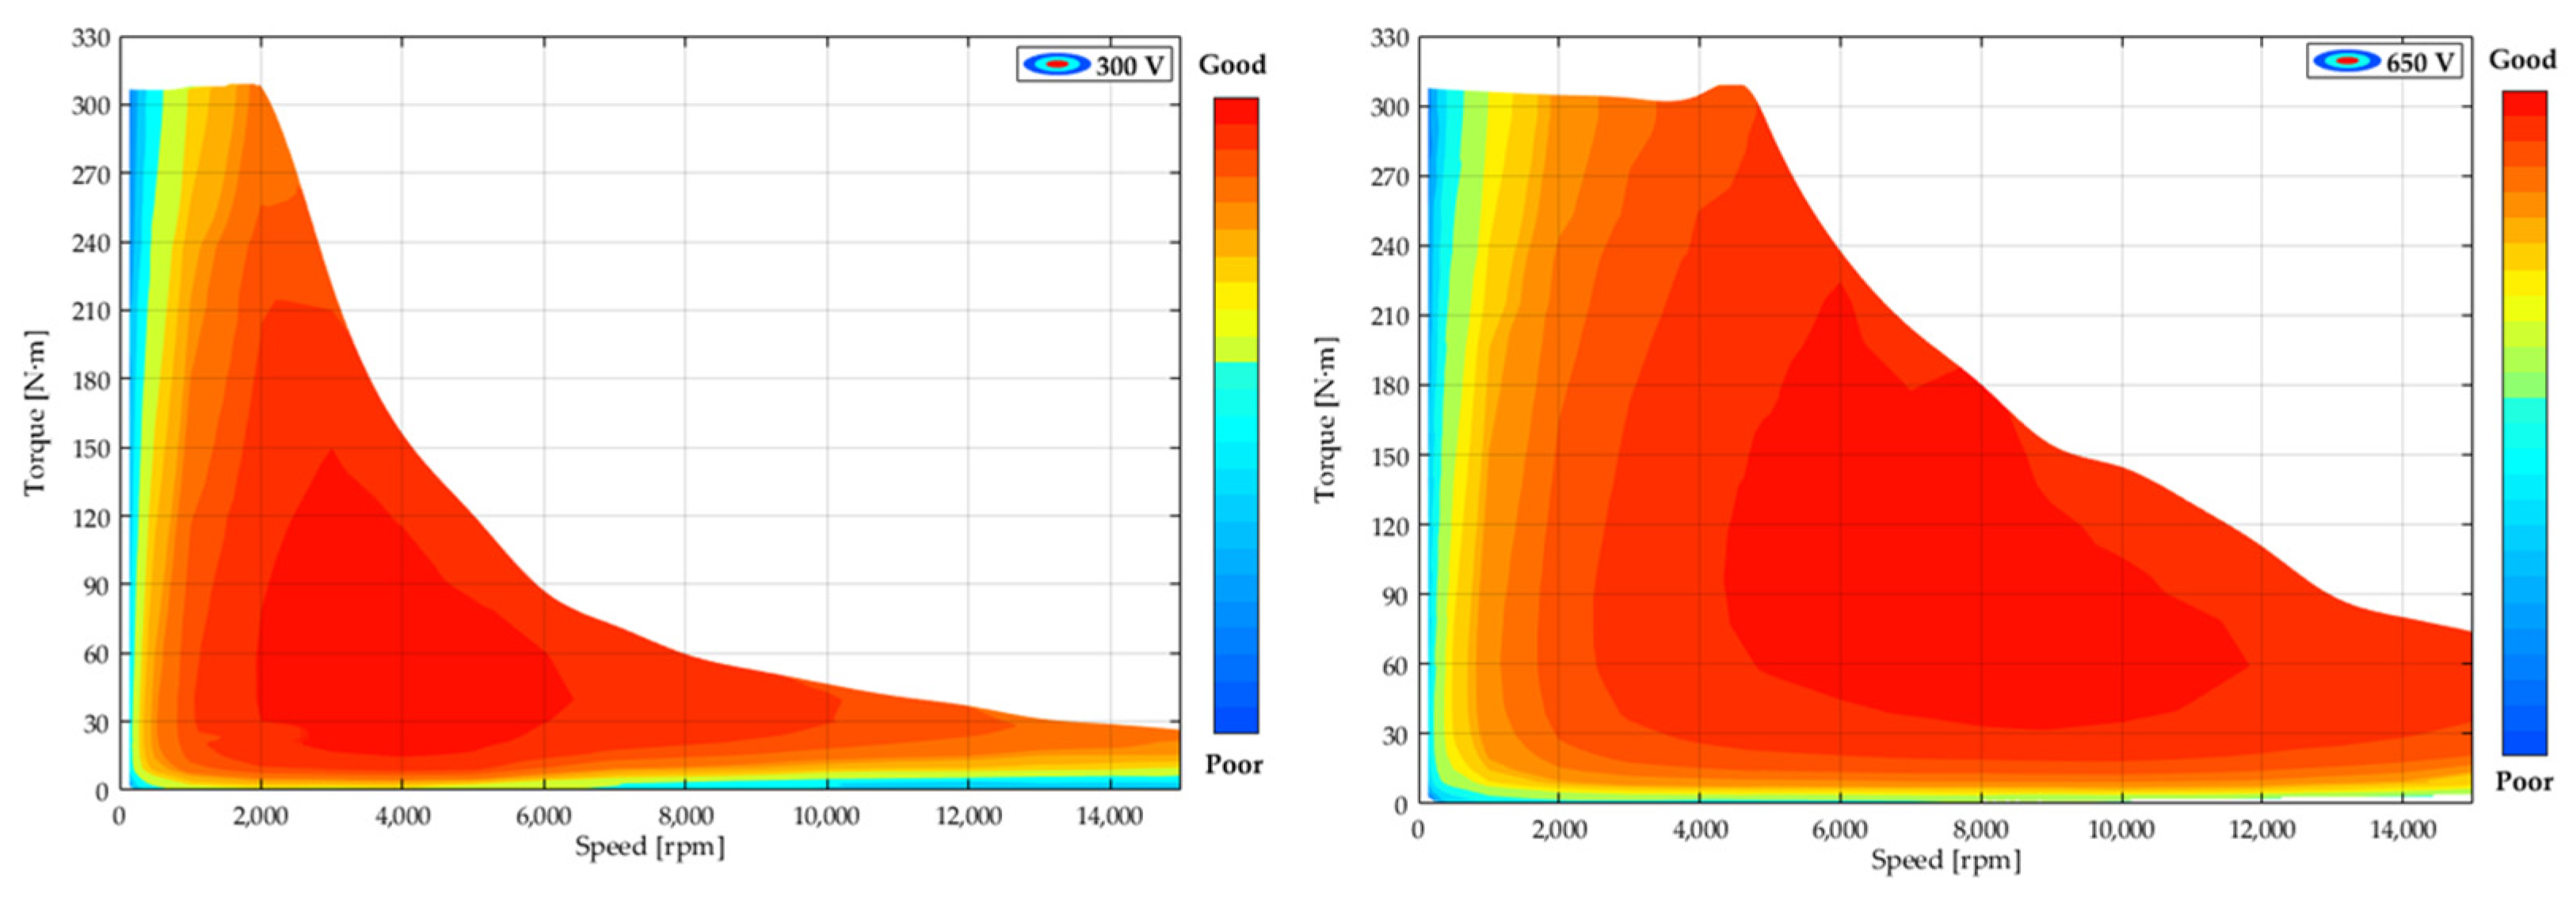
4.1.1. Voltage Boost Technology

The change of working voltage of the electric drive system can affect the system efficiency. Figure 10 is a map of electric drive system efficiency of A Company at different working voltages. If the motor operating voltage is increased, the high efficiency region will move to its high speed and high torque region; the battery voltage cannot change at will, and blindly raising its working voltage to improve the high efficiency zone will inevitably cause other costs, such as increasing insulation protection level to ensure the safety. Due to the bi-directional DC–DC converter technology which can change the voltage dynamically [14], this component will directly affect the system efficiency of the electrical drive system, so as to improve the economy level of the vehicle. According to A Company’s multiple rounds of test results, the highest efficiency of bi-directional DC–DC converter can reach 99.69%, and the dynamic response time is less than 50 ms. At the same time, there are two electric drive systems; one of them is equipped with bi-directional DC–DC, and the other is a voltage stabilizing system (when the battery voltage is 300 V). The difference in the ratio of the high efficiency zone where the system efficiency greater than 85% is up to 15.5%.

4.1.2. Control Strategy Optimization

Under the condition of hybrid electric drive phase, the engine start/stop and working process, mode switching, and energy recovery strategies, directly affecting the vehicle economy, acceleration performance, and ride comfort. After years of research and development, testing, verification, and analysis, A Company has accumulated several energy consumption optimization control strategy use cases, such as setting a specific SOC as the battery SOC balance point, power distribution ratio, and engine operating point, etc.
As a mathematical model of vehicle capacity management is difficult to establish, the development cycle and development cost of products put forward are high requirements. The conventional research idea is to design the optimal control strategy use case first, then to calculate the simulation model and do the bench test. Taking the optimal solution can greatly improve the economy of related models, and greatly simplify the vehicle development and optimization process.

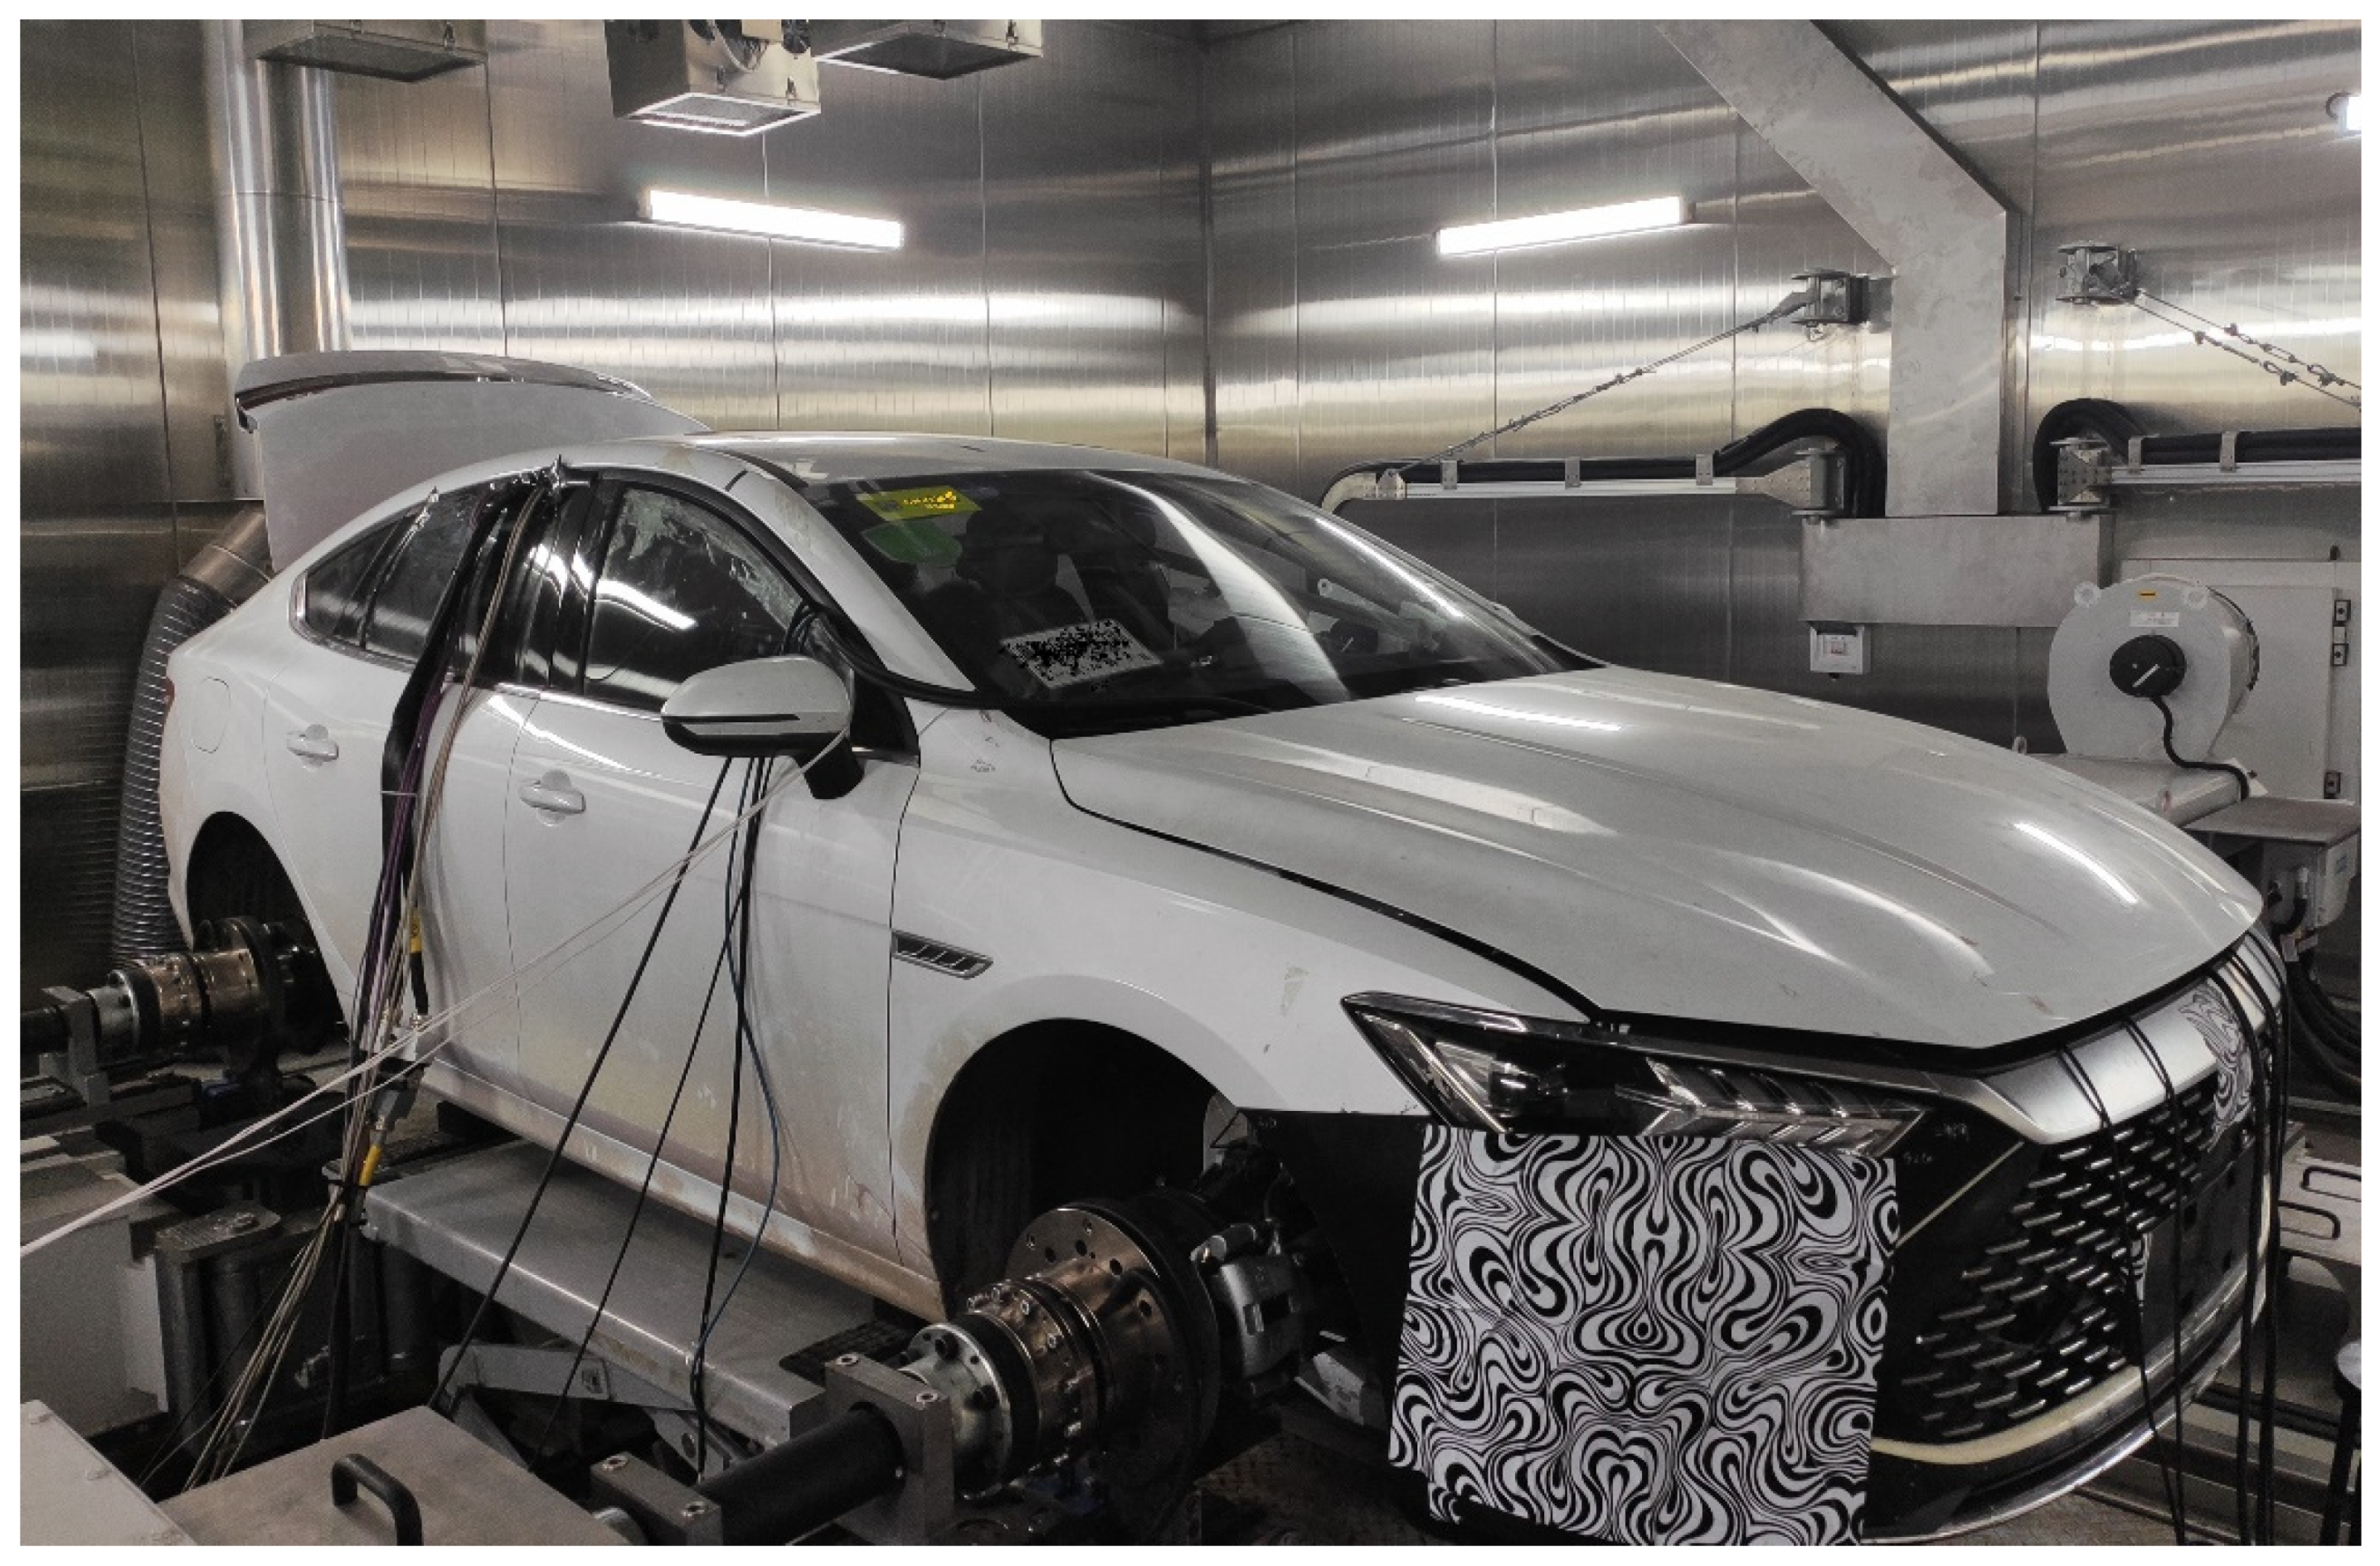
4.1.3. Theoretical Calculation and Bench Test

In this paper, MATLAB is used to realize the rapid theoretical analysis and calculation, and to plan the vehicle bench test, comparative analysis, and verification. The bench test is shown in Figure 11.

4.2. Results of Hardware Optimization

In order to verify the effect of bi-directional DC–DC converter on economy, this paper adopts different battery voltage and dynamic voltage boost methods to verification. the theoretical calculation and bench test of pure electric driving range at high SOC and normal temperature condition are carried out, respectively. The results shown in Table 3.
According to Table 3, the EV energy consumption performance of the electric hybrid system can be improved if the operating voltage of the system increases to different degrees, and the automatic boost strategy can achieve the optimal economic performance. By the same token, the system efficiency of the generator can achieve better economic performance under the influence of the bi-directional DC–DC converter.

4.3. Results of Hardware and Software Optimization

On the basis of energy distribution model and theoretical fuel consumption calculation method, several typical optimal test cases are analyzed, and the comparative analysis of the bench test optimization of theoretical fuel consumption is carried out. The result shown in Table 4.
Table 4 shows that different optimization use cases have different levels of impact on energy consumption, and the results of theoretical calculation and bench test result are basically consistent. The deviation is less than 5%, which suggests that the energy distribution model and the theoretical calculation method proposed in this paper are reasonable and credible, and can be used as a conventional energy consumption optimization method to assist the design and research of optimal energy consumption.

5. Conclusions

In this paper, according to the architecture characteristics of electric hybrid system (EHS), and the energy flow states of each drive mode, and the steady-state efficiency map of each part of the system is presented. The concept of vehicle energy distribution model based on EHS is proposed, and based on the guidance of this model, combined with common ways to reduce energy consumption, the vehicle energy consumption optimization is studied from two aspects of software and hardware optimization. We compared the theoretical calculation results of different energy consumption optimization methods and the bench test results; the deviation between the results is less than 5%, which shows that the model is reasonable and adaptable, and overcomes the shortage of adaptability of previous average efficiency models. It provides an important theoretical basis for the subsequent research on energy consumption reduction, and also provides a new way of further energy consumption optimization design of the same type of hybrid system.

Author Contributions

Conceptualization, P.L. and M.Z.; methodology, H.C. and H.H.; software, H.H.; validation, H.H.; formal analysis, H.H.; investigation, H.H.; resources, P.L. and H.H.; data curation, H.H.; writing—original draft preparation, P.L. and H.H.; writing—review and editing, P.L. and H.H.; visualization, H.H.; supervision, H.H.; project administration, H.H.; and funding acquisition, H.H. All authors have read and agreed to the published version of the manuscript.

Funding

This research received no external funding.

Conflicts of Interest

All authors are employees of BYD Auto Industry Co., Ltd. The paper reflects the views of the scientists, and not the company.

Abbreviations

The following abbreviations are used in this manuscript:
EHSElectric Hybrid System
DHTDedicated Hybrid Transmission
AERAll-Electric Range
PHEVPlug-In Hybrid Electric Vehicle
HEVHybrid-Electric Vehicle
CDCharged Deploying
CSCharge Sustaining
OBCOnboard Charger
SOCState of Charge
OTAOver-the-air (Technology)
NEDCNew European Driving Cycle
WLTCWorldwide Harmonized Light Vehicles Test Cycle
IPBIntegrated Power Brake

References

  1. Energy and New Energy Vehicle Technology Roadmap Strategic Advisory Committee. Energy-Saving and New Energy Vehicle Roadmap 2.0, SAE-China; Mechanical Industry Press: Beijing, China, 2020; pp. 1–65. [Google Scholar]
  2. Wang, Y.G. Comparative analysis of hybrid power system of mainstream dual motor. China Auto 2019, 4, 30–34. [Google Scholar]
  3. Ide, H.; Sunaga, Y.; Higuchi, N. Development of SPORT HYBRID i-MMD Control System for 2014 Model Year Accord. Introd. New Technol. 2013, 25, 33–41. [Google Scholar]
  4. Lu, Z.J.; Su, H.X. Viewing the Route of BYD’s Plug-in Hybrid Architecture Technology Based on Patent Analysis. Commer. Veh. 2020, 1, 90–92. [Google Scholar]
  5. Zeng, X.H.; Yang, N.N.; Song, D.F.; Xiao, L.; Ba, T. HEV Energy Consumption Analysis Based on Power Loss Model. Automot. Eng. 2017, 39, 630–635, 660. [Google Scholar]
  6. Zeng, X.H.; Li, G.H.; Song, D.F.; Zhu, G.H.; Wang, Y.S. Analysis of Theoretical Fuel Consumption of Hybrid Electric System Based on Energy Calculation Model. Automot. Eng. 2019, 41, 266–275. [Google Scholar]
  7. Morteza, M.; Mehdi, M. An Optimal Energy Management Development for Various Configuration of Plug-in and Hybrid Electric Vehicle. J. Cent. South Univ. 2015, 22, 1737–1747. [Google Scholar]
  8. Gokce, K.; Ozdemir, A. An Instantaneous Optimization Strategy Based on Efficiency Maps for Internal Combustion Engine/Battery Hybrid Vehicles. Energy Convers. Manag. 2014, 81, 255–269. [Google Scholar] [CrossRef]
  9. Jeong, J.; Lee, D.; Kim, N.; Zheng, C.; Park, Y.-I.; Cha, S.W. Development of PMP-based power management strategy for a parallel hybrid electric bus. Int. J. Precis. Eng. Manuf. 2014, 15, 345–353. [Google Scholar] [CrossRef]
  10. Ohkubo, N.; Matsushita, S.; Ueno, M.; Akamine, K.; Hatano, K. Application of Electric Servo Brake System to Plug-in Hybrid Vehicle. SAE Int. J. Passeng. Cars-Electron. Electr. Syst. 2013, 6, 255–260. [Google Scholar] [CrossRef]
  11. Snihir, I.; Rey, W.; Verbitskiy, E.; Belfadhel-Ayeb, A.; Notten, P.H. Battery open-circuit voltage estimation by a method of statistical analysis. J. Power Sources 2006, 159, 1484–1487. [Google Scholar] [CrossRef] [Green Version]
  12. Dubarry, M.; Svoboda, V.; Hwu, R.; Liaw, B.Y. Capacity Loss in Rechargeable Lithium Cells during Cycle Life Testing: The Im-portance of Determining State-of-charge. J. Power Sour. 2007, 174, 1121–1125. [Google Scholar] [CrossRef]
  13. Liu, Y.; Gong, Y.; Li, J.; Chen, H.E. Research on the Technology Development of 45%~50% Thermal Efficiency of Gasoline Engine. Automot. Dig. 2019, 7, 22–26. [Google Scholar]
  14. Toshiro, H.M.T.; Yoichi, I. A Power Efficiency Improvement Technique for a Bidirectional Dual Active Bridge DC-DC Converter at Light Load. IEEE Trans. Ind. Appl. 2014, 50, 4047–4055. [Google Scholar]
Figure 1. Powertrain layout.
Wevj 12 00213 g001
Figure 2. Powertrain operation: (a) Electric drive mode; (b) Series hybrid drive mode; and (c) Parallel hybrid drive mode.
Wevj 12 00213 g002
Figure 3. Mode shifting and engine operating point.
Wevj 12 00213 g003
Figure 4. Brake torque distribution: (a) The brake force distribution between each shaft of the vehicle; (b) The electric-hydraulic brake force distribution on each axle.
Wevj 12 00213 g004
Figure 5. Engine efficiency map.
Wevj 12 00213 g005
Figure 6. The efficiency map of generator electric drive system.
Wevj 12 00213 g006
Figure 7. The efficiency map of motor electric drive system.
Wevj 12 00213 g007
Figure 8. The engine thermal efficiency correction model.
Wevj 12 00213 g008
Figure 9. Mode distribution.
Wevj 12 00213 g009
Figure 10. Efficiency effected by voltage.
Wevj 12 00213 g010
Figure 11. Picture of vehicle bench test.
Wevj 12 00213 g011
Table 1. Powertrain and vehicle specification.
ModelItemSpecification
EngineTypeL4 1.5L Atkinson
Power81 kW
Torque135 N·m
GeneratorTypeDC brushless motor
Power70 kW
Torque90 N·m
Traction motorTypeDC brushless motor
Power132 kW
Torque316 N·m
BatteryTypeLiMPO4
Capacity8.32 kWh
VehicleAll-Electric Range55/120 km
TypeSedan/SUV
Table 2. Energy consumption result.
Test CycleElectricity (kWh) 1Fuel (kg) 2Energy Ratio (%) 3Energy Consumption (L/100 km) 4
WLTC−0.0850.900−0.795.28
NEDC0.0360.3170.943.92
1 Electricity is the battery net power consumption. 2 Fuel is the cumulative fuel consumption. 3 Energy ratio is equal to the energy ratio of the battery net power consumption to the cumulative fuel consumption, and is displayed as a percentage. According to the requirements of the GB/T 19753-2021, when the value is in the range of plus or minus 1, the cumulative fuel consumption at this time can be used to calculate the vehicle energy consumption of this working condition. 4 The energy consumption is the simulation result, and expressed in liter per 100 km.
Table 3. Energy consumption performance of EV test.
Test CycleElectricity (kWh)Voltage (V)Energy Consumption (kWh/100 km) 1Bench Test (kWh/100 km)Error (%) 2
NEDC1.42230012.9313.33−3.0
1.40450012.7613.03−2.1
1.363Voltage boost12.3912.84−3.5
WLTC3.431Voltage boost14.7514.452.1
1 The energy consumption is the simulation result, expressed in kilowatt-hour per 100 km. 2 Error is equal to the ratio of the deviation between the simulation and the bench test result to the bench test result, displayed as a percentage.
Table 4. Energy consumption performance of HEV test.
Test CycleElectricity (kWh)Voltage (V)Fuel (kg)Energy Ratio (%)Energy Consumption (L/100 km)Bench Test (L/100 km)Error (%)
WLTC−0.0853000.900−0.795.285.59−4.9
−0.0455000.881−0.435.165.39−4.2
−0.0486500.896−0.455.255.48−4.1
0.086Voltage boost0.8720.815.114.904.3
NEDC0.032Voltage boost0.3200.833.974.03−1.5
Publisher’s Note: MDPI stays neutral with regard to jurisdictional claims in published maps and institutional affiliations.

