Article

Flexibility-Enhancing Charging Station to Support the Integration of Electric Vehicles

1
Smart Innovation Norway, Håkon Melbergs vei 16, 1783 Halden, Norway
2
Department of Computer Science and Computational Engineering, UiT The Arctic University of Norway, Lodve Langes Gate 2, 8514 Narvik, Norway
*
Author to whom correspondence should be addressed.
World Electr. Veh. J. 2021, 12(2), 53; https://doi.org/10.3390/wevj12020053
Submission received: 22 December 2020 / Revised: 24 March 2021 / Accepted: 24 March 2021 / Published: 1 April 2021

Abstract

:
This paper discusses the Inspiria charging station facility in Norway, which enables various charging point operators to offer different charging systems for different purposes and needs. The charging station can be considered a specific case of a shared economy, as users share the same infrastructure and much of the same space. By utilizing new technology and the differences in charging needs in an innovative way, the power requirements for charging can be controlled and the severity of high-load periods can be reduced—both within the charging station’s system and outside it. Using historical traffic data from the Inspiria charging station’s area and Monte Carlo simulations, this study investigated the impact of charging on the grid—both in the current period and in the future. Attention was paid to the impact associated with the usage of superfast chargers. The possibility of containing grid disturbances through utilization of local flexibility was investigated. Finally, we investigated the benefits that the charging station model brings to charging point operators and car owners. The research reported provides support for ambitions for accelerated roll-out and increased density of cost-effective charging points, the wider implication of which concerns the transition to fossil-free transport and the utilization of locally generated, renewable energy.

1. Introduction

Electrification in transport is seen as one of the main means for reducing pollution and mitigating climate change. According to the European Commission [1], transport represents almost a quarter of Europe’s greenhouse gas emissions and it is considered the main cause of poor air quality in cities. Transport electrification, combined with a high share of renewable generation in the power system, can significantly mitigate climate change. In particular, as shown in [2], the increasing penetration of electric vehicles (EVs) can reduce the mitigation cost associated by the 2 °C climate stabilization target.
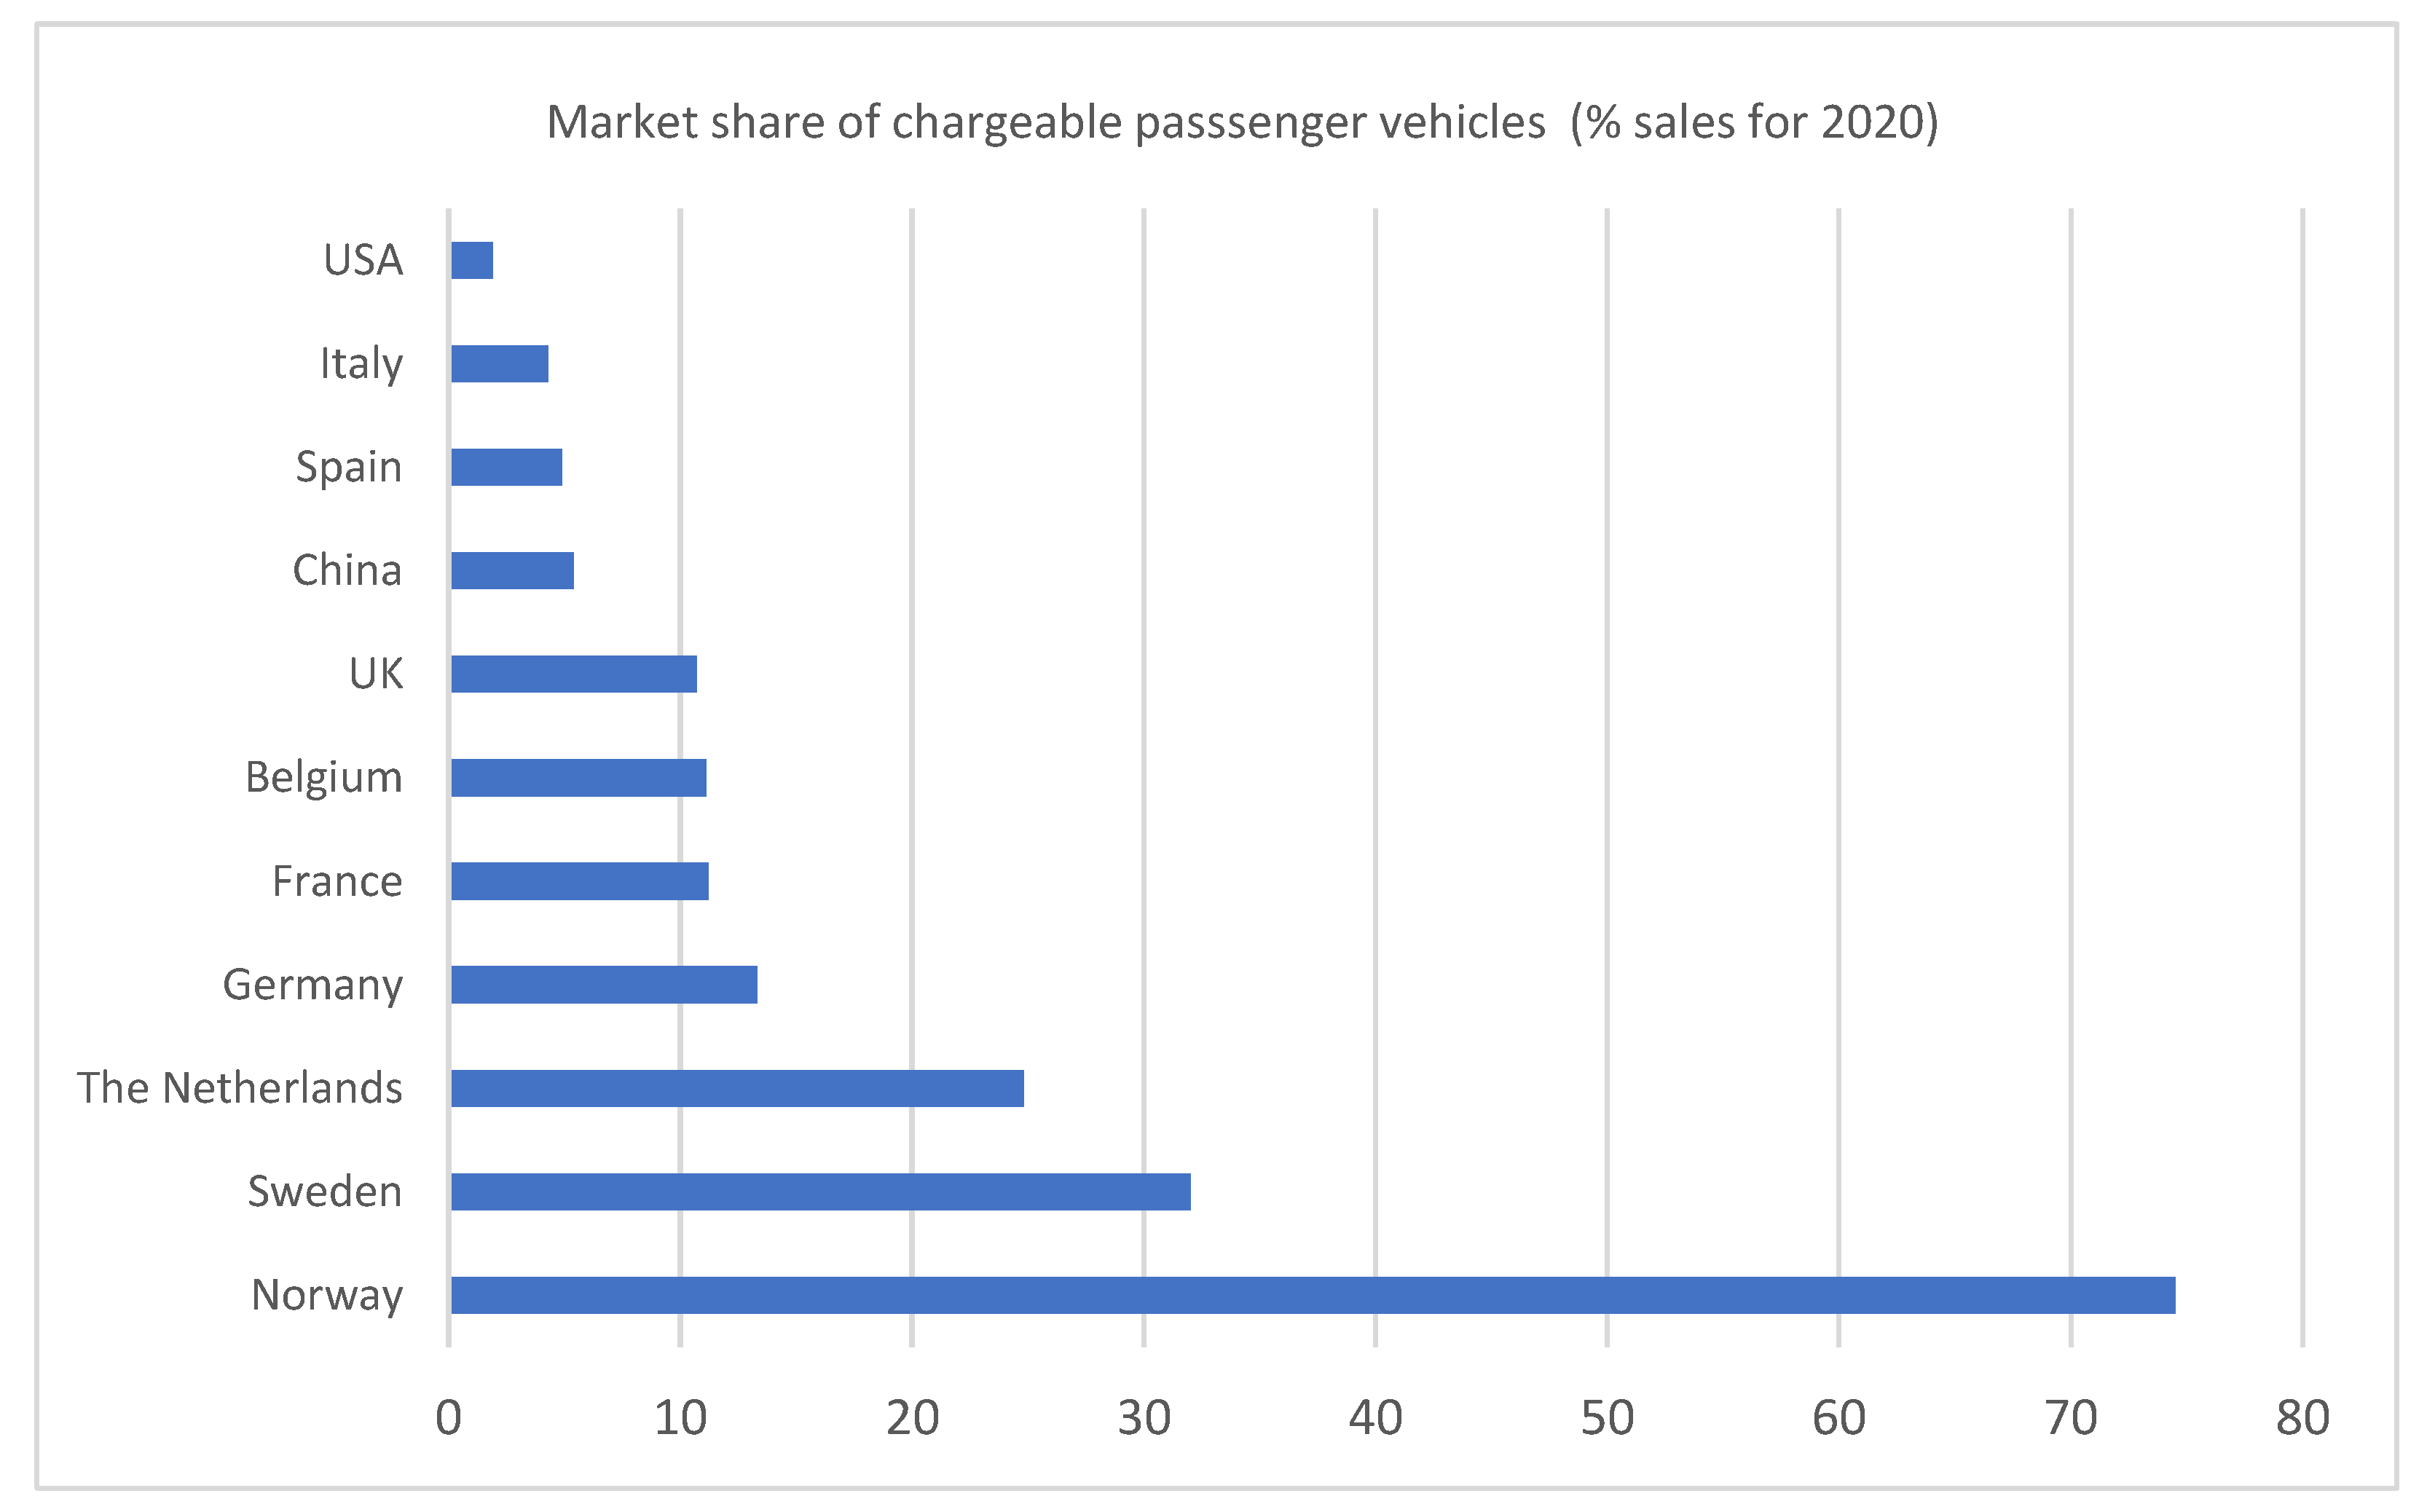
Having perceived the positivity of the personal driving experience and the contribution to climate targets, the number of people who express a preference for electric vehicles (EVs) is rapidly increasing. In Norway, e-mobility development has been intensive for several years and the country represents one of the most mature EV markets in the world. The market share of purely electric and chargeable hybrid vehicles in Norway accounts for almost 75% of the sales of new cars [3], bringing the country to the world’s forefront when considering electric vehicles per capita (Figure 1).
Furthermore, the sales indicate that EV ownership cuts through sociographic, geographic, and demographic boundaries, with a variety of people being represented among EV owners [4,5,6]. These specificities of the Norwegian EV market offer a basis for carrying out unique studies in which a fair amount of empirical data can be utilized. However, the increasing numbers of EVs on the roads pose significant challenges to the power grid. The high capacity needs associated with fast charging or simultaneous charging of a number of vehicles and the unpredictability of the EV owners’ charging patterns can cause major operational problems for grid operators [7]. Among the most often discussed challenges, as related to EV charging, are increased load in the distribution network, the difficulty of optimizing the operational processes in the grid, new requirements for distribution network planning and threatened power quality [8]. Moreover, as pointed out in [8], as the access volume of electric vehicles increases, the reliability of the power can be expected to decrease.
Yet, according to the authors of [10], the variety of disadvantage effects associated with EV charging can be reduced by rebuilding and expanding the distribution network, through governance of technology and through proper optimization techniques. However, while expansion of grid infrastructure usually has a very high cost, the possibility of accommodating EV charging through smart-charging approaches and local system optimization constitutes a most attractive alternative which is worth investigating. Such an alternative is even more attractive when one considers that improved EV charging methods can help alleviate the grid burden associated with home charging and cut down on the waiting lines at popular charging locations.
The challenges and impacts associated with the increasing need for EV charging have been discussed from various perspectives in the literature, often based on scenarios and simulations. To mitigate the negative impact on the reliability of the electricity grid, the authors of [11] proposed applying convex relaxation and proper rounding techniques, which can successfully handle the combinatorial optimization problem of EV charging. According to the authors of [12], the challenges associated with uncontrolled EV charging can be referred to voltage profile, power loss, grid unbalance, reduction in transformers’ lifetime and harmonic distortion. Having performed an extensive review of the different EV charging strategies, the authors of [12] classified them into scheduling, clustering and forecasting, and recommended additional research to address issues related to customer privacy and secure and reliable communication system cost management. In [13], the impact of EVs on the development of the future power grid was discussed, with the importance and role of EVs in the future energy internet put in focus.
Although there is significant research interest towards the implications of EV charging, the studies based on real-life implementations are of limited scope. Some experiences from EV charging have been described in [14], where it was pointed out that smart charging can contribute to avoiding higher cost periods of energy supply, increase customer engagement and help customers manage their EV use, defer or avoid investments in grid infrastructure, enable renewable energy integration and facilitate grid services. The large-scale pilot experiences described in [15] showed that, by steering the power demand of EVs (known as smart charging), the grid limits can be successfully avoided and electricity cost can be kept lower. According to the authors of [15], the benefits could include increased usage of renewable energy and avoiding costly capacity tariffs. It was further suggested in [15] that smart charging is particularly beneficial during winter times. A recently undertaken smart charging initiative [16] aimed to develop a large-scale smart charging solution that can be rolled out nationwide by flexibility service providers such as charging point operators (CPOs), aggregators and energy suppliers. At the core of the initiative lies the stakeholders’ ambition to have a smart charging solution that gives them both choice and freedom over the way their EVs are charged, at the same time as reducing charging costs [16].
An overview of the business models associated with EV charging was provided in [17], where the focus was placed on five categories: regional fast-charging networks, local (small) business initiatives, commercial EV charging, E-fleets and municipal and sustainable e-mobility. With a growing number of EVs on the European roads [18], the need for business models that incorporate attractive EV-charging opportunities is increasing. Such models should offer a sound business case where risk is mitigated, profit from EV charging is ensured and operating costs are low [17], whilst simultaneously taking into account EV drivers’ experience and remuneration. The current paper proposes a charging station configuration that can accommodate these requirements, embracing a variety of EV charging needs and suppliers and aiming to provide the most efficient accommodation of EV charging within the power grid. The idea for the type of charging station was inspired by the “food court” concept, where different venues are gathered in a common area and infrastructure to share costs, create added marketing weight together and provide a high variety of services and a quality experience for customers. The sellers (service providers), on the other hand, benefit from an increased customer base and the generally high attractiveness of the charging station. In a similar way to the food court, the different types of charging station could offer different types of EV charging, consolidating a variety of charging point operators within the same location and offering some basic common facilities. The discussed charging station is an exemplary case of a shared economy and introduces flexibility for both the CPO and the driver.
With accelerating growth in EVs’ share of the roads and an increasing number of interested stakeholders, Norway offers a unique opportunity to trial innovative charging approaches. A first-of-its-kind energy flexibility-supporting charging station solution is currently being implemented in the country in the vicinity of the Inspiria Science Center—hence the name “Inspiria charging station” (ICS). At the charging station, a variety of CPOs can offer charging to EV drivers. The different needs of EV users, e.g., as associated with long-term parking, short-term parking or “just passing” cars, can all be satisfied at the same location, utilizing the local infrastructure and saving additional investments. Furthermore, the overall ICS concept incorporates local production (photovoltaic (PV) panel installed on the roof above the chargers) as well as a stationary battery. The ambition is that, in the future, the joint utilization of smart charging, distributed generation, local storage and vehicle-to-grid/vehicle-to-building (V2G/V2B) technologies at the ICS will create a win-win-win situation, where benefits are brought respectively to the EV drivers, enterprises (CPOs and power companies) and the environment.
Considering that the envisioned charging station is at its initial development stage, with the chargers currently being installed, the aim of this study was to analyze the charging needs and the associated impact on the power system, determining ways to keep costs down and assuring the best possible service. This will help uncover the benefits related to utilizing the charging station and pave the way for a successful, future, full-scale implementation and replication of the solution.
To achieve the above goal, this study explored the initial simulation results for the ICS to answer the following research questions: based on existing traffic data at the charging station, what is the impact of EV charging on the grid—now and in the future? What is the impact of superfast charging (more than 175 kW)? How can the impact be contained in an economically optimal way? What benefits does the charging station bring to the CPOs and the EV owners? Finally, what advantage does the current ICS have compared to a regular charging station with the “petrol station“ business model?
Thus, the rest of the paper is structured as follows. Section 2 provides the basic characteristics of the charging station and explains the methods used for the analysis. Section 3 presents the results from the simulations, stressing the impact of using a superfast charger. Section 4 discusses the results while Section 5 provides concluding remarks.

2. Materials and Methods

2.1. Basic Characteristics of the ICS

This subsection provides some basic characteristics of the Inspiria charging station concept considered crucial to the analysis.
The ICS organizes several different charging offers within the parking area of the Inspiria Science Center, with approximately 200 parking spots. An essential part of the ICS concept is considered to be the possibility of covering different charging needs through specialized offers. This means that the charging service, payment arrangements and booking are all adapted to the specific charging needs. Within the ICS the various charging services and the investments that they require are carried out by independent enterprises which experience increased customer base and reduced operational costs through acting at the charging station’s arena. Importantly, the arrangements at the ICS are made so that the various suppliers of charging services can buy priority over others. This allows for a local trading space for buying and selling priorities (or flexibility). Further on, charging services could be connected with other services that increase demand or cross-subsidize charging (e.g., services related to visiting the nearby Science Center, hotel or aquapark facilities).
When it comes to the power balancing, a central system ensures that the hourly supply and demand of electricity matches at all times and that this takes place within the capacity defined by the local transformer. Finally, all charging services are realized within the Inspiria Science Center’s meter and the existing transformer.
The configuration of the ICS is shown in Figure 2, where the interactions between the Science Center with PV panel and battery, a flexibility operator and the other flexibility stakeholders are represented. The cash flow, energy and flexibility sales are illustrated. For example, the Inspiria Science Center sells flexibility (from in-house demand response, rooftop solar panels or battery) via the flexibility operator. The CPOs participate through energy and flexibility exchanges and utilize two-way (or rebated) cash flow.

2.2. Method for Analysis

2.2.1. Technical Specifications and Charging Needs

Two elements can be considered to be of critical importance for the realization of the charging station’s concept—the customer base and their charging needs. The customer base refers to the number of EV drivers that make their way to the charging stations in the vicinity of the Inspiria Science Center, independent of their charging needs. The charging needs, on the other hand, relate to the load that each separate charging activity brings to the system behind the Science Center’s meter. Both elements are critical for the charging station concept’s capacity design and success. Thus, an analysis of the charging needs according to the number of visitors is presented next, considering the current stage of the ICS implementation.
Currently, the parking lot at the Science Center offers eight charging stations, one of which has a maximum capacity of 50 kW and the rest 22 kW. Both AC and DC are offered and the price is approximately 2.5 NOK/kWh. Utilizing data for 2018 and 2019 made available in [19], the charging needs to be considered further in simulations and with regard to the consequent upscale of the ICS’s charging offers are described next.
The data analysis suggested that both seasonal and daily patterns can be observed at the charging station. During the winter period (November–December), increased need for charging was exhibited—a trend that could relate to increased activity in the time before Christmas, more customers at the nearby hotel with an aquapark and more visits to the Science Center. With regard to the daily pattern, the arrivals at the charging stations tended to a peak during the hours of 12:00 to 15:00. Together with the charging time duration (from less than a minute to more than 10 h), the numbers of arrivals are jointly represented in Figure 3.
With regard to the collected data, the variety of charging needs is obvious. To alleviate the potential high-load challenges, it can be considered appropriate to promote long-term parking with charging outside the peak load period—which for the ICS location occurred between 9:00 and 16:00. This is of high importance when considering that the maximum load occurs during this period anyway and is decisive for the settlement of the capacity tariff charged by the local distribution system operator (DSO). However, increases outside the peak load hours are only settled for consumed energy. Thus, making use of flexibility and smart charging (and also, in the future, local generation and storage) at the ICS vicinity is crucial in order to cut costs and avoid capacity problems in the local infrastructure.
Undoubtedly, the distribution presented in Figure 3 may change with the future development of e-mobility and as the scope of the ICS becomes enlarged. However, to be able to make realistic simulations of the envisioned development, a sound base of charging duration distributions should be taken into account. Thus, the cumulative distribution presented in Table 1 can be considered valuable input to be taken further in the analysis. As Table 1 indicates, it is 100% likely that the charging time at midnight is less than 5 h, while it is almost 90% likely that the charging time for those who start charging at 7 in the morning is less than 2 h. At 13:00 there is about a 50% chance that the arriving EV drivers will charge for less than half an hour.
In addition to the above presented distribution of charging duration times, some additional specificities, in particular relating to the future development of the ICS, have to be considered prior to the simulations. For example, a superfast charger of more than 300 kW capacity and 32 charging stations of 22 kW are planned to be installed in the first phase of the ICS implementation. These, together with the eight charging stations currently present, formed the charging base when running the simulations. An overview of the existing and planned charging stations is provided in Table 2. The planning of the chargers is based on the observed traffic flow and charging needs, as provided in [19]. In addition, the general trends for the region and the country under the assumption that the distribution of visits across the day remains constant was considered. This assumption is reasonable because current users represent the majority of EV travelers/commuters, and they follow a regular routine that is also pronounced for general electricity consumption. Another factor to consider is that deep charging occurs more seldom than expected—i.e., the charging behavior seems to be more time-controlled (“enough is enough”) rather than aiming for full charge. It was further assumed that drivers who are “short of time” would prefer to use the ultrafast chargers, under the assumption that “time is of the essence” and because they provide a reasonable cost.
Also, with respect to future developments, we can expect a significant increase of arrivals due to the sustained growth in sales of EVs and as a consequence of more active marketing of the facility. However, it is hard to find an obvious reason for a major change in the relative distribution of arrivals across the day. What can rather be expected is a shift from 22 kW and 50 kW chargers towards ultra-fast chargers—a change that was accounted for in the simulation mode. For the arrivals related to non-parking needs, a shift from slow charging to superfast charging would be the first priority unless the waiting lines increased to more than twice the charging times. To take account of this possibility, the simulation model incorporated a feature where a fraction of the “waiting” segment with non-parking needs shifts to a regular charger to top-up. In addition, a fraction of the arrivals may turn around and leave to find other options elsewhere. The split was determined by a heuristic function assuming the following:
  • The fraction that historically spent less than 30 min at a charging station (topping-up) will want to supercharge.
  • If the drivers at the waiting line expect it to continue for more than 15 min, those subjects will seek out other possibilities. A weighted random number determined whether they would move on or use the other, vacant chargers at the ICS. Due to the historic reasons, drivers ending up in a line will most often stay and use a slower option just to get going with some extra miles.
Furthermore, as new EV models are coming on the market with increasing battery and charging capacities, while older models are still in use, there will continue to be various types of EV charging needs in the years to come. A final point regarding the ICS’s technical specifications concerns its capacity limits—as the capacity of the nearby transformer is 1230 A, while the cable network leading to it has a limit of 915 A, it is the local infrastructure that constitutes the primary constraint.

2.2.2. Simulations

For the analysis a Monte Carlo simulation model of the future ICS facility with planned chargers was used. The starting point for the simulations was based on the empirical material made available in [19], which comprised the basis for determining arrival rates, amount charged and service rates for the ICS. In addition, cost data related to the energy price and grid tariffs were utilized. The overall energy cost comprised three elements: the grid tariff for capacity, the grid tariff for energy and the spot price (Table 3). As Table 3 shows, significant seasonal variations can be observed. In particular, the winter periods can bring about high costs. The values are normalized but give a good idea of the energy cost carried by the Inspiria Science Center, in the vicinity of which the ICS is located.
The simulation model was designed so that the variations in arrival rates can be analyzed. The starting point was the data for the hourly distribution presented earlier in Figure 3. It was assumed that the future distribution of arrivals per day would be stable, and that any targeted growth in visits for charging, as based on providers’ own marketing, would take place as much as possible outside the current peak load periods for the center and in relation to the current arrival profile. Here, an amplification factor was used to study sensitivities. An amplification factor of up to four times the current visits was applied. In addition, a “skewed” amplification factor was introduced to study changes in the empirical profile based on current empirical data. This meant that a possible increasing demand before and after the current peak load period was investigated.
The average arrivals as they appeared in the original empirical data, with or without an amplification factor for demand, were modeled based on traditional queue theory and with the use of the Poisson distribution. Several replications were run on the same basis in order to determine variance and extreme situations in which coinciding high-demand needs had a significant effect. It is the probability of such extreme result values that must be taken into account under the capacity assessment.
Maximum “patience” was modeled as a 15-min wait for those who wanted to use the superfast charger. If the superfast charger did not become available within that time, the drivers either leave the charging station or use slower charging (a more detailed explanation is provided as part of the description of charging needs in Section 2.2.1).
A difficult issue was related to the capacity mix for batteries (Table 4). As it is uncertain what types of cars will visit the ICS in the future, the model was designed so that different compositions of the car fleet arriving at the ICS could be analyzed.
Assumptions were also made about the power output from the chargers. As can be seen from Table 4, only Porsches have the opportunity to extract 300 kW of power. Otherwise, two cars of the Audi e-tron or Tesla Model S types are required to achieve a corresponding load. It is difficult to determine what proportion of visitors will have these types of electric cars in the future. An attempt was made to solve the problem by analyzing current empirical data in which the time factor rather than the charge level was the most important. This means that the simulation model delegated to the superfast charger those who are short of time and who only have less than 30 min available for charging. If the superfast charger is already fully occupied on arrival, the EV driver is transferred to the 50 kWs charger if it is available. The EV drivers who have more than 30 min time available are distributed to the fast chargers or to the 22 kW chargers. Here, an assumption was made that the majority of arriving electric cars are able to extract maximum power since they use three-phase charging. Currently, however, this is the case only for Renault, Tesla and, in some cases, the Audi e-tron. Still, it can be expected that DC charging or three-phase charging will become more common in the future.

3. Results

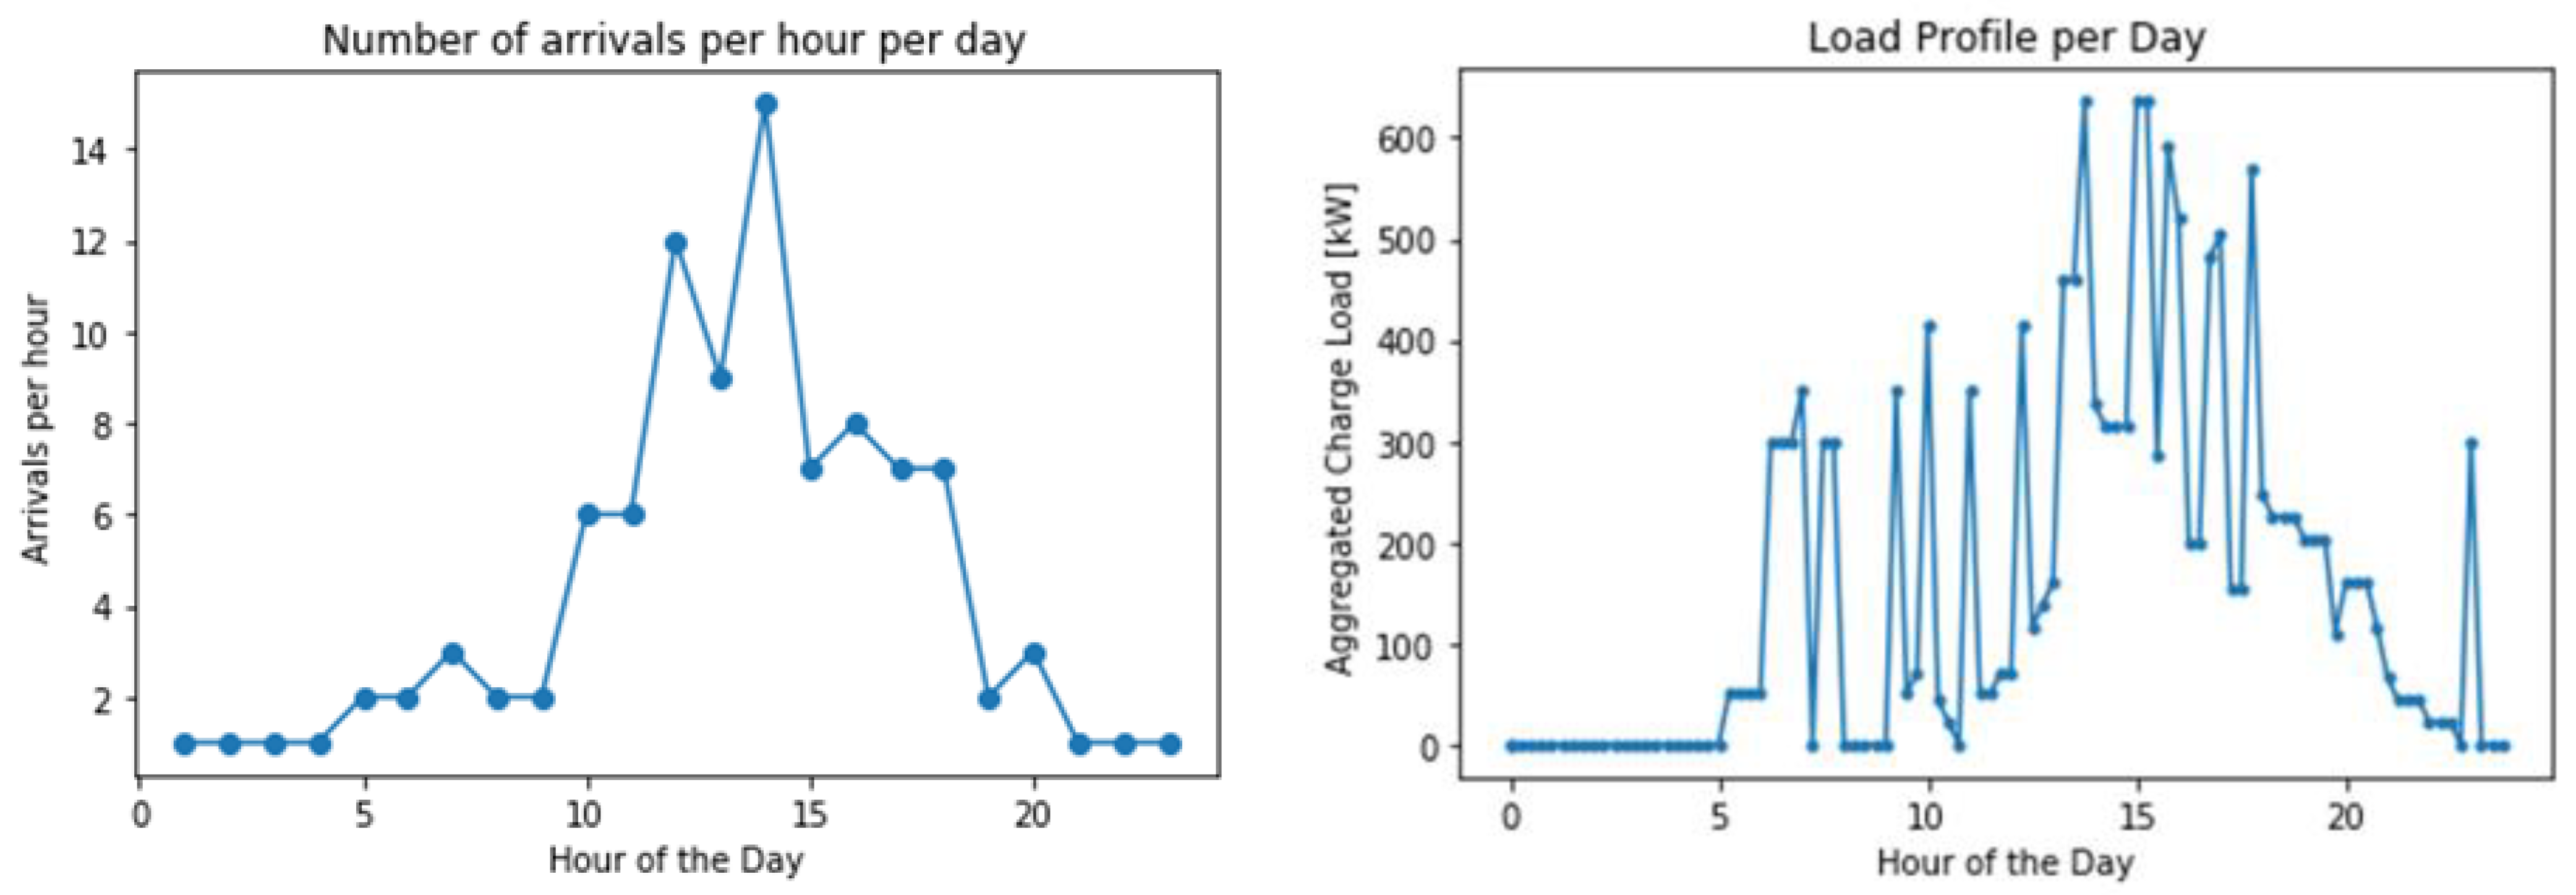
Results from the Monte Carlo simulations are shown in Figure 4. The simulations reveal a fundamental similarity between the simulated results and the empirical data profile presented in Figure 3. Figure 4 also shows the connection between arrivals and load, which in turn entails information on the energy capacity needs. Comparing the simulated arrivals with the historical arrivals from the data, it can be intuitively seen that the simulation takes care of the existing demand pattern. Also, it can be observed that the load deflections are less than the physical capacity limit of 500 kW.
As described earlier, the probability of using the superfast charger increases the shorter the available time of the visiting EV driver is. It is the capacity of the superfast charger that is crucial for the load situation, as the superfast charger of 300 kW has the biggest impact on power consumption. When the arrival rate is higher than the service rate, a queue forms. In cases with high demand at the superfast charger, longer periods with high loads are present, not a higher aggregate power level. The simulations show that, considering today’s visitor numbers (amplification factor 1) and a fast charger of 300 kW, the power output is below the maximum limit of 500 kW. The operating speed of the superfast charger becomes a limitation as the number of visitors increases.
On the other hand, when the number of visitors quadruples, the maximum effect also increases. Figure 5 illustrates the consequences of using an amplification factor of 4 with respect to the current visitors’ rate. In this case the aggregated charge load goes above the 500 kW threshold. The increase can be associated with the greater number of 22 kW charging stations used and is not due to the superfast charger, which quickly reaches the capacity limit.
Furthermore, 
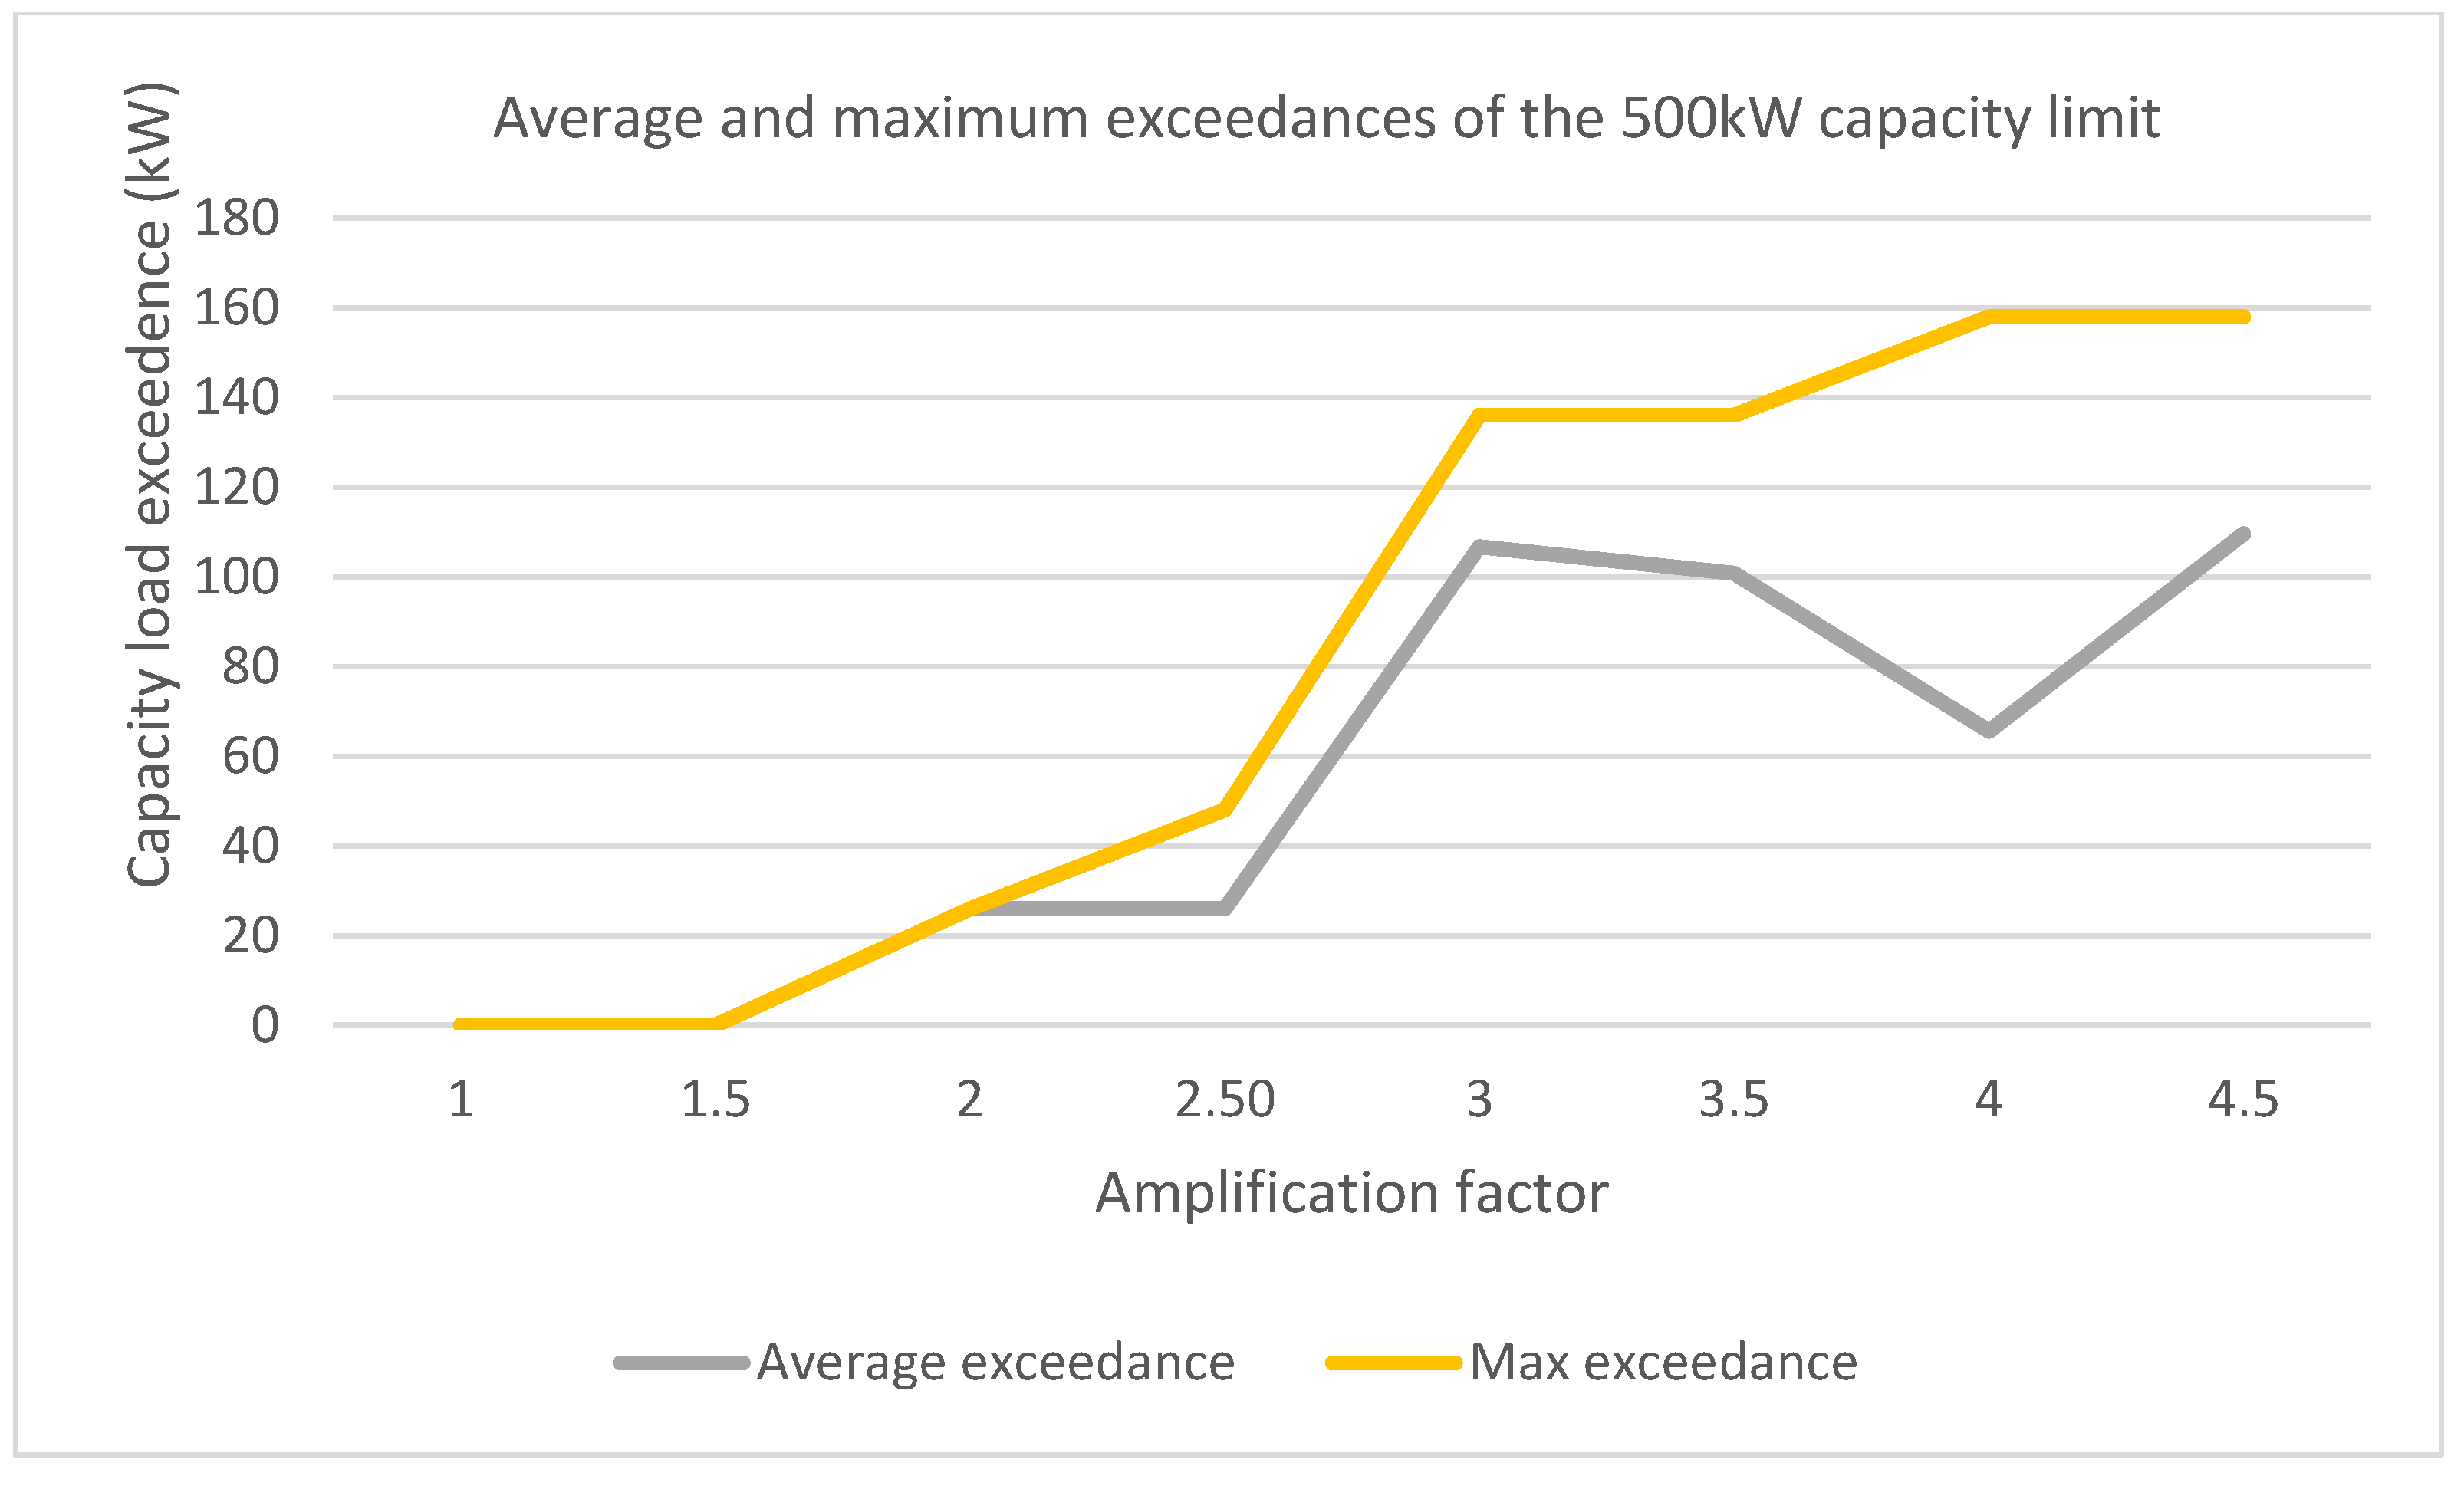
Figure 6 shows the results of simulations where the probability of exceeding the limit of 500 kW as a function of increased demand is given. The graph shows that, even at twice the current demand, the probability of exceeding the 500 kW threshold is around 20%, but the expected above-the-threshold value is around 26 kW, which is within the estimated demand response flexibility potential at the Inspiria Science Center. Furthermore, considering at least 3.5 times the number of visitors in relation to the current situation and the same service profile, the probability of exceeding the capacity limit is close to 100%. If the demand experienced at the ICS in 2018 is taken into account, the usage of a superfast charger would bring about above-the-threshold values in 40% of the cases, but the exceedance would vary around 20–30 kW (Figure 7). However, situations that require three times as much flexibility to ensure that system capacity is not exceeded should be expected during such periods.
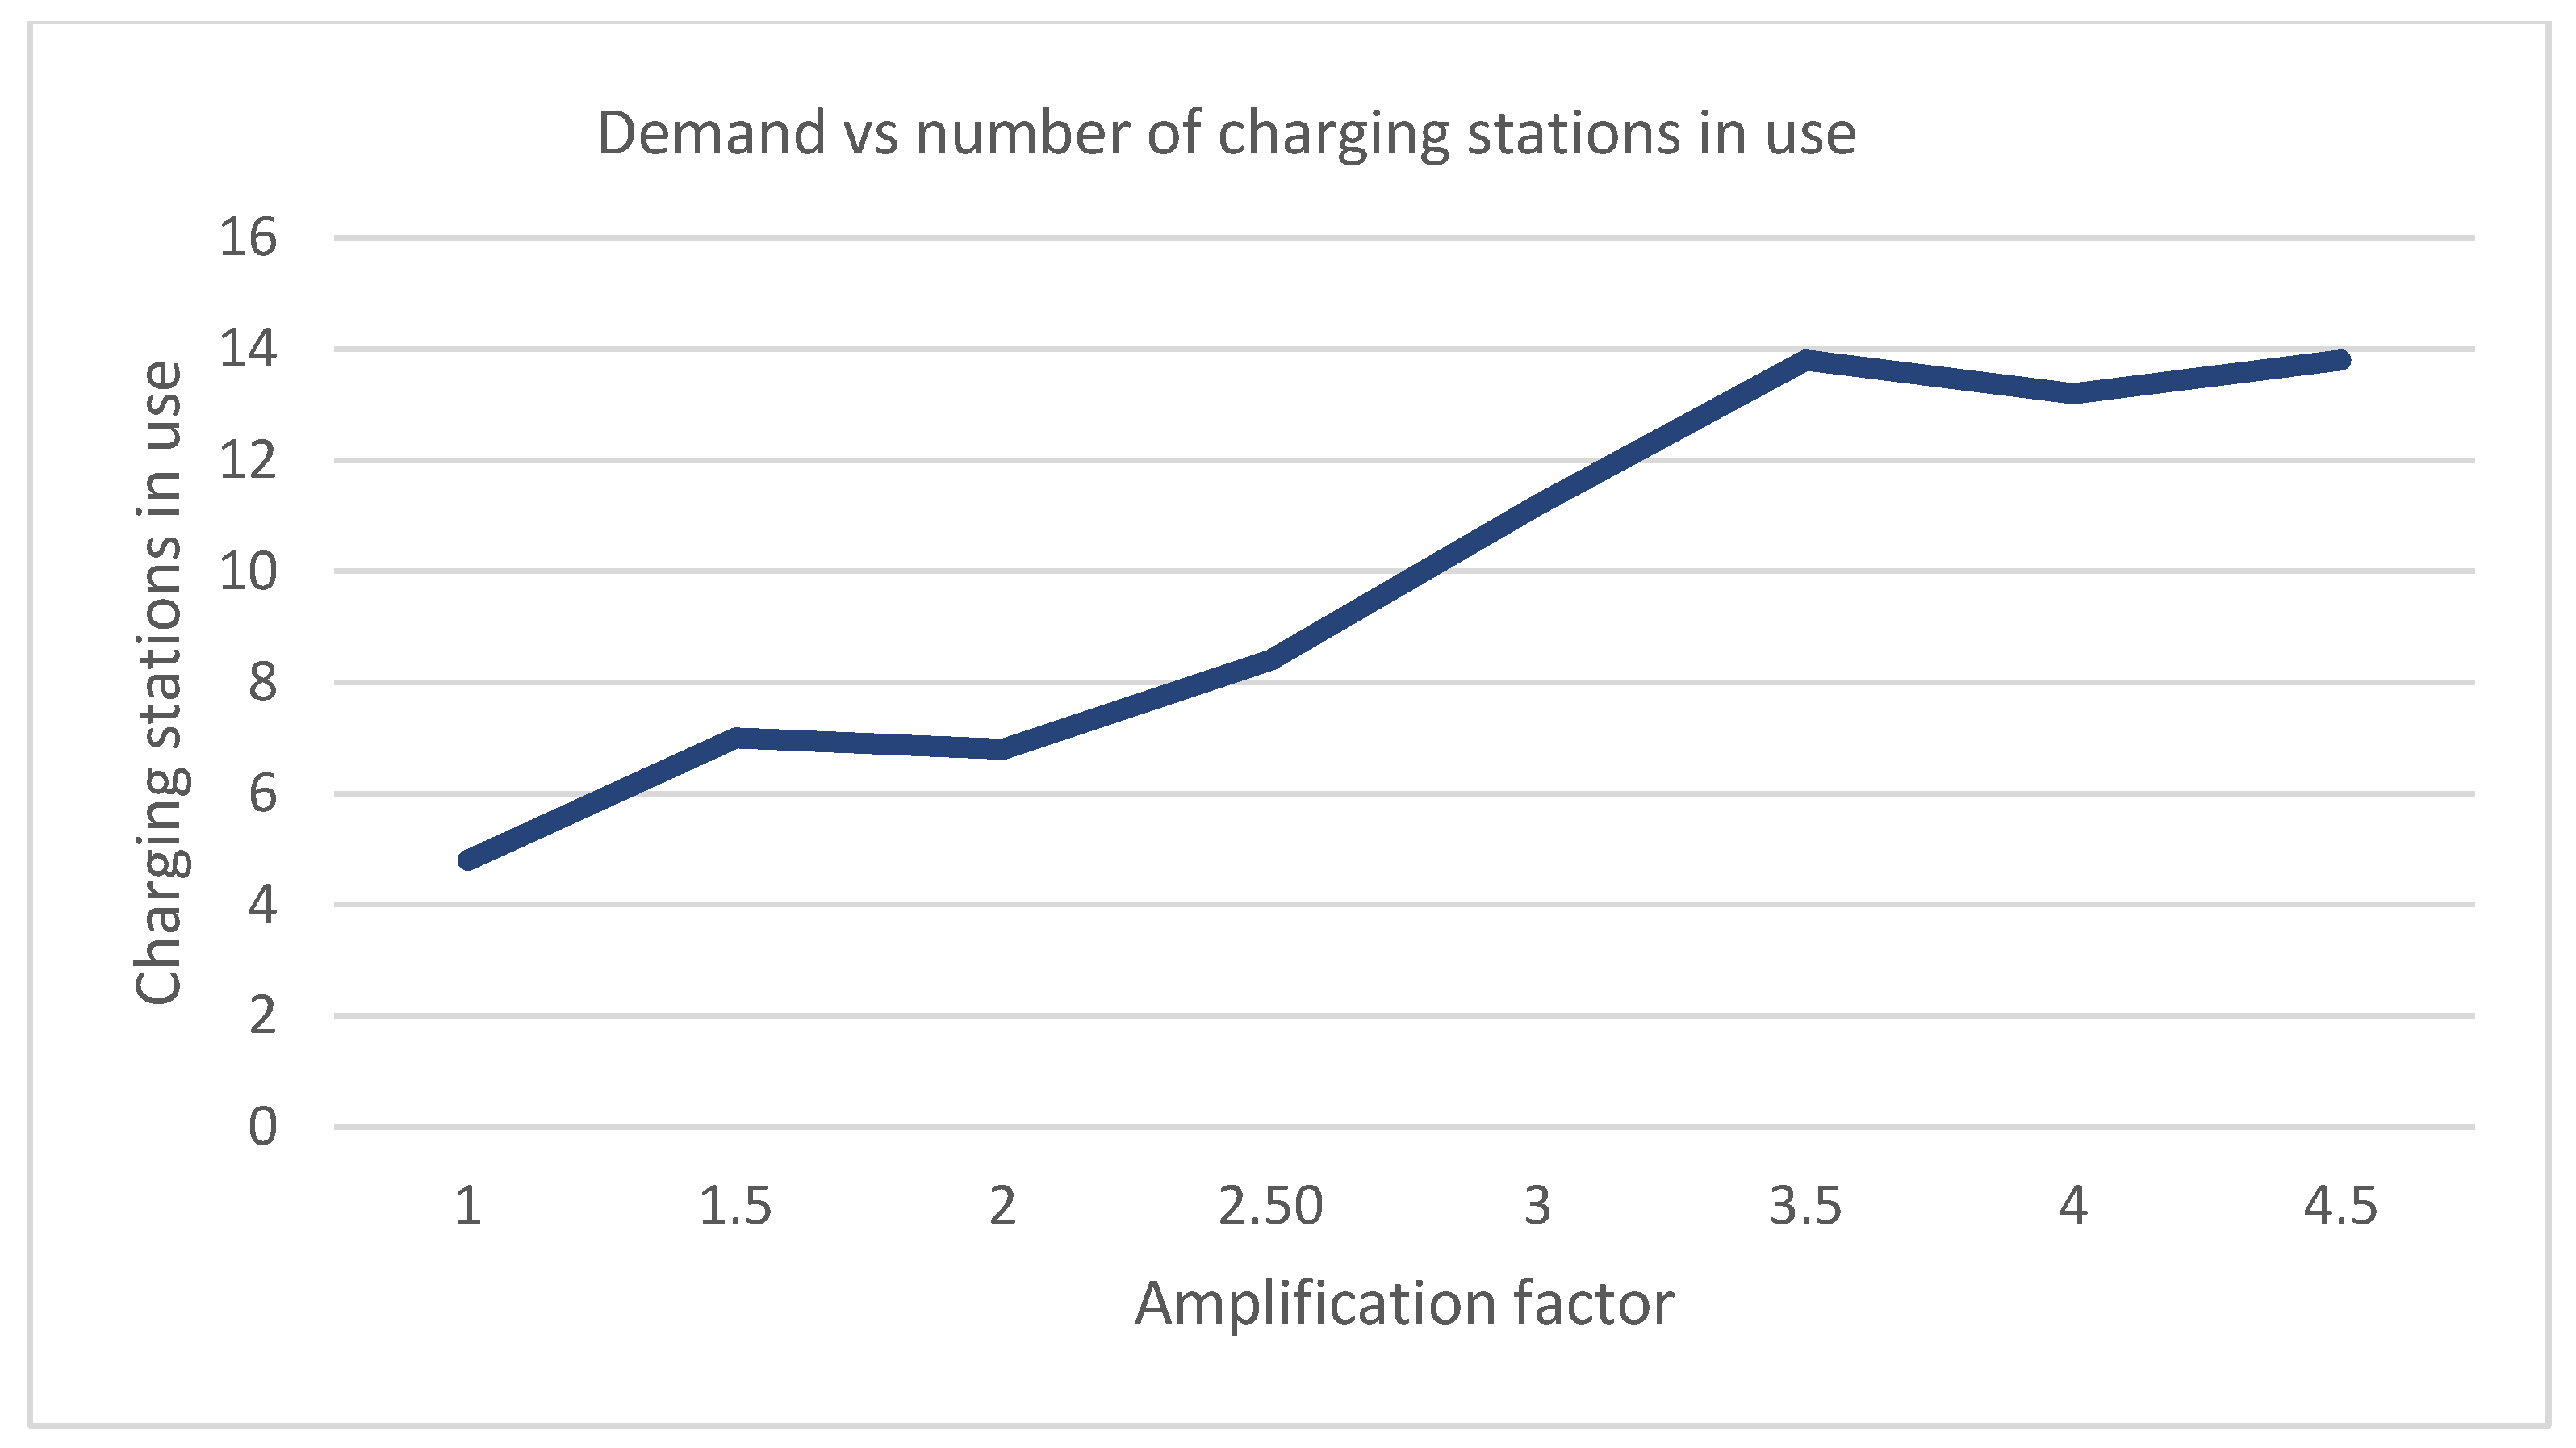
Increased demand may certainly also contribute to increased occupancy for the ICS. With a superfast charger and a quadrupling of demand, there are still 18–20 charging points (out of 33) that are rarely or never used (Figure 8). When approximately eight charging points, including the 300 kW and 50 kW chargers, are used at the same time, the probability that the physical limit of 500 kW is exceeded is close to 100%.
If the superfast charging capacity increases to handle the demand (Figure 9), this leads to a radical change in the aggregate maximum load—something that will happen even with weak or no demand growth. As illustrated in Figure 9, the maximum loads exceed the effects that result from situations with only one superfast charger. As a comparison, in Figure 5, the aggregated charge load is a bit above 600 kW, while in Figure 9 it exceeds 800 kW.

4. Discussion

4.1. Grid Impact

The capacity for charging in Norway has been proved to be too low compared to the number of vehicles and driving behavior [20]. The gap between the number of cars and available charging capacity has widened and the need for more charging points and higher capacity has become imminent [21]. However, the cost of building charging stations at attractive locations may be very high [22,23]. Considering the trends associated with charging needs, this research work investigated the impact of increasing demand for charging, specifically referring to the utilization of a superfast charger. As proved in [24], there is demand for ultrafast charging even if users have to pay more compared to other forms of charging.
Currently, however, the introduction of superfast chargers is considered a challenge in Norway [25]. Investment costs are high—an ultrafast charger can cost close to one million NOK [26]. In addition, when discussing the ultrafast charger’s impact, it should be taken into account that cars with charging capacities of 150 kW and upwards to 350 kW have been considered. As of today, only the Porsche Taycan can handle 350 kW but, according to sales statistics [27], the number of EVs with ultrafast charging capabilities above 150 kW (such as the Audi e-tron, Mercedes EQC, Tesla Model 3, Volvo XC40 and Porsche Taycan) are rapidly increasing.
The simulations undertaken showed that with one ultrafast charger the grid limit of 500 kW at the ICS would not be exceeded. However, if more ultrafast chargers were installed, utilization of flexibility resources would be required. For the ICS, demand response from nearby buildings, a stationary battery and PV panel, and smart charging can be considered suitable options.

4.2. Smart Charging

Smart charging can alleviate grid capacity challenges by charging long-term parked cars in a flexible manner, avoiding peak load periods. This is certainly not valid for superfast charging, for which the time space is very limited and the available flexibility is constrained to a few minutes when charging at full power. An alternative could be to reduce the power to 150 kW or 100 kW during very critical periods. Although very few cars today are able to charge at rates above 100 kW, the idea is that superfast charging will be more common in the future. The validity of a service based on an ultra-fast charger hinges on availability and the shortest charging time possible. That is what creates a competitive edge compared to regular charging options. Thus, reducing the effect of a superfast charger should be considered an emergency measure and, therefore, only a backup option.
In the provided simulation analysis, the superfast charging alternative was considered as “non-dispatchable” and was given top priority. Thus, smart charging aims at the 50 kW and 22 kW alternatives. It can be questioned to what extent smart charging can compare to other sources of flexibility, such as batteries. As an example, if EV drivers who park to charge and accept smart charging are granted a discount of 10–30% per kWh, a lifetime cost comparable with other flexibility alternatives can be estimated.

4.3. Benefits to CPOs and EV Owners

The charging station concept aims to provide a number of benefits to CPOs and EV drivers. For CPOs, the main benefits are associated with an enlarged market base and possibilities for inclusion of their core business (EV charging) into new profit-bringing business models. The latter could be, for example, related to integrated offers (in cooperation with the Science Center and the nearby hotel) and smart charging of long-term parked cars (e.g., the vehicles of commuters, employees situated at the local office buildings, Science Center and hotel and longer-term visitors). The innovative and renewable energy profile associated with the ICS can provide additional marketing benefits for the participating CPOs. Most importantly, the utilization of flexibility resources at the charging station can contain EV charging-induced capacity needs, and thus reduce costs for the CPOs, particularly those associated with high-capacity tariffs.
EV drivers, on the other hand, could get access to a variety of charging options at an attractive location with multiple additional services (hotel accommodation, the aquapark facilities, fitness services, restaurants, conference services, the Science Center, the commuters’ hub and a nearby office park). The possibility of making profit out of V2G/B participation and flexible charging, the wide service choice and the soft values perceived when part of an innovative, energy efficient and environmentally friendly solution should be considered as the strongest participation-motivating factors for EV owners.
Also, it should be kept in mind that the CPOs bear significant investment costs for setting up the charging points. While getting a home charger installed costs between 13,000 and 17,000 NOK, the cost for setting up a slow charger at a public space is normally within the range of 50,000 to 100,000 NOK, and establishing a fast-charging station is associated with a cost of 0.5 to 1 million NOK [26]. In addition, from the EV owner’s perspective, the price of charging, and in particular ultrafast charging, can be an issue to consider. According to the Norwegian Electric Vehicle Association, huge price differences can be observed: while the price of charging at a 150 kW Ionity pole can be as high as 8.40 NOK per kWh, the same service at a Tesla station is priced at 1.70 NOK per kWh [28]. In this regard, both CPOs and EV owners could benefit from the ICS’s offers and opportunities. For the CPOs, this means a shorter payback period, higher profits and the possibility for additional revenue from flexibility sales. The EV owners are given a larger choice of charging options and the possibility of economically benefiting from flexible charging, these also being offered in combination with value-added services.
However, when it comes to EV charging, it is important to note that the economic benefits for EV owners (seen as the savings associated with “alternative fuel”) are strongly dependent on electricity market prices. In this regard, a simplified example can be given to illustrate a case in which an ultrafast charger loses its relative economic competitiveness to gasoline-fueled cars and home charging: a Porsche Taycan can charge at 350 kW to fill up its 93.4 kWh battery in approximately 15 min, enabling the charger to serve four such cars in an hour. This suggests a 15-min spike of 350 kW or a 350 kW load for an hour. If this charging had taken place on the morning of 12 February 2021, when the electricity price in Norway was at its highest (249.98 EUR/MWh from 8 a.m. to 9 a.m.), the cost for charging one car would have been close to 350 NOK, which would give a km price of 80–100 øre. The price of driving a diesel car would be approximately the same.

5. Conclusions

A simulation model was developed for the Inspiria Charging Station based on empirical material from Fortum Charge and Drive. It was assumed that future daily demand would have a statistical distribution largely similar to the one established with historical data. However, different market measures and the accelerating e-mobility development in Norway could affect the assumed similarity. The existing historical data and the simulations carried out based on it provide a useful reference point for future assessments and decision making pertaining to further development of the ICS and for charging station establishments in general.
The simulations performed indicate that the probability of experiencing capacity constraints increases rapidly if demand is doubled. This depends on the desire of electric car drivers to primarily use a superfast charger instead of other chargers. High usage of the superfast charger induces significant capacity impact but is, however, limited by the operating ability of the charger. At the point where a queue for charging is formed, the ICS capacity ceiling is reached. In a situation in the future in which the number of superfast chargers is doubled, a risk for exponential development occurs and the conditions examined here are no longer applicable. However, there is a preliminary safety factor in the technical limitations due to the capabilities of today’s electric cars. The fact that few cars can handle charging levels of 100 kW or higher provides a significant margin compared to the calculations presented here.
Based on the assumptions used for the analyses, it can be expected that the probability of exceeding the 915-amp limit (500 kW) for the charging station installation will be higher than 50% if current demand is tripled or more. However, such exceedances would be limited to 50–150 kW. The ambition is that, in the future, this can be handled using a combination based on smart charging, indoor demand response at the nearby Science Center building and a battery. Indoor demand response is considered the cheapest option but may entail a number of disadvantages for the primary operation at the Inspiria Science Center. This flexibility should, therefore, only be used as a reserve. A more suitable flexibility measure would be to use smart charging for cars that have been parked for a long time. However, this process is still immature and would need to be developed over time.
The assumptions made may eventually prove to be the key limitations of this research work. The simulations carried out were based on historical data and the associated statistical distribution depended on an assumption that has not yet been proved. However, while Norway experiences accelerated development regarding EVs and charging, the patterns of arrivals could change as more people make the transition to e-mobility. Additionally, the prices for home charging relative to the prices for a public service can also change influx for different hours and days. However, the marketing professionals associated with the ICS project maintain strong beliefs that current behavior (and thus the distribution of arrivals) will not change. Their view has been recently supported by an independent party (a supplier of CPO supporting services) [29]. Referring to empirical data from multiple charging stations, the authors of [29] showed that the distinct usage pattern that has been historically identified, where EV drivers consider the time available rather than the state-of-charge, was maintained in most places despite growths in the number of arrivals. Future statistics on arrivals and demand for charging will thus indicate whether the assumptions made still represent a sound base for the provided research.
The conducted analysis constituted the basis for both the business development and design of the ICS. Recent market developments regarding superfast chargers, where each charger is supported with a battery (e.g., of the type described in [30]), represent a development that fits well with the ambitions defining the starting point for this analysis. As the demand for superfast charging is growing in the country, while the locations with sufficient capacity remain limited, systems that can reduce the peak loads are needed. The use of different sources of flexibility is of high interest and will be investigated in future work. The current study could thus serve as a reference point for future studies on the e-mobility topic in which different means of peak load management are considered.
The variety of charging options and the utilization of a shared economy for energy flexibility distinguishes the ICS from other charging station alternatives and substantially increase its attractiveness to visitors. At the current initial stage of the ICS, however, a stable flexibility resource that can handle the first phase of a future growth in demand should be ensured. Here, a battery could play an important role. Solar panels could contribute to extending the life of the battery but cannot be used as the sole flexibility resource since production during the winter months is limited. Future research related to the ICS will focus on the possibility of efficiently balancing the local system by utilizing various distributed energy resources (demand response, smart charging, PV panel and a stationary battery), thus enhancing the use of intermittent renewable energy and further reducing the need for investments in new local infrastructure.

Author Contributions

Conceptualization, I.I. and B.B.; Data curation, B.B.; Formal analysis, I.I. and B.B.; Investigation, I.I.; Methodology, B.B.; Software, B.B.; Supervision, B.B.; Writing—original draft, I.I.; Writing—review & editing, I.I. and B.B. All authors have read and agreed to the published version of the manuscript.

Funding

This work was supported by the CINELDI project (Centre for Intelligent Electricity Distribution), an eight-year Research Centre under the FME scheme (Centre for Environment-Friendly Energy Research, 257626/E20). The presented research was part of a CINELDI task for 2021 where energy flexibility, EVs, smart charging and grid impact were the main focus. The authors gratefully acknowledge the financial support from the Research Council of Norway and the CINELDI partners. In addition, the authors are grateful to have been able to exploit the results from the NVADE project, funded by the European Union’s Horizon 2020 Research and Innovation program under Grant Agreement No. 731148.

Conflicts of Interest

The authors declare no conflict of interest. The funding organization had no role in the design of the study; in the collection, analyses, or interpretation of data; in the writing of the manuscript, and in the decision to publish the results.

References

  1. Official Website of the European Union. Transport Emissions. European Commission. Available online: https://ec.europa.eu/clima/policies/transport_en (accessed on 2 July 2020).
  2. Zhang, R.; Fujimori, S. The role of transport electrification in global climate change. Environ. Res. Lett. 2020, 15, 034019. [Google Scholar] [CrossRef]
  3. Norwegian Electric Vehicle Association. Statistics on Electric Vehicles. Available online: https://elbil.no/elbilstatistikk/ (accessed on 21 December 2020).
  4. Institute of Transport Economics. Norwegian Center for Transport Research. Who Goes Electric? Characteristics of Electric Car Ownership in Norway 2011–2017. Available online: https://www.toi.no/publications/who-goes-electric-characteristics-of-electric-car-ownership-in-norway-2011-2017-article36391-29.html (accessed on 10 March 2021).
  5. Holst, L.A. Hvem er Den Norske Elbil-Kjøperen? (Who Is the Norwegian EV-Buyer?). Bisnode. Available online: https://www.bisnode.no/kunnskap/blogg/hvem-er-den-norske-elbil-kjoperen/ (accessed on 11 March 2021).
  6. Statistics Norway. Elbileigarne Sin Sosiale Profil (The EV Owners’ Social Profile). Available online: https://www.ssb.no/transport-og-reiseliv/artikler-og-publikasjoner/kvart-sjette-av-dei-rikaste-hushalda-har-elbil (accessed on 10 March 2021).
  7. Burnham, A.; Dufek, E.J.; Stephens, T.; Francfort, J.; Michelbacher, C.; Carlson, R.B.; Zhang, J.; Vijayagopal, R.; Dias, F.; Mohanpurkar, M.; et al. Enabling fast charging—Infrastructure and economic considerations. J. Power Sources 2017, 367, 237–249. [Google Scholar] [CrossRef]
  8. Wang, Y.; Su, H.; Wang, W.; Zhu, Y. The impact of electric vehicle charging on grid reliability. In IOP Conference Series: Earth and Environmental Science; IOP Publishing: Bristol, UK, 2018; Volume 199. [Google Scholar]
  9. Statista. Market Share of Newly Registered Passenger Electric Vehicles in Selected European Countries in 2020. Available online: https://www.statista.com/statistics/625795/eu-electric-vehicle-market-share-by-country/ (accessed on 10 March 2021).
  10. Chun-lin, G.; Li, W.; Dan, W.; Wen-bo, Q.; Xiang-ning, X. Impact of electric vehicle charging on power grid. In Proceedings of the International Conference on Electrical and Control Engineering, Yichang, China, 16–18 September 2011; pp. 2270–2274. [Google Scholar] [CrossRef]
  11. Khonji, M.; Chau, S.C.-K.; Elbassioni, K. Challenges in Scheduling Electric Vehicle Charging with Discrete Charging Rates in AC Power Networks. In Proceedings of the e-Energy’18: The Ninth International Conference on Future Energy Systems, Karlsruhe, Germany, 12–15 June 2018; pp. 183–186. [Google Scholar] [CrossRef]
  12. Al-Ogaili, A.S.; Hashim, T.J.; Rahmat, N.A.; Ramasamy, A.K.; Marsadek, M.B.; Faisal, M.; Hannan, M.A. Review on Scheduling, Clustering, and Forecasting Strategies for Controlling Electric Vehicle Charging: Challenges and Recommendations. IEEE Access 2019, 7, 128353–128371. [Google Scholar] [CrossRef]
  13. Das, H.S.; Rahman, M.M.; Li, S.; Tan, C.W. Electric vehicles standards, charging infrastructure, and impact on grid integration: A technological review. Renew. Sustain. Energy Rev. 2020, 120. [Google Scholar] [CrossRef]
  14. Smart Electric Power Alliance. A Comprehensive Guide to Electric Vehicle Managed Charging. 2019. Available online: https://sepapower.org/resource/a-comprehensive-guide-to-electric-vehicle-managed-charging/ (accessed on 23 November 2020).
  15. Knowledge and Innovation Center ElaadNL. What Happens When Algorithms Take Control of the Charging of Electric Vehicles on a Massive Scale; INVADE Project and ElaadNL: Arnhem, The Netherlands, 2019. [Google Scholar]
  16. UK Power Networks. Launch of UK’s First Electric Vehicle Smart Charging Marketplace Trial. Available online: https://www.ukpowernetworks.co.uk/internet/en/news-and-press/press-releases/Launch-of-UKs-first-electric-vehicle-smart-charging-marketplace-trial.html (accessed on 23 November 2020).
  17. ENSTO. 5 Great EV Charging Business Models. Available online: https://www.ensto.com/company/newsroom/blogs/5-great-ev-charging-business-models/ (accessed on 24 November 2020).
  18. McKinsey&Company. McKinsey Electric Vehicle Index: Europe Cushions a Global Plunge in EV Sales. Available online: https://www.mckinsey.com/industries/automotive-and-assembly/our-insights/mckinsey-electric-vehicle-index-europe-cushions-a-global-plunge-in-ev-sales (accessed on 24 November 2020).
  19. Fortum Charge and Drive. Available online: https://www.fortum.com/products-and-services/vehicle-charging/general-information/travelling-and-charging (accessed on 26 November 2020).
  20. Lie-Jacobsen, Ø. Ladekø—Hvem er Først i Køen? (Charging Queue—Who Is the First on the Queue?). Elbil 24. Available online: https://www.elbil24.no/nyheter/hvem-er-forst-i-koen/72960339 (accessed on 10 March 2021).
  21. Lervik, F. Monica og Harald i Ladekø Sammen Med Med Halve Elbil-Norge (Monica and Harald in a Charging Queue Together with Half of EV-Norway). TV2 Nyheter. Available online: https://www.tv2.no/a/11553856 (accessed on 10 March 2021).
  22. Myhre, T. Her Lønner Det Seg ikke å ha Flere Ladestasjoner (Here It Does Not Pay off to Have More Charging Stations). NRK. Available online: https://www.nrk.no/innlandet/distriktene-taper-i-utbygging-av-ladestasjoner-for-elbil-1.15336256 (accessed on 10 March 2021).
  23. Valle, M. Det er for Vanskelig å Etablere Hurtigladere på Bensinstasjoner (It Is Too Difficult to Establish Fast Chargers at Petrol Stations). Teknisk Ukeblad. Available online: https://www.tu.no/artikler/det-er-for-vanskelig-a-etablere-hurtigladere-pa-bensinstasjoner/500014 (accessed on 10 March 2021).
  24. Have, S.; Gkiotsalitis, K.; Geurs, K. Investigating the Future of Ultrafast Charging: A Choice Experiment in the Netherlands. World Electr. Veh. J. 2020, 11, 70. [Google Scholar] [CrossRef]
  25. Ask, A.O. Norske Bensinstasjoner Synes det er for Dyrt å Bygge Hurtigladere (Norwegian Petrol Stations Consider It Too Expensive to Build Fast Chargers). Aftenposten. Available online: https://www.aftenposten.no/norge/politikk/i/pAn7nG/norske-bensinstasjoner-synes-det-er-for-dyrt-aa-bygge-hurtigladere (accessed on 10 March 2021).
  26. Figenbaum, E.; Amundsen, A. Ladestasjoner for Elbiler. Tiltak.no. Available online: https://www.tiltak.no/c-miljoeteknologi/c4-atferdspaavirkning/c-4-6/#:~:text=I%20f%C3%B8lge%20Enova%20(2016)%20kostet,vil%20kostnadene%20kunne%20v%C3%A6re%20lavere (accessed on 10 March 2021).
  27. Elbilstatistikk.no. Statistics on Electric Vehicles in Norway. Available online: https://elbilstatistikk.no/ (accessed on 10 March 2021).
  28. Norwegian EV Association (Norsk Elbilforening). Dette Koster Hurtiglading (This Costs Fast Charging). Available online: https://elbil.no/dette-koster-hurtiglading/ (accessed on 10 March 2021).
  29. MeshCraft. Smart Charge Webinar. In Proceedings of the Hvordan Elbilen kan Redusere Svingninger i Strømnettet (How the Electric Vehicle Can Reduce Fluctuations in the Electricity Grid), Webinar, 11 March 2021. [Google Scholar]
  30. JOLT Energy Group. We Are Bringing High-Power Charging Downtown. Available online: https://jolt.energy/urban-charging/ (accessed on 23 March 2021).
Figure 1. Sales of chargeable cars (battery-driven and hybrid) as a percentage share of the total number of car sales in selected countries. Data source: [9].
Wevj 12 00053 g001
Figure 2. The Inspiria charging station concept embracing different charging point operators (CPOs).
Wevj 12 00053 g002
Figure 3. Hourly distribution of number of arrivals for charging and charging duration at the Inspiria charging station (ICS). Average values for the period January–March 2019. The “<1 min” category is associated with an often experienced “trial and error” period at the beginning of the charging process. The late charging sessions are typically related to the routine of the neighboring hotel.
Wevj 12 00053 g003
Figure 4. Results from simulations with amplification factor 1 (current situation) showing arrival rates in one day (figure on the (left)) and estimated loads as a consequence of this type of arrival pattern (figure on the (right)).
Wevj 12 00053 g004
Figure 5. Simulation of a future situation where demand is four times higher than today (amplification factor 4). In this case, the physical capacity limit of 500 kW is exceeded at around 150 kW.
Wevj 12 00053 g005
Figure 6. The probability that a given amplification factor will lead to loads higher than 500 kW.
Wevj 12 00053 g006
Figure 7. Average and maximum exceedances of the 500 kW capacity limit for equal amplification factors. The maximum values can occur approximately 20% of the time.
Wevj 12 00053 g007
Figure 8. Number of charging stations used at different demand rates (amplification factor 1–4).
Wevj 12 00053 g008
Figure 9. An example of a future situation where demand is four times higher than today and where this demand is met with an extra superfast charger of 300 kW.
Wevj 12 00053 g009
Table 1. Cumulative distribution over charging time duration per hour of the day.
01234567891011121314151617181920212223
<1 MIN.0.75000000.18750.16330.26670.18750.24780.22860.24110.15060.11710.08890.07530.07780.16870.1270.22000.2
<15 MIN.0.8333101000.3750.38780.51110.40630.41590.33330.39720.30120.24770.26670.27960.31110.39760.33330.460.20.14290.4
<30 MIN.0.833310100.50.50.61220.71110.6250.61950.57140.55320.50.36940.44440.55910.60.61450.55560.580.53330.42860.4
<1 H0.916710100.750.750.73470.86670.84380.73450.70480.66670.58430.45950.58520.78490.77780.72290.68250.70.66670.71430.8
<2 H0.958310100.750.8750.8980.91110.95310.80530.82860.73050.67470.5090.64440.84950.83330.81930.73020.80.80.78571
<3 H0.958310100.750.93750.91840.93330.98440.8850.89520.86520.82530.61710.74070.88170.91110.90360.8730.820.86670.85711
<4 H0.958310100.750.93750.93880.93330.98440.97350.94290.89360.91570.69820.78520.92470.93330.93980.93650.920.93330.92861
<5 H110100.750.93750.93880.93330.98440.97350.99050.94330.94580.76130.80740.94620.96670.96390.93650.940.93330.92861
<6 H110100.750.93750.93880.93330.98440.973510.98580.96390.77480.81480.94620.96670.97590.95240.960.93330.92861
<7 H110100.750.93750.93880.93330.98440.9735110.9880.84680.84440.96770.97780.9880.98410.980.933311
<8 H11010.50.750.93750.93880.93330.98440.9735110.9940.9730.91110.97850.977810.984110.933311
<9 H11110.510.93750.93880.93330.98440.9735110.9941110.977810.984110.933311
>=10 H111111111111111111111111
SUM12.2081221228.510.2510.34710.810.90610.54910.49510.2779.83738.37398.933310.19410.31110.49410.07910.389.66679.714310.8
Table 2. Overview of the ICS—existing and planned chargers.
Existing ChargersPlanned Chargers
1 charger of 50 kW1 superfast charger of more than 300 kW
7 chargers of 22 kW32 chargers of 22 kW
Table 3. Energy costs at the Inspiria Science Center; data provided by the local DSO Hafslund Nett.
Energy Cost ElementPeriodNOKConsumptionOverall Energy Cost
Grid tariff for capacityDecember–February150100 kWh/h15,000 NOK/month
Grid tariff for capacityNovember, March80100 kWh/h8000 NOK/month
Grid tariff for capacityApril–October23100 kWh/h2300 NOK/month
Grid tariff for energyNovember, March0.0750,000 kWh/month3500 NOK/month
Grid tariff for energyApril–October0.03960,000 kWh/month1950 NOK/month
Energy spot priceHigh-price period0.555,400 kWh/month (avg.)27,706 NOK/month
Energy spot priceLow-price period0.2555,400 kWh/month (avg.)13,853 NOK/month
Table 4. Charging-related characteristics for different car models as of 2019.
Car ModelBattery CapacityType of ChargerMaximum Power Usage during Fast Charging (DC)
Porsche Taycan90 kWhType 2, CCS C2350 kW
Audi e-tron95 kWhType 2, CCS C2150 kW
Jaguar I-Pace90 kWhType 2, CCS C2100 kW
KIA e-soul30 kWhType 1, CHAdeMO80 kW
KIA Niro EV64.2 kWhType 2, CCS C280 kW
Nissan Leaf gen 260 kWhType 2, CHAdeMO50 kW
Tesla Model S (different versions)Up to 100 kWhType 2120 kW
Tesla Model 3(different versions)Up to 75 kWhType 2, CCS C2150 kW
MB EQC 40080 kWhType 2, CCS C2110 kW
MB E250B36 kWhType-250 kW
Opel Ampera60 kWhType 2, CCS C250 kW
Renault ZOE E4041 kWhType-250 kW
Publisher’s Note: MDPI stays neutral with regard to jurisdictional claims in published maps and institutional affiliations.

