Article

Reliability Control of Electric Racing Car’s Accelerator and Brake Pedals

School of Mechanical and Automotive Engineering, Xiamen University of Technology, Xiamen 361024, China
*
Author to whom correspondence should be addressed.
World Electr. Veh. J. 2021, 12(1), 1; https://doi.org/10.3390/wevj12010001
Submission received: 29 September 2020 / Revised: 12 December 2020 / Accepted: 20 December 2020 / Published: 23 December 2020

Abstract

:
Considering the rules of Formula Student Racing regarding functional and safety requirements of an electric vehicle’s power system, a reliability control model of accelerator and brake pedal is developed in the Matlab/Simulink platform. Voltage signals of the accelerator pedal are filtered. An amplitude limit module and consistency module check the filtered voltage signals of the accelerator pedal. The voltage signal of the brake pedal is processed to achieve the accurate position of the accelerator pedal and avoid the influence of incorrect signals and mis-operation on safety. The control model need not change the structure of the pedal and increase the sensors. Simulation and experimental results verified that the model can effectively avoid influences of pedal vibration on the voltage signal, identify the faulty signals and cut power output when the accelerator and brake pedal are depressed simultaneously.

1. Introduction

Formula Student Racing is an engineering competition. Over a year, students need to build a single seat formula racing car. Every year, Formula Student conducts the competition in Germany, Britain, China, America and other countries. Students compete with teams from all over the world. The purpose of the competition is not only to select the fastest race car, but also to examine the comprehensive strength of a car, such as construction, performance, cost and business planning [1,2]. Undoubtedly, Formula Student has cultivated many talents for the electric vehicle field. As an important component of an electric racing car’s power system, the accelerator pedal will greatly affect the power, stability and safety of the racing car. It must respond to the driver’s intention accurately and quickly. Now, research on electric accelerator pedals are mostly focused on using Kalman filter, fuzzy control, sliding-mode control and neural network control to obtain the actual position of the accelerator pedal. Hai Wang et al. proposed a tracking control model based on continuous fast non-singular terminal sliding mode for vehicle electronic throttle [3]. Bin Yang et al. took spring, stick-slip friction and gear backlash into account and proposed a nonlinear controller to estimate the throttle opening change [4]. Youhao Hu et al. proposed a control scheme to estimate the upper bound of the lumped uncertainty. The scheme is based on an extreme-learning-machine for vehicle electronic throttles with uncertain dynamics [5]. Hao Sun et al. established a fuzzy dynamical model for an electronic throttle system which had the features of uncertainty, nonlinearity and external disturbance [6]. Sun Jian-min et al. established a mathematical model for an electronic throttle by using fuzzy and immune feedback control algorithms [7]. In order to access the actual position of the vehicle electronic throttle when there are failures in the sensor, Alessandro N. Vargas et al. used a wattmeter and unscented Kalman filter to estimate the position [8]. However, these control algorithms are complicated and require more memory which need more iteration time. So they are not suitable for the quick response control system of electric racing cars. In the research on the reliability of the accelerator pedal and the brake pedal, the main focus is only on the pedal mechanical structure [9,10]. The research on brake pedals mainly focuses on electro-hydraulic brake systems of electric automobiles and the identification of the driver’s braking intention. Bo Wang et al. proposed a method of identifying the driver’s braking intention which is based on an empirical mode decomposition algorithm and theory of entropy for electric automobiles [11]. Xuan Zhao et al. proposed a braking intention identification method which is based on a Gaussian mixture-hidden Markov model to improve identification of the driver’s intention [12].
However, the research focused on combined reliability control of electric racing cars’ accelerator and brake pedals is still very few. The control algorithm and mechanical devices for preventing mis-stepping on the accelerator pedal have certain limitations. Hao G et al. designed a locking device, using the centrifugal clutch, with speed threshold on the accelerator pedal [13]. However, the device will also be triggered during the rapid acceleration, which will affect the acceleration performance of the racing car. At the same time, this method greatly changes the structure of the accelerator pedal. Ming-Ji, W et al. used radar and sensors to collect vehicle information and prevented the driver from accidentally stepping on the accelerator when the distance is too short [14]. This method requires more sensors to be added to the racing car, which increases the complexity of the system and reduces the reliability.
In order to establish a combined control model of acceleration and brake pedals that meets the special requirements of the rules and design, while keeping the mechanical structure unchanged, this paper takes the accelerator and brake pedal of the Xiamen University of Technology electric racing car as a research object and proposes a simple and reliable control strategy. According to the rules of the competition, the voltage signals of the accelerator pedal position sensor (APPS) and brake pedal sensor (BPS) are detected and processed accordingly, and the acceleration and brake pedals are prevented from being depressed at the same time. The control model that meets the requirements is established in Matlab/Simulink and verified by experimental test.

2. Design Requirements

The electric accelerator pedal consists of mechanical structure, two independent displacement sensors and relevant circuits. Its essence it converts the driver’s torque request to corresponding voltage signals and transfers them to the vehicle control unit (VCU). As shown in Figure 1, voltage signals are sent to the motor control unit (MCU) by controller area network (CAN) bus after processing in the VCU and the MCU controls the torque output of the motor.
According to competition rules, the electric racing car’s accelerator and brake pedal should meet the following rules:
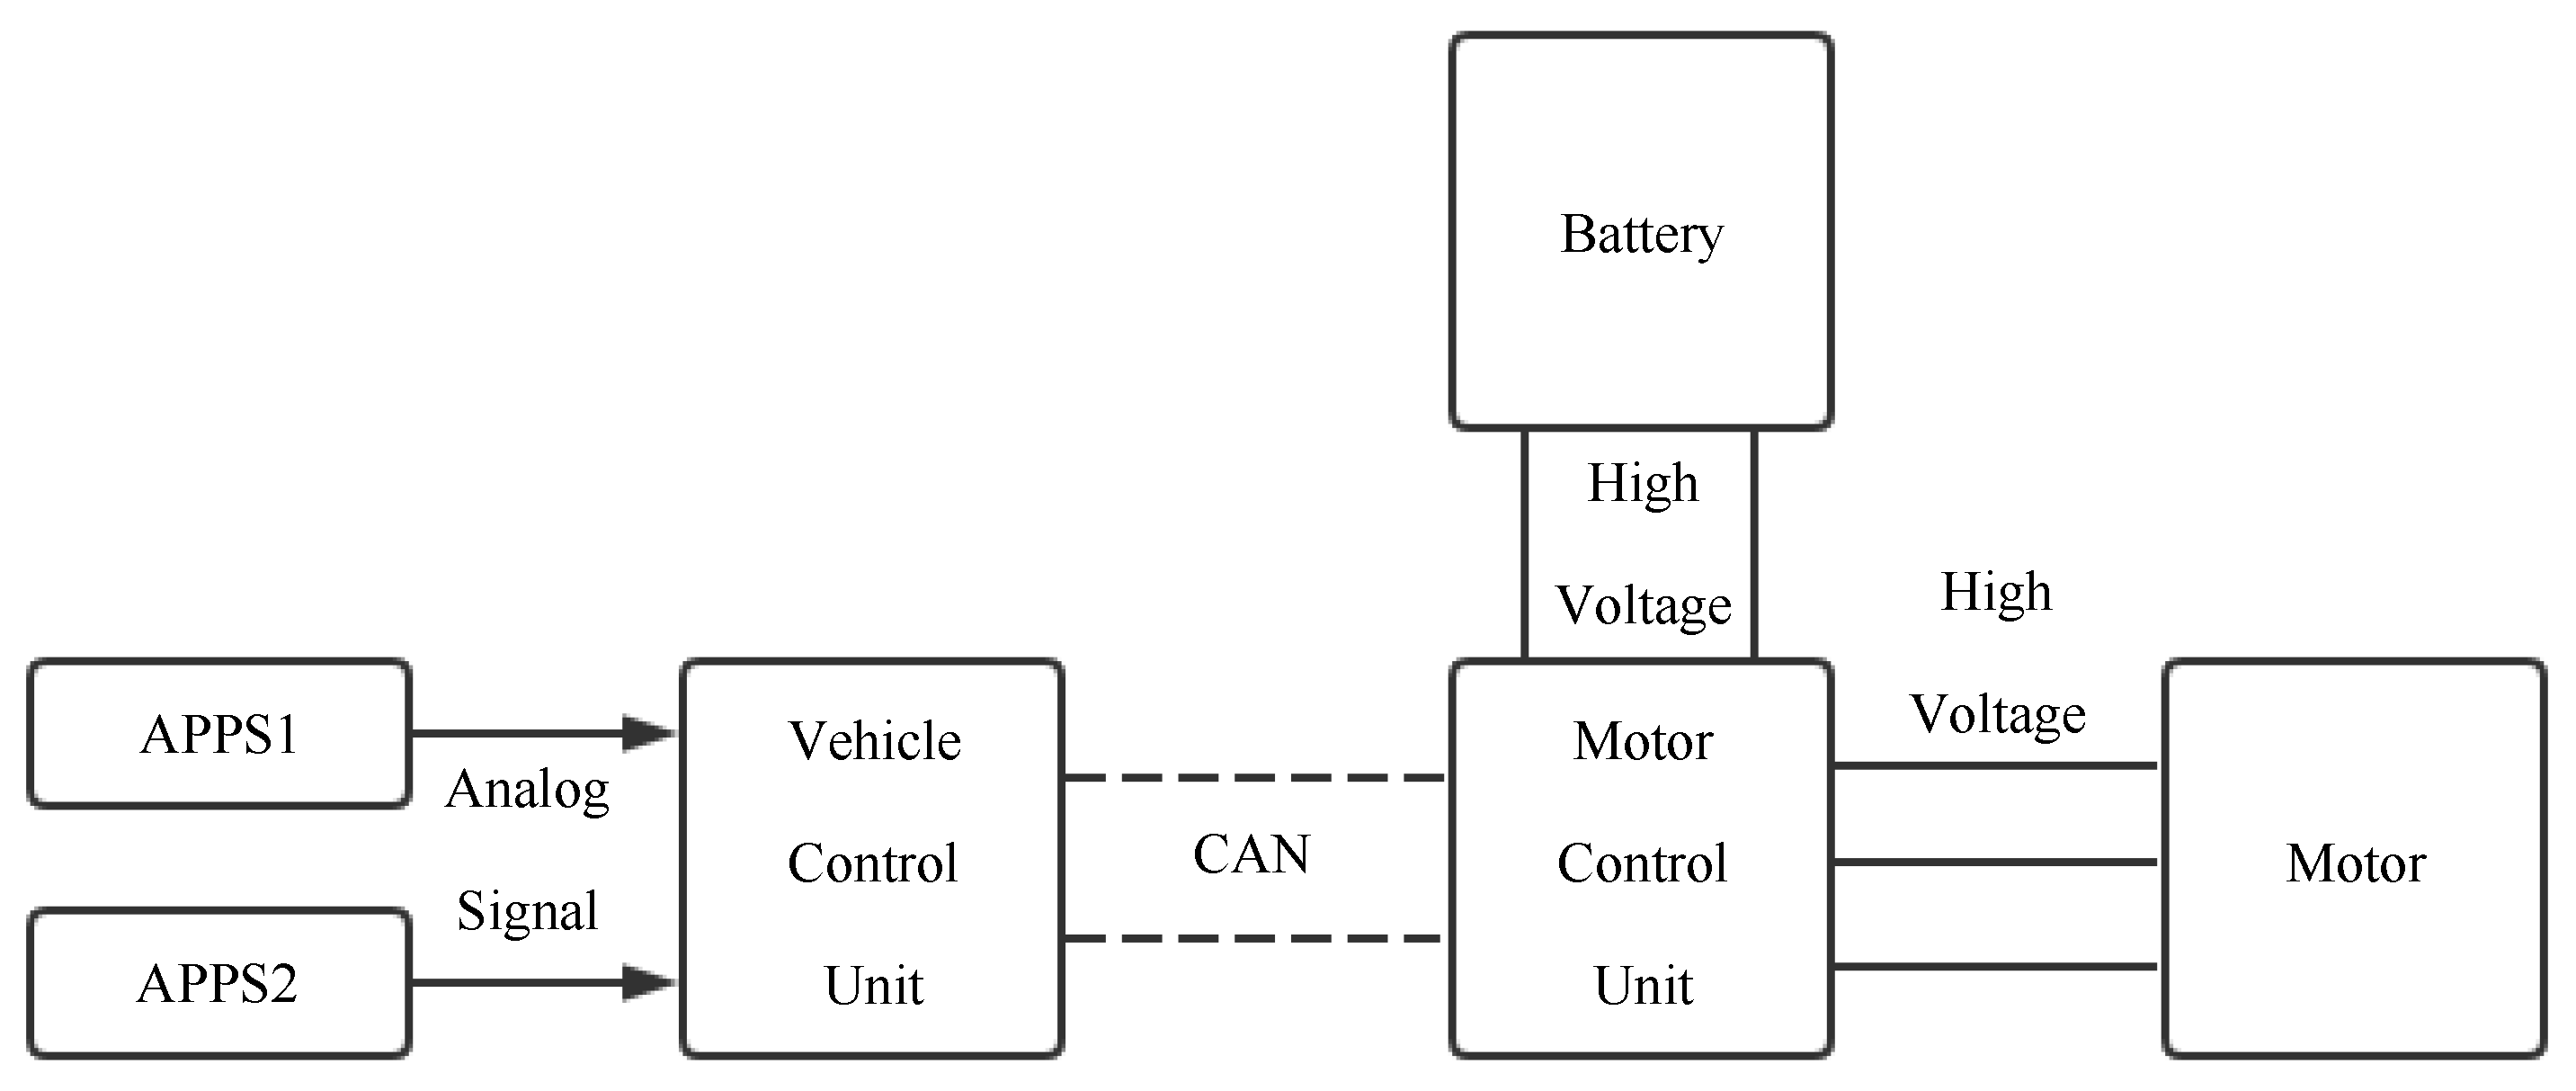
  • Each car must use at least two independent APPSs, which means that each sensor does not share power and signal line;
  • If the car uses analog sensors, the transfer function of each sensor must be different. Each sensor’s slope must be positive and either the gradients, offsets or both, should also be different to other(s);
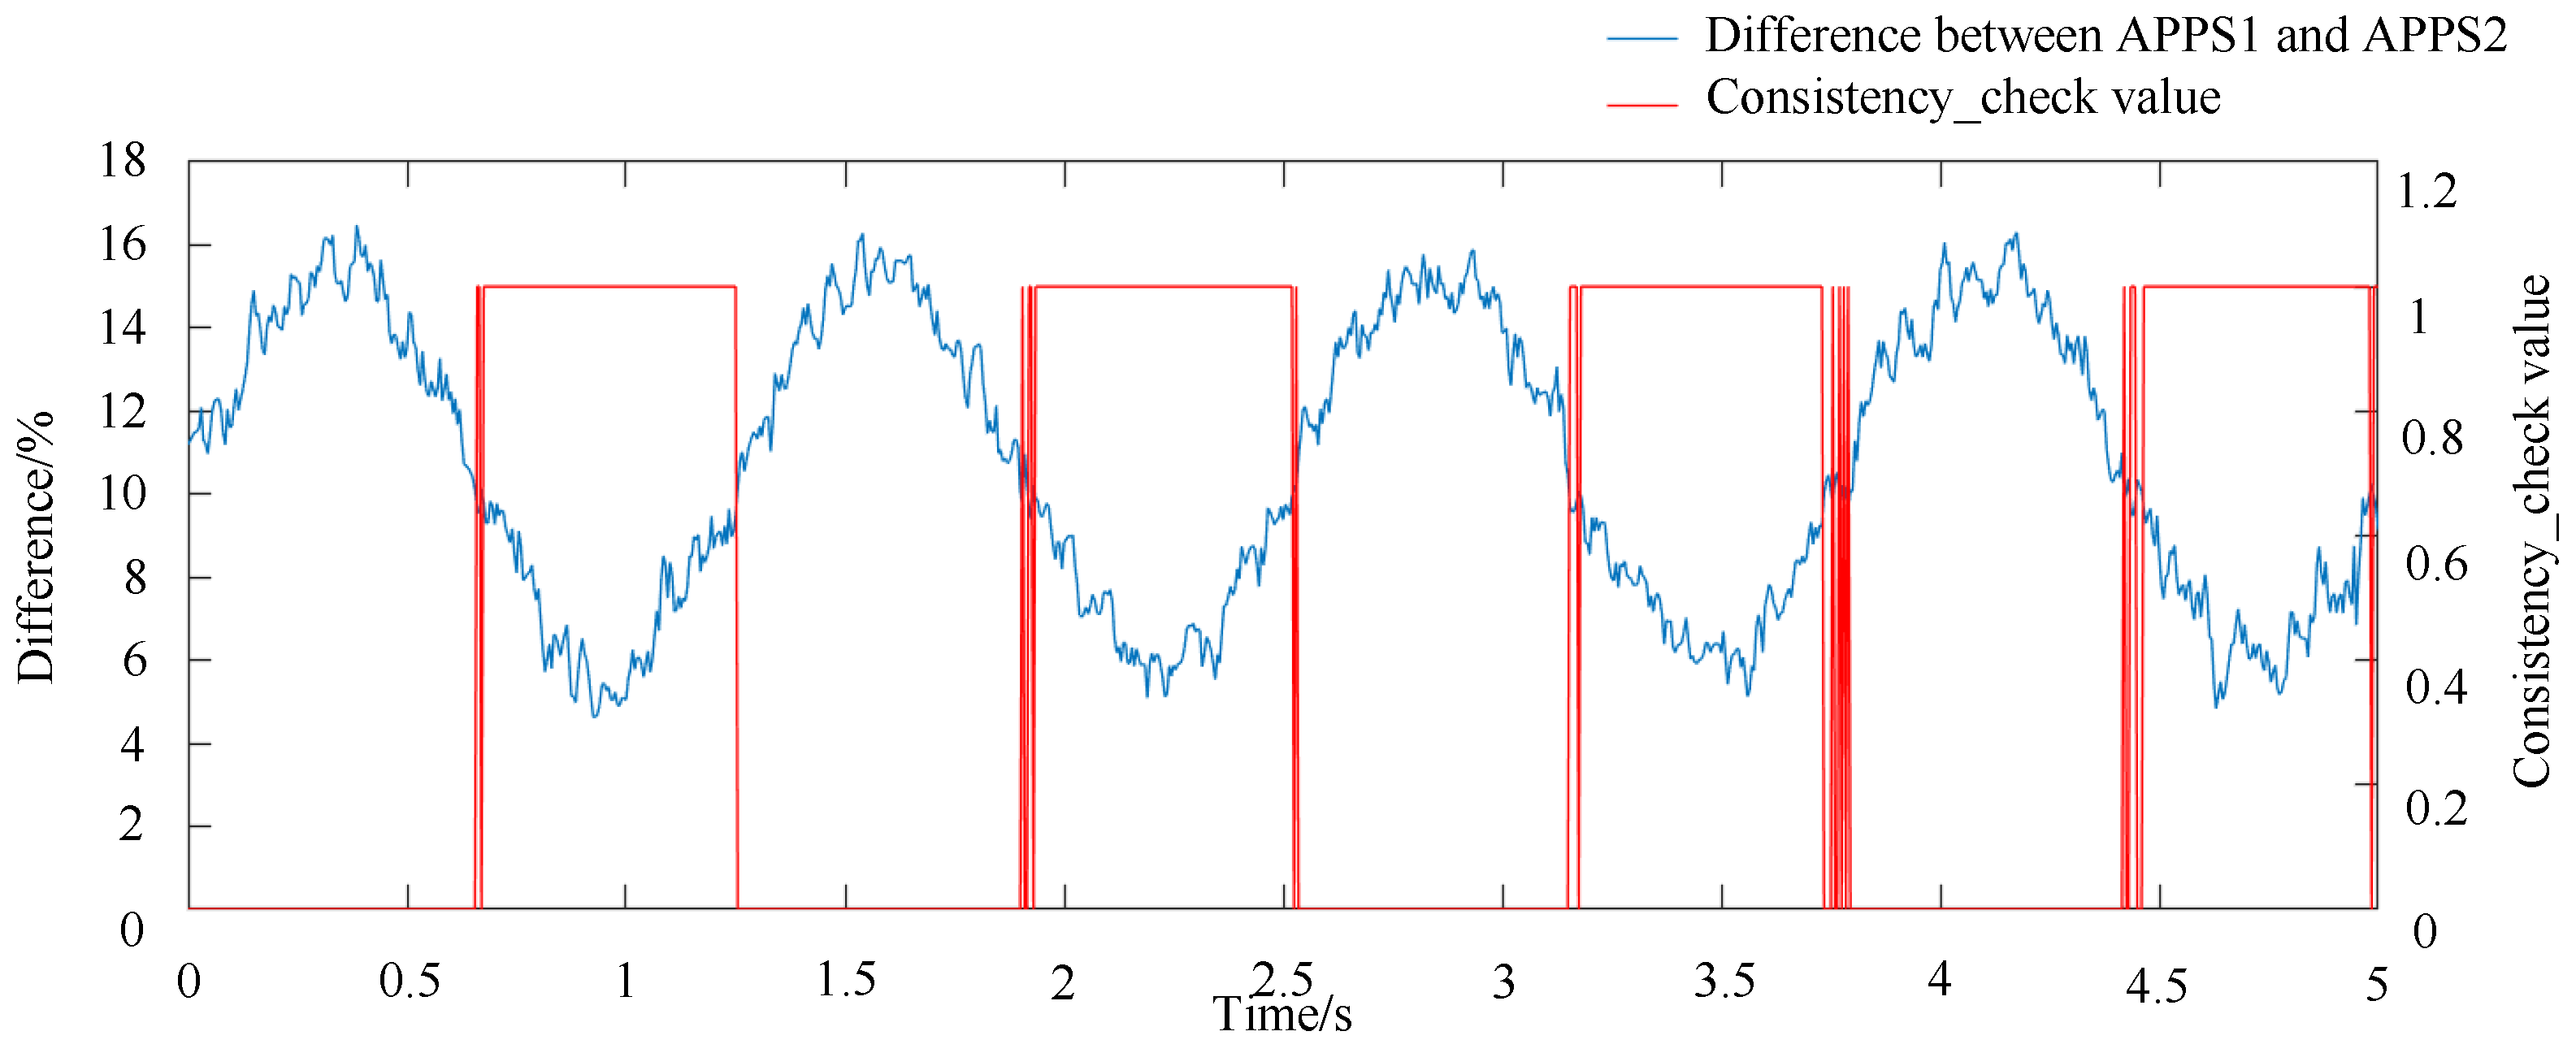
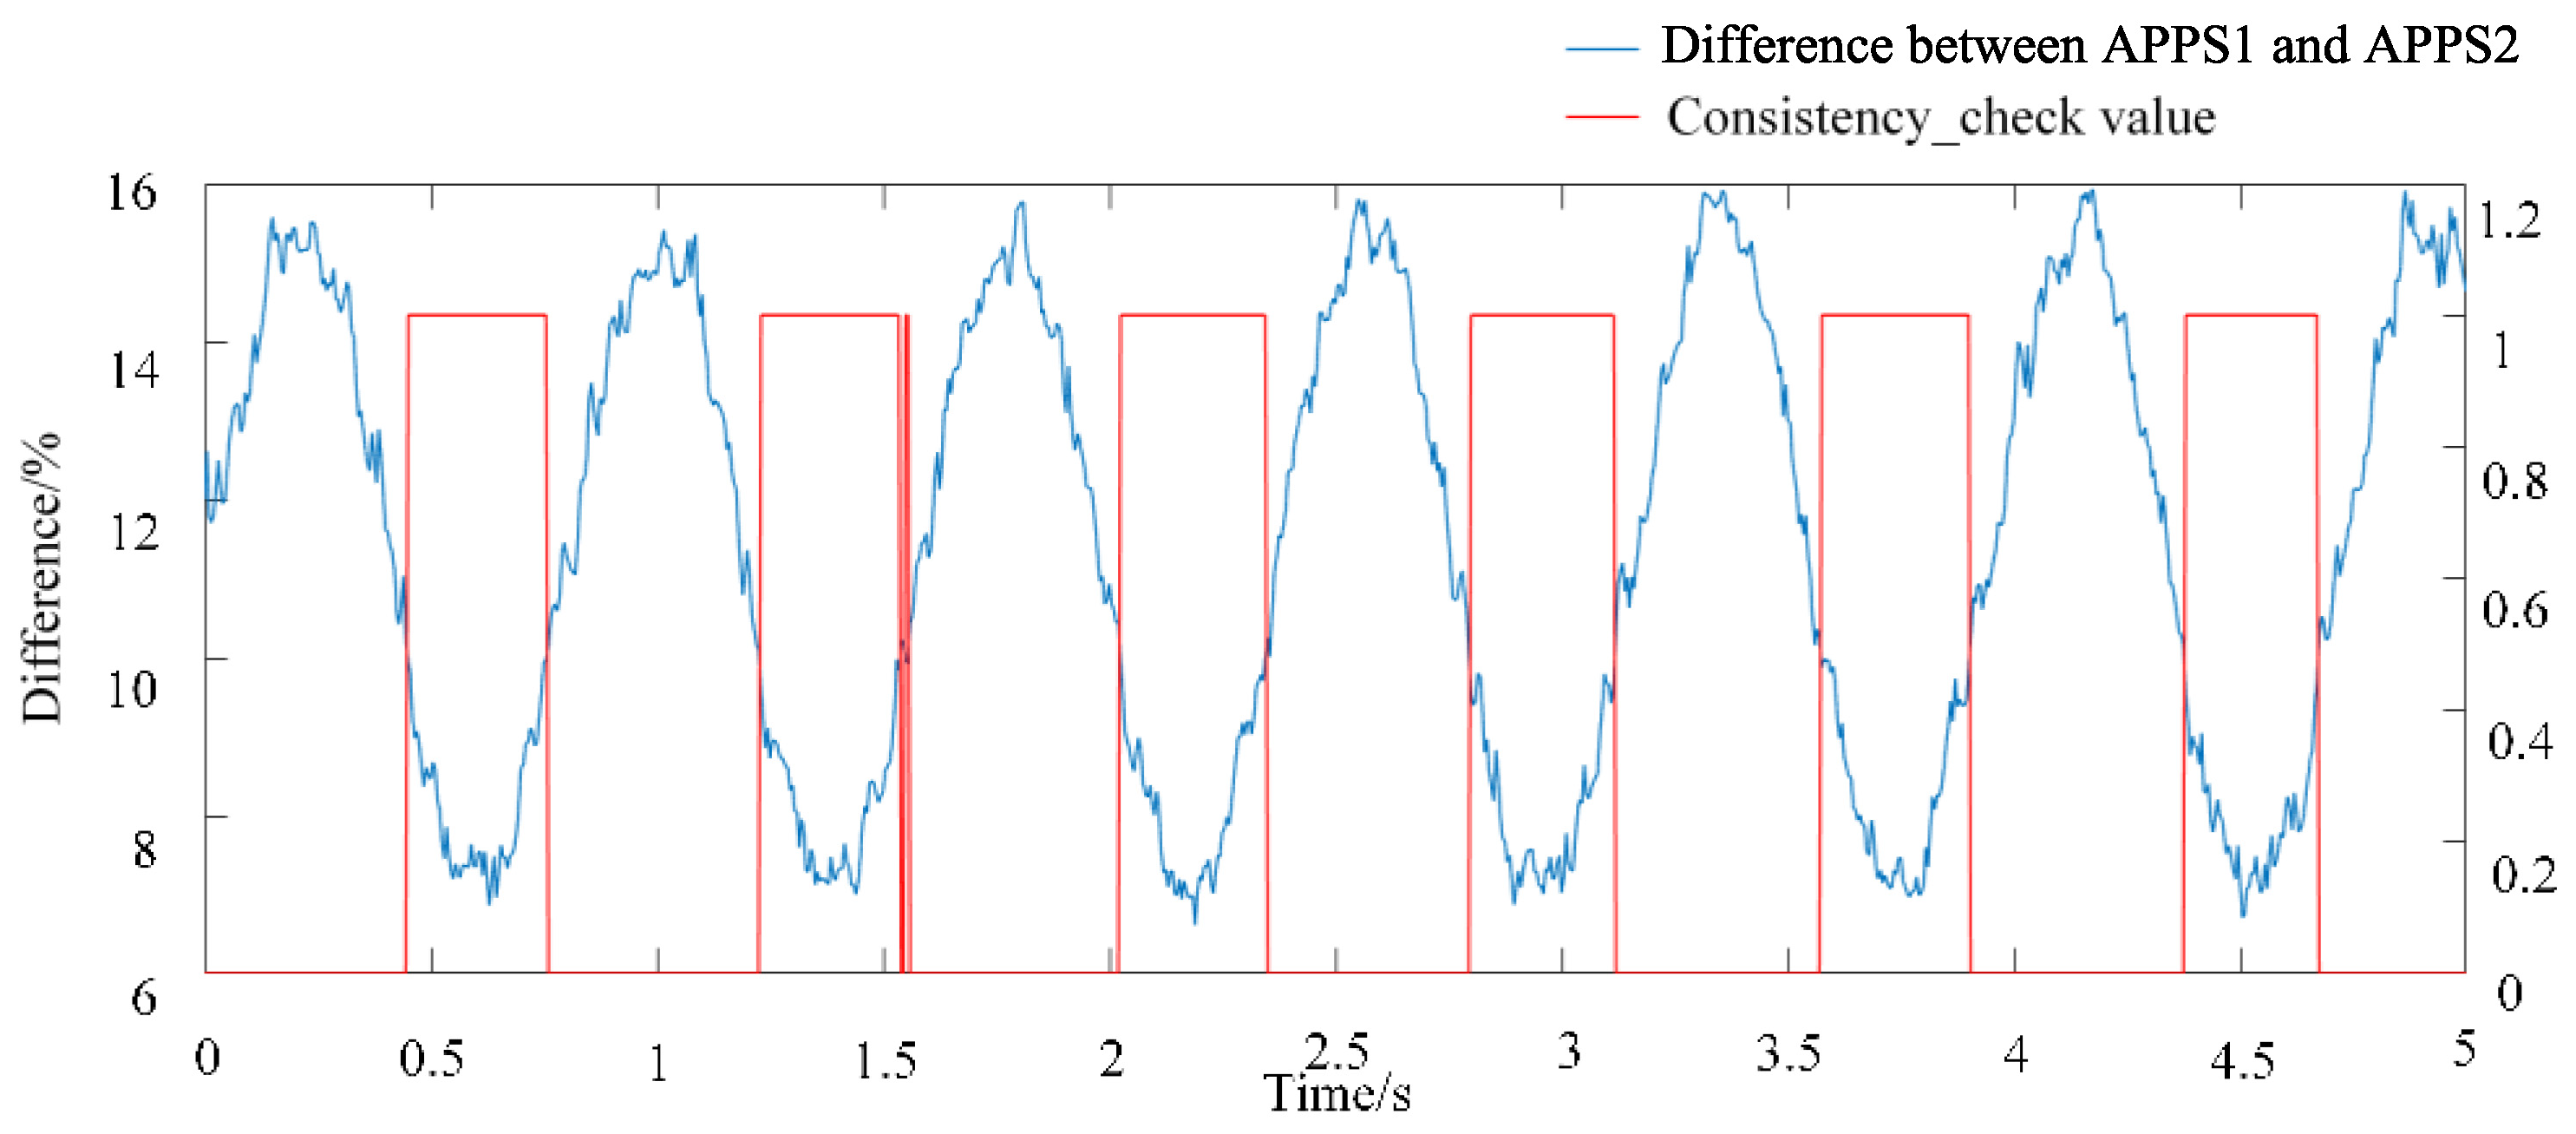
  • If the difference in accelerator pedal travel between two sensors is more than 10%, the VCU must promptly cut off power to the motor(s) entirely;
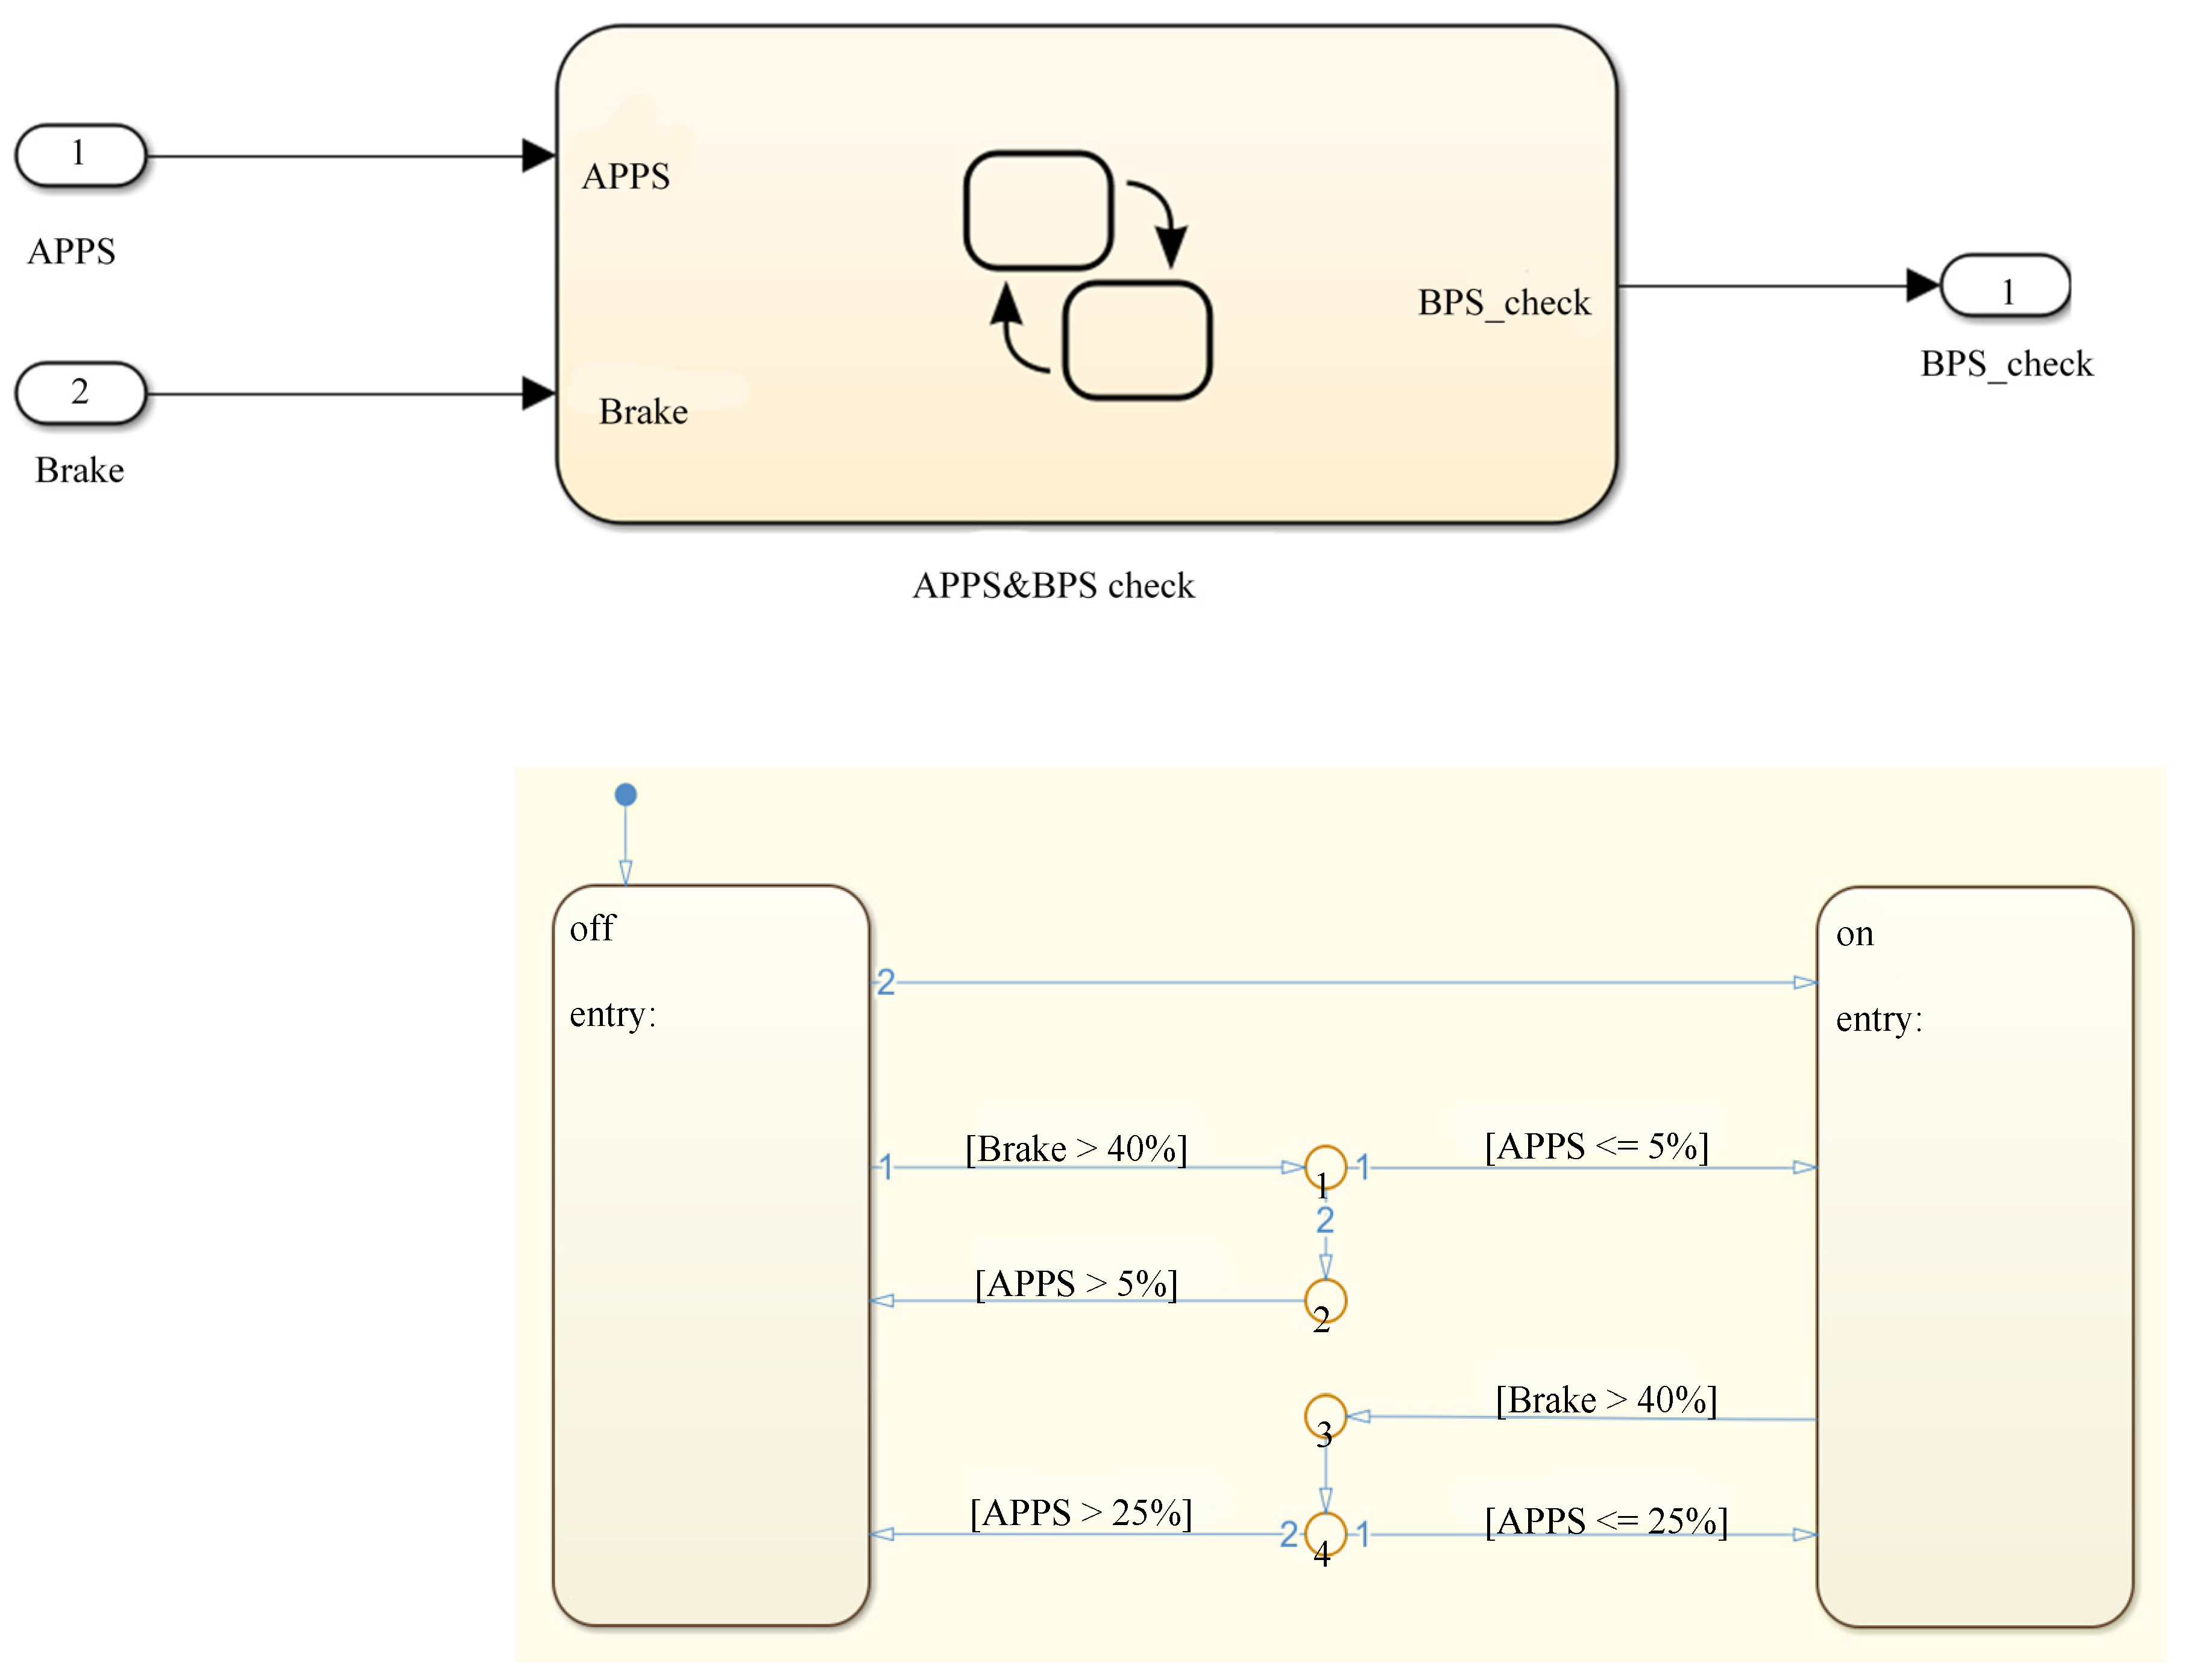
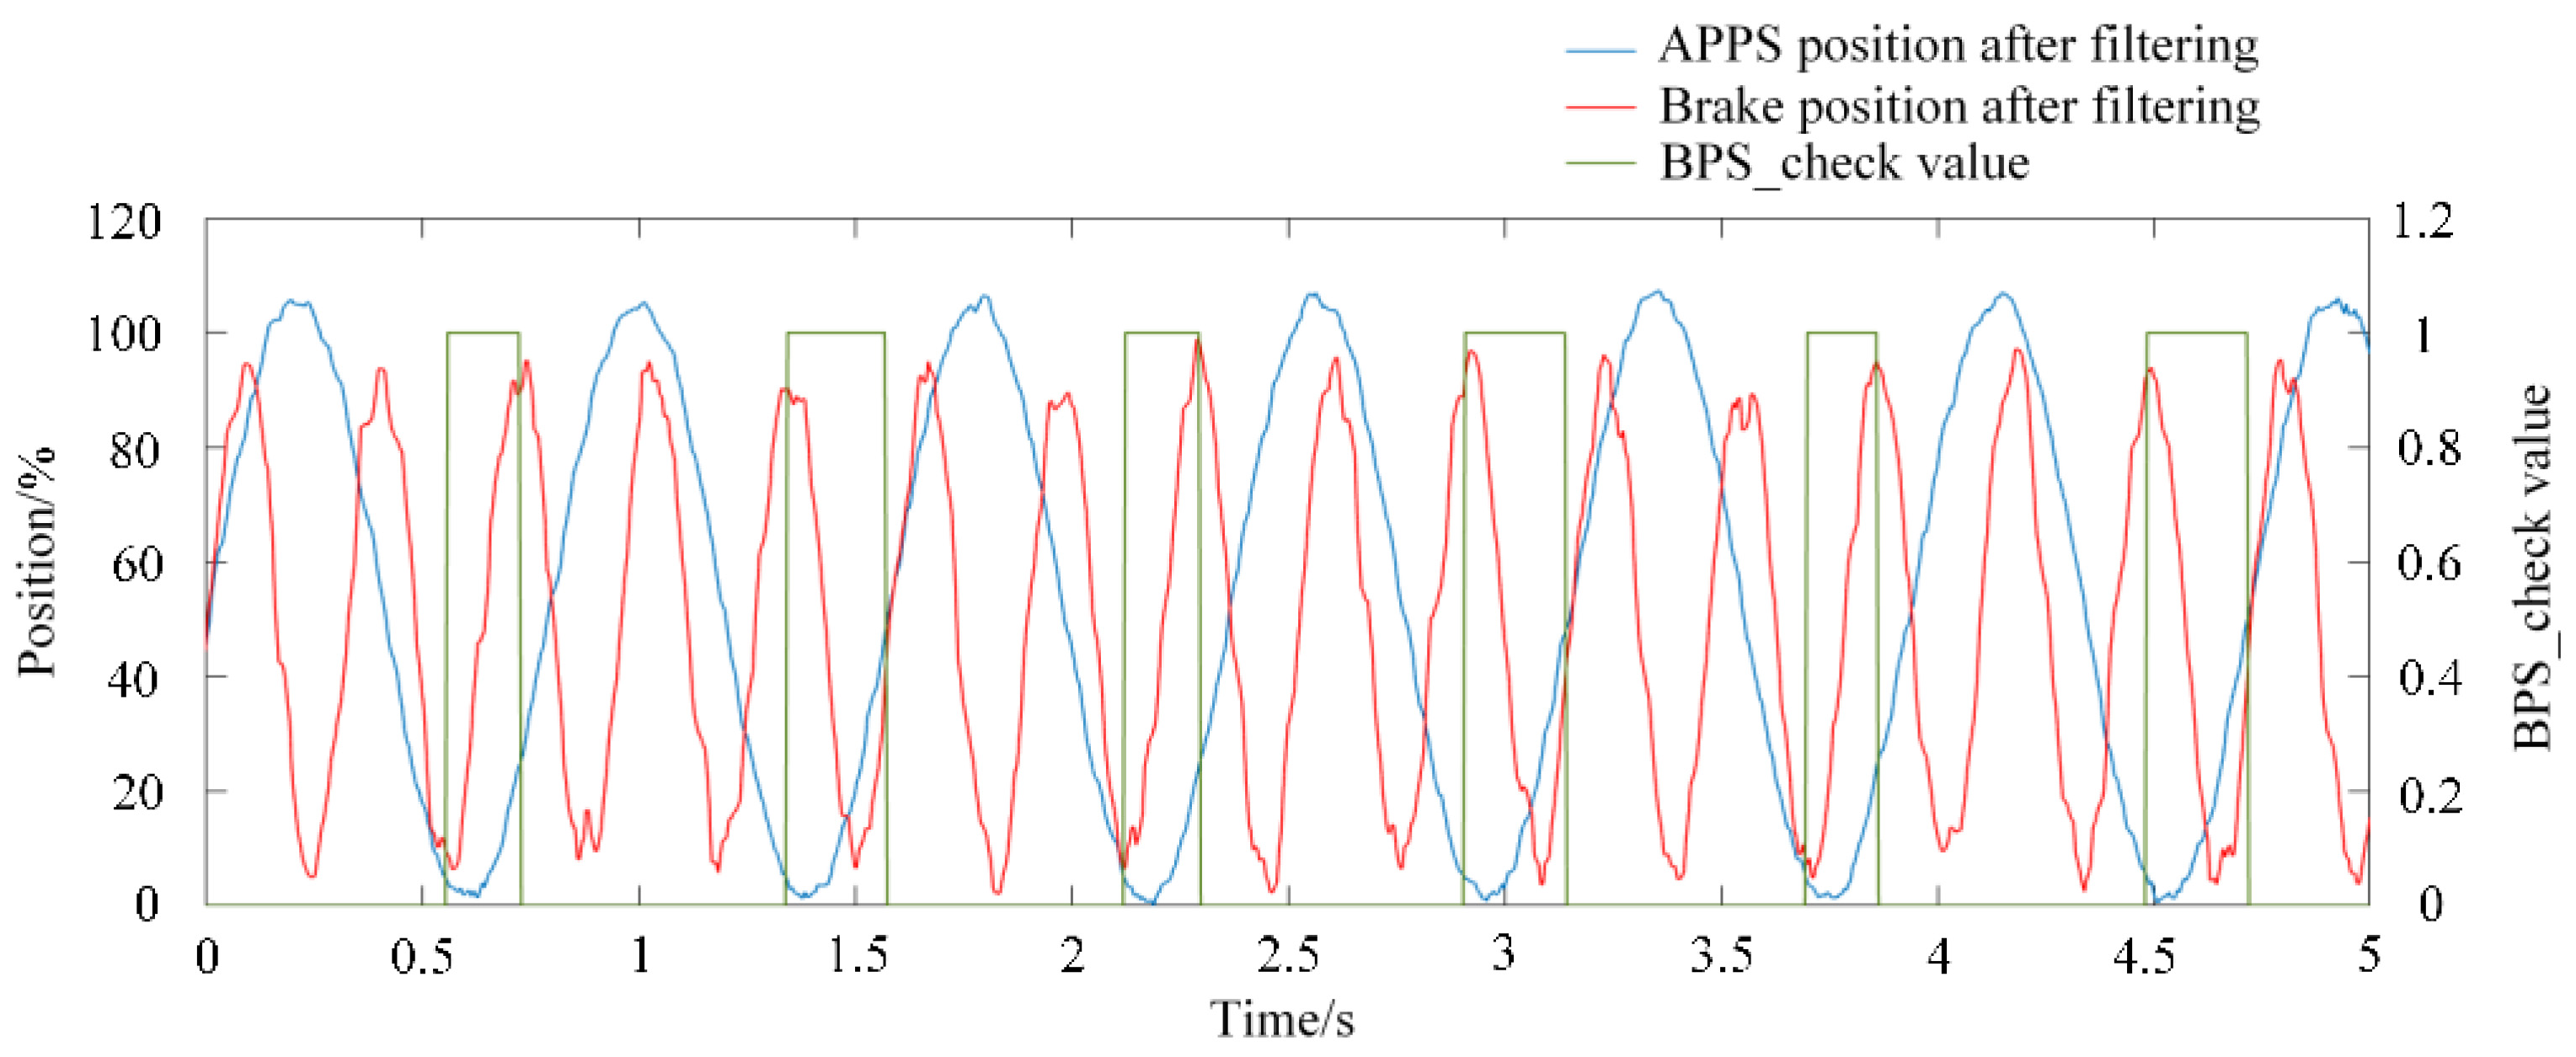
  • If the accelerator pedal travel is more than 25%, and at the same time the brake pedal is hardly pressed, the power to the motor(s) must be cut off immediately and completely. The power to the motor(s) must remain shut down until the accelerator pedal travel is less than 5%, whether the brakes are still actuated or not.

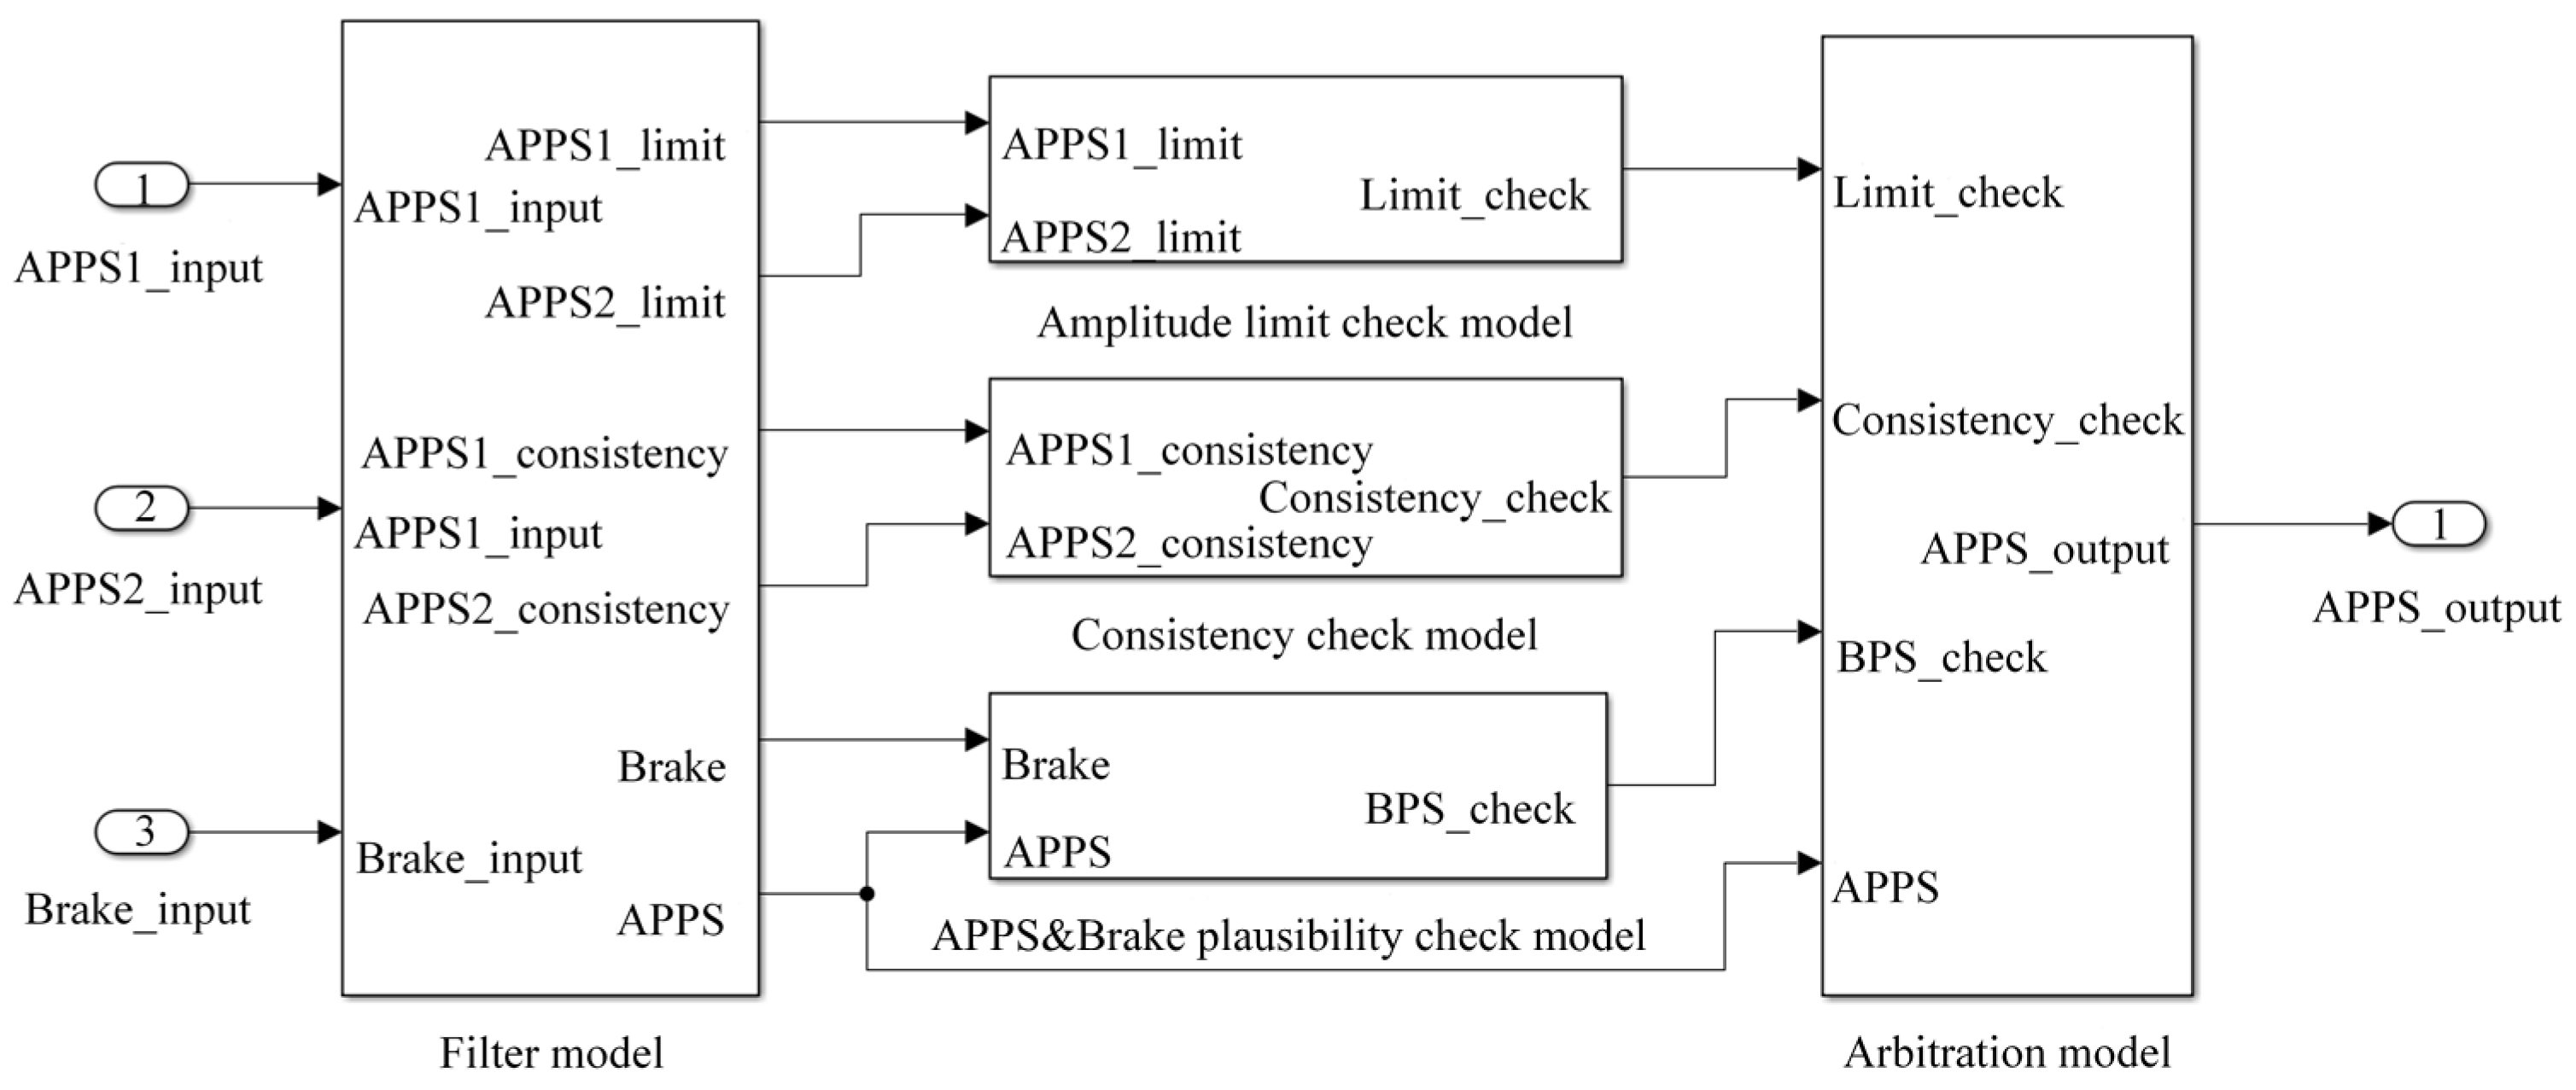
3. Pedal Reliability Model Build
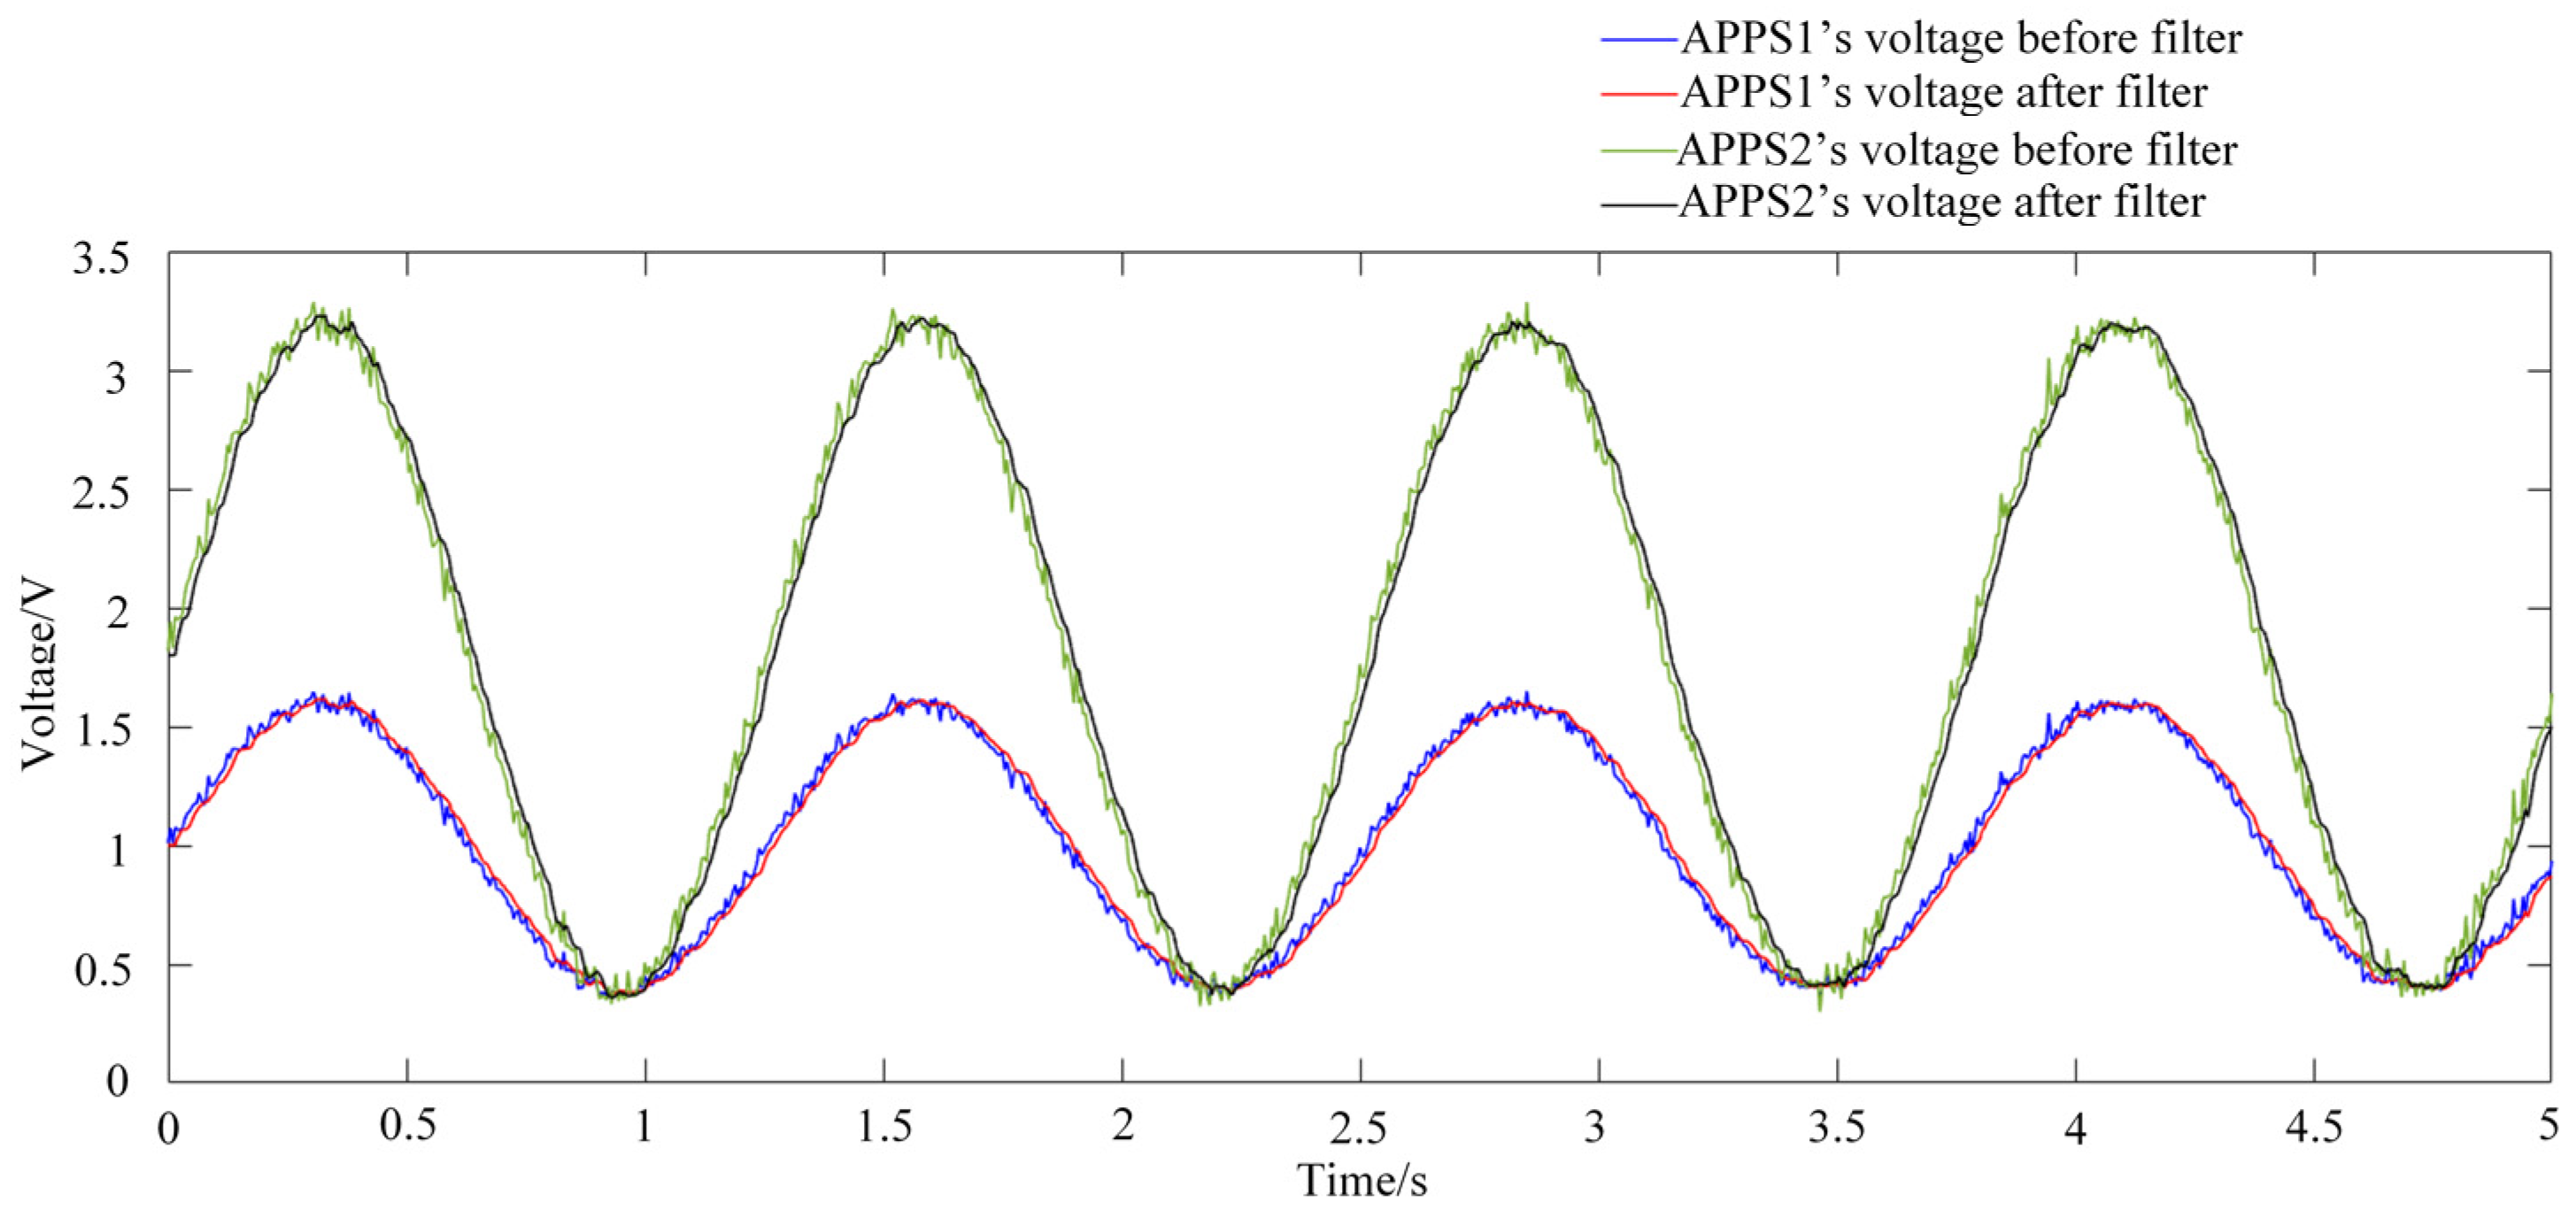
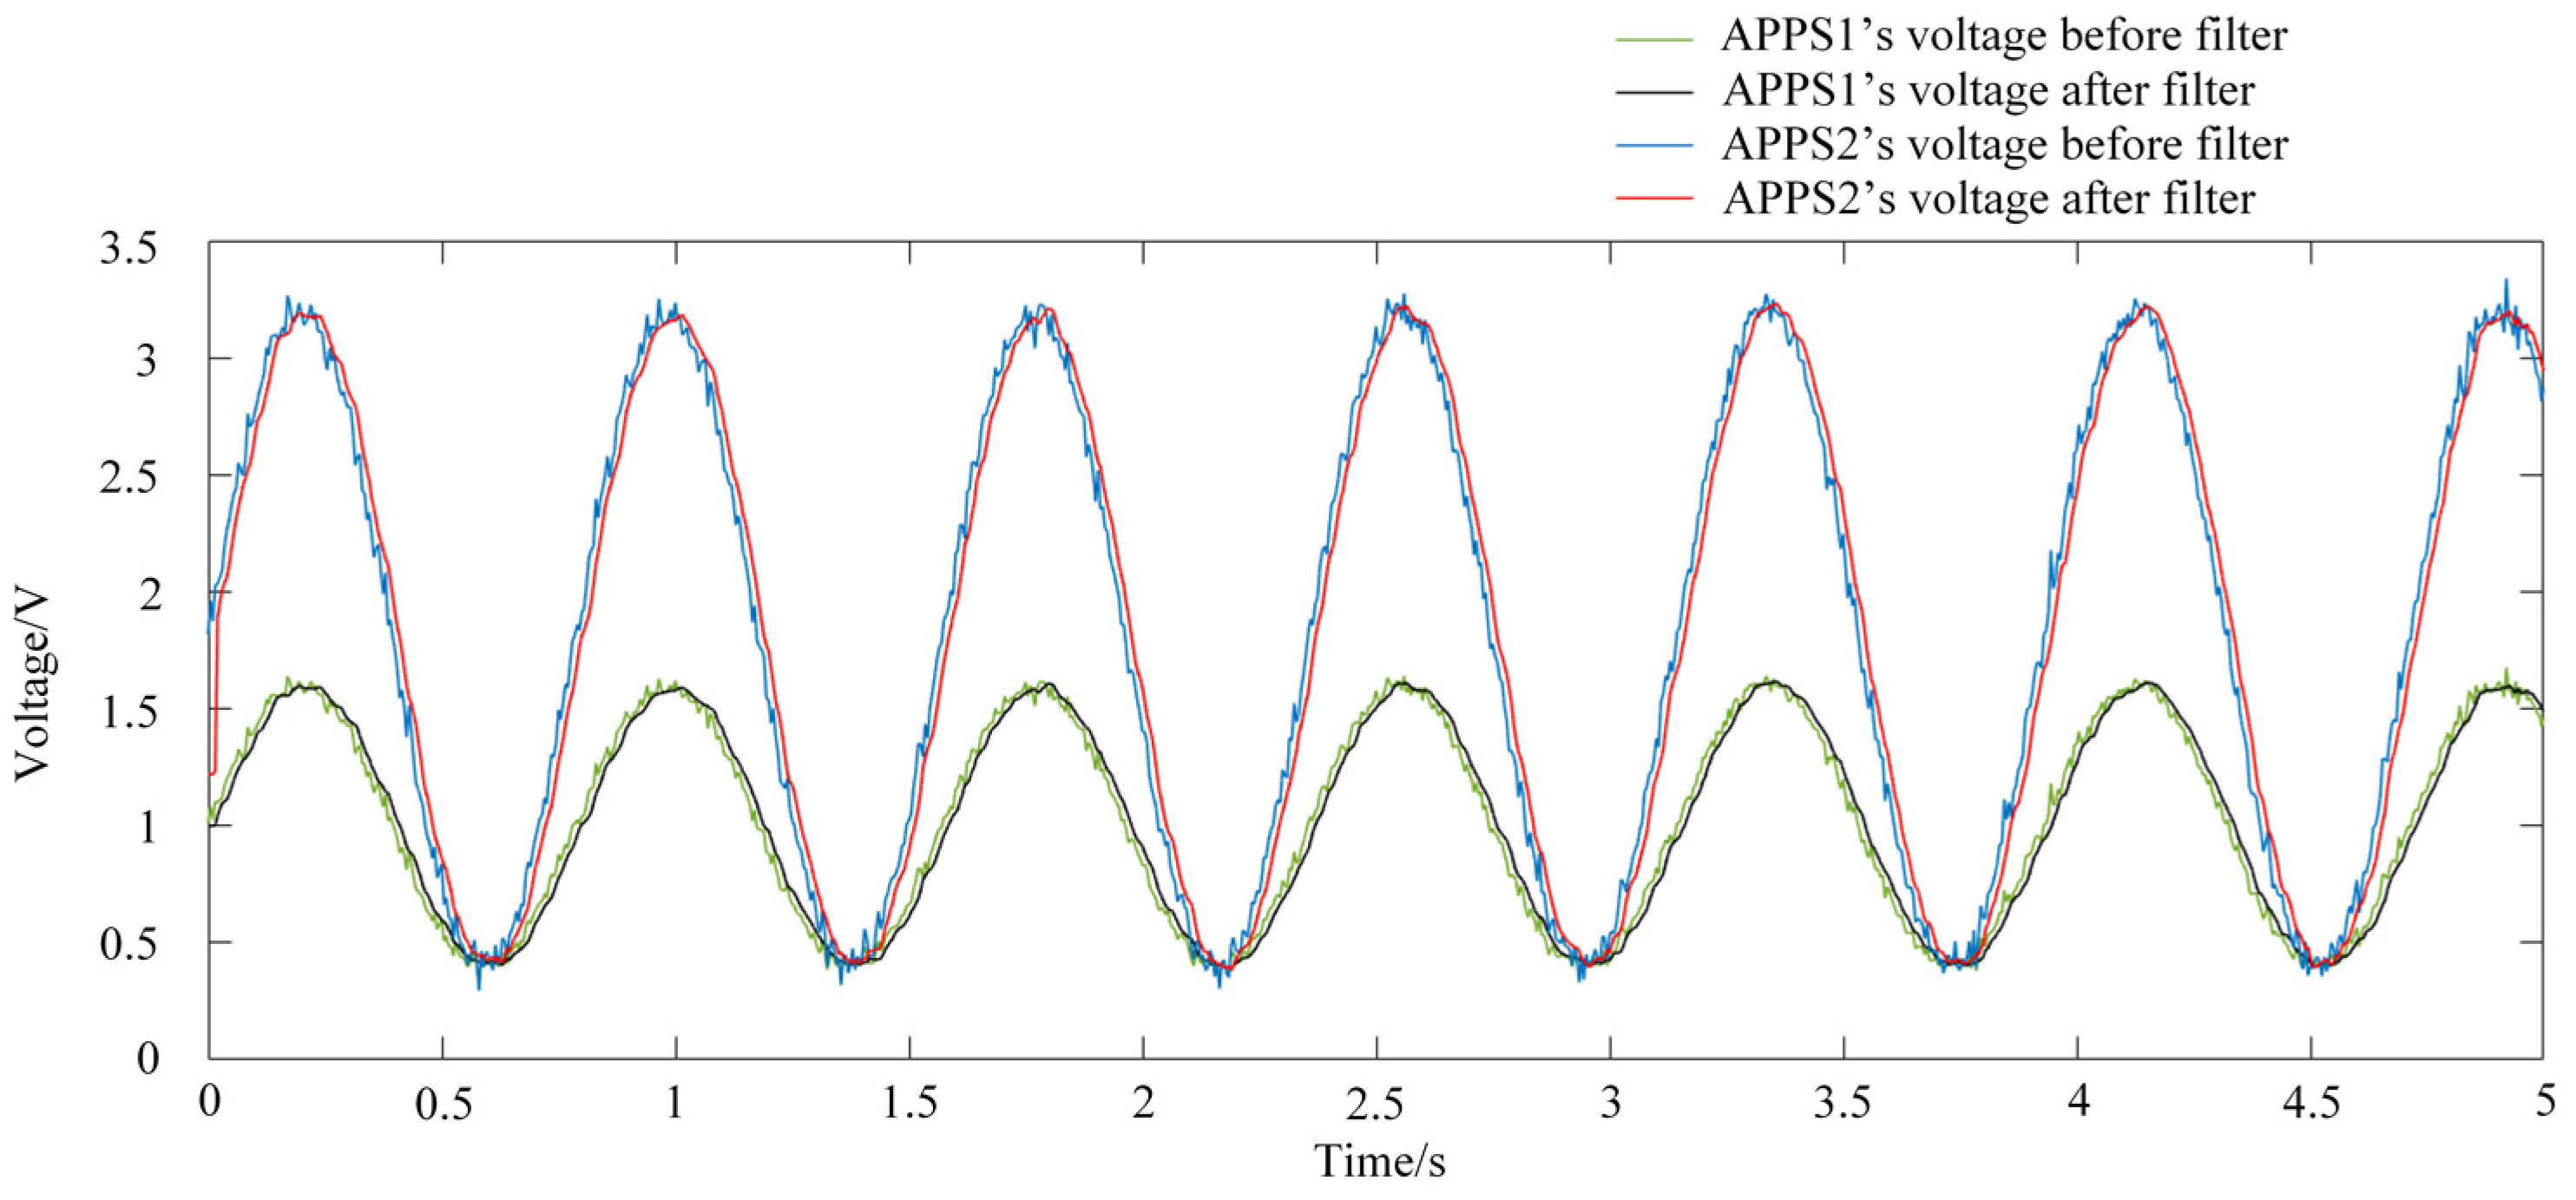
This research surrounding the accelerator and brake pedal of the Xiamen University of Technology electric racing car as research object, combining rules of the competition, builds a reliable control model in MATLAB/Simulink. The control model consists of four parts: filter, amplitude limit check, consistency check and APPS/Brake pedal plausibility check.

3.1. Filter

During the driving process, the acceleration and brake pedal will generate some vibration because of the intense driving, so the output voltage of the sensor will fluctuate. By properly designing the filter model, the effect of vibration on the output voltage can be effectively eliminated. The output voltage range of the APPS is related to the pedal’s mechanical structure. The relationship between the positions of the accelerator pedal is fed back by the sensor and its output voltage can be obtained by Equations (1)–(3):
T =   1 2 × ( T 1 + T 2 )
T 1 = A P P S 1 i n p u t A P P S 1 n o l o a d A P P S 1 f u l l l o a d A P P S 1 n o l o a d
T 2 = A P P S 2 i n p u t A P P S 2 n o l o a d A P P S 2 f u l l l o a d A P P S 2 n o l o a d
where T is the position of the accelerator pedal. T1 is the position fed back by the No. 1 accelerator pedal position sensor (APPS1). T2 is the position fed back by the No. 2 accelerator pedal position sensor (APPS2). A P P S 1 i n p u t is the output voltage of APPS1. A P P S 2 i n p u t is the output voltage of APPS2. A P P S 1 n o l o a d is the output voltage of APPS1 at no load. A P P S 2 n o l o a d is the output voltage of APPS2 at no load. A P P S 1 f u l l l o a d is the output voltage of APPS1 at full load. A P P S 2 f u l l l o a d is the output voltage of APPS2 at full load.
The voltage output range of the accelerator pedal sensor is 0–5 V. When the sensor is installed on electric racing car, it is limited by the pedal structure. The output voltage of APPS1 at the no-load position was 0.415 V, and the output voltage at the full-load position was 1.392 V. The output voltage of APPS2 at the no-load position was 0.561 V, and the output voltage at the full-load position was 3.163 V. In order to ensure that all signals can be detected after filtering, the upper and lower limits were appropriately expanded so that voltage ranges of APPS1 and APPS2 were 0.4–1.4 V and 0.5–3.2 V, respectively. The filtering model is shown in Figure 2. The Tapped Delay module was used to delay the input signal by 5 sampling times, then the maximum and minimum values were removed and the average value was calculated. Since the two sensors’ output voltages were not in an integer ratio relationship, in order to facilitate detections later, the signal was converted into a percentage in advance by using the 1-D Lookup Table module. Then the model outputs two signals APPS1_consistency and APPS1_limit for consistency detection and limit detection, respectively. The APPS2 and brake pedal sensor (BPS)’s filter model is similar to APPS1.

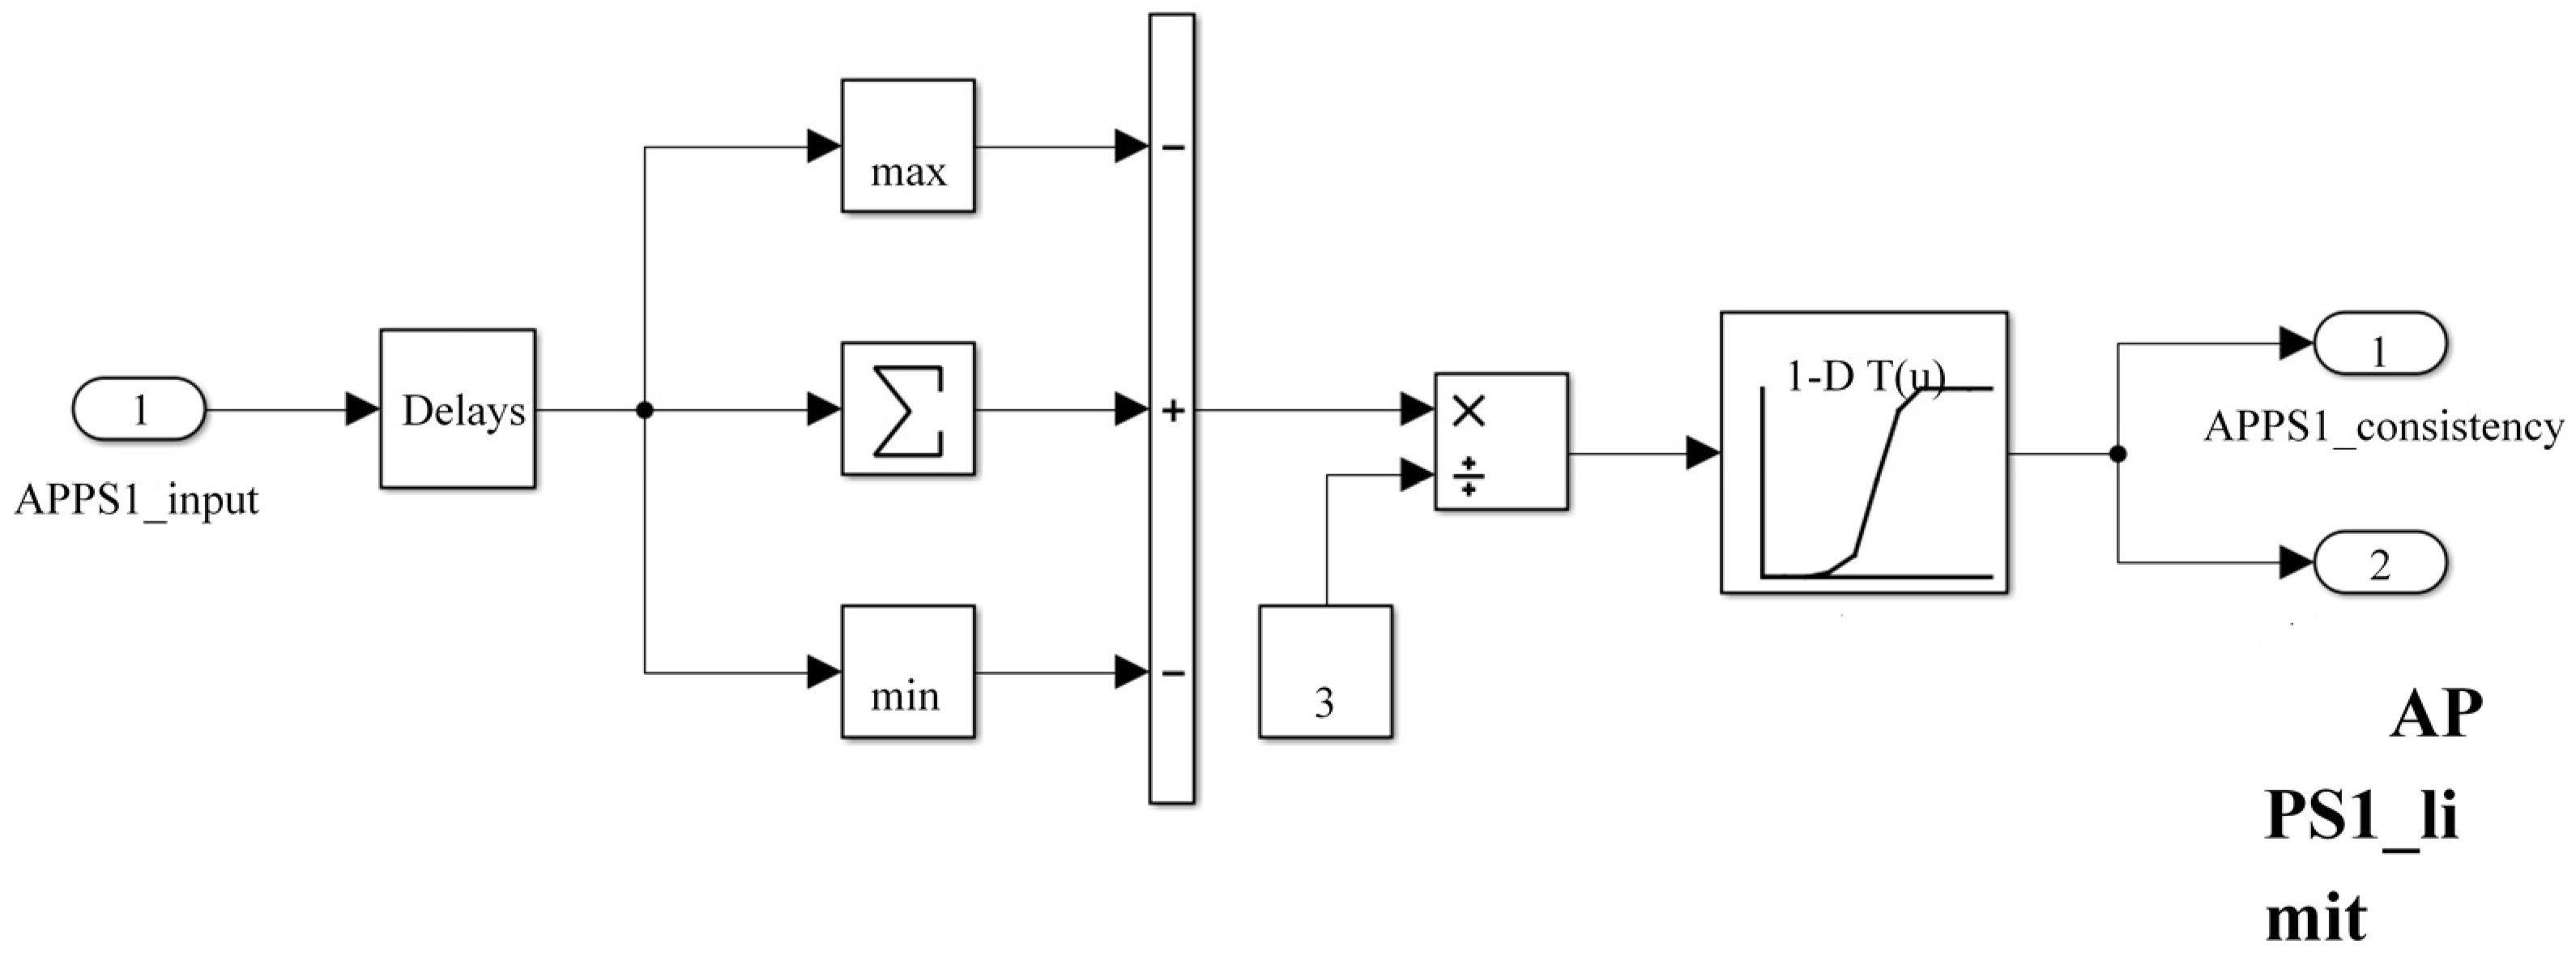
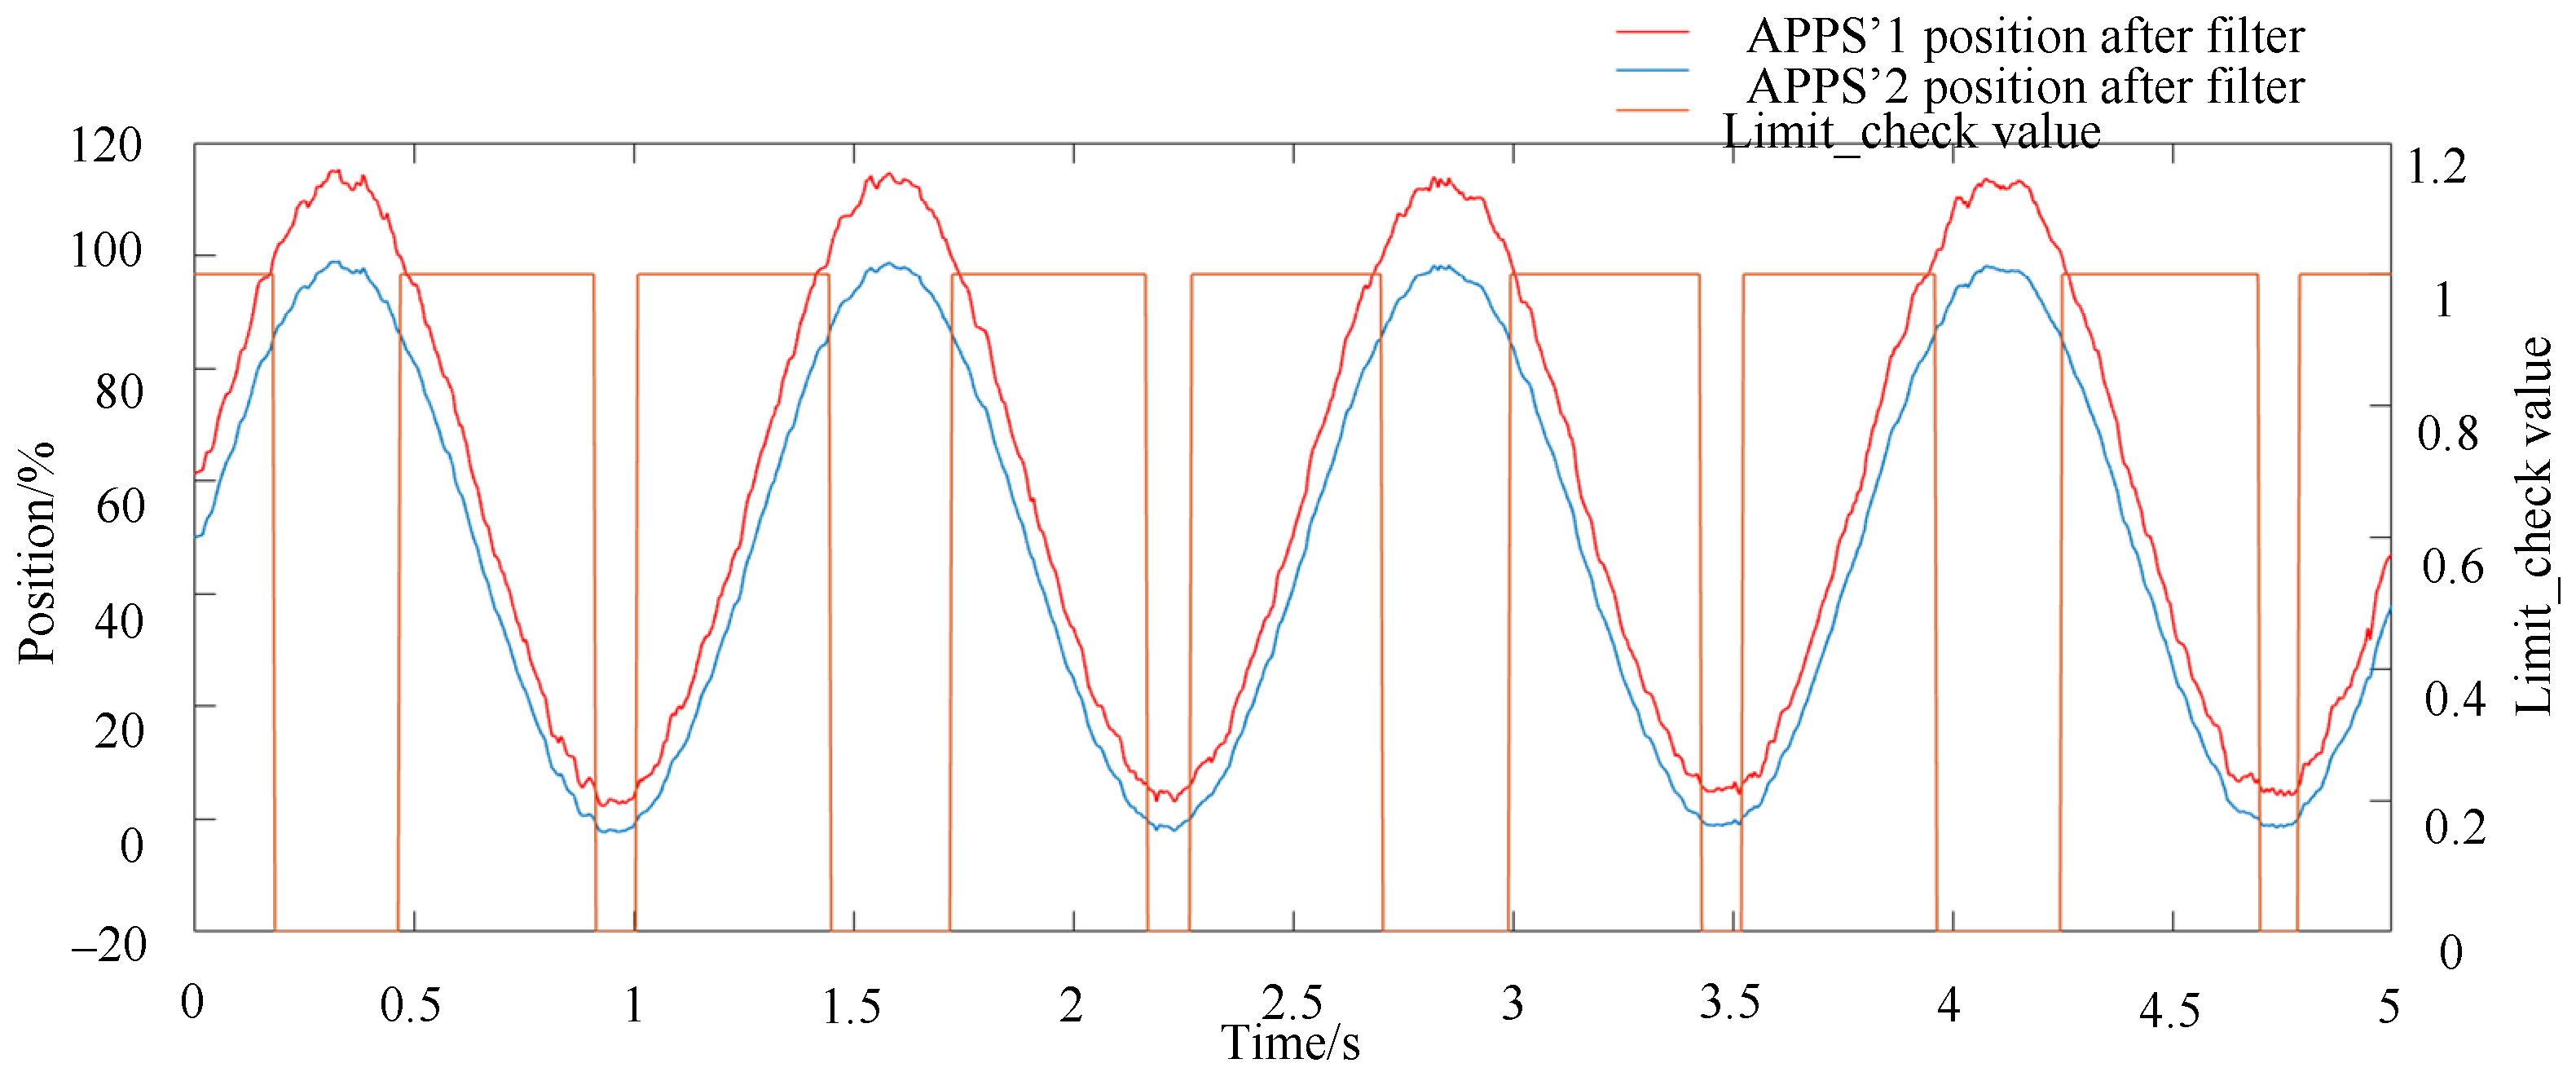
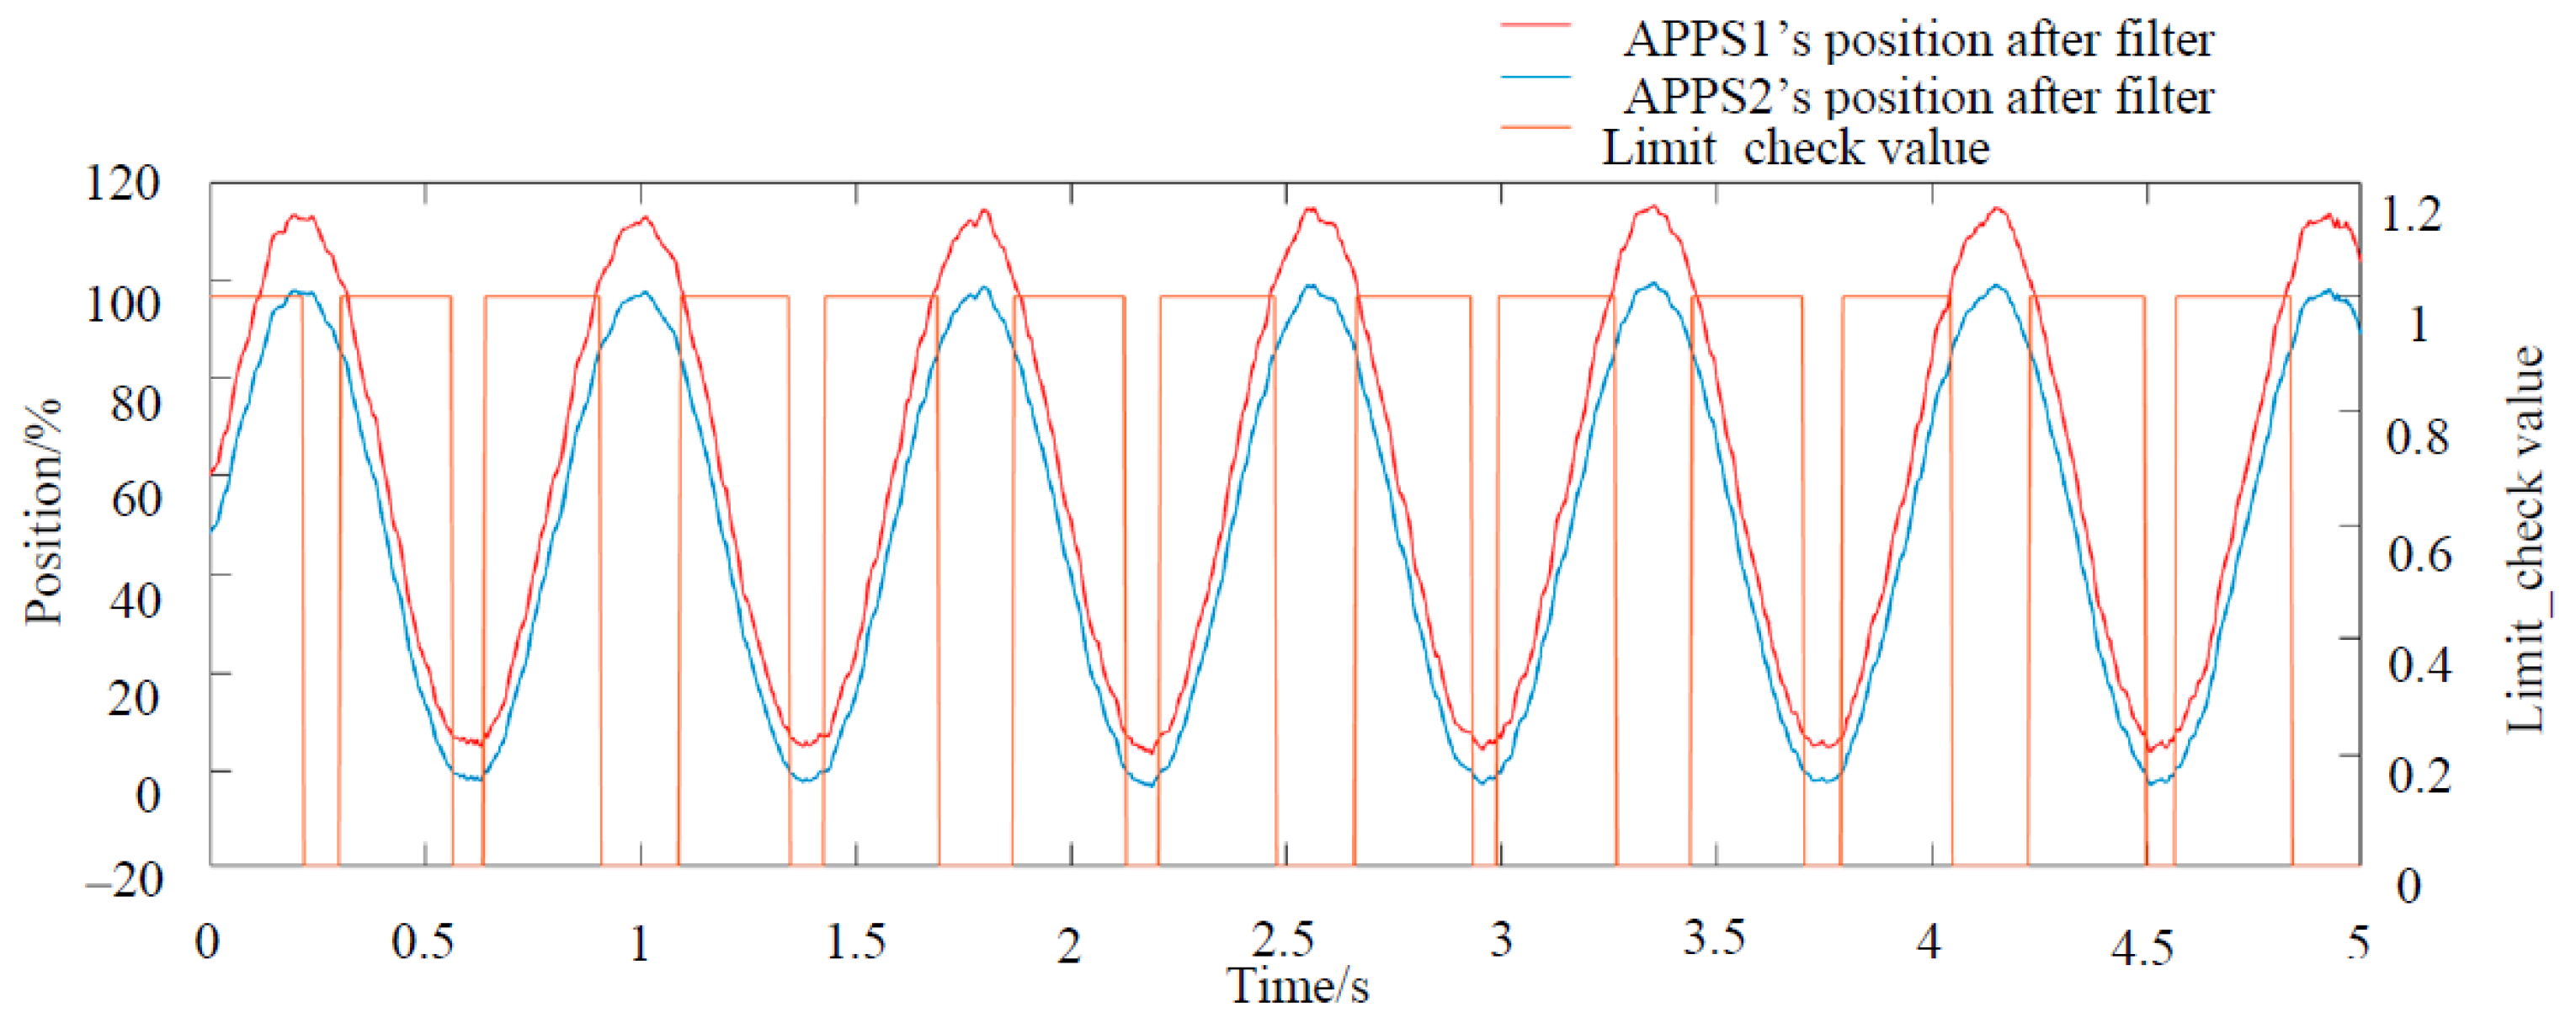
3.2. Amplitude Limit Check

After the filter, if the signal exceeds 100% and the duration exceeds 200 ms, it means that the mechanical limit structure of the accelerator pedal is damaged and exceeds the design position. If the signal is less than 0% and the duration exceeds 200 ms, it means that the signal wire of the accelerator pedal sensor is broken or the sensor is damaged, and the signal cannot be output. Therefore, when the opening of the accelerator pedal exceeds the normal range, in order to ensure the driver’s safety, the power output of the motor must be stopped. The amplitude limit check model is shown in Figure 3. If the values of APPS1_limit and APPS2_limit are between 0% and 100%, then the values of APPS1_check and APPS2_check are 1, respectively, otherwise the values are 0. If the values of APPS1_check and APPS2_check are 1 or the values are 0 but the duration is less than 200 ms, then the value of Limit_check is 1, otherwise the value is 0.

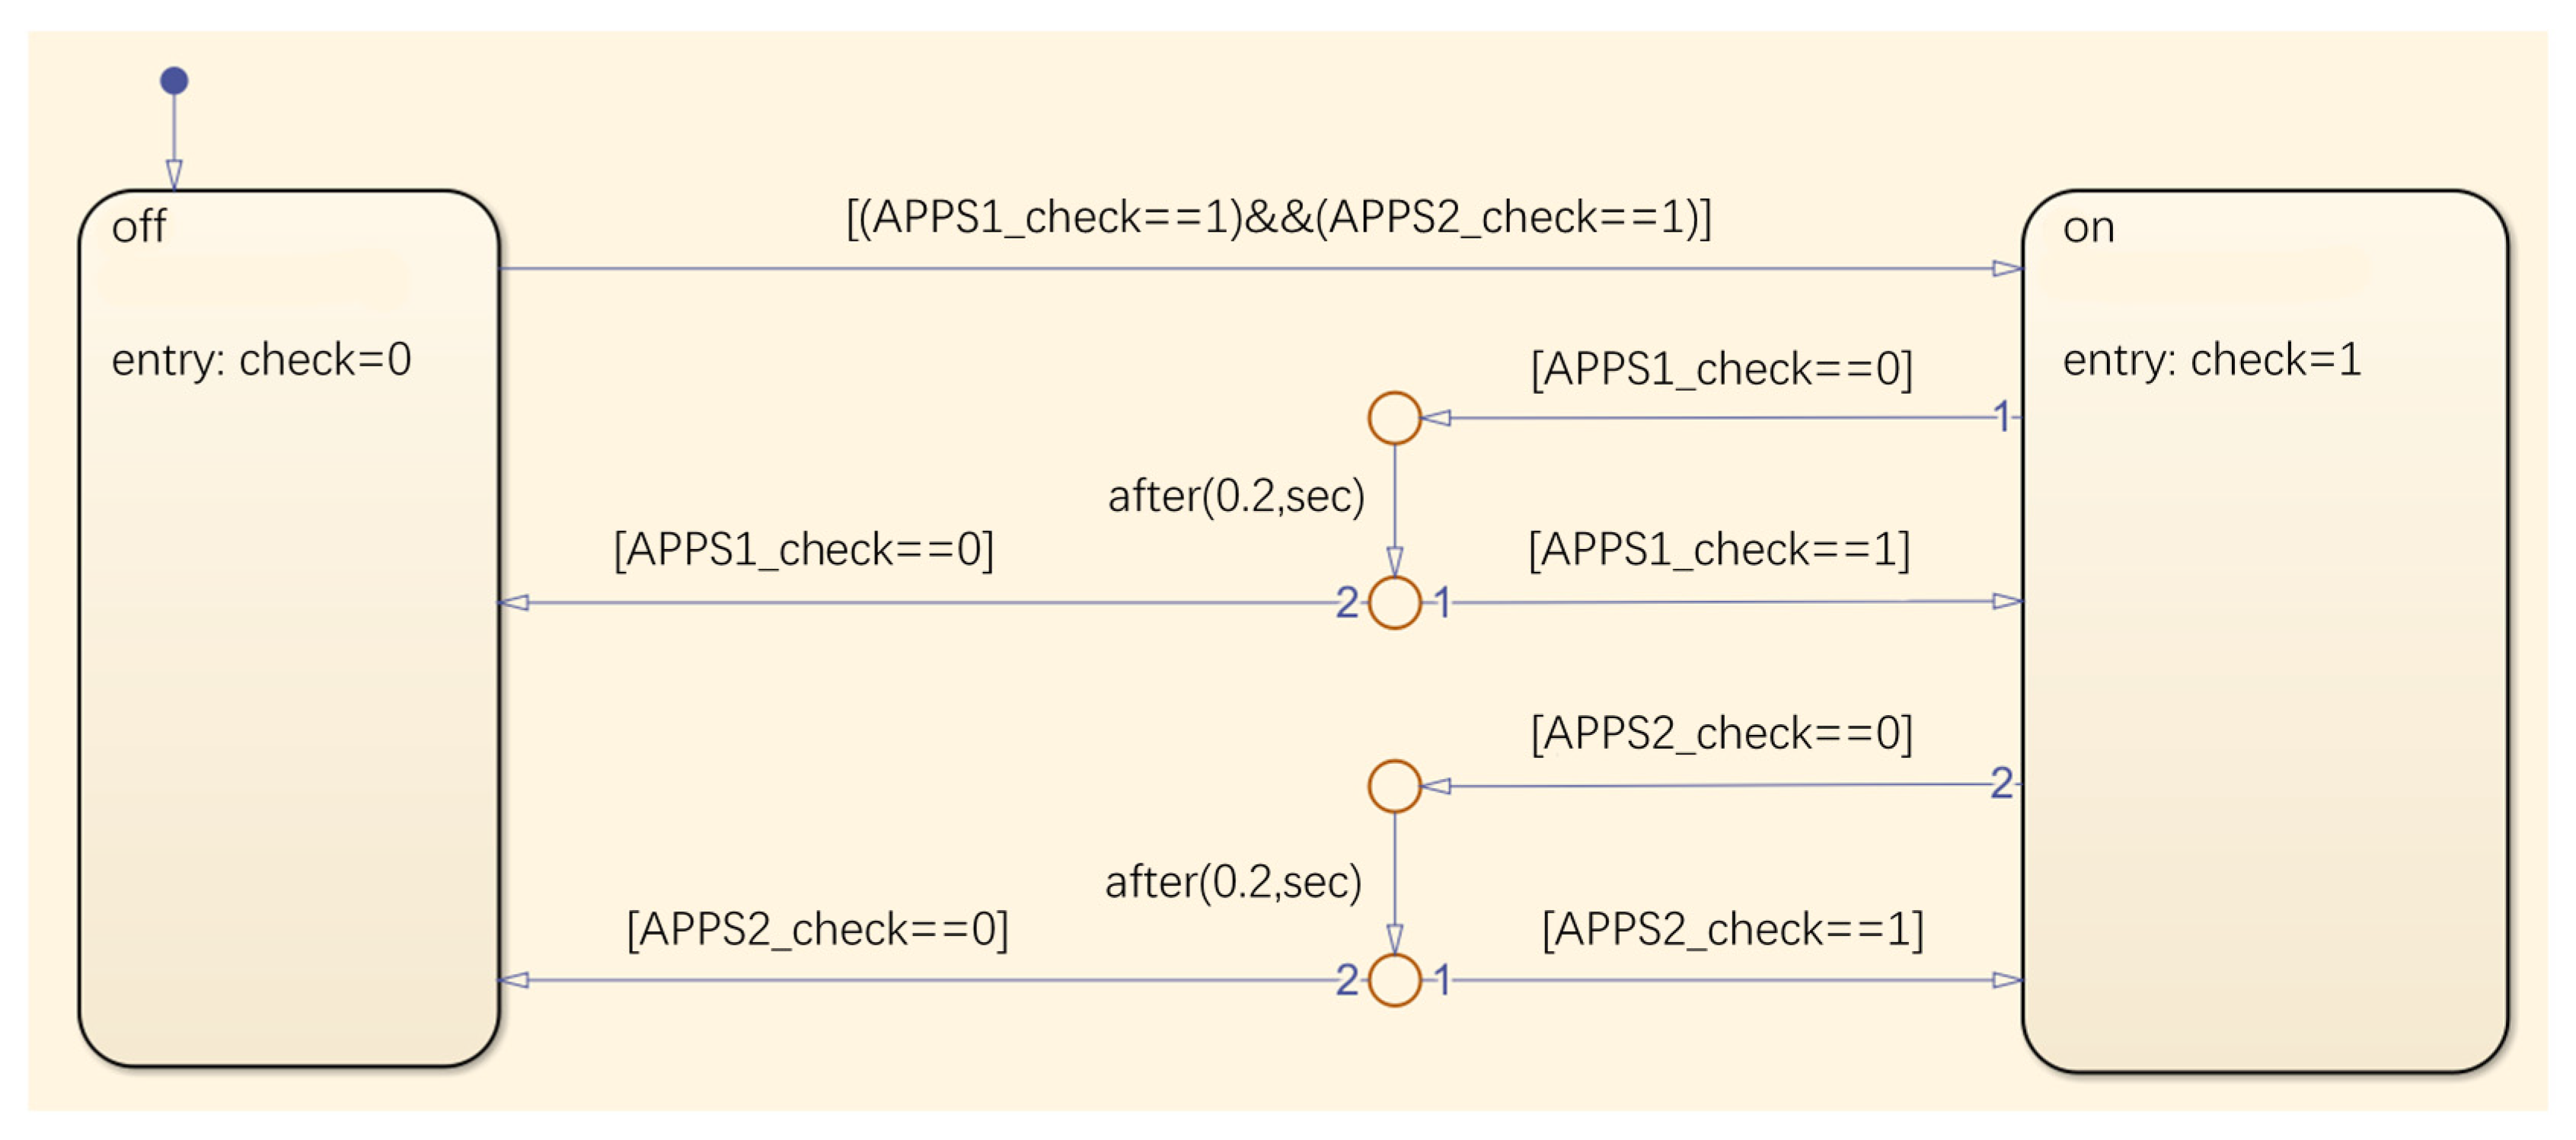
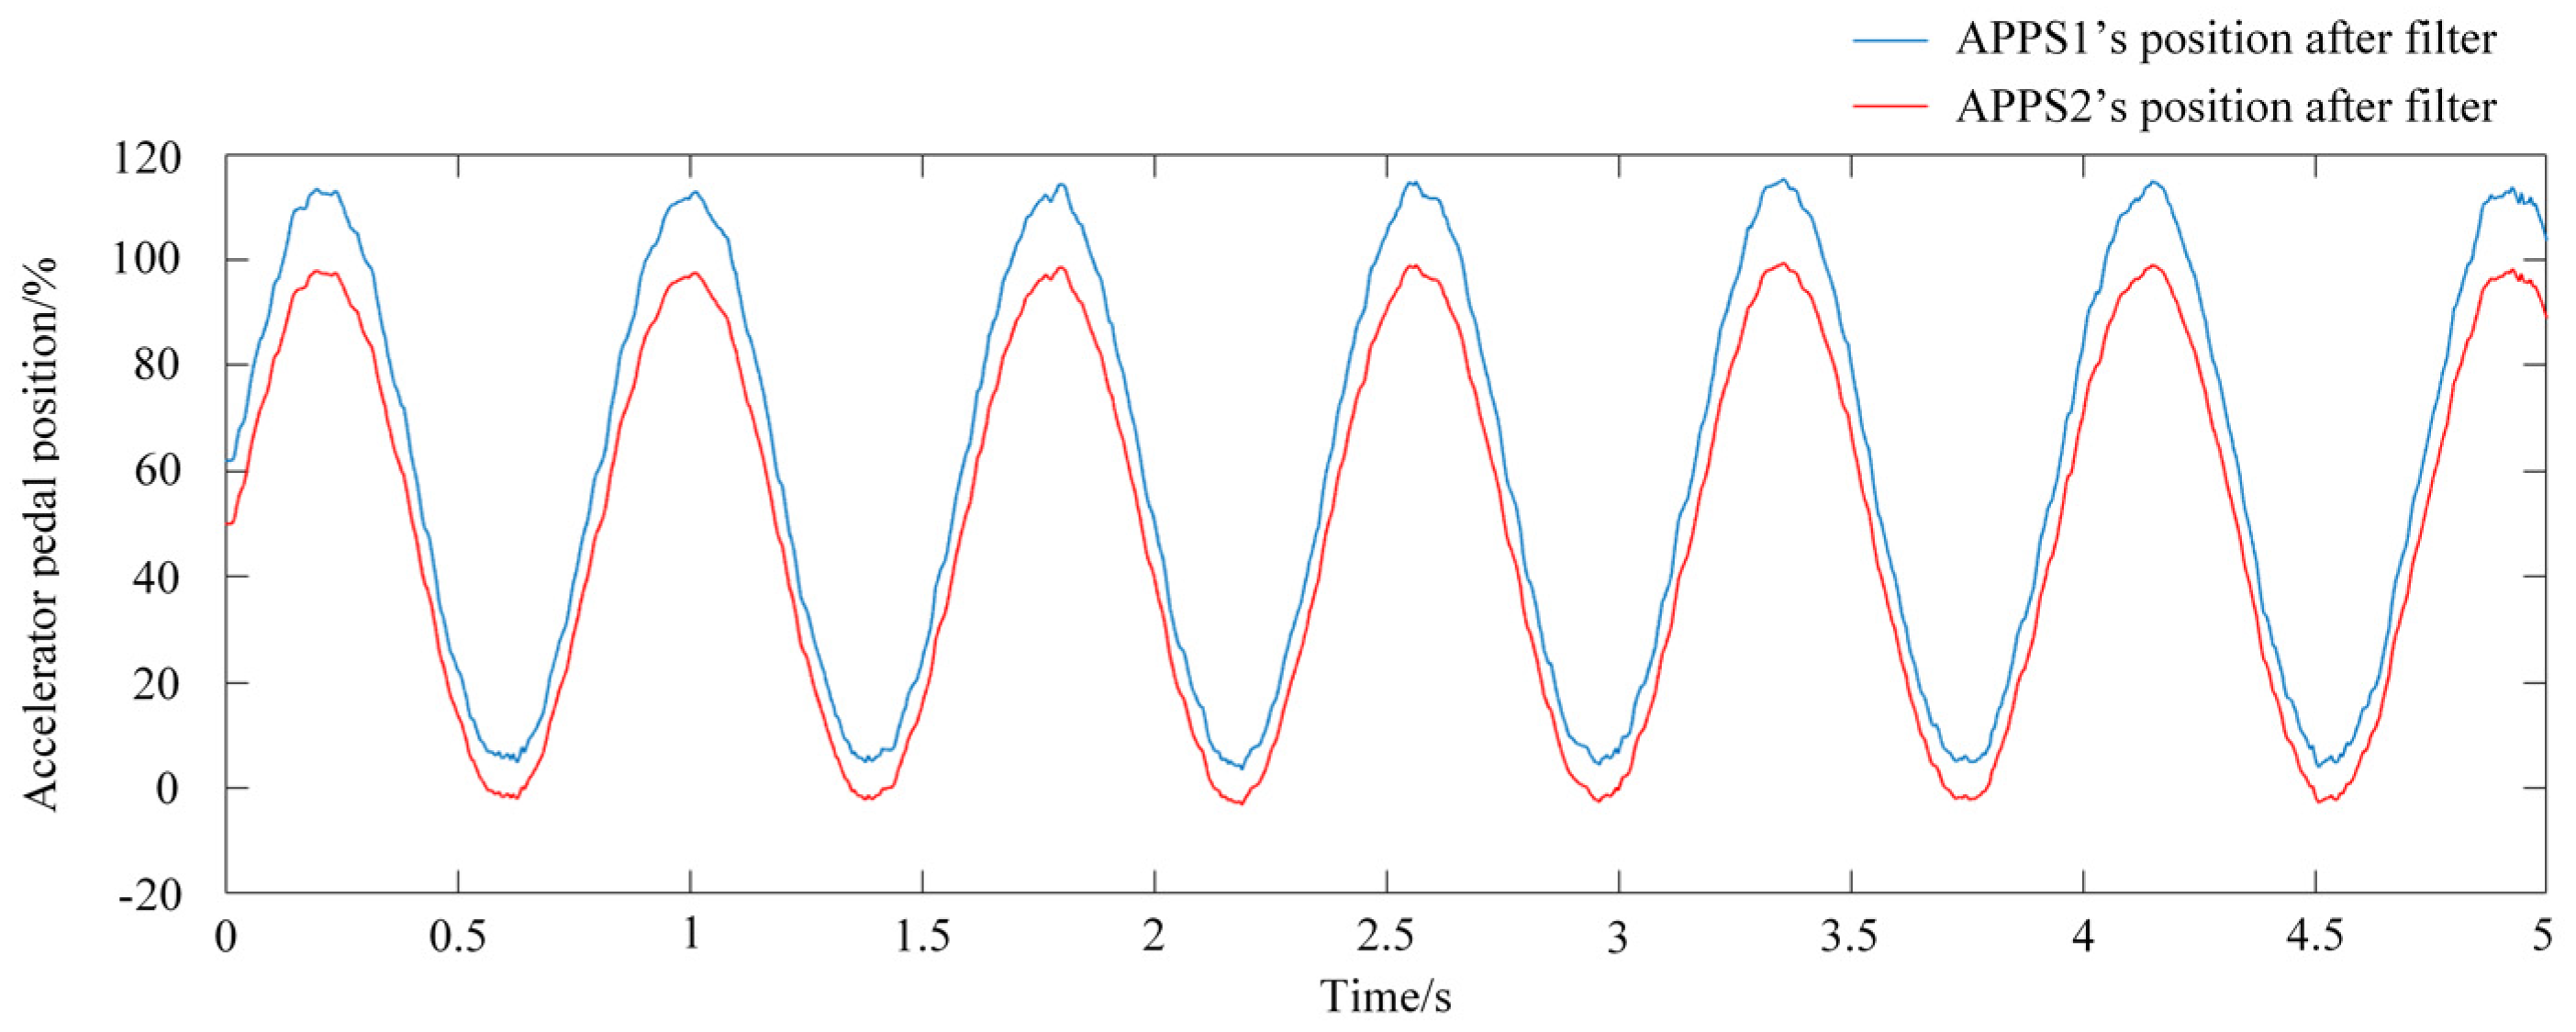
3.3. Consistency Check

According to the competition’s rules, if the difference between the travel of the accelerator pedal fed back by the two sensors exceeds 10%, the power output from the motor controller to the motor must be shut down immediately. The consistency check model is shown in Figure 4. If the difference is greater than 10%, then the Consistency_check output’s signal is zero.

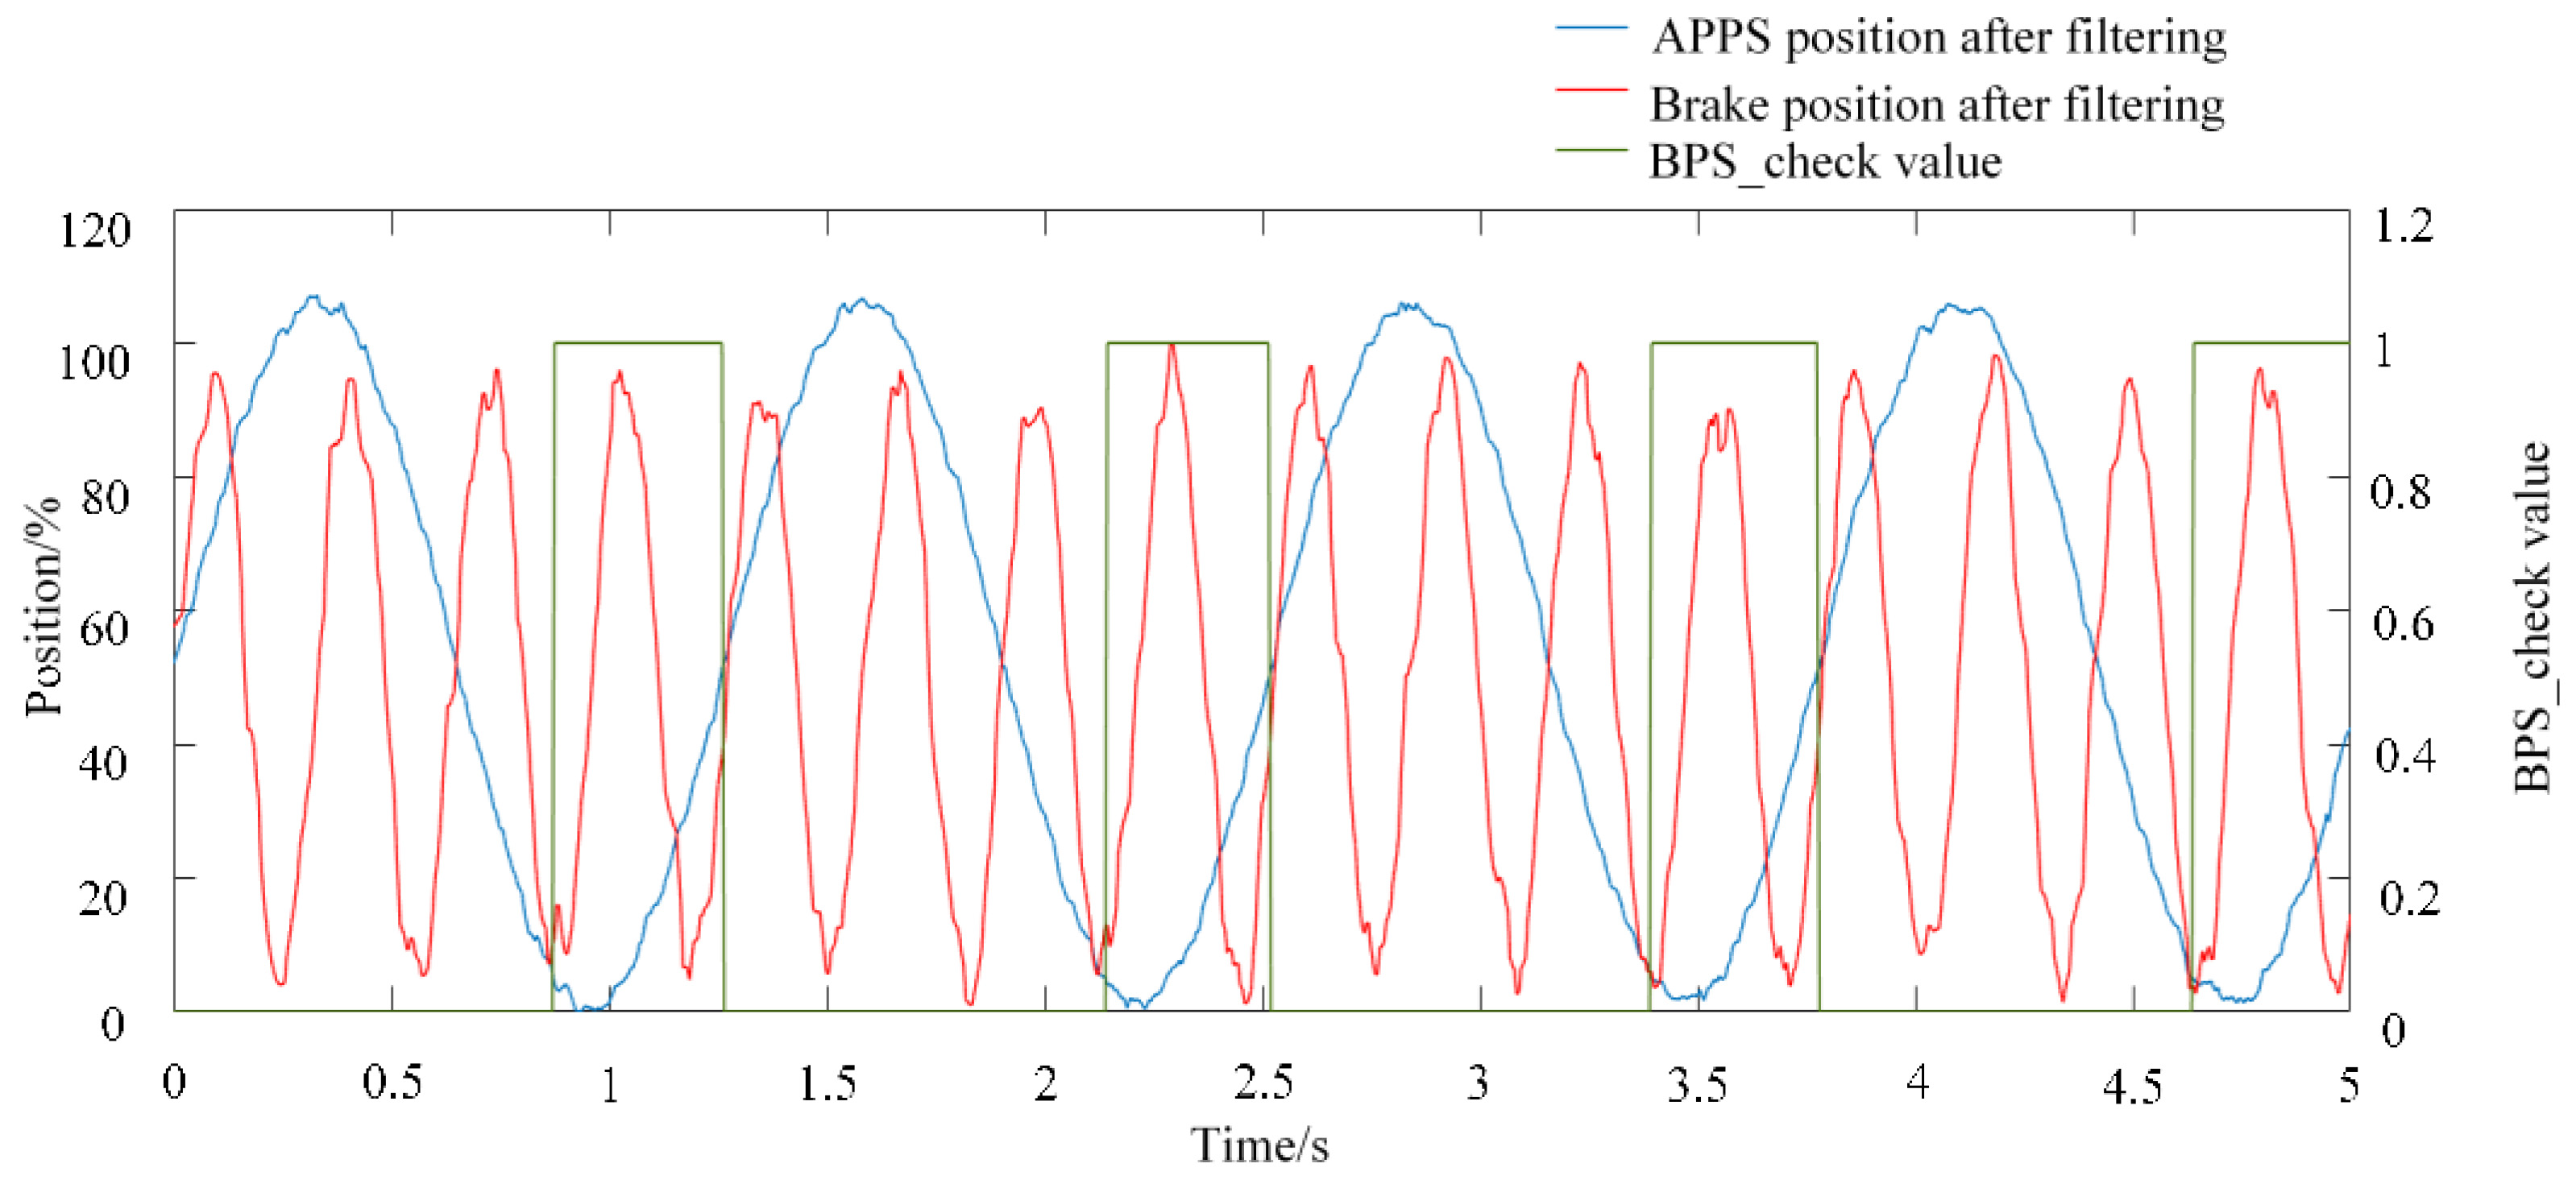
3.4. APPS/Brake Pedal Plausibility Check

If the racing car lost control in some situation, the driver might simultaneously step on the accelerator and brake pedals by instinct. At this time, the brake system cannot slow the car down immediately. So according to the rules, if the accelerator pedal travel is more than 25%, and at the same time the brake pedal is hardly pressed, the power to the motor(s) must be cut off immediately and completely. The power to the motor(s) must remain shut down until the accelerator pedal travel is less than 5%, whether the brakes are still actuated or not. In the case of emergency braking, the pressure in the brake master cylinder will be very high. Due to the influence of accelerations, decelerations and vibrations during the driving process, the oil pressure in the master cylinder will fluctuate sharply. The higher trigger point can prevent the model from being activated by interference signals and causing power interruption. Therefore 40% of the brake pressure during emergency braking is taken as the trigger point. This can ensure that the power can be effectively cut off during emergency braking. Signal APPS1_limit and signal APPS2_limit are averaged to obtain signal APPS. Using the Stateflow module to check signal APPS and signal brake, the APPS/brake pedal plausibility check model is shown in Figure 5.
As shown in Figure 5, signal APPS and Brake are input into the APPS&BPS check model. The state is ”off” and the value of BPS_check is 0. If the value of signal Brake is less than 40%, the state is changed from ”off” to ”on” and the value of BPS_check is changed to 1. At this time, the electric racing car can output power. In the case of state is “on” and Brake is more than 40%, the state is changed from “on” to junction 3 then junction 4. At junction 4, if APPS is more than 25%, then the state is changed to “off”, otherwise the state is back to “on”. Since Brake is more than 40%, the state is changed from “off” to junction 1. At junction 1, if APPS is less than 5%, then the state is changed to “on”, otherwise the state is back to “off” through junction 2.
The above control algorithm model is encapsulated into various subsystems according to different functions, and the subsystems are connected according to the signal transmission sequence. The global control model is shown in Figure 6. The signals of the acceleration and brake pedals, APPS1_input, APPS2_input and Brake_input, first enter the filter model. Signal APPS1_limit and APPS2_limit are output from the filter model to the amplitude limit check model. Signal APPS1_consistency and APPS2_consistency are the consistency check model. APPS and Brake are respectively the accelerator and brake pedal opening position. Signal APPS and Brake are output to the APPS&Brake plausibility check model. After the detection of three models, signal Limit_check, Consistency_check and BPS_check are output to the arbitration model. Only when the three signal values are all 1, is APPS output, otherwise only 0 is output. Then the actual opening of the accelerator pedal will be converted into a torque demand value and sent to the motor controller by the CAN bus.

4. Simulation

4.1. Projects

In order to verify reliability of the entire control model, the model needs to be simulated with Matlab/Simulink. Simulation items include filter simulation, amplitude limit simulation, consistency simulation and APPS/brake pedal plausibility simulation.

4.2. Simulation Results

Simulink’s Band-Limited White Noise module and Sine Wave module are added to produce a signal to simulate the input signals of APPS1 and APPS2. APPS1’s normal voltage range is between 0.4 and 1.4 V. APPS2’s normal voltage range is between 0.5 and 3.2 V. To verify the effectiveness of the control model, using a sine wave signal that satisfies the equation f ( a ) = 0.6 s i n 5 a + 1 plus a white noise signal to simulate APPS1’s voltage signal. Therefore, at the upper pole of the signal, the voltage will exceed the normal range. A sine wave signal that satisfies the equation f ( b ) = 1.4 s i n 5 b + 1.8 plus a white noise signal is used to simulate APPS2’s voltage signal. Therefore, at the lower pole of the signal, the voltage will exceed the normal range. A sine wave signal that satisfies the equation f ( c ) = 0.2 s i n 20 x + 1.15 plus a white noise signal is used to simulate BPS’s voltage signal. The voltage signals of APPS1 and APPS2 before and after filtering are shown in Figure 7. Before filtering, the voltage signals of APPS1 and APPS2 have more burrs, indicating that the position of the accelerator pedal is unstable and has a great influence on power output. The signal before and after filtering is subtracted from the original signal, respectively, and the standard deviation is calculated. The standard deviation before filtering is 0.03187 V and after filtering is 0.01935 mV. Therefore, this filtering method can effectively reduce the influence of noise on the signal and the power output is smoother. After converting the voltage signal into the pedal position signal, the positions after filtering of APPS1 and APPS2 are shown in Figure 8. It can be seen from Figure 8 that the position of APPS1 at the upper pole exceeds the normal range and the difference with APPS2 is greater than 10%. Additionally, the position of APPS2 at the lower pole exceeds the normal range.
After filtering, some position signals are still less than 0% or greater than 100%. If 2 sensors’ position signals are both in the normal range or their signals exceed the normal range but duration is less than 200 ms, then signal Limit_check outputs 1, otherwise it outputs 0. APPS1_limit and APPS2_limit are input into the amplitude limit check model and the simulation result is shown in Figure 9. At the upper pole of APPS1 and the lower pole of APPS2, the Limit_check value is 0.
APPS1_consistency and APPS2_consistency are input into the consistency check model. If the difference between the two signals is less than 10%, then the model outputs signal 1, otherwise outputs signal 0. The consistency check model simulation results are shown in Figure 10. When the difference between APPS1 and APPS2 exceeds 10%, the model can detect the fault signal and outputs 0.
APPS1 and APPS2 signals after filter are averaged to obtain the APPS signal, which is checked with the brake pedal signal. According to the rules, if the accelerator pedal travel is more than 25%, and at the same time the brake pedal is hardly pressed, the power to the motor(s) must be cut off immediately and completely. APPS and BPS’s signals are input into the APPS/Brake pedal plausibility check model, the simulation results are shown in Figure 11. When APPS exceeds 25% and Brake exceeds 40%, the value of BPS_check is 0. Additionally, the value can remain 0 until APPS is less than 5%.
Output signals of the three detection models are input into the Arbitration model to obtain an accurate accelerator pedal position signal APPS_output. If amplitude limit check, consistency check model and APPS/Brake pedal plausibility check model’s results are all 1, then the APPS_output value is equal to APPS, otherwise the APPS_output value is equal to 0. The position of the accelerator pedal will not be transmitted to the MCU, and the motor will stop.

5. Experimental Verification

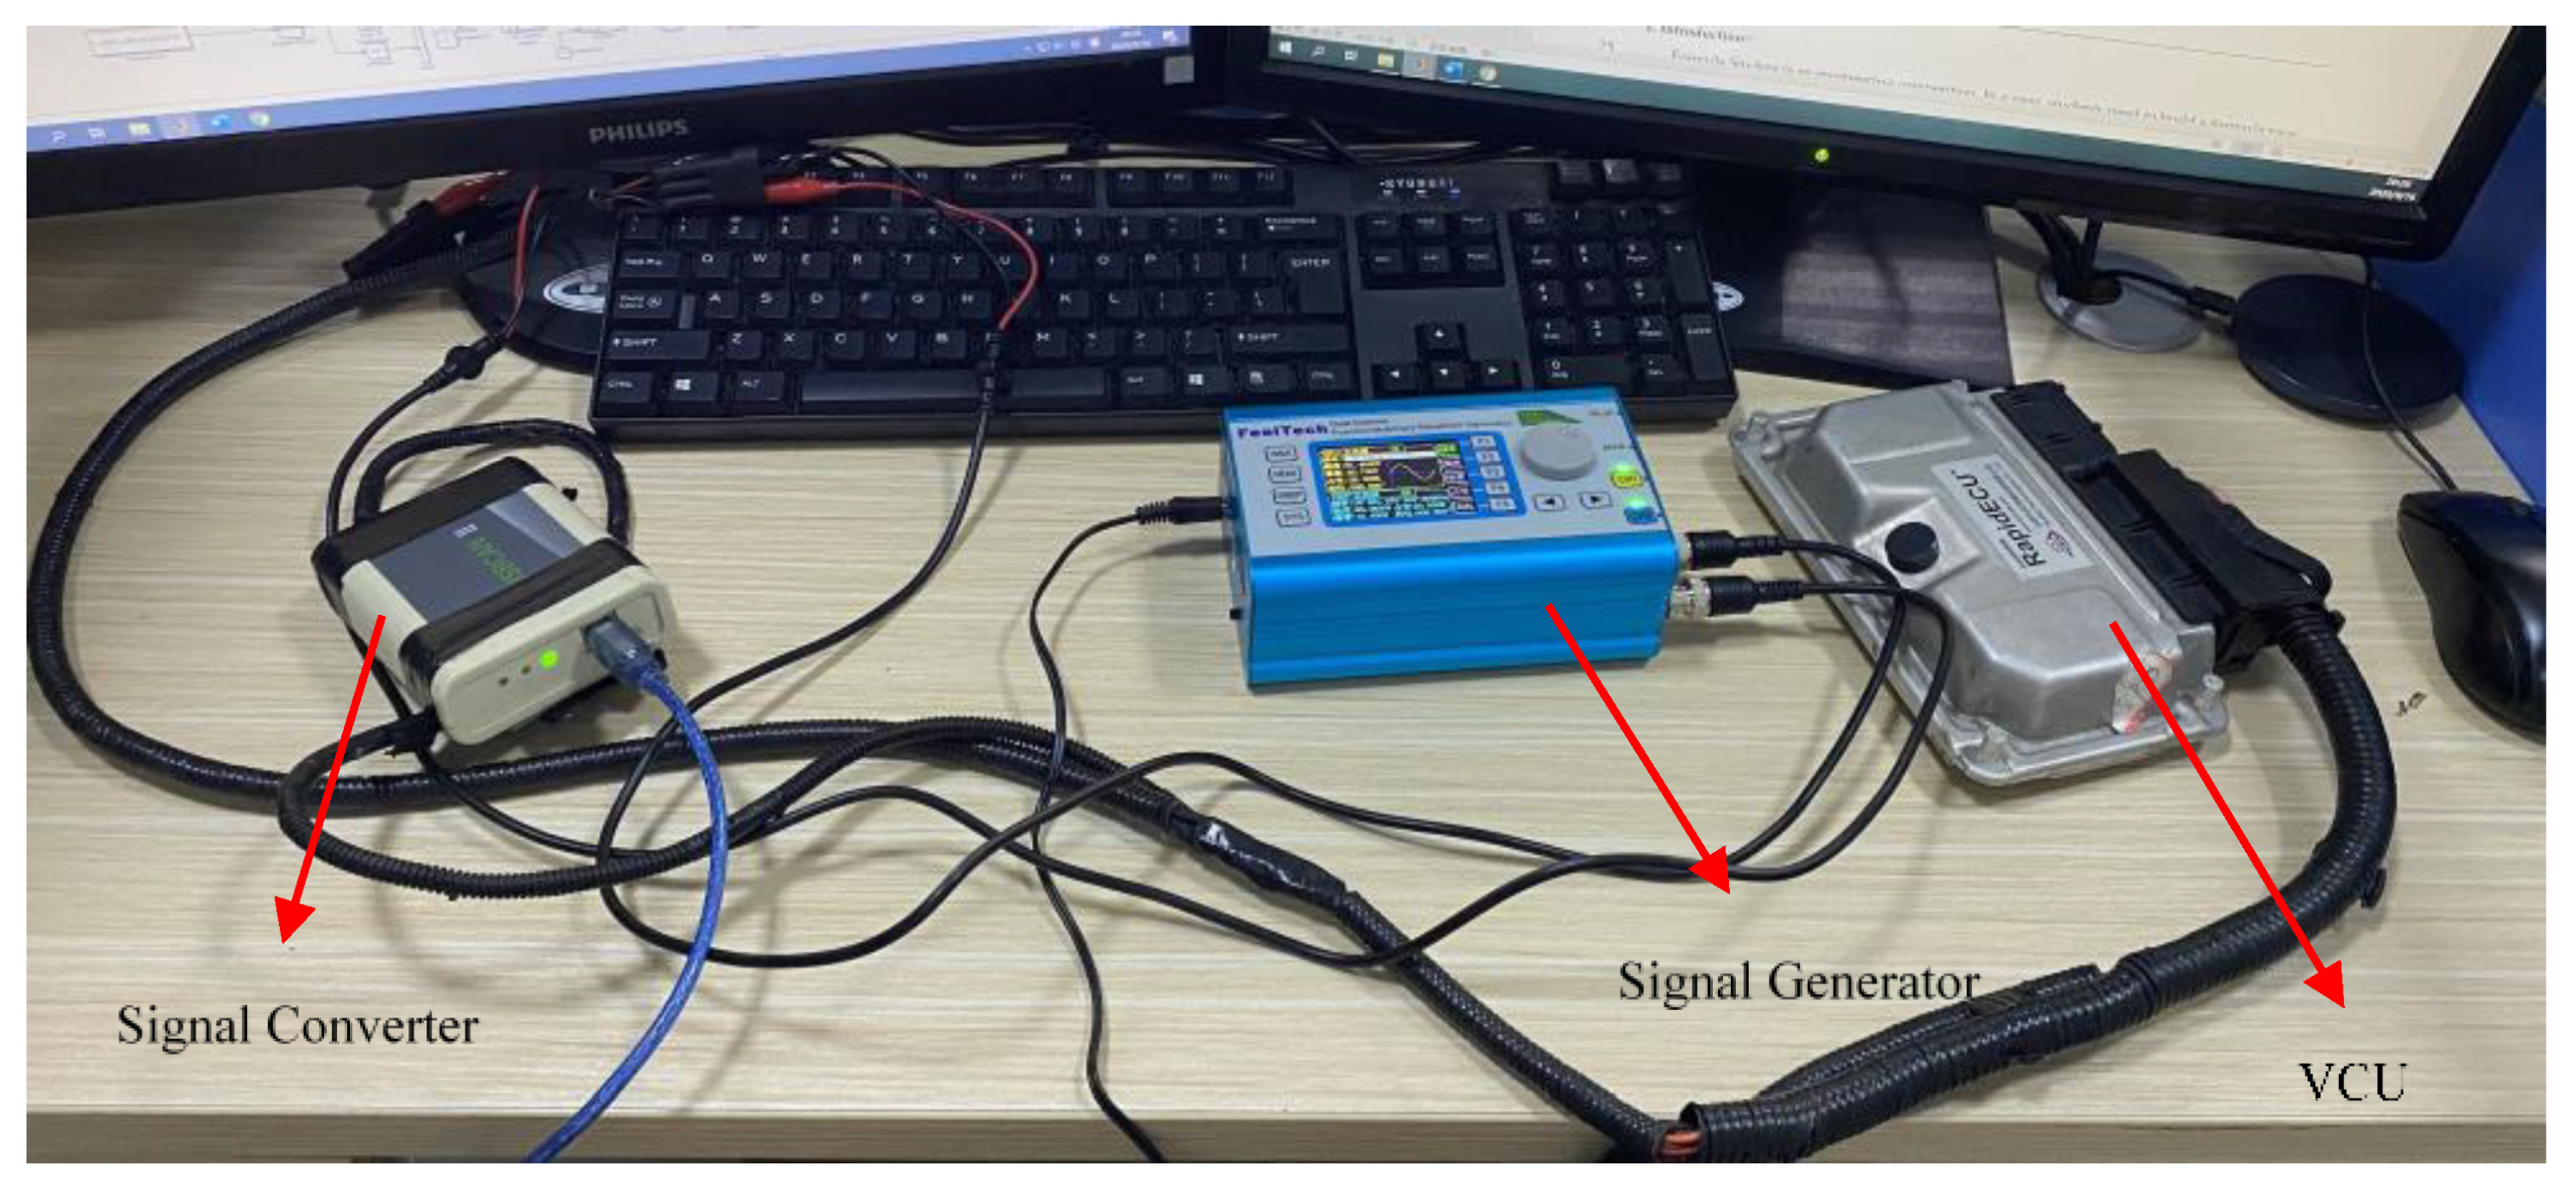
5.1. Experimental Setup

In order to verify the effectiveness of the above reliability control strategy, a test platform as shown in Figure 12 is built. A signal generator is used to simulate the output voltage signals of the accelerator pedal and brake pedal sensors. Signals are transmitted to the VCU which is used by the electric racing car for processing. Then the VCU transmits the results of the test to the computer for analysis through a signal converter.

5.2. Experimental Results

The signal generator outputs a voltage signal by superimposing white noise on a sine wave. The sine wave varies between 0.4–1.6 V and 0.4–3.2 V. The voltage changes before and after the filter are shown in Figure 13.
APPS1 and APPS2’s position changes after filter are shown in Figure 14.
According to Figure 13 and Figure 14, APPS1 and APPS2’s positions change smoother after filtering. The amplitude limit check module experimental result is shown in Figure 15. At the upper pole of APPS1 and the lower pole of APPS2, the Limit_check value is 0. When the value is 1, it means APPS1 and APPS2’s positions are all between 0 and 100%, or the signals exceed the normal range but the duration is less than 200 ms.
APPS1_consistency and APPS2_consistency are input into the consistency check model. If the difference between two signals is less than 10%, then the model outputs signal 1, otherwise it outputs signal 0. The consistency check model experimental results are shown in Figure 16. When the difference between APPS1 and APPS2 exceeds 10%, the model can detect the fault signal and outputs 0.
It can be seen from Figure 15 and Figure 16, when the difference between APPS1 and APPS2’s position is not greater than 10%, the consistency check module will output value 1.
Signal APPS and Brake are transmitted to APPS/Brake pedal plausibility check model for processing. The experimental result is shown in Figure 17. When the value is 0, it means the accelerator pedal and brake pedal are depressed at the same time. When APPS exceeds 25% and Brake exceeds 40%, the value of BPS_check is 0. Additionally, the value can remain 0 until APPS is less than 5%.
Output signals of the three detection models and signal APPS are input into the arbitration model for processing. Only the amplitude limit check model, consistency check model and APPS/Brake pedal plausibility check model are all passed the model outputs APPS, otherwise outputs 0. The accelerator pedal position experimental results are shown in Table 1. According to the table, the signal APPS_output outputs only when all check models pass, otherwise it outputs 0. The model is able to detect error signals and prevent pressing the accelerator and brake pedal simultaneously. The position of the accelerator pedal will not be transmitted to the MCU, and the motor will stop. The experimental tests proved that the system is effective in increasing the accuracy, reliability and safety of the electric racing car accelerator pedal. Moreover the above benefits have been obtained only by VCU software without modifying the mechanical structure of the pedal, and without increasing new sensors.

6. Conclusions

This research studies the reliability control strategy of an electric racing car’s accelerator and brake pedal. The control process of the model is simulated by establishing a simulation model in Matlab/Simulink. Simulation results show that filter model can effectively reduce the glitch in the signal, make the voltage signal smoother, and improve the accuracy of the signal. The amplitude limit check model and consistency check model can effectively detect sensors’ abnormal signals. The APPS/brake pedal plausibility check model can avoid the situation that accelerator pedal and brake pedal are depressed simultaneously, and the power output can be shut down immediately. After two accelerator pedal voltage signals are processed, the pedal position signal can be accurately output. The model meets the reliability control requirements. In future work, we will record the signals before and after processing through the data collector, and verify the reliability control algorithm on the racing car. At the same time, reliability control research will be conducted on other control components of electric racing cars to improve safety.

Author Contributions

Conceptualization, Y.L., H.H. and L.D.; methodology, Y.L. and H.H.; software, Y.L.; writing—original draft preparation, Y.L.; writing—review and editing, H.H. and L.D. All authors have read and agreed to the published version of the manuscript.

Funding

This research received no external funding.

Institutional Review Board Statement

Not applicable for studies not involving humans or animals.

Informed Consent Statement

Not applicable for studies not involving humans.

Data Availability Statement

Data sharing not applicable. No new data were created or analyzed in this study. Data sharing is not applicable to this article.

Conflicts of Interest

The authors declare no conflict of interest.

References

  1. What Is the Formula Student Germany Competition? Available online: https://www.formulastudent.de/about/concept/ (accessed on 25 September 2019).
  2. Mihailidis, A.; Samaras, Z.; Nerantzis, I.; Fontaras, G.; Karaoglanidis, G. The design of a Formula Student race car: A case study. Proc. Inst. Mech. Eng. Part D J. Automob. Eng. 2009, 223, 805–818. [Google Scholar] [CrossRef]
  3. Wang, H.; Shi, L.; Man, Z.; Zheng, J.; Li, S.; Yu, M.; Jiang, C.; Kong, H.; Cao, Z. Continuous fast nonsingular terminal sliding mode control of automotive electronic throttle systems using finite-time exact observer. IEEE Trans. Ind. Electron. 2018, 65, 7160–7172. [Google Scholar] [CrossRef]
  4. Yang, B.; Liu, M.; Kim, H.; Cui, X. Luenberger-sliding mode observer based fuzzy double loop integral sliding mode controller for electronic throttle valve. J. Process Control 2018, 61, 36–46. [Google Scholar] [CrossRef]
  5. Hu, Y.; Wang, H.; Cao, Z.; Zheng, J.; Ping, Z.; Chen, L.; Jin, X. Extreme-learning-machine-based FNTSM control strategy for electronic throttle. Neural Comput. Appl. 2020, 32, 14507–14518. [Google Scholar] [CrossRef]
  6. Sun, H.; Zhao, H.; Huang, K.; Qiu, M.; Zhen, S.; Chen, Y.-H. A fuzzy approach for optimal robust control design of an automotive electronic throttle system. IEEE Trans. Fuzzy Syst. 2017, 26, 694–704. [Google Scholar] [CrossRef]
  7. Sun, J.-m.; Zheng, P.-t. Immune Feedback Strategy in an Electronic Throttle Control System. J. Highway Transp. Res. Dev. Engl. Ed. 2019, 13, 103–110. [Google Scholar] [CrossRef]
  8. Vargas, A.N.; Menegaz, H.M.; Ishihara, J.Y.; Acho, L. Unscented Kalman filters for estimating the position of an automotive electronic throttle valve. IEEE Trans. Veh. Technol. 2016, 65, 4627–4632. [Google Scholar] [CrossRef]
  9. Gong, Y.; Yang, Z.-G. Fracture failure analysis of automotive accelerator pedal arms with polymer matrix composite material. Compos. Part B Eng. 2013, 53, 103–111. [Google Scholar] [CrossRef]
  10. Romero, J.; Queipo, N. Reliability-based and deterministic design optimization of a FSAE brake pedal: A risk allocation analysis. Struct. Multidiscip. Optim. 2017, 56, 681–695. [Google Scholar] [CrossRef]
  11. Wang, B.; Wang, L.; Tang, X.; Yang, S. A braking intention identification method based on data mining for electric vehicles. Math. Probl. Eng. 2019, 2019. [Google Scholar] [CrossRef] [Green Version]
  12. Zhao, X.; Wang, S.; Ma, J.; Yu, Q.; Gao, Q.; Yu, M. Identification of driver’s braking intention based on a hybrid model of GHMM and GGAP-RBFNN. Neural Comput. Appl. 2019, 31, 161–174. [Google Scholar] [CrossRef]
  13. Hao, G.; Jia, Y.; Gongxiang, C.; Chuanbao, W.U.; Ke, Z. The design of the mechanical locking device for anti-mistakenly stepped on the accelerator system with the speed threshold. J. Henan Inst. Ence Technol. Nat. Ence Ed. 2017, 45, 65–70. [Google Scholar]
  14. Ming-Ji, W.; He, N.; Yong, Z.; University, N.P. A design of intelligent control system for preventing mistakenly stepping on accelerator pedal of vehicle. Electron. Design Eng. 2017, 4, 14. [Google Scholar]
Figure 1. Racing driving system structure diagram.
Wevj 12 00001 g001
Figure 2. Filter model.
Wevj 12 00001 g002
Figure 3. Amplitude limit check model.
Wevj 12 00001 g003aWevj 12 00001 g003b
Figure 4. Consistency check model.
Wevj 12 00001 g004
Figure 5. APPS&Brake plausibility check model.
Wevj 12 00001 g005
Figure 6. Global control model.
Wevj 12 00001 g006
Figure 7. Filter model simulation result.
Wevj 12 00001 g007
Figure 8. The positions of APPS1 and APPS2.
Wevj 12 00001 g008
Figure 9. Amplitude limit check simulation result.
Wevj 12 00001 g009
Figure 10. Consistency check simulation result.
Wevj 12 00001 g010
Figure 11. APPS/Brake pedal plausibility check simulation result.
Wevj 12 00001 g011
Figure 12. The experimental platform of the reliability control strategy.
Wevj 12 00001 g012
Figure 13. APPS1 and APPS2’s voltages before and after the filter.
Wevj 12 00001 g013
Figure 14. APPS1 and APPS2’s position after filter.
Wevj 12 00001 g014
Figure 15. Amplitude limit check module experimental result.
Wevj 12 00001 g015
Figure 16. Consistency check module experimental result.
Wevj 12 00001 g016
Figure 17. APPS/Brake pedal plausibility check module experimental result.
Wevj 12 00001 g017
Table 1. List of fault signals
ConditionLimit_CheckConsistency_CheckBPS_CheckOutput
1111APPS
20110
31010
41100
50010
60100
71000
80000
Publisher’s Note: MDPI stays neutral with regard to jurisdictional claims in published maps and institutional affiliations.

