Article

A Health Indicator for the Online Lifetime Estimation of an Electric Vehicle Power Li-Ion Battery

1
State Grid Zhejiang Hangzhou Xiaoshan Power Supply Co., Ltd., Hangzhou 311200, China
2
School of Electrical Engineering and Automation, Wuhan University, Wuhan 430072, China
*
Author to whom correspondence should be addressed.
World Electr. Veh. J. 2020, 11(3), 59; https://doi.org/10.3390/wevj11030059
Submission received: 5 August 2020 / Revised: 21 August 2020 / Accepted: 22 August 2020 / Published: 31 August 2020

Abstract

:
With the further development of the electric vehicle (EV) industry, the reliability of prediction and health management (PHM) systems has received great attention. The original Li-ion battery life prediction technology developed by offline training data can no longer meet the needs of use under complex working conditions. The existing methods pay insufficient attention to the dispersive information of health indicators (HIs) under EV driving conditions, and can only calculate through standard configuration files. To solve the problem that it is difficult to directly measure the capacity loss in real time, this paper proposes a battery HI called excitation response level (ERL) to describe the voltage variation at different lifetimes, which could be easily calculated according to the current and voltage under the actual load curve. In addition, in order to further optimize the proposed HI, Box–Cox transformation was used to enhance the linear correlation between the initially extracted HI and the capacity. Several Li-ion batteries were discharged to the 50% state of health (SOH) through profiles with different depths of discharge (DODs) and mean states of charge (SOCs) to verify the accuracy and robustness of the proposed method. The average estimation error of the tested batteries was less than 3%, which shows a good performance for accuracy and robustness.

1. Introduction

With the further development of the electric vehicle (EV) industry, and in order to avoid or warn of battery performance failures as much as possible, the reliability of the prediction and health management (PHM) system of EV batteries has received greater attention from enterprises [1,2]. The PHM system uses the state of charge (SOC) and the state of health (SOH) to comprehensively evaluate the state of the EV battery. Of these, the degradation degree of battery aging represented by SOH is an important parameter for carrying out battery fault diagnosis and obtaining safety early warning [3,4].
Generally, the degree of decrease in the capacity of a Li-ion battery is monitored as a health indicator (HI) of battery degradation. On the one hand, the original Li-ion battery life prediction technology developed based on offline training data can no longer meet the needs of use under complex working conditions. This is because the operating environment temperature, load conditions, and charging status of Li-ion batteries used in EVs undergo unpredictable and drastic changes under actual complex working conditions [5]. Thus, it is very difficult to design the cyclic accelerated aging test under the working conditions similar to the actual operating conditions of the EV’s Li-ion battery. In addition, the effectiveness of the collected offline training data is difficult to guarantee. On the other hand, it is difficult to directly measure the capacity loss in real time under EV driving conditions, and the dispersion of battery characteristics further causes uncertainty in the evaluation [6]. Therefore, many effective methods to explore HIs through measurable signals like voltage, current, and so on have been proposed. HIs based on impedance, voltage, and charging curves have been proposed.
In recent years, many SOH estimation methods have been proposed. Most of the research studies agree that capacity fading can be represented by the change in internal resistance and other parameters in equivalent circuit models (ECMs) [7]. The resistance method can perform online evaluation based on the correlation between capacity attenuation and battery impedance (ohmic internal resistance, SEI resistance, etc.), but the reasonable choice of the model has a greater impact on impedance identification [8]. The information theory method is based on the estimation of the correlation between the capacity attenuation and the voltage response complexity under the same excitation. The calculation is simple and easy to implement. However, due to the dispersion of battery characteristics, the applicability of the fitting results is poor. In recent years, lifetime estimation methods based on HIs exacted from incremental capacity (IC), differential voltage (DV), open circuit voltage (OCV), and sample entropy of discharging voltage curves have been proposed [9,10]. The analysis method based on the IC curve allows the analysis of the aging mechanism of the battery according to the correlation between the aging mechanism and the peak drop and translation characteristics of the IC curve [11,12]. However, it is difficult to obtain the IC curve completely in actual vehicle conditions, and it is difficult to achieve quantitative analysis. The DV curve is obtained from the constant current (CC) charging curve when the battery is charging. It can also identify the aging mechanism and estimate the health of the battery. It can potentially be used for online diagnosis and prognosis services in the battery management system (BMS). However, its estimation process is very complicated [13,14]. Since there is a certain correlation between OCV and SOC, SOH, and SOC, using OCV can effectively track battery SOH online. However, it is difficult to perform online monitoring of OCV of EV batteries, because the measurement of OCV requires a long time to stand still in order to reach a steady state [15,16]. By detecting the modified sample entropy of the battery voltage sequence, an effective calculation method can be provided for the diagnosis and prediction of different battery faults. In addition, the data can be analyzed and quantified according to the law. However, this method takes a long time and requires additional capacity parameters when calculating sample entropy [17,18]. Furthermore, these methods focus mostly on the batteries used in EV applications and pay attention insufficiently to the dispersion information of the HIs. In addition, the online lifetime estimation cannot be achieved because the HIs can only be calculated through standard profiles. Hence, it is expected that researchers select an accurate and robust HI for the online lifetime estimation of EV batteries to show better performance in reducing the dispersion. Finally, an online battery SOH estimation method with high accuracy and low dispersion and that meets the needs of the vehicle environment must be proposed.
In this paper, we introduce a battery HI called excitation response level (ERL). The ERL can be calculated easily based on current and voltage under actual load profile, which is effective for the online lifetime estimation of the EV power Li-ion battery of the BMS. In addition, in order to further optimize the life index ERL, Box–Cox transformation is used to enhance the linear correlation between the initially extracted ERL and the capacity [19].
The rest of this article is organized in the following order: Section 2 introduces the calculation method of ERL and the steps of the Box–Cox transformation method. Section 3 introduces the experimental process. Based on the extraction and optimization of ERL, and the experimental work on the characteristics of Li-ion batteries, the experimental results of the Li-ion batteries are compared and analyzed to verify the effectiveness and accuracy of the method in Section 4. Finally, is the conclusions are summarized in Section 5.

2. ERL-Based Lifetime Estimator

2.1. ERL Extraction

When the battery is in a low capacity state, the transient part of the EV’s driving signal causes it to undergo frequent charging and discharging processes, which accelerates the aging of the batteries [1]. Voltage response is the most intuitive reflection of battery performance. The voltage variation under the hybrid pulse is shown in Figure 1. It is obvious that voltage variation under a certain current excitation can reflect battery aging, which is similar to the research studies carried out in [20,21]. Thus, HIs extracted in the voltage response curves can be effective for SOH estimation.
However, extracting some certain points in the voltage response curve as HI, such as the maximum voltage [22], may be easily affected by the error of the voltage sensor, and furthermore, it cannot represent voltage fluctuations for a period of time. Therefore, the concept of standard deviation is employed to describe the fluctuation degree of voltage response sequences in Figure 1 in this paper. The standard deviation values of current excitation and related terminal voltage variation are shown in Equation (1) as follows:
σ V = 1 N i = 1 N ( U i U ¯ ) , σ I = 1 N i = 1 N ( I i I ¯ )
where N is the number of sampling points, and U ¯ and I ¯ are the mean voltage and current values of all sampled voltage and current values, respectively. However, the standard deviation of the voltage variation at different lifetimes is not comparable because different currents may be applied to the battery. Thus, the ERL is proposed to eliminate the influence of different excitations on voltage changes, which introduces variation information of current sequences as shown in Equation (2):
E R L = σ V σ I
In engineering, the voltage and current can be sampled by the BMS. Generally, a sampling frequency of 1 Hz is sufficient for the BMS. The voltage and current of the first 120 s discharge after the battery is fully charged can be collected, and then the ERL can be calculated based on Equations (1) and (2). It is worth noting that the ERL is significantly influenced by the impedance characteristics of batteries, and thus is affected by the range of SOC. Therefore, the influence of SOC should be eliminated as much as possible when the ERL is used as an HI to describe the capacity degradation. The first 120 s load profile was employed in this paper to ensure that the SOC remained at approximately 100% after the ERL was calculated. In addition, the first 120 s load profile can effectively ensure sufficient information about load variation. It is worth noting that the criteria of the first load profile can be adjusted according to the actual application scenarios.
Compared with other HIs based on voltage variation mentioned above, which mostly require a certain excitation, the ERL can be calculated directly through the actual load profile. Moreover, the ERL differs from methods such as information entropy because it requires no matrix inversion and is more applicable to the embedded system.

2.2. Box–Cox Transformation

Generally, it is better to use a linear fitting relationship in the BMS. Although the HI can reflect the degradation process of the system, its performance may not be a fully linear relationship due to the complexity of the underlying degradation process [23]. Thus, the Box–Cox transformation theory was used to enhance the linear correlation between the initially extracted ERL and the capacity in order to further optimize the life index ERL.
Box–Cox transformation is a data transformation method based on maximum likelihood estimation. The main function is to make the transformed data obey or approximately obey the normal distribution [10,24]. The calculation equation is composed of the raw data y, the transformation parameter λ, and the transformed data y(λ). The specific transformation equation is as follows:
y ( λ ) = { y λ 1 λ , λ 0 log y , λ = 0
In the linear regression model, Equation (3) can be expressed as follows:
y i ( λ ) = β 0 + β 1 x i 1 + β 1 x i 2 + + β q x iq + ε i
where β0, β1, …, βq are the coefficients, q is the number of independent variables, and εi are independent random errors and satisfy ε i N ( 0 , σ 2 ) , i = 1 , 2 , , n .
There are two methods for estimating the parameter λ in the Box–Cox transformation—one is maximum likelihood estimation and the other is the Bayes method. In this paper, the maximum likelihood estimation method was used, which is easy to understand and compute.
First, the conversion result is assumed to be y(λ) ~ N(, σ2I), where X is a design matrix with X = (X1, X2, …, Xn)T, Xi = (1, xi1, xi2, …, xiq), β = (β0, β1, …, βq)T and the model parameters are (λ, β, σ2). Construct the likelihood function L(λ, β, σ2|y, X) as follows:
L ( λ , β , σ 2 | y , X ) = f ( y ( λ ) ) = exp ( 1 2 σ 2 ( y ( λ ) X β ) T ( y ( λ ) X β ) ) ( 2 π σ 2 ) n 2 J ( λ , y )
where f(y(λ)) is the density of y(λ) and J(λ,y) is the Jacobian of y transformed into y(λ), namely J ( λ , y ) = i = 1 n y i λ 1 .
It can be noted that the likelihood equation is proportional to the (β, σ2) likelihood equation used to estimate the observed y(λ) for each fixed λ. Therefore, the maximum likelihood estimation formula of (β, σ2) can be obtained as follows:
β ^ ( λ ) = ( X T X ) 1 X T y ( λ )
σ ^ 2 ( λ ) = ( y ( λ ) X β ) T ( y ( λ ) X β ) n
Finally, substituting β ^ ( λ ) and σ ^ 2 ( λ ) into Equation (5), we can obtain the log-likelihood of the distribution of λ by maximizing the likelihood function of (β, σ2):
L ( λ ) = C n 2 log ( σ ^ 2 ( λ ) ) + ( λ 1 ) i = 1 n log ( y i )
The corresponding λ when L(λ) reaches the maximum value obtained through optimization can be obtained by Equation (9):
g ( λ ) = n 2 log ( σ ^ 2 ( λ ) ) + ( λ 1 ) i = 1 n log ( y i )
The steps to determine the parameter λ are as follows [10]:
(a)
Choose an initial value of λ within a suitable range (such as [–5,5]).
(b)
Substitute the initial λ to calculate the corresponding g(λ).
(c)
Calculate all g(λ) corresponding to the remaining λ in turn.
(d)
Plot the correlation curve of g(λ) and λ.
(e)
Select the λ that maximizes g(λ).
The Box–Cox transformation requires no prior information and the calculation process is simple, which has great engineering application potential.

3. Experimental Section

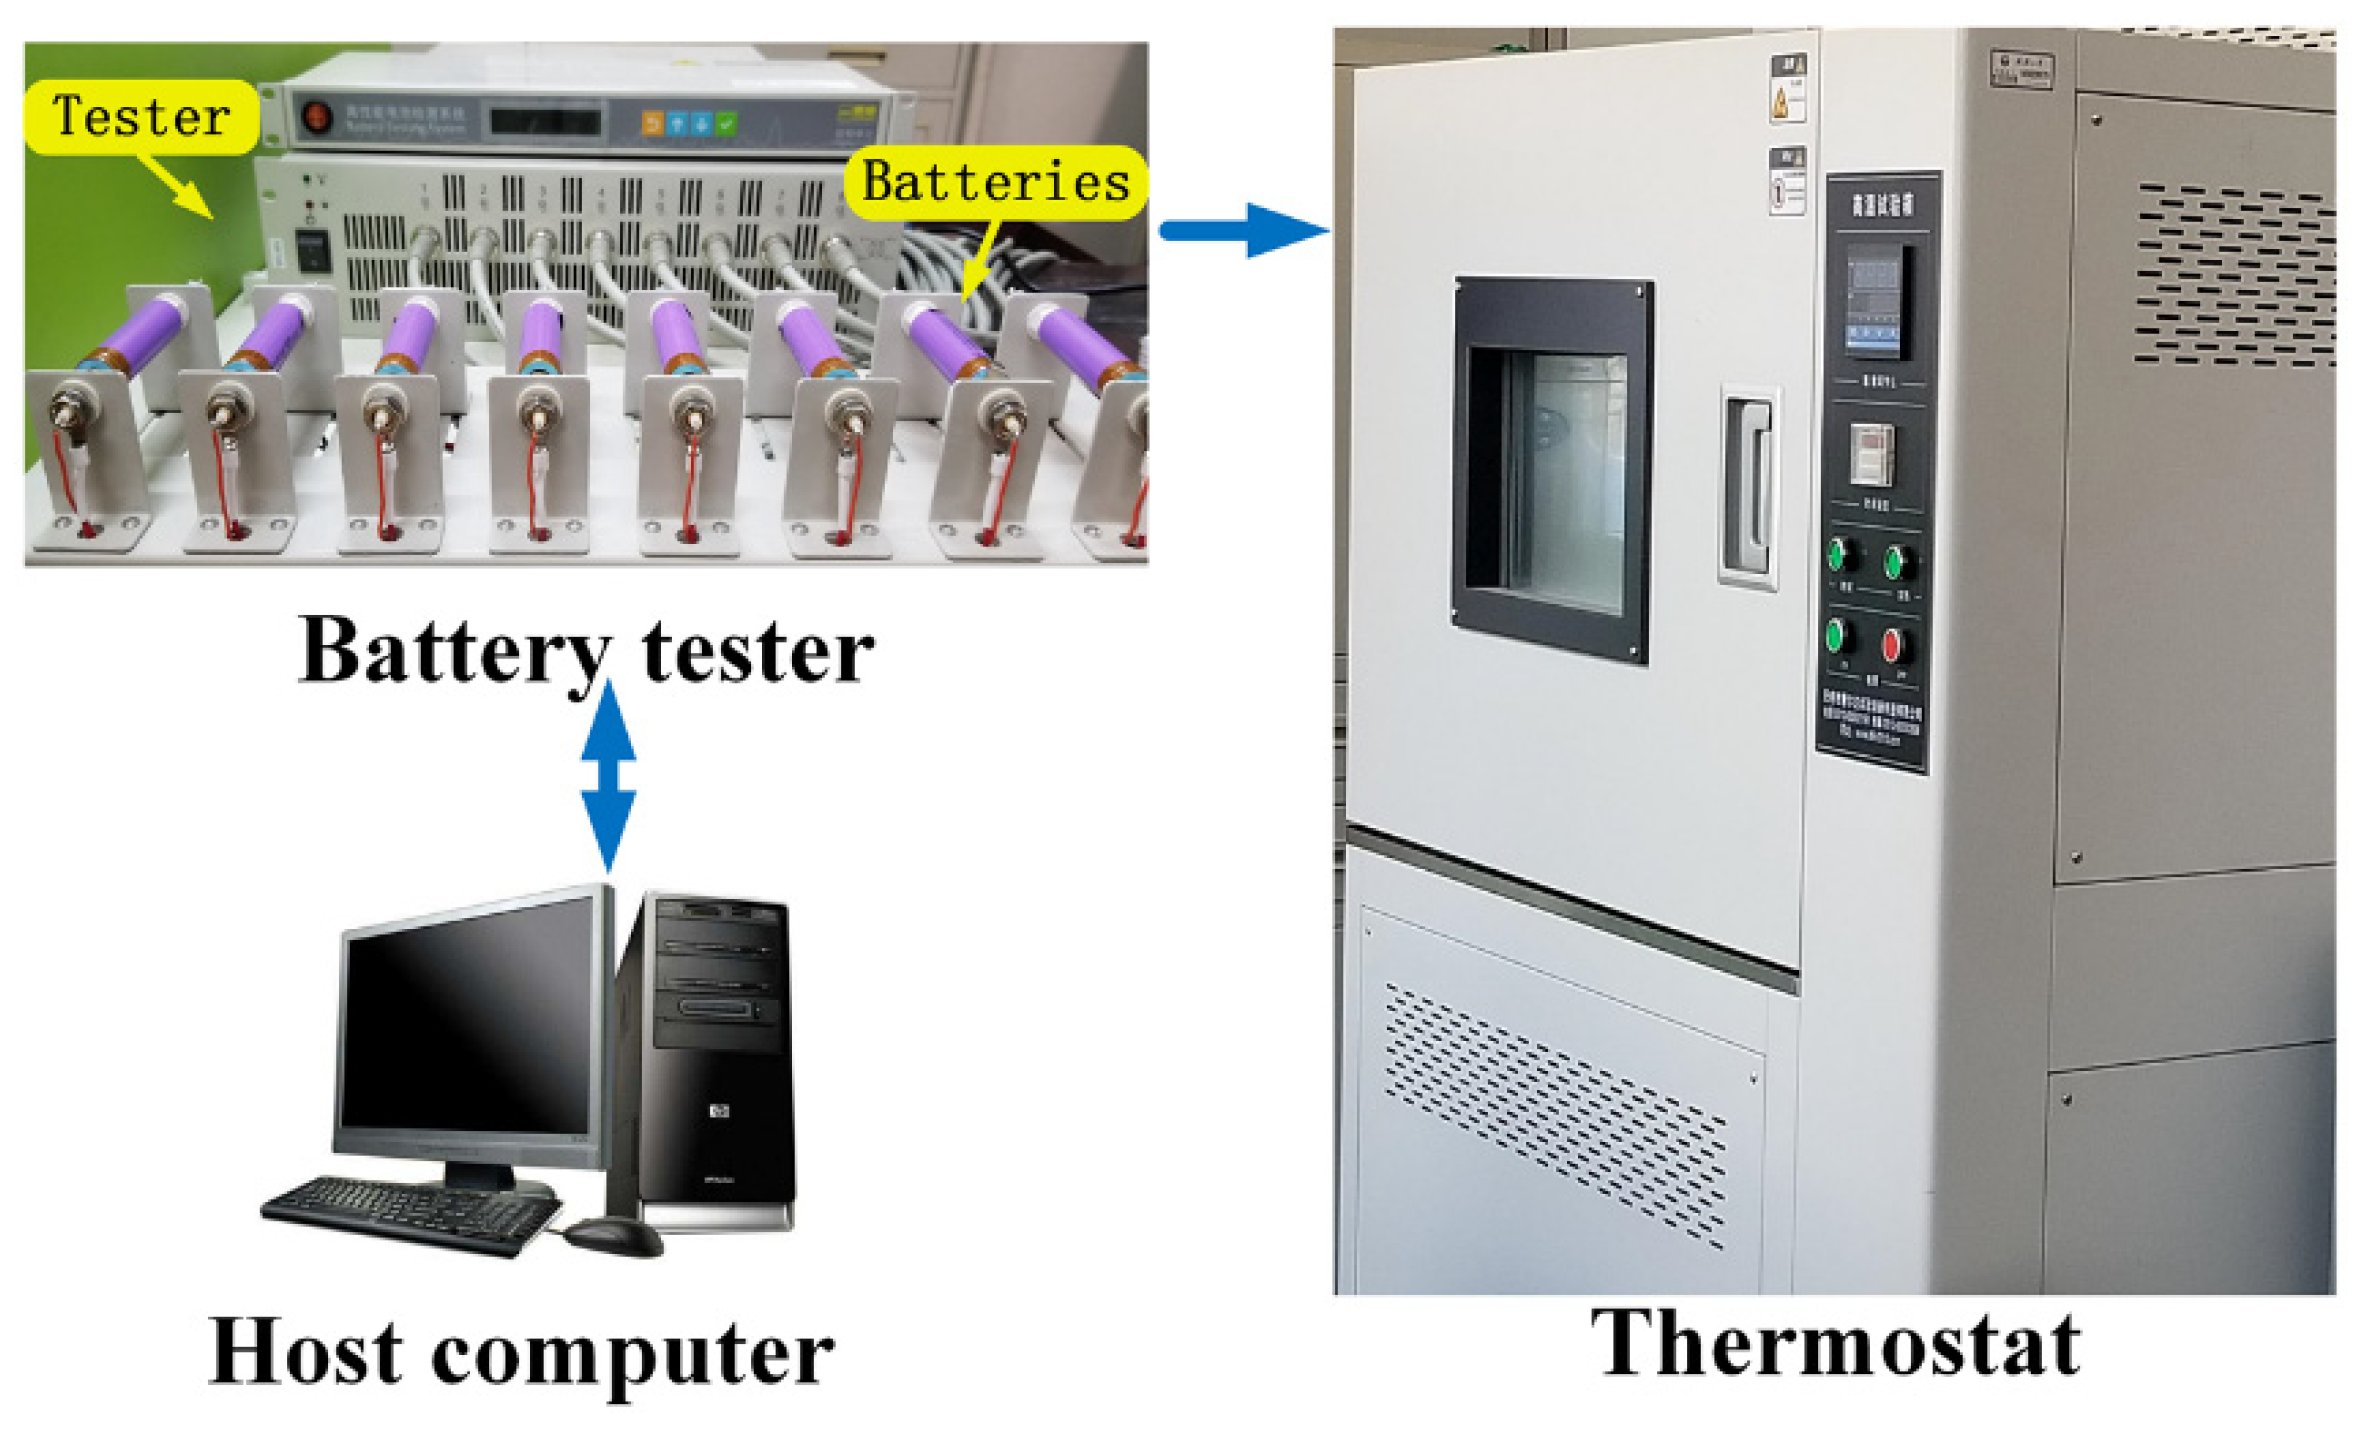
In this study, Li(NiCoMn)O2 (NCM) batteries were employed to verify the performance of the proposed method, and the specifications are shown in Table 1. The test bench, shown in Figure 2, consists of a Neware BTS-4000-5V/10A machine (Shenzhen, Guangdong, China) with a sampling frequency of 10 Hz and a sampling terminal voltage accuracy of 0.1% [25]. The batteries were kept in a thermostat at 25 °C.
In this study, a combination of cycling-induced aging test (CAT) and calibration test (CT) was performed [26], which is shown in Figure 3. The CAT ended when SOH was less than 50%. The profiles are shown in Table 2. The CT was performed every 3% of capacity. The CT comprised a capacity calibration test, a dynamic stress test (DST), and a constant current (CC) test. DST is one of the typical working conditions of EVs, which can effectively simulate the dynamic discharge process. For the DST profile, current rates are high, but the durations are short. Therefore, they are considered to be the simplified duty cycles for frequency regulation applications in energy storage systems. In the CC profile, the maximum current rate is lower, but the SOC range is larger and the cycle duration is longer. Therefore, it is applicable for peak shaving applications [27].

4. Results and Discussion

4.1. Estimation Dispersion of ERL

The initial ERL was calculated based on the working parameters of the EV’s Li-ion battery obtained in the experiments. Two scatter plots were used to show the relationship between the ERL and the remaining capacity of the three test batteries under DST and CC conditions, as shown in Figure 4. The black solid line represents the fitting curve with minimum deviation and the red dashed lines represent the fitting curves with specified confidence interval. It can be observed that there is a certain linear relationship between the extracted ERL and the battery capacity. However, linearity still has much room for improvement. Meanwhile, the dispersion of ERL under the DST profile was lower than that under the CC profile, which indicates that the ERL-based method exhibits better performance under EV dynamic working conditions (such as frequent starting and stopping). In addition, it is obvious that the dispersion between batteries further increases with aging, which reduces the accuracy of lifetime estimation. Therefore, it is necessary to use the Box–Cox method to optimize the ERL index extraction process in order to obtain more accurate online lifetime estimation results within the full capacity range.

4.2. Optimization of ERL

In order to further improve the linear relationship between the extracted ERL and the battery capacity after calculating the original ERL, the Box–Cox transformation was applied as described in Section 2.2.
The linear model of capacity and ERL is as follows after using the Box–Cox transformation with a specific parameter λ:
C ( λ ) = β 0 + β 1 E R L + ε = X β + ε
where X = [1, ERL], β = [β0, β1]T, and C(λ) can be transformed as follows:
C ( λ ) = { C λ 1 λ , λ 0 log C , λ = 0
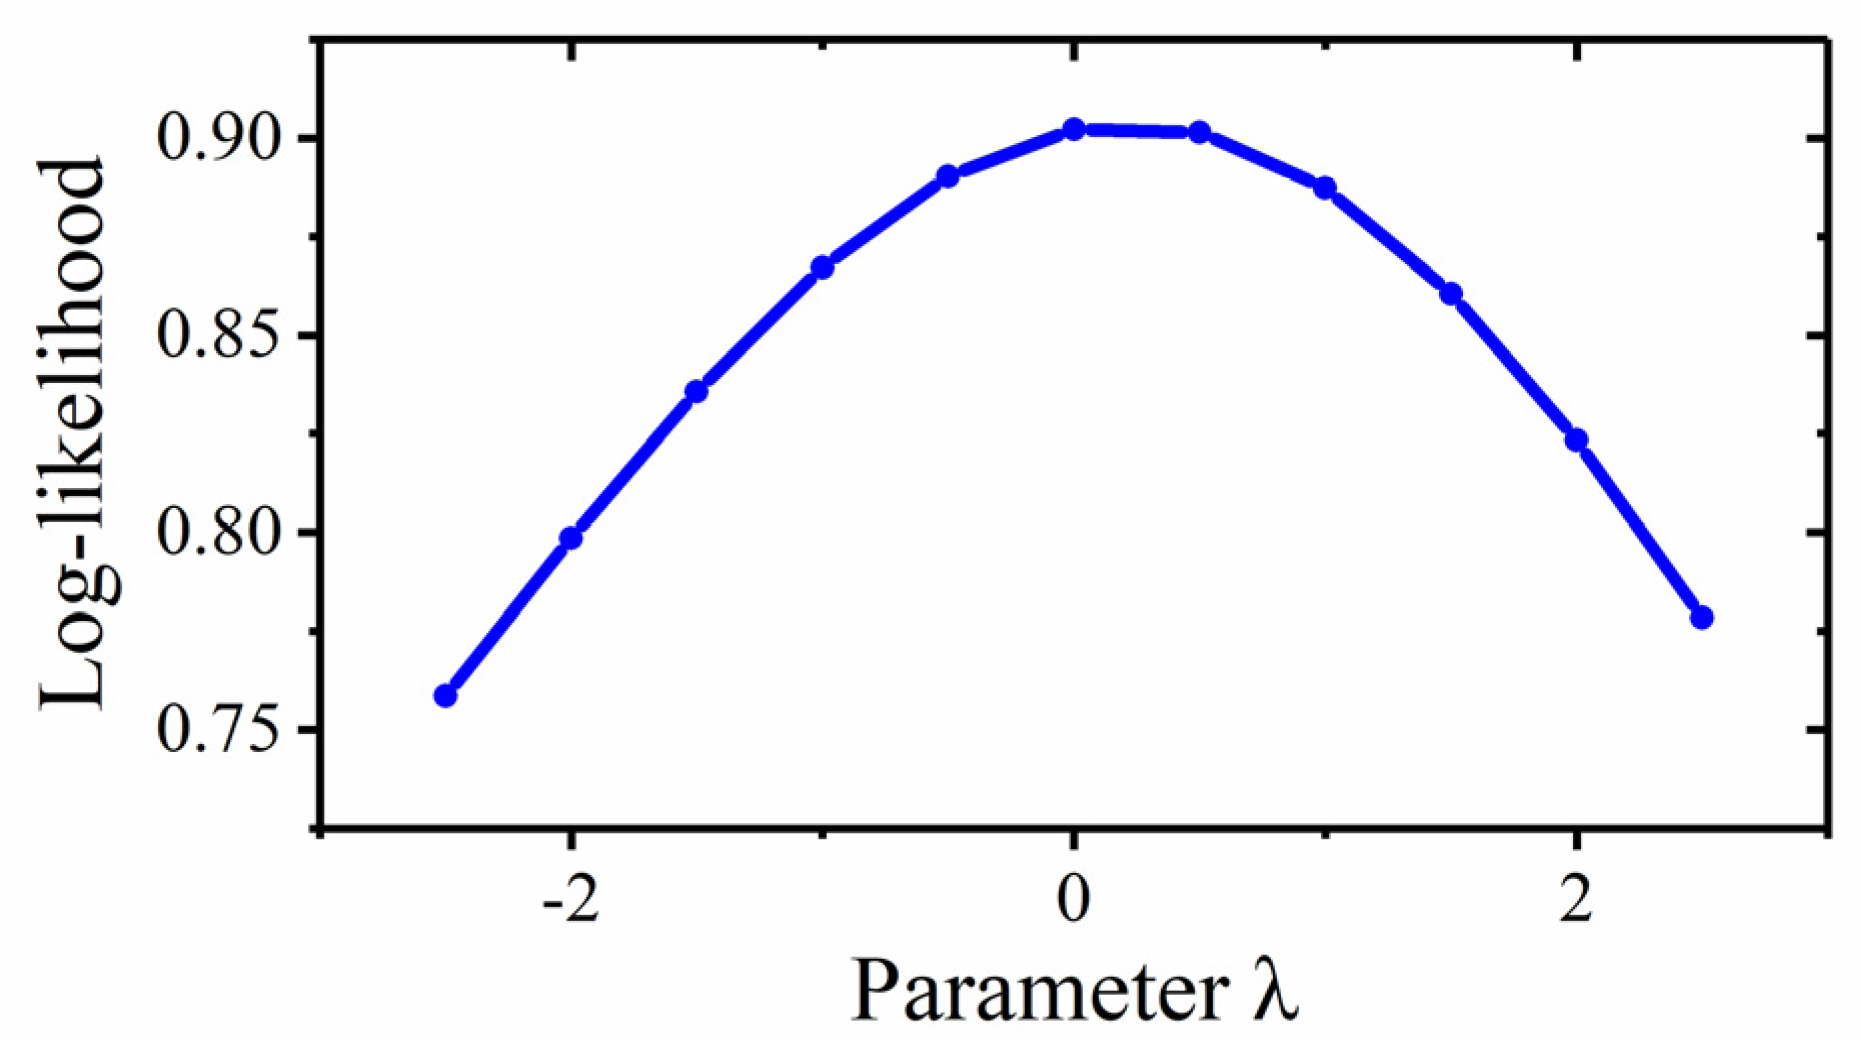
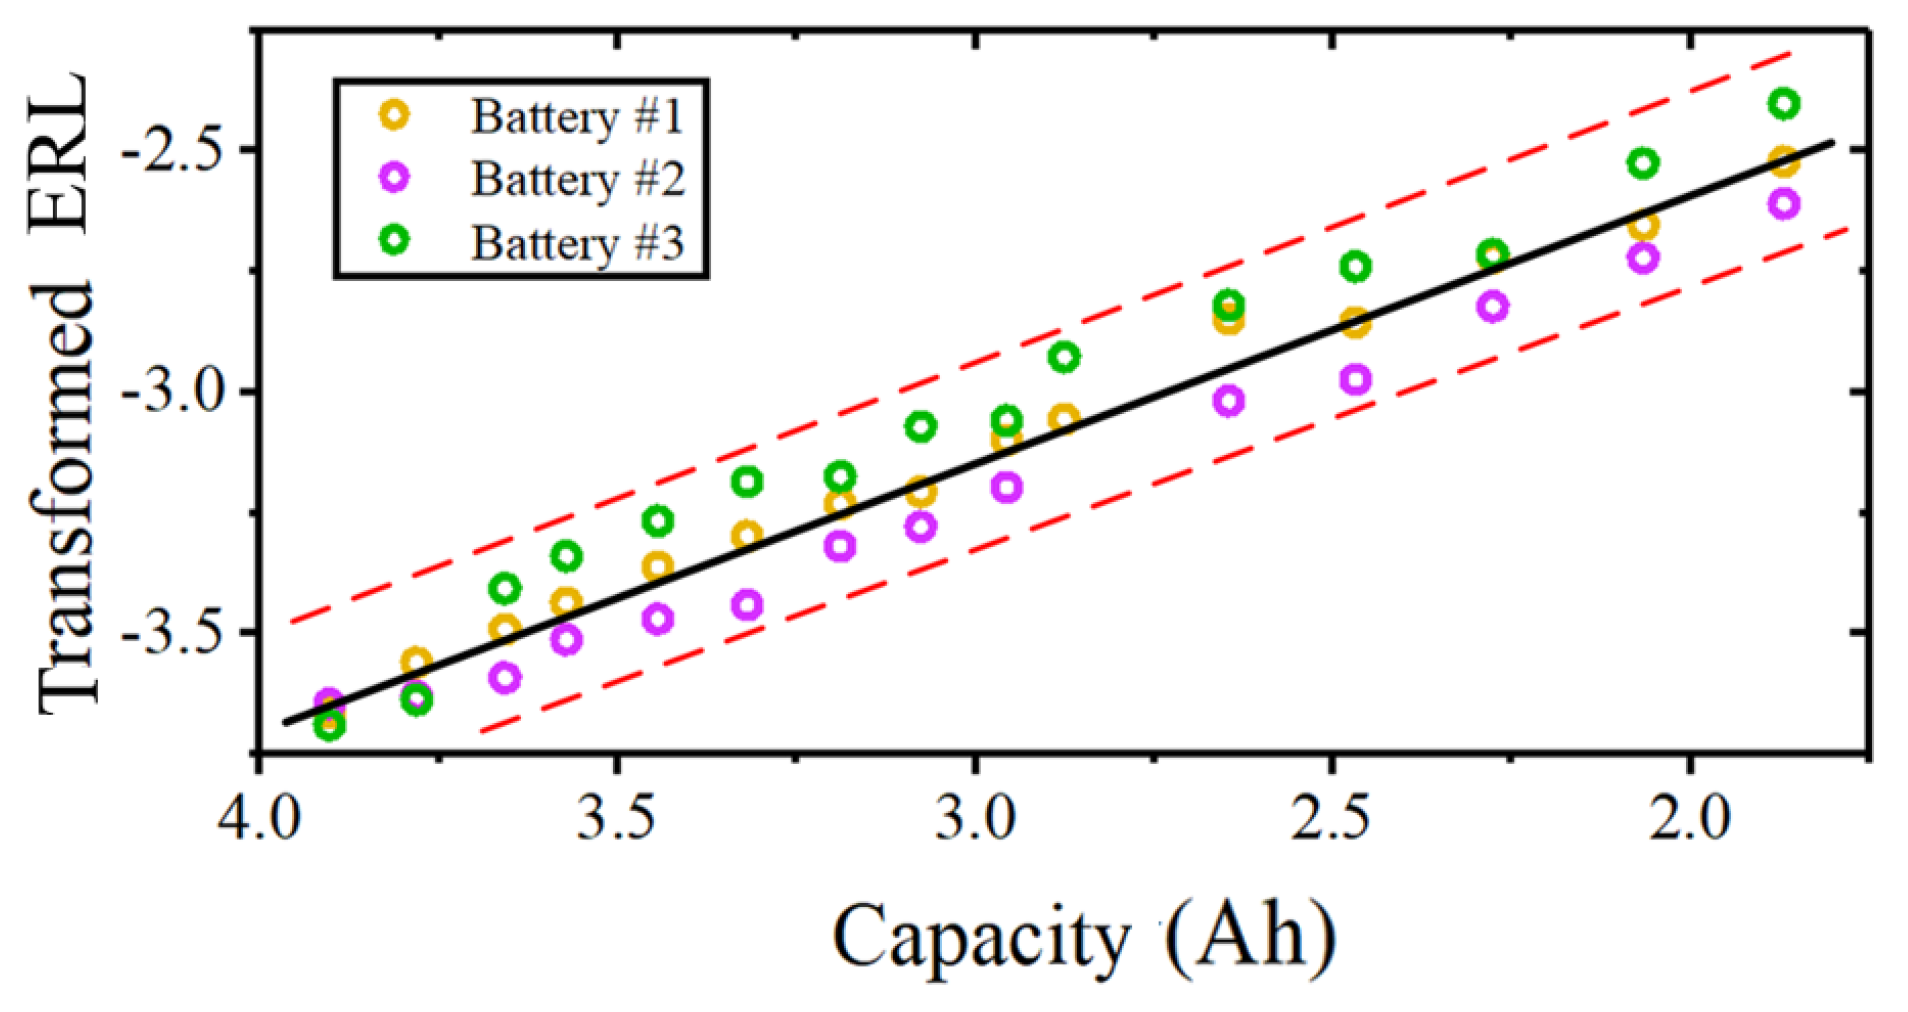
The parameter λ was found using the steps proposed in Section 2.2 that maximize the log-likelihood function. Figure 5 shows the curve relationship between the log-likelihood function and the parameter λ. The log-likelihood function first increases with the increase of λ. When λ = 0, the log-likelihood function curve reaches its peak, and the value is maximized. Then, the log-likelihood function curve begins to decrease. Therefore, λ = 0 was selected for the Box–Cox transformation, and the results are shown in Figure 6, which shows the relationship curve between transformed ERL and the capacity. By comparing Figure 4 and Figure 6, it can be observed that the relationship between the transformed ERL and the capacity is closer to linear.

4.3. Estimation Result

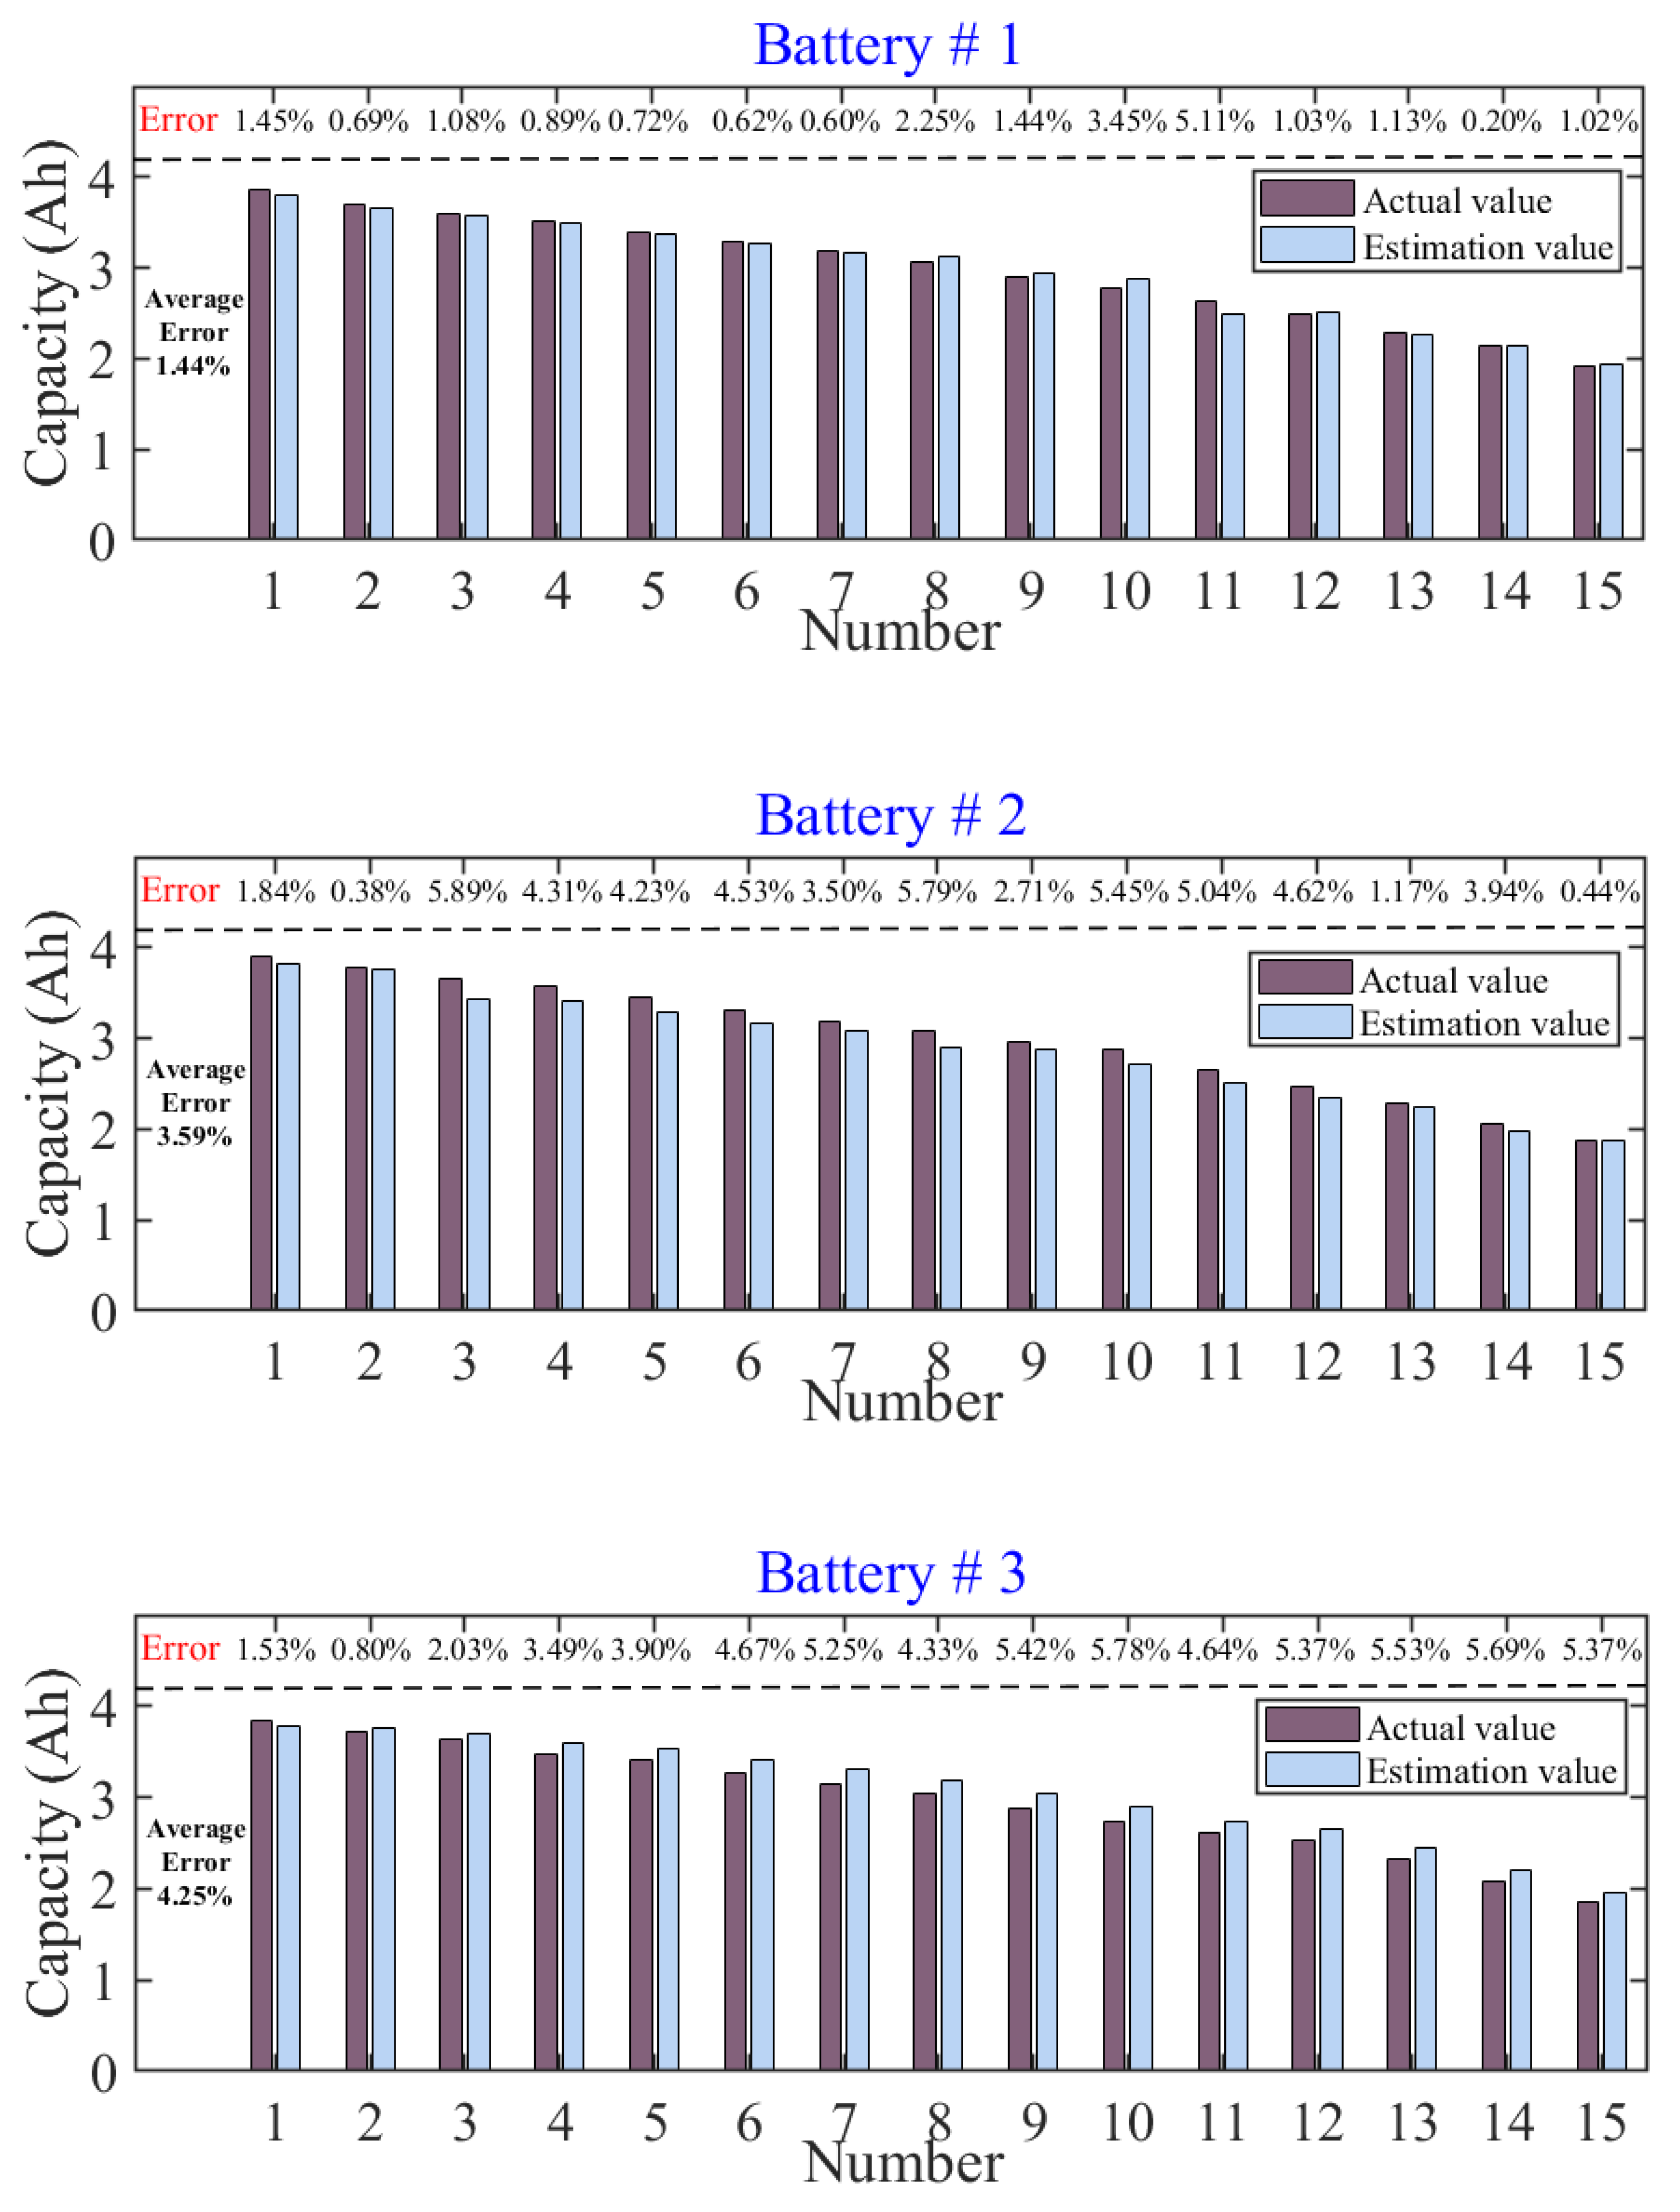
Figure 7 shows the estimation results of all tested batteries. The capacity of each battery was estimated based on the fitting relationship in Figure 6. It can be clearly observed from Figure 7 that the estimator shows high estimation accuracy in 15 selected cycles even when the battery’s lifetime is less than 70%. It is worth noting that the proposed estimator is robust enough, considering the difference in cycling-induced aging profiles of the three tested batteries.
Two lifetime estimation methods including the “internal resistance (IR) based method [7]” and the “IC curve-based method [11]” were employed to compare with the proposed ERL-based method. The average error and peak error of different methods are shown in Figure 8 and Table 3. The peak error of the ERL-based method is 5.89% and the average error is 3.09%, which are obviously less than the other methods.
Although the effectiveness of the abovementioned methods in lifetime estimation for batteries used in EVs has been proven, the dispersion between batteries with reduced capacity decreases the robustness of the above methods as the battery ages further in other applications. Thus, the results indicate that it is necessary to use ERL to eliminate dispersion.

5. Conclusions

In this paper, an ERL-based lifetime estimator was proposed for the online lifetime estimation of EVs under complex driving conditions. The proposed ERL was easily calculated based on the current and voltage under the actual load curve. The Box–Cox transformation enhanced the linear correlation between the originally extracted ERL and the capacity, which made the ERL more accurate and could effectively quantify the battery degradation characteristics. Numerous experiments showed that the estimation average and peak errors of the tested batteries were all less than 3% and 6%, respectively, while the training set consisted of three cells. The impact of battery dispersion on estimation was reduced, which showed a good performance for the accuracy and robustness of the online lifetime estimation of the EV power Li-ion battery under actual dynamic working conditions. The applicability of more cells under various profiles will be verified in future work.

Author Contributions

Conceptualization, B.Y. and S.L.; methodology, B.Y., H.Q., and H.L.; validation, L.W. and H.Q.; formal analysis, L.W.; resources, K.H.; data curation, K.H.; writing—original draft preparation, L.W. and K.H.; writing—review and editing, B.Y. and H.Q.; supervision, B.Y.; project administration, B.Y.; funding acquisition, B.Y. All authors have read and agreed to the published version of the manuscript.

Funding

This work was supported in part by the National Key Research and Development Program of China under Grant 2017YFB1201003 and the Science and Technology Project of the State Grid Zhejiang Electric Power Co., Ltd. (Project number: HZJTK13).

Conflicts of Interest

The authors declare no conflict of interest.

References

  1. Kim, Y.; Raghunathan, V.; Raghunathan, A. Design and Management of Battery-Supercapacitor Hybrid Electrical Energy Storage Systems for Regulation Services. IEEE Trans. Multi Scale Comput. Syst. 2016, 3, 12–24. [Google Scholar] [CrossRef]
  2. Meng, H.; Li, Y.F. A review on prognostics and health management (PHM) methods of lithium-ion batteries. Renew. Sustain. Energy Rev. 2019, 116, 109405. [Google Scholar] [CrossRef]
  3. Wang, D.; Miao, Q.; Pecht, M. Prognostics of lithium-ion batteries based on relevance vectors and a conditional three-parameter capacity degradation model. J. Power Sources 2013, 239, 253–264. [Google Scholar] [CrossRef]
  4. Zhang, J.; Lee, J. A review on prognostics and health monitoring of Li-ion battery. J. Power Sources 2011, 196, 6007–6014. [Google Scholar] [CrossRef]
  5. Ma, J.; Xu, S.; Shang, P.; Ding, Y.; Qin, W.; Cheng, Y.; Lu, C.; Su, Y.; Chong, J.; Jin, H.; et al. Cycle life test optimization for different Li-ion power battery formulations using a hybrid remaining-useful-life prediction method. Appl. Energy 2020, 262, 114490. [Google Scholar] [CrossRef]
  6. Lucu, M.; Martinez-Laserna, E.; Gandiaga, I.; Liu, K.; Marco, J. Data-driven nonparametric Li-ion battery ageing model aiming at learning from real operation data—Part B: Cycling operation. J. Energy Storage 2020, 30, 101410. [Google Scholar] [CrossRef]
  7. Yuan, H.F.; Dung, L.R. Off-Line State-of-Health Estimation for High Power Lithium-Ion Batteries Using Three-Point Impedance Extraction Method. IEEE Trans. Veh. Technol. 2017, 66, 2019–2032. [Google Scholar] [CrossRef]
  8. Sun, L.; Li, G.; You, F. Combined internal resistance and state-of-charge estimation of lithium-ion battery based on extended state observer. Renew. Sustain. Energy Rev. 2020, 131, 109994. [Google Scholar] [CrossRef]
  9. Qian, K.; Huang, B.; Ran, A.; He, Y.; Li, B.; Kang, F. State-of-health (SOH) evaluation on lithium-ion battery by simulating the voltage relaxation curves. Electrochim. Acta 2019, 303, 183–191. [Google Scholar] [CrossRef]
  10. Zhou, Y.; Huang, M.; Chen, Y.; Tao, Y. A novel health indicator for on-line lithium-ion batteries remaining useful life prediction. J. Power Sources 2016, 321, 1–10. [Google Scholar] [CrossRef]
  11. Tian, J.; Xiong, R.; Yu, Q. Fractional-Order Model-Based Incremental Capacity Analysis for Degradation State Recognition of Lithium-Ion Batteries. IEEE Trans. Ind. Electron. 2018, 66, 1576–1584. [Google Scholar] [CrossRef]
  12. Li, Y.; Abdel-Monem, M.; Gopalakrishnan, R.; Berecibar, M.; Nanini-Maury, E.; Omar, N.; van den Bossche, P.; van Mierlo, J. A quick on-line state of health estimation method for Li-ion battery with incremental capacity curves processed by Gaussian filter. J. Power Sources 2018, 373, 40–53. [Google Scholar] [CrossRef]
  13. Bloom, I.; Jansen, A.N.; Abraham, D.P. Differential voltage analyses of high-power, lithium-ion cells. 1. Technique and application. J. Power Sources 2005, 139, 295–303. [Google Scholar] [CrossRef]
  14. Han, X.; Ouyang, M.; Lu, L.; Li, J.; Zheng, Y.; Li, Z. A comparative study of commercial lithium ion battery cycle life in electrical vehicle: Aging mechanism identification. J. Power Sources 2014, 251, 38–54. [Google Scholar] [CrossRef]
  15. Tong, S.; Klein, M.P.; Park, J.W. On-line optimization of battery open circuit voltage for improved state-of-charge and state-of-health estimation. J. Power Sources 2015, 293, 416–428. [Google Scholar] [CrossRef]
  16. Lee, S.; Kim, J.; Lee, J.; Cho, B.H. State-of-charge and capacity estimation of lithium-ion battery using a new open-circuit voltage versus state-of-charge. J. Power Sources 2008, 185, 1367–1373. [Google Scholar] [CrossRef]
  17. Yunlong, S.; Gaopeng, L.; Yongzhe, K.; Zhongkai, Z.; Bin, D.; Chenghui, Z. A multi-fault diagnosis method based on modified Sample Entropy for lithium-ion battery strings. J. Power Sources 2020, 446, 227275. [Google Scholar]
  18. Widodo, A.; Shim, M.C.; Caesarendra, W.; Yang, B.S. Intelligent prognostics for battery health monitoring based on sample entropy. Expert Syst. Appl. Int. J. 2011, 38, 11763–11769. [Google Scholar] [CrossRef]
  19. Zhang, Y.; Xiong, R.; He, H.; Pecht, M.G. Lithium-Ion Battery Remaining Useful Life Prediction with Box–Cox Transformation and Monte Carlo Simulation. IEEE Trans. Ind. Electron. 2018, 66, 1585–1597. [Google Scholar] [CrossRef]
  20. Banaei, A.; Fahimi, B. Real time condition monitoring in Li-Ion batteries via battery impulse response. In Proceedings of the 2010 IEEE Vehicle Power and Propulsion Conference, Lille, France, 1–3 September 2010. [Google Scholar]
  21. Lavigne, L.; Sabatier, J.; Francisco, J.M.; Guillemard, F.; Noury, A. Lithium-ion Open Circuit Voltage (OCV) curve modelling and its ageing adjustment. J. Power Sources 2016, 324, 694–703. [Google Scholar] [CrossRef]
  22. Coleman, M.; Hurley, W.G.; Lee, C.K. An Improved Battery Characterization Method Using a Two-Pulse Load Test. IEEE Trans. Energy Convers. 2008, 23, 708–713. [Google Scholar] [CrossRef]
  23. Liu, D.; Zhou, J.; Liao, H.; Peng, Y.; Peng, X. A Health Indicator Extraction and Optimization Framework for Lithium-Ion Battery Degradation Modeling and Prognostics. IEEE Trans. Syst. Man Cybern. Syst. 2015, 45, 915–928. [Google Scholar]
  24. Morozova, M.; Koschutnig, K.; Klein, E.; Wood, G. Monotonic non-linear transformations as a tool to investigate age-related effects on brain white matter integrity: A Box–Cox investigation. NeuroImage 2016, 125, 1119–1130. [Google Scholar] [CrossRef] [PubMed] [Green Version]
  25. Liu, S.; Wang, J.; Liu, Q.; Tang, J.; Liu, H.; Fang, Z. Deep-Discharging Li-Ion Battery State of Charge Estimation Using a Partial Adaptive Forgetting Factors Least Square Method. IEEE Access 2019, 7, 47339–47352. [Google Scholar] [CrossRef]
  26. Liu, S.; Wang, J.; Liu, Q.; Tang, J.; Liu, H.; Zhou, Y.; Pan, X. A Novel Discharge Mode Identification Method for Series-connected Battery Pack Online State of Charge Estimation over A Wide Life Scale. IEEE Trans. Power Electron. 2020. [Google Scholar] [CrossRef]
  27. Jiang, Y.; Jiang, J.; Zhang, C.; Zhang, W.; Gao, Y.; Li, N. State of health estimation of second-life LiFePO4 batteries for energy storage applications. J. Clean. Prod. 2018, 205, 754–762. [Google Scholar] [CrossRef]
Figure 1. Voltage variation: (a) current; (b) voltage.
Wevj 11 00059 g001
Figure 2. Battery test bench.
Wevj 11 00059 g002
Figure 3. Test steps.
Wevj 11 00059 g003
Figure 4. Relationship between excitation response level (ERL) and capacity: (a) a dynamic stress test (DST) profile; (b) a constant current (CC) profile.
Wevj 11 00059 g004
Figure 5. Log-likelihood function with parameter λ.
Wevj 11 00059 g005
Figure 6. Log-likelihood function with parameter λ.
Wevj 11 00059 g006
Figure 7. Estimation results of all tested batteries.
Wevj 11 00059 g007
Figure 8. Comparison of lifetime estimation. (a) average error (b) peak error.
Wevj 11 00059 g008
Table 1. Battery specifications.
TypeSizeTerminal Voltage (V)Operating Voltage (V)Capacity (Ah)Maximum Discharge Rate (C)
Li(NiCoMn)O2 (NCM)21,7003.72.7–4.244
Table 2. Cycling-induced aging test (CAT) profile.
BatteryDepth of Discharge (DOD)State of Charge (SOC) Ranges
# 150%25–75%
# 250%35–85%
# 340%30–70%
Table 3. Error of lifetime estimation.
ErrorIR-Based MethodIC-Based MethodERL-Based Method
Peak error18.58%15.84%5.89%
Average error4.90%5.02%2.95%