1. Introduction
Resource scarcity, climate change, and health risks from air pollution are among the greatest global challenges facing our society today [
1]. For all three, transportation is relevant, as conventional combustion engines run on fossil fuels and produce large amounts of CO
2 [
2] and NO
x [
3]. In Germany, for example, several major cities are currently struggling to comply with the thresholds of the European Union for nitrogen dioxide in the air. Against this background, electric mobility represents a key solution for local emission reduction by means of alternative drive technologies. In particular, individual transport offers great potential for improvement, since passenger cars account for the largest share of the vehicle population and the proportion of electric vehicles is still low. As of 1 October 2018, the number of purely battery electric vehicles (BEV) in Germany totaled 73,398, which is a negligibly small proportion compared to over 46 million passenger cars with internal combustion engines (ICE) [
4].
The fact that electric vehicles have not yet achieved broad market penetration in Germany despite government subsidies [
5] indicates that there are still major barriers that limit the willingness of both private and commercial users to use and buy BEVs. In addition to the limited availability of the required car types and comparatively high acquisition costs [
6,
7], two criteria are at the forefront that are not independent of each other: On the one hand, potential users have concerns about the comparatively short range of many electric vehicles [
8,
9]. On the other hand, the current availability of public charging infrastructure is perceived as an impediment to adaption [
10]. The development of a charging infrastructure that covers both pure demand and the needs and requirements of current and potential future users with regard to charging locations and charging services is therefore of decisive importance.
Currently, various approaches for the planning of charging infrastructure exist, ranging from pure demand planning at the national or regional level [
11] to spatial positioning at corridors [
12] or in city districts [
13]. All approaches have in common that they model users’ requirements [
14], and behaviours. This concerns, of course, statistical data on traffic volumes, but also an understanding of the drivers’ decision-making processes with regard to the question of when and why which charging opportunity is used and preferred and which is perhaps skipped. Thereby, not only current BEV users, the early adopters, must be taken into account, but also future users, who currently still drive ICE vehicles. This is all the more important since, on the one hand, mixed traffic from BEV and ICE vehicles is to be expected in the foreseeable future and shared locations and thus synergy effects could also be taken into account in public infrastructure planning. On the other hand, the comparison of BEV and ICE users is mandatory in order to understand both the refilling behaviours and also how the drivers perceive and cope with limited range situations (especially when users switch from combustion to electric drives). If users’ behaviours and decision criteria remain stable and predictable across driving situations, conditions and purposes, this information could be integrated into the infrastructure planning.
2. Current State of Research
In the following, an overview of the general state of research on fueling and charging behaviour in handling cars is given, before the focus moves to so-called range stress and its determinants.
2.1. Charging and Refueling Behavior
Range was found to play an important role in either context, charging and refueling: Both, BEV users as well as drivers of cars with ICE allocate the available range resources in line with their mobility needs [
15]. Comparing users’ behavior of charging versus traditional refueling [
15], it was found that drivers did not differ in their perception of critical filling levels for fuel tanks and batteries, indicating that the fear of getting stranded with either vehicle type might be the same for both user groups. However, as regards the frequency of charging and refueling, BEV users charged in a timely manner, whereas ICE vehicle users indicated running on empty more often and only then refilled the tank completely [
15]—which goes in line with corresponding research in this context [
16,
17].
In addition, differences in the conditions for charging and refueling were found: financial aspects were considered less decisive with BEV users, probably due to a higher socio-economic status [
18]. For drivers of vehicles with ICE, planning and routine seemed not that important, presumably because the network of petrol stations is quite well-established [
15]. Kuby [
16] argued that the state of infrastructure is exactly where the difficulty lies in deriving habits from traditional refueling to charging behavior, as drivers of non-alternative-fuel vehicles are used to being able to refuel almost anytime and anywhere. Considering that the installation of charging infrastructure is still under construction, the convenience of charging locations was more important for the adaptation process than the price [
16]. In particular, as drivers refilled their vehicles more often on the way than near home, one practical implication referred to the optimization of (charging) location, such as in high-traffic sectors, in order to facilitate the changeover [
16]. This confirms previous findings which show that the use of BEV is particularly visible in metropolitan areas [
19]. However, with regard to the widespread use and acceptance of electric mobility, [
19] argue to showcase public charging infrastructure stronger in general (e.g., also in other, more distant locations).
Overall, differences between users’ charging and refueling behavior demonstrate that user habits might not be transferred one-to-one to other driving contexts and vehicle technologies—also because different user groups (e.g., purchasers and owners of cars with ICE and BEV) seem to differ as regards socio-psychological as well as socio-demographic profiles and thus need to be addressed individually [
19,
20]. Against the background of limited charging infrastructure and range, further research is needed to identify user requirements and characteristics in dealing with specific applications and usage situations, such as of critical range.
2.2. Users’ Perception of Range Stress
With regard to BEV usage, limited range is frequently under discussion as a major challenge for acceptance—in particular, when compared to vehicles with ICE [
21]. In this context, the terms
range anxiety and
range stress are commonly used to describe concerns about getting stranded with a BEV due to a discharged battery [
22,
23]. Regarding the terminology, range anxiety and range stress are often considered in close connection, due to conceptual overlaps [
24].
According to [
25], range anxiety is associated with the uncertainty of an unknown situation, expectations of potential consequences, and (dis)trust perceptions e.g., in the information provided by the charge-level display. In particular, the fear of not reaching the target destination due to insufficient range was discovered as a key element attributed to range anxiety [
26]. To approach this “feeling of fear” in more detail, further studies included range stress as a predictive factor in the conceptual framework of range anxiety [
21]. Range stress was found to be more strongly connected to the actual user experience in a certain driving situation [
23], which is also the focus of the present study. In line with [
21], we understand range stress as the “perceived discrepancy between available and preferred resources” in a range situation that causes drivers’ discomfort and stress.
In this study, the focus is on the participants’ cognitive and emotional perceptions of range stress (see
Section 4), which offers great potential to identify user demands and usage barriers to increase the acceptance of BEV in the long term.
Previously conducted field trials indicated that BEV users are not as sensitive to range stress as might be expected [
27]. On the one hand, this was attributed to the avoidance of critical range situations as a prevention strategy. On the other hand, it was assumed that the range resources available satisfied users’ mobility needs, so that range situations perceived as stressful did not occur [
27]. However, when unavoidably confronted with limited range while driving, Rauh et al. [
21] found symptomatic range stressors, such as frequent charge-level display checks, in particular with BEV novices. Considering the early period of BEV usage as particularly challenging to the adaptation process, Franke et al. [
28] examined individual differences in experienced range stress as a basis for practical implications. In particular, system trust and route familiarity revealed lower range stress levels [
28]. Additionally, personality traits (e.g., control beliefs), technical knowledge, as well as the general ability to handle uncertainty influenced the coping of limited range settings [
24,
27,
28]. As range stress is related to BEV acceptance [
9,
23], further research is needed, especially with regard to demands of future user groups, as previous research is mainly limited to users who have already made the switch to electric drives.
User-centered studies revealed that comprehensible and informative charge-level displays, but also the system’s reliability and trustworthiness gain positive effects [
23,
28,
29] in compensating range stress as negative contributions to the adaptation process. In addition, BEV users should be provided with relevant knowledge and range competence, such as strategies to drive with low battery consumption [
21,
30]. In this context, research also indicated significant effects of driving experience and training on users’ range stress perception [
21,
30], which will be examined in more detail below.
Table A1 in the appendix gives an overview of relevant preliminary works and findings in the context of drivers’ range stress in BEV usage.
2.3. Effects of Driving Experience and Training
Whether users perceive range situations to be stressful is determined by external (e.g., system settings) and internal (e.g., personality traits) factors. Particularly, driving experience and training are decisive factors for range stress. Rauh et al. [
21] showed that BEV driving experience positively affected the perception and handling of limited range, users’ self-confidence, and control beliefs in driving situations where the remaining range was less than the set distance. Overall, experienced drivers have less range stress compared to inexperienced drivers [
21]. The positive impact of practical experience was also shown: [
23], for example, reported that range stress decreased with the total distance driven in a three-month trial. Günther et al. [
30] assumed that the teaching of eco-driving strategies in theory leads to improved driving behavior in practice through enhanced certainty and knowledge. Within BEV test drives—in which experienced BEV drivers, trained non-BEV drivers, and untrained non-BEV drivers were compared—driving experience as well as pre-drive eco-driving training had positive effects on both users’ driving behavior in critical range situations and BEV acceptance [
30].
Furthermore, [
9] showed that practical experience in BEV driving increased users’ range satisfaction over time, which was related to the acceptance of BEVs, including the intention to recommend BEV usage to others. Authors suggested offering practical experience to BEV purchasers, depending on individual mobility needs, before they finally decide on a BEV—to improve range satisfaction and, thus, the adaptation process in advance [
9].
2.4. Research Gap
Research on user and system factors predicting range satisfaction as well as the nature of range stress and coping strategies is well advanced. Thus far, the focus was on the perception and evaluation of critical range situations with regard to active BEV users in field trials, which is necessary to validate the effect of practical experience, for example. However, there is a lack of knowledge concerning the comparison of different driving contexts, range situations, and user groups—for instance, contrasting traditional refueling and drivers of cars with ICE, who might be future BEV users. To better understand the meaning of range stress for different (i.e., active and potential) user groups, the extent to which users perceive limited range as stressful, and also how to derive guidance for practice, further research is needed, which this study responds to as a supplement to the current state of research. In this context, stronger focus should be placed on user diversity effects on acceptance-related criteria, such as users’ trust in their vehicle. Here, alternative methodological approaches are needed, as scenario-based quantitative study designs, to validate previously obtained research results, e.g., from field study trials, in larger sample sizes. By comparing the needs and demands of future users with experienced BEV, the results contribute to a deeper understanding of range stress related determinants in order to facilitate the overall access of BEV.
3. Questions Addressed
Based on the state of research and the gaps in knowledge identified, the following research questions will be addressed in the current paper:
How do e-vehicle drivers and users of vehicles with internal combustion engines differ with regard to their range stress perceptions and how is this influenced by the respective driving experience? In order to be able to classify the range stress of BEV users, comparability with ICE users must first be made possible. In this context, it is useful to take the results of [
31] and exemplarily validate the underlying personality traits with both user groups.
How do trust in the vehicle and in the fuel and battery level displays influence range stress and what are underlying factors? Trust in a car or in technology in general has a decisive influence on how people behave with it [
32]. For a better understanding of range stress, it is necessary to understand the influence of trust in the different information on range and filling level provided by the vehicle.
To what extent can range stress be predicted on the basis of user and vehicle characteristics? To model the refueling or charging behaviour in the spatial planning of charging infrastructure, the data basis is usually limited to local statistical data since attitudes or trust values cannot be empirically collected in every region. A prediction of range stress based on user and vehicle characteristics only would allow for defining user profiles for the modelling [
33].
Although initial models for range stress among e-vehicle users exist, we chose an exploratory research approach, for two reasons. On the one hand, there are still relatively large gaps in knowledge in predicting range stress for both ICE and BEV users. Thus, to formulate and test specific structural behavioural models was not appropriate yet. On the other hand, still, only small portions of BEV users are available in Germany in comparison to ICE drivers. Therefore, we could not rely on the availability of a large sample in the BEV group. Therefore, we aimed at an exploratory approach, with validated independent factors (driver or car related variables) and range stress as a dependent variable. This procedure allows (a) a comparison of BEV and ICE users with respect to perceptions of range stress and (b) an analysis of which user factors impact the drivers’ perception. Still, we formulate some general hypotheses which will also be tested in the following:
Hypothesis 1 (H1). Technology commitment and range stress are negatively related: The higher the technical commitment, the lower the range stress.
Hypothesis 2 (H2). As the willingness to take risks increases, the range stress decreases.
Hypothesis 3 (H3). There is a correlation between the number and type of information available in the vehicle on fill level and range and the trust in the displays.
Hypothesis 4 (H4). The higher the trust in the vehicle and its displays, the lower the range stress.
Hypotheses 1 and 2 are based on results from [
31] and [
27,
28] and are intended to confirm earlier results with a more heterogeneous sample in terms of driving experience. In contrast, Hypothesis 3 was derived from findings on the influence of information and feedback provided on eco-driving behaviour [
34,
35] and Hypothesis 4 again from [
28]. Both should serve to assess the influence of the vehicle on range stress, as e-vehicles are often more modern at present and provide the driver with more information on the state of charge (SoC) and the remaining range.
4. Methodology
Subsequently, we present the methodical approach to answering the research questions before we address the collection and processing of data.
4.1. Questionnaire Design
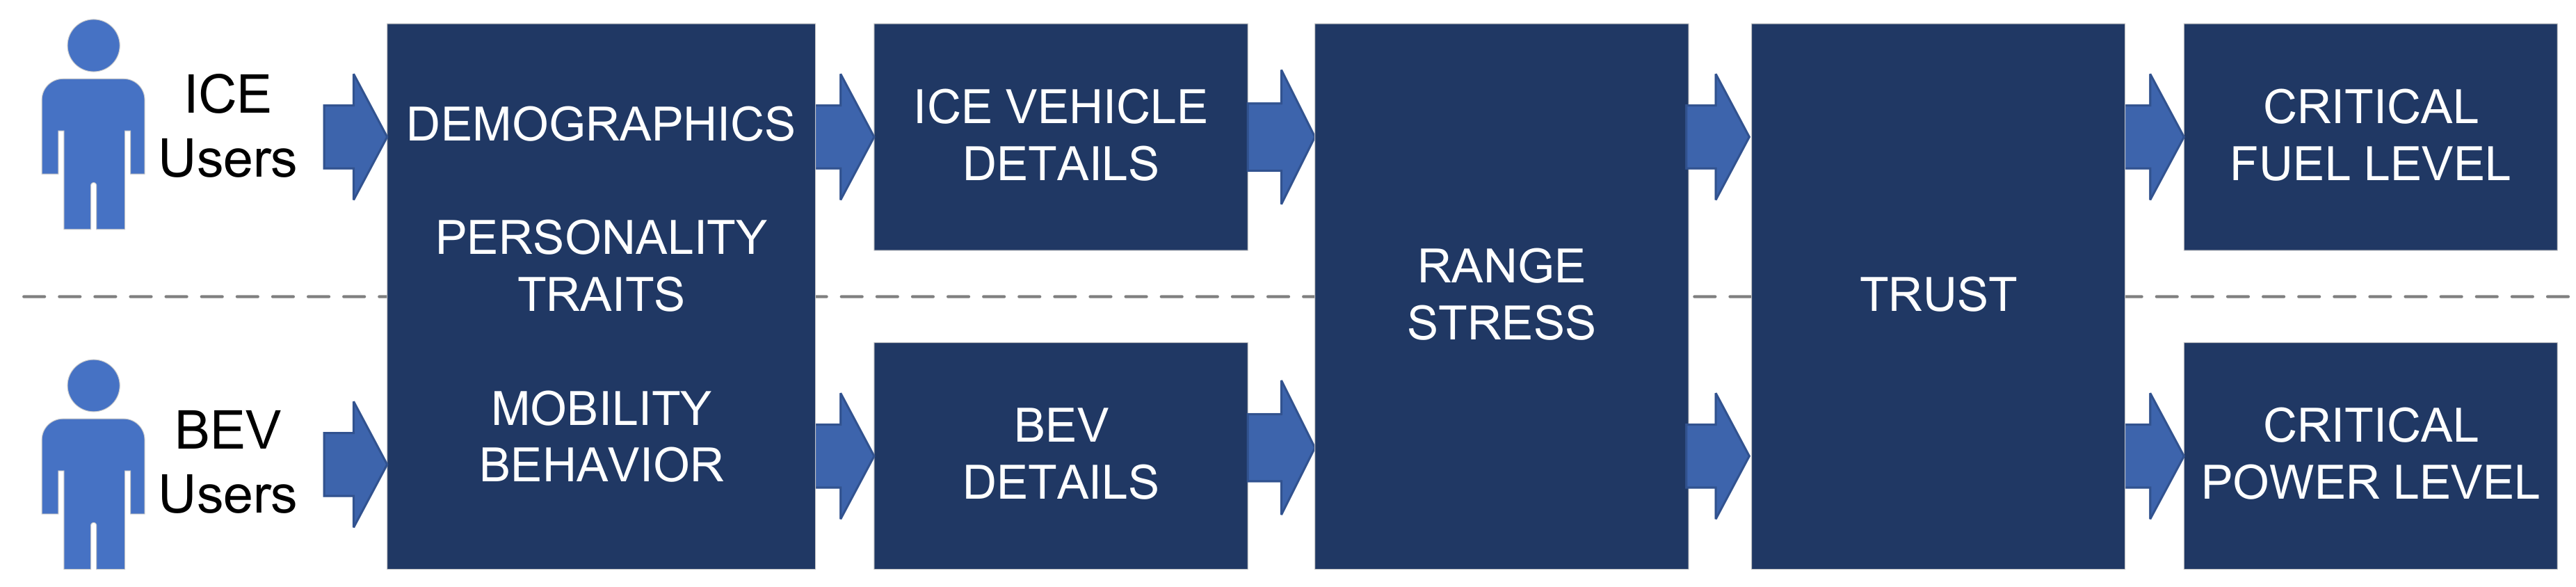
The questionnaire developed contained three main thematic blocks:
Demographics and Personality Traits
First, demographic data of the participants were collected, such as age, gender, level of education, but also further information on household size and income, place of residence and occupation. With regard to personality traits of the participants, risk attitudes and technical commitment were surveyed.
Mobility Behavior
The next questionnaire block dealt with the participants’ mobility behaviour. This included information on driving license and car ownership, use of means of transport, and annual mileage. In addition, data on the used cars were queried, e.g., vehicle classes, maximum ranges, type of tank or battery indicators, or, in the case of e-vehicles, the available connector types.
Range Stress and Trust
In the last block of the questionnaire, range stress and trust requirements were questioned. On the one hand, perceived stress factors were asked for and levels of tanks or batteries that were regarded as the limit to feeling uncomfortable. On the other hand, the individual trust of the users in the vehicles and in their displays regarding available ranges and the current fill level was surveyed.
The experimental setup was based on a basic between-group design: The questions were adapted for e-vehicle users and drivers of vehicles with combustion engines. The adaptation essentially only included wording changes, such as the adaptive use of “battery” or “tank”. However, a few questions were exclusive to one of the two groups mentioned, such as for e-vehicle users the question regarding the connector types of the vehicles used. An overview of the questionnaire structure can be found in
Figure 1.
4.1.1. Scales and Level of Measurement
As a basis for the operationalisation of range stress, six items based on [
21] were adapted and used to assess both cognitive and emotional levels of stress (see
Table A2). These items were supplemented with six completely new items, which, in addition to the fear of a breakdown of the vehicle, related to self-efficacy in estimating range. A complete overview of the new items is given in
Table 1.
To measure the participants’ risk attitudes, the domain-specific risk-taking (DOSPERT) scale from [
36] was used, which distinguishes between risk perception, and risk taking. Since the individual dimensions of the DOSPERT scale, focusing on
ethical,
financial,
health/safety,
recreational, and
social risks, do not fit to the current driving context, the general willingness to take risks independent from context was additionally surveyed using the short scale by [
37]. In addition to risk attitude, technology commitment was assessed by means of the scale of [
38] with its dimensions
technology acceptance,
technology self-efficacy, and
technology locus of control.
In contrast, new items were used to measure trust in the car and the tank/battery display. For all items, only Likert response formats ranging from min = 0 (e.g., “
no agreement”) to max = 5 (e.g., “
full agreement”) were applied. For measuring the critical filling level that is perceived by the participants as the limit to discomfort, the scale from [
15] was used. Where applicable, question blocks or the items within a block were presented in random order.
4.1.2. Defining Experience Groups
In order to enable group comparisons with regard to experience in handling BEV and ICE vehicles, criteria for experience levels were derived. Particularly with regard to the question of when a user is to be regarded as a novice and when as an experienced driver, there is no uniform picture in science, legal framework conditions or, for example, in the case of tariff classes of car insurance. This work took the legal framework in Germany as a basis that requires an experienced accompanying person who must hold a driving licence for at least five years to accompany drivers under 18 years of age [
39]. Therefore, the cut-off between ICE novices and ICE experienced drivers was set at five years driving license possession. Due to the fact that there are currently no novice drivers who have learned to drive exclusively with e-vehicles, and due to the age structure of the current adopter group [
40], this classification criterion could not be applied for e-vehicle users likewise. For the classification of BEV experience, a two-year electric vehicle use was therefore defined as a limit in order to ensure that each BEV user to be regarded as experienced has experienced all seasons electrically driving at least twice, since the changing temperature conditions influence the respective maximum ranges [
41].
4.2. Data Acquisition
The study was implemented as an online questionnaire. Participants were acquired in German thematic online forums focusing on automotive mobility in general and BEVs in particular. Since the focus of this study was on the internal measurement of individual variables, differences and correlations, the focus in the acquisition of participants was not on the representativeness of absolute values for a population, but on a high variance of the examined user characteristics. Among other things, this also affects the ranges of the electric vehicle models used, since earlier pilot studies often considered only one specific vehicle type at a time.
The study took place in June and July 2018. Screening criteria for participation were the possession of a car driving license as well as at least occasional car use. Furthermore, drivers of hybrid vehicles were excluded from the analysis. Participation was voluntary and there was no form of reimbursement for time and effort.
4.3. Data Processing and Analysis
The collected data set was first evaluated and cleaned up with regard to its quality. Dropouts and responses with inconsistent answering patterns were excluded as well as were sorted out based on unrealistically fast response times.
The data was analyzed descriptively as well as by means of parametric and non-parametric inferential statistical methods (depending on scales and data distributions. For pairwise comparisons (post-hoc tests), the Bonferroni correction or the Dwass–Steel–Critchlow–Fligner (DSCF) method were used, depending on applicability. The level of significance was set to . Partial Eta-square, Cohen’s d, Phi coefficients, and Epsilon-square were used to measure effect sizes for group comparisons, if applicable.
Cronbach’s coefficient
was calculated to determine the reliability of multi-item scales, which was at least satisfactory for all scales, such as for
technology commitment (
),
risk taking (
), and
risk perception (
). The general
willingness to take risks [
37] was strongly correlated with the dimensions of the DOSPERT scale, which is why no separate report is provided in the remaining paper, even though the scale was included in all calculations for control purposes.
To identify the expected different dimensions of range stress, an explorative factor analysis with oblimin rotation was used. The analysis resulted in a model with four factors: Stress by a general low fill level of tank or battery (STRFIL, ), stress by a range that is insufficient to reach the destination (STRIRA, ), stress by a low self-efficacy in estimating the range in terms of bad self-assessment capabilities (STRSAR, ), and stress by fearing the breakdown of the car (STRBRD, ).
5. Sample
In total, the responses of
participants were included in the analysis. In addition, 69.1% (
) of the participants were male and 31.9% female (
). The average age was 41.2 years (
), with the youngest participant 18 years of age and the oldest 84 years. Overall, the sample was slightly younger than the German population’s average of 44.3 years [
42].
The participants had a relatively high level of education: 61.2% () had a university degree and 29.9% () a high-school diploma. The remaining participants had other secondary school qualifications. The participants resided in almost equal proportions in inner cities (33.7%, ), suburbs (38.6%, ) and rural areas (27.7%, ). The average household size was 2.7 people (). The most common house type was the one- or two-family house (65.5%, ). The median of the average net household income per month amounted to 4000 to 5000 €.
In line with the screening criteria, all participants held a car driving license. Furthermore, 85.3% (
) of the participants owned a car of their own, while the remaining used, for example, company cars or car-sharing services. More than half of the respondents stated they used the car on a daily basis (
, 54.5%), followed by multiple times per week (
, 25.5%). The annual mileage was relatively equally distributed, with a peak at 10,000 to 15,000 kilometers (see
Table 2). With regard to the fuel or charging indicators in the vehicles used, 78.4% (
) had a display of the estimated remaining range, 13.7% (
) a display of the filling level in liters or kWh, and 11.8% (
) a display of the filling level in percent.
In addition, 134 () participants drove a vehicle with a combustion engine, while 70 () used a battery electric vehicle. The ICE users stated an average range of 695 km () for their vehicles, while the BEVs showed an expected lower range of 261 km () on average. Furthermore, 52 (74.2%) of the BEVs were capable of fast-charging.
Experience Groups
As explained in
Section 4.1.2, four experience groups were distinguished. The largest group was made up of ICE experienced drivers with a little over 100 participants, while the other three groups were about the same size, each with about 30 participants (see
Table 3).
A closer look at the groups showed that there was a gender difference. While there was still a surplus of women among ICE novices, this already tilts among the ICE experienced and leads to a male share of more than 95% among the BEV drivers. This difference was significant with
,
,
. Furthermore, age also increased with increasing experience level (
,
,
). While the average age of BEV users corresponds to the typical age of the early adopter group [
40,
43], ICE users in this study were comparatively young. Therefore, the educational qualifications also differ significantly (
,
,
), since, in particular, ICE novices, i.e., also driving licence beginners, cannot yet be at an age that makes university degrees possible. As was also expected, the net household income of ICE novices was low compared to the other groups (
,
,
). In terms of place of residence, BEV users in the sample were more likely to come from suburbs and rural areas, while ICE drivers were more likely to live in inner cities and suburbs (
,
,
), mirroring previous findings [
15].
Regarding mobility, differences between the groups were revealed. First, and as per definition, ICE novices possessed a driving license for only a few years, while the other three groups did not differ significantly. The overall effect of the experience group was nevertheless significant (, , ). The low annual mileage is also typical for beginners. Furthermore, both BEV groups had a significantly higher mileage than the ICE users (, , ). Concerning the maximum range of the vehicles, the difference between ICE and BEV users (, , ) also occurred. As expected, the maximum possible range of the ICE vehicles was on average 2.5 times higher than that of the BEVs.
With regard to the tank and battery level information provided by the vehicles, there were significant differences between the groups, both in the display of the remaining range (, , ) and in the display of the fill level in percent (, , ). It was noticeable that none of the ICE vehicles displayed a percentage level, but at least 60%, respectively 75%, give information about the remaining range. For the BEVs, almost all vehicles indicated the remaining range, over 50% the concrete level in percent, and some an indication of remaining kilowatt hours (kWh).
6. Results
In the following, the differences between the individual experience groups with regard to the perceived range stress, the filling levels perceived as critical, and the trust in the vehicle and the tank/battery indicator are presented. Subsequently, the focus is on the relationships between these factors, as well as on the influence of risk taking and technology commitment on range stress. Finally, the prediction of range stress is made on the basis of user characteristics.
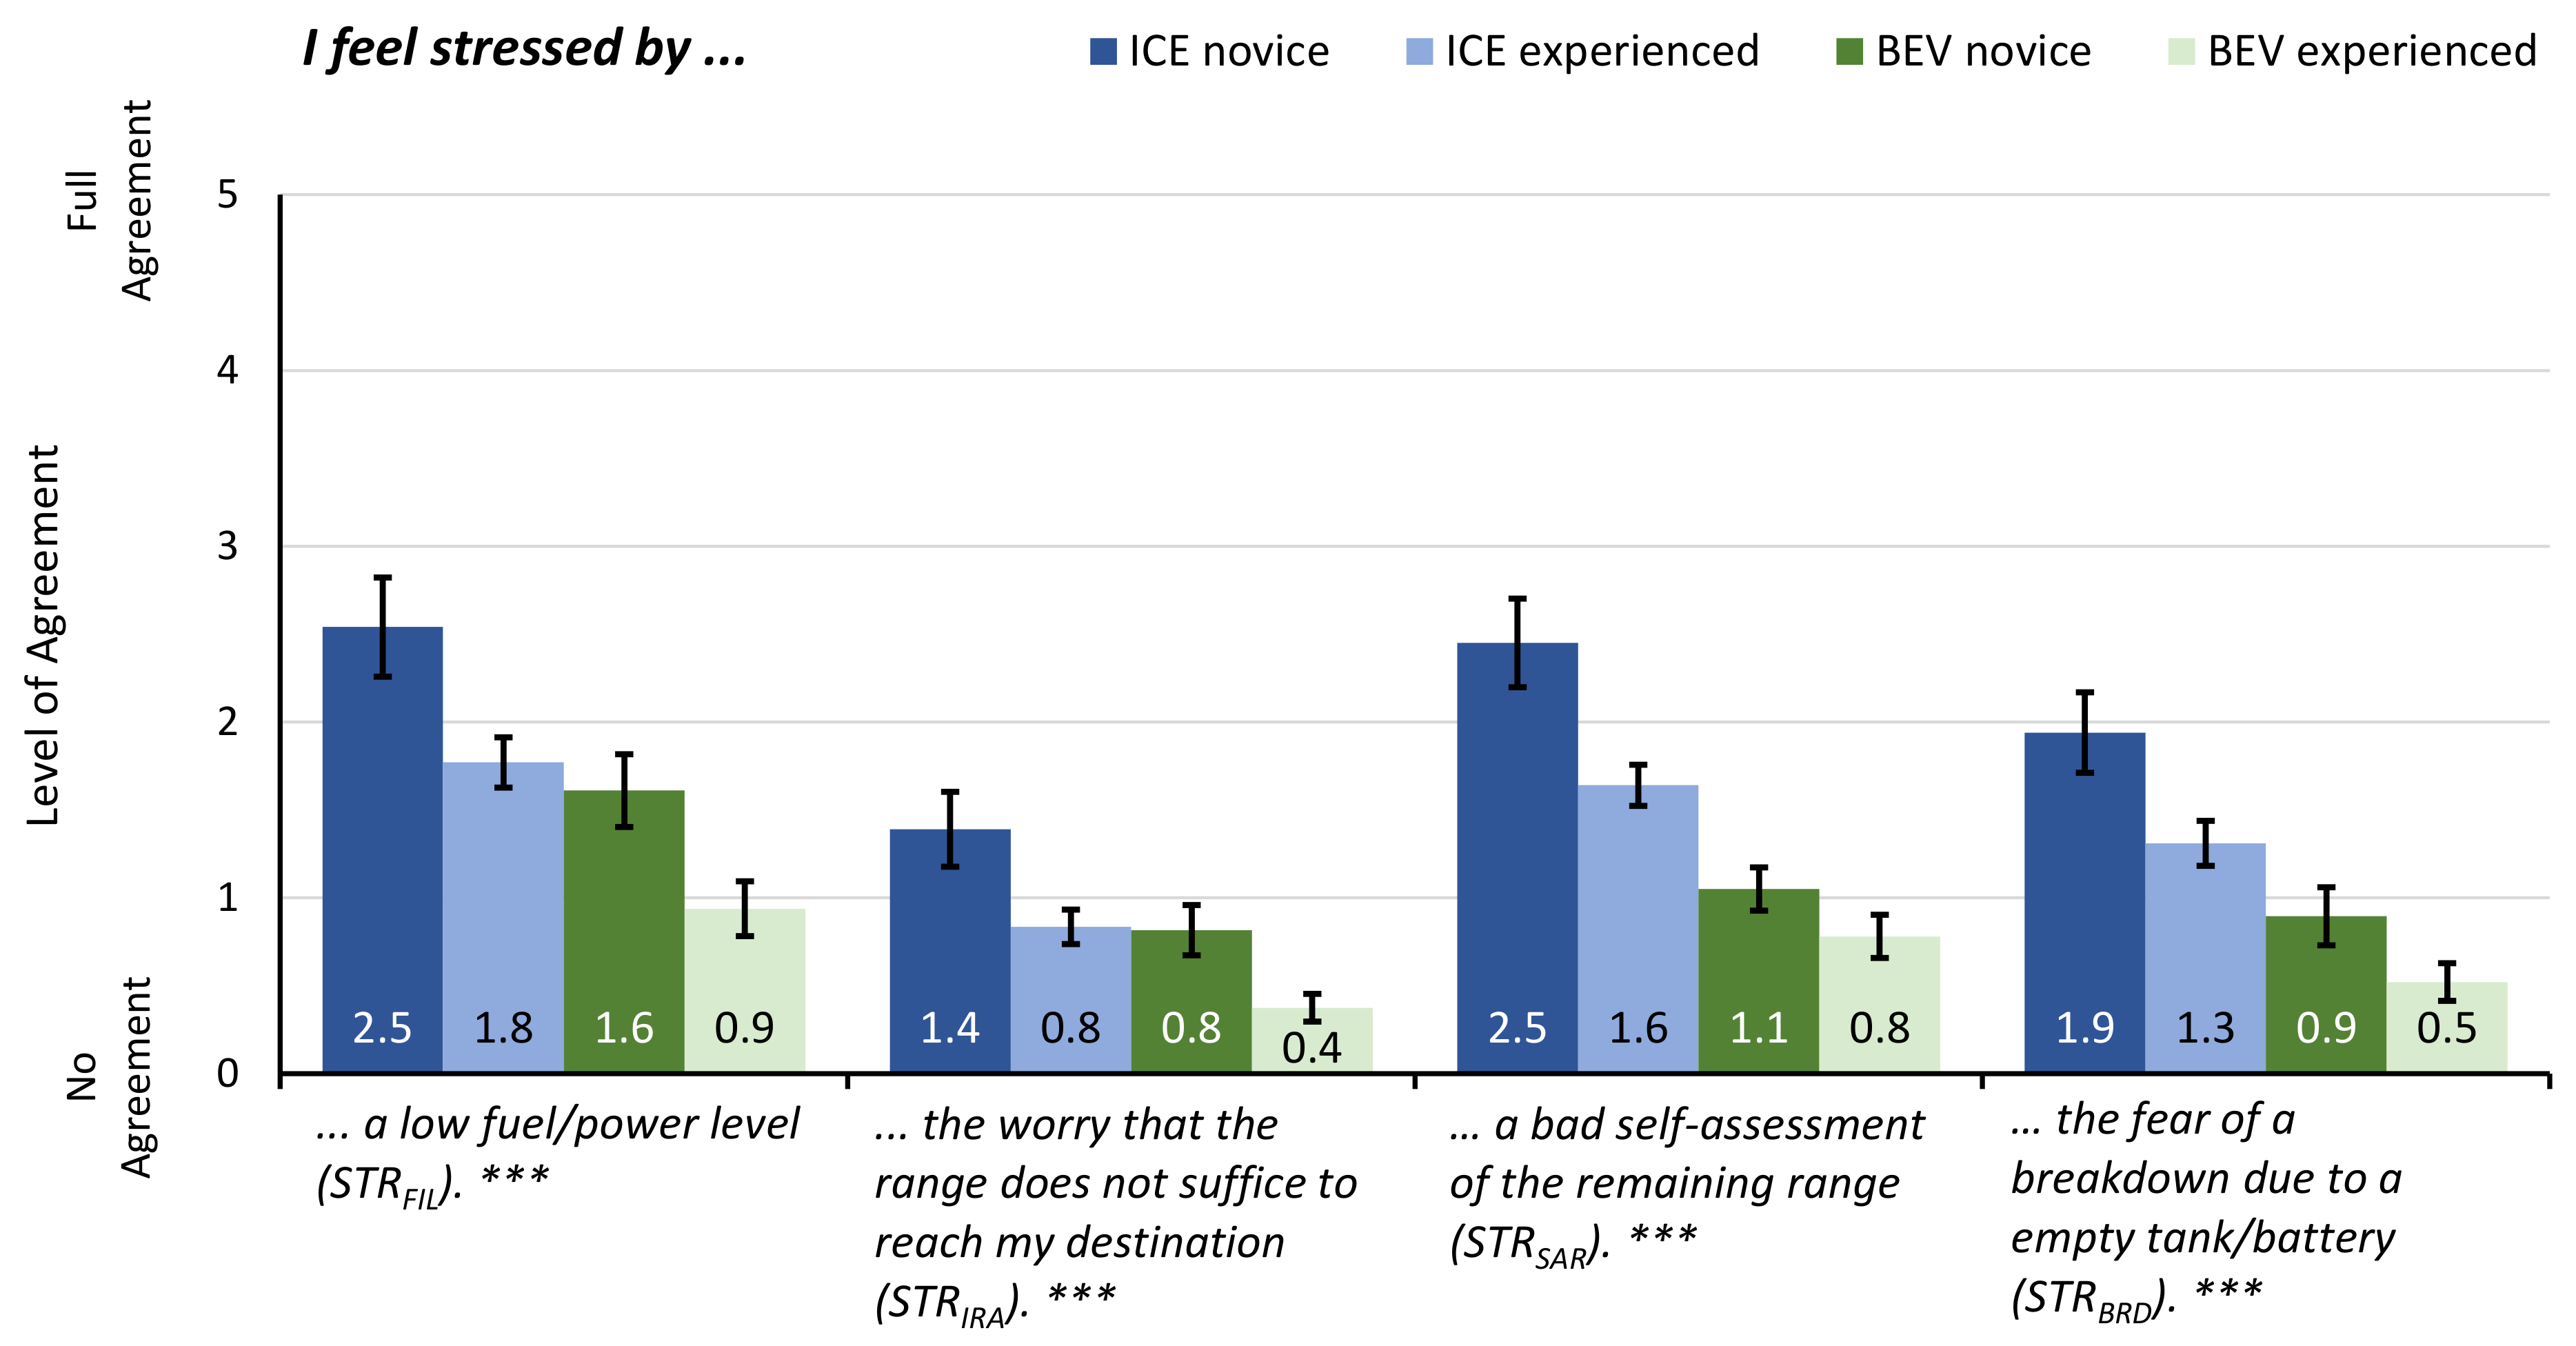
6.1. Perceived Range Stress
Figure 2 shows the participants’ average agreement with the four stress factors studied. A similar picture emerges for all factors: stress is highest among ICE novices and decreases among ICE experienced drivers, BEV novices through to BEV experienced drivers. In absolute terms, however, the stress levels are comparatively low. Even with ICE novices, the values of some stress factors reached the middle of the scale at most.
A significant effect of the experience group could be observed for the stress caused by a low fill level (, , ), for the stress caused by an insufficient range to reach the target (, , ), for the stress caused by a poor self-assessment of the available range (, , ), as well as for the stress caused by the fear of a breakdown of the vehicle (, , ). When comparing the individual experience groups pairwise, it is noticeable for all stress factors that the ICE novices differ significantly from all groups in the sense of higher average stress levels ( for all pairwise comparisons). In contrast, e.g., ICE experienced users differ significantly from BEV novices only with regard to one factor: ICE experienced drivers had significantly higher stress levels based on poor self-assessments of reach than BEV novices (). The BEV experienced users, however, never differed significantly from the BEV novices, but from both ICE user groups for all stress factors ( for all pairwise comparisons).
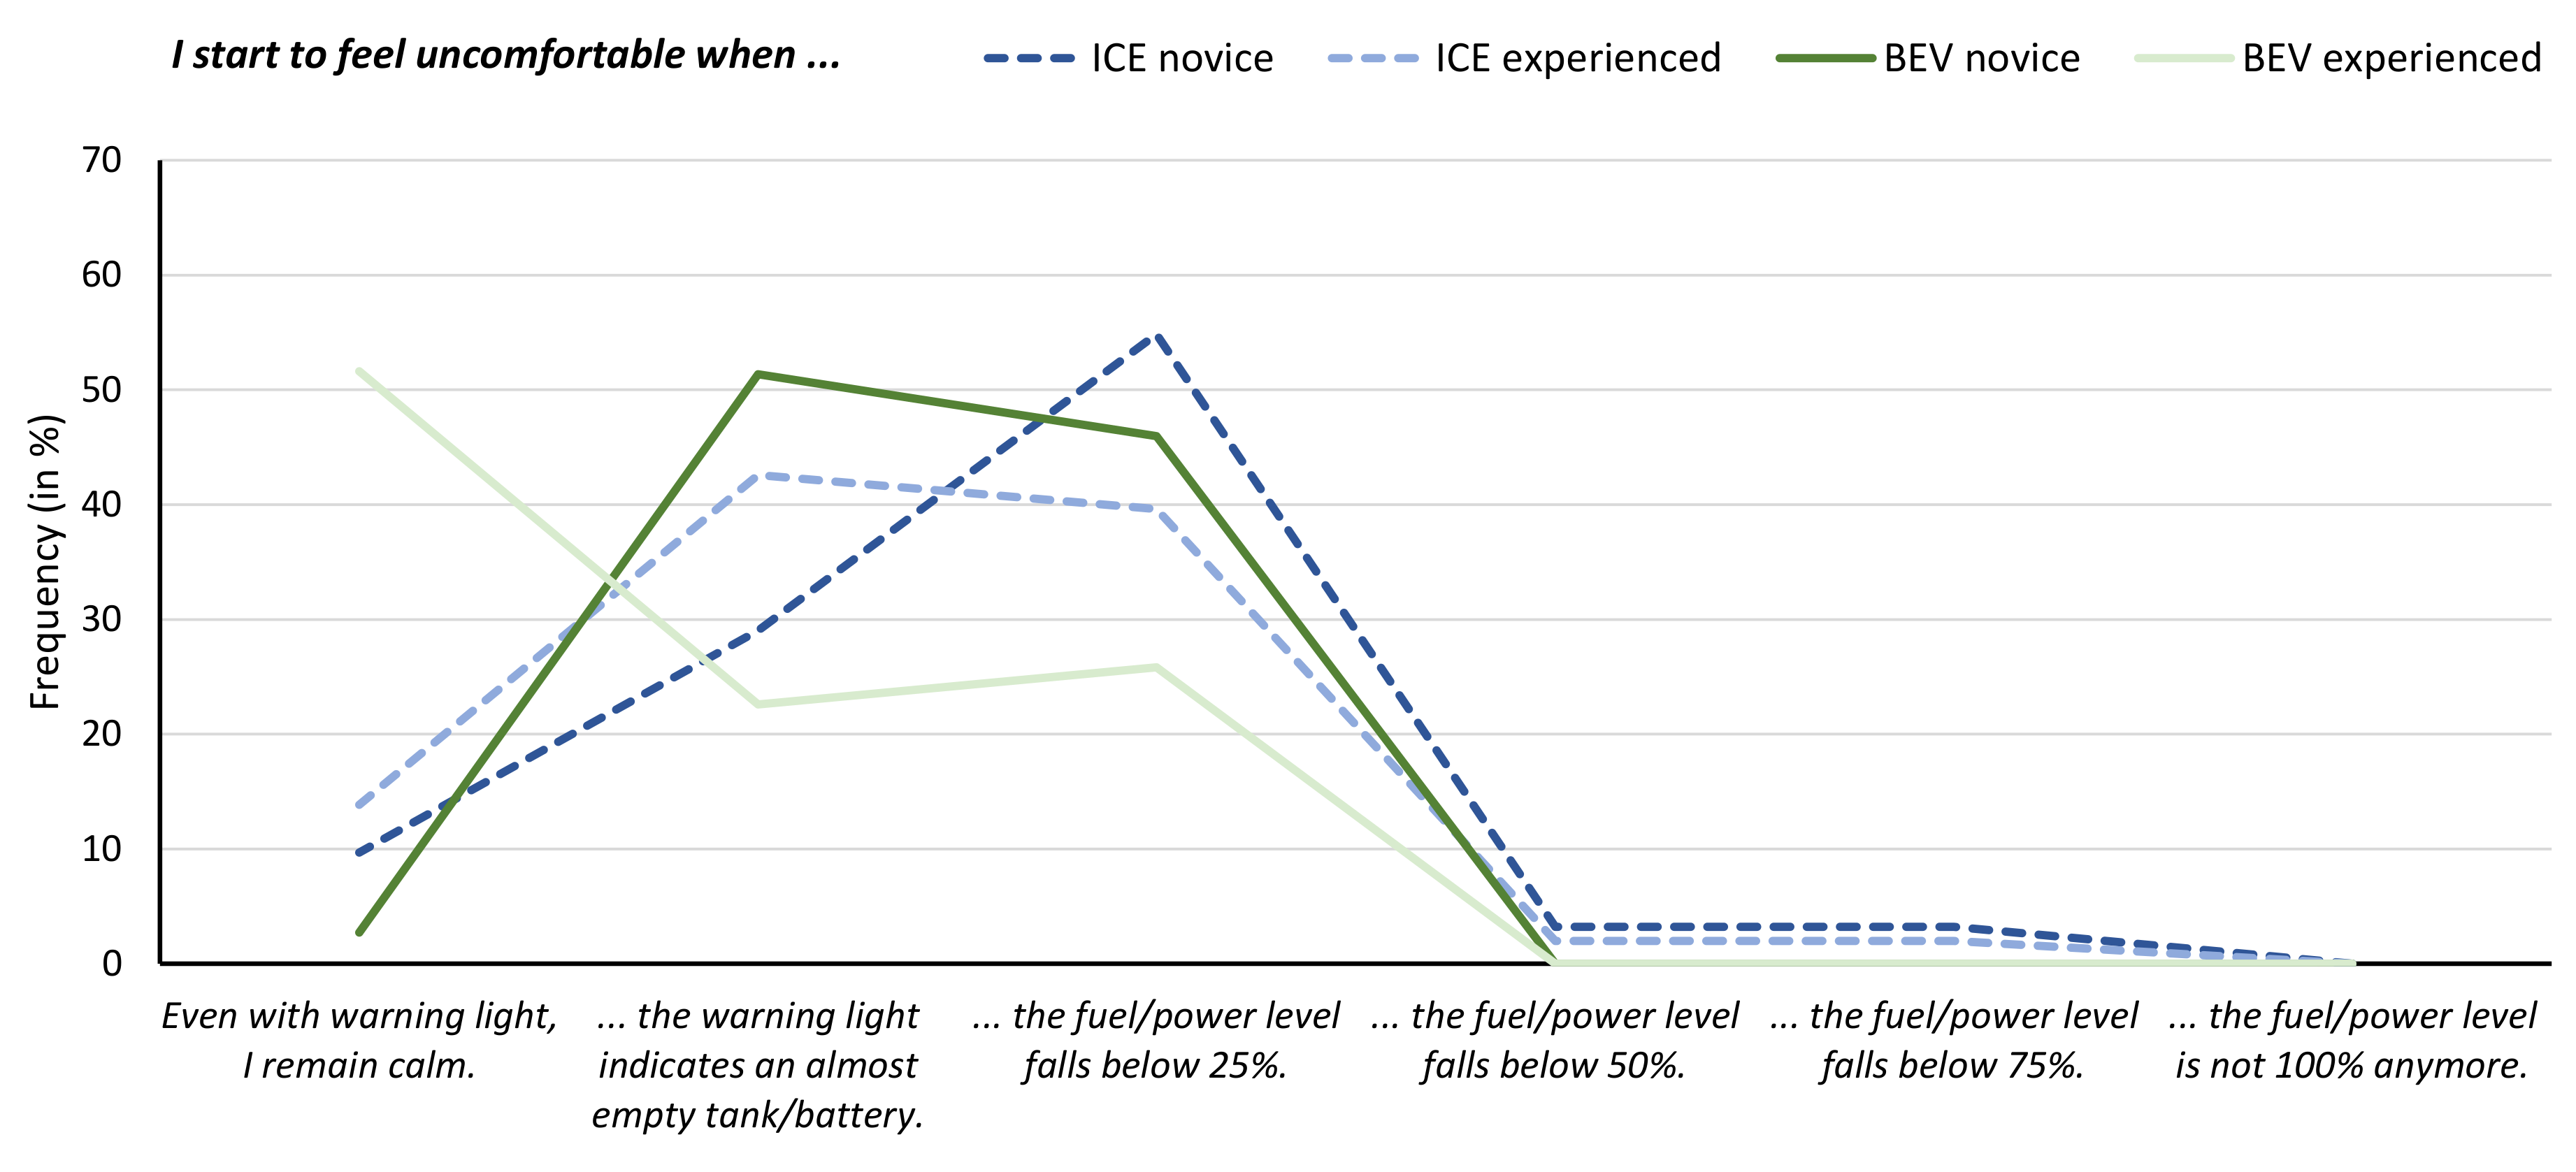
6.2. Critical Fuel/Power Levels
In addition to the stress factors, the level of fuel or power, which is perceived as critical, can also be relevant for the refueling or charging behaviour. As can be seen in
Figure 3, all experience groups remained calm even at a tank or battery level of 50%. Only below this did users begin to feel uncomfortable and differentiate. Looking at the relative frequencies, it became apparent that most ICE novices started already thinking about refuelling when the filling level fell below 25%. For ICE experienced drivers and BEV novices, in contrast, the peak of the relative frequencies was found at an activated warning light as a time for the onset of discomfort. For BEV experienced users, an absolute majority even remains calm in case of a low filling level that is already highlighted by the warning light.
Overall, the differences in the perception of the critical filling level between the experience groups were significant (, , ). However, pairwise comparisons revealed that only BEV experienced drivers differed significantly from all other groups with regard to the critical level ( for all pairwise comparisons). Experienced BEV drivers felt uncomfortable and started thinking about recharging at significantly lower fill levels. No statistically significant differences were found between the remaining groups.
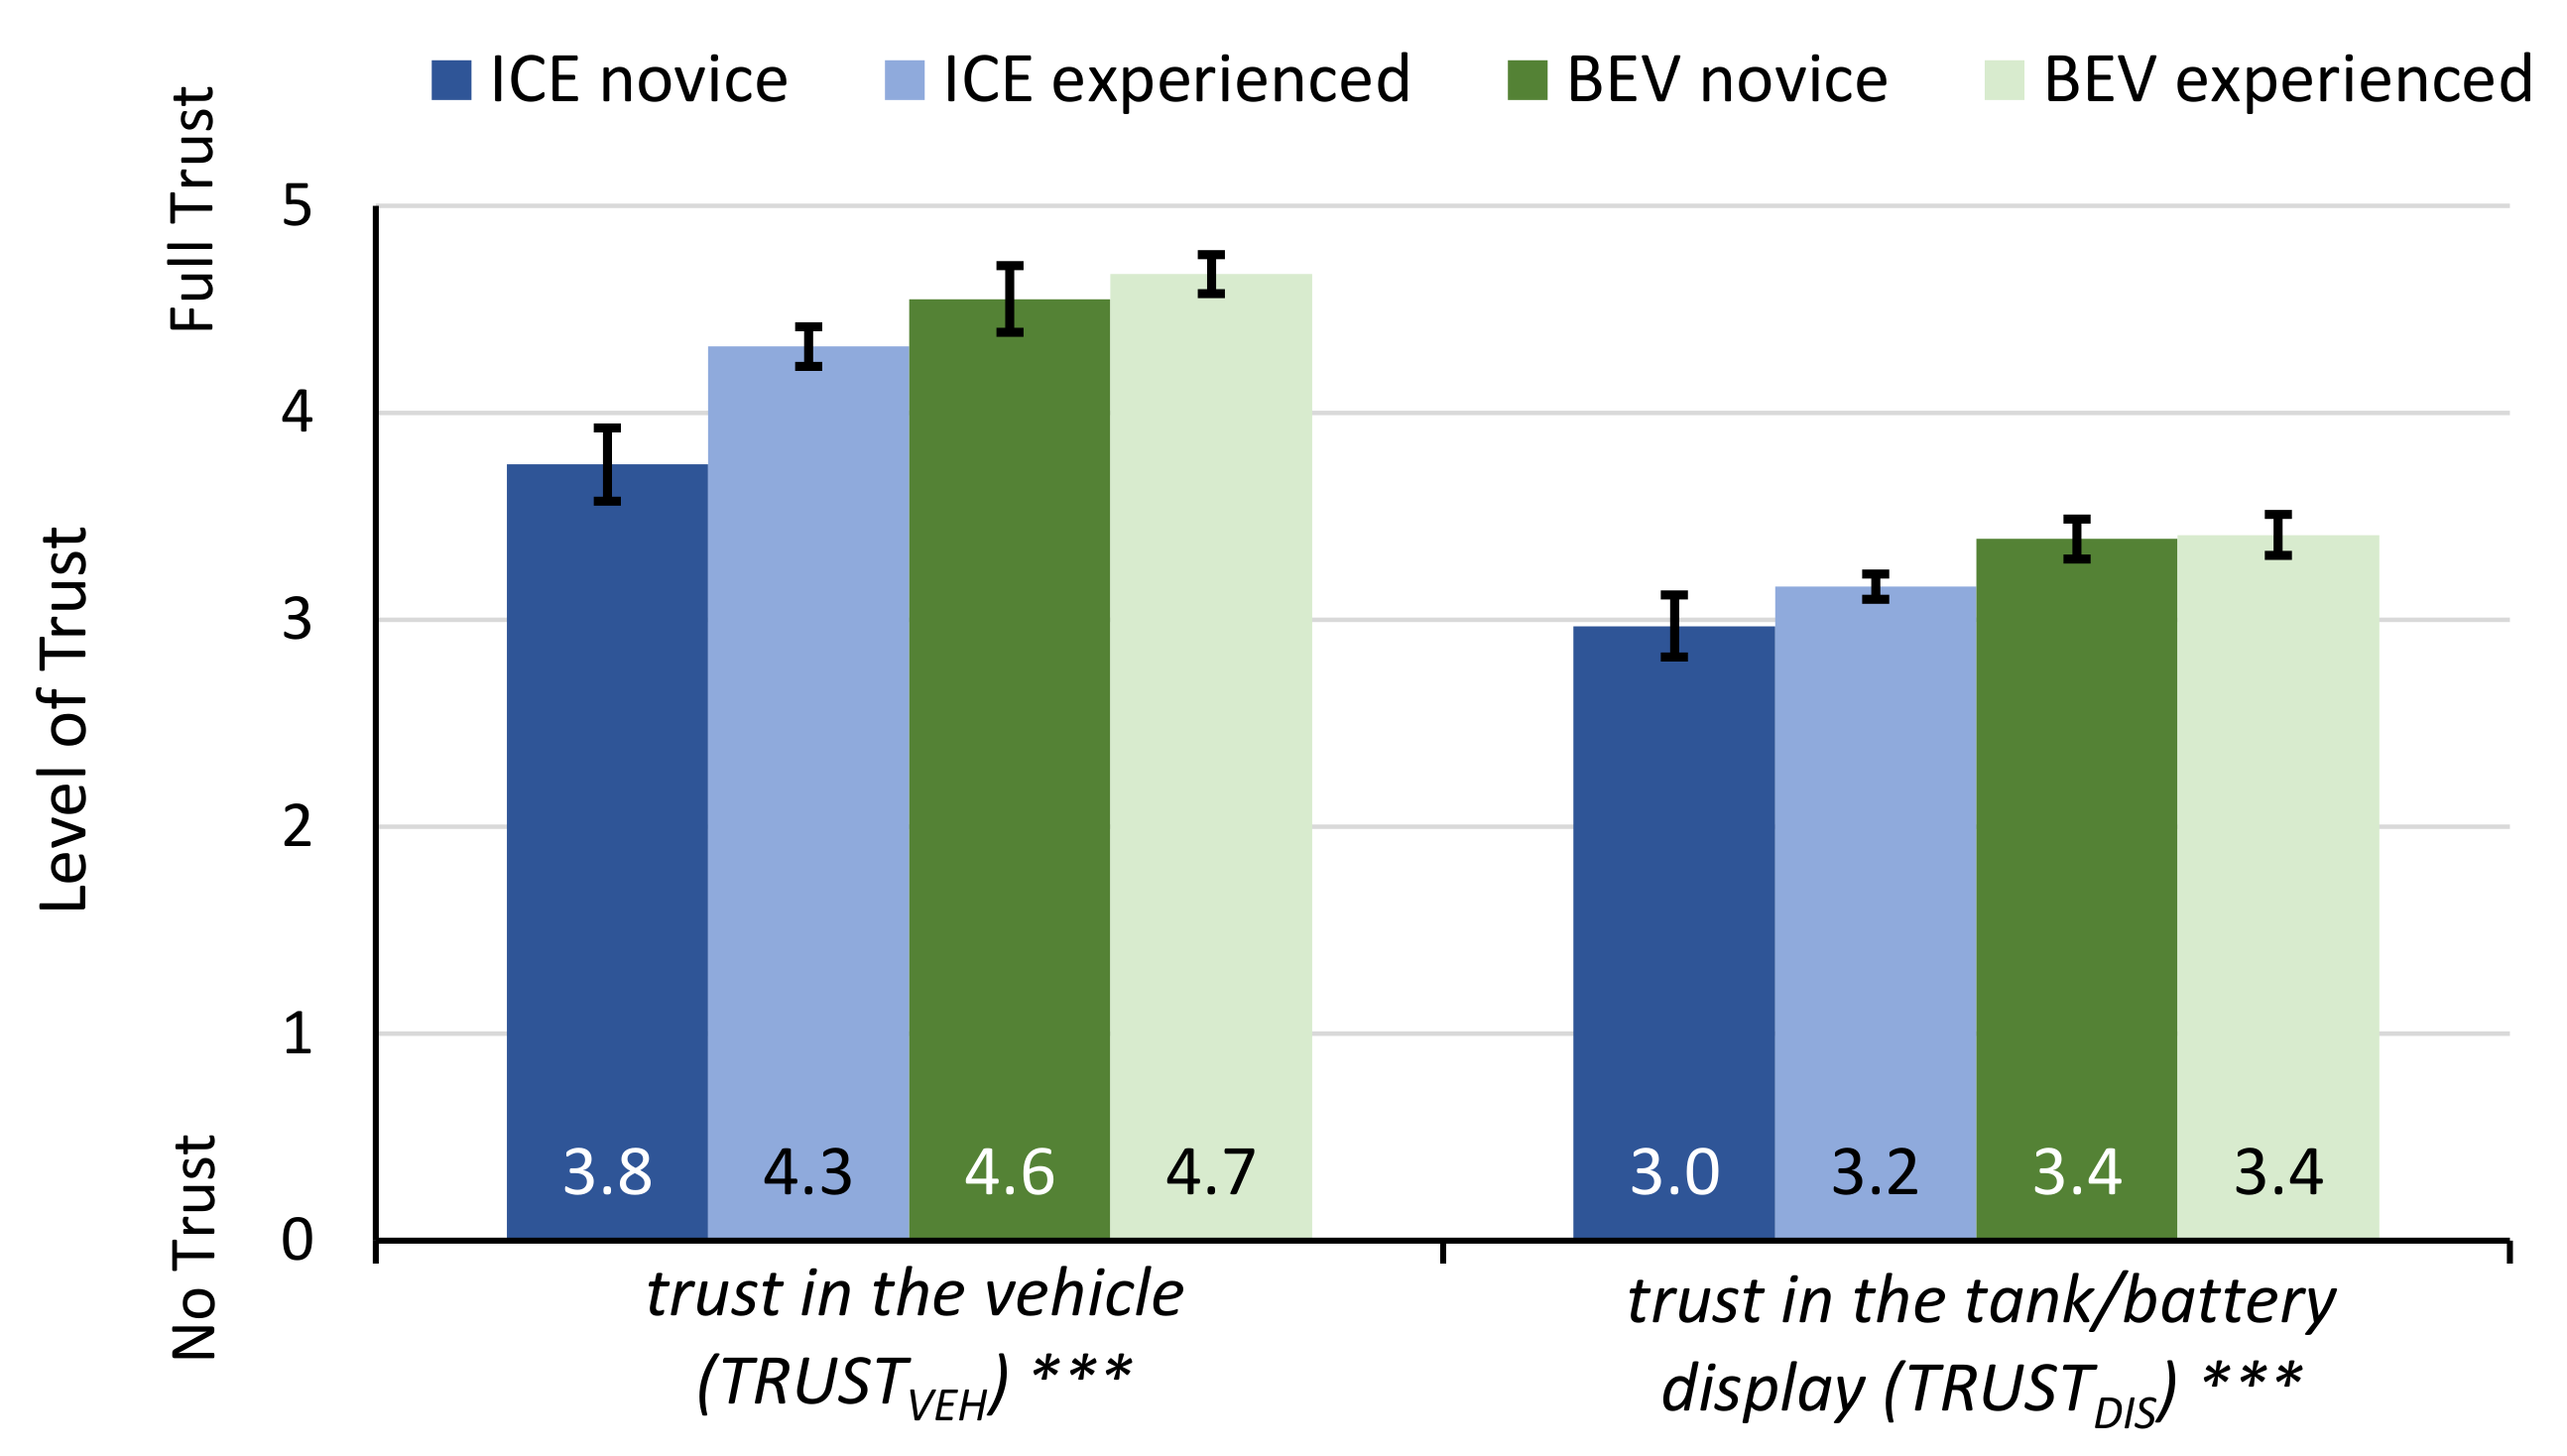
6.3. Trust in the Vehicle and the Tank/Battery Display
When looking at the trust in the vehicle and the tank/battery displays, the picture already known from the range stress emerges again: the absolute trust values increase from ICE novices to BEV experienced ones (see
Figure 4). It is also noticeable, however, that the trust in the vehicle was particularly high among the participants in all experience groups, with values of almost 4 to almost 5 out of 5 points max. In addition, with regard to the displays, trust can be stated for all groups. Although the average values here were lower, between 3 and 3.4 points, they were still above the center of the scale.
For both assessed trust values, an effect of the experience group could be found: The groups differed significantly with regard to trust in the vehicle (, , ) and in the displays (, , ), even though the effect sizes, as can be seen from the differences in the mean values, were rather small in both cases. Pairwise comparisons of all experience groups showed that only the group of ICE novices was primarily responsible for these differences. In terms of trust in the vehicle, this group differed significantly from all others ( for all pairwise comparisons), while the other three groups did not differ from each other. These three groups also did not differ significantly with regard to trust in the tank/battery display. The difference, however, was that ICE novices differed significantly from BEV users ( for both comparisons) but not from ICE experienced drivers.
6.4. Interrelations between Trust, Stress-Related Factors, and Vehicle Displays
In addition to the influence of the experience groups, the relationships between the range stress related factors will be analyzed in the following. As can be seen in
Table 4, there are significant correlations between all factors. As expected, there are significant positive correlations between all stress factors (
for all correlations). With increasing stress levels of one factor, e.g., fear of a vehicle breakdown, the other stress factors also increase and vice versa. The same applies to the level of the tank or battery, which is perceived as critical. The lower the level, the lower the stress levels (
for correlations with all stress factors) and vice versa.
A reversed picture emerges when considering trust. In general, trust in the vehicle and in the tank/battery display is significantly negatively correlated with all stress factors and the critical fill level ( for all correlations). Higher trust is accompanied by less stress and lower critical levels. The strongest correlations are found for trust in the displays and fear of vehicle breakdown—the greater the trust, the lower the fear—and for trust in the vehicle and stress by self-assessment of range—the greater the trust, the less stress caused by poor range assessment.
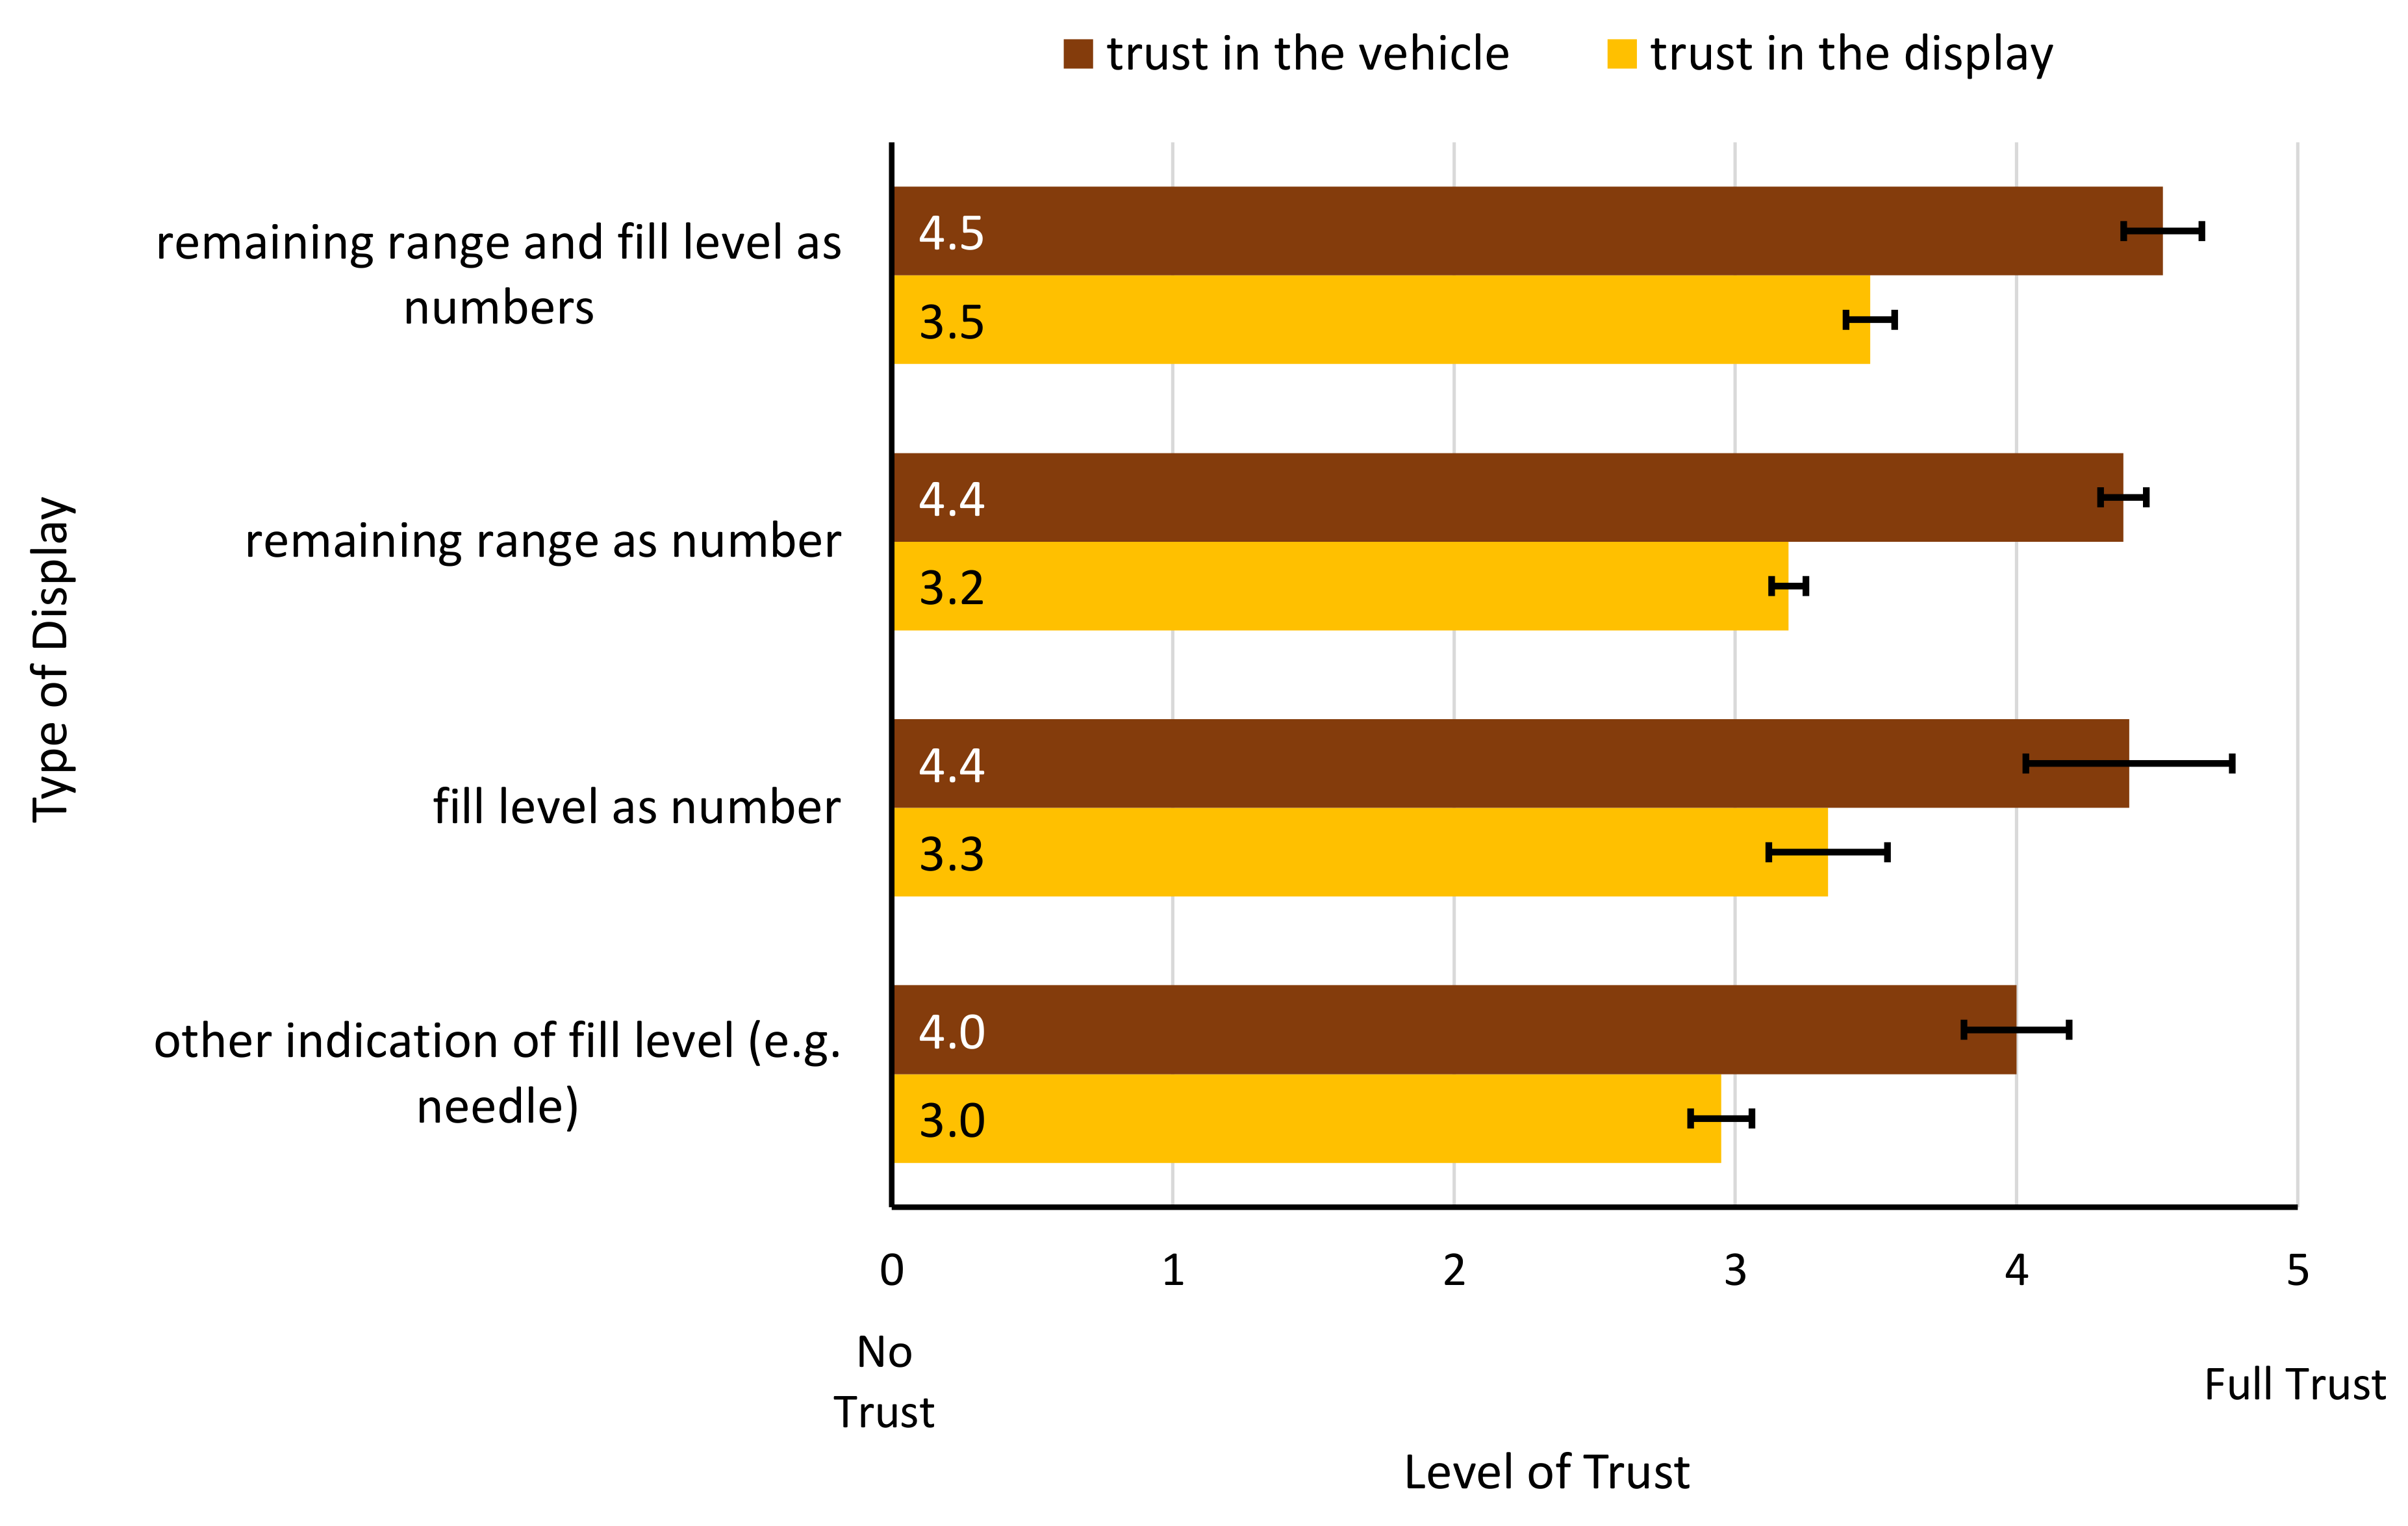
Looking at the effects of the type of information provided by the vehicle, it can be seen that there is no significant difference of trust in the vehicle as a whole (
) but for trust in the tank or battery display (
,
,
). In line with the small effect size, however, this difference only exists between a different type of representation of the fill level (e.g., classical needles) and the combined display of both remaining range and fill level as numbers (
). The trust in systems that provide both information is significantly higher than the trust in systems that use other types of indicators. In absolute terms, however, users trust all types of information presentation (see
Figure 5). Furthermore, the type of display has no significant effect on the level of tank or battery perceived as critical (
).
With regard to range stress, the fuel or charging display has only a minor effect. There is no significant difference between the perceived stress due to an insufficient remaining range and the stress due to a generally low fuel or power level depending on the information presentation. In contrast, for the perceived stress from a incorrect self-assessment of range (, , ) and the stress from the fear of a breakdown (, , ) there is a significant effect. This, however, is for both cases due to the significant difference between the numerical representation of both range and fill level, on the one hand, and other forms of information representation, on the other ().
6.5. The Influence of Risk Attitude and Technology Commitment on Range Stress
To analyze the effects of the drivers’ technology commitment and attitude towards risks, the dimensions of range stress considered separately in
Section 6.1 were first merged into a single scale by averaging (Cronbach’s
).
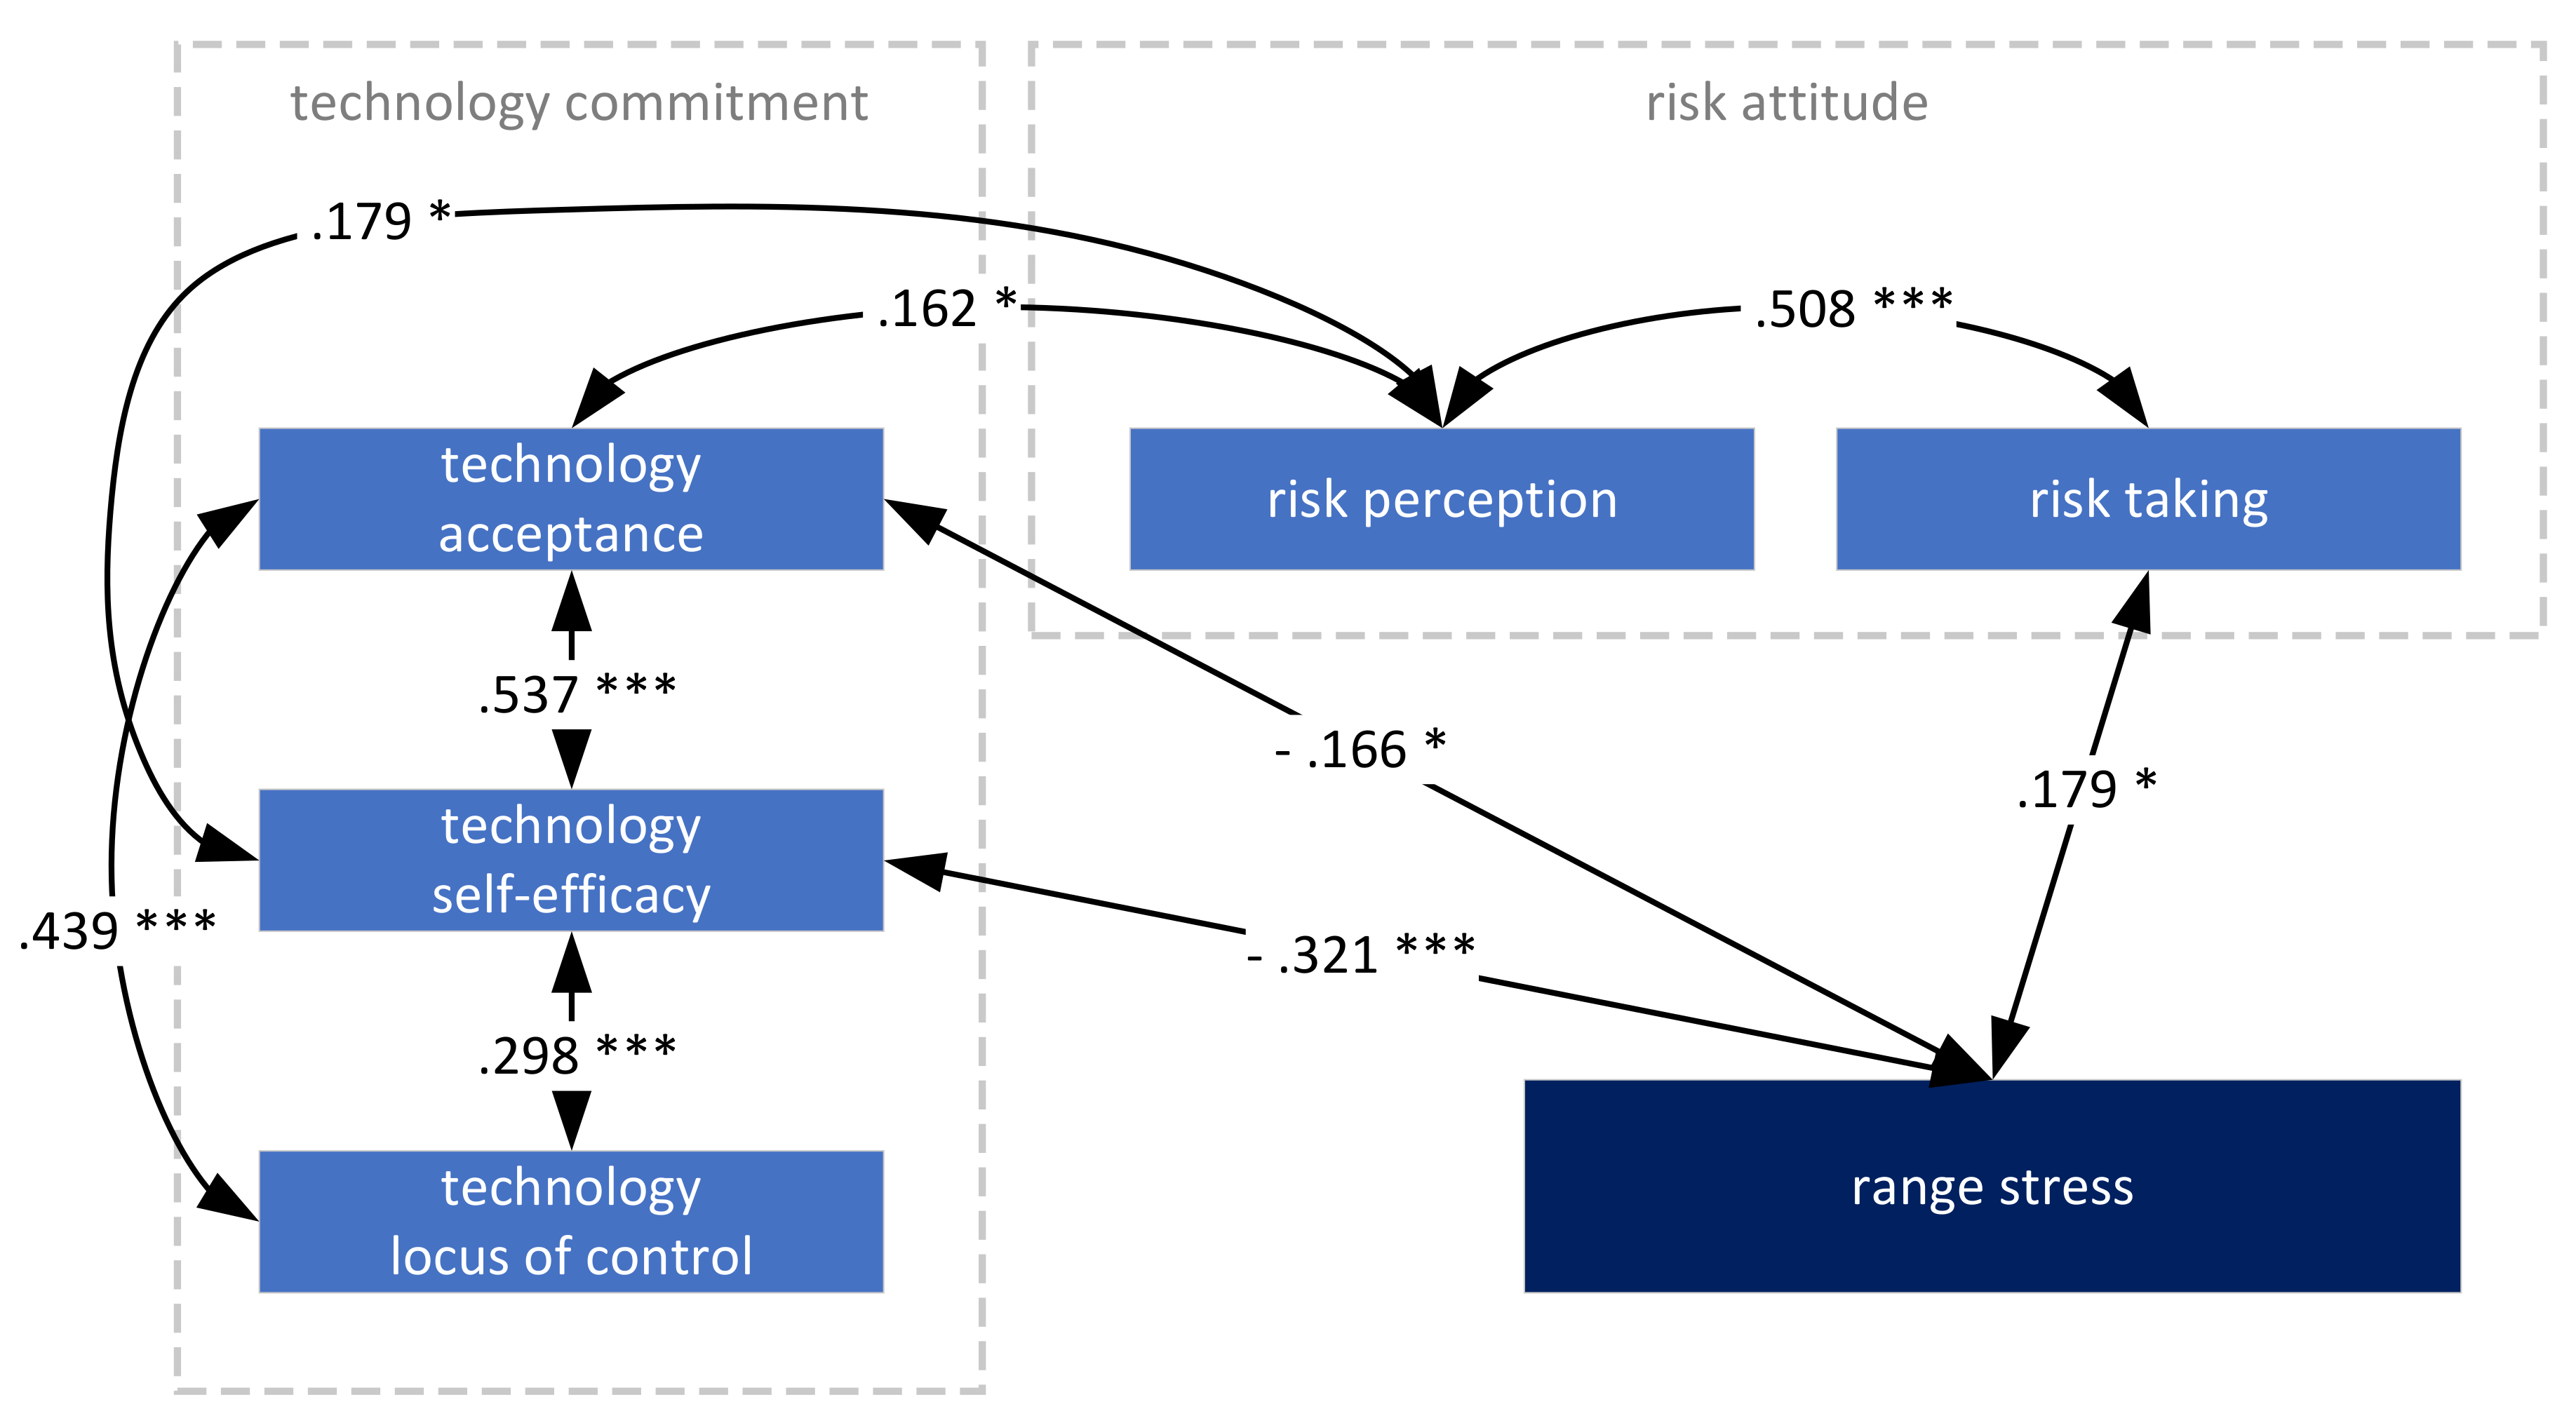
Figure 6 shows that, as expected, the individual dimensions of technology commitment, as well as risk perception and risk attitude correlate positively with each other (
for all correlations). In addition, there were also significant correlations between technology commitment and risk perception: the higher the technology acceptance and the higher the technology self-efficacy, the higher was the risk perception of the users.
With regard to range stress, it was revealed that it correlated negatively with two dimensions of technology commitment: The greater the technology acceptance and the technology self-efficacy of the users, the lower was the perceived range stress. In contrast, a significant positive correlation was found for risk taking behaviour and range stress: With increasing risky behaviour, the range stress also intensified. In addition to the range stress, there was also a significant, albeit weak, negative correlation between willingness to take risks and the critical tank and battery level (, ). The higher the willingness to take risks, the lower the levels that are perceived as boundary to discomfort. In contrast, no significant correlations were found between the critical levels and the dimensions of technology commitment.
6.6. Predicting Range Stress by User and Vehicle Characteristics
A multiple linear regression was applied to predict the perceived range stress using user characteristics. Therefore, demographic data and personality traits surveyed as well as data on mobility behaviour and the vehicles used were analyzed as predictors of range stress. However, only
gender (
),
car ownership (
), and
BEV experience (
) were significant predictors for the model. Notably,
risk taking and
risk perception as well as all dimensions of
technology commitment did not contribute significantly to the prediction (despite the correlations presented in
Section 6.5). With regard to risk, both the individual dimensions and the overall scales were taken into account but could not be included in the model. Concerning the vehicle, neither technical specifications (e.g.,
average range,
car classification, or
type of tank/battery display) nor usage parameters (e.g.,
annual mileage) were predictors either.
The resulting regression model explained a significant proportion of variance in range stress, with adjusted
(
,
). The participants’ predicted range stress on a scale between
and
equals
where
gender is coded as
and
,
car ownership as
and
, and
BEV experience is measured in years, with 0 for ICE users. For a complete overview of the significant predictors, see
Table 5.
If gender as a factor is excluded from the analysis, risk taking becomes significant as a predictor, but this leads to a drop of adjusted to .234 for the model.
7. Discussion
In the following, the results are first discussed and classified with regard to the hypotheses, their significance for the state of research, and the modelling of traffic behaviour.
7.1. The Effects of Personality Traits (H1 and H2)
The first two hypotheses dealt with the influence of personality traits on perceived range stress. First, a significant negative correlation between technology commitment and range stress was determined, which is why hypothesis H1 can be assumed to be correct. Thus, the results reported by [
27,
28] were confirmed for a sample of novice and experienced drivers of both BEVs and ICE vehicles, although the level of correlation was lower in the current study. A less clear picture emerged with regard to risk attitudes on range stress. While for personal risk perceptions no significant correlation with range stress could be found, the opposite was true for risk-taking. However, the direction of the correlation was different than previously assumed in H2. Therefore, the hypothesis must be rejected. The original idea was that people who are willing to take a high risk generally have a greater tolerance for stress and therefore feel less range stress. The fact that the results seem to indicate rather the opposite might be due to the nature and timing of the survey. As discussed in more detail in
Section 8, the data are not perceptions in a concrete driving situation, e.g., induced in an experiment, but a general evaluation across all individual driving situations related to the general handling of the vehicle. The current findings could therefore be an indication that low risk tolerance simply leads to the avoidance of situations where range stress might occur acutely. This assumption is supported by the fact that less risk-averse drivers tend to indicate higher critical tank or battery levels, which could result in increased or at least earlier refill stops, which in turn would lead to fewer situations near the range limits. For a more specific assessment, however, journeys and charge/fuel diaries over longer periods of time would be necessary.
7.2. The Meaning of Information Representation for Trust and Range Stress (H3 and H4)
With regard to hypotheses H3 and H4, the expected outcome was evident. As predicted, increasing trust ensures that the perceived range stress decreases. This applies to both trust in the vehicle as a whole and to trust in the indicators in particular. Therefore, H4 could be confirmed. The results show that, as a vehicle manufacturer, it makes particular sense to invest in the reliability of the fuel and battery indicators, as missing trust in these markers is closely linked to the fear of a vehicle breakdown as a stress factor. Regarding hypothesis H3, the emerging picture is less clear than expected. It was found that the general type of the tank or battery display had an influence on the trust in these displays, as is known, e.g., from eco- driving indicators [
34,
35]. Thus, a clear distinction can be made between modern numerical displays and older display formats, e.g., via tank needles. This can, of course, be taken into account in the user modelling but has only limited influence on user behaviour, since, on the one hand, no influence of the display type was revealed for the critical tank or battery levels, which would possibly have effects on the tank or charging frequencies. On the other hand, one can assume that almost all future cars, no matter whether BEV or ICE based, will at least offer numerical representation forms so that the differences found can essentially serve in the modelling to differentiate between older cars in mixed-traffic scenarios. More interestingly, no difference in trust was found within the numerical representation modes, i.e., whether the remaining range, the current fill level, or both is displayed. This contradicts hypothesis H3, which has to be rejected as a whole (despite the differences regarding the type of display). It can be assumed that the experience with the specific vehicle may also play a greater role here. If one knows how the vehicle behaves, a conversion from level to range and vice versa could also be carried out by the users themselves. However, this assumption cannot be verified on the base of the existing data, since only the general experience with different car types, but not the experience with the concrete vehicles currently in use, was asked for.
7.3. The Myth of Range Stress?
In addition to testing the hypotheses, one of the aims of this work was to elucidate the influence of driving experience on tank and battery levels perceived as critical and on range stress in order to enable a prediction of the latter for different user groups. Regarding the critical level, an effect of the experience group was found. At first glance, this result seems to contradict findings reported in [
15] that did not state any difference between ICE and BEV users in this matter. However, and this might explain the difference, the study mentioned has only compared ICE and BEV users in general, without taking experience into account. In addition, in the present study, only the experienced BEV users expressed significantly lower critical values while BEV novices and ICE users did not differ. Thus, there seems to be no effect of the drive technology as such, which then would be in line with [
15]. It is noticeable that especially the experienced BEV users only start to feel uncomfortable at lower filling levels. Here, habituation effects could possibly play a role: the more frequently users get into situations where they have to make full use of the vehicle’s maximum range, which is likely to be the case more frequently with e-vehicles than with combustion vehicles due to the lower ranges, the more low filling levels lose their anxiety-producing effect.
A comparable picture emerged for the perceived range stress. For all stress factors surveyed, BEV users, especially experienced ones, stated the lowest stress levels. The fact that experience in handling electric vehicles reduces range stress was to be expected on the basis of earlier work [
21]. However, the finding that, firstly, the absolute level of perceived stress was rather low for all groups and stress factors and, secondly, that BEV users even reported lower values than ICE users, raises at least doubts about the persisting relevance of range anxiety for electromobility as novel technology in general and for infrastructure planning in particular. It seems more likely that range stress is a phenomenon that affects drivers of both BEVs and ICE vehicles similarly. However, this seems to be a strong contradiction to numerous studies on range stress of e-vehicle users, as elaborated in the state of research of this paper. In order to allow a better classification of the results, it is worth taking a closer look at the methods of both current and previous work and thereby anticipating
Section 8 with regard to limitations.
In addition, the point in time of the respective research does also account for the findings: Most other research work is based on pilot projects and focuses on the first weeks and months, sometimes only the first contact, of users with e-vehicles [
9]. This high resolution of the observation period cannot be achieved by the current work that rather offers a general long-term view. Especially when using a BEV for the first time, increased range stress is likely, as various studies have shown. On the basis of the results of this paper, the assumption arises that perceived stress might not differ from the first use of ICE cars. However, the comparison of novice ICE and BEV drivers in the first weeks and months of car use is still pending. Furthermore, some work confronted the drivers in experiments with driving situations at the limits of the range in order to trigger range stress [
21,
28]. What is still missing are the same experiments carried out with ICE drivers in order to be able to evaluate the absolute meaning of range stress in concrete driving situations.
To sum up, the theoretical models of range stress and charging behaviour among e-vehicle users, for example by [
27] or [
17], do not lose their validity in light of the results reported here. On the contrary, it can be speculated that those models could also be transferable or extended to the use of ICE vehicles. Nevertheless, the significance of range anxiety in the public debate and the strong focus on range limits within the press and public media should be critically questioned, which, however, does not mean that range does not play a role in the adaptation of electric vehicles. However, the lower possible ranges seem to be perceived as an obstacle by potential users less as a result of (expected) range stress than as a result of a simple consideration and comparison of vehicle capacity.
7.4. Prediction of Range Stress
Finally, the possibility of predicting range stress and thus modelling is discussed. For spatial infrastructure planning, a prediction based only on user characteristics, in the sense of demographic or socio-economic data, and vehicle specifications is particularly relevant, as such information is usually available for concrete geographical areas. Such a predictive model could be identified in the present study, but the explained variance was below 40%, which is not satisfactory. However, it is still unclear whether other manifest characteristics are significant predictors for range stress or whether this is already the best clarification rate that can be achieved based on spatial statistics. Possible factors for future research would be, for example, the age of the vehicle, the duration for which the specific vehicle has already been used or possessed, or the intended use of the car and the associated trip distances.
In addition to the question of whether the vehicle is privately owned or not and BEV experience, gender was a significant predictor and even contributed the highest explanation of variance. The fact that the willingness to take risks becomes a significant predictor for range stress only if the factor gender is excluded from the analysis leads to the assumption that it is not gender per se that influences range stress, but that other underlying factors play a role that may correlate with gender but have not been included in this study. In this context, way-finding behaviors and spatial anxiety could also play a role, since gender-specific differences could already be demonstrated for the latter [
44,
45]. If future studies confirm that gender can be used in mobility contexts as a stable substitute in prediction for certain personality traits, this would be very helpful for infrastructure planning, since gender distributions are usually available for all spatial areas, whereas personality details could at best be surveyed by sampling. This point could become even more important if e-vehicles are used and purchased more frequently by women in the future, which is not the case at present [
18].
8. Limitations
In order to better classify the results, some methodological and conceptual limitations of the approach should be considered. As this study’s results are based on a scenario questionnaire design, physiological and behavioral symptoms related to range stress have not been measured. Hence, follow-up studies should implement empirical-experimental sections to validate the obtained research results for both ICE and BEV users.
Another limitation is the different definition of experience for BEV and ICE users. Because practically no one currently obtains a driving licence using electric vehicles and then continues to use e-vehicles, BEV and ICE user groups are not completely distinct. In contrast, BEV users are currently usually also experienced ICE users. From an experimental point of view, this is not entirely straightforward and it also explains the similarities between ICE experienced users and BEV novices, but a better separation is currently not possible due to a lack of potential participants.
A further limitation that must be taken into account when interpreting the results stems from the characteristics of the sample. A completely balanced sample, which differs in the respective subgroups only in terms of experience, can hardly be achieved at present, as e-vehicle users currently still stand out significantly from other drivers in terms of their user characteristics [
40]. Even with a larger BEV sample, little additional variance, e.g., in socio-demographic factors, can be expected at least at present due to the homogeneity of this special population. There is also no evidence that certain imbalances regarding the current experience groups would have influenced the results to such an extent that they would be relevantly distorted in their meaning. Nevertheless, it would be desirable in a future study to place the results on a broader basis in terms of participant numbers because this would make further methodological approaches beyond the current one possible.
Finally, the study results are restricted to only one country perspective, in this case Germany, which has traditionally a long history with ICE car manufacturing. Future research should therefore validate the findings with drivers of other countries, and cultures to get a full picture of range stress and adoption behaviors for e-vehicle technology.
9. Conclusions and Outlook
The present study showed that drivers of conventional and electric drives differ less than expected in their perception of range. This is initially to be regarded as positive for mobility infrastructure planning because the use of both drive types could be modelled in the same way, at least with regard to the aspects in focus here, and existing assumptions on the use of conventional vehicles could be transferred to the context of electromobility. Especially if current ICE users switch to electric drives, an extreme change of behaviour or settings is not to be expected. Forecasts for future demand scenarios should thus become somewhat simpler and hopefully more reliable. In this context, the future technical development and further expansion of the charging infrastructure should be a focus of research. For example, the decrease in charging duration and the general availability of high-performance charging (HPC) might further level the differences between e-vehicle users and users of vehicles with combustion engines regarding their behavioural patterns. The question of how range extender or plug-in hybrid electric vehicles (PHEV) influence range stress has also not yet been exhaustively researched.
In order to provide a holistic picture of refueling and charging behaviour, for traffic modelling, the next step would now be to combine the many individual parts that have already been researched into a holistic structural equation model. This would allow a broader perspective, as, for example, how likely it is for certain user groups to almost empty a tank or a battery or which frequencies of the refilling processes can be expected. In addition, regional comparisons of the aforementioned questions within Germany or in comparison to other countries with different settlement and transport structures would be useful for the planning of charging infrastructure. Ideally, two variants of models should be considered: first, a complete model which also takes into account underlying personality traits in order to gain a precise understanding of the effect relationships and, second, a model that only associates manifest traits or traits that can be directly deduced from these with the prediction of fueling and charging behavior in order to formulate and qualitatively evaluate predictions based only on available local statistical data. Range stress or anxiety, as well as trust in the vehicles, would be only two of several factors and not the target value to predict.
In addition to the implications for future research, the current paper also provides indications on how the adaptation of e-vehicles can be accompanied by public information and communication concepts. This includes, above all, clearly communicating that range stress, even though currently treated as the black sheep in the media, is much less decisive in practice. Accompanied by best practice examples in which, for example, BEV drivers themselves increasingly have their say, this could counteract irrational fear of range stress laypeople might have. It can be assumed that, with the further spread of e-vehicles, social influence, in addition to one’s own hand-on experience, will contribute to the fact that driving an e-vehicle is not associated with being constantly under pressure due to the shorter range.
Author Contributions
All authors had an active part in writing/preparing the original draft (R.P., T.B., H.B., and M.Z.), whereby the first author is the main person responsible (R.P.). The conceptualization phase was accomplished predominantly by the first author (R.P.) and the second author (T.B.). Data curation, formal analysis, and visualization were mainly accomplished by the first author (R.P.). The third author (H.B.) contributed with project administration and review/editing, while the last author (M.Z.) was responsible for supervision and funding acquisition.
Funding
This research was funded by the German Federal Ministry for Economic Affairs and Energy (Project Cities in Charge, reference no. 01 MZ 18005C).
Acknowledgments
The authors thank all participants for sharing their opinions in a novel technology. Special thanks to Susanne Gohr, Imke Haverkämper, Maike Holle, Lisanne Simons, Chantal Lidynia, and Christin Gatzka for their research assistance. Further thanks go to Regina and David Robert Jones who inspired the paper title.
Conflicts of Interest
The authors declare no conflict of interest.
Ethics Statement
We did not seek ethical approval from the ethics committee, as our study falls in the category where no such approval is necessary in Germany. This category spans all non-invasive, non-clinical research on human subjects, where subjects are transparently informed about the purpose, aim, and risks of the studies and when these risks are reasonably low. Prior to participating in the study, they were informed that it is of high importance to understand free opinions and attitudes on mobility behaviour from the drivers’ perspective and that we were very happy if they would share their opinions with us. Still, however, we stressed that their participation was completely voluntary. The participants were not reimbursed for taking part in the study. Furthermore, we ensured a high standard privacy protection and let the participants know that none of their answers can be referred back to them as persons. Demographic data were also submitted voluntarily and all participants were informed that, on request, their personal data would be deleted from our encrypted hard drives. After these careful explanations, participants reported to feel well informed about the purpose and the aim of the study and their freedom to quit participation at any time. Regarding the privacy policy explanations, the participants reported to understand that high standards were applied and deliberately accepted participation. Participant privacy is a key value that our university has committed itself to uphold. From the comments in the open question fields at the end of the survey, we learnt that those participants were interested in the topic and were keen to look at the results, which we assured them to receive.
Appendix A
Table A1.
Overview of existing relevant literature on range stress with details on research focus and samples.
Table A1.
Overview of existing relevant literature on range stress with details on research focus and samples.
| Author Group | Cultural Setting | Research Focus | User Group(s) | Method |
|---|
| Franke et al., 2017 [9] | Germany | Investigation of factors (practical experience, mobility profiles, coverage of mobility needs, psychological range levels) related to BEV users’ perceived range satisfaction and its relation to BEV acceptance. | BEV users () | Field study |
| Philipsen et al., 2018 [15] | Germany | Comparison of users’ behavior of charging versus traditional refueling with regard to user-specific conditions, frequencies, and critical levels. | BEV users () vs. ICE users () | Questionnaire study |
| Franke & Krems 2013 [17] | Germany | Investigation of psychological dynamics underlying BEV users’ charging behavior, focused on the development of a measurement scale to assess user-battery interaction style (UBIS). | BEV users () | Field study |
| Rauh et al., 2015 [21] | Germany | Comparison of experienced and inexperienced BEV users as regards their perception of range appraisal and range anxiety to investigate the extent to which practical experience reduces range anxiety. | Experienced BEV users () vs. Inexperienced BEV users () | Field study |
| Franke et al., 2016 [23] | Germany | Investigation of factors (frequency of critical range situations, practical experience, coping skills, tolerance of low range, trustworthiness of the range estimation system, collective adaptive capacity) that can protect against everyday range stress (ERS) in BEV usage and its relation to range satisfaction and BEV acceptance. | BEV users () | Field study |
| Nilsson 2011 [25] | Sweden | Exploration of BEV users’ perception of range anxiety, related attributes, affects, and possible reasons. | BEV users () | Interview study |
| Franke et al., 2012 [27] | Germany | Investigation of BEV users’ experience of range stress and perception of comfortable range with regard to stress-buffering personality traits (control beliefs, ambiguity tolerance) and coping skills (subjective range competence, daily range practice). | BEV users () | Field study |
| Franke et al., 2016 [28] | Germany | Investigation of individual differences in BEV users’ experience of range stress in a critical range situation with regard to route familiarity, trust in the range estimation system, system knowledge, subjective range competence, emotional stability, and control beliefs in dealing with technology. | BEV users () | Field study |
| Rau et al., 2015 [29] | Germany | Investigation of BEV users’ experience in critical range situations with regard to stress-inducing and stress-reducing factors as well as stress-reducing strategies to formulate design recommendations, such as for the available range safety buffer. | BEV users () | Field study |
Table A2.
Question items adapted from [
21] to measure stress by a low fill level and by an insufficient range.
Table A2.
Question items adapted from [
21] to measure stress by a low fill level and by an insufficient range.
| Item | Intended Dimension |
|---|
| “When the warning light on the filling gauge lights up, I stay calm.” | stress by low fill level |
| “I feel stressed by a low charge/fuel level.” | stress by low fill level |
| “A low charge/fuel level makes me uncomfortable, so I try to avoid this situation.” | stress by low fill level |
| “While driving I often worry about the charge/fuel level and the resulting remaining range.” | stress by insufficient range |
| “I feel stressed by the remaining range.” | stress by insufficient range |
| “The question of whether I’ll reach my next destination with my charge/fuel level is a source of concern.” | stress by insufficient range |
References
- Sandler, T. Global Challenges: An Approach to Environmental, Political, and Economic Problems; Cambridge University Press: Cambridge, UK, 1997. [Google Scholar] [CrossRef]
- Chapman, L. Transport and climate change: A review. J. Transp. Geogr. 2007, 15, 354–367. [Google Scholar] [CrossRef]
- Ban-Weiss, G.A.; McLaughlin, J.P.; Harley, R.A.; Kean, A.J.; Grosjean, E.; Grosjean, D. Carbonyl and Nitrogen Dioxide Emissions From Gasoline- and Diesel-Powered Motor Vehicles. Environ. Sci. Technol. 2008, 42, 3944–3950. [Google Scholar] [CrossRef] [PubMed]
- Kraftfahrt-Bundesamt. Bestand an Kraftfahrzeugen und Kraftfahrzeuganhängern nach Bundesländern, Fahrzeugklassen und ausgewählten Merkmalen. In Statistische Mitteilungen des Kraftfahrt-Bundesamtes; Kraftfahrt-Bundesamt: Flensburg, Germany, 2018. [Google Scholar]
- Philipsen, R.; Brell, T.; Funke, T.; Brost, W.; Ziefle, M. With a Little Help from My Government—A User Perspective on State Support for Electric Vehicles. In International Conference on Applied Human Factors and Ergonomics; Springer: Cham, Switzerland, 2018; pp. 386–397. [Google Scholar] [CrossRef]
- Ziefle, M.; Beul-Leusmann, S.; Kasugai, K.; Schwalm, M. Public perception and acceptance of electric vehicles: Exploring users’ perceived benefits and drawbacks. In International Conference of Design, User Experience, and Usability; Springer: Cham, Switzerland, 2014; pp. 628–639. [Google Scholar] [CrossRef]
- Biresselioglu, M.E.; Kaplan, M.D.; Yilmaz, B.K. Electric mobility in Europe: A comprehensive review of motivators and barriers in decision-making processes. Transp. Res. Part A Policy Pract. 2018, 109, 1–13. [Google Scholar] [CrossRef]
- Pearre, N.S.; Kempton, W.; Guensler, R.L.; Elango, V.V. Electric vehicles: How much range is required for a day’s driving? Transp. Res. Part C Emerg. Technol. 2011, 19, 1171–1184. [Google Scholar] [CrossRef]
- Franke, T.; Günther, M.; Trantow, M.; Krems, J.F. Does this range suit me? Range satisfaction of battery electric vehicle users. Appl. Ergon. 2017, 65, 191–199. [Google Scholar] [CrossRef] [PubMed]
- Egbue, O.; Long, S. Barriers to widespread adoption of electric vehicles: An analysis of consumer attitudes and perceptions. Energy Policy 2012, 48, 717–729. [Google Scholar] [CrossRef]
- Anderson, J.E.; Böttcher, N.; Kuhnimhof, T. An approach to determine charging infrastructure for one million electric vehicles in Germany. In Proceedings of the Transportation Research Board 2016 Annual Meeting, Washington, DC, USA, 10–14 January 2016. [Google Scholar]
- Sathaye, N.; Kelley, S. An approach for the optimal planning of electric vehicle infrastructure for highway corridors. Transp. Res. Part E Logist. Transp. Rev. 2013, 59, 15–33. [Google Scholar] [CrossRef]
- Brost, W.; Funke, T.; Philipsen, R.; Brell, T.; Ziefle, M. Integrated Model Approach STELLA Method of Site Identification for Charging Infrastructure. IFAC-PapersOnLine 2018, 51, 206–211. [Google Scholar] [CrossRef]
- Philipsen, R.; Schmidt, T.; Van Heek, J.; Ziefle, M. Fast-charging station here, please! User Criteria for Electric Vehicle Fast-charging Locations. Transp. Res. Part F Traffic Psychol. Behav. 2016, 40, 119–129. [Google Scholar] [CrossRef]
- Philipsen, R.; Brell, T.; Brost, W.; Eickels, T.; Ziefle, M. Running on empty—Users’ charging behavior of electric vehicles versus traditional refueling. Transp. Res. Part F Traffic Psychol. Behav. 2018, 59, 475–492. [Google Scholar] [CrossRef]
- Kuby, M. The opposite of ubiquitous: How early adopters of fast-filling alt-fuel vehicles adapt to the sparsity of stations. J. Transp. Geogr. 2019, 75, 46–57. [Google Scholar] [CrossRef]
- Franke, T.; Krems, J.F. Understanding charging behaviour of electric vehicle users. Transp. Res. Part F Traffic Psychol. Behav. 2013, 21, 75–89. [Google Scholar] [CrossRef]
- Plötz, P.; Schneider, U.; Globisch, J.; Dütschke, E. Who will buy electric vehicles? Identifying early adopters in Germany. Transp. Res. Part A Policy Pract. 2014, 67, 96–109. [Google Scholar] [CrossRef]
- Westin, K.; Jansson, J.; Nordlund, A. The importance of socio-demographic characteristics, geographic setting, and attitudes for adoption of electric vehicles in Sweden. Travel Behav. Soc. 2018, 13, 118–127. [Google Scholar] [CrossRef]
- Nayum, A.; Klöckner, C.A.; Mehmetoglu, M. Comparison of socio-psychological characteristics of conventional and battery electric car buyers. Travel Behav. Soc. 2016, 3, 8–20. [Google Scholar] [CrossRef]
- Rauh, N.; Franke, T.; Krems, J.F. Understanding the impact of electric vehicle driving experience on range anxiety. Hum. Factors 2015, 57, 177–187. [Google Scholar] [CrossRef]
- Tate, E.; Harpster, M.O.; Savagian, P.J. The Electrification of the Automobile: From Conventional Hybrid, to Plug-in Hybrids, to Extended-Range Electric Vehicles. SAE Int. J. Passeng. Cars-Electron. Electr. Syst. 2008, 1, 156–166. [Google Scholar] [CrossRef]
- Franke, T.; Rauh, N.; Günther, M.; Trantow, M.; Krems, J.F. Which Factors Can Protect Against Range Stress in Everyday Usage of Battery Electric Vehicles? Toward Enhancing Sustainability of Electric Mobility Systems. Hum. Factors 2016, 58, 13–26. [Google Scholar] [CrossRef]
- Franke, T.; Schmalfuß, F.; Rauh, N. Human Factors and Ergonomics in the Individual Adoption and Use of Electric Vehicles. In Ergonomics and Human Factors for a Sustainable Future; Palgrave Macmillan: Singapore, 2018; pp. 135–160. [Google Scholar] [CrossRef]
- Nilsson, M. Electric Vehicles: An Interview Study Investigating the Phenomenon of Range Anxiety; ELVIRE: Goteborg, Sweden, 2011. [Google Scholar]
- Nilsson, M. Electric Vehicles. The Phenomenon of Range Anxiety; ELVIRE: Goteborg, Sweden, 2011. [Google Scholar]
- Franke, T.; Neumann, I.; Bühler, F.; Cocron, P.; Krems, J.F. Experiencing range in an electric vehicle: Understanding psychological barriers. Appl. Psychol. 2012, 61, 368–391. [Google Scholar] [CrossRef]
- Franke, T.; Rauh, N.; Krems, J.F. Individual differences in BEV drivers’ range stress during first encounter of a critical range situation. Appl. Ergon. 2016, 57, 28–35. [Google Scholar] [CrossRef]
- Rauh, N.; Franke, T.; Krems, J.F. User experience with electric vehicles while driving in a critical range situation—A qualitative approach. IET Intell. Transp. Syst. 2015, 9, 734–739. [Google Scholar] [CrossRef]
- Günther, M.; Rauh, N.; Krems, J.F. How driving experience and consumption related information influences eco-driving with battery electric vehicles—Results from a field study. Transp. Res. Part F Traffic Psychol. Behav. 2019, 62, 435–450. [Google Scholar] [CrossRef]
- Franke, T.; Krems, J.F. Interacting with limited mobility resources: Psychological range levels in electric vehicle use. Transp. Res. Part A Policy Pract. 2013, 48, 109–122. [Google Scholar] [CrossRef]
- Walker, G.; Stanton, N.; Salmon, P. Trust in vehicle technology. Int. J. Veh. Des. 2016, 70, 157–182. [Google Scholar] [CrossRef]
- Brost, W.; Funke, T.; Lembach, M. Spatial Analysis of the Public Transport Accessibility for Modelling the Modal Split in the Context of Site Identification for Charging Infrastructure. Infrastructures 2018, 3, 21. [Google Scholar] [CrossRef]
- McIlroy, R.C.; Stanton, N.A.; Godwin, L.; Wood, A.P. Encouraging eco-driving with visual, auditory, and vibrotactile stimuli. IEEE Trans. Hum.-Mach. Syst. 2017, 47, 661–672. [Google Scholar] [CrossRef]
- Allison, C.K.; Stanton, N.A. Eco-driving: The role of feedback in reducing emissions from everyday driving behaviors. Theor. Issues Ergon. Sci. 2018. [Google Scholar] [CrossRef]
- Weber, E.U.; Blais, A.R.; Betz, N.E. A domain-specific risk-attitude scale: Measuring risk perceptions and risk behaviors. J. Behav. Decis. Mak. 2002, 15, 263–290. [Google Scholar] [CrossRef]
- Beierlein, C.; Kovaleva, A.; Kemper, C.J.; Rammstedt, B. Kurzskala zur Erfassung der Risikobereitschaft (R-1); Technical Report; ZIS—GESIS Leibniz Institute for the Social Sciences: Mannheim, Germany, 2015. [Google Scholar] [CrossRef]
- Neyer, F.J.; Felber, J.; Gebhardt, C. Entwicklung und Validierung einer Kurzskala zur Erfassung von Technikbereitschaft (technology commitment). Diagnostica 2012, 58, 87–99. [Google Scholar] [CrossRef]
- Federal Ministry of Justice and Consumer Protection. Verordnung über die Zulassung von Personen zum Straßenverkehr (Fahrerlaubnis-Verordnung—FeV). 2018. Available online: https://www.gesetze-im-internet.de/fev_2010/__48a.html (accessed on 15 June 2019).
- Trommer, S.; Jarass, J.; Kolarova, V. Early adopters of electric vehicles in Germany unveiled. In Proceedings of the 28th International Electric Vehicle Symposium and Exhibition, Goyang, Korea, 3–6 May 2015. [Google Scholar]
- Han, X.; Ouyang, M.; Lu, L.; Li, J. A comparative study of commercial lithium ion battery cycle life in electric vehicle: Capacity loss estimation. J. Power Sources 2014, 268, 658–669. [Google Scholar] [CrossRef]
- Statistisches Bundesamt. Statistisches Jahrbuch—Deutschland und Internationales, 1st ed.; Statistisches Bundesamt: Wiesbaden, Germany, 2017. [Google Scholar]
- Frenzel, I.; Trommer, S.; Lenz, B.; Jarass, J. Erstnutzer von Elektrofahrzeugen in Deutschland. Nutzerprofile, Anschaffung, Fahrzeugnutzung; Technical Report; Deutsches Zentrum für Luft- und Raumfahrt e.V.: Köln, Germany, 2015. [Google Scholar]
- Schmitz, S. Gender differences in acquisition of environmental knowledge related to wayfinding behavior, spatial anxiety and self-estimated environmental competencies. Sex Roles 1999, 41, 71–93. [Google Scholar] [CrossRef]
- Lawton, C.A. Gender, spatial abilities, and wayfinding. In Handbook of Gender Research in Psychology; Springer: New York, NY, USA, 2010; pp. 317–341. [Google Scholar] [CrossRef]
© 2019 by the authors. Licensee MDPI, Basel, Switzerland. This article is an open access article distributed under the terms and conditions of the Creative Commons Attribution (CC BY) license (http://creativecommons.org/licenses/by/4.0/).


