An Analysis of Consumer Incentives in Support of Electric Vehicle Uptake: An Australian Case Study


Abstract
:1. Introduction
- The provision of incentives positively influences the likelihood that private motor vehicle customers will buy an EV the next time they buy a car.
- There is a relationship between provision of information about current model EVs and the likelihood to buy; people who receive information are more likely to buy an EV than those who do not.
2. Methods
2.1. Questionnaires
2.2. Data Analysis Techniques
3. Results and Discussion
3.1. Impact of Variables on the Likelihood to Buy an EV
3.2. Exposure to EVs, Travel Profiles and Preferred Vehicle Fuel Sources
Fear of the car running out of energy before one could get to an electricity source for recharging particularly in busy traffic and/or on a motorway, harbour tunnel or harbour bridge where there are hefty fines for running out of ‘juice’.(Respondent 21, Questionnaire 2, Q10)
3.3. Barriers to EV Purchase
3.4. Incentives Increasing the Likelihood of EV Adoption
3.5. Access to Information: Impact on Preferences
3.6. Implications of the Results
4. Conclusions
Supplementary Materials
Author Contributions
Funding
Acknowledgments
Conflicts of Interest
Nomenclature/Acronyms
| AUD | Australian Dollar |
| BEV | Battery Electric Vehicle (relies only on mains electricity for battery recharge) |
| EV | Electric vehicle (includes all types of plug-in electric cars) |
| GHG | greenhouse gas emissions |
| HOV | High Occupancy Vehicle (or transit) lanes |
| ICEV | Internal combustion engine vehicle |
| PHEV | plug-in hybrid electric vehicle uses mains electricity to recharge the battery, as well as petrol/diesel to generate additional energy for propulsion |
References
- UNFCCC. Report of the Conference of the Parties on Its Fifteenth Session, Held in Copenhagen from 7 to 19 December 2009, Addendum, Part Two: Action Taken by the Conference of the Parties at Its Fifteenth Session. UNFCCC 2010. [Google Scholar] [CrossRef]
- Broadbent, G.H.; Drozdzewski, D.; Metternicht, G. Electric Vehicle Adoption: An Analysis of Best Practice and Pitfalls for Policy Making from Experiences of Europe and the US. Geogr. Compass 2017. [Google Scholar] [CrossRef]
- CCA. Opportunities to Reduce Light Vehicle Emissions in Australia; Climate Change Authority, Australian Government: Melbourne, Australia, 2015. Available online: http://www.climatechangeauthority.gov.au/reviews/light-vehicle-emissions-standards-australia/opportunities-reduce-light-vehicle-emissions (accessed on 22 December 2018).
- Nilsson, M.; Nykvist, B. Governing the Electric Vehicle Transition: Near Term Interventions to Support a Green Energy Economy. Appl. Energy 2016, 179, 1360–1371. [Google Scholar] [CrossRef]
- Lutsey, N.; Searle, S.; Chambliss, S.; Bandivadekar, A. Assessment of Leading Electric Vehicle Promotion Activities in United States Cities. Washington DC. 2015. Available online: http://www.theicct.org/sites/default/files/publications/ICCT_EV-promotion-US-cities_20150729.pdf (accessed on 22 December 2018).
- FCAI. FCAI Sales Cars. Federal Chamber of Automotive Industries VFACTS, 2017. Available online: http://www.fcai.com.au/sales/cars (accessed on 3 February 2018).
- Berckmans, G.; Messagie, M.; Smekens, J.; Omar, N.; Vanhaverbeke, L.; van Mierlo, J. Cost Projection of State of the Art Lithium-Ion Batteries for Electric Vehicles up to 2030. Energies 2017, 10, 1314. [Google Scholar] [CrossRef]
- Nykvist, N.; Nilsson, M. Rapidly Falling Costs of Battery Packs for Electric Vehicles. Nat. Clim. Chang. 2015, 5, 329–332. [Google Scholar] [CrossRef]
- Shankleman, J. The Electric Car Revolution Is Accelerating. Bloomberg Businessweek. 6 July 2017. Available online: https://www.bloomberg.com/news/articles/2017-07-06/the-electric-car-revolution-is-accelerating (accessed on 22 December 2018).
- Department of Environment and Energy. Australian Emissions Projections. Canberra, ACT; 2016. Available online: https://www.environment.gov.au/system/files/resources/9437fe27-64f4-4d16-b3f1-4e03c2f7b0d7/files/aust-emissions-projections-2016.pdf (accessed on 7 July 2017).
- Australian Bureau of Statistics. 3218.0—Regional Population Growth, Australia, 2016–17. Canberra, ACT; 2018. Available online: http://www.abs.gov.au/ausstats/abs@.nsf/mf/3218.0 (accessed on 22 December 2018).
- Australian Bureau of Statistics. 9208.0—Survey of Motor Vehicle Use, Australia, 12 Months Ended 30 June 2016. Canberra; 2017. Available online: http://www.abs.gov.au/AUSSTATS/abs@.nsf/DetailsPage/9208.012 months ended 30 June 2016?OpenDocument (accessed on 22 December 2018).
- Greaves, S.; Backman, H.; Ellison, A.B. An Empirical Assessment of the Feasibility of Battery Electric Vehicles for Day-to-Day Driving. Transp. Res. Part A Policy Pract. 2014, 66, 226–237. [Google Scholar] [CrossRef]
- Gardner, J.; Quezada, G.; Paevere, P. Social Study on Attitudes, Drivers and Barriers to the Uptake of Electric Vehicles, (An Electric Driveway Project Report); Commonwealth Scientific and Industrial Research Organisation (CSIRO): Canberra, Australia; Report Number: EP113815; Australia; 2011. Available online: https://publications.csiro.au/rpr/download?pid=csiro:EP113815&dsid=DS3 (accessed on 22 December 2018).
- Higgins, A.; Paevere, P. Diffusion Modelling of Electric Vehicle Uptake: Methodology and Case Study for Victoria. Australian Commonwealth Scientific and Industrial Research Organisation (CSIRO), 2011. Available online: https://www.researchgate.net/publication/283539744_Spatial_Modelling_of_Electric_Vehicle_Uptake_and_Electricity_Grid_Impacts_in_Australia (accessed on 22 December 2018).
- Smith, B.; Olaru, D.; Jabeen, F.; Greaves, S. Electric Vehicles Adoption: Environmental Enthusiast Bias in Discrete Choice Models. Transp. Res. Part D Transp. Environ. 2017, 51, 290–303. [Google Scholar] [CrossRef]
- Kollmuss, A.; Agyeman, J. Mind the Gap: Why Do People Act Environmentally and What Are the Barriers to. Environ. Educ. Res. 2002, 8, 239–260. [Google Scholar] [CrossRef]
- Lane, B.; Potter, S. The Adoption of Cleaner Vehicles in the UK: Exploring the Consumer Attitude-Action Gap. J. Clean. Prod. 2007, 15, 1085–1092. [Google Scholar] [CrossRef]
- Bator, F.M. The Anatomy of Market Failures. Q. J. Econ. 1958, 72, 351–379. Available online: https://courses.cit.cornell.edu/econ335/out/bator_qje.pdf (accessed on 22 December 2018). [CrossRef]
- Rogers, E.M. Diffusion of Innovations, 5th ed.; The Free Press: New York, NY, USA, 2003. [Google Scholar]
- Leech, N.L.; Onwuegbuzie, A.J. A Typology of Mixed Methods Research Designs. Qual. Quant. 2009, 43, 265–275. [Google Scholar] [CrossRef]
- Krause, R.M.; Carley, S.R.; Lane, B.W.; Graham, J.D. Perception and Reality: Public Knowledge of Plug-in Electric Vehicles in 21 U.S. Cities. Energy Policy 2013, 63, 433–440. [Google Scholar] [CrossRef]
- Bergman, M.M. 5 Methodological Issues in Conducting Mixed Methods Research; Sage Publishing: Thousand Oaks, CA, USA, 2008; pp. 66–83. [Google Scholar]
- Survey Monkey. 2015. Available online: https://www.surveymonkey.com/ (accessed on 3 July 2015).
- Winchester, H.P.M. Ethical Issues in Interviewing as a Research Method in Human Geography. Aust. Geogr. 1996, 27, 117–131. [Google Scholar] [CrossRef]
- Bryman, A. Social Research Methods, 4th ed.; Oxford University Press: Oxford, UK, 2012. [Google Scholar]
- Hay, I. (Ed.) Qualitative Research Methods in Human Geography, 2nd ed.; Oxford University Press: Melbourne, Australia, 2005. [Google Scholar]
- Figenbaum, E.; Kolbenstvedt, M.; Elvebakk, B. Electric Vehicles—Environmental, Economic and Practical Aspects—As Seen by Current and Potential Users TØI Report 1329/2014. Oslo. 2014. Available online: https://www.toi.no/getfile.php/Publikasjoner/TØI rapporter/2014/1329-2014/1329-2014-el.pdf (accessed on 22 December 2018).
- Figenbaum, E.; Kolbenstvedt, M. Learning from Norwegian Battery Electric and Plug-in Hybrid Vehicle Users Report 1492/2016. Oslo. 2016. Available online: https://www.toi.no/getfile.php?mmfileid=43161 (accessed on 22 December 2018).
- Jensen, A.F.; Cherchi, E.; Mabit, S.L. On the Stability of Preferences and Attitudes before and after Experiencing an Electric Vehicle. Transp. Res. Part D Transp. Environ. 2013, 25, 24–32. [Google Scholar] [CrossRef]
- Needell, Z.A.; McNerney, J.; Chang, M.T.; Trancik, J.E. Potential for Widespread Electrification of Personal Vehicle Travel in the United States. Nat. Energy 2016, 16112. [Google Scholar] [CrossRef]
- UK DfT. Public Attitudes towards Electric Vehicles: 2016 (Revised). 2016. Available online: https://www.gov.uk/government/statistics/public-attitudes-towards-electric-vehicles-2016 (accessed on 22 December 2018).
- Egbue, O.; Long, S. Barriers to Widespread Adoption of Electric Vehicles: An Analysis of Consumer Attitudes and Perceptions. Energy Policy 2012, 48, 717–729. [Google Scholar] [CrossRef]
- Lieven, T. Policy Measures to Promote Electric Mobility—A Global Perspective. Transp. Res. Part A Policy Pract. 2015, 82, 78–93. [Google Scholar] [CrossRef]
- Sierzchula, W.; Bakker, S.; Maat, K.; van Wee, B. The Influence of Financial Incentives and Other Socio-Economic Factors on Electric Vehicle Adoption. Energy Policy 2014, 68, 183–194. [Google Scholar] [CrossRef]
- Fulton, L.; Tal, G.; Tarrantine, T. Can We Achieve 100 Million Plug-in Cars by 2030? Research Report UCD-ITS-RR-16-07. Davis. 2016. Available online: https://its.ucdavis.edu/research/publications/ (accessed on 2 July 2017).
- Bjerkan, K.Y.; Nørbech, T.E.; Nordtømme, M.E. Incentives for Promoting Battery Electric Vehicle (BEV) Adoption in Norway. Transp. Res. Part D Transp. Environ. 2016, 43, 169–180. [Google Scholar] [CrossRef]
- Figenbaum, E. Perspectives on Norway’s Supercharged Electric Vehicle Policy. Environ. Innov. Soc. Transit. 2017, 25, 14–34. [Google Scholar] [CrossRef]
- Lévay, P.Z.; Drossinos, Y.; Thiel, C. The Effect of Fiscal Incentives on Market Penetration of Electric Vehicles: A Pairwise Comparison of Total Cost of Ownership. Energy Policy 2017, 105, 524–533. [Google Scholar] [CrossRef]
- Tietge, U.; Diaz, S.; Mock, P.; German, J.; Bandivadekar, A.; Ligterink, N. From Laboratory to Road—A 2016 Update of Official and ‘Real-World’ Fuel Consumption and CO2 Values for Passenger Cars in Europe; International Council on Clean Transportation: Berlin, Germany, 2016; Available online: https://www.theicct.org/publications/laboratory-road-2016-update (accessed on 22 December 2018).
- Mersky, A.C.; Sprei, F.; Samaras, C.; Qian, Z. Effectiveness of Incentives on Electric Vehicle Adoption in Norway. Transp. Res. Part D Transp. Environ. 2016, 46, 56–68. [Google Scholar] [CrossRef]
- Brown, G.E.G., Jr. EXECUTIVE ORDER B-16-2012. USA; 2012. Available online: https://www.gov.ca.gov/news.php?id=17472 (accessed on 22 December 2018).
- California Senate. Electric Vehicle Charging Stations Open Access Act. 2013. Available online: http://leginfo.legislature.ca.gov/faces/billNavClient.xhtml?bill_id=201320140SB454 (accessed on 22 December 2018).
- California Assembly. AB 2565, Muratsuchi. Rental Property: Electric Vehicle Charging Stations. USA; 2014. Available online: https://leginfo.legislature.ca.gov/faces/billNavClient.xhtml?bill_id=201320140AB2565 (accessed on 22 December 2018).
- Shahan, C. California Bill Allows Renters to Install Electric-Car Charging Stations. Clean Technica. 31 August 2014. Available online: http://cleantechnica.com/2014/08/31/california-bill-renters-install-electric-car-charging-stations/ (accessed on 22 December 2018).
- Simpson, C. Car Tech Living in an Apartment Block? You Can Finally Charge Your Electric Car. Gizmodo Australia. May 2015. Available online: http://www.gizmodo.com.au/2015/05/jet-charge-makes-buying-an-electric-car-easy-for-apartment-owners/ (accessed on 22 December 2018).
- Wolin, L.D. Gender Issues in Advertising—An Oversight Synthesis of Research: 1970–2002. J. Adv. Res. 2003, 43, 111–129. [Google Scholar] [CrossRef]
- Kempf, D.S.; Laczniak, R.N.; Smith, R.E. The Effects of Gender on Processing Advertising and Product Trial Information. Mark. Lett. 2006, 17, 5–16. [Google Scholar] [CrossRef]
- McCright, A.M. The Effects of Gender on Climate Change Knowledge and Concern in the American Public. Popul. Environ. 2010, 32, 66–87. [Google Scholar] [CrossRef]
- Cahill, E.; Davies-Shawhyde, J.; Turrentine, T.S. New Car Dealers and Retail Innovation in California’s Plug-In Electric Vehicle Market. Davis. 2014. Available online: https://merritt.cdlib.org/d/ark:%252F13030%252Fm5xp8k5z/1/producer%252F894403654.pdf (accessed on 22 December 2018).
- Cahill, C. Plug In America Blazes a Trail to Market for PEVs. Plug in America. 2016. Available online: https://pluginamerica.org/plug-america-blazes-trail-market-pevs/ (accessed on 22 December 2018).
- Nayum, A.; Klockner, C.A. A Comprehensive Socio-Psychological Approach to Car Type Choice. J. Environ. Psychol. 2014, 40, 401–411. [Google Scholar] [CrossRef]
- Jansson, J.; Pettersson, T.; Mannberg, A.; Brännlund, R.; Lindgren, U. Adoption of Alternative Fuel Vehicles: Influence from Neighbors, Family and Coworkers. Transp. Res. Part D Transp. Environ. 2017, 54, 61–73. [Google Scholar] [CrossRef]

| Independent Variable | Weighted Average Response (Scale 1–5) to Dependent Variable | ||
|---|---|---|---|
| Likelihood of Buying BEV | Likelihood of Buying PHEV | ||
| Gender | Female | 3 | 3.22 |
| Male | 2.8 | 2.89 | |
| Age | 18–24 | 2.6 | 2.8 |
| 25–34 | 2.79 | 2.85 | |
| 35–44 | 2.98 | 3.15 | |
| 45–54 | 3.1 | 3.1 | |
| 55–64 | 3.04 | 3.1 | |
| 65–74 | 2.82 | 2.95 | |
| 75 or older | 2.67 | 3.05 | |
| Car condition at purchase | New | 3.09 | 3.09 |
| Used | 2.68 | 2.91 | |
| Vehicle price willingness to pay | <$20,000 | 2.64 | 2.84 |
| $20 k–$30 k | 2.99 | 3.09 | |
| $30 k–$40 k | 2.74 | 3.11 | |
| $40 k–$50 k | 3.26 | 3.26 | |
| >$50 k | 3.2 | 2.9 | |
| Size of vehicle | Small | 3.05 | 3.17 |
| Medium | 2.9 | 3.05 | |
| Large | 2.6 | 2.6 | |
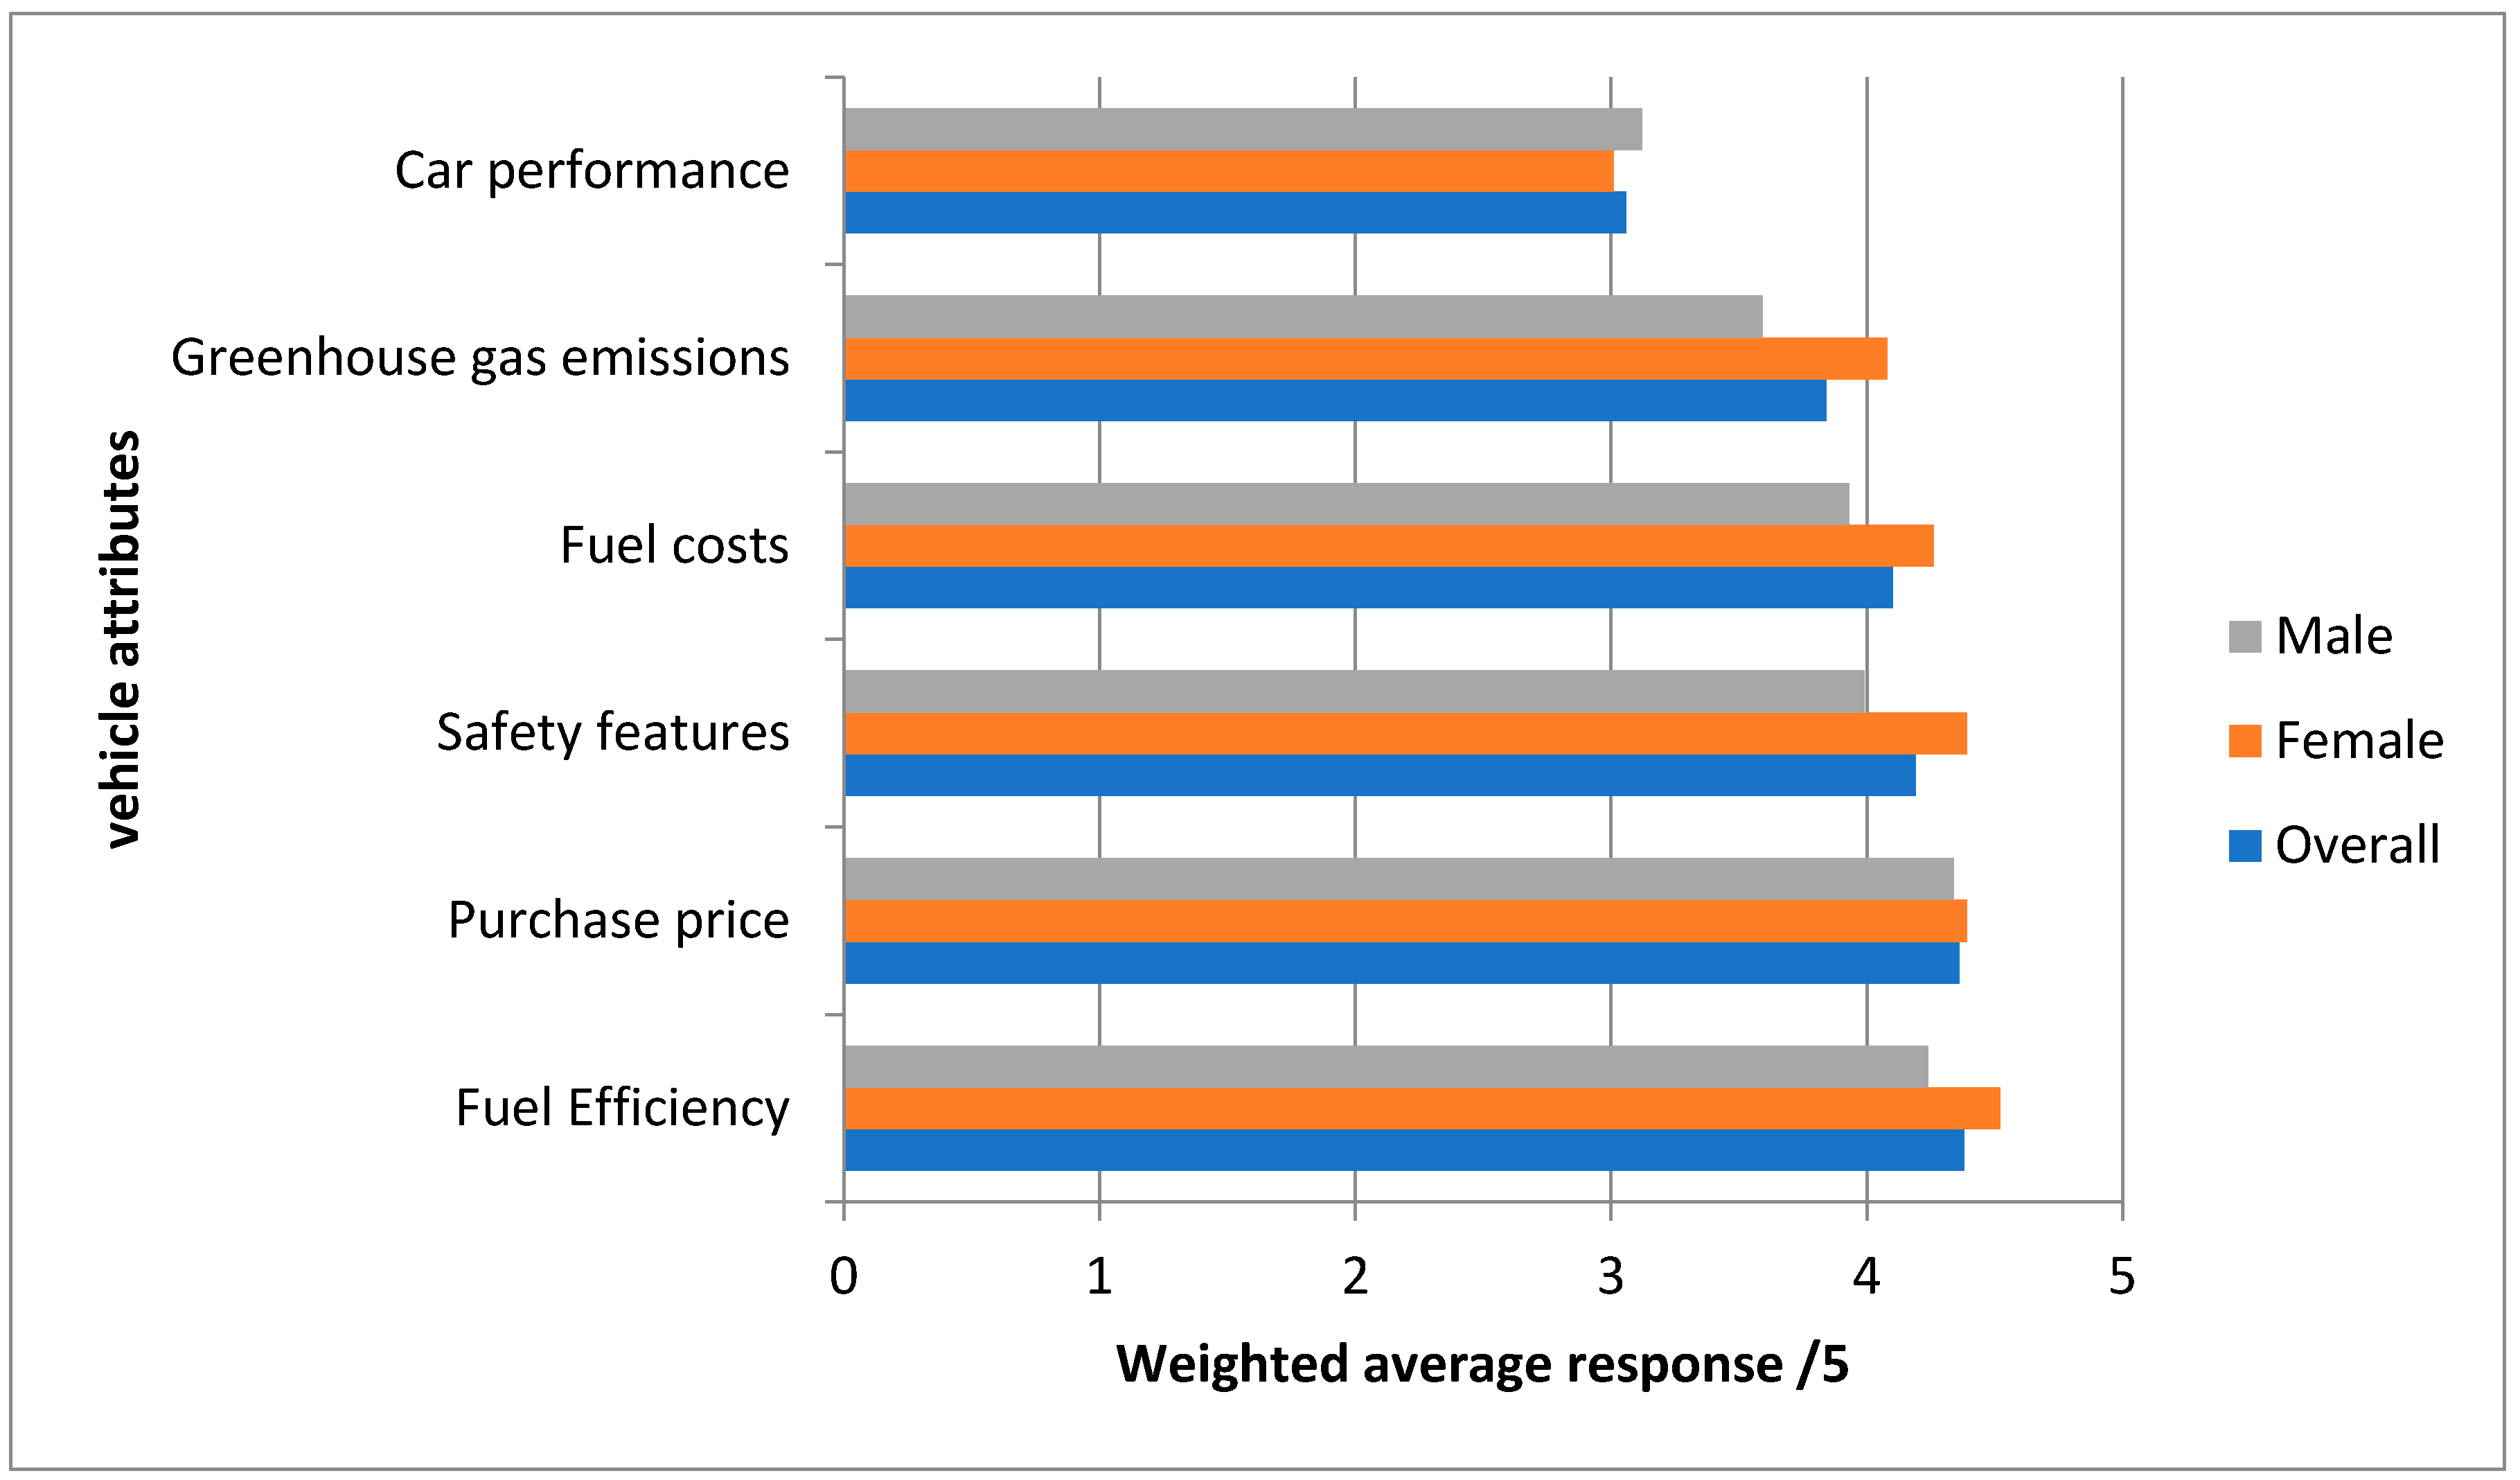
| Variable | Weighted Average Response (Scale 1–5) | ||
|---|---|---|---|
| All Respondents | Female (n = 166) | Male (n = 164) | |
| Fuel Efficiency | 4.38 | 4.52 | 4.24 |
| Purchase price | 4.36 | 4.39 | 4.34 |
| Safety features | 4.19 | 4.39 | 3.99 |
| Fuel costs | 4.1 | 4.26 | 3.93 |
| Greenhouse gas emissions | 3.84 | 4.08 | 3.59 |
| Car performance | 3.06 | 3.01 | 3.12 |
| Variable | Weighted Average Response (Scale 1–5) | ||
|---|---|---|---|
| Overall (n = 330) | Test (n = 164) | Control (n = 166) | |
| Qu 30 Likelihood to buy BEV | 2.94 | 3.02 | 2.85 |
| Gender | |||
| Female (n = 166) | 3 | 3.14 | 2.8 |
| Male (n = 164) | 2.8 | 2.87 | 2.88 |
| Car condition at purchase | |||
| New (n = 140) | 3.1 | 3.3 | 2.85 |
| Used (n = 154) | 2.68 | 2.74 | 2.62 |
| Willingness to spend on next car | |||
| Less than $20,000 (n = 109) | 2.64 | 2.75 | 2.6 |
| $20 k–$30 k (n = 79) | 2.99 | 3.2 | 2.75 |
| $30 k–$40 k (n = 46) | 2.74 | 2.7 | 2.75 |
| $40 k–$50 k (n = 39) | 3.26 | 3.3 | 3.1 |
| $50 k or more (n = 30) | 3.2 | 3.6 | 2.73 |
| Size of car | |||
| Small (n = 123) | 3.05 | 3.1 | 3 |
| Medium (n = 164) | 2.9 | 3.0 | 2.8 |
| Large (n = 43) | 2.6 | 2.75 | 2.4 |
| Qu 31 Likelihood to buy PHEV | 3.1 | 3.1 | 3 |
| Gender | |||
| Female (n = 166) | 3.22 | 3.27 | 3.15 |
| Male (n = 164) | 2.89 | 2.93 | 2.86 |
| Car condition at purchase | |||
| New (n = 140) | 3.1 | 3.12 | 2.98 |
| Used (n = 154) | 2.91 | 3.03 | 2.87 |
| Willingness to spend on next car | |||
| Less than $20,000 | 2.84 | 2.9 | 2.8 |
| $20 k–$30 k | 3.09 | 3.2 | 3 |
| $30 k–$40 k | 3.11 | 2.9 | 3.25 |
| $40 k–$50 k | 3.26 | 3.3 | 3.1 |
| $50 k or more | 2.9 | 3.1 | 2.6 |
| Size of car | |||
| Small | 3.2 | 3.25 | 3.1 |
| Medium | 3.05 | 3.1 | 3 |
| Large | 2.6 | 2.75 | 2.4 |
| Source of Information | Weighted Average Response (Scale 1–5) | ||
|---|---|---|---|
| Overall | Female | Male | |
| Prior knowledge about particular car models | 3.63 | 3.50 | 3.73 |
| Family and friends | 3.0 | 3.28 | 2.76 |
| Car sales person | 2.24 | 2.57 | 1.96 |
| Formal information sources (e.g., magazine articles, car brand websites, articles written by motoring journalists, TV shows) | 3.9 | 3.93 | 3.87 |
| Advertisements about specific car models | 2.22 | 2.15 | 2.27 |
| Test drive | 4.1 | 4.15 | 4.05 |
© 2019 by the authors. Licensee MDPI, Basel, Switzerland. This article is an open access article distributed under the terms and conditions of the Creative Commons Attribution (CC BY) license (http://creativecommons.org/licenses/by/4.0/).
Share and Cite
Broadbent, G.H.; Metternicht, G.; Drozdzewski, D. An Analysis of Consumer Incentives in Support of Electric Vehicle Uptake: An Australian Case Study. World Electr. Veh. J. 2019, 10, 11. https://doi.org/10.3390/wevj10010011
Broadbent GH, Metternicht G, Drozdzewski D. An Analysis of Consumer Incentives in Support of Electric Vehicle Uptake: An Australian Case Study. World Electric Vehicle Journal. 2019; 10(1):11. https://doi.org/10.3390/wevj10010011
Chicago/Turabian StyleBroadbent, Gail Helen, Graciela Metternicht, and Danielle Drozdzewski. 2019. "An Analysis of Consumer Incentives in Support of Electric Vehicle Uptake: An Australian Case Study" World Electric Vehicle Journal 10, no. 1: 11. https://doi.org/10.3390/wevj10010011
APA StyleBroadbent, G. H., Metternicht, G., & Drozdzewski, D. (2019). An Analysis of Consumer Incentives in Support of Electric Vehicle Uptake: An Australian Case Study. World Electric Vehicle Journal, 10(1), 11. https://doi.org/10.3390/wevj10010011