Article

The Limit of Urban Land Expansion Based on Population Growth and Economic Development: A Case Study of Shandong Province in China

1
College of Geography and Environment, Shandong Normal University, Jinan 250358, China
2
Jinan Urban Development Group Co., Ltd., Jinan 250014, China
*
Author to whom correspondence should be addressed.
Sustainability 2023, 15(1), 73; https://doi.org/10.3390/su15010073
Submission received: 11 November 2022 / Revised: 9 December 2022 / Accepted: 16 December 2022 / Published: 21 December 2022
(This article belongs to the Special Issue Urban Sprawl and Sustainable Land Use Planning)

Abstract

:
As a developing country, China is experiencing rapid urbanization. With rapid economic development and urban population growth, urban land continues to expand. The urban land expansion provides development space for cities; however, the disorderly expansion of urban land also results in a significant waste of land resources. In order to effectively regulate the scale of urban land and prevent the disorderly expansion of urban land, it is necessary to conduct analyses of the characteristics and trends of urban land expansion. In the present paper, taking Shandong province as the research area, we analyze the characteristics and limits of urban land expansion. Based on the relationship between urban land expansion, economic development, and urban population growth, using urban land area, the output value of secondary and tertiary industries, and population data to construct a marginal effect model and logistic model to estimate the limit time and limit scale of urban land expansion in Shandong province from the perspectives of economic development and urban population growth. The results show that: (a) Economic development and urban population growth are the main influencing factors of urban land expansion in Shandong province. With the development of the economy and urbanization, the expansion rate of urban land in Shandong province is decreasing. (b) From the perspective of economic development, With the continuous improvement of urban land use efficiency, the demand for newly-added urban land by economic development gradually weakens. In 2033, the urban land in Shandong province will reach the expansion limit, with a limit scale of 7982 km2. (c) From the perspective of urban population growth, in 2037, the urbanization rate of Shandong province will reach 80%, the urban population will be stable, and the urban land will reach the expansion limit, with a limit scale of 9068.8 km2.

1. Introduction

Urban land expansion is the inevitable result of urbanization and is also the most obvious spatial characteristic of urbanization. With the process of urbanization, urban economic activities develop vigorously, and more people are attracted and flock to cities, thus promoting the rapid growth of the urban population [1,2,3]. Economic development and population growth constantly increase the demand for land resources, which inevitably leads to urban land expansion [4,5]. As a developing country, China is in a period of rapid urbanization. With the urban population growth and economic development, the scale of urban land will increase accordingly. Urban land expansion provides a material basis for urban development. Still, there are some problems in the process of urbanization, such as the disorderly expansion of urban land, uncontrolled spatial expansion, and low efficiency of land use [6,7,8], which lead to increasing tension between the people and the land and restrict regional sustainable development [9]. Based on the basic national conditions of more people and less land, China has put forward the land management policy of economical and intensive land use, which improves the efficiency of urban land use and prevents the disordered expansion of urban land to protect cultivated land resources and solve the contradiction between “eating” and “construction”. Thus, it is very important to effectively control urban land expansion and formulate sustainable land use policies to analyze the characteristics of urban land expansion and predict the trend of urban land expansion scientifically. Recent research on urban land expansion mainly focused on characteristics and patterns of urban land expansion, driving factors, and prediction of urban land use scale [10,11,12,13,14,15].
Researchers have extensively discussed the spatial-temporal characteristics and driving forces of urban land expansion from different scales, which are the basis of scientific regulation of urban land use scale. Based on remote sensing data, some GIS analysis methods are used to study the spatial-temporal expansion characteristics of urban lands, such as the expansion index method, fractal dimension method [16], and center-of-gravity model [17]. It has been shown that urban land expansion has obvious spatial-temporal differences [18]. The driving factors of urban land expansion are analyzed with mathematical models, such as the spatial probit model [4], logistic regression analysis [19], vector error correction model [20], regression model [21], and spatial-temporal weighted regression model [22]. Marshall et al. [23] pointed out that urban land expansion is closely related to population size in most regions of the world. Poghosyan [11], Morshed [13], and Alsharif et al. [24] showed that population and urbanization are the main influencing factors of urban land expansion. Alice et al. [25] further showed that population increase, income increase, and continuous improvement of infrastructure are the driving factors for urban land expansion. In addition, some studies showed that the driving forces of urban land expansion have spatial heterogeneity, and the constraining effects of natural conditions on urban land expansion have gradually weakened over time [4]. In China, it is generally believed that social and economic development is the main driving force of urban land expansion [26,27,28].
Some of the researchers have tried to use models to predict urban expansion, such as land change modeler [10], variable weights logistic cellular automata model [29], FLUS model [30,31], CA model [32], logistic regression [33], artificial neural networks [34], and so on. These researches mainly predict the scale of urban land at a specific time point in the future or study the reasonable scale of urban land in a certain period from a certain factor affecting urban land expansion. Based on the characteristics of land use change in the process of urbanization, some researchers have used a variety of models to study the limit scale of urban land expansion, such as the model of stepwise regression mode and per capita land area [35], classification and regressive method [36], logistic model and autoregressive distributed lag model [37]. There are few research achievements in predicting the expansion limit of urban land from the perspectives of time and space.
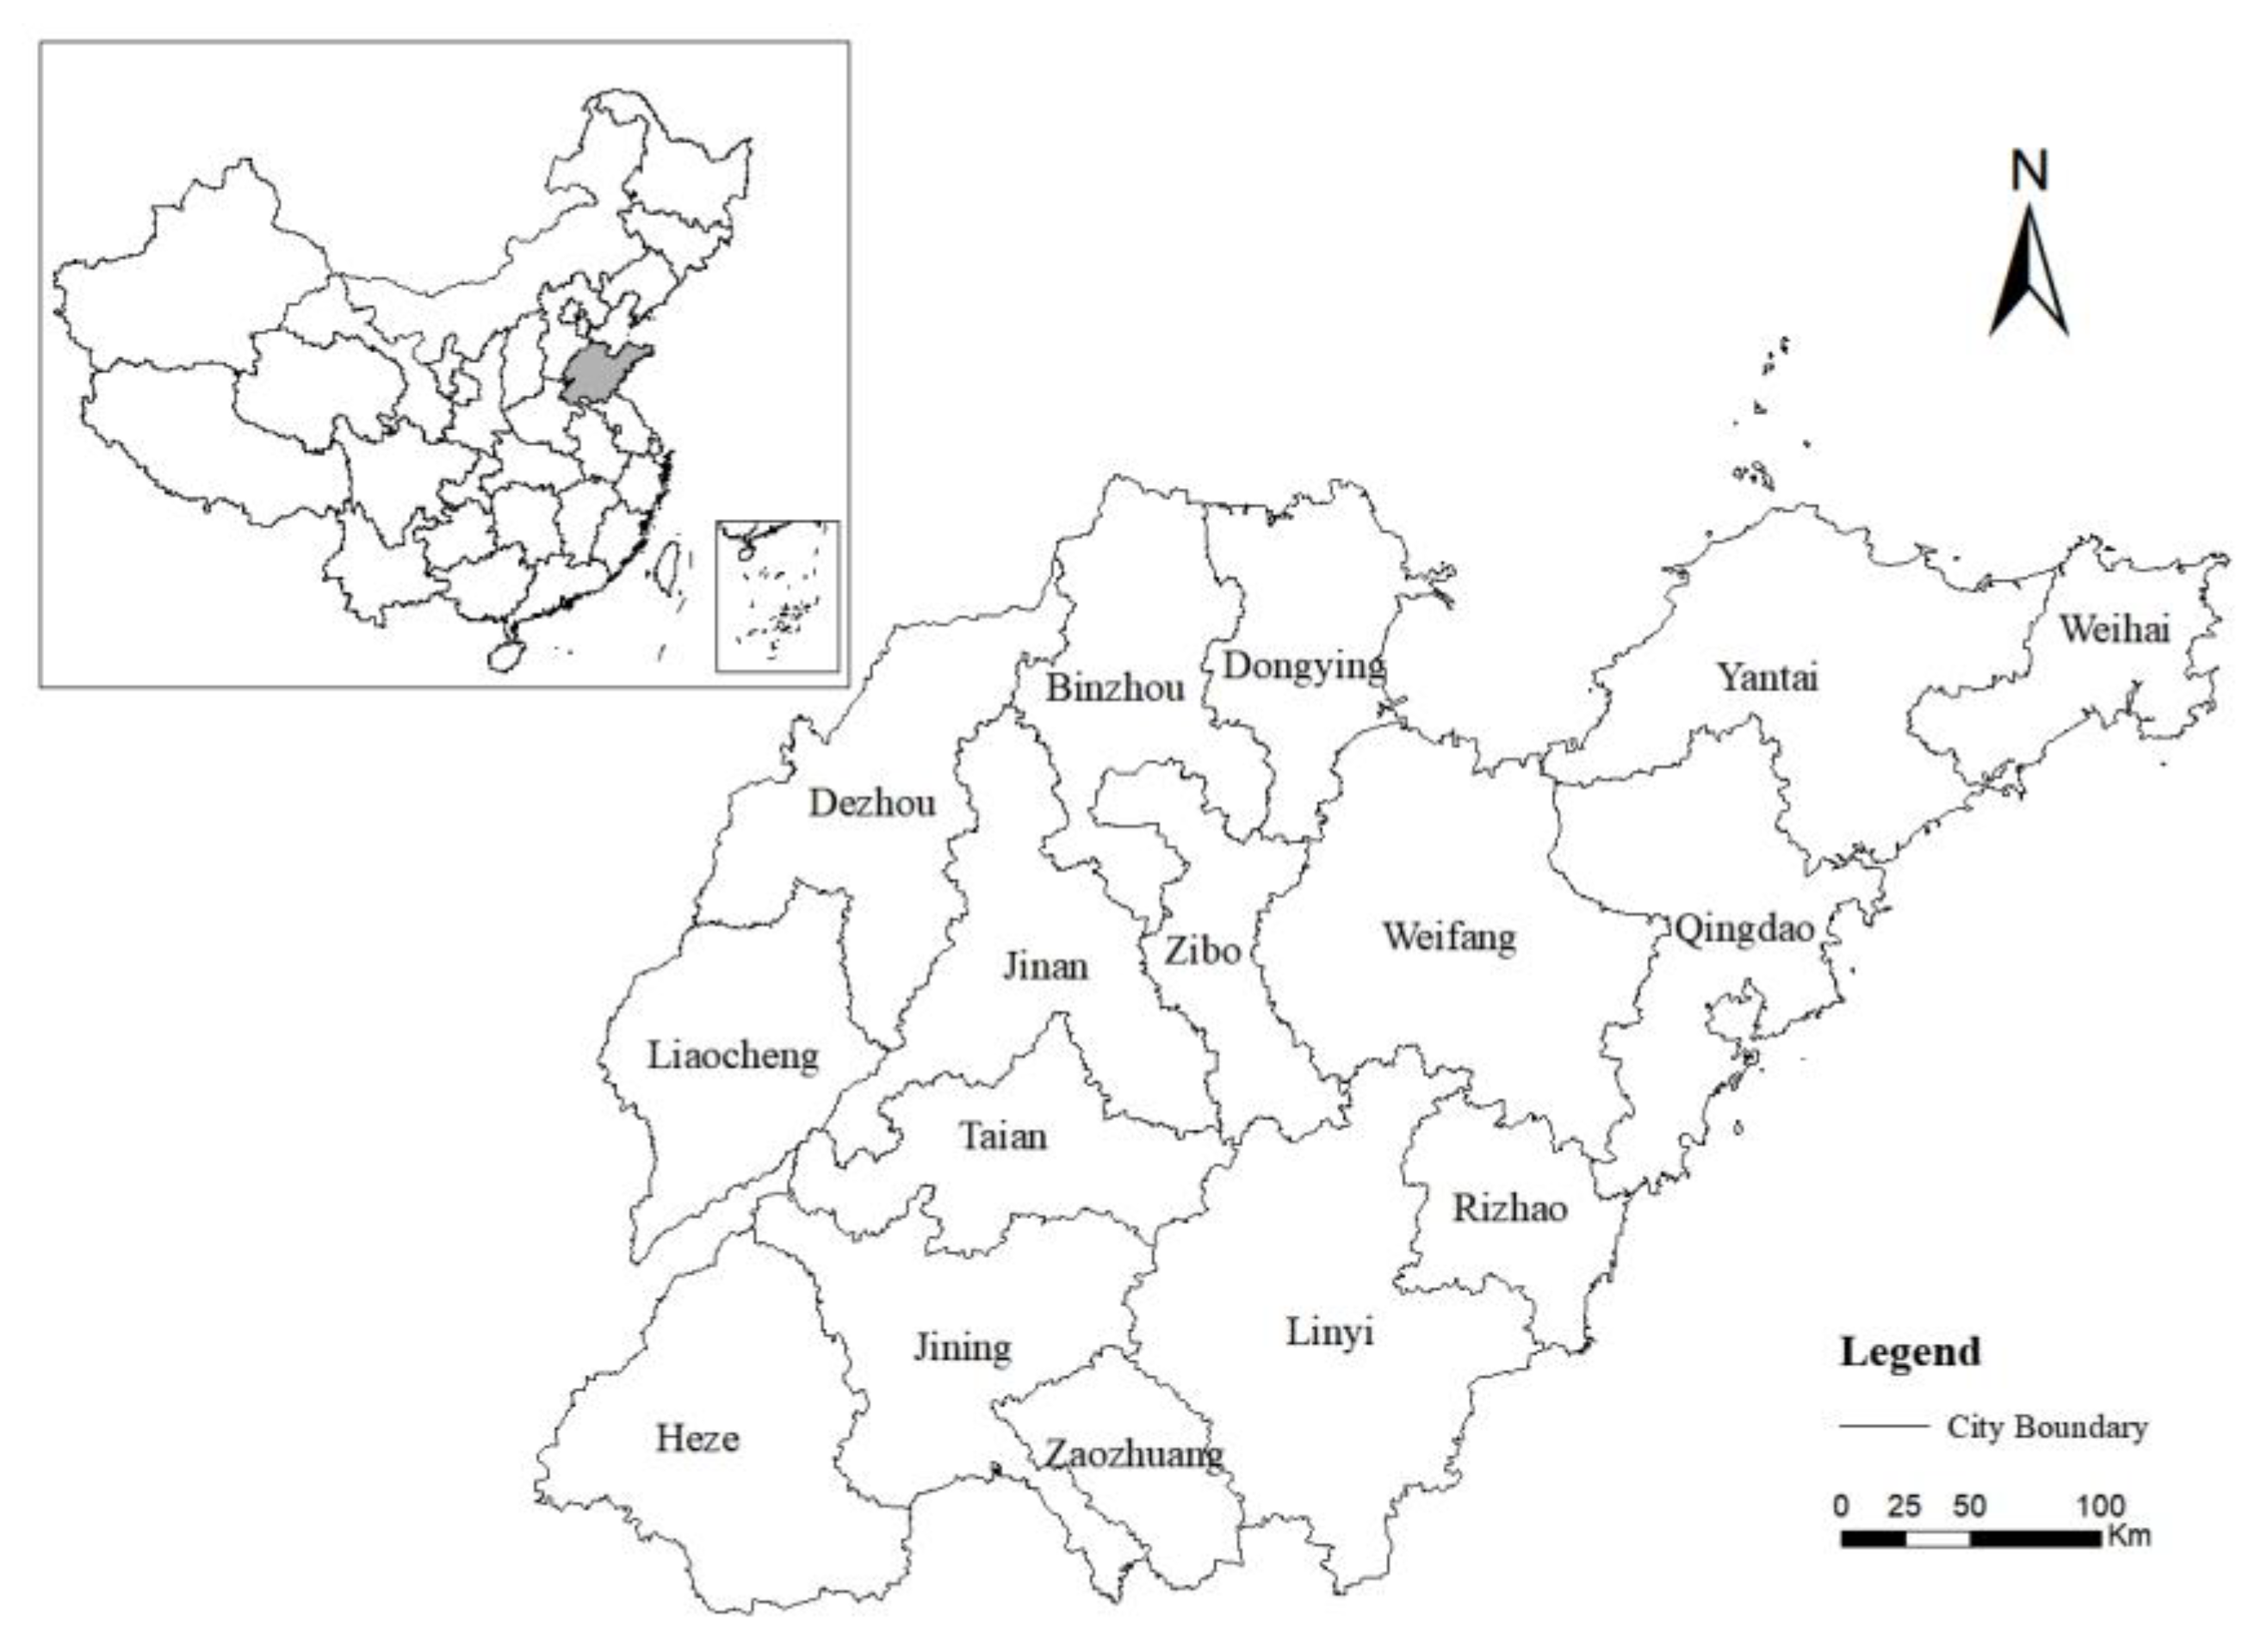
Shandong province is a province with a large population and economy in China, and its urbanization and national economy are at the forefront of the country. Still, Shandong province is also China’s main grain-producing area, and the contradiction between humans and land cannot be ignored. Controlling the rational expansion of urban land is not only the requirement of land resource management but also the practical requirement of cultivated land protection. Therefore, taking Shandong province as the study area, based on the impact of economic development and urbanization on urban land expansion, this paper constructs the marginal effect model and logistic model to predict the expansion limits of urban land from two perspectives of space and time, that is the scale limit and time limit. Compared with predicting the scale of urban land in a certain period, predicting the expansion limit of urban land can better reflect the future trend of urban land expansion and provide references for macro-control of urban land expansion. Predicting the expansion limit of urban land from the perspectives of time and space enriches urban land expansion research methods. Furthermore, the research results can provide reference for formulating land use policies conducive to promoting sustainable land use and long-term sustainable social and economic development in Shandong province.

2. Data Sources and Methods

2.1. Study Area and Data Sources

Shandong province is located on the east coast of China and the lower reaches of the Yellow River, located at 114°48′–122°42′ E and 34°23′–38°17′ N, with a total land area of 155,800 km2 (Figure 1). As a province with a large population and economy, Shandong province ranks at the forefront of the country in terms of economic scale and urbanization rate. However, the contradiction between humans and land in the process of economic development and rapid urbanization has become increasingly prominent. From 2001 to 2018, the urban land area in Shandong province increased by 4494.18 km2, with an average annual growth rate of 7.28%, higher than the national average in the same period, while the per capita cultivated land was 0.075 hm2, lower than the national average. The contradiction between humans and land was very serious. Controlling the rational expansion of urban land is very important for the realistic protection of cultivated land.
Urban construction land area is used to reflect the scale of urban land. The total area includes the urban construction land of the municipal districts, county-level cities, and counties in Shandong province. Urban land data are obtained from the Shandong Urban Construction Statistical Annual Report (2001–2019). The socioeconomic data, including the output value of secondary and tertiary industries, urban population, total population, and urbanization rate, are mainly obtained from the China City Statistical Yearbook (2001–2019), and the relevant data of some counties are obtained from the Statistical Yearbook of prefecture-level cities of Shandong province. In order to eliminate the influence of price factors and ensure the comparability of data, the output value of the secondary and tertiary industries was converted into the value based on 2001 through the consumer price index.

2.2. Methods

2.2.1. Pearson Correlation Analysis

According to previous studies, it can be concluded that social and economic development is the main reason for urban land expansion in China, and the influencing factors include fixed asset investment, industrial restructuring, economic growth, population and urbanization [35,38,39,40,41]. Since fixed asset investment and industrial restructuring are closely related to economic development, and there is a strong correlation between the urbanization rate and urban population, to maintain the independence of influencing factors and exclude the factors with high correlation, the output value of secondary and tertiary industries and urban population are selected as indicators to measure the social and economic development of cities. Pearson correlation analysis is used to analyze the correlation between socioeconomic development and urban land expansion in Shandong Province.
For variables X = x 1 , x 2 , , x n T and Y = y 1 , y 2 , , y n T , the Pearson correlation coefficient is calculated as follows:
r = i = 1 n x i x ¯ y i y ¯ i = 1 n x i x ¯ i = 1 n y i y ¯
where r is the correlation coefficient; x ¯ and y ¯ are the averages of the variable values, respectively. The value range of r is (−1, 1), that is, |r| ≤ 1. The closer |r| is to 1, the more correlated x and y are. If r = −1, it indicates that there is a completely negative linear correlation between x and y; if r = 1, it indicates that there is a completely positive linear correlation between x and y; if r = 0, there is no linear correlation between x and y. In general, when |r| ≥ 0.8, it can be considered highly correlated.

2.2.2. Marginal Effect Model

Studies have shown that in the process of economic development, the demand for construction land by economic growth increases first and then decreases. In the process of rapid urbanization and the transition from the initial stage of industrialization to the advanced or post-industrialization stage, the dependence of economic growth on the expansion of construction land gradually weakens [42,43,44]. Li et al. [45] constructed a marginal land use measurement model by analyzing the relationship between land use and economic growth in China and believed that when the marginal land use efficiency is 0, the scale of urban land will reach the limit.
Thus, this study introduces the marginal theory in economics to measure the relationship between urban land expansion and economic growth. Referring to the marginal effect analysis method, the increase of urban land required for increasing one unit of the output value of secondary and tertiary industries is defined as marginal urban land, and the marginal effect model of urban land expansion and economic growth is established. Multiple derivatives and regression predict the time for urban land to reach the expansion limit.
Firstly, in order to eliminate the influence of heteroscedasticity, the logarithms of urban land area and the output value of secondary and tertiary industries are taken and expressed as lnC and lnD, respectively. Then the relationship between them is established:
ln C = α + β × ln D
where C is the urban land area (hm2); D is the output value of secondary and tertiary industries (100 million Yuan); α is the constant term; β is the regression coefficient.
Take a derivative of Equation (2) to calculate the marginal urban land M (hm2/100 million Yuan):
M = d c d D  
Take the second derivative of Equation (2) to obtain the change rate of marginal urban land (M′), as shown in Equation (4). When M′ = 0, M also tends to be zero. Then, urban land reaches the expansion limit.
M = d M d D = d 2 C d 2 D
In order to get the moment when M′ = 0, take the absolute value of M′ of each year and calculate its logarithm, and then Eviews software is used for regression analysis to obtain the relationship between M′ and time:
ln ( M ) = R + N × t
where M′ is the change rate of marginal urban land; R and N are coefficients; t is time.
The t-value is the limit time of urban land expansion, which is obtained when M′ = 0.

2.2.3. Logistic Model

Urban land expansion is the result of urbanization, and the urbanization process is characterized by stages. The urbanization evolution in developed countries can be divided into three stages: the initial stage, rapid stage, and stable stage, which accords with the change law of the logistic curve, and the urbanization process in China also conforms to this trend [46,47]. Urban population is closely related to regional total population and urbanization level. According to the 2019 Revision of World Population Prospects issued by the United Nations, China’s population growth inertia is on a downward trend and will reach its peak around 2030. It can be seen that the urban population cannot continue to grow, and urban land cannot continue to expand. When urbanization reaches a high level, the urbanization process will enter a stable stage. At this time, the urban population increases slowly and gradually tend to be stable, and the scale of urban land will also reach the expansion limit.
It has been shown that both the urbanization process and the urban population tend to be stable when the urbanization rate reaches 80% and the urban land reaches the expansion limit [48]. According to the trend of population growth and urbanization evolution, the logistic model is built to predict the trend of population growth and urbanization process in Shandong province and further to calculate the limit time and limit scale of urban land expansion combined with the per capita urban land area. By this, the logistic curve between urban land expansion and economic development in Shandong province is verified, and the limit scale of urban land expansion is calculated. The basic expression of the logistic model is as follows:
y = K 1 + K c e x ln b
where K is the upper limit value; b and c are constants; x is the argument, y is the dependent variable corresponding to x.
S = P t × Y × I
where S is the total urban land area; P(t) is the total regional population; Y is the urbanization rate; I is the per capita urban land area.

3. Results

3.1. Correlation Analysis between Urban Land Expansion and Socio-Economic Development in Shandong Province

The condition of Pearson correlation analysis is that the data follow a normal distribution. Before the Pearson correlation analysis, the Shapiro–Wilk test was applied to test the normality of the output value of secondary and tertiary industries, urban population, and the urban land area. The test results show that the p-values are 0.270, 0.586, and 0.587, respectively, greater than 0.05, and the variable data follow normal distribution at the 95% confidence level (Table 1).
The results show that the Pearson correlation coefficients between urban land area and secondary and tertiary industry output value and urban population in Shandong province are 0.97 and 0.95, respectively, with high correlation and p < α = 0.01. This indicates that economic development and urban population growth are the main influencing factors of urban land expansion in Shandong province.

3.2. Characteristics of Urban Land Expansion in Shandong Province

From 2001 to 2018, the urbanization rate of Shandong province increased from 39.20% to 61.18%. In order to ensure the needs of various activities of urban residents, the total scale of urban land in Shandong province has continued to expand with the continuous improvement of urbanization. Urban land increased from 2197.97 km2 to 6692.15 km2, an increase of 4494.18 km2 with an average annual increase of 264.36 km2 from 2001 to 2018. It can be seen that urban land expansion is the inevitable result of urbanization.
In Shandong province, urban land has also been expanding with the increase in the output value of secondary and tertiary industries. Still, the expansion range and expansion rate show a fluctuating downward trend with obvious phased characteristics (Table 2).
Before 2006, the output value of secondary and tertiary industries in Shandong province was less than 2 trillion yuan, with relatively low economic development, but the economic growth rate was fast. From 2001 to 2006, the output value of secondary and tertiary industries increased by an average annual growth of 18.66%, and the average annual expansion rate of urban land was as high as 11.94%, with an average annual increase of 332.33 km2. During this period, economic development has a great demand for urban land.
With the continuous improvement of the economy, the economic growth rate gradually decreased. From 2007 to 2013, the output value of secondary and tertiary industries in Shandong province increased from 2197.18 billion yuan to 3877.56 billion yuan, with the average annual growth rate dropping to 10.64%. At the same time, the expansion area and expansion rate of urban land also decreased. The average annual expansion area of urban land was 252.91 km2, with an average annual expansion rate of 5.55%.
In 2014, the output value of secondary and tertiary industries in Shandong Province exceeded 4 trillion yuan, reaching a higher economic level. After that, the economic growth rate further slowed down, and the expansion rate of urban land also decreased. From 2014 to 2018, the average annual economic growth rate was 5.33%, and urban land’s average annual expansion rate decreased to 3.52%, with an average annual increase of 212.38 km2. Obviously, with the continuous improvement of the economic level and the gradual slowdown of the economic growth rate, the expansion area and expansion rate of urban land are declining. This indicates that the demand for newly-added urban land in economic development continues to decrease, and the role of urban land expansion in promoting economic growth is decreasing. From the perspective of urban land use efficiency, the output value per area of urban land in Shandong province continues to increase, from 371 million yuan/km2 in 2001 to 751 million yuan/km2 in 2018. The economic output per area of urban land is increasing. This indicates that with technological progress and industrial restructuring, urban land use efficiency keeps improving, which is also one of the reasons for the decrease in the demand for newly-added urban land, reflecting the gradual reduction of the dependence of economic development on newly-added urban land. Therefore, it can be predicted that the scale of urban land will not continue to expand. When the economy develops after a certain level, both the slowdown of economic growth and the improvement of land use efficiency will reduce the demand for urban land, and the scale of urban land will gradually stabilize, which conforms to the law of diminishing marginal effects.

3.3. Limit Prediction of Urban Land Expansion Based on Economic Development

3.3.1. The Limit of Time

In order to reduce the impact of heteroscedasticity problems on model estimation, the heteroscedasticity test should be conducted in linear regression. In this paper, the White heteroscedasticity test method was used, and the test results are shown in Table 3. The results showed that p < 0.05, indicating that the null hypothesis was rejected and there was heteroscedasticity.
In this paper, the commonly used logarithmic transformation method of raw data was used to eliminate the influence of heteroscedasticity. The logarithms of urban land area and the output value of secondary and tertiary industries in Shandong province from 2001 to 2018 were taken and expressed as lnC and lnD, respectively. The regression analysis of lnC and lnD is carried out by Eviews software, and the regression results are shown in Table 4.
The regression results showed that the correlation between lnC and lnD reached 0.995, indicating that the fitting degree between them was good and significantly correlated. The constant is 7.155, and the regression coefficient is 0.577. Accordingly, the expression of their relation is obtained.
ln C = 7.155 + 0.577 × ln D
Take the derivative of Equation (8) to calculate the marginal urban land:
M = 0.577 × C D
Take the derivative of Equation (9) to calculate the change rate of marginal urban land:
M = 0.244 × C D 2
The marginal urban land and its change rate in Shandong province are shown in Figure 2.
Figure 2 shows that the marginal urban land in Shandong province showed an obvious downward trend from 2001 to 2018, and the change rate of marginal urban land was negative and increased towards zero. It shows that in the process of urban development, technological progress and industrial restructuring have effectively improved urban land use efficiency, thereby weakening the demand for new urban land in economic development. The marginal urban land will decrease gradually, and its change rate will approach zero eventually. When the change rate of marginal urban land is zero, marginal urban land will also approach zero, and urban land will reach the limit of expansion.
The results of the regression analysis of ln(|M′|) and t are shown in Table 5.
The relation between ln(M′|) and t is obtained from the results of regression analysis:
ln ( M ) = 294.9967 0.1508 t
Let |M′| = 0.00001, which can be regarded as the change rate of marginal urban land is infinitely close to 0, and obtain t = 2032.56. That is, the expansion of urban land in Shandong province will reach its limit in 2033 (rounded).

3.3.2. Limit Scale

Put the urban land area and the output value of secondary and tertiary industries in each year into Equation (6) to obtain the logistic expression (Equation (12)) with the highest fitting degree after multiple fittings. Relevant parameter values are shown in Table 6. According to the values of R2 and F, it can be judged that the fitting effect is good with statistical significance. Based on this, the limit scale of urban land expansion in Shandong province is estimated to be 7982 km2.
y = 7982 1 + 3.439 e 0.0005 x

3.4. Limit Prediction of Urban Land Expansion Based on Urban Population Growth

3.4.1. The Limit of Time

Taking the urbanization rate of Shandong province from 2001 to 2018 as the dependent variable and the year as the independent variable (set 2001 as 1), the logistic model was selected for regression, and the K value was set as 100. The results are shown in Table 7. The fitting goodness of regression is 0.9907, and the sig value is less than 0.01, which indicates that it has a good fitting effect. The logistic expression of the urbanization rate (Equation (13)) is obtained by substituting the values of each parameter into the formula. When y = 80, t = 36.39, i.e., the urbanization rate of Shandong province will reach 80% in 2037, and the scale of urban land will reach the limit of expansion.
y = 100 1 + 1.641 e 0.0517 t

3.4.2. Limit Scale

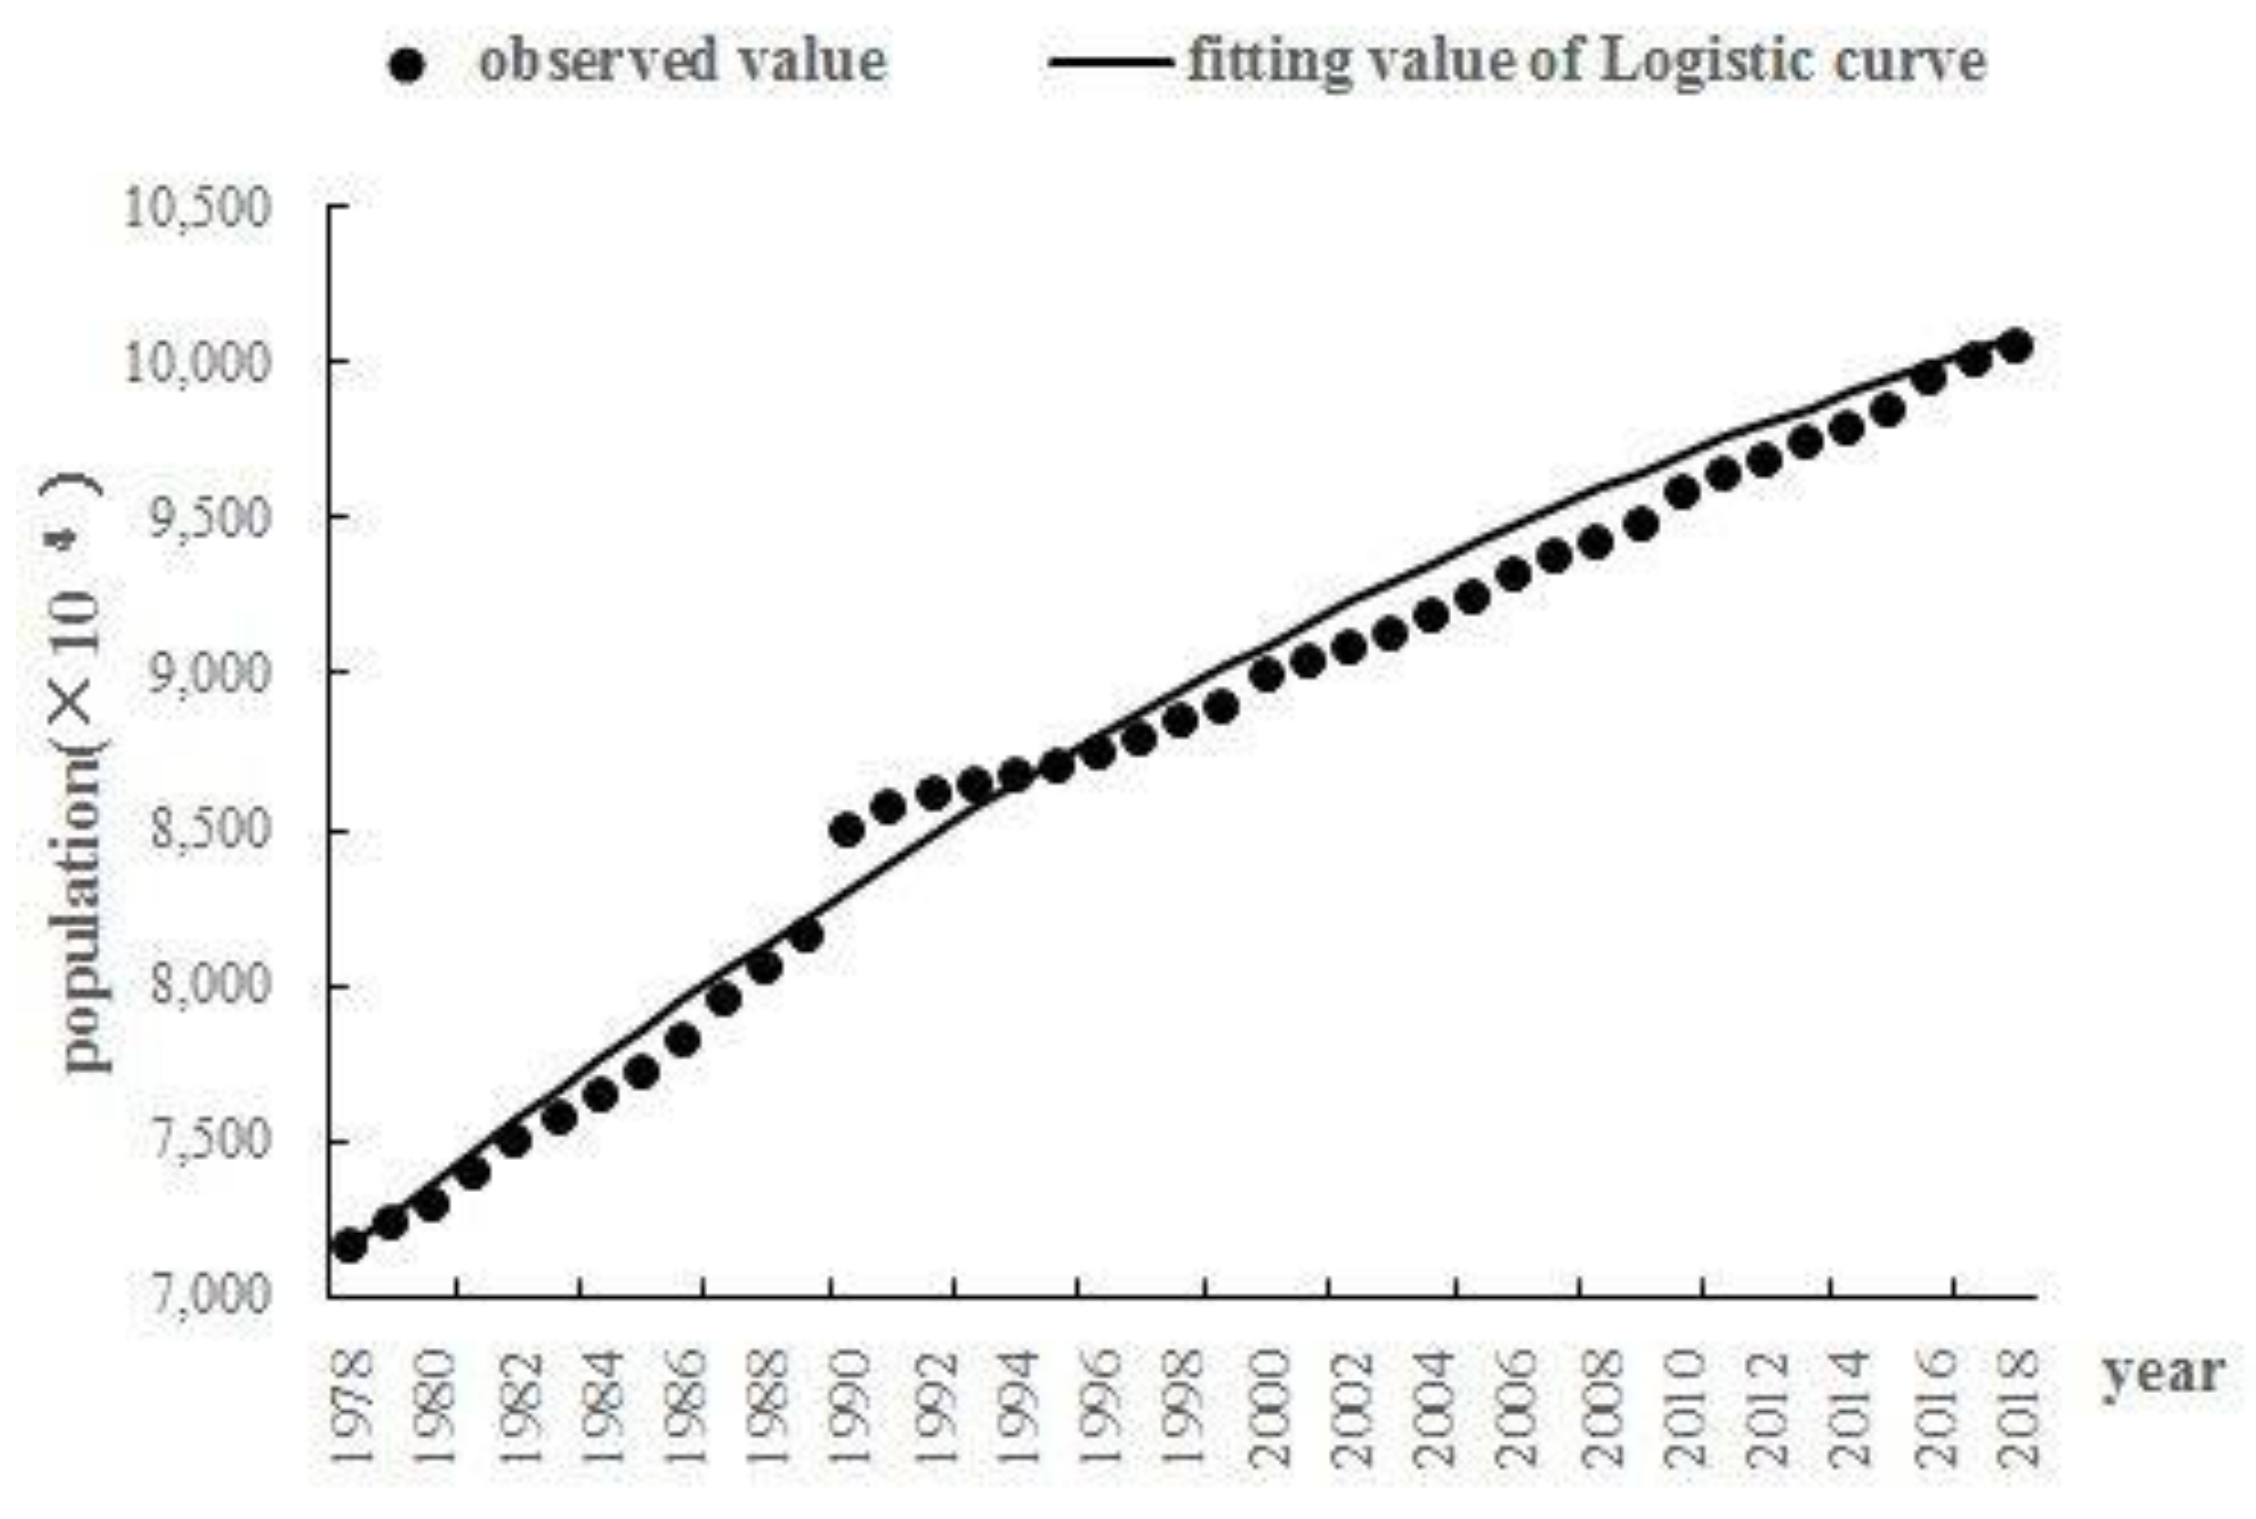
In order to improve the prediction accuracy, the resident population data from 1978 to 2018 were selected to fit the logistic curve of the total population change in Shandong province (Figure 3).
The fitting parameters are shown in Table 8, and the logistic model of the total population growth in Shandong province was constructed (Equation (14)).
y = 11 , 336 1 + 0.59 e 0.0365 t 1977
R2 = 0.9904 and Sig. < 0.01 indicate that the curve-fitting effect is ideal (Table 8). The average error between the fitting value and the actual value is only 1.29%, which shows that the prediction result of the logistic model is accurate and reliable and can reflect the population change trend of Shandong province. According to this model, it is predicted that the peak growth of the total population in Shandong province is 113.36 million, so the urban population can be calculated when the urbanization rate is 80%. In combination with the Code for Classification of Urban Land Use and Planning Standards of Development Land (GB50137-2011) [49], and the requirements of economic and intensive land use, which is calculated by 100 square meters per person, the limit scale of urban land expansion in Shandong province based on urban population growth is 9068.8 km2 by Equation (7).

4. Discussion

4.1. Comparison of the Two Predictions

Comparing the two predictions, it can be found that the limit time of urban land expansion in Shandong province is relatively close under these two perspectives. The limit time of urban land expansion from the perspective of economic development is slightly earlier than that from the perspective of urban population growth. The limit scale of urban land expansion from the perspective of urban population growth is larger than that from the perspective of economic development. The main reason is that according to the relationship between urban land expansion and economic development, industrial structure optimization and technological progress improve urban land use efficiency, and economic growth gradually reduces the demand for newly-added urban land along with social and economic development. When the demand for newly-added urban land tends to zero, it is considered that urban land has reached the expansion limit. At this time, although economic development has got rid of the dependence on urban land expansion, the urban population is still increasing along with the urbanization process. Moreover, with the improvement of socioeconomic level, the requirements of urban residents for production and living conditions and the urban environment will also increase. The increased demand for various types of land use such as residential, transportation, infrastructure and public service facilities, and ecological environment construction will also lead to urban land expansion. Thus, from the predicted results, the limit scale of urban land expansion from the perspective of urban population growth is larger than that of economic development.
Based on the comprehensive analysis of the two prediction results, the urban land in Shandong province will reach the expansion limit in 2037 with a limit scale of 9068.8 km2. Compared with the urban land area of 6521.61 km2 in 2018, the potential of urban land expansion in Shandong province is 2547.19 km2 in the future, and the duration of expansion is 19 years.

4.2. Urban Land Expansion Trends and Urban Development Policy Requirements

In this study, the results show that with urbanization and economic development, the dependence of economic development on urban land expansion has gradually decreased in Shandong province. According to the prediction results, after 2033, the role of urban land expansion in promoting economic development in Shandong province will be significantly reduced, and more newly-added urban land will be used to improve the urban residents’ production and living conditions and the urban ecological environment. This trend is in line with the requirements of China’s strict land use management system and high-quality urban development policies. Under the guidance of the policies of intensive land use and the transformation of old growth drivers into new ones, in the future, the urban industrial structure of Shandong province will be continuously optimized, and land use efficiency will continue to improve. This will lead to the demand for economic development for new urban land gradually decreasing. In addition, in the context of the current high-quality urban development, improving people’s livelihood and strengthening urban ecological construction in the future will become the focus of urban development. Thus, the demand for infrastructure land, public facilities land, ecological land, residential land, and traffic land will further increase, leading to urban land expansion.

4.3. Research Methods

Socioeconomic development is the main influencing factor of urban land expansion. Many studies have predicted the scale of urban land in a certain period based on the influencing factors of urban land expansion. The research on the prediction of urban land limit scale is mainly carried out from the perspective of the demand for construction land in the process of urbanization, and there is limited research on the expansion limit of urban land from the perspective of the economic effect of urban land use. This study introduces the marginal effect principle in economics and constructs the marginal effect model of urban land expansion from the perspective of economic development demand for urban land to predict the expansion limit of urban land. This model helps improve the research method of urban land expansion. In addition, compared with the prediction of urban land in a certain period, based on urbanization and economic growth, predicting the expansion limit of urban land from the perspectives of time and space can better reflect the trend of urban land expansion. Moreover, from the perspectives of time and space, the prediction of the expansion limit of urban land also enriches the research content of urban land expansion to a certain extent.

4.4. Deficiencies and Future Research

This paper only predicts the expansion limits of urban land from the perspectives of economic development and population growth. However, urban land use change is a dynamic and complex process, and urban land expansion is affected by a variety of factors, such as natural factors, policies, and city functional orientation. In the future, it is necessary to consider the comprehensive impact of various factors on urban land expansion and further improve the prediction model. Moreover, due to the regional differences in population distribution and socioeconomic development, the characteristics of urban land expansion are different in different regions and cities of different levels. Therefore, empirical studies on the expansion limits of urban land according to the development characteristics of different cities can improve the efficiency of urban land expansion regulation, which is also the direction of further research.

5. Conclusions

The present study analyzes the characteristics and main influencing factors of urban land expansion in Shandong province. It predicts the limit time and limit scale of urban land expansion in Shandong province from the two perspectives of economic development and urban population growth. The results can provide references for land use planning in Shandong province and regulating the total scale of urban land from the provincial scale. It can be concluded:
(1)
From 2001 to 2018, the total scale of urban land in Shandong province showed a trend of continuous expansion, but the expansion area and expansion rate fluctuated and declined.
(2)
Economic development and urban population growth are the main factors influencing Shandong province’s urban land expansion. With the process of urbanization and economic development, urban land expansion presents obvious stage characteristics. From the analysis of the relationship between urban land expansion and economic development, Shandong province’s change in urban land scale conforms to the law of diminishing marginal effect.
(3)
In 2037, the urbanization rate of Shandong province will reach 80%, urbanization will enter a stable development stage, the urban population will tend to be stable, and urban land will reach the expansion limit. The limit scale is 9068.8 km2. Based on urban population growth, the limit time of urban land expansion is slightly later than that based on economic development (2033), and the limit scale is expected to be larger than 7982 km2, as predicted based on economic development. According to the law of economic development and population growth, the duration of urban land expansion in Shandong province is less than 20 years.

Author Contributions

Conceptualization, X.W. and B.C.; methodology, X.W. and B.C.; formal analysis, X.W. and B.C.; investigation, B.C. and Q.D.; resources, X.W.; data curation, B.C. and Q.D.; writing—original draft preparation, X.W. and B.C.; writing—review and editing, X.W. and Q.D.; supervision, X.W.; project administration, X.W.; funding acquisition, X.W. All authors have read and agreed to the published version of the manuscript.

Funding

This research was funded by Shandong Social Science Fund (19BJCJ23).

Institutional Review Board Statement

Not applicable.

Informed Consent Statement

Not applicable.

Data Availability Statement

Urban land data are obtained from the Shandong Urban Construction Statistical Annual Report (2001–2019) (Statistics compiled by the Housing and Urban-Rural Development Department of Shandong Province). The socioeconomic data are obtained from the China City Statistical Yearbook (2001–2019) and the Statistical Yearbook of prefecture-level cities of Shandong province (https://data.cnki.net, accessed on 4 June 2021).

Conflicts of Interest

The authors declare no conflict of interest.

References

  1. Ji, Y.; Guo, X.; Zhong, S.; Wu, L. Land financialization, uncoordinated development of population urbanization and land urbanization, and economic growth: Evidence from China. Land 2020, 9, 481. [Google Scholar] [CrossRef]
  2. Wang, X.R.; Hui, C.M.; Sun, J.X. Population migration, urbanization and housing prices: Evidence from the cities in China. Habitat. Int. 2017, 66, 49–56. [Google Scholar] [CrossRef]
  3. Meng, X.; Han, J. Roads, economy, population density, and CO2: A city-scaled causality analysis. Resour. Conserv. Recycl. 2018, 128, 508–515. [Google Scholar] [CrossRef]
  4. Li, G.; Sun, S.; Fang, C. The varying driving forces of urban expansion in China: Insights from a spatial-temporal analysis. Landsc. Urban Plan. 2018, 174, 63–77. [Google Scholar] [CrossRef]
  5. Yang, Z.; Chen, Y.; Wu, Z. How urban expansion affects the thermal environment? A study of the impact of natural cities on the thermal field value and footprint of thermal environment. Ecol. Indic. 2021, 126, 107632. [Google Scholar] [CrossRef]
  6. Yu, J.; Zhou, K.; Yang, S. Land use efficiency and influencing factors of urban agglomerations in China. Land Use Policy 2019, 88, 104143. [Google Scholar] [CrossRef]
  7. Kuang, B.; Lu, X.; Han, J.; Fan, X.; Zuo, J. How urbanization influence urban land consumption intensity: Evidence from China. Habitat. Int. 2020, 100, 102103. [Google Scholar] [CrossRef]
  8. Yang, Z.; Chen, Y.; Guo, G.; Zheng, Z.; Wu, Z. Using nighttime light data to identify the structure of polycentric cities and evaluate urban centers. Sci. Total Environ. 2021, 780, 146586. [Google Scholar] [CrossRef]
  9. Tang, L.; Liu, J.; Ma, X. Research on coordination between urban construction land consumption intensity and socio-economic development level: From the perspective of urban development stages. China Land Sci. 2018, 31, 73–82. [Google Scholar]
  10. Mishra, B.K.; Mebeelo, K.; Chakraborty, S.; Kumar, P.; Gautam, A. Implications of urban expansion on land use and land cover: Towards sustainable development of Mega Manila, Philippines. GeoJournal 2021, 86, 927–942. [Google Scholar] [CrossRef]
  11. Armen, P. Quantifying urban growth in 10 post-Soviet cities using Landsat data and machine learning. Int. J. Remote Sens. 2018, 39, 8688–8702. [Google Scholar]
  12. Hidayat, O.; Kajita, Y. Land use management and urban land expansion in Kabul: A case study of rapid urbanization. Curr. Urban Stud. 2019, 7, 193–205. [Google Scholar] [CrossRef]
  13. Morshed, N.; Yorke, C.; Zhang, Q. Urban expansion pattern and land use dynamics in Dhaka, 1989-2014. Prof. Geogr. 2017, 69, 396–411. [Google Scholar] [CrossRef]
  14. Wiatkowska, B.; Słodczyk, J.; Stokowska, A. Spatial-temporal land use and land cover changes in urban areas using remote sensing images and GIS analysis: The case study of Opole, Poland. Geosciences 2021, 11, 312. [Google Scholar] [CrossRef]
  15. Sushanta, G.; Sabina, I.; Muyeed, H.M. Analysis of impervious land-cover expansion using remote sensing and GIS: A case study of Sylhet sadar upazila. Appl. Geogr. 2018, 98, 156–165. [Google Scholar]
  16. Qian, M.; Pu, L.; Zhang, J.; Zhang, M. Urban spatial expansion characteristics in China’s rapid urbanization region: A case study of SXC region. Int. J. Geosci. 2013, 4, 1365–1375. [Google Scholar] [CrossRef] [Green Version]
  17. Maimaiti, B.; Ding, J.; Simayi, Z.; Kasimu, A. Characterizing urban expansion of Korla city and its spatial-temporal patterns using remote sensing and GIS methods. J. Arid. Land 2017, 9, 458–470. [Google Scholar] [CrossRef] [Green Version]
  18. Liu, S.; Liao, Q.; Liang, Y.; Li, Z.; Huang, C. Spatio–temporal heterogeneity of urban expansion and population growth in China. Int. J. Environ. Res. Public Health 2021, 18, 13031. [Google Scholar] [CrossRef]
  19. Salem, M.; Tsurusaki, N.; Divigalpitiya, P. Analyzing the driving factors causing urban expansion in the peri-urban areas using logistic regression: A case study of the greater Cairo region. Infrastructures 2019, 4, 4. [Google Scholar] [CrossRef] [Green Version]
  20. Zhang, Y.; Xie, H. Interactive relationship among urban expansion, economic development, and population growth since the reform and opening up in China: An analysis based on a vector error correction model. Land 2019, 8, 153. [Google Scholar] [CrossRef] [Green Version]
  21. Khan, A.A.; Arshad, S.; Mohsin, M. Population growth and its impact on urban expansion: A case study of Bahawalpur, Pakistan. Univers. J. Geosci. 2014, 2, 229–241. [Google Scholar] [CrossRef]
  22. Huang, B.; Wu, B.; Barry, M. Geographically and temporally weighted regression for modeling spatio-temporal variation in house prices. Int. J. Geogr. Inf. Sci. 2010, 24, 383–401. [Google Scholar] [CrossRef]
  23. Marshall, J.D. Urban land area and population growth: A new scaling relationship for metropolitan expansion. Urban Stud. 2007, 44, 1889–1904. [Google Scholar] [CrossRef]
  24. Alsharif, A.; Pradhan, B. Urban sprawl analysis of Tripoli metropolitan city (Libya) using remote sensing data and multivariate Logistic regression model. J. Indian Soc. Remote 2014, 42, 149–163. [Google Scholar] [CrossRef]
  25. Alice, C.; Yann, L.; Harold, L. What drives land take and urban land expansion? A systematic review. Land Use Policy 2018, 79, 339–349. [Google Scholar]
  26. Yan, Y.; Ju, H.; Zhang, S.; Jiang, W. Spatio temporal patterns and driving forces of urban expansion in coastal areas: A study on urban agglomeration in the Pearl River Delta, China. Sustainability 2020, 12, 191. [Google Scholar] [CrossRef] [Green Version]
  27. Zhou, L.; Dang, X.; Mu, H.; Wang, B.; Wang, S. Cities are going uphill: Slope gradient analysis of urban expansion and its driving factors in China. Sci. Total Environ. 2021, 775, 145836. [Google Scholar] [CrossRef]
  28. You, H.; Yang, X. Urban expansion in 30 megacities of China: Categorizing the driving force profiles to inform the urbanization policy. Land Use Policy 2017, 68, 531–551. [Google Scholar] [CrossRef]
  29. Shu, B.; Bakker, M.M.; Zhang, H.; Li, Y.; Carsjens, G.J. Modeling urban expansion by using variable weights logistic cellular automata: A case study of Nanjing, China. Int. J. Geogr. Inf. Sci. 2017, 31, 1314–1333. [Google Scholar] [CrossRef]
  30. Liu, X.; Liang, X.; Li, X.; Xu, X.; Ou, J.; Chen, Y.; Li, S.; Wang, S.; Pei, F. A future land use simulation model (FLUS) for simulating multiple land use scenarios by coupling human and natural effects. Landsc. Urban Plan. 2017, 168, 94–116. [Google Scholar] [CrossRef]
  31. Liang, X.; Liu, X.; Li, X.; Chen, Y.; Tian, H.; Yao, Y. Delineating multi-scenario urban growth boundaries with a CA-based FLUS model and morphological method. Landsc. Urban Plan. 2018, 177, 47–63. [Google Scholar] [CrossRef]
  32. Chen, Y.; Li, X.; Liu, X.; Ai, B.; Li, S. Capturing the varying effects of driving forces over time for the simulation of urban growth by using survival analysis and cellular automata. Landsc. Urban Plan. 2016, 152, 59–71. [Google Scholar] [CrossRef]
  33. Hu, Z.; Lo, C.P. Modeling urban growth in Atlanta using logistic regression. Comput. Environ. Urban Syst. 2007, 31, 667–688. [Google Scholar] [CrossRef]
  34. Tayyebi, A.; Pijanowski, B.C.; Pekin, B. Two rule-based urban growth boundary models applied to the Tehran metropolitan area, Iran. Appl. Geogr. 2011, 31, 908–918. [Google Scholar] [CrossRef]
  35. Wang, P.; Zheng, D.; Huang, S. The influence factors of urban land expansion and calculation of its utmost scale: A case study of Haikou city. J. Shanxi Agric. Univ. (Soc. Sci. Ed) 2018, 17, 44–50. [Google Scholar]
  36. Shi, Y.; Wu, J.; Huang, S. Study on estimating methods of the utmost scale of construction land in Shanghai. Econ. Geogr. 2013, 33, 14. [Google Scholar]
  37. Zeng, X.; Xun, C.; Wang, W.; Du, J. Growth of city size in China: Estimate of the limit scale. China Popul. Resour. Environ. 2013, 23, 55–61. [Google Scholar]
  38. Liu, Y.; Geng, H.; Sun, W.; Li, C.; Chu, X. Analysis on the regional differences and driving factors of urban construction land expansion. China Popul. Resour. Environ. 2017, 27, 122–127. [Google Scholar]
  39. Liu, B. The decoupling relationship between the expansion of urban construction land and economic growth in Jilin province. J. Resour. Ecol. 2019, 10, 275–281. [Google Scholar]
  40. Huang, Q.; Liu, Y. The Coupling between Urban Expansion and Population Growth: An Analysis of Urban Agglomerations in China (2005–2020). Sustainability 2021, 13, 7250. [Google Scholar] [CrossRef]
  41. Tang, J.; Lv, C.; Yang, X. Analysis of driving forces of urban land expansion in Suzhou-Wuxi-Changzhou region. Resour. Sci. 2009, 31, 801–806. [Google Scholar]
  42. Zhang, Q. Analysis research on relationship between land use and economic development in process of industrialization advancement in South Korean. China Popul. Resour. Environ. 2007, 17, 81–84. [Google Scholar]
  43. Gallo, J. Space-time analysis of GDP disparities among European regions: A Markov chains approach. Int. Reg. Sci. Rev. 2004, 27, 138–163. [Google Scholar] [CrossRef]
  44. Aroca, P.; Bosch, M.; Maloney, W. Spatial dimensions of trade liberalization and economic convergence: Mexico 1985–2002. World Bank Econ. Rev. 2005, 19, 345–378. [Google Scholar] [CrossRef]
  45. Li, X.; Jiang, D.; Qu, F.; Zhu, P. Metrical relationship between the marginal land use and economic growth. China Popul. Resour. Environ. 2009, 19, 92–95. [Google Scholar]
  46. Zhang, L.; Zhang, Y. Duration, rate and revelation of rapid gradual progress stage of China urbanization based on logistic model. J. Henu. (Nat. Sci. Ed.) 2015, 45, 550–555. [Google Scholar]
  47. Chen, S.; Zhang, L.; Xu, X. Stage characteristic and trend of urbanization evolution in China based on logistic model. Arid. Land Geogr. 2015, 38, 384–390. [Google Scholar]
  48. Chen, M.; Wang, K. Speed and tendency of China’s urbanization: Comparative study based on cross-country panel data model. City Plan. Rev. 2013, 37, 16–21. [Google Scholar]
  49. GB50137-2011; Code for Classification of Urban Land Use and Planning Standards of Development Land. Ministry of Housing and Urban-Rural Development of the People’s Republic of China: Beijing, China. Available online: http://www.mohurd.gov.cn (accessed on 5 September 2021).
Figure 1. Location of the study area.
Sustainability 15 00073 g001
Figure 2. Marginal urban land and its change rate in Shandong province from 2001 to 2018.
Sustainability 15 00073 g002
Figure 3. Logistic fitting curve of the total population in Shandong province.
Sustainability 15 00073 g003
Table 1. Test results of Shapiro–Wilk.
VariableStatisticdfp
The output value of secondary and tertiary industries0.938180.270
Urban population0.959180.586
Urban land area0.959180.587
Table 2. Characteristics of urban land expansion and economic development in Shandong province.
TimeAverage Annual Growth Rate of Output Value of Secondary and Tertiary Industries (%)Average Annual Expansion rate of Urban Land (%)YearOutput Value Per Area of Secondary and Tertiary Industries (100 million Yuan/km2)
2001–200618.6611.9420013.71
2007–201310.645.5520136.88
2014–20185.333.5220187.51
Table 3. Results of the White heteroscedasticity test.
ParameterValueParameterValue
F-statistic5.892Prob. F(2,15)0.0129
Obs × R-squared7.920Prob. Chi-Square (2)0.0191
Scaled explained SS8.593Prob. Chi-Square (2)0.0136
Table 4. Regression analysis results of lnC and lnD by Eviews in Shandong province from 2001 to 2018.
VariateCoefficientStd. Errort-StatisticProb.
R7.1550.10269.9450.000
N0.5770.01057.2150.000
R20.995Akaike info criterion−4.498
Adjusted R20.995Schwarz criterion−4.399
S.E. of regression0.024Hannan-Quinn info criterion−4.483
Sum squared resid0.009Durbin-Watson stat0.494
Log-likelihood42.479F-Statistic3273.51
Mean dependent var12.998Prob (F-Statistic)0.000
S.D. dependent var0.337
Table 5. Regression analysis results of ln(|M′|) and t by Eviews in Shandong province from 2001 to 2018.
VariateCoefficientStd. Errort-StatisticProb.
R294.996718.12116.2790.000
N−0.15080.009−16.7580.000
R20.946Akaike info criterion−0.292
Adjusted R20.943Schwarz criterion−0.193
S.E. of regression0.198Hannan–Quinn info criterion−0.278
Sum squared resid0.630Durbin–Watson stat0.144
Log-likelihood4.625F-Statistic280.825
Mean dependent var−8.665Prob (F-Statistic)0.000
S.D. dependent var0.829
Table 6. Estimation results of urban land expansion based on the logistic curve in Shandong province.
KbcR2FSig.
79820.99990.00040.98961517.8440.000
Table 7. Logistic model parameters of urbanization rate in Shandong province.
KbcR2FSig.
1000.94960.01640.99071702.23830.000
Table 8. Logistic model parameters of total population change in Shandong province.
KbcR2FSig.
11,3360.96420.000050.99044006.5120.000
Disclaimer/Publisher’s Note: The statements, opinions and data contained in all publications are solely those of the individual author(s) and contributor(s) and not of MDPI and/or the editor(s). MDPI and/or the editor(s) disclaim responsibility for any injury to people or property resulting from any ideas, methods, instructions or products referred to in the content.

