


Delineating Groundwater Potential Zones in Hyper-Arid Regions Using the Applications of Remote Sensing and GIS Modeling in the Eastern Desert, Egypt


Abstract
:1. Introduction
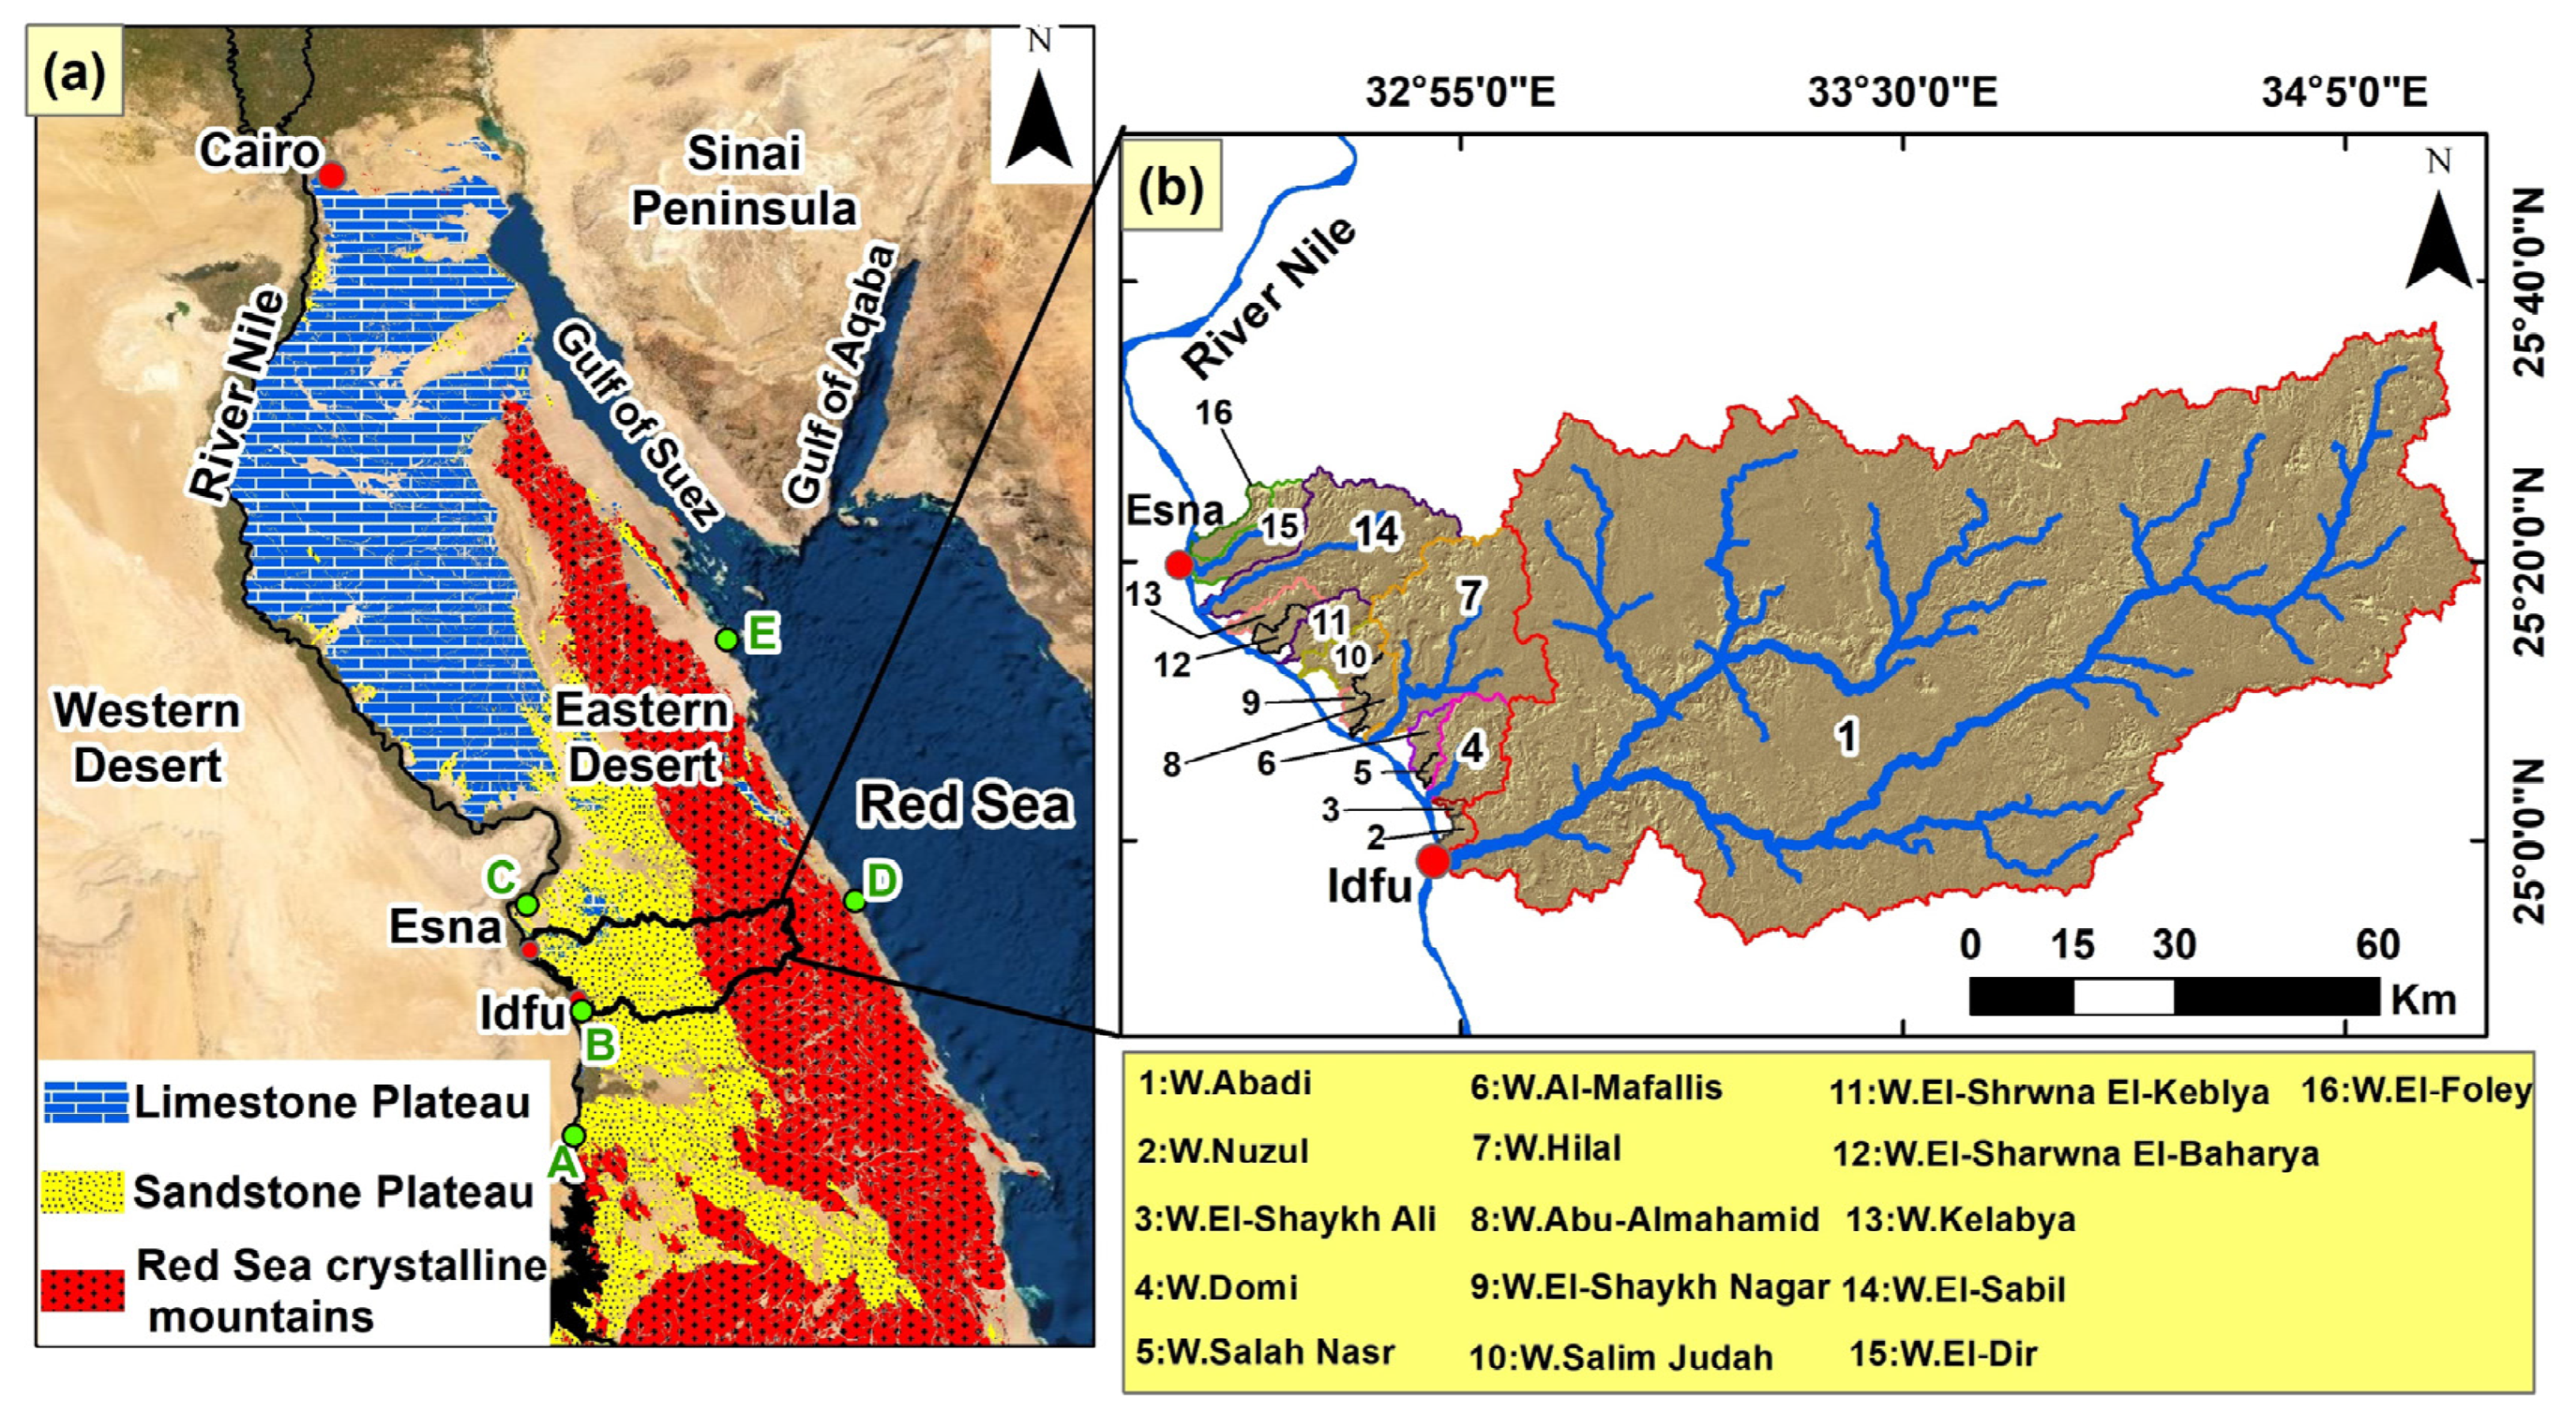
2. Site Description
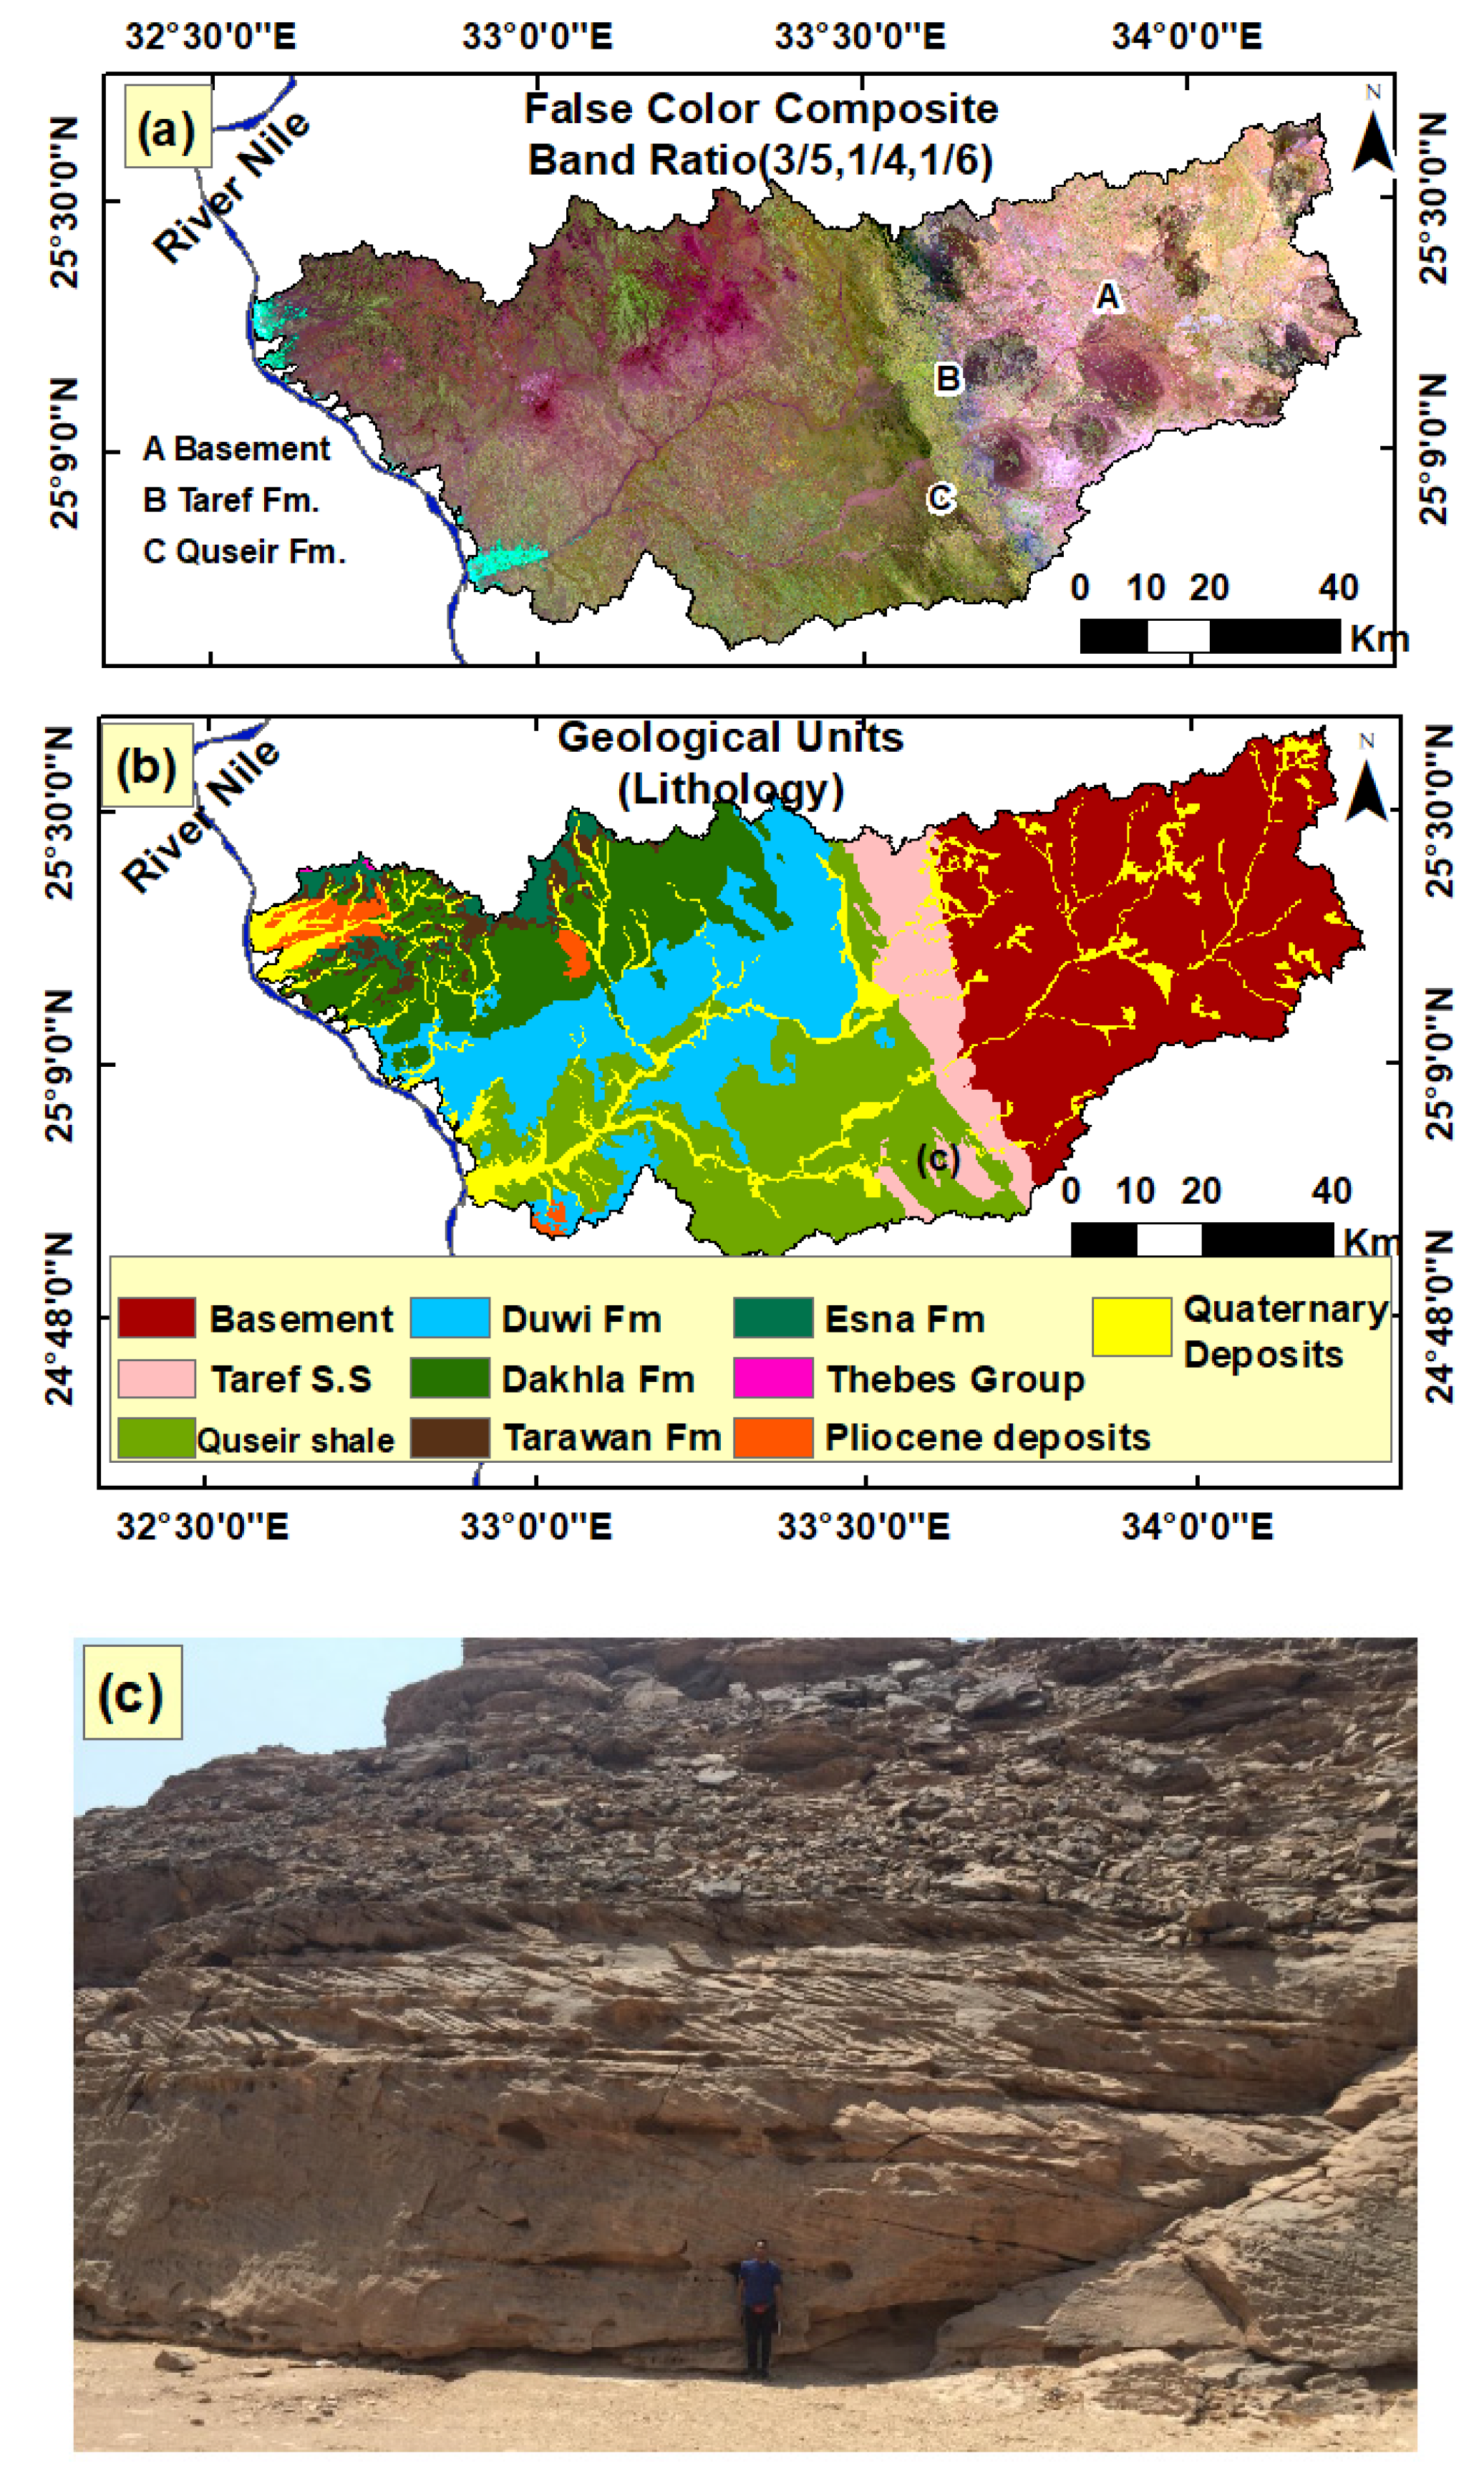
3. Geological Setting
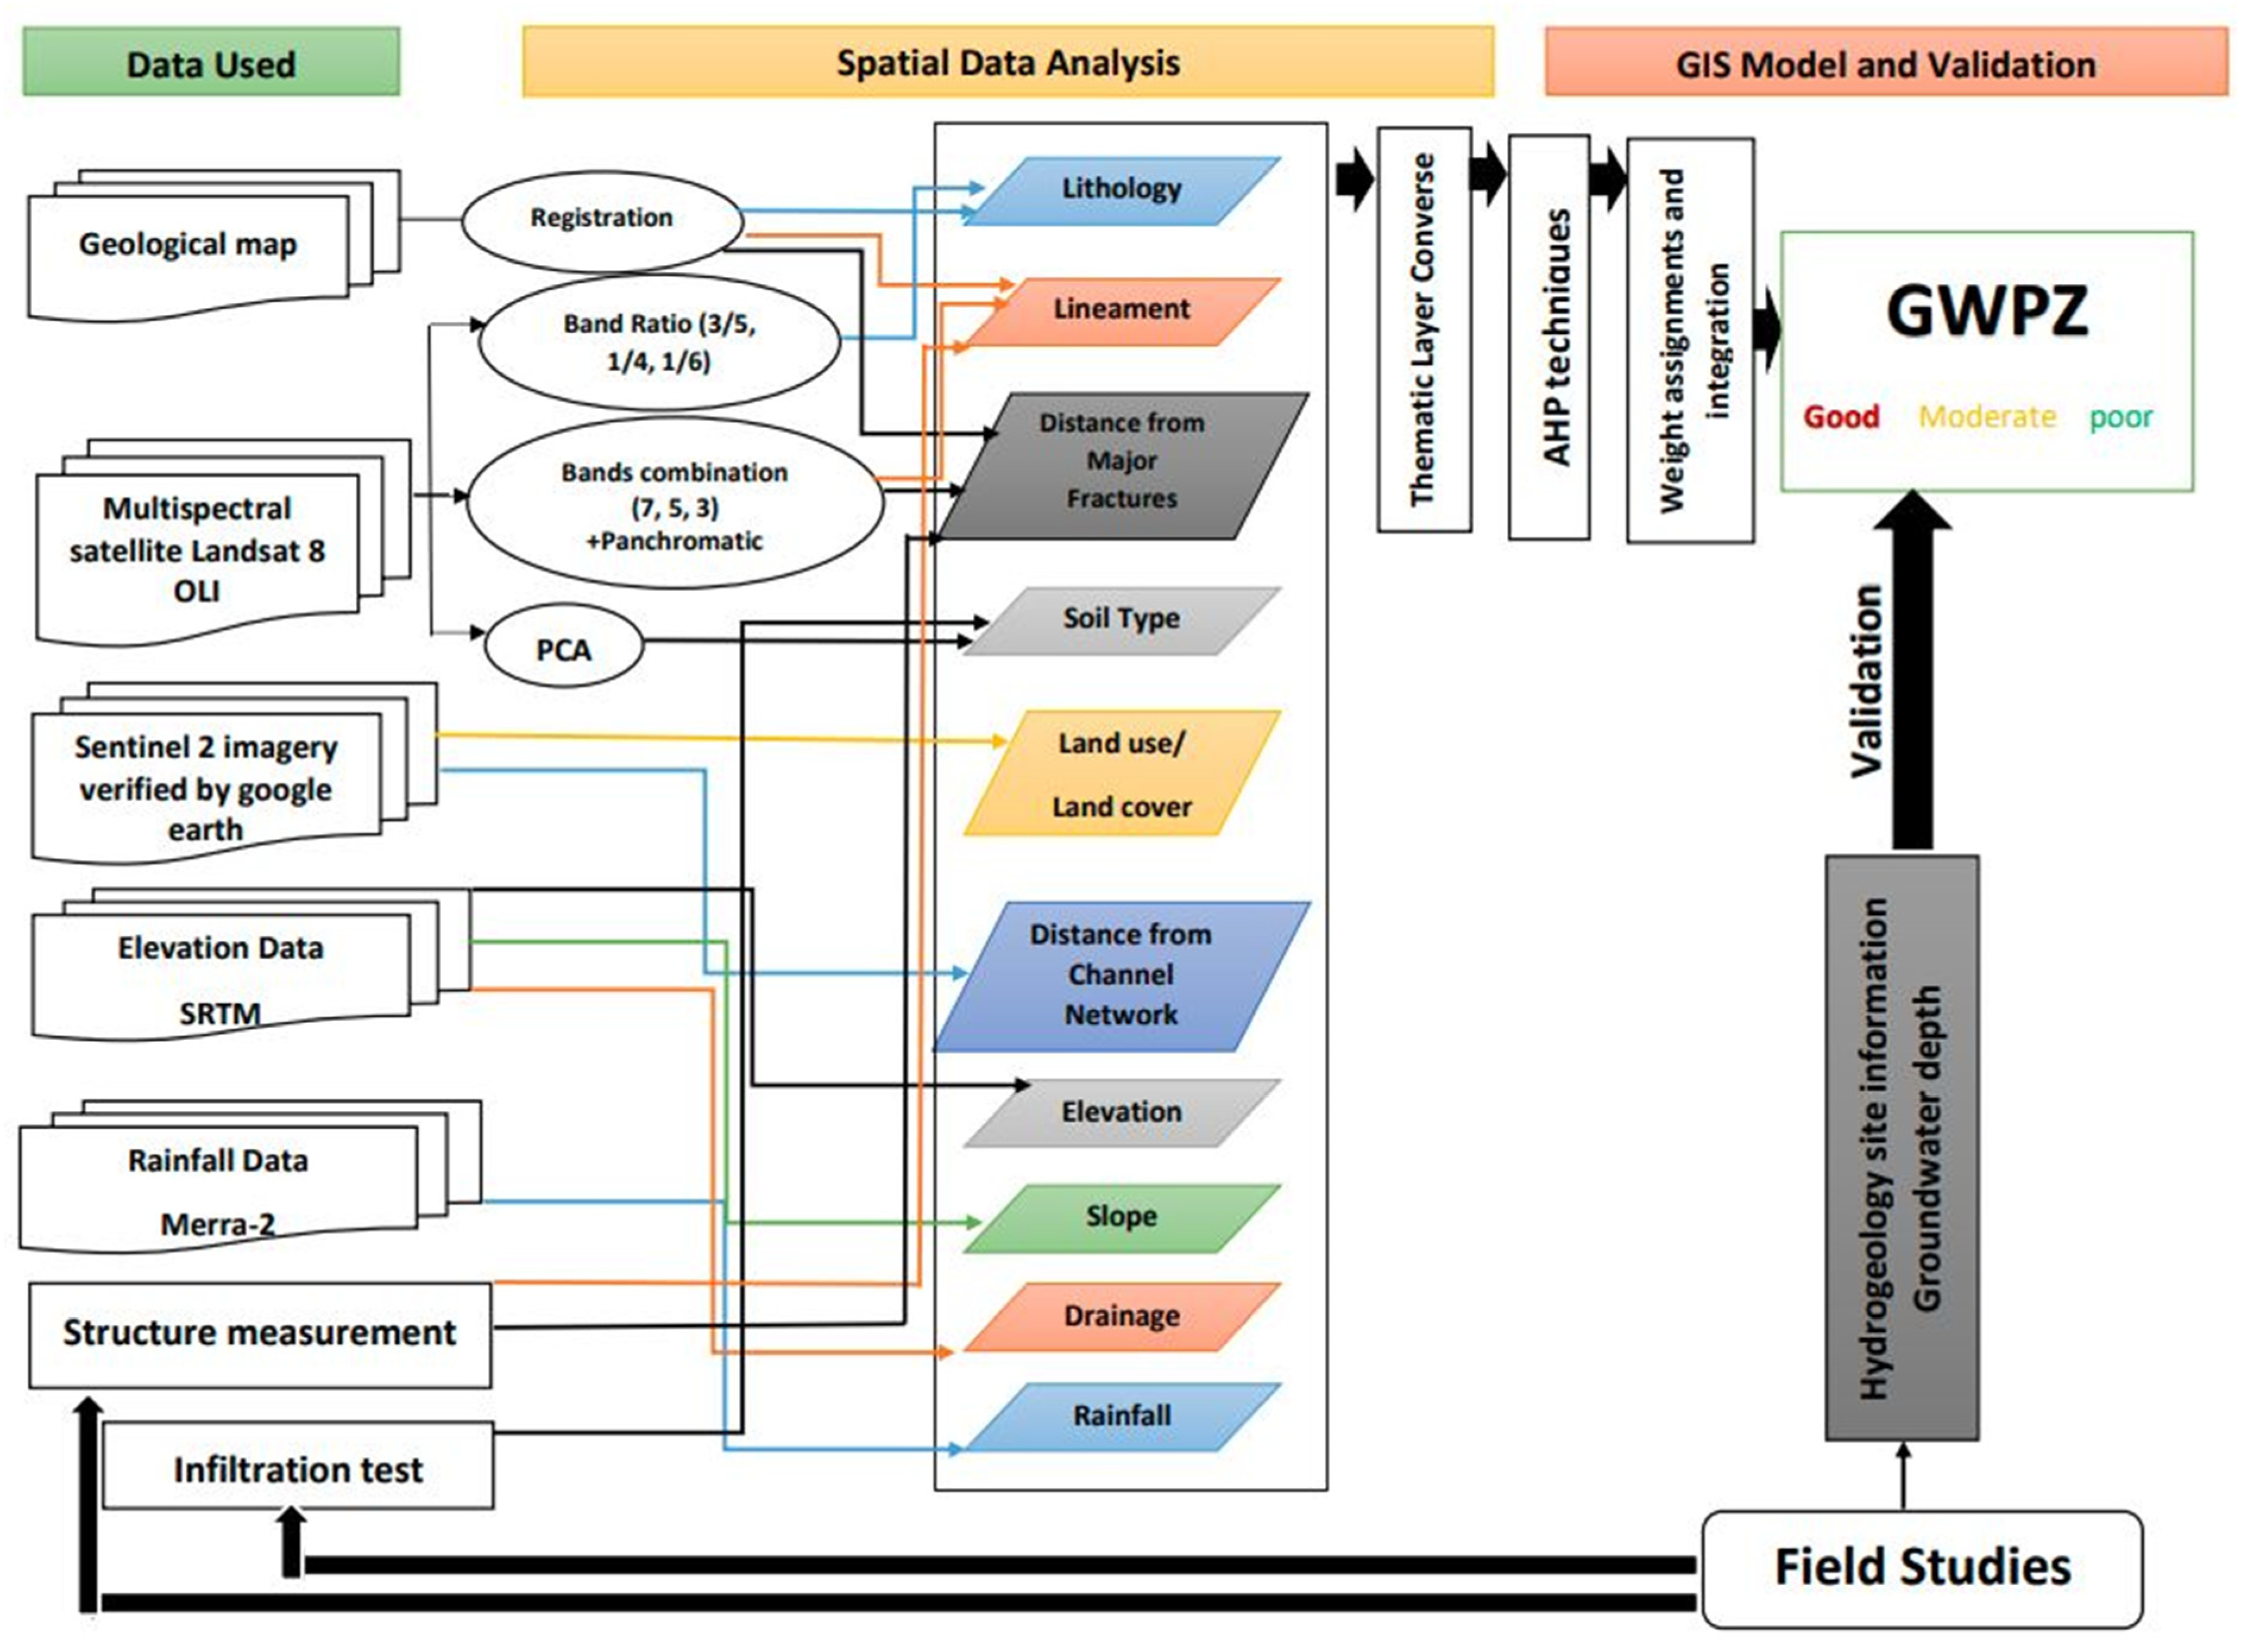
4. Methodology and Data
5. Results and Discussion
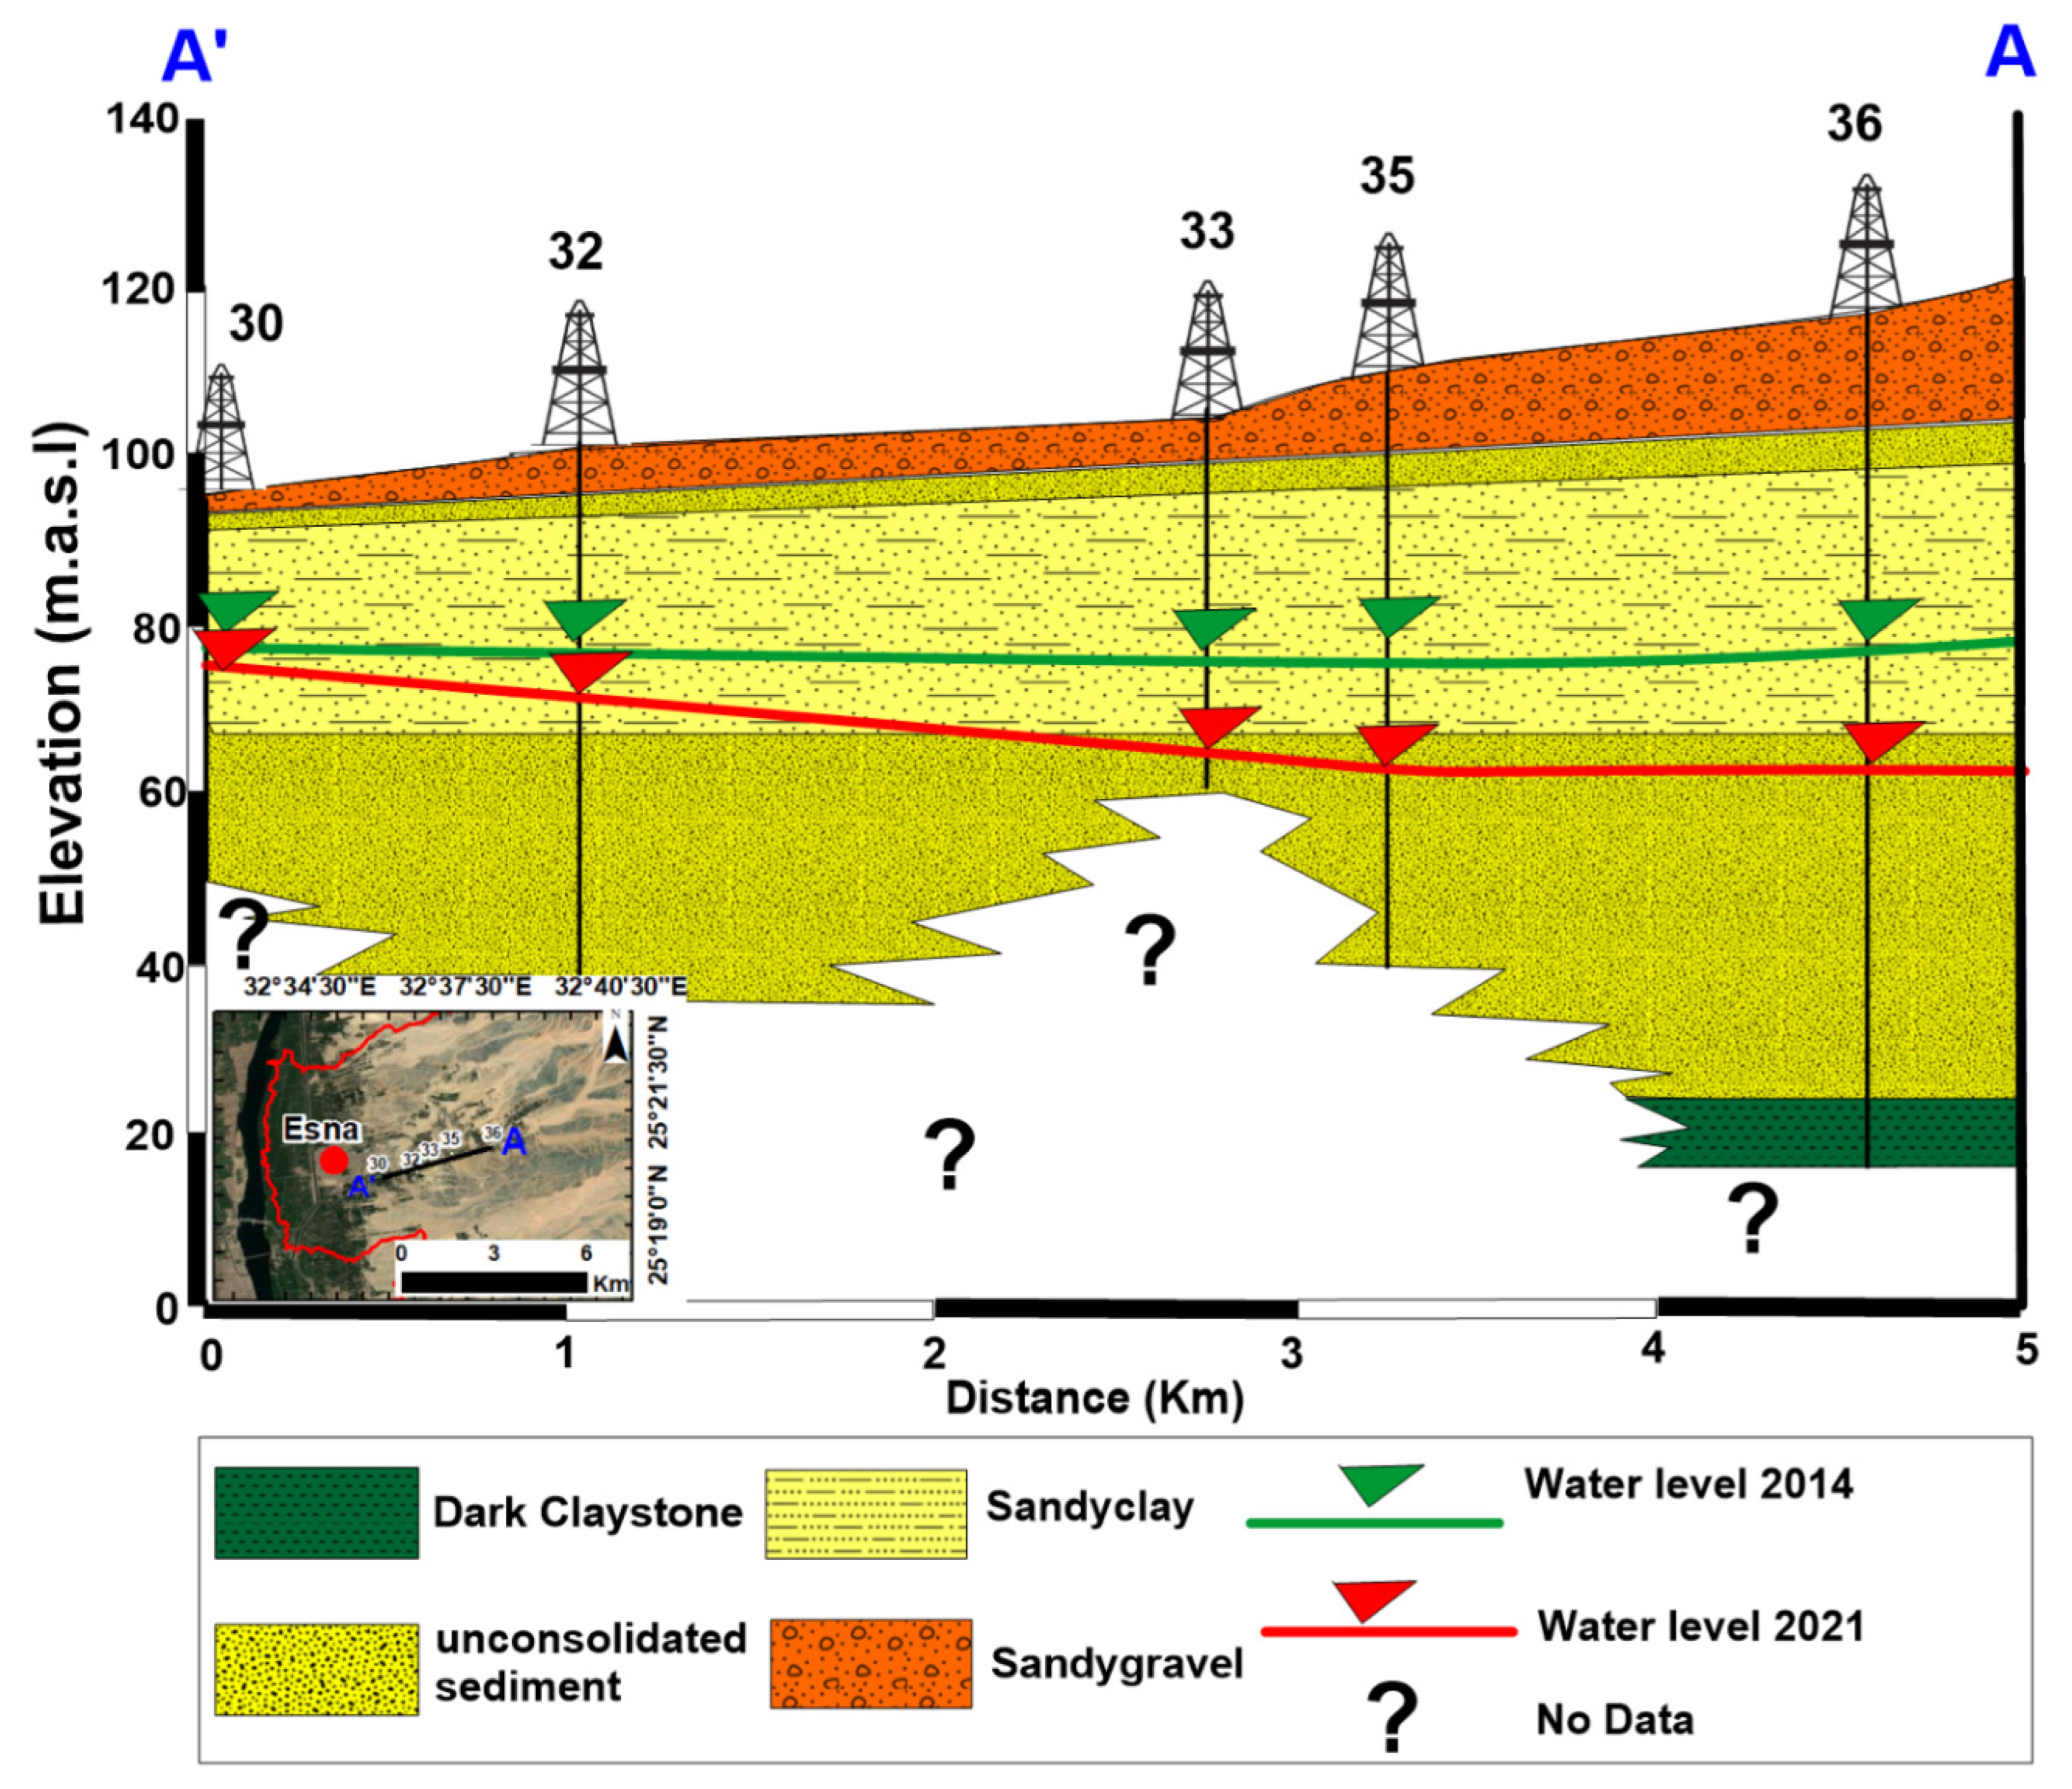
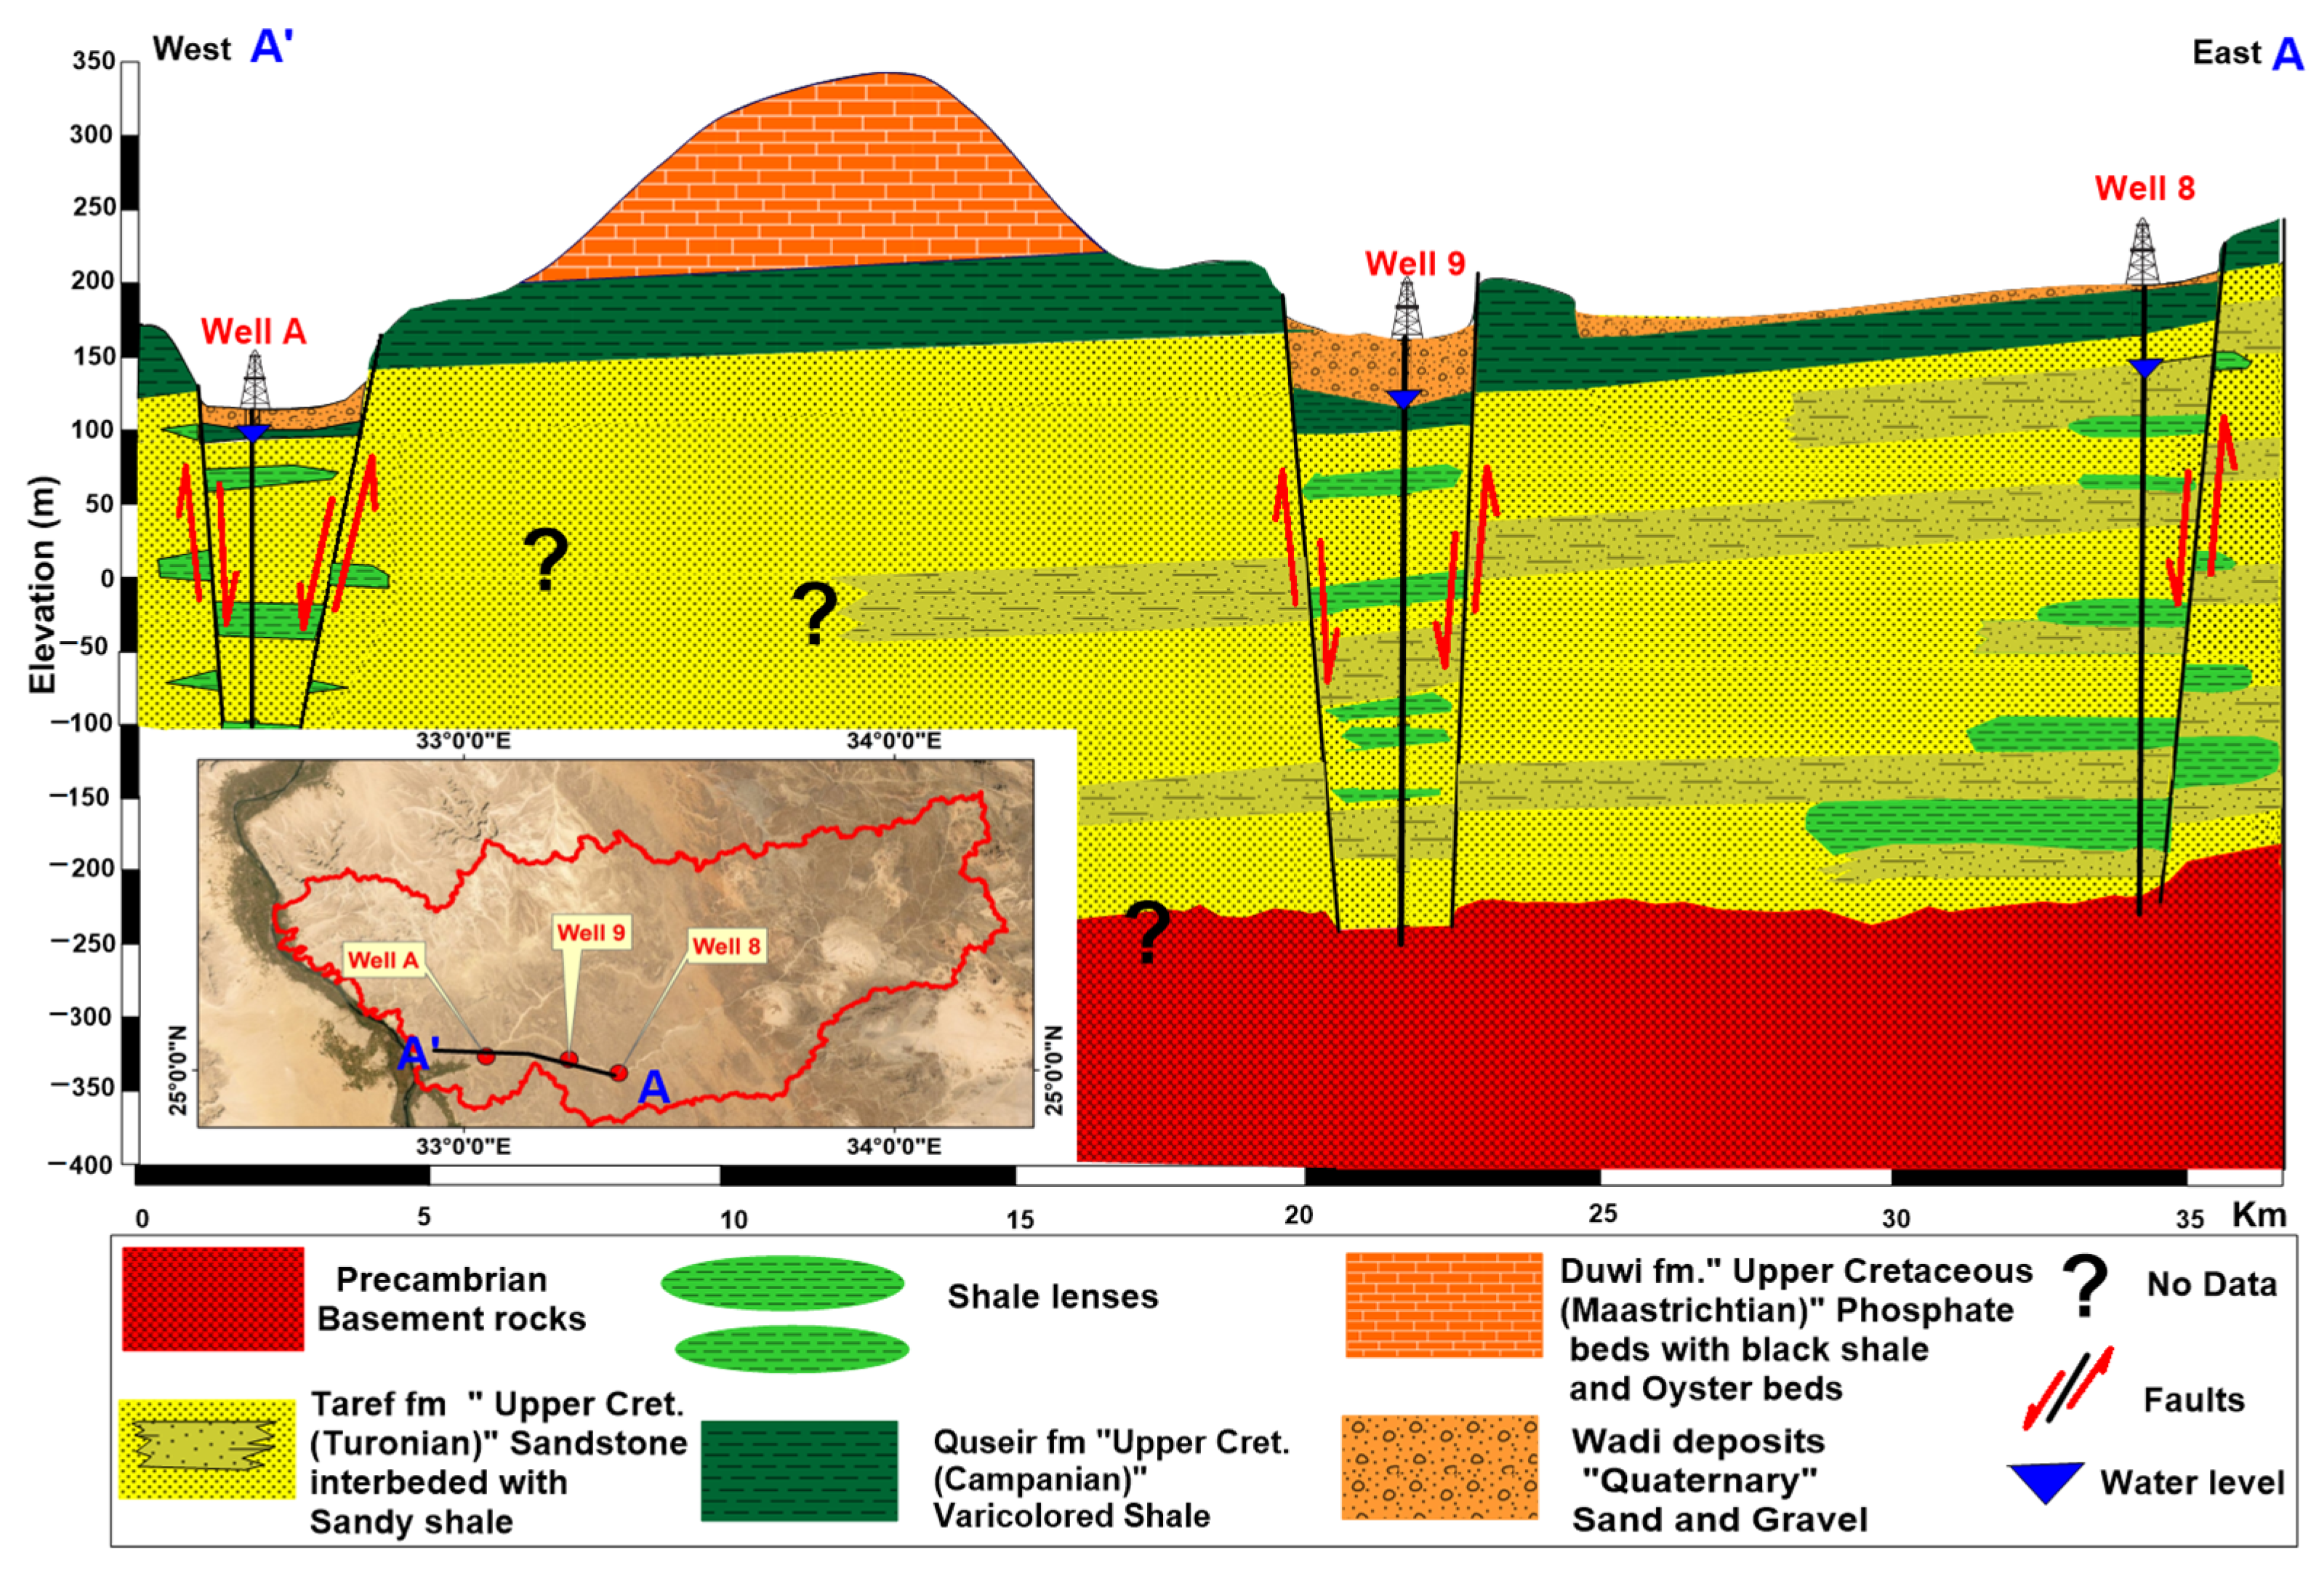
5.1. Hydrogeological Condition
5.2. Preparation of Thematic Layers Influencing Groundwater Recharge
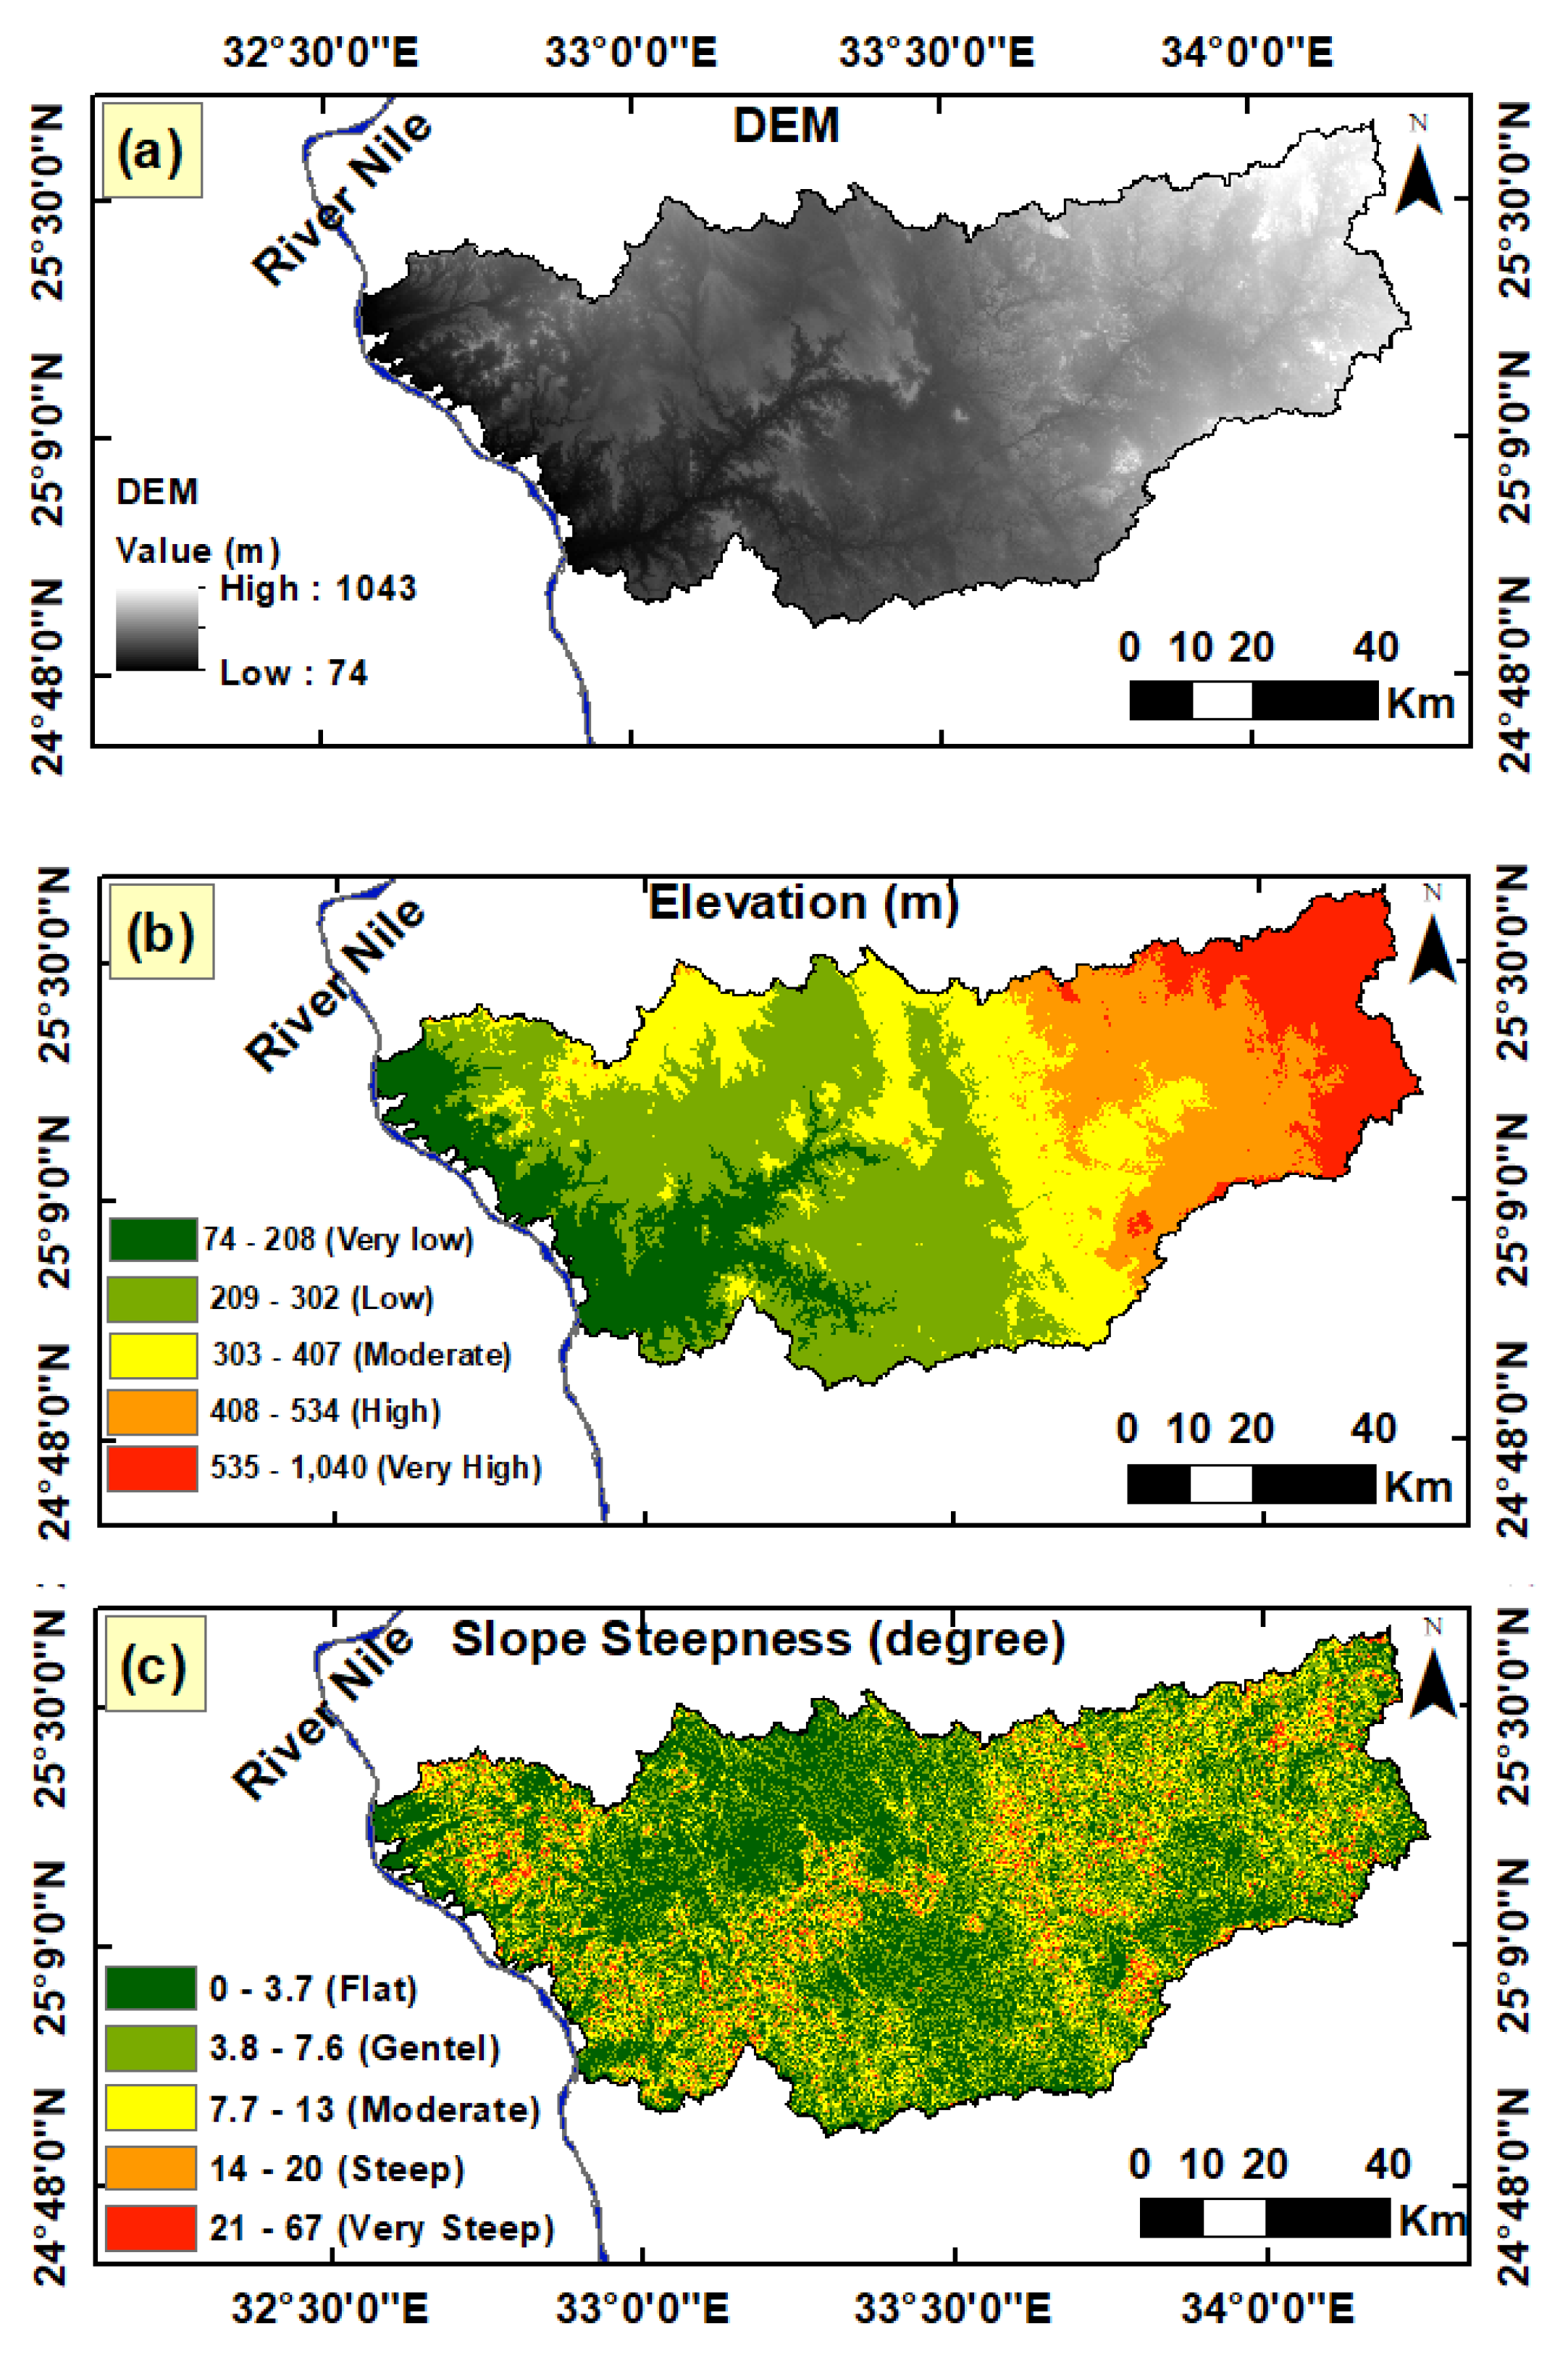
5.2.1. Elevation
5.2.2. Slope Steepness
5.2.3. Density of Drainage Network
5.2.4. Precipitation (Rainfall Distribution)
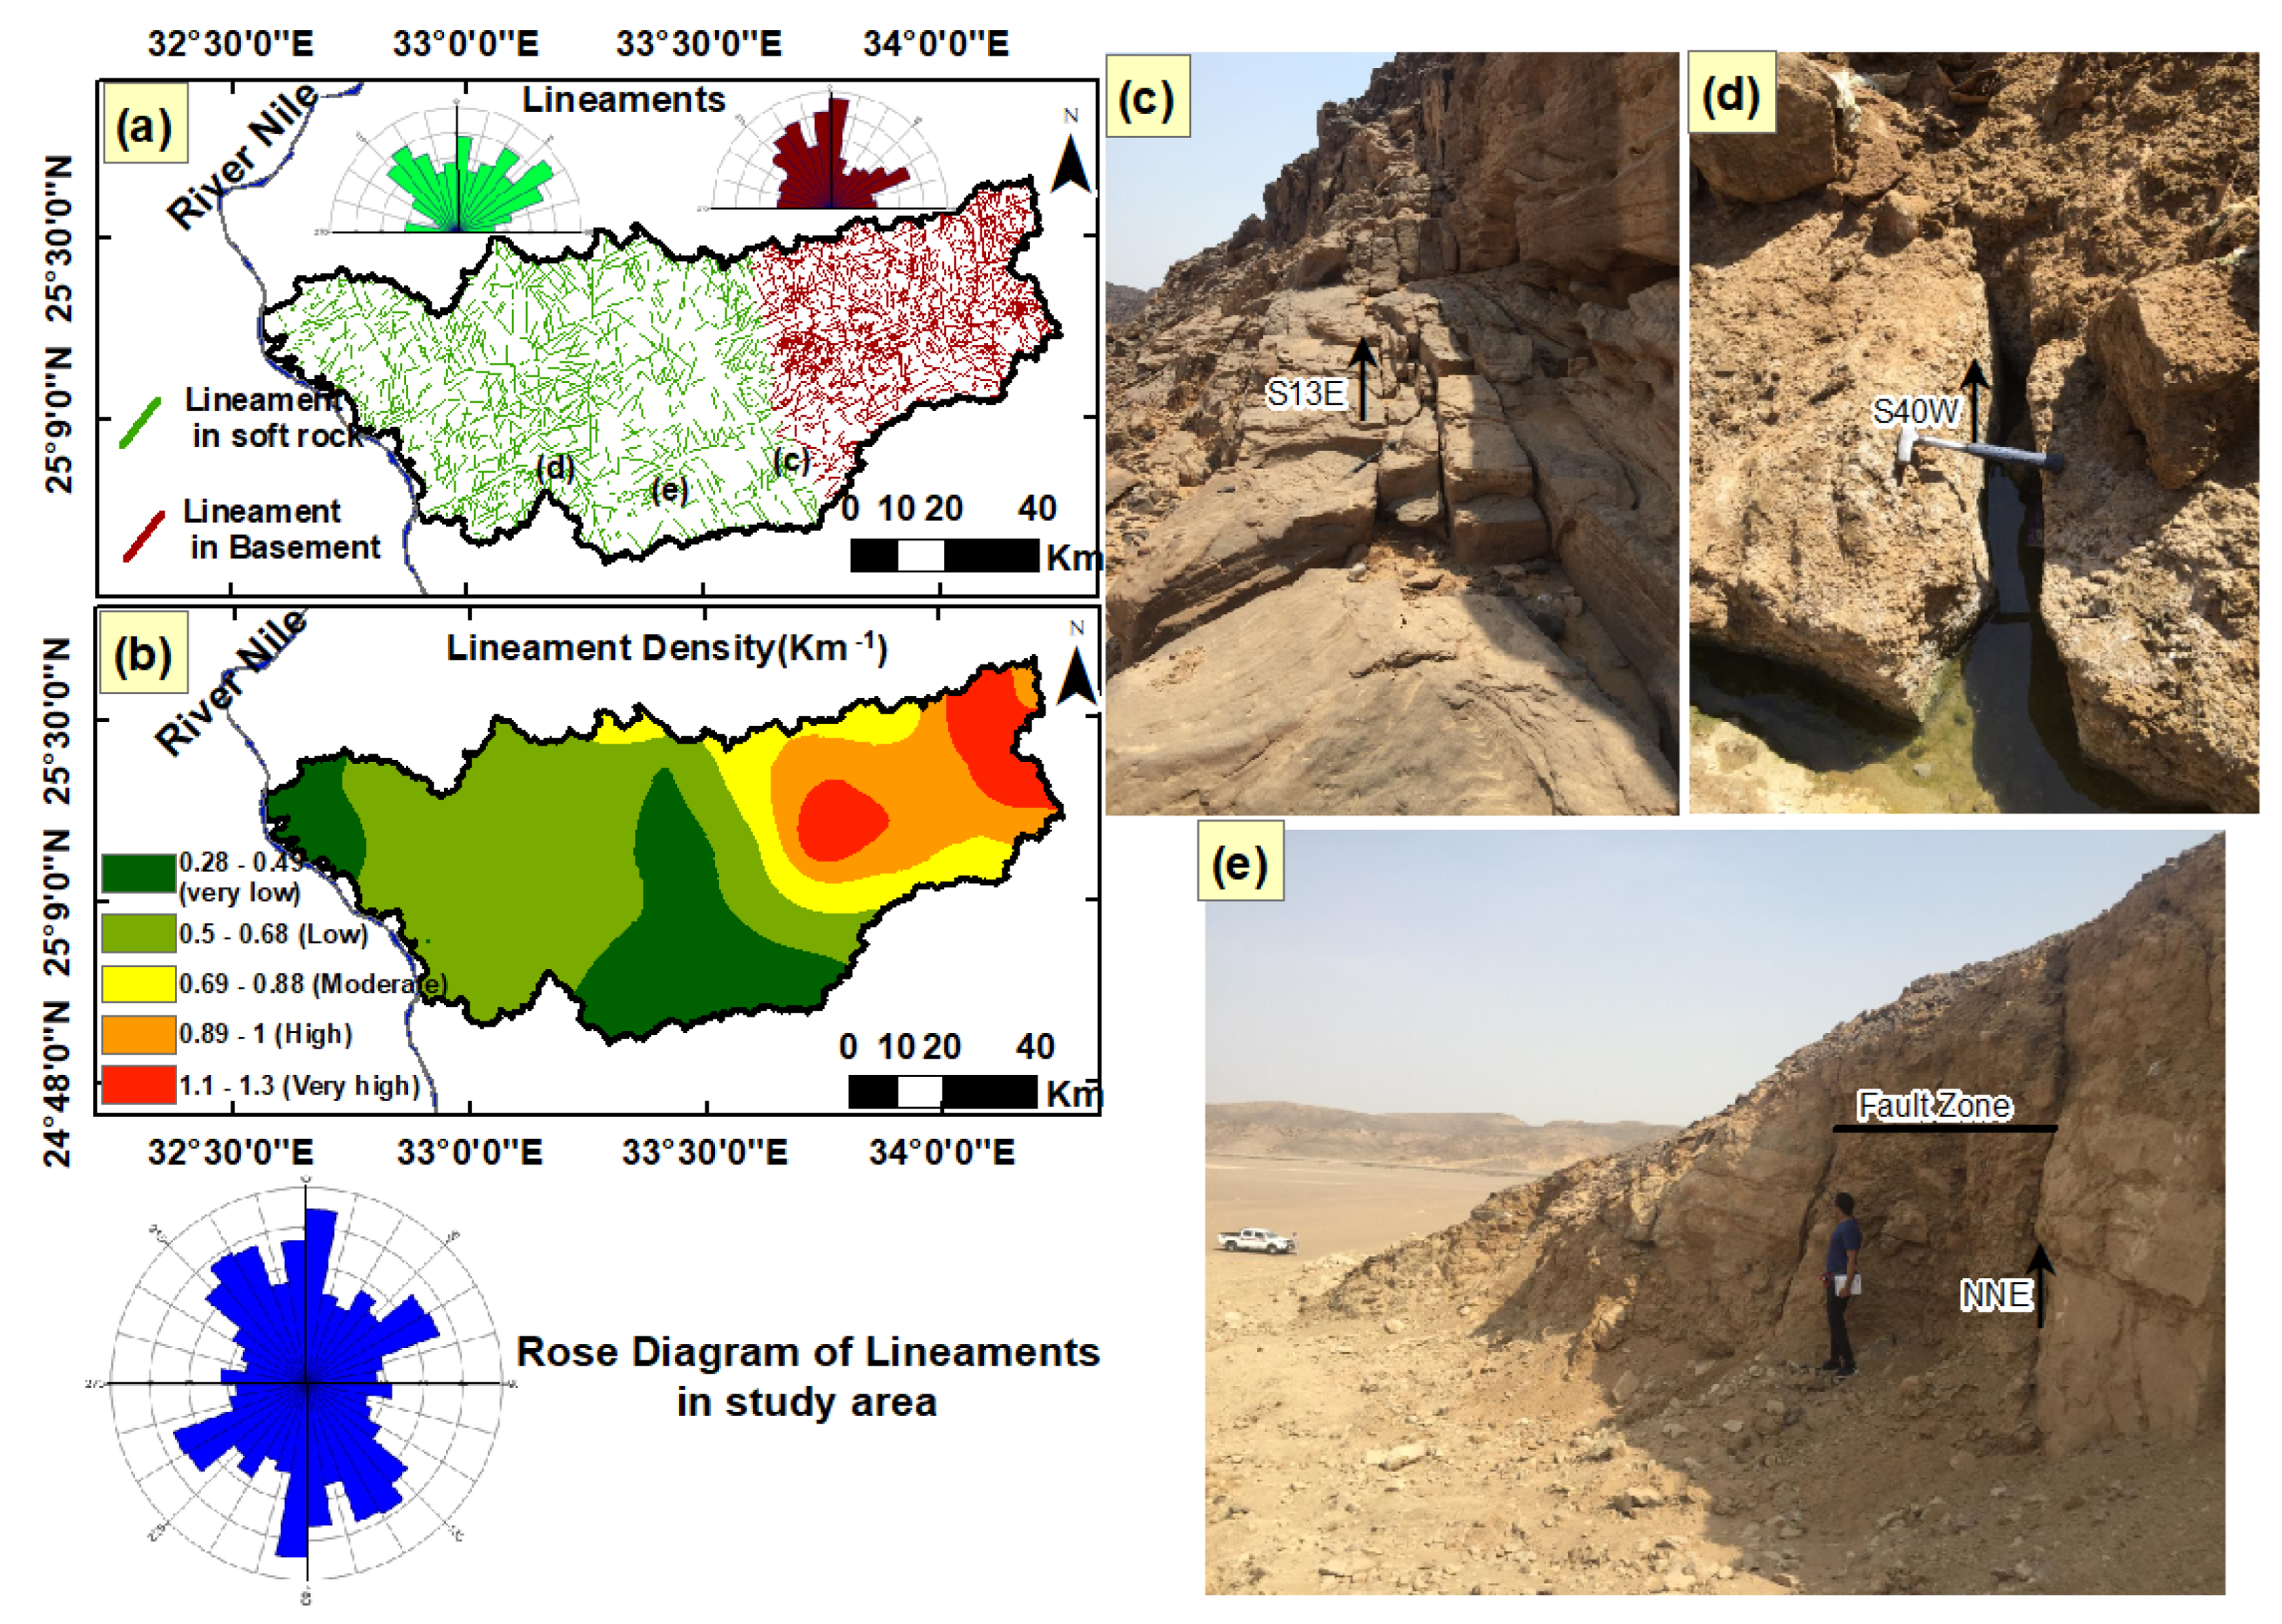
5.2.5. Structure Lineament Density
5.2.6. Distance from Major Fractures
5.2.7. Lithology
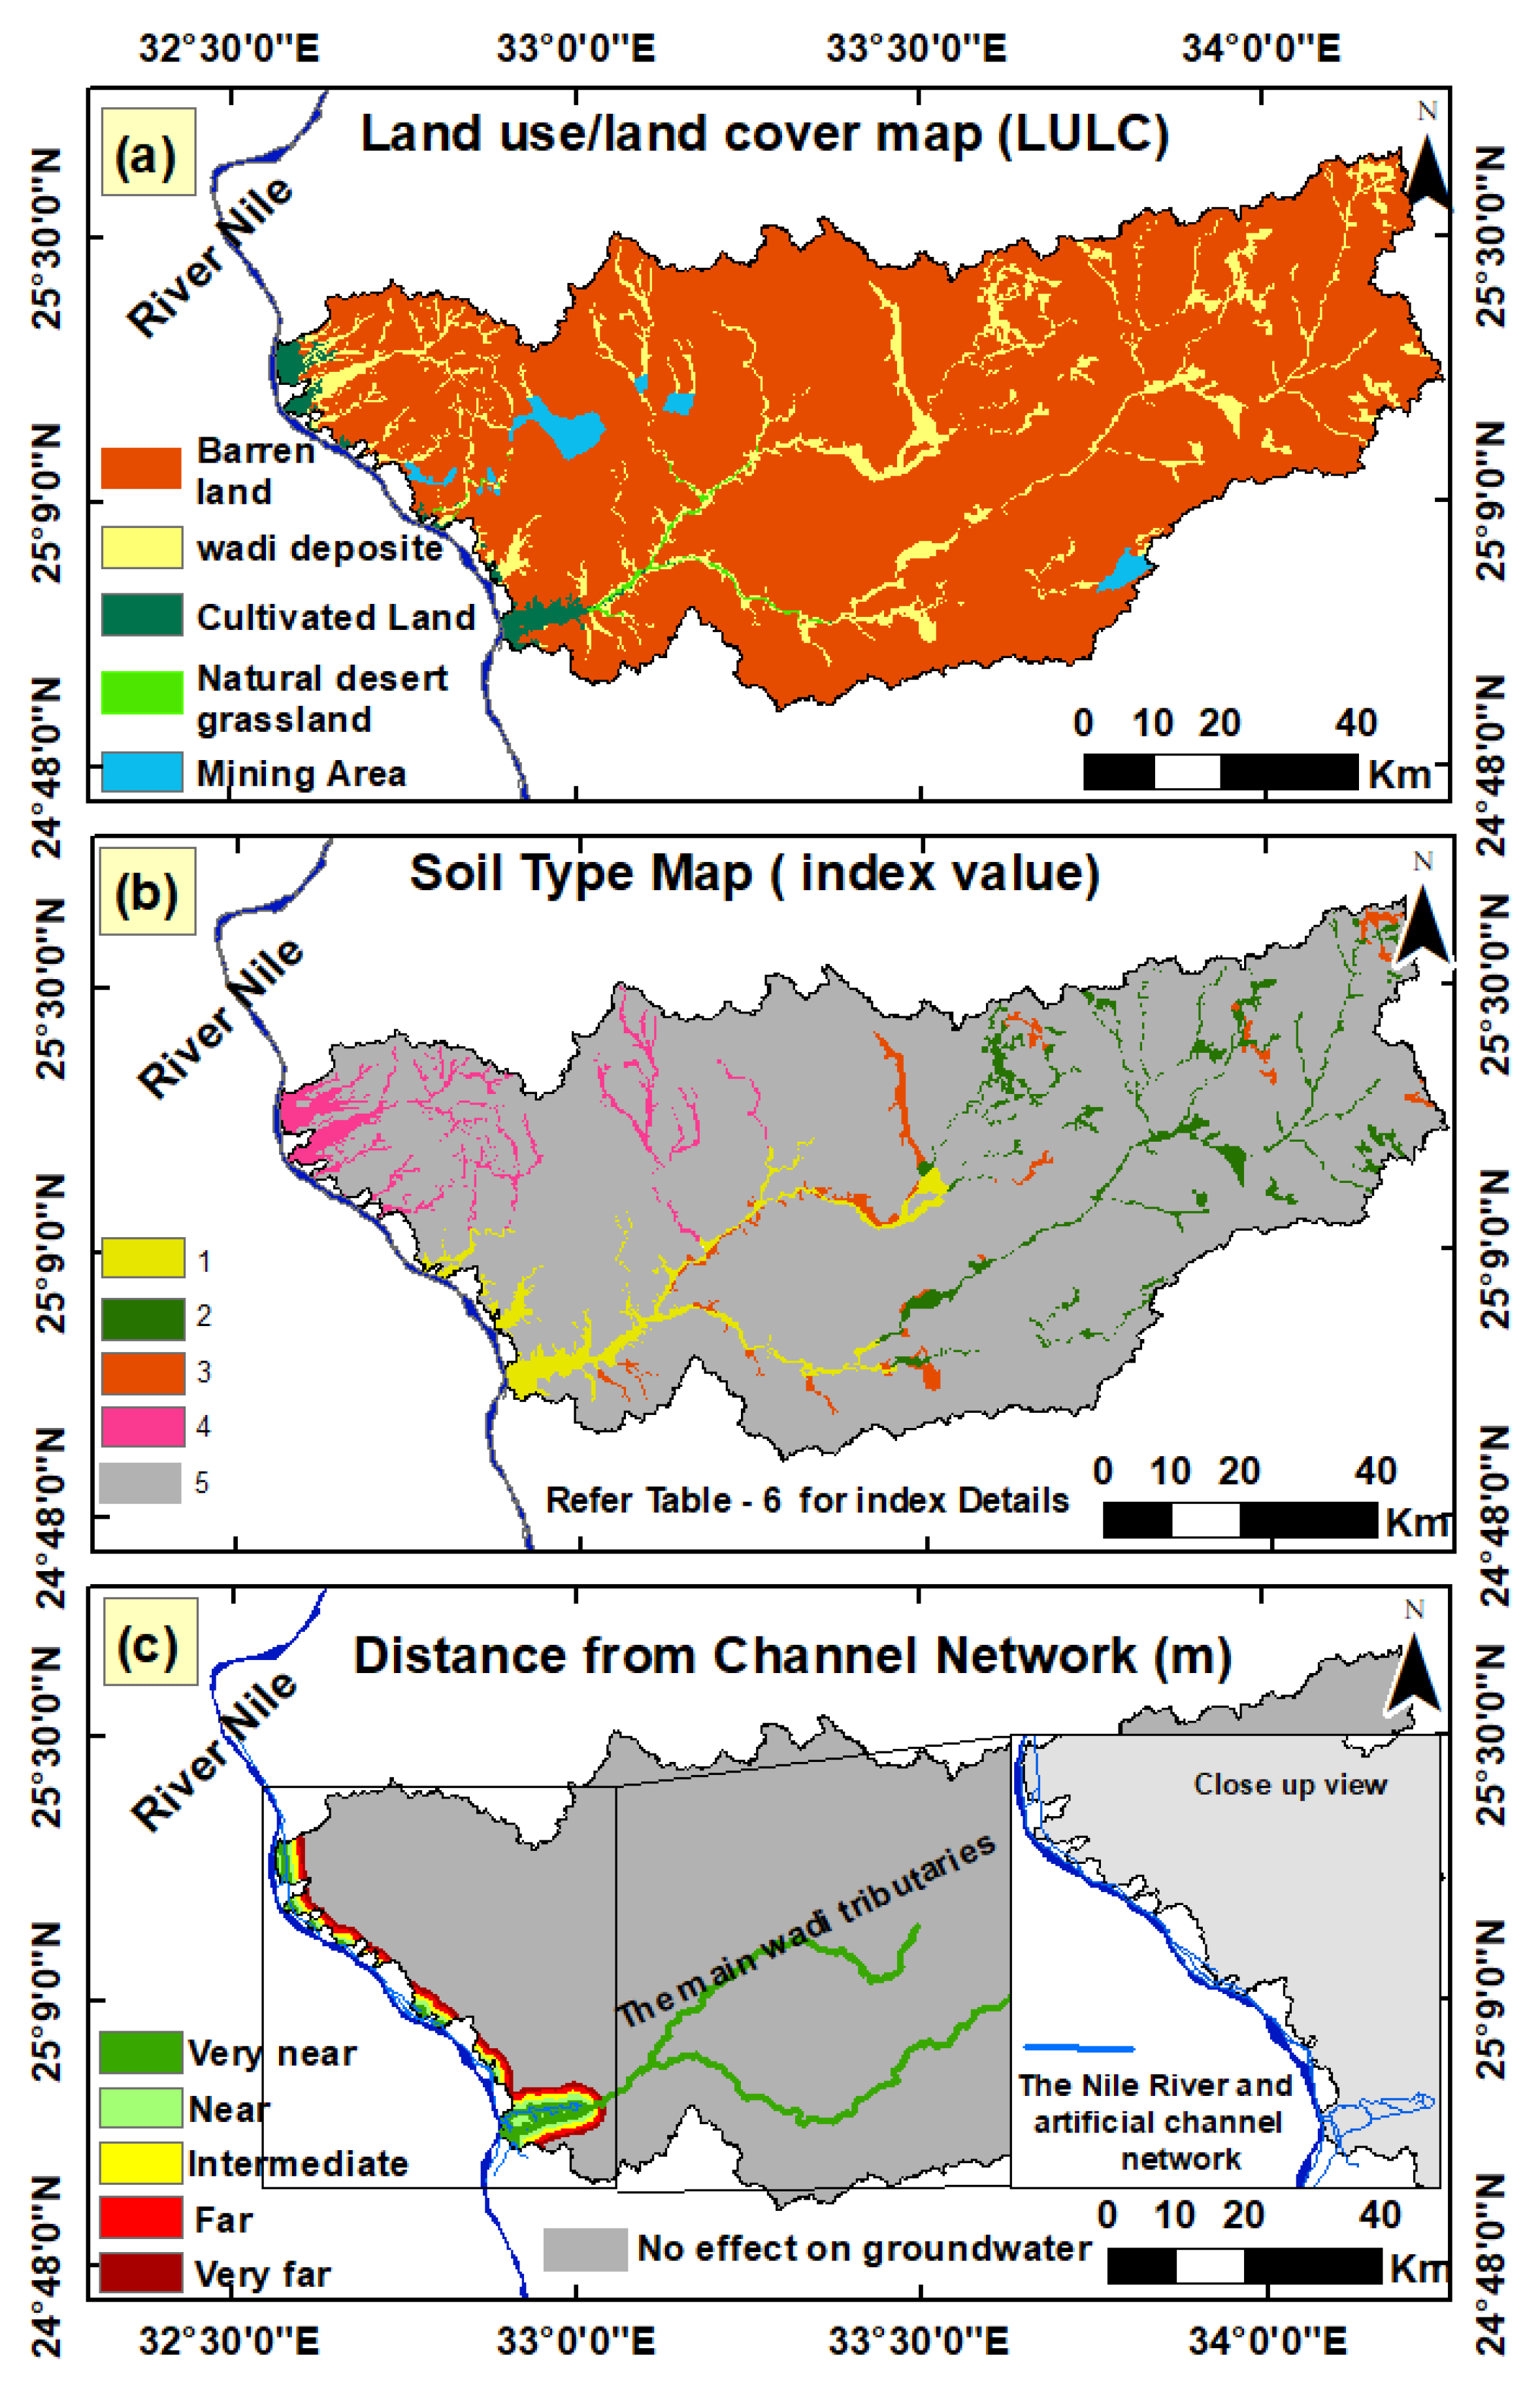
5.2.8. Land Use/land Cover (LULC)
5.2.9. Soil Type
5.2.10. Distance from Channel Network (DCN)
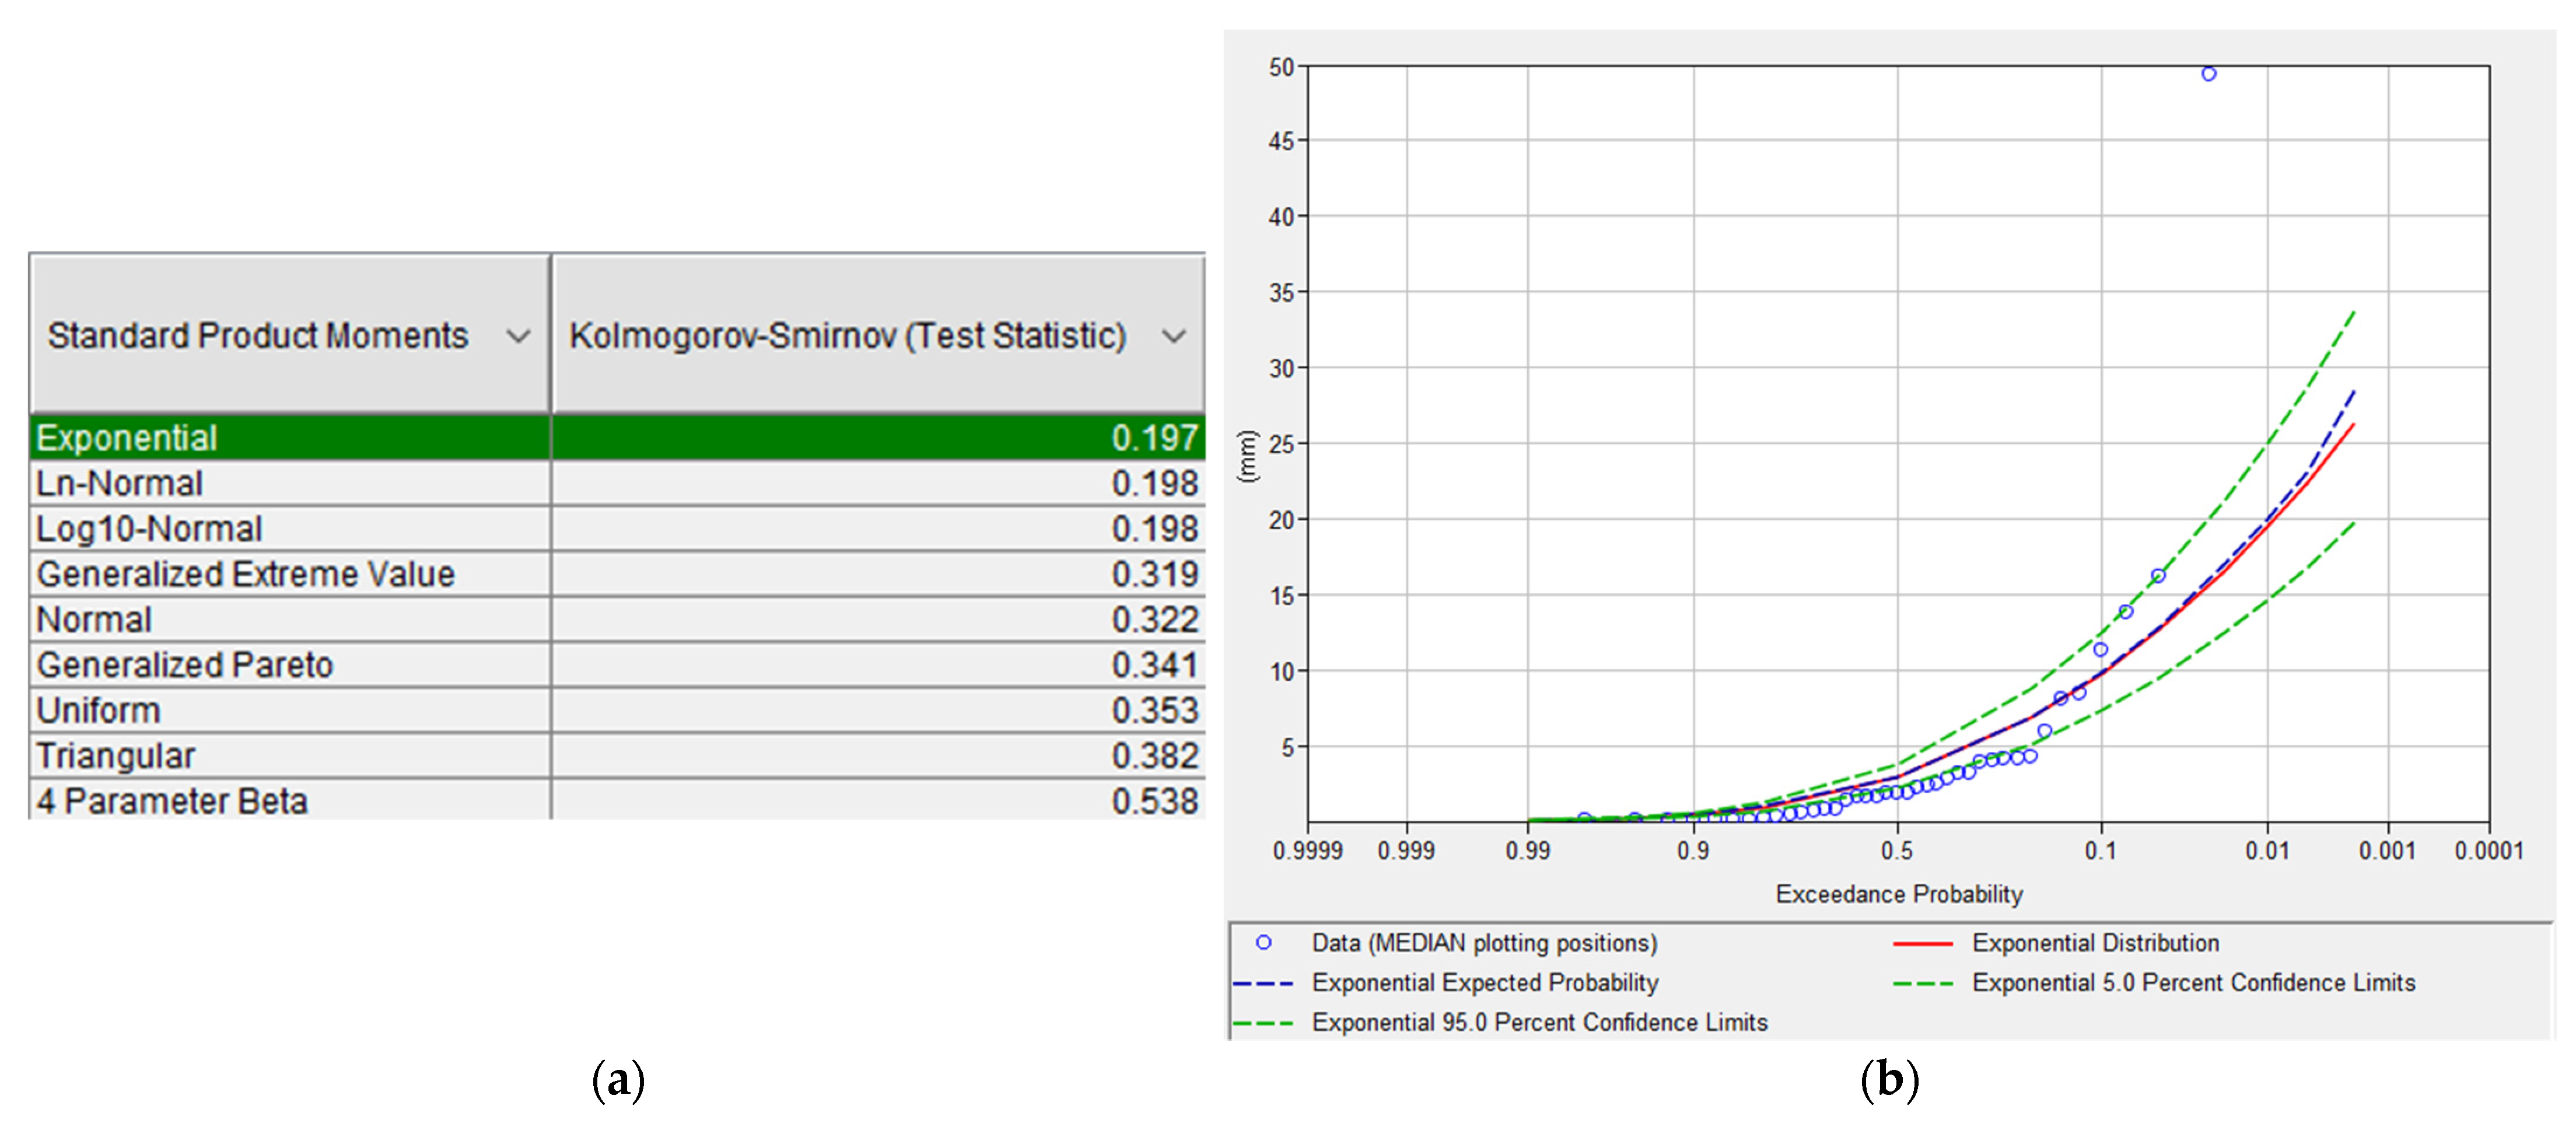
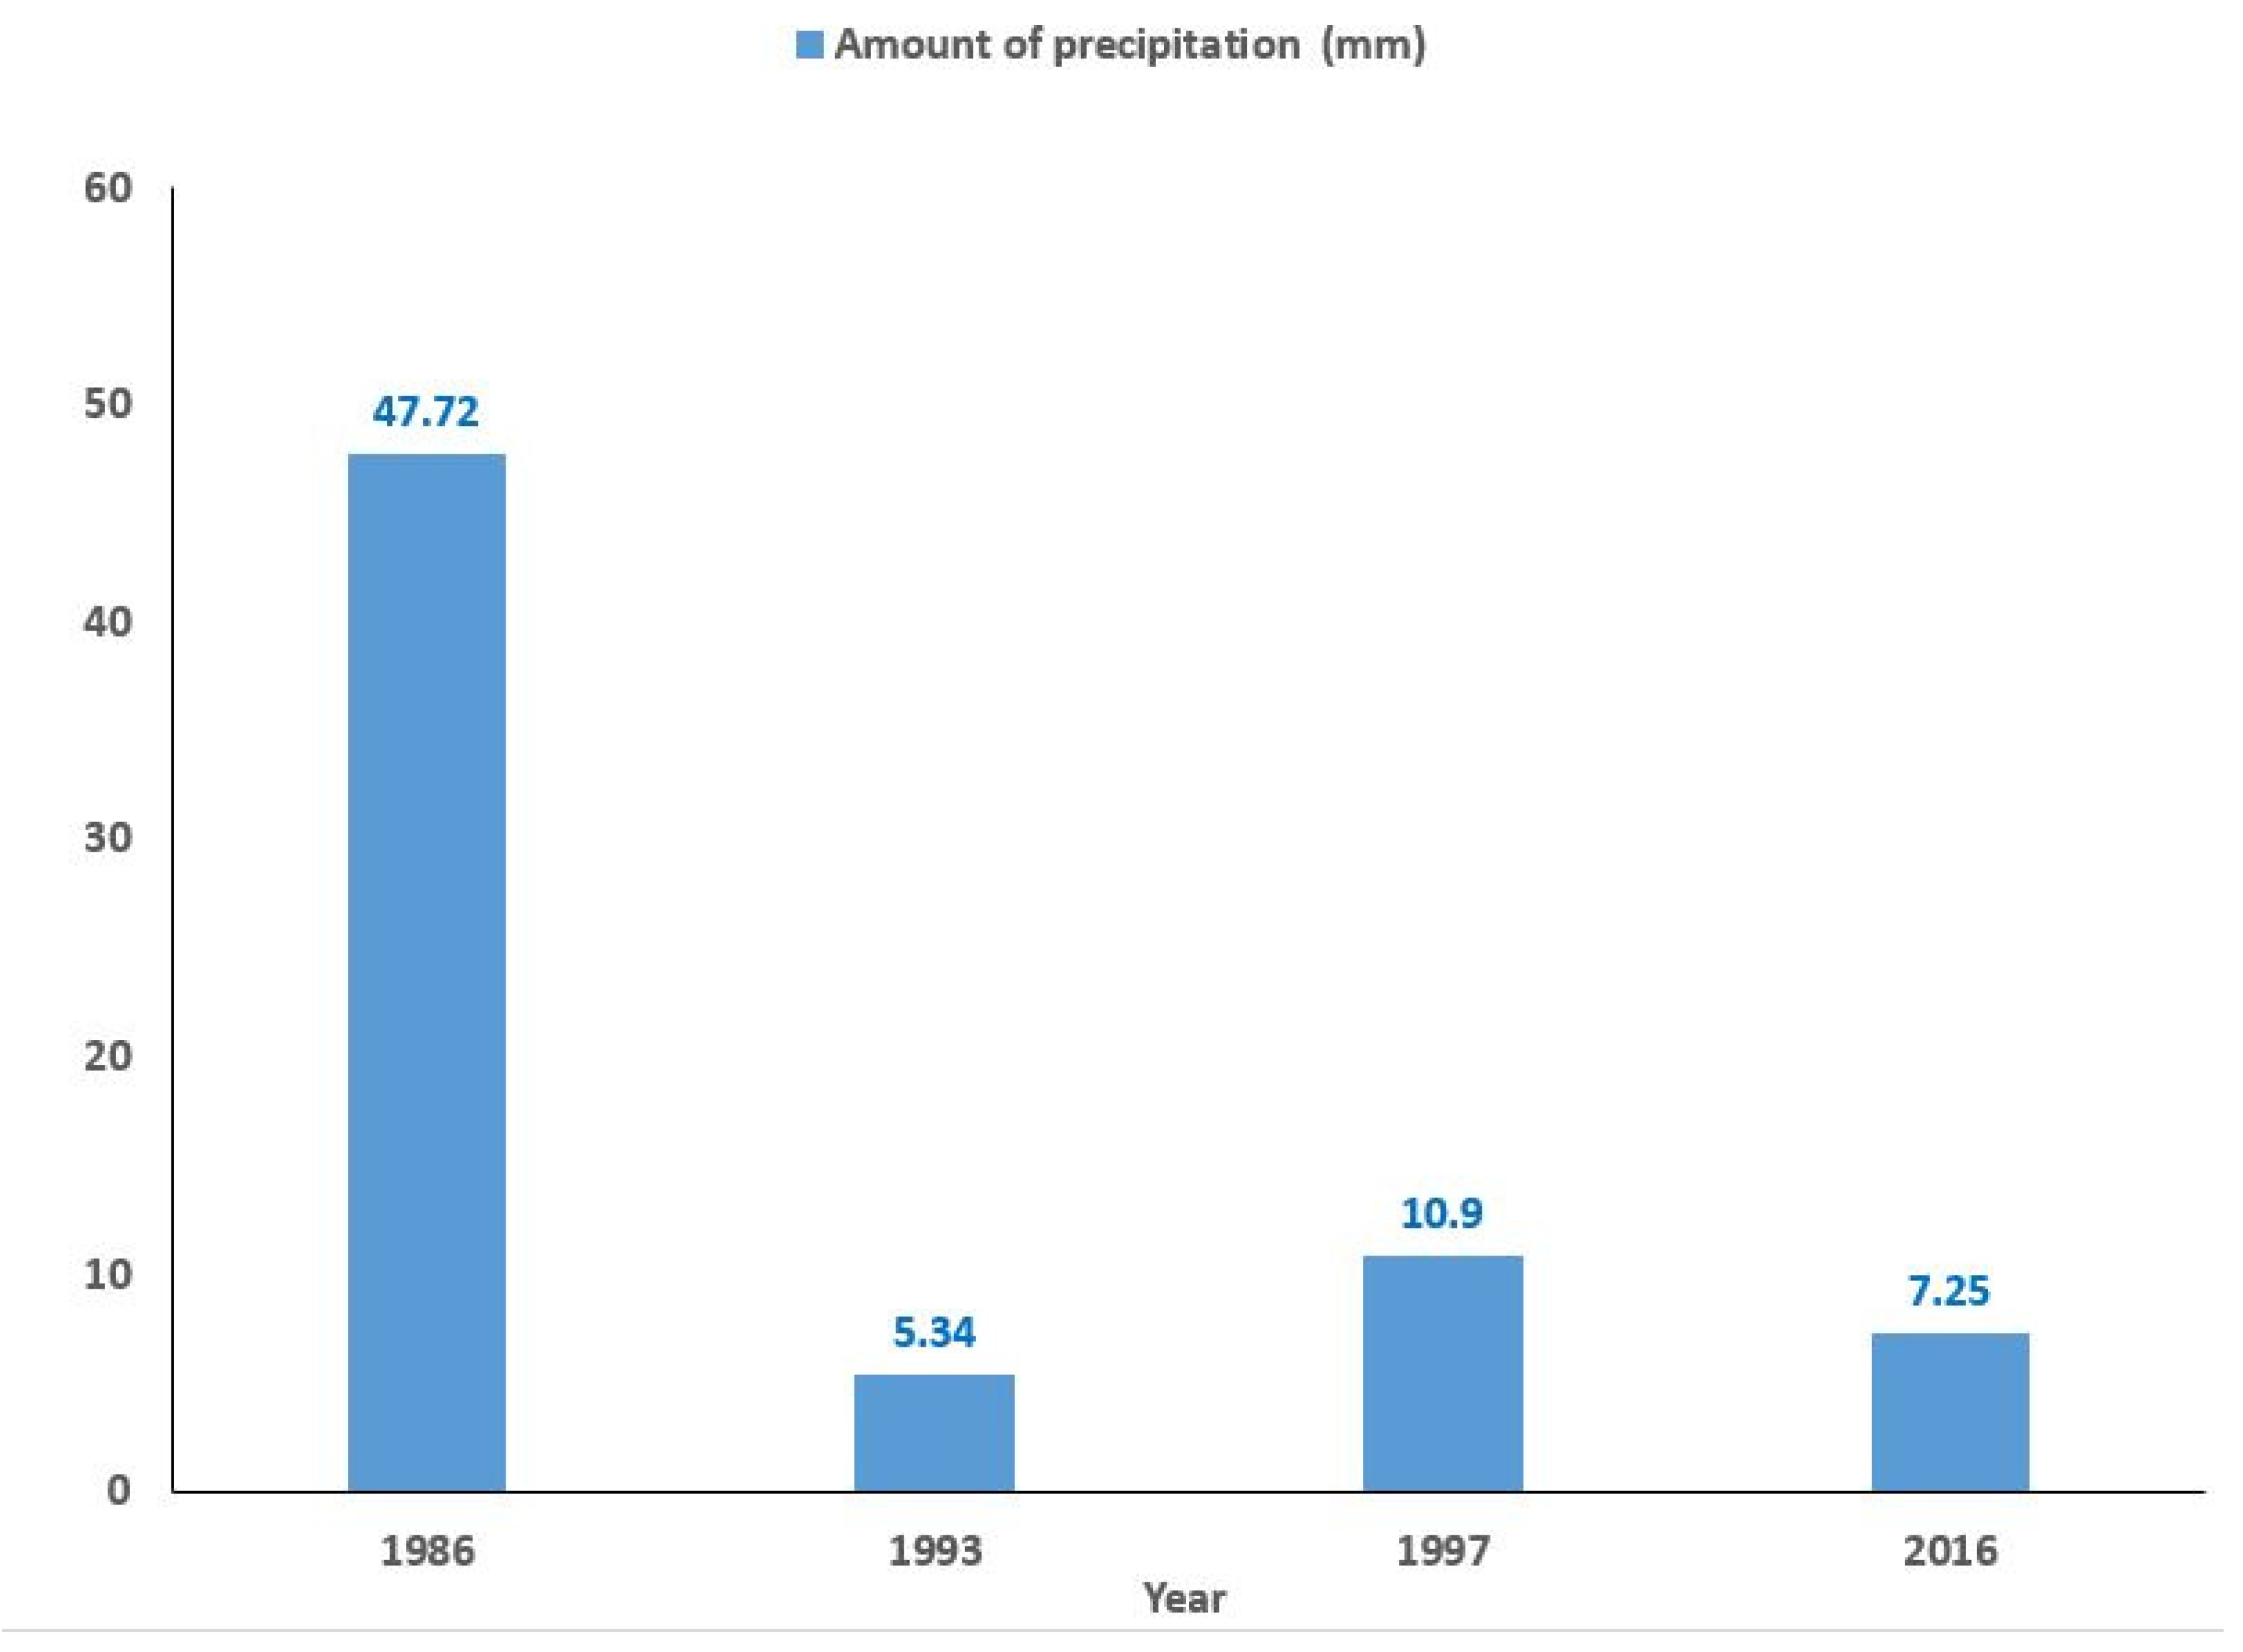
5.3. The Rainfall Pattern and Return Period in Light of Climatic Change
The Impact of Climate Change on Groundwater Recharge
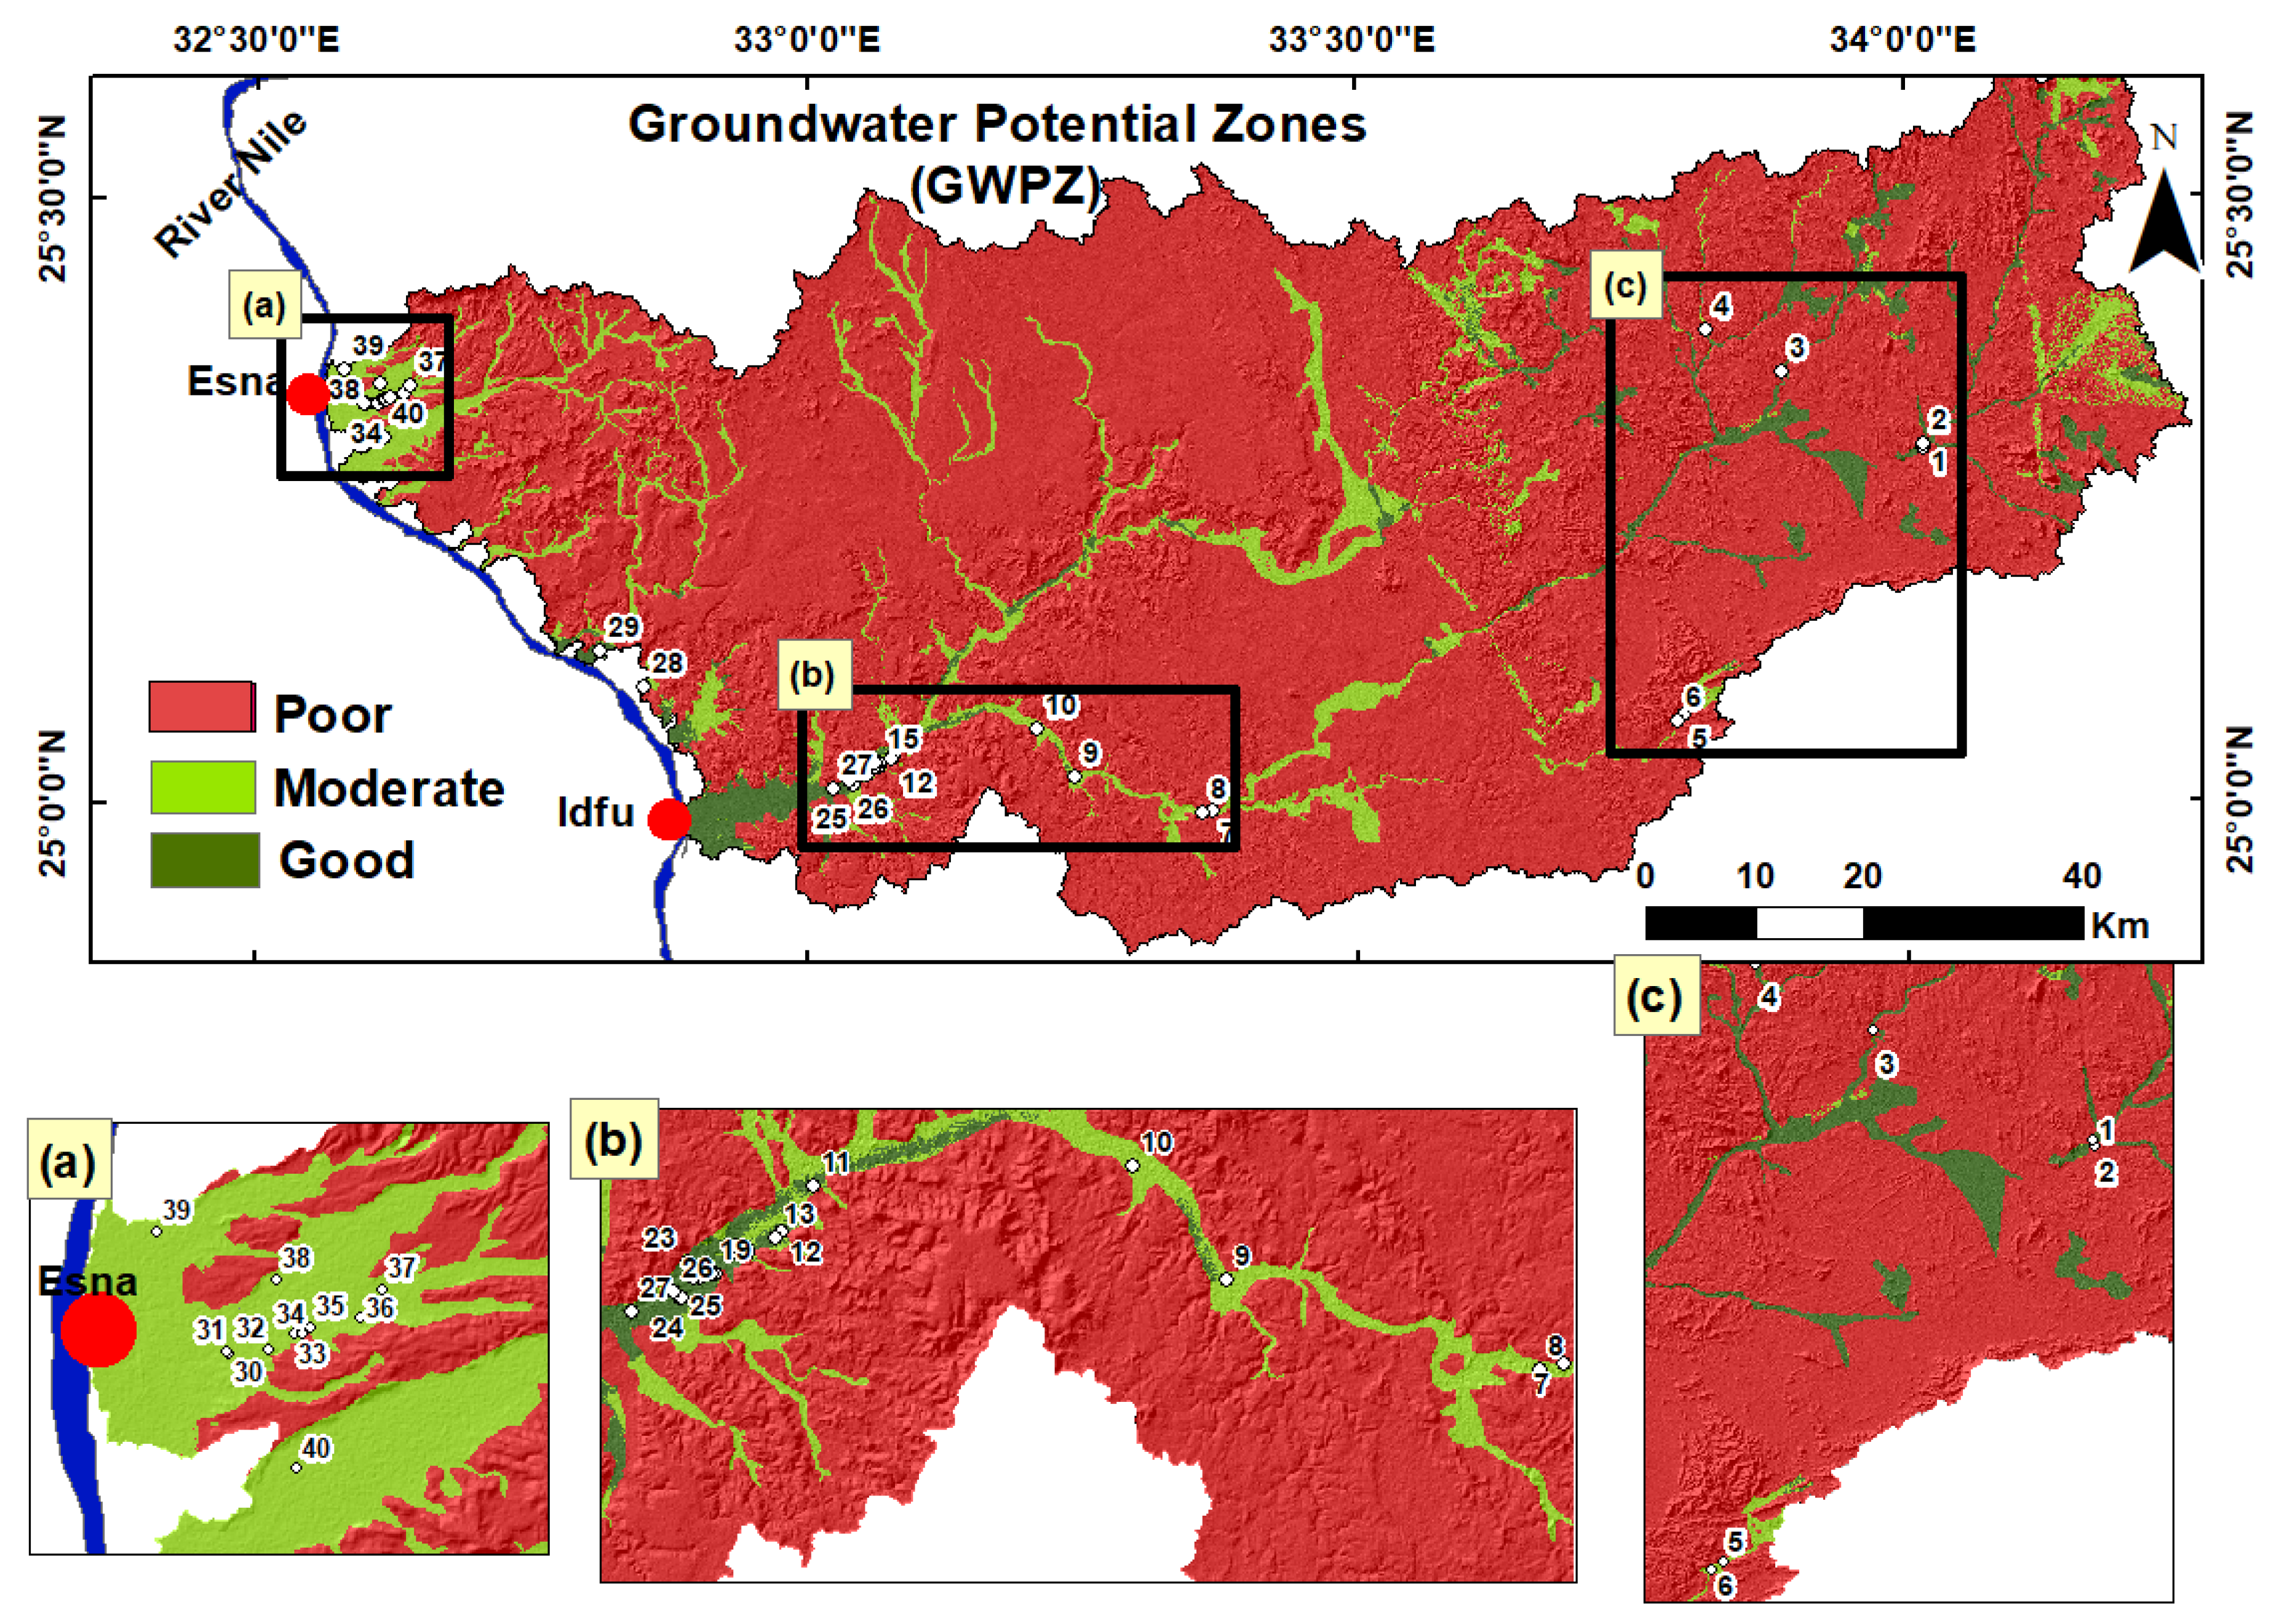
5.4. Groundwater Potential Zone (GWPZ)
5.5. Model Validation
6. Conclusions
Supplementary Materials
Author Contributions
Funding
Institutional Review Board Statement
Informed Consent Statement
Data Availability Statement
Acknowledgments
Conflicts of Interest
References
- Yousif, M. A new theory to enhance the groundwater-related decisions based on deciphering the palaeohydrologic regime under climate change in the Sahara. Model. Earth Syst. Environ. 2021, 8, 3885–3895. [Google Scholar] [CrossRef]
- Yousif, M.; Hussien, H.M.; Abotalib, A.Z. The Respective roles of modern and paleo recharge to alluvium aquifers in continental rift basins: A case study from El Qaa Plain, Sinai, Egypt. Sci. Total Environ. 2020, 739, 139927. [Google Scholar] [CrossRef] [PubMed]
- UNESCO. The United Nations World Water Development Report 2015; Water for a Sustainable World; UNESCO: Paris, France, 2015. [Google Scholar]
- Ghosh, D.; Mandal, M.; Karmakar, M.; Banerjee, M.; Mandal, D. Application of geospatial technology for delineating groundwater potential zones in the Gandheswari Watershed, West Bengal. Sustain. Water Resour. Manag. 2020, 6, 1–14. [Google Scholar] [CrossRef]
- Global Information System on Water and Agriculture. Available online: https://www.fao.org/aquastat/en/databases/ (accessed on 4 December 2021).
- Heggy, E.; Sharkawy, Z.; Abotalib, A.Z. Egypt’s water budget deficit and suggested mitigation policies for the grand ethiopian renaissance dam filling scenarios. Environ. Res. Lett. 2021, 16, 074022. [Google Scholar] [CrossRef]
- Senanayake, I.P.; Dissanayake, D.M.D.O.K.; Mayadunna, B.B.; Weerasekera, W.L. An approach to delineate groundwater recharge potential sites in Ambalantota, Sri Lanka using GIS techniques. Geosci. Front. 2016, 7, 115–124. [Google Scholar] [CrossRef] [Green Version]
- Jha, M.K.; Chowdary, V.M.; Chowdhury, A. Groundwater assessment in Salboni Block, West Bengal (India) using remote sensing, geographical information system and multi-criteria decision analysis techniques. Hydrogeol. J. 2010, 18, 1713–1728. [Google Scholar] [CrossRef]
- Jha, M.K.; Chowdhury, A.; Chowdary, V.M.; Peiffer, S. Groundwater management and development by integrated remote sensing and geographic information systems: Prospects and constraints. Water Resour. Manag. 2007, 21, 427–467. [Google Scholar] [CrossRef]
- Israil, M.; Al-hadithi, M.; Singhal, D.C. Application of a resistivity survey and geographical information system (GIS) analysis for hydrogeological zoning of a Piedmont Area, Himalayan Foothill Region, India. Hydrogeol. J. 2006, 14, 753–759. [Google Scholar] [CrossRef]
- Oh, H.J.; Kim, Y.S.; Choi, J.K.; Park, E.; Lee, S. GIS mapping of regional probabilistic groundwater potential in the area of Pohang City, Korea. J. Hydrol. 2011, 399, 158–172. [Google Scholar] [CrossRef]
- Adiat, K.A.N.; Nawawi, M.N.M.; Abdullah, K. Assessing the accuracy of GIS-based elementary multi criteria decision analysis as a spatial prediction tool—A case of predicting potential zones of sustainable groundwater resources. J. Hydrol. 2012, 440–441, 75–89. [Google Scholar] [CrossRef]
- Russo, T.A.; Fisher, A.T.; Lockwood, B.S. Assessment of managed aquifer recharge site suitability using a GIS and modeling. Groundwater 2015, 53, 389–400. [Google Scholar] [CrossRef] [PubMed] [Green Version]
- Hussien, H.M.; Kehew, A.E.; Aggour, T.; Korany, E.; Abotalib, A.Z.; Hassanein, A.; Morsy, S. An integrated approach for identification of potential aquifer zones in structurally controlled terrain: Wadi Qena Basin, Egypt. Catena 2017, 149, 73–85. [Google Scholar] [CrossRef]
- Tiwari, K.; Goyal, R.; Sarkar, A. GIS-based spatial distribution of groundwater quality and regional suitability evaluation for drinking water. Environ. Process. 2017, 4, 645–662. [Google Scholar] [CrossRef]
- Arulbalaji, P.; Padmalal, D.; Sreelash, K. GIS and AHP techniques based delineation of groundwater potential zones: A case study from Southern Western Ghats, India. Sci. Rep. 2019, 9, 1–17. [Google Scholar] [CrossRef] [Green Version]
- Hussien, H.M.; Yousif, M.; El Sheikh, A. Investigation of groundwater occurrences in structurally controlled terrain, based on geological studies and remote sensing data: Wadi El Morra, South Sinai, Egypt. NRIAG J. Astron. Geophys. 2020, 9, 512–531. [Google Scholar] [CrossRef]
- Madani, A.; Niyazi, B. Groundwater potential mapping using remote sensing techniques and weights of evidence GIS model: A case study from Wadi Yalamlam Basin, Makkah Province, Western Saudi Arabia. Environ. Earth Sci. 2015, 74, 5129–5142. [Google Scholar] [CrossRef]
- Fildes, S.G.; Clark, I.F.; Somaratne, N.M.; Ashman, G. Mapping Groundwater potential zones using remote sensing and geographical information systems in a fractured rock setting, southern flinders ranges, South Australia. J. Earth Syst. Sci. 2020, 129, 1–25. [Google Scholar] [CrossRef]
- Srinivasa Rao, Y.; Jugran, D.K. Delineation of Groundwater potential zones and zones of groundwater quality suitable for domestic purposes using remote sensing and GIS. Hydrol. Sci. J. 2003, 48, 821–833. [Google Scholar] [CrossRef]
- Kumar, P.K.D.; Gopinath, G.; Seralathan, P. International journal of remote application of remote sensing and GIS for the demarcation of groundwater potential zones of a River Basin in Kerala, Southwest Coast of India. Int. J. Remote Sens. 2007, 28, 5583–5601. [Google Scholar] [CrossRef]
- Prasad, R.K.; Monda, N.C.; Banerjee, P.; Nandakumar, M.V.; Singh, V.S. Deciphering Potential Groundwater Zone in Hard Rock Through The Application of GIS. Environ. Geol. 2008, 55, 467–475. [Google Scholar] [CrossRef]
- Ganapuram, S.; Kumar, G.T.V.; Krishna, I.V.M.; Kahya, E.; Demirel, M.C. Mapping of groundwater potential zones in the Musi Basin using remote sensing data and GIS. Adv. Eng. Softw. 2009, 40, 506–518. [Google Scholar] [CrossRef]
- Al Saud, M. Mapping potential areas for groundwater storage in Wadi Aurnah Basin, Western Arabian Peninsula, using remote sensing and geographic information system techniques. Hydrogeol. J. 2010, 18, 1481–1495. [Google Scholar] [CrossRef]
- Avtar, R.; Singh, C.K.; Shashtri, S.; Singh, A.; Mukherjee, S. Identification and analysis of groundwater potential zones in Ken-Betwa River linking area using remote sensing and geographic information system. Geocarto Int. 2010, 25, 379–396. [Google Scholar] [CrossRef]
- Dar, I.A.; Sankar, K.; Dar, M.A. Remote sensing technology and geographic information system modeling: An integrated approach towards the mapping of groundwater potential zones in Hardrock Terrain, Mamundiyar Basin. J. Hydrol. 2010, 394, 285–295. [Google Scholar] [CrossRef]
- Elewa, H.H.; Qaddah, A.A. Groundwater potentiality mapping in the Sinai Peninsula, Egypt, using remote sensing and GIS-watershed-based modeling. Hydrogeol. J. 2011, 19, 613–628. [Google Scholar] [CrossRef] [Green Version]
- Abdelkareem, M.; El-Baz, F.; Askalany, M.; Akawy, A.; Ghoneim, E. Groundwater prospect map of Egypt’s Qena Valley Using data fusion. Int. J. Image Data Fusion 2012, 3, 169–189. [Google Scholar] [CrossRef]
- Magesh, N.S.; Chandrasekar, N.; Soundranayagam, J.P. Delineation of groundwater potential zones in Theni District, Tamil Nadu, using remote sensing, GIS and MIF techniques. Geosci. Front. 2012, 3, 189–196. [Google Scholar] [CrossRef] [Green Version]
- Abdalla, F. Mapping of groundwater prospective zones using remote sensing and GIS techniques: A case study from the Central Eastern Desert, Egypt. J. African Earth Sci. 2012, 70, 8–17. [Google Scholar] [CrossRef]
- Deepika, B.; Avinash, K.; Jayappa, K.S. Integration of hydrological factors and demarcation of groundwater prospect zones: Insights from remote sensing and GIS techniques. Environ. Earth Sci. 2013, 70, 1319–1338. [Google Scholar] [CrossRef]
- Nag, S.K.; Ghosh, P. Delineation of groundwater potential zone in Chhatna Block, Bankura District, West Bengal, India using remote sensing and GIS techniques. Environ. Earth Sci. 2013, 70, 2115–2127. [Google Scholar] [CrossRef]
- Nampak, H.; Pradhan, B.; Manap, M.A. Application of GIS based data driven evidential belief function model to predict groundwater potential zonation. J. Hydrol. 2014, 513, 283–300. [Google Scholar] [CrossRef]
- Agarwal, R.; Garg, P.K. Remote sensing and GIS based groundwater potential & recharge zones mapping using multi-criteria decision making technique. Water Resour. Manag. 2016, 30, 243–260. [Google Scholar] [CrossRef]
- Ibrahim-Bathis, K.; Ahmed, S.A. Geospatial technology for delineating groundwater potential zones in Doddahalla Watershed of Chitradurga District, India. Egypt. J. Remote Sens. Sp. Sci. 2016, 19, 223–234. [Google Scholar] [CrossRef] [Green Version]
- Selvarani, A.G.; Maheswaran, G.; Elangovan, K. Identification of artificial recharge sites for Noyyal River Basin using GIS and remote sensing. J. Indian Soc. Remote Sens. 2017, 45, 67–77. [Google Scholar] [CrossRef]
- Hussein, A.-A.; Govindu, V.; Nigusse, A.G.M. Evaluation of groundwater potential using geospatial techniques. Appl. Water Sci. 2017, 7, 2447–2461. [Google Scholar] [CrossRef] [Green Version]
- Thapa, R.; Gupta, S.; Guin, S.; Kaur, H. Assessment of groundwater potential zones using multi-influencing factor (MIF) and GIS: A case study from Birbhum District, West Bengal. Appl. Water Sci. 2017, 7, 4117–4131. [Google Scholar] [CrossRef]
- Das, S. Delineation of groundwater potential zone in hard rock terrain in Gangajalghati Block, Bankura District, India using remote sensing and GIS techniques. Model. Earth Syst. Environ. 2017, 3, 1589–1599. [Google Scholar] [CrossRef] [Green Version]
- Rajaveni, S.P.; Brindha, K.; Elango, L. Geological and geomorphological controls on groundwater occurrence in a hard rock region. Appl. Water Sci. 2017, 7, 1377–1389. [Google Scholar] [CrossRef] [Green Version]
- Patra, S.; Mishra, P.; Mahapatra, S.C. Delineation of groundwater potential zone for sustainable development: A case study from Ganga Alluvial plain covering Hooghly District of India using remote sensing, geographic information system and analytic hierarchy process. J. Clean. Prod. 2018, 172, 2485–2502. [Google Scholar] [CrossRef]
- Adeyeye, O.A.; Ikpokonte, A.E.; Arabi, A.S. The dual use of drainage characteristics in groundwater potential modelling using remote sensing and GIS: An example from Dengi Area, Northcentral Nigeria. Sustain. Water Resour. Manag. 2018, 4, 1105–1115. [Google Scholar] [CrossRef]
- Pande, C.B.; Khadri, S.F.R.; Moharir, K.N.; Patode, R.S. Assessment of groundwater potential zonation of Mahesh River Basin Akola and Buldhana Districts, Maharashtra, India using remote sensing and GIS techniques. Sustain. Water Resour. Manag. 2018, 4, 965–979. [Google Scholar] [CrossRef]
- Murmu, P.; Kumar, M.; Lal, D.; Sonker, I.; Singh, S.K. Delineation of groundwater potential zones using geospatial techniques and analytical hierarchy process in Dumka District, Jharkhand, India. Groundw. Sustain. Dev. 2019, 9, 100239. [Google Scholar] [CrossRef]
- Çelik, R. Evaluation of groundwater potential by GIS-Based multicriteria decision making as a spatial prediction tool: Case study in the Tigris River Batman-Hasankeyf Sub-Basin, Turkey. Water 2019, 11, 2630. [Google Scholar] [CrossRef] [Green Version]
- Mallick, J.; Khan, R.A.; Ahmed, M.; Alqadhi, S.D.; Alsubih, M.; Falqi, I.; Hasan, M.A. Modeling groundwater potential zone in a Semi-Arid Region of Aseer using Fuzzy-AHP and geoinformation techniques. Water 2019, 11, 2656. [Google Scholar] [CrossRef] [Green Version]
- Benjmel, K.; Amraoui, F.; Boutaleb, S.; Ouchchen, M.; Tahiri, A.; Touab, A. Mapping of groundwater potential zones in techniques, and multicriteria data analysis (Case of the Ighrem Region, Western Anti-Atlas, Morocco). Water 2020, 12, 471. [Google Scholar] [CrossRef] [Green Version]
- Achu, A.L.; Reghunath, R.; Thomas, J. Mapping of groundwater recharge potential zones and identification of suitable site-specific recharge mechanisms in a tropical river basin. Earth Syst. Environ. 2020, 4, 131–145. [Google Scholar] [CrossRef]
- Berhanu, K.G.; Hatiye, S.D. Identification of groundwater potential zones using proxy data: Case study of Megech Watershed, Ethiopia. J. Hydrol. Reg. Stud. 2020, 28, 100676. [Google Scholar] [CrossRef]
- Lentswe, G.B.; Molwalefhe, L. Delineation of potential groundwater recharge zones using analytic hierarchy process-guided GIS in the semi-arid Motloutse Watershed, Eastern Botswana. J. Hydrol. Reg. Stud. 2020, 28, 100674. [Google Scholar] [CrossRef]
- Mukherjee, I.; Singh, U.K. Delineation of groundwater potential zones in a drought-prone semi-arid region of East India using GIS and analytical hierarchical process techniques. Catena 2020, 194, 104681. [Google Scholar] [CrossRef]
- Kaur, L.; Rishi, M.S.; Singh, G.; Nath Thakur, S. Groundwater potential assessment of an alluvial aquifer in Yamuna Sub-Basin (Panipat Region) using remote sensing and GIS techniques in conjunction with Analytical Hierarchy Process (AHP) and Catastrophe Theory (CT). Ecol. Indic. 2020, 110, 105850. [Google Scholar] [CrossRef]
- Ahmadi, H.; Kaya, O.A.; Babadagi, E.; Savas, T.; Pekkan, E. GIS-based groundwater potentiality mapping using AHP and FR models in Central Antalya, Turkey. Environ. Sci. Proc. 2021, 5, 11. [Google Scholar] [CrossRef]
- Zhu, Q.; Abdelkareem, M. Mapping groundwater potential zones using a knowledge-driven approach and GIS analysis. Water 2021, 13, 579. [Google Scholar] [CrossRef]
- Ranganathan, M.; Murugesan, B.; Mukesh, M.; Islam, Z.; Gebremedhin, D.T.; Brhane, G.K. Groundwater potentiality mapping in Viruthachalam Taluk, Tamil Nadu, India: AHP and GIS approaches. Hydrospatial Anal. 2021, 5, 24–33. [Google Scholar] [CrossRef]
- Anteneh, Z.L.; Alemu, M.M.; Bawoke, G.T.; Kehali, A.T.; Fenta, M.C.; Desta, M.T. Appraising groundwater potential zones using geospatial and Multi-Criteria Decision Analysis (MCDA) techniques in Andasa-Tul Watershed, Upper Blue Nile Basin, Ethiopia. Environ. Earth Sci. 2022, 81, 1–20. [Google Scholar] [CrossRef]
- Melese, T.; Belay, T. Groundwater potential zone mapping using analytical hierarchy process and GIS in Muga Watershed, Abay Basin, Ethiopia. Glob. Chall. 2022, 6, 2100068. [Google Scholar] [CrossRef]
- Ramachandra, M.; Babu, K.R.; Kumar, B.P.; Rajasekhar, M. Deciphering groundwater potential zones using AHP and geospatial modelling approaches: A case study from YSR District, Andhra Pradesh, India. Int. J. Energy Water Resour. 2022, 1–11. [Google Scholar] [CrossRef]
- Ogungbade, O.; Ariyo, S.O.; Alimi, S.A.; Alepa, V.C.; Aromoye, S.A.; Akinlabi, O.J. A combined GIS, remote sensing and geophysical methods for groundwater potential assessment of Ilora, Oyo Central, Nigeria. Environ. Earth Sci. 2022, 81, 1–13. [Google Scholar] [CrossRef]
- NASA Prediction of Worldwide Energy Resources Data Access Documentation Resources about Contact. Available online: https://power.larc.nasa.gov/data-access-viewer/ (accessed on 14 October 2021).
- Izz, A.A. Landforms of Egypt; American University Press: Cairo, Egypt, 1971. [Google Scholar]
- Conco, C. Geological Map of Egypt, Scale 1: 500,000; Egyptian General Petroleum Corporation: Cairo, Egypt, 1987. [Google Scholar]
- USGS Earth Explorer. Available online: https://earthexplorer.usgs.gov/ (accessed on 14 October 2021).
- Saaty, T.L. Decision Making for Leaders: The Analytic Hierarchy Process for Decisions in a Complex World; RWS Publications: Bangalore, India, 1990. [Google Scholar]
- Singh, L.K.; Jha, M.K.; Chowdary, V.M. Assessing the accuracy of GIS-based multi-criteria decision analysis approaches for mapping groundwater potential. Ecol. Indic. 2018, 91, 24–37. [Google Scholar] [CrossRef]
- Hazen, A. Discussion: Dams on sand foundations. Trans. Am. Soc. Civ. Eng. 1911, 73, 190–208. [Google Scholar]
- Todd, D.K.; Mays, L.W. Groundwater Hydrology, 3rd ed.; John Wiley & Sons, Inc.: New York, NY, USA, 2005; ISBN 978-0-471-05937-0. [Google Scholar]
- Duffy, C.J.; Al-Hassan, S. Groundwater circulation in a closed desert basin: Topographic scaling and climatic forcing. Water Resour. Res. 1988, 24, 1675–1688. [Google Scholar] [CrossRef]
- Twidale, C.R. River patterns and their meaning. Earth Science Rev. 2004, 67, 159–218. [Google Scholar] [CrossRef]
- Charlton, R. Fundamentals of Fluvial Geomorphology; Routledge: New York, NY, USA, 2008; ISBN 0203371089. [Google Scholar]
- Horton, R.E. Drainage-basin characteristics. Eos Trans. Am. Geophys. Union 1932, 13, 350–361. [Google Scholar] [CrossRef]
- Gelaro, R.; McCarty, W.; Suárez, M.J.; Todling, R.; Molod, A.; Takacs, L.; Randles, C.A.; Darmenov, A.; Bosilovich, M.G.; Reichle, R.; et al. The modern-era retrospective analysis for research and applications, version 2 (MERRA-2). J. Clim. 2017, 30, 5419–5454. [Google Scholar] [CrossRef]
- Kuswanto, H.; Naufal, A. Evaluation of performance of drought prediction in Indonesia based on TRMM and MERRA-2 using machine learning methods. MethodsX 2019, 6, 1238–1251. [Google Scholar] [CrossRef]
- Reichle, R.H.; Liu, Q.; Koster, R.D.; Draper, C.S.; Mahanama, S.P.P.; Partyka, G.S. Land surface precipitation in MERRA-2. J. Clim. 2017, 30, 1643–1664. [Google Scholar] [CrossRef]
- Europe’s eyes on Earth. The Copernicus Global Land Service (CGLS). Available online: https://land.copernicus.eu/global/ (accessed on 19 September 2022).
- Hung, L.Q.; Batelaan, O.; De Smedt, F. Lineament extraction and analysis, comparison of LANDSAT ETM and ASTER imagery. Case study: Suoimuoi Tropical Karst Catchment, Vietnam. Remote Sens. Environ. Monit. GIS Appl. Geol. V 2005, 5983, 59830T. [Google Scholar] [CrossRef]
- Magowe, M.; Carr, J.R. Relationship between lineaments and ground water occurrence in Western Botswana. Groundwater 1999, 37, 282–286. [Google Scholar] [CrossRef]
- Al-Ruzouq, R.; Shanableh, A.; Yilmaz, A.G.; Idris, A.E.; Mukherjee, S.; Khalil, M.A.; Gibril, M.B.A. Dam site suitability mapping and analysis using an integrated GIS and machine learning approach. Water 2019, 11, 1880. [Google Scholar] [CrossRef] [Green Version]
- Edet, A.E.; Okereke, C.S.; Teme, S.C.; Esu, E.O. Application of remote-sensing data to groundwater exploration: A case study of the Cross River State, Southeastern Nigeria. Hydrogeol. J. 1998, 6, 394–404. [Google Scholar] [CrossRef]
- Jasrotia, A.S.; Kumar, A.; Singh, R. Integrated remote sensing and GIS approach for delineation of groundwater potential zones using aquifer parameters in Devak and Rui Watershed of Jammu and Kashmir, India. Arab. J. Geosci. 2016, 9, 1–15. [Google Scholar] [CrossRef]
- Martin, S.L.; Hayes, D.B.; Kendall, A.D.; Hyndman, D.W. The land-use legacy effect: Towards a mechanistic understanding of time-lagged water quality responses to land use/cover. Sci. Total Environ. 2017, 579, 1794–1803. [Google Scholar] [CrossRef] [PubMed]
- Lerner, D.N.; Harris, B. The relationship between land use and groundwater resources and quality. Land Use Policy 2009, 26, 265–273. [Google Scholar] [CrossRef]
- Collin, M.L.; Melloul, A.J. Combined land-use and environmental factors for sustainable groundwater management. Urban Water 2001, 3, 229–237. [Google Scholar] [CrossRef]
- Machiwal, D.; Jha, M.K.; Mal, B.C. Assessment of groundwater potential in a semi-arid region of India using remote sensing, GIS and MCDM techniques. Water Resour. Manag. 2011, 25, 1359–1386. [Google Scholar] [CrossRef]
- Adeyeye, O.A.; Ikpokonte, E.A.; Arabi, S.A. GIS-based groundwater potential mapping within Dengi Area, North Central Nigeria. Egypt. J. Remote Sens. Sp. Sci. 2019, 22, 175–181. [Google Scholar] [CrossRef]
- Mohallel, S.A.; Abdella, H.F.; Habibah, A.Z. Hydrogeochemical assessment of groundwater quality at Wadi Abbadi, Southern Part of Eastern Desert, Egypt. Curr. Sci. Int. 2019, 8, 422–438. [Google Scholar]
- Ezz, H.; Gomaah, M.; Abdelwares, M. Watershed delineation and estimation of groundwater recharge for Ras Gharib Region, Egypt. J. Geosci. Environ. Prot. 2019, 07, 202–213. [Google Scholar] [CrossRef] [Green Version]
- Adeyemo, J.; Olofintoye, O.O. Optimized Fourier approximation models for estimating monthly streamflow in the Vanderkloof Dam, South Africa. In Advances in Intelligent Systems and Computing; Springer International Publishing: Cham, Switzerland, 2014; Volume 288, pp. 293–306. ISBN 978-3-319-07493-1. [Google Scholar]
- Swain, S.; Taloor, A.K.; Dhal, L.; Sahoo, S.; Al-Ansari, N. Impact of climate change on groundwater hydrology: A comprehensive review and current status of the Indian hydrogeology. Appl. Water Sci. 2022, 12, 1–25. [Google Scholar] [CrossRef]
- Hassan, W.H.; Hussein, H.H.; Nile, B.K. The effect of climate change on groundwater recharge in unconfined aquifers in the western desert of Iraq. Groundw. Sustain. Dev. 2022, 16, 100700. [Google Scholar] [CrossRef]
- Folk, R.L. Petrologie of Sedimentary Rocks; Hemphill Publishing Co.: Austin, TX, USA, 1974; ISBN 0-914696-14-9. [Google Scholar]


| N | Factors | El | Sl | Rf | DD | LD | G | Gm | LU/LC | Vg | TPI | TWI | ND | MF | ST | STh | R | SPI | ASPR | SPS | WTF | WTD | SWB | AR | Aspect | D | M | RI | ED | GWQ | NGWR | |
|---|---|---|---|---|---|---|---|---|---|---|---|---|---|---|---|---|---|---|---|---|---|---|---|---|---|---|---|---|---|---|---|---|
| Literature Review | ||||||||||||||||||||||||||||||||
| 1 | [20] | × | × | × | × | × | × | × | ||||||||||||||||||||||||
| 2 | [21] | × | × | × | × | × | × | × | ||||||||||||||||||||||||
| 3 | [22] | × | × | × | × | × | × | |||||||||||||||||||||||||
| 4 | [23] | × | × | × | × | × | × | × | ||||||||||||||||||||||||
| 5 | [24] | × | × | × | × | × | × | |||||||||||||||||||||||||
| 6 | [25] | × | × | × | × | × | × | × | ||||||||||||||||||||||||
| 7 | [26] | × | × | × | × | × | × | |||||||||||||||||||||||||
| 8 | [11] | × | × | × | × | × | × | |||||||||||||||||||||||||
| 9 | [27] | × | × | × | × | × | × | × | × | |||||||||||||||||||||||
| 10 | [28] | × | × | × | × | × | ||||||||||||||||||||||||||
| 11 | [29] | × | × | × | × | × | × | × | ||||||||||||||||||||||||
| 12 | [30] | × | × | × | × | × | ||||||||||||||||||||||||||
| 13 | [31] | × | × | × | × | × | × | × | ||||||||||||||||||||||||
| 14 | [32] | × | × | × | ||||||||||||||||||||||||||||
| 15 | [33] | × | × | × | × | × | × | × | × | × | × | × | ||||||||||||||||||||
| 16 | [18] | × | × | × | × | × | × | |||||||||||||||||||||||||
| 17 | [34] | × | × | × | × | × | × | × | × | |||||||||||||||||||||||
| 18 | [35] | × | × | × | × | × | × | × | × | |||||||||||||||||||||||
| 19 | [36] | × | × | × | × | × | × | × | ||||||||||||||||||||||||
| 20 | [37] | × | × | × | × | × | × | × | × | |||||||||||||||||||||||
| 21 | [38] | × | × | × | × | × | × | × | × | × | ||||||||||||||||||||||
| 22 | [39] | × | × | × | × | × | × | |||||||||||||||||||||||||
| 23 | [40] | × | × | × | × | × | × | |||||||||||||||||||||||||
| 24 | [41] | × | × | × | × | × | × | × | × | × | × | |||||||||||||||||||||
| 25 | [42] | × | × | × | × | × | × | |||||||||||||||||||||||||
| 26 | [43] | × | × | × | × | × | ||||||||||||||||||||||||||
| 27 | [16] | × | × | × | × | × | × | × | × | × | × | × | × | |||||||||||||||||||
| 28 | [44] | × | × | × | × | × | × | × | × | |||||||||||||||||||||||
| 29 | [45] | × | × | × | × | × | × | × | × | |||||||||||||||||||||||
| 30 | [46] | × | × | × | × | × | × | × | × | × | × | × | × | |||||||||||||||||||
| 31 | [47] | × | × | × | × | × | × | × | × | |||||||||||||||||||||||
| 32 | [48] | × | × | × | × | × | × | × | × | × | × | |||||||||||||||||||||
| 33 | [4] | × | × | × | × | × | × | × | ||||||||||||||||||||||||
| 34 | [49] | × | × | × | × | × | × | × | × | |||||||||||||||||||||||
| 35 | [50] | × | × | × | × | × | × | |||||||||||||||||||||||||
| 36 | [19] | × | × | × | × | × | × | |||||||||||||||||||||||||
| 37 | [51] | × | × | × | × | × | × | |||||||||||||||||||||||||
| 38 | [52] | × | × | × | × | × | × | × | × | |||||||||||||||||||||||
| 39 | [53] | × | × | × | × | × | × | × | ||||||||||||||||||||||||
| 40 | [54] | × | × | × | × | × | × | × | × | × | × | |||||||||||||||||||||
| 41 | [55] | × | × | × | × | × | × | |||||||||||||||||||||||||
| 42 | [56] | × | × | × | × | × | × | × | × | × | ||||||||||||||||||||||
| 43 | [57] | × | × | × | × | × | × | × | × | × | × | |||||||||||||||||||||
| 44 | [58] | × | × | × | × | × | × | × | ||||||||||||||||||||||||
| 45 | [59] | × | × | × | × | × | × | × | × | |||||||||||||||||||||||
| Them | Assigned Weight | Elevation | Slope | Rainfall | Drainage Density | Lineament Density | Major Fractures | LULC | Lithology | Soil Type | Channel Network | Criteria Weight | Criteria Weight (Percent) |
|---|---|---|---|---|---|---|---|---|---|---|---|---|---|
| Elevation | 3 | 3/3 | 3/3 | 3/5 | 3/4 | 3/6 | 3/3 | 3/2 | 3/7 | 3/8 | 3/3 | 0.068 | 6.8% |
| Slope | 3 | 3/3 | 3/3 | 3/5 | 3/4 | 3/6 | 3/3 | 3/2 | 3/7 | 3/8 | 3/3 | 0.068 | 6.8% |
| Rainfall | 5 | 5/3 | 5/3 | 5/5 | 5/4 | 5/6 | 5/3 | 5/2 | 5/7 | 5/8 | 5/3 | 0.113 | 11.4% |
| Drainage Density | 4 | 4/3 | 4/3 | 4/5 | 4/4 | 4/6 | 4/3 | 4/2 | 4/7 | 4/8 | 4/3 | 0.091 | 9.1% |
| Lineament Density | 6 | 6/3 | 6/3 | 6/5 | 6/4 | 6/6 | 6/3 | 6/2 | 6/7 | 6/8 | 6/3 | 0.136 | 13.6% |
| Major Fractures | 3 | 3/3 | 3/3 | 3/5 | 3/4 | 3/6 | 3/3 | 3/2 | 3/7 | 3/8 | 3/3 | 0.068 | 6.8% |
| LULC | 2 | 2/3 | 2/3 | 2/5 | 2/4 | 2/6 | 2/3 | 2/2 | 2/7 | 2/8 | 2/3 | 0.045 | 4.5% |
| Lithology | 7 | 7/3 | 7/3 | 7/5 | 7/4 | 7/6 | 7/3 | 7/2 | 7/7 | 7/8 | 7/3 | 0.159 | 15.9% |
| Soil Type | 8 | 8/3 | 8/3 | 8/5 | 8/4 | 8/6 | 8/3 | 8/2 | 8/7 | 8/8 | 8/3 | 0.181 | 18.2% |
| Channel Network | 3 | 3/3 | 3/3 | 3/5 | 3/4 | 3/6 | 3/3 | 3/2 | 3/7 | 3/8 | 3/3 | 0.068 | 6.8% |
| Thematic Layer | Criteria Weight (%) | Class | Rank | Area km2 | Area (%) | |
|---|---|---|---|---|---|---|
| (1) Elevation (DEM) | 6.8 | 74–208 (ma.s.l) | (Very Low) | 5 | 1122.4 | 14.1 |
| 208–302 (ma.s.l) | (Low) | 4 | 2903.2 | 36.4 | ||
| 302–407 (ma.s.l) | (Moderate) | 3 | 1768.6 | 22.1 | ||
| 407–534 (ma.s.l) | (High) | 2 | 1324.8 | 16.6 | ||
| 534–1043 (ma.s.l) | (Very High) | 1 | 866.5 | 10.9 | ||
| (2) Slope Steepness (Degree) | 6.8 | 0–3.6° | (Flat) | 5 | 3299.9 | 41.3 |
| 3.6–7.6° | (Gentle) | 4 | 2601.6 | 32.6 | ||
| 7.6–12.9° | (Moderate) | 3 | 1308.9 | 16.4 | ||
| 12.9–20° | (Steep) | 2 | 598.1 | 7.5 | ||
| 20–67.1° | (Very Steep) | 1 | 177.1 | 2.2 | ||
| (3) Drainage Density | 9.1 | 1.112–1.171 (km/km2) | (Very Low) | 1 | 2586 | 32.4 |
| 1.171–1.215 (km/km2) | (Low) | 2 | 2213.2 | 27.7 | ||
| 1.215–1.259 (km/km2) | (Moderate) | 3 | 1840.6 | 23.1 | ||
| 1.259–1.326 (km/km2) | (High) | 4 | 1200 | 15 | ||
| 1.325–1.434 (km/km2) | (Very High) | 5 | 145.7 | 1.8 | ||
| (4) Rainfall | 11.4 | 2.33–3.46 (mm) | (Very Low) | 1 | 4608.3 | 57.7 |
| 3.46–4.15 (mm) | (Low) | 2 | 1706.5 | 21.4 | ||
| 4.15–5.08 (mm) | (Moderate) | 3 | 912.8 | 11.4 | ||
| 5.08–6.21 (mm) | (High) | 4 | 415.3 | 5.2 | ||
| 6.21–7.67 (mm) | (Very High) | 5 | 342.6 | 4.3 | ||
| (5) Lineament Density | 13.6 | 0.27–0.47 (km/km2) | (Very Low) | 1 | 1784.7 | 22.3 |
| 0.47–0.67 (km/km2) | (Low) | 2 | 3531.7 | 44.2 | ||
| 0.67–0.87 (km/km2) | (Moderate) | 3 | 885 | 11.1 | ||
| 0.87–1.08 (km/km2) | (High) | 4 | 1114.7 | 14 | ||
| 1.08–1.28 (km/km2) | (Very High) | 5 | 669.3 | 8.4 | ||
| (6) Distance from Major Fractures | 6.8 | <200 (m) | (Very Near) | 5 | 212.2 | 2.7 |
| 200–400 (m) | (Near) | 4 | 231.5 | 2.9 | ||
| 400–600 (m) | (Intermediate) | 3 | 242 | 3 | ||
| 600–800 (m) | (Far) | 2 | 245.7 | 3 | ||
| 800–1000 (m) | (Very Far) | 1 | 148.7 | 3.1 | ||
| (7) Lithology | 15.9 | Wadi Deposits (Quaternary) Different types of soil | 5 | 810.3 | 10.1 | |
| Taref Fm. (Paleozoic–Cret. “Turonian”) Sandstone, fine to medium grained | 4 | 526.1 | 6.6 | |||
| Issawia Fm. (Pliocene) Sandy clays, marls, shales, siliceous brecciated limestone, and conglomerates | 3 | 114.6 | 1.4 | |||
| Duwi Fm. (Upper Cret. “Maastrichtian”) Phosphate beds with black shale, marl, and oyster bed sandstone. | 3 | 1339.6 | 16.8 | |||
| Tarwan Fm. (Paleocene) White Chalk and chalky limestone | 3 | 164.4 | 2.1 | |||
| Thebes Group (Eocene) Chalk and chalky limestone bed rich in chert beds | 3 | 3.6 | 0.1 | |||
| Quseir Fm. (Upper Cret. ”Campanian”) Varicolored shale, siltstone, and flaggy sandstone | 2 | 1535.1 | 19.2 | |||
| Dakhla Fm. (Upper Cret. ”Maastrichtian”) Dark grey shallow marine marl and shale with intercalated limestone | 2 | 1004.3 | 12.6 | |||
| Esna Fm. (Paleocene) Green to grey shales with gypsum veinlets altered with a marl bed | 2 | 142.8 | 1.8 | |||
| Precambrian Basement rocks Igneous, metamorphic, and metasediments | 1 | 2344.7 | 29.4 | |||
| (8) Land Use/Land Cover | 4.5 | Wadi Deposit | 5 | 685.7 | 8.6 | |
| Natural desert grassland | 5 | 29.7 | 0.4 | |||
| Cultivated Land | 4 | 104 | 1.3 | |||
| Mining Area | 2 | 106.7 | 1.3 | |||
| Barren Land | 1 | 7059 | 88.4 | |||
| (9) Soil Type (according to in-filtration rate) | 18.2 | Index 1 | (Very high) | 5 | 218.8 | 2.7 |
| Infiltration capacity equilibrium = 13.8mm/min | ||||||
| Index 2 | (High) | 4 | 271.3 | 3.4 | ||
| Infiltration capacity equilibrium = 4.5mm/min | ||||||
| Index 3 | (Moderate) | 3 | 122.9 | 1.5 | ||
| Infiltration capacity equilibrium = 2mm/min | ||||||
| Index 4 | (Low) | 2 | 213.4 | 2.7 | ||
| Infiltration capacity equilibrium = 0.53mm/min | ||||||
| Index 5 | (Very low) | 1 | 7158.9 | 89.7 | ||
| Not Soil “Rock” | ||||||
| (10) Distance from Channel Network | 6.8 | 0–600 (m) | (Very Near) | 5 | 63.2 | 0.8 |
| 601–1200 (m) | (Near) | 4 | 38.6 | 0.5 | ||
| 1201–1800 (m) | (Intermediate) | 3 | 35.4 | 0.4 | ||
| 1801–2400 (m) | (Far) | 2 | 39 | 0.5 | ||
| 2401–3000 (m) | (Very Far) | 1 | 43.4 | 0.5 | ||
| Theme | Elevation | Slope | Rainfall | Drainage Density | Lineament Density | Major Fractures | LULC | Lithology | Soil Type | Channel Network | Weight Sum Value | ʎ |
|---|---|---|---|---|---|---|---|---|---|---|---|---|
| Elevation | 0.068 | 0.068 | 0.068 | 0.068 | 0.068 | 0.068 | 0.068 | 0.068 | 0.068 | 0.068 | 0.682 | 10 |
| Slope | 0.068 | 0.068 | 0.068 | 0.068 | 0.068 | 0.068 | 0.068 | 0.068 | 0.068 | 0.068 | 0.682 | 10 |
| Rainfall | 0.114 | 0.114 | 0.114 | 0.114 | 0.114 | 0.114 | 0.114 | 0.114 | 0.114 | 0.114 | 1.136 | 10 |
| Drainage Density | 0.091 | 0.091 | 0.091 | 0.091 | 0.091 | 0.091 | 0.091 | 0.091 | 0.091 | 0.091 | 0.909 | 10 |
| Lineament Density | 0.136 | 0.136 | 0.136 | 0.136 | 0.136 | 0.136 | 0.136 | 0.136 | 0.136 | 0.136 | 1.364 | 10 |
| Major Fractures | 0.068 | 0.068 | 0.068 | 0.068 | 0.068 | 0.068 | 0.068 | 0.068 | 0.068 | 0.068 | 0.682 | 10 |
| LULC | 0.045 | 0.045 | 0.045 | 0.045 | 0.045 | 0.045 | 0.045 | 0.045 | 0.045 | 0.045 | 0.455 | 10 |
| Lithology | 0.159 | 0.159 | 0.159 | 0.159 | 0.159 | 0.159 | 0.159 | 0.159 | 0.159 | 0.159 | 1.591 | 10 |
| Soil Type | 0.182 | 0.182 | 0.182 | 0.182 | 0.182 | 0.182 | 0.182 | 0.182 | 0.182 | 0.182 | 1.818 | 10 |
| Channel Network | 0.068 | 0.068 | 0.068 | 0.068 | 0.068 | 0.068 | 0.068 | 0.068 | 0.068 | 0.068 | 0.682 | 10 |
| The Indices of Consistency of Randomly Generated Reciprocal Matrices [64] | ||||||||||
|---|---|---|---|---|---|---|---|---|---|---|
| The Matrix’s Order | ||||||||||
| N | 1 | 2 | 3 | 4 | 5 | 6 | 7 | 8 | 9 | 10 |
| RCI value * | 0.00 | 0.00 | 0.58 | 0.90 | 1.12 | 1.24 | 1.32 | 1.41 | 1.45 | 1.49 |
| Index | Soil Type |
|---|---|
| 1 |
|
| 2 |
|
| 3 |
|
| 4 |
|
| 5 |
|
| Return Period (Years) | Percent Chance Exceedance | Median (mm) | Expected Probability (mm) | Confidence Limits Probability 5% (mm) | Confidence Limits Probability 95% (mm) |
|---|---|---|---|---|---|
| 2 | 50 | 2.934 | 2.952 | 3.759 | 2.196 |
| 5 | 20 | 6.812 | 6.894 | 8.728 | 5.099 |
| 10 | 10 | 9.746 | 10.074 | 12.487 | 7.295 |
| 20 | 5 | 12.679 | 13.245 | 16.246 | 9.492 |
| 50 | 2 | 16.557 | 17.393 | 21.215 | 12.395 |
| 100 | 1 | 19.491 | 20.477 | 24.974 | 14.591 |
| S No. | Aquifer type | Basin | Well Type | Latitude | Longitude | Depth to Water (2015–2021) | Groundwater Level | Well Location on GWPZ Map | Validation Remarks | ||
|---|---|---|---|---|---|---|---|---|---|---|---|
| 2015 | 2021 | Drawdown | |||||||||
| 1 | Basement | Abadi | Hand-dug | 25.29305 | 34.01715 | 21 | - | - | Medium | Poor | Disagree |
| 2 | 25.2962 | 34.01673 | 13.5 | - | - | Shallow | Good | Agree | |||
| 3 | 25.35523 | 33.8881 | 11.22 | - | - | Shallow | |||||
| 4 | 25.39138 | 33.8192 | 3.31 | - | - | Very Shallow | |||||
| 5 | 25.07295 | 33.79751 | - | 36.3 | - | Medium | Moderate | ||||
| 6 | 25.06789 | 33.79088 | - | 32.8 | - | ||||||
| 7 | Nubia | Abadi | Drilled | 24.99508 | 33.36889 | - | 60 | - | Medium/Deep | Moderate | Partially agree |
| 8 | 24.99331 | 33.35946 | - | 55 | - | ||||||
| 9 | 25.02363 | 33.24399 | - | 44 | - | Medium | Agree | ||||
| 10 | 25.06227 | 33.20951 | - | 32.3 | - | Medium | Agree | ||||
| 11 | Hand-dug | 25.05524 | 33.09096 | 8.5 | 10 | 1.5 | Shallow | Good | Agree | ||
| 12 | Drilled | 25.03958 | 33.07906 | - | 10.2 | - | Shallow | Good | Agree | ||
| 13 | 25.03756 | 33.07654 | 8.7 | 10 | 1.3 | Shallow | Good | Agree | |||
| 14 | 25.03233 | 33.06653 | 7.5 | 8 | 0.5 | Very Shallow | Good | Agree | |||
| 15 | 25.03411 | 33.06639 | 10 | 11 | 1 | Shallow | Moderate | Partially agree | |||
| 16 | 25.03237 | 33.06243 | - | 15.8 | - | Shallow | Good | Agree | |||
| 17 | 25.03537 | 33.062 | - | 4.2 | - | Very Shallow | |||||
| 18 | 25.02555 | 33.05486 | 8.6 | 10 | 1.4 | Shallow | |||||
| 19 | 25.02591 | 33.05341 | - | 12 | - | Shallow | |||||
| 20 | 25.02426 | 33.04908 | 5 | 6 | 1 | Very Shallow | |||||
| 21 | Quaternary | Abadi | Hand-dug | 25.02464 | 33.04648 | 4 | 5.2 | 1.2 | Very Shallow | Good | Agree |
| 22 | Nubia | 25.02999 | 33.04420 | - | 6.7 | - | Very Shallow | Good | Agree | ||
| 23 | Drilled | 25.0296 | 33.04430 | - | 7.8 | - | Agree | ||||
| 24 | Quaternary | Hand-dug | 25.0177 | 33.04155 | 3 | 4 | 1 | Very Shallow | Good | Agree | |
| 25 | 25.01735 | 33.04177 | 2.9 | 4.2 | 1.3 | Agree | |||||
| 26 | 25.01964 | 33.03901 | - | 4.1 | - | Agree | |||||
| 27 | 25.0128 | 33.02373 | - | 3 | - | Agree | |||||
| 28 | Al-Mafallis | Drilled | 25.09834 | 32.85235 | - | 2.9 | - | Moderate | Disagree | ||
| 29 | Nubia | Hilal | Spring | 25.12756 | 32.81267 | Flowing | Very Shallow | Good | Agree | ||
| 30 | Quaternary | El-Dir | Drilled | 25.33117 | 32.59856 | 18 | 20 | 2 | Medium | Moderate | Agree |
| 31 | 25.33142 | 32.59790 | 18 | 20 | 2 | ||||||
| 32 | 25.33219 | 32.60896 | 25 | 30 | 5 | ||||||
| 33 | 25.33567 | 32.61537 | 30 | 40 | 10 | ||||||
| 34 | 25.33562 | 32.61775 | - | 44.6 | - | ||||||
| 35 | 25.33738 | 32.61988 | 35 | 47 | 12 | ||||||
| 36 | 25.33968 | 32.63270 | 40 | 54 | 14 | Medium/Deep | Partially agree | ||||
| 37 | 25.34631 | 32.6385 | - | 63 | - | Medium/Deep | |||||
| 38 | 25.34867 | 32.611 | - | 32 | - | Medium | Agree | ||||
| 39 | El-Foley | 25.35972 | 32.57956 | - | 20 | - | |||||
| 40 | El-Sabil | 25.30405 | 32.61621 | - | 36 | - | |||||
Publisher’s Note: MDPI stays neutral with regard to jurisdictional claims in published maps and institutional affiliations. |
© 2022 by the authors. Licensee MDPI, Basel, Switzerland. This article is an open access article distributed under the terms and conditions of the Creative Commons Attribution (CC BY) license (https://creativecommons.org/licenses/by/4.0/).
Share and Cite
Morgan, H.; Hussien, H.M.; Madani, A.; Nassar, T. Delineating Groundwater Potential Zones in Hyper-Arid Regions Using the Applications of Remote Sensing and GIS Modeling in the Eastern Desert, Egypt. Sustainability 2022, 14, 16942. https://doi.org/10.3390/su142416942
Morgan H, Hussien HM, Madani A, Nassar T. Delineating Groundwater Potential Zones in Hyper-Arid Regions Using the Applications of Remote Sensing and GIS Modeling in the Eastern Desert, Egypt. Sustainability. 2022; 14(24):16942. https://doi.org/10.3390/su142416942
Chicago/Turabian StyleMorgan, Hesham, Hussien M. Hussien, Ahmed Madani, and Tamer Nassar. 2022. "Delineating Groundwater Potential Zones in Hyper-Arid Regions Using the Applications of Remote Sensing and GIS Modeling in the Eastern Desert, Egypt" Sustainability 14, no. 24: 16942. https://doi.org/10.3390/su142416942
APA StyleMorgan, H., Hussien, H. M., Madani, A., & Nassar, T. (2022). Delineating Groundwater Potential Zones in Hyper-Arid Regions Using the Applications of Remote Sensing and GIS Modeling in the Eastern Desert, Egypt. Sustainability, 14(24), 16942. https://doi.org/10.3390/su142416942