1. Introduction
In the field of machine learning and pattern recognition, feature extraction from massive high-dimensional data is a very demanding job [
1]. Various applications of feature extraction methods include face recognition [
2], EEG-based emotion recognition [
3], rice disease recognition [
4], facial emotion recognition [
5], speaker recognition [
6] and diagnosis of COVID-19 related diseases [
7,
8].
One of the most prevalent feature extraction methods is Principal Component Analysis (PCA) [
9,
10], which seeks a projection matrix that maximizes projected variance. PCA is a simple, non-parametric technique for extracting relevant information from large datasets, minimizing information loss, reducing the dimensionality of such datasets and increasing interpretability. It is abundantly applied in different disciplines including atmospheric science [
10], computer science [
11] and neuroscience [
12].
When applying PCA to extract features from images, 2D image matrices should be reshaped into 1D image vectors prior [
11]. This operation abandons the 2D image spatial structure information and leads to a large size of covariance matrix that is difficult to handle. Two-dimensional PCA (2DPCA) [
13] alleviates this problem by dealing with image matrices directly rather than reshaping them into vectors. Compared with PCA, 2DPCA extracts more structural information from images and its covariance matrix becomes much easier to handle. Moreover, 2DPCA generally outperforms PCA in image reconstruction and recognition [
13]. Due to its simple formulation and superior performance, 2DPCA has been successfully applied in various fields such as image retrieval [
14,
15], fault detection [
16], iris recognition [
17], target recognition based on synthetic aperture radar images [
18], bearing fault diagnosis [
19], brain tumor diagnosis [
20], etc.
Despite having many advantages, 2DPCA treats the rows and columns of images unequally, thus lacking symmetry in its theory. Specifically, to extract features from an image by 2DPCA, rows rather than columns of the image are projected onto the principal components. In order to project the other direction, i.e., columns of the image, the alternative 2DPCA (A2DPCA) [
21] was proposed. Then, it is natural to combine the two kinds of unilateral 2DPCA. Following this idea,
[
21], generalized 2DPCA (G2DPCA) [
22] and sequential row–column 2DPCA (RC2DPCA) [
23] were proposed in order to fuse the bilateral information of images.
calculates bilateral eigenvectors by directly taking the projection matrices from 2DPCA and A2DPCA. Generalized 2DPCA calculates bilateral eigenvectors by iteratively solving a minimization problem. RC2DPCA calculates bilateral eigenvectors in two stages, i.e., first performing 2DPCA in the row direction on the original data and then performing A2DPCA in the column direction on the projected results of the first stage. All of these algorithms project an image onto the two lateral eigenvectors simultaneously in order to compute the final projection results.
In this paper, we propose a novel bilateral 2DPCA by fusing 2DPCA and A2DPCA in a direct fashion, called Direct Bilateral 2DPCA (DB2DPCA). Unlike the previously proposed bilateral 2DPCA algorithms, we concatenate the projection results of 2DPCA and A2DPCA together for projection, and we take the average reconstruction results of 2DPCA and A2DPCA for reconstruction. The proposed method has three advantages. First, it has a symmetric property in the sense that it treats the rows and columns of images equally. Second, for projection, it concatenates the bilateral information rather than mixing them together. Therefore, it extracts more features than lateral algorithms or other previously proposed bilateral algorithms. For reconstruction, it simply averages two lateral results, thus being more interpretable than other bilateral algorithms. Third, it is rooted in 2DPCA and A2DPCA; so, the computational time to extract features by DB2DPCA will be no longer than those of other bilateral algorithms.
The contributions of our work are summarized in the following points:
- 1.
A novel, bilateral 2DPCA—i.e., DB2DPCA—is proposed by fusing two unilateral 2DPCA algorithms. We concatenate the projection results of 2DPCA and A2DPCA together for projection and take the average reconstruction results of 2DPCA and A2DPCA for reconstruction. By this way, we can extract more features from images and obtain a more interpretable reconstruction model.
- 2.
We evaluate DB2DPCA in the tasks of image recognition and reconstruction on four widely used benchmark databases. The experimental results demonstrate that the proposed algorithm outperforms competing algorithms.
- 3.
Additional experiments on reordered and reshaped images further demonstrate the superiority of DB2DPCA in image recognition.
The remainder of this paper is organized as follows.
Section 2 reviews the recent advances of 2DPCA.
Section 3 describes the competing algorithms and the proposed DB2DPCA algorithm.
Section 4 conducts experiments of image reconstruction and classification to evaluate the performance of DB2DPCA.
Section 5 shows the experimental results.
Section 6 provides discussions on this study and related works. Finally,
Section 7 presents the conclusions.
2. Related Works
Besides the unilateral and bilateral 2DPCA-based algorithms mentioned above, there are many other advances of 2DPCA, as discussed below.
To extract more structure information from images, Titijaroonroj et al. [
24] and Sahoo et al. [
25,
26] made improvements on the traditional 2DPCA by utilizing it on subimages of the original image. The subimages are generated by sliding a window on the original image or by partitioning the original image into blocks. By this way, they can extract more structure information from images. However, the procedures of these algorithms are complex and their performances are largely determined by how the image is partitioned.
Traditional 2DPCA utilizes
-norm as the distance metric, which aggravates the effect of outliers on the objective function. On the other hand, the features extracted by 2DPCA are dense, which means that 2DPCA cannot automatically eliminate irrelevant features. To introduce robustness and sparsity into traditional 2DPCA, several algorithms have been proposed. Li et al. [
27] and Wang et al. [
28] replaced
-norm with
-norm on the objective function of 2DPCA to improve its robustness, and proposed the greedy 2DPCA-L1 and the non-greedy 2DPCA-L1. Yang et al. [
29] further replaced
-norm with transformed
-norm, which is expected to be more robust, and proposed the 2DPCA-
. Wang and Wang [
30] imposed
-norm both on the objective function and the constraint of 2DPCA for simultaneously robust and sparse modeling, and proposed the 2DPCAL1-S. Considering that replacing
-norm with
-norm brings many benefits to the related algorithms, it is worthwhile to replace the two norms by an arbitrary norm, i.e.,
-norm, to exploit more possibilities. Based on this idea, Wang [
31] imposed
-norm both on the objective function and the constraint of 2DPCA, and proposed the generalized 2DPCA with
-norm (G2DPCA-Lp), further enhancing its robustness and sparseness.
Rotational invariance is another desired property of 2DPCA-based algorithm which can be introduced by
-norm or
F-norm.
-norm is a rotational invariant
-norm, hence the name
-norm [
32,
33]. Gao et al. [
34] introduced
-norm into 2DPCA and proposed the
-2DPCA. Li et al. [
35] replaced square
F-norm with
F-norm in 2DPCA and proposed the
F-2DPCA. Gao et al. [
36] minimized the ratio of reconstruction error to the projected variances that are measured with
F-norm, and proposed the Angle-2DPCA. Wang and Li [
37] minimized the product of reconstruction error and projected variance that are measured with
F-norm and proposed the Area-2DPCA. Wang et al. [
38] maximized the ratio of projected variance to original data that are measured with
F-norm and proposed the Cos-2DPCA. Bi et al. [
39] maximized the ratio of projected variance to original data that are measured with
-norm and considered the optimal mean in data centralization, proposing the robust optimal mean cosine angle 2DPCA (ROMCA-2DPCA). Razzak et al. [
40] introduced 2D outliers–robust PCA (ORPCA) by relaxing the orthogonal constraints and penalizing the regression coefficient. Inspired by extending
-norm and
-norm to
-norm, the
-norm and
F-norm were extended to arbitrary powers correspondingly. By extending
-norm to
-norm, Mi et al. [
41] proposed the
-2DPCA, Zhou et al. [
42] proposed the generalized centered 2DPCA (GC-2DPCA). By extending
F-norm to
-norm, Kuang et al. [
43] proposed the
-2DPCA. Following the two-stage idea of RC2DPCA [
23], Zhou et al. [
44] proposed the bilateral Angle-2DPCA (BA2DPCA), Bi et al. [
45] proposed the
-norm sequential bilateral 2DPCA (
-SB-2DPCA).
To directly address the three color channels of an image, color 2DPCA-based algorithms were proposed. Xiang et al. [
46] used a row vector to represent the color channel and proposed the color-2DPCA (C-2DPCA). Jia et al. [
47] used a quaternion with zero real part to represent the color channel and proposed the 2D quaternion PCA (2D-QPCA). Xiao and Zhou [
48] proposed a novel quaternion ridge regression model for 2D-QPCA and proposed the QRR-2D-QPCA. Wang et al. [
49] replaced square
F-norm with
F-norm in 2D-QPCA and proposed the
F-2D-QPCA. Jia et al. [
50] replaced
-norm with
-norm in 2D-QPCA and proposed the generalized 2D-QPCA (G-2D-QPCA). Zhao et al. [
51] introduced
-norm to 2D-QPCA and proposed the relaxed 2DPCA (R-2DPCA).
Besides those mentioned above, Zhang et al. [
52] replaced the
F-norm with nuclear-norm in traditional 2DPCA and generalized 2DPCA [
22], proposing the nuclear-norm-based 2DPCA (N-2DPCA) and the nuclear-norm-based bilateral 2DPCA (NB-2DPCA). Zhang et al. [
53] proposed a computationally efficient Riemannian proximal stochastic gradient descent algorithm (RPSGD) to solve sparse 2DPCA on the Stiefel manifold. Li et al. [
54] introduced the human learning mechanism to 2DPCA and proposed the self-paced 2DPCA (SP2DPCA). Wang et al. [
55] applied the Lanczos algorithm to speed up traditional 2DPCA. Further, 2DPCA was employed to design novel neural networks such as 2DPCA-Net [
56] and L1-2DPCA-Net [
57].
In summary, recent advances of 2DPCA mainly focus on partitioning images into subregions to extract more structural information, introducing robustness and sparsity by
-norm or
-norm, introducing rotational invariance by
-norm or
F-norm, processing color images directly under the quaternion framework, designing deep learning models, etc., as shown in
Table 1. Note that some algorithms in this table incorporate multiple ideas but we still classify each of them into a single category for simplicity. For example,
-SB-2DPCA [
45] incorporates the arbitrary power of
-norm and the sequential bilateral idea from RC2DPCA [
23].
3. Methodology
Few of the algorithms in
Table 1 pay attention to fusing bilateral information of images, which is the focus of this paper. In the following paper, lowercase letters denote scalars, boldface lowercase letters denote vectors and boldface uppercase letters denote matrices. We first review related algorithms, i.e., PCA, 2DPCA, A2DPCA and
, in order. Then, the proposed DB2DPCA algorithm is described and its relationships with the four related algorithms are discussed.
3.1. PCA
Suppose there are
n training image samples
, where
;
; and
h and
w are the image height and image width, respectively. Let
. When applying PCA for image analysis, 2D image matrices should be reshaped into corresponding 1D image vectors prior [
11], generating
, where
,
. PCA [
9,
10] aims at finding a projection matrix
by maximizing the total scatter of projected image samples as follows:
where
m is the feature number,
denotes an identity matrix,
denotes the trace of a matrix and
denotes the mean image vector. By eigenvalue decomposition of the covariance matrix [
9,
10]
we can obtain
m eigenvalues
and corresponding eigenvectors
. Without loss of generality, we assume that the eigenvalues are sorted in descending order. The eigenvectors are the principal components and they make up the projection matrix
. The percentage of total variance [
10] explained by these principal components is
For a test image sample
, its feature matrix is
The reconstruction result of sample
is
It can be further reshaped from a vector into a image matrix in order to generate the reconstruction image. Eigenvalue decomposition of the covariance matrix is difficult since the size of is huge.
3.2. 2DPCA
In contrast to traditional PCA, 2DPCA [
13] depends on 2D image matrices rather than 1D image vectors. Therefore, the image matrices do not need to be reshaped into vectors prior. Instead, an image covariance matrix can be constructed based on the image matrices in a direct manner. To be specific, 2DPCA [
13] aims at finding a projection matrix
where
k is the feature number and
denotes the mean image. The projection matrix
is calculated by eigen-decomposition of the image covariance matrix
and then selecting the eigenvectors corresponding to the
k largest eigenvalues [
13]. The percentage of total variance explained by these eigenvectors can be calculated similar to Equation (
3). For a test image sample
, its feature matrix is
The reconstruction image of sample
is
The original 2DPCA only projects the rows of images onto the projection matrix, as shown in Equations (
6) and (
8). Therefore, 2DPCA lacks symmetry in the sense that it treats the rows and columns of images unequally.
3.3. Alternative 2DPCA
Since 2DPCA only deals with one direction of images, it is necessary to propose an algorithm to deal with the other direction of images. This idea leads to A2DPCA [
21]. A2DPCA aims to find a projection matrix
by solving the following optimization problem:
where
l is the feature number. Similarly,
could be calculated by eigen-decomposition of the image covariance matrix
and then selecting the eigenvectors corresponding to the
l largest eigenvalues [
21]. The percentage of total variance explained by these eigenvectors can be calculated likewise. For a test image sample
, its feature matrix is
The reconstruction image of sample
is
A2DPCA only projects the columns of images onto the projection matrix. It also lacks symmetry, the same as 2DPCA.
3.4.
[
21], G2DPCA [
22] and RC2DPCA [
23] are three representatives of existing bilateral 2DPCA algorithms. All of them project an image onto the two lateral eigenvectors simultaneously in order to calculate the feature matrix. Their only difference lies in the way to calculate bilateral eigenvectors. Since
shares the same eigenvectors with the two unilateral 2D algorithms but the eigenvectors of G2DPCA and RC2DPCA are quite different, we focus on
in our paper. By this way, we can make a fair comparison between this bilateral 2D algorithm and the two unilateral 2D algorithms.
To make the most of bilateral information,
[
21] directly takes the projection matrices
and
from 2DPCA and A2DPCA, respectively. For a test image sample
, its feature matrix projected by
is
The reconstruction image of sample
reconstructed by
is
overcomes the limitations of the two unilateral 2D algorithms by projecting the rows and columns of images onto two lateral eigenvectors simultaneously. Zhang and Zhou [
21] demonstrated that compared with the two unilateral 2D algorithms,
achieves the same classification accuracies on the Olivetti Research Laboratory (ORL) face database and achieves higher classification accuracies on a partial Face Recognition Technology (FERET) database. However, its formulation mixes bilateral information from images together and may lead to information loss. The other two unilateral algorithms, i.e., G2DPCA [
22] and RC2DPCA [
23], have the same problem.
3.5. Direct Bilateral 2DPCA
In this paper, we propose a novel, bilateral 2DPCA called DB2DPCA by fusing the two unilateral algorithms, i.e., 2DPCA and A2DPCA, in a direct fashion—that is, DB2DPCA takes the projection matrices and from the two unilateral algorithms, respectively, the same as . The difference between the two bilateral algorithms is that projects an image onto two lateral projection matrices simultaneously while DB2DPCA projects an image onto a single lateral projection matrix each time and then combines the results from two laterals together.
For a test image sample
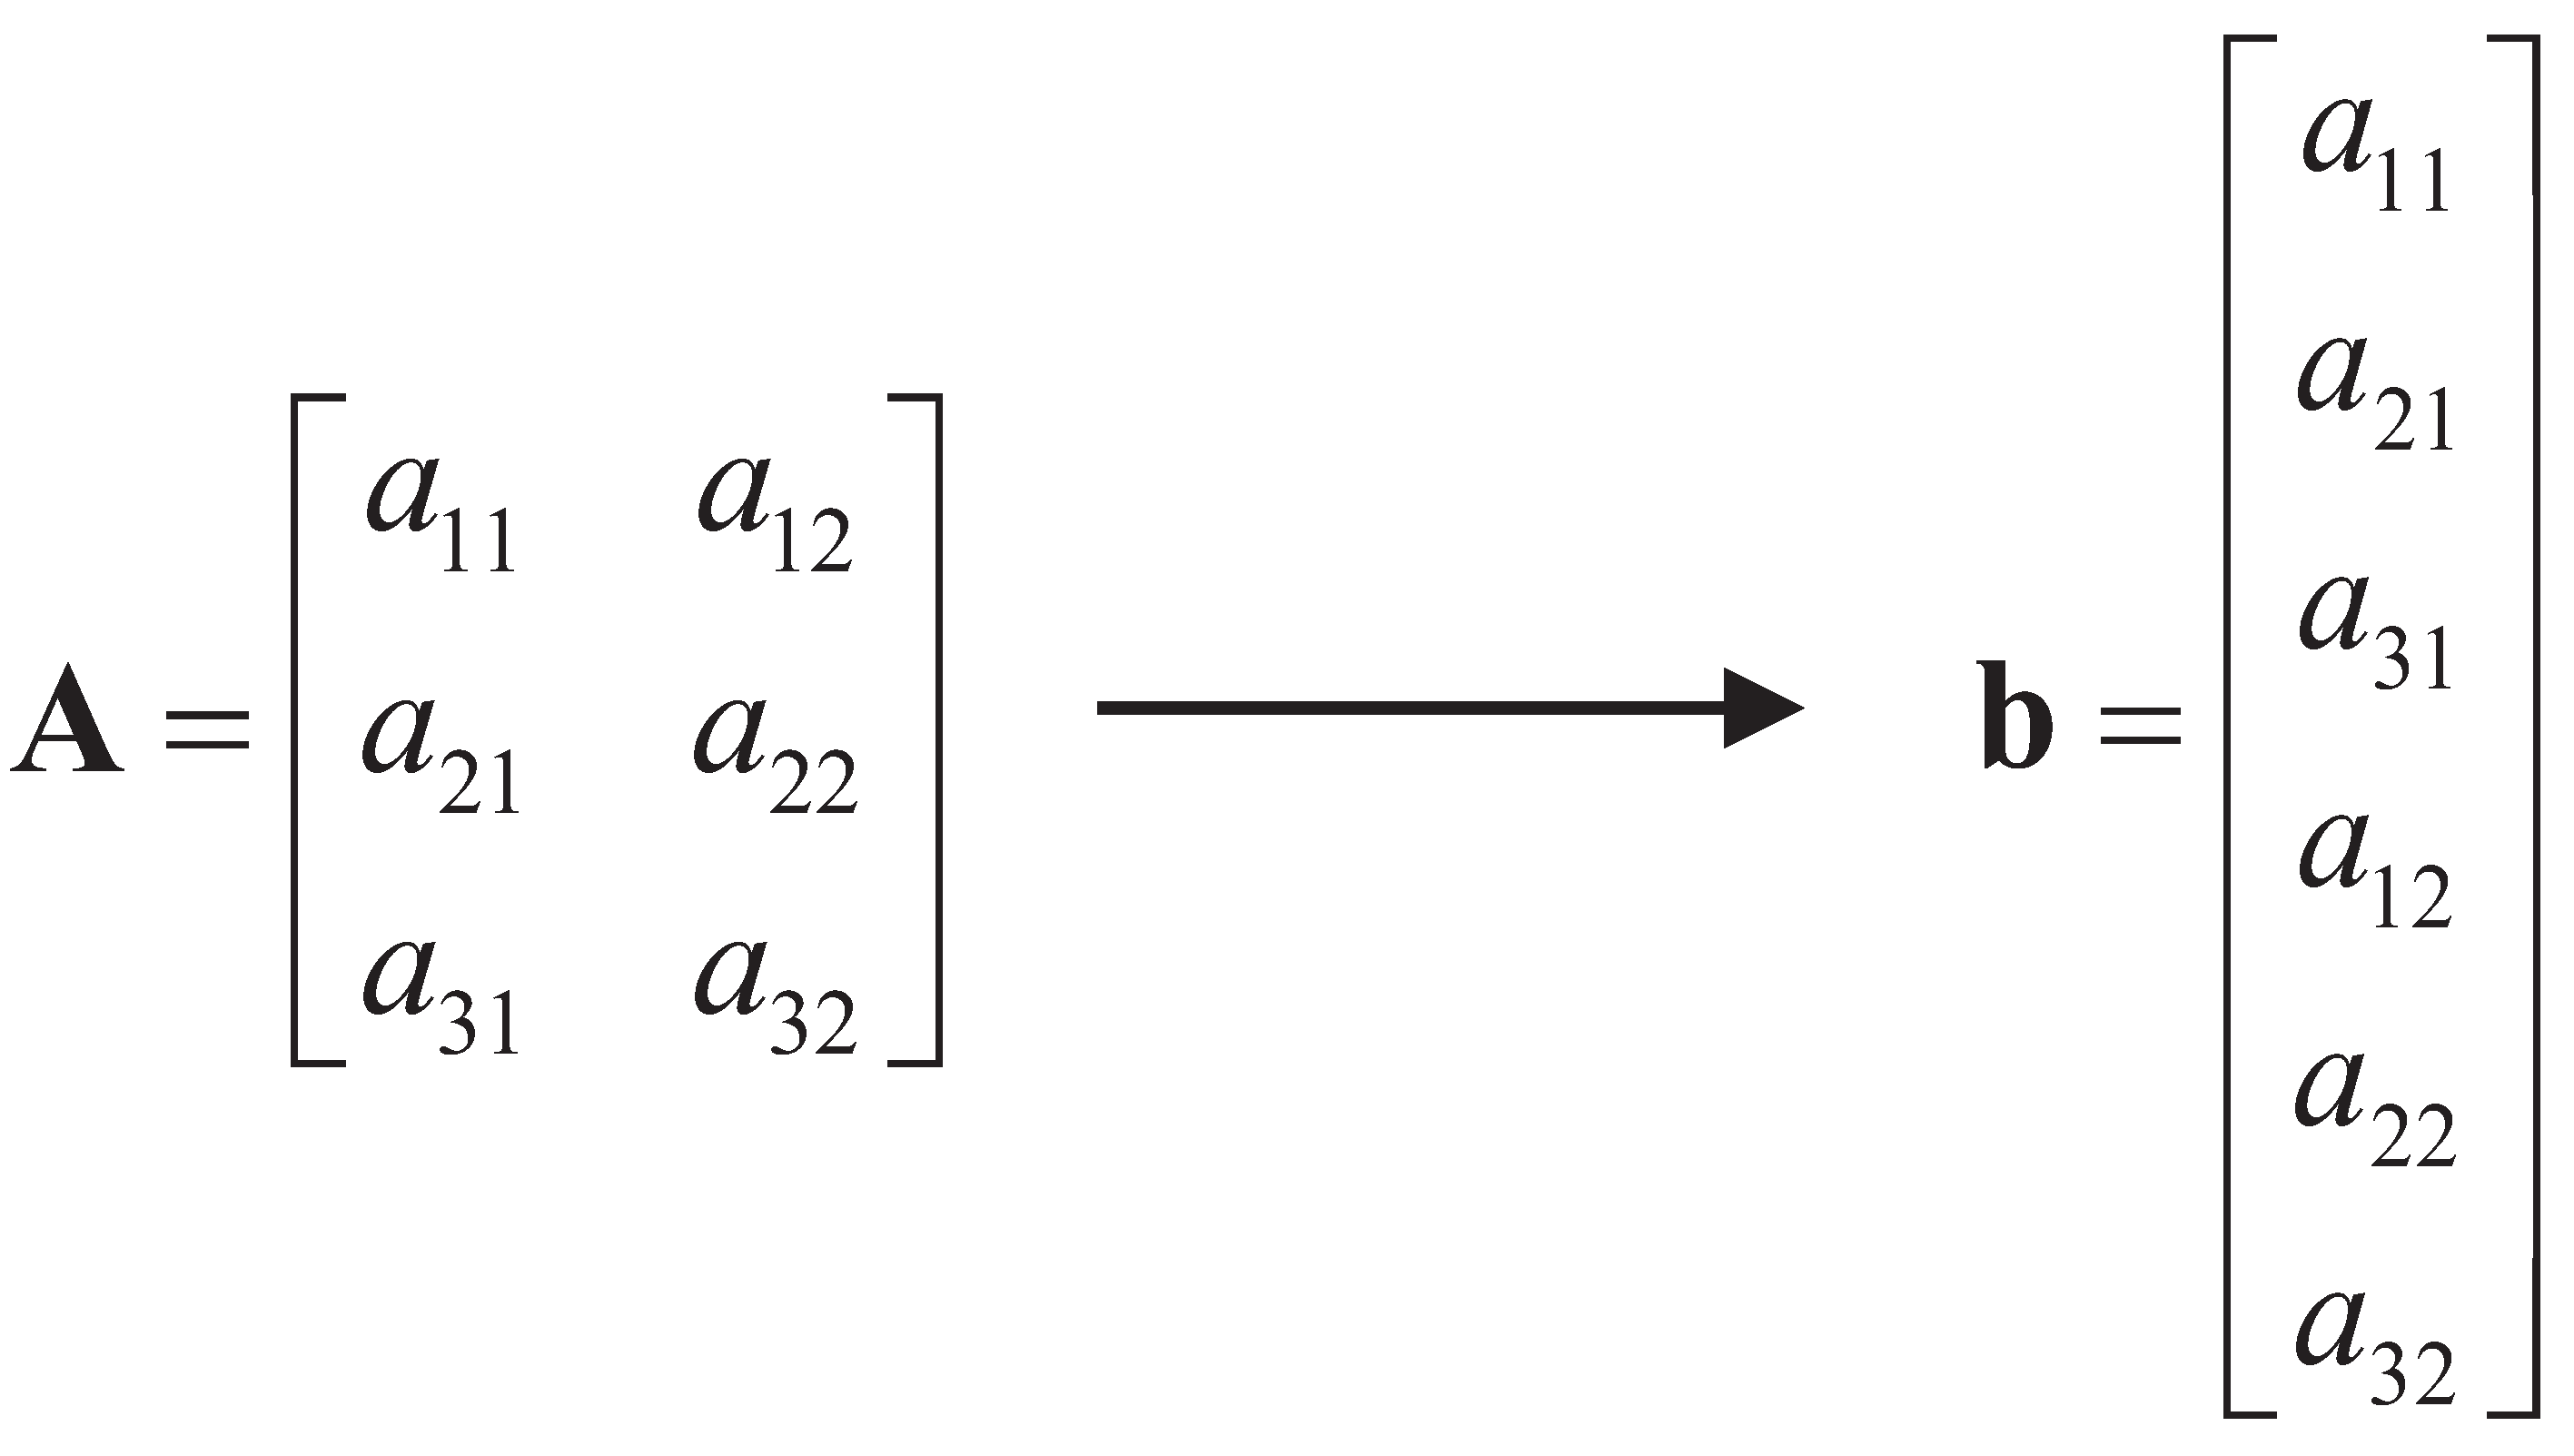
, its feature matrix by DB2DPCA is calculated by concatenating the feature matrices of 2DPCA and A2DPCA as
where
means to transform a matrix into a column vector by taking elements from the matrix in a column-wise manner.
Figure 1 shows an illustration of this operation that transforms a matrix
into a column vector
, i.e.,
.
The reconstruction image of sample
by DB2DPCA is
Here, we use arithmetic mean to combine the reconstruction results of the two lateral 2DPCAs. However, geometric mean or other kinds of means can also be tried. In general, for two positive scalars
a and
b, the generalized mean [
58] is defined as
when
r is a real number. Two special cases of generalized means are the arithmetic mean when
and the geometric mean when
. In this paper, we focus on
, i.e., the arithmetic mean, in consideration of computational complexity and reconstruction performance.
The algorithm procedure of DB2DPCA is shown in Algorithm 1. First, we calculate projection matrices
and
by solving the optimization problems of 2DPCA and A2DPCA, i.e., Equations (
6) and (
10), respectively. Then, we calculate the feature matrix of a test image sample by Equation (
16) which concatenates the feature matrices of the two unilateral 2D algorithms. The extracted features can be used to evaluate the performance of DB2DPCA in image classification. And we calculate the reconstruction image of a test image sample by Equation (
17), which averages the reconstruction results of the two unilateral 2D algorithms. The obtained reconstruction image can be used to evaluate the performance of DB2DPCA in image reconstruction.
| Algorithm 1: Algorithm procedure of DB2DPCA |
Input: training image samples , ; feature numbers k and l. Output: the feature matrix and the reconstruction image. 1. Calculate projection matrix by solving Equation ( 6). 2. Calculate projection matrix by solving Equation ( 10). 3. Calculate the feature matrix by Equation ( 16). 4. Calculate the reconstruction image by Equation ( 17). |
By concatenating the feature matrices of 2DPCA and A2DPCA, DB2DPCA extracts more features that are useful for image recognition. By averaging the reconstruction results of 2DPCA and A2DPCA, DB2DPCA strengthens their common parts and weakens their differences; thus, it is expected to obtain better performance in image reconstruction.
3.6. Relationships between DB2DPCA and Other Algorithms
An image is essentially a sample containing d(= features after neglecting its 2D structure. To investigate the relationships between DB2DPCA and related algorithms, we reshape images into matrices by the same rule. Three extreme conditions are stated below.
(1) When and , we can obtain that equals the projection matrix of conventional PCA and . In this case, the feature matrix for a test sample is calculated by concatenating two parts, wherein one part is the feature matrix calculated by PCA and the other part is the result of subtracting the mean image from the sample image. The reconstruction image of is calculated by averaging the reconstruction image of PCA and the sample image.
(2) When
,
and the pixels in images are not reordered, the projection and reconstruction results of DB2DPCA are just integrating the results of 2DPCA and A2DPCA, as shown in Equations (
16) and (
17), respectively.
(3) When and , we can obtain that , and equals the projection matrix of conventional PCA. In this case, the projection and reconstruction results of DB2DPCA are the same as the results in case of and . This shows the symmetry property of DB2DPCA.
In general, p could be an arbitrary integer satisfying . Thus, —namely, q—is the smallest integer no less than . The symmetry of DB2DPCA indicates that DB2DPCA on images of size approximates DB2DPCA on images of size . By taking this symmetric property into consideration, we only need to change p in the range of in order to investigate its effect on the performance of DB2DPCA.
Since , there may exist blank pixels that should be filled in a reshaped image. Some potential choices are randomly picking some pixels from the original image to fill the blanks, calculating the mean value of all pixels in the original image to fill the blanks and filling the blanks with the nearest non-blank pixels. If only the cases when d is divisible by p are considered, we can avoid the noises introduced by these operations.
4. Experiments
In order to evaluate DB2DPCA, we compare its performances in image reconstruction and recognition with four related algorithms, i.e., PCA, 2DPCA, A2DPCA and , on four image databases. To further exploit the properties of DB2DPCA, we additionally conduct image recognition experiments when the pixels in images are reordered by certain rules and when images are reshaped to different sizes.
4.1. Databases
Here, we briefly introduce the four databases used in the experiments. These are the Extended Yale B face database [
59], AR face database [
60], Binary Alphadigits database and PolyU 3D palmprint database [
61]. These databases are used to address different kinds of recognition problems, i.e., face recognition in various lighting conditions, face recognition with occlusions, handwritten digits and letters classification, and palmprint recognition. In this way, we could make a thorough comparison between the proposed DB2DPCA and related algorithms.
The Extended Yale B face database includes 2414 cropped face images from 38 individuals, with about 64 images per individual. There exist 18 broken images in this database. The images were captured under various lighting conditions. The image size is 192 by 168. For computational convenience, the images are resized into 48 by 42. This database can be downloaded from
http://vision.ucsd.edu/~leekc/ExtYaleDatabase/ExtYaleB.html (accessed on 18 October 2016).
The AR face database contains 3120 images of 120 subjects, with 26 images per subject. The images were taken with different facial expressions and illuminations, and some images were occluded with black sunglasses or scarves. Here, we use a cropped version of this database where the image size is 50 by 40. This database can be downloaded from
http://www2.ece.ohio-state.edu/~aleix/ARdatabase.html (accessed on 18 October 2016).
The Binary Alphadigits database consists of 1404 binary images from 36 classes, with 39 images per class. The images are handwritten digits and letters. Specifically, this database contains digits “0” through “9” and capital letters “A” through “Z”. The image size is 20 by 16. This database can be downloaded from
http://www.cs.nyu.edu/~roweis/data.html (accessed on 30 September 2018).
The PolyU 3D palmprint database contains 8000 images collected from 400 different palms, with 20 images per palm. Each image contains a 3D region of interest (ROI) and the corresponding 2D ROI. In our experiments, only the 2D ROIs are used. The image size is 128 by 128. For computational convenience, the images are resized into 32 by 32. This database can be downloaded from
http://www4.comp.polyu.edu.hk/~biometrics/ (accessed on 9 September 2018).
Table 2 shows the statistics of the four databases.
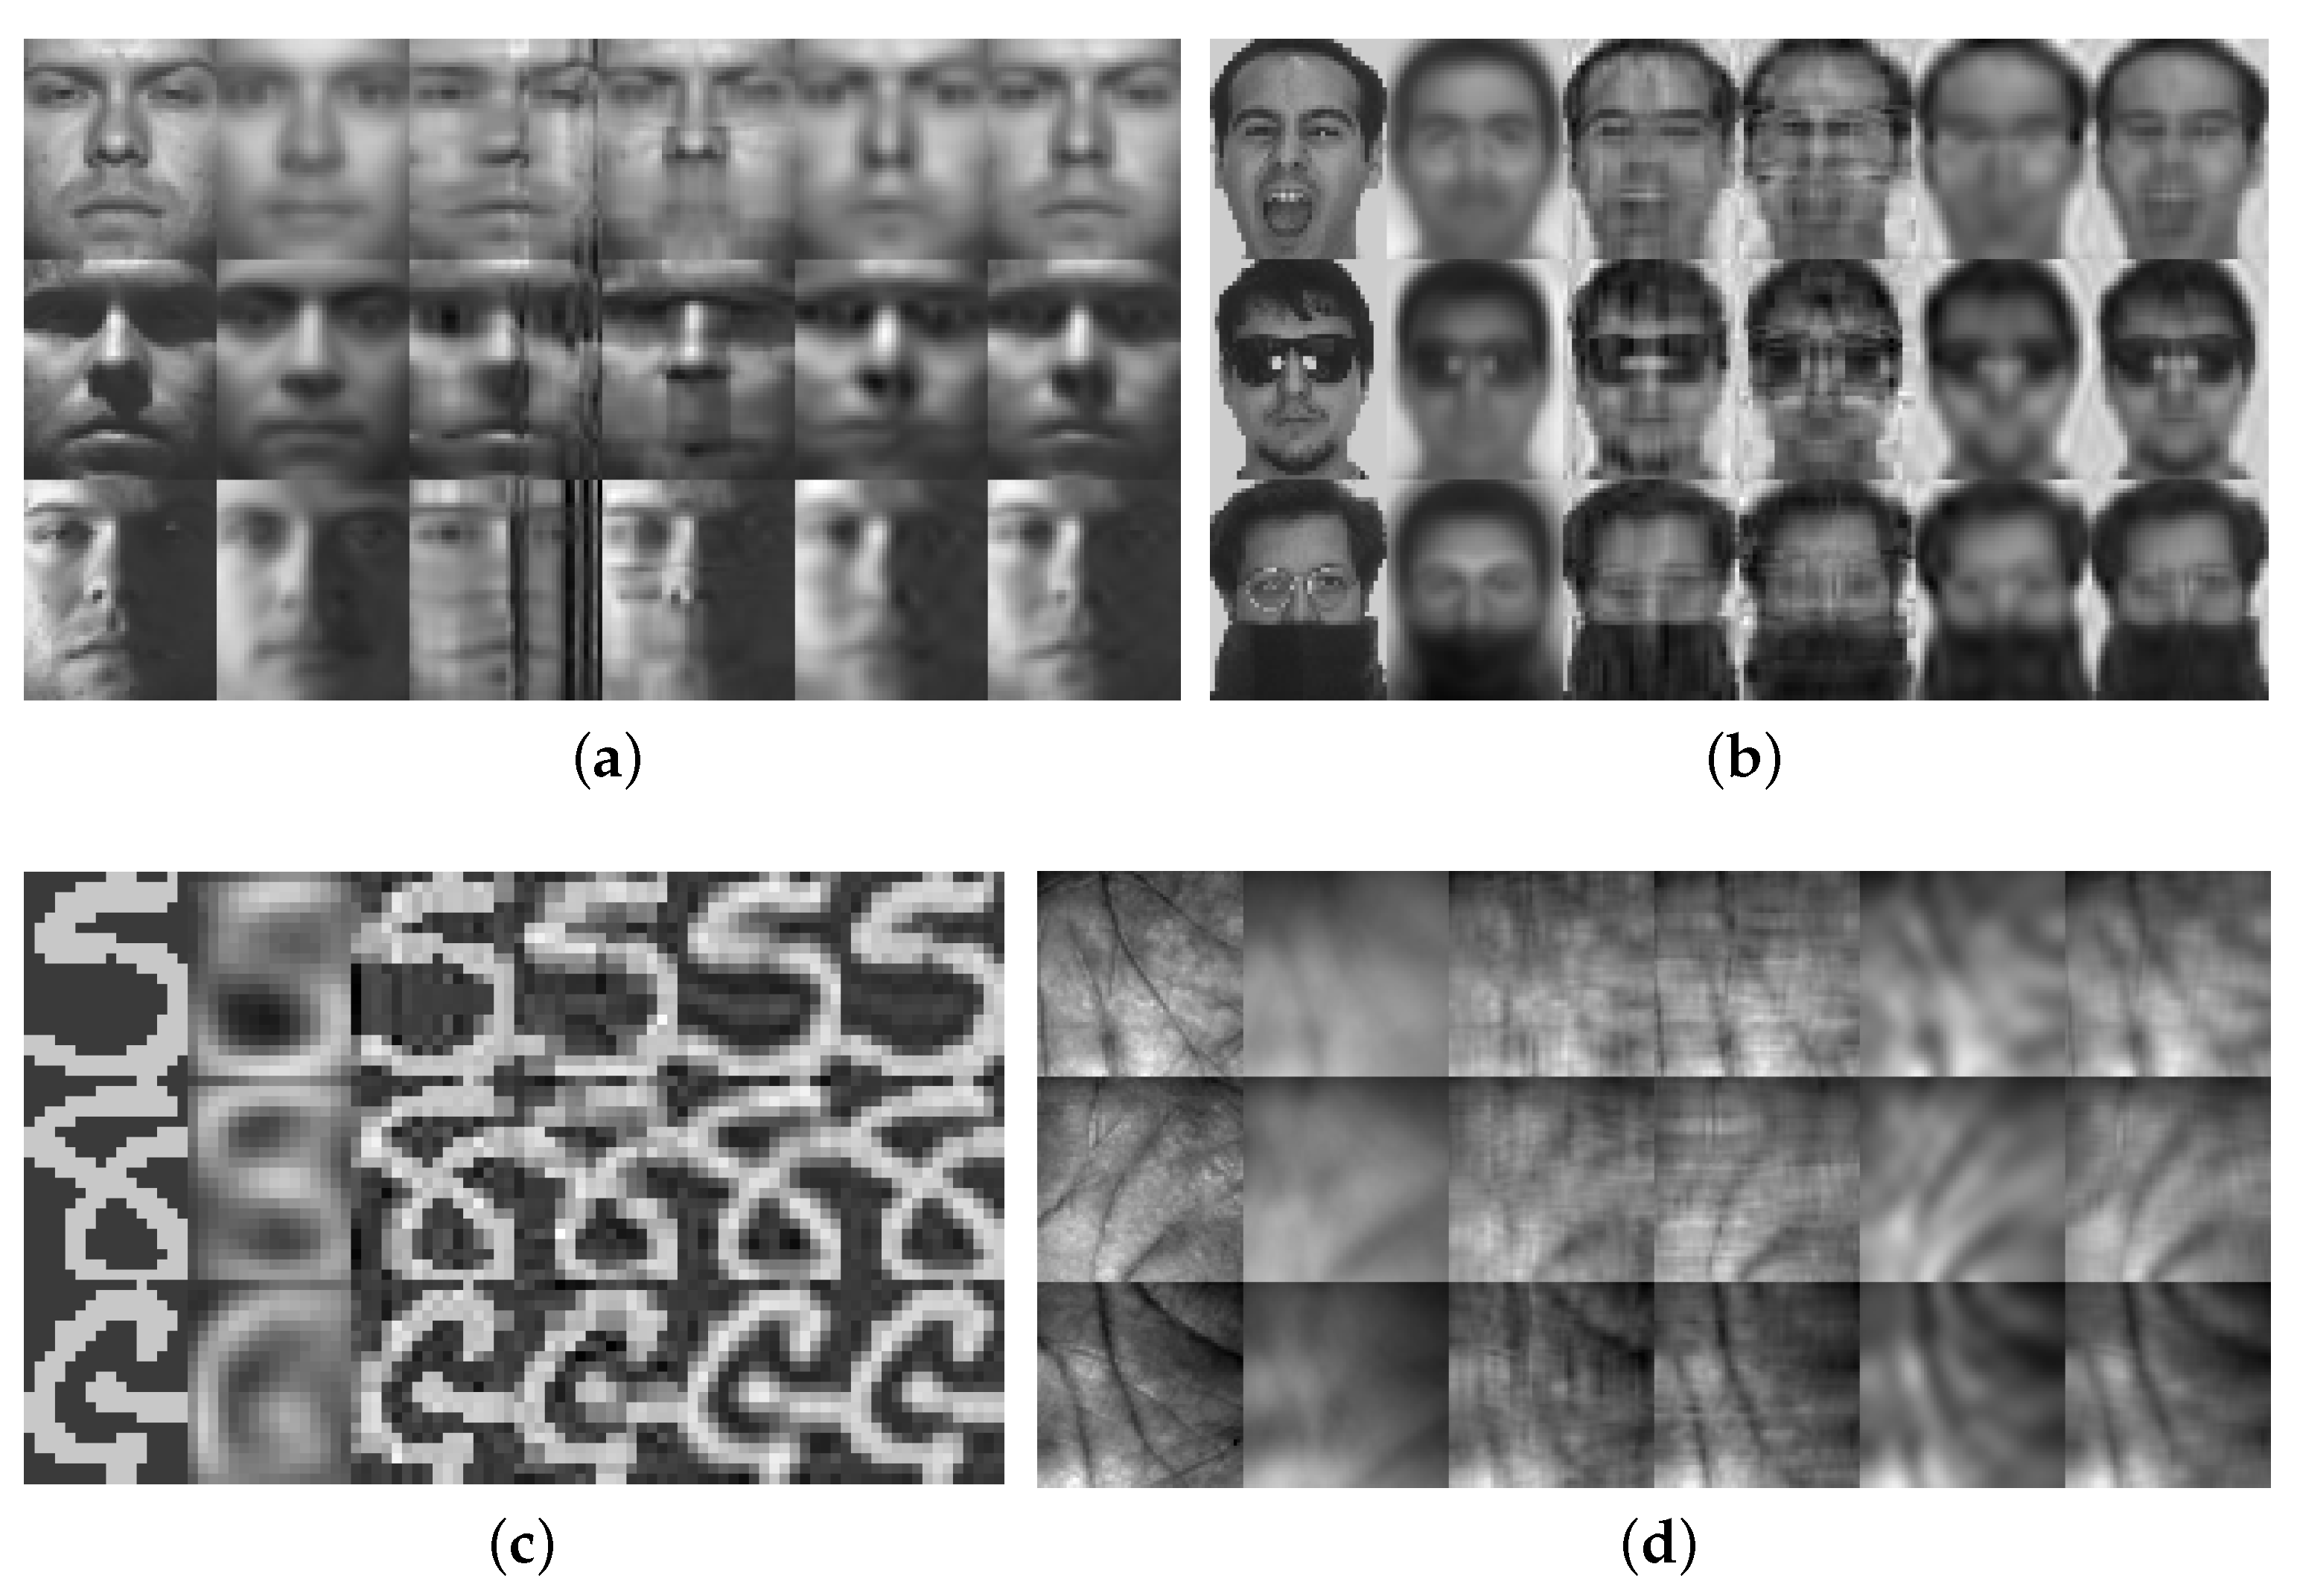
Figure 2 shows some sample images.
4.2. Image Reconstruction
To quantify the comparison of the five algorithms in image reconstruction, we calculate reconstruction errors of these algorithms. Suppose
is the reconstruction image of
by one of the five algorithms,
. Then, the average reconstruction error is
where
denotes the Frobenius norm. The reconstruction result of PCA is shown in Equation (
5). It should be further reshaped into a
matrix in order to obtain the corresponding reconstruction image
. For the four 2D algorithms, i.e., 2DPCA, A2DPCA,
and DB2DPCA, their definitions of
are shown in Equations (
9), (
13), (
15) and (
17), respectively. Note that for the two bilateral algorithms, the same number of features are extracted from both laterals.
4.3. Image Recognition
To compare the recognition performance of DB2DPCA with the aforementioned four algorithms, we employ these algorithms to extract features and then apply a specific classifier on the extracted features to perform classification. Since recognition performance is largely determined by the classifier, we try three different classifiers in order to highlight the effects of the feature extraction methods. The classifiers chosen are the Nearest Neighbor (NN) classifier, linear Support Vector Machine (SVM) [
62,
63] and Collaborative Representation Classifier (CRC) [
64,
65]. These classifiers are widely employed to evaluate the recognition performance of unsupervised learning algorithms.
Ten-fold cross validation is adopted for performance evaluation—that is, all images are randomly separated into ten folds, wherein nine folds are for training and the remaining one fold is for testing. This procedure is repeated ten times and the average classification accuracy is calculated.
For PolyU 3D palmprint database, we perform classification on images from the first 100 subjects to reduce the computational time. For the other three databases, all images are used.
For the two bilateral algorithms, we extract the same number of features from both laterals. To implement linear SVM, we use LibSVM [
62,
63] with default parameters. As recommended in [
62], prior to classification by linear SVM, the training and testing data are linearly scaled. Specifically, each attribute in training data is scaled to [0, 1]; then, the same parameters are applied to the testing data. For CRC, the regularization parameter
is set to be
as in [
64], where
n is the number of training samples.
4.4. The Effect of Reordering Pixels in Images
All faces, handwritten characters and palmprint images carry semantic information for humans but not for machines. When analyzed by statistical algorithms, an image is essentially a stack of data. Since 2D algorithms treat an image as a whole without transforming it into a long vector, it is natural to ask whether the image structure information affects the classification performances of the above algorithms. To this end, we reorder the pixels in all images of a database by the same rule and then perform classification as described above.
Figure 3 shows sample images from the Extended Yale B face database and six variants generated by reordering the pixels in the original images. For clarity, the original image and its six variants are called variants 0 to 6, respectively. The variants 1 to 4 are generated by rotating the original images by 180 degrees clockwise, flipping the original images upside down, flipping the original images in the left/right direction and exchanging the upper half and lower half of the original images. The remaining two variants are generated by randomly reordering pixels of the original images. These reordering rules are representative. Note that when a reordering rule is chosen, it is applied to the whole database to keep the image structure consistent across all images. Then, we conduct image classification tasks on the reordered databases in order to examine the effect of reordering pixels in images.
4.5. The Effect of Reshaping Images
As discussed in
Section 3.6, DB2DPCA is closely related to other PCA algorithms under some extreme conditions when images are reshaped. Therefore, we proceed to test the effect of reshaping images on classification performances. When an image is reshaped, its structure information is partially lost. In order to preserve the original image structure as much as possible, pixels in the image matrices are stacked column-wise as in
Figure 1. By changing the image height
p, a series of new databases can be generated. We only consider the cases when the image height
p satisfies
and
d is divisible by
p. In this way, we can avoid introducing noises in the reshaping procedure.
Since a
image can be reshaped into a
image in many different ways, it is necessary to consider the mixed effects of reordering and reshaping. To this end, we first generate two randomly reordered databases as in
Figure 3 and then reshape the reordered databases by stacking pixels column-wise as in
Figure 1 to generate two series of new databases. The original database and its reordered and reshaped variants are called variants 0–2 in order. Note that the same reordering and reshaping rule should be applied to all images in the original database in order to keep the image structure consistent.
Figure 4 shows the reordered and reshaped images of a sample image from the Extended Yale B face database. The image heights in the eight columns of the figure are 28, 32, 36, 42, 48, 56, 63 and 72 in order.
For illustration, we focus on the Extended Yale B face database with CRC as the classifier again. Since there are three series of reordered and reshaped databases, we fix the feature number
k in the each algorithm as in [
21]. Specifically, we choose the smallest
k satisfying that the percentage of total variance explained by the first
k principal components is larger than a preset threshold
. The threshold
is set to 0.5, 0.6, 0.7 and 0.8 in the experiments. For the two bilateral algorithms, i.e.,
and DB2DPCA, we choose
k in the same manner for two laterals separately. Then, we conduct image classification tasks on the reordered and reshaped databases in order to examine the effect of reshaping images.
5. Results
5.1. The Percentage of Total Variance Explained
Before proceeding to the experimental results of image recognition and reconstruction, it is meaningful to examine the percentages of total variance explained by features of different algorithms. This can provides valuable insights on the differences between the three basic types of PCA transformations, i.e., PCA, 2DPCA and A2DPCA. The principal components of two bilateral 2D algorithms, i.e., and DB2DPCA, are directly inherited from the two unilateral 2D algorithms. Thus, it is not necessary to analyze them separately.
Table 3 shows the maximal number of principal components that can be extracted by different algorithms. Since there are plenty of samples in the four databases, as shown in
Table 2, the maximal number of principal components that can be extracted by PCA, 2DPCA and A2DPCA equals the image size, image width and image height, respectively.
Figure 5 shows the percentages of total variance explained by the first thirty principal components of the three algorithms. For the Binary Alphadigits database, the results corresponding to the maximal number of principal components are calculated. Detailed results when the number of principal components is smaller than seven are listed in
Table 4. The results of the two unilateral 2D algorithms are exactly the same, and both are much larger than the corresponding results of PCA. For the two unilateral 2D algorithms, the first thirty principal components can explain most of the total variance. For PCA, the first thirty principal components can explain
to
of the total variance, depending on the database. The percentages of total variance explained indicate how much information is extracted from a specific database, thus greatly affecting the performances of the feature extraction algorithms in image reconstruction and recognition.
5.2. Image Reconstruction
Figure 6 shows the reconstructed images of the five algorithms, wherein the first ten feature vectors are used for image reconstruction. Note that for the two bilateral algorithms, the first ten projection vectors from both laterals are used. The reconstructed images of PCA and
are very obscure. The reconstructed images of 2DPCA and A2DPCA have vertical stripes and horizontal stripes, respectively. The reconstructed images of DB2DPCA highly approximate the original images. Obviously, the proposed algorithm outperforms the other four algorithms in image reconstruction.
Figure 7 shows the average reconstruction errors of the five algorithms with different numbers of extracted features. For the two bilateral algorithms, we select the same number of features for both laterals. By averaging the results in
Figure 7 across different feature numbers, we obtain
Table 5. With the exception of
Figure 7a, the average reconstruction errors of PCA are the largest among the five algorithms, the average reconstruction errors of DB2DPCA are the smallest and the results of the other three algorithms lie between those of PCA and DB2DPCA. These results again demonstrate that DB2DPCA outperforms the other four algorithms in image reconstruction.
It is not surprising that the reconstructed images of PCA are very obscure and the average reconstruction errors of PCA are large. The maximal number of principal components that can be extracted by PCA is much larger than those of the two unilateral algorithms, as shown in
Table 3, but only the first few feature vectors are used to generate the reconstructed image or calculate the reconstruction errors. The percentages of total variance explained by these feature vectors are relatively small, as shown in
Figure 5 and
Table 4, and cannot be guaranteed to reconstruct the original image accurately. By comparison, the total number of features that can be extracted by 2DPCA-based algorithms is small and the percentage of total variance explained by the same number of feature vectors of these algorithms is large. Therefore, 2DPCA-based algorithms perform much better than PCA with the same number of feature vectors in image reconstruction.
The reconstructed images of 2DPCA and A2DPCA have vertical stripes and horizontal stripes, respectively. The average reconstruction errors of the two unilateral algorithms are much larger than those of DB2DPCA; this is because 2DPCA only projects the rows of images onto its projection matrix and A2DPCA only projects the columns of images onto its projection matrix. Since the noises in the reconstructed images of 2DPCA and A2DPCA exist in different directions, these noises counteract with each other when they are averaged by DB2DPCA. Therefore, DB2DPCA has better reconstruction performance than the two unilateral 2D algorithms.
The reconstructed images of are also obscure. The average reconstruction errors of are much larger than those of DB2DPCA; this is because projects the rows and columns of images onto the corresponding projection matrices simultaneously, thus mixing bilateral information together and leading to information loss. DB2DPCA avoids this problem by averaging between the reconstruction results of the two unilateral algorithms, thus strengthening their similarities and weakening their differences. Therefore, DB2DPCA achieves better image reconstruction performance than .
The reconstructed images of DB2DPCA highly approximate the original images, and the average reconstruction errors of DB2DPCA are the smallest among the five algorithms. Therefore, we conclude that DB2DPCA outperforms the other four algorithms in image reconstruction.
In recent years,
-norm and
-norm were introduced to improve 2DPCA algorithms, proposing new algorithms such as 2DPCA-L1 [
27], 2DPCAL1-S [
30] and G2DPCA [
31]. These algorithms are expected to be more robust to noise and obtain sparse results. However, they only slightly outperform 2DPCA in image reconstruction even with optimal tuning parameters, especially when the feature number is small. Compared with these algorithms, DB2DPCA is rather efficacious in image reconstruction.
5.3. Image Recognition
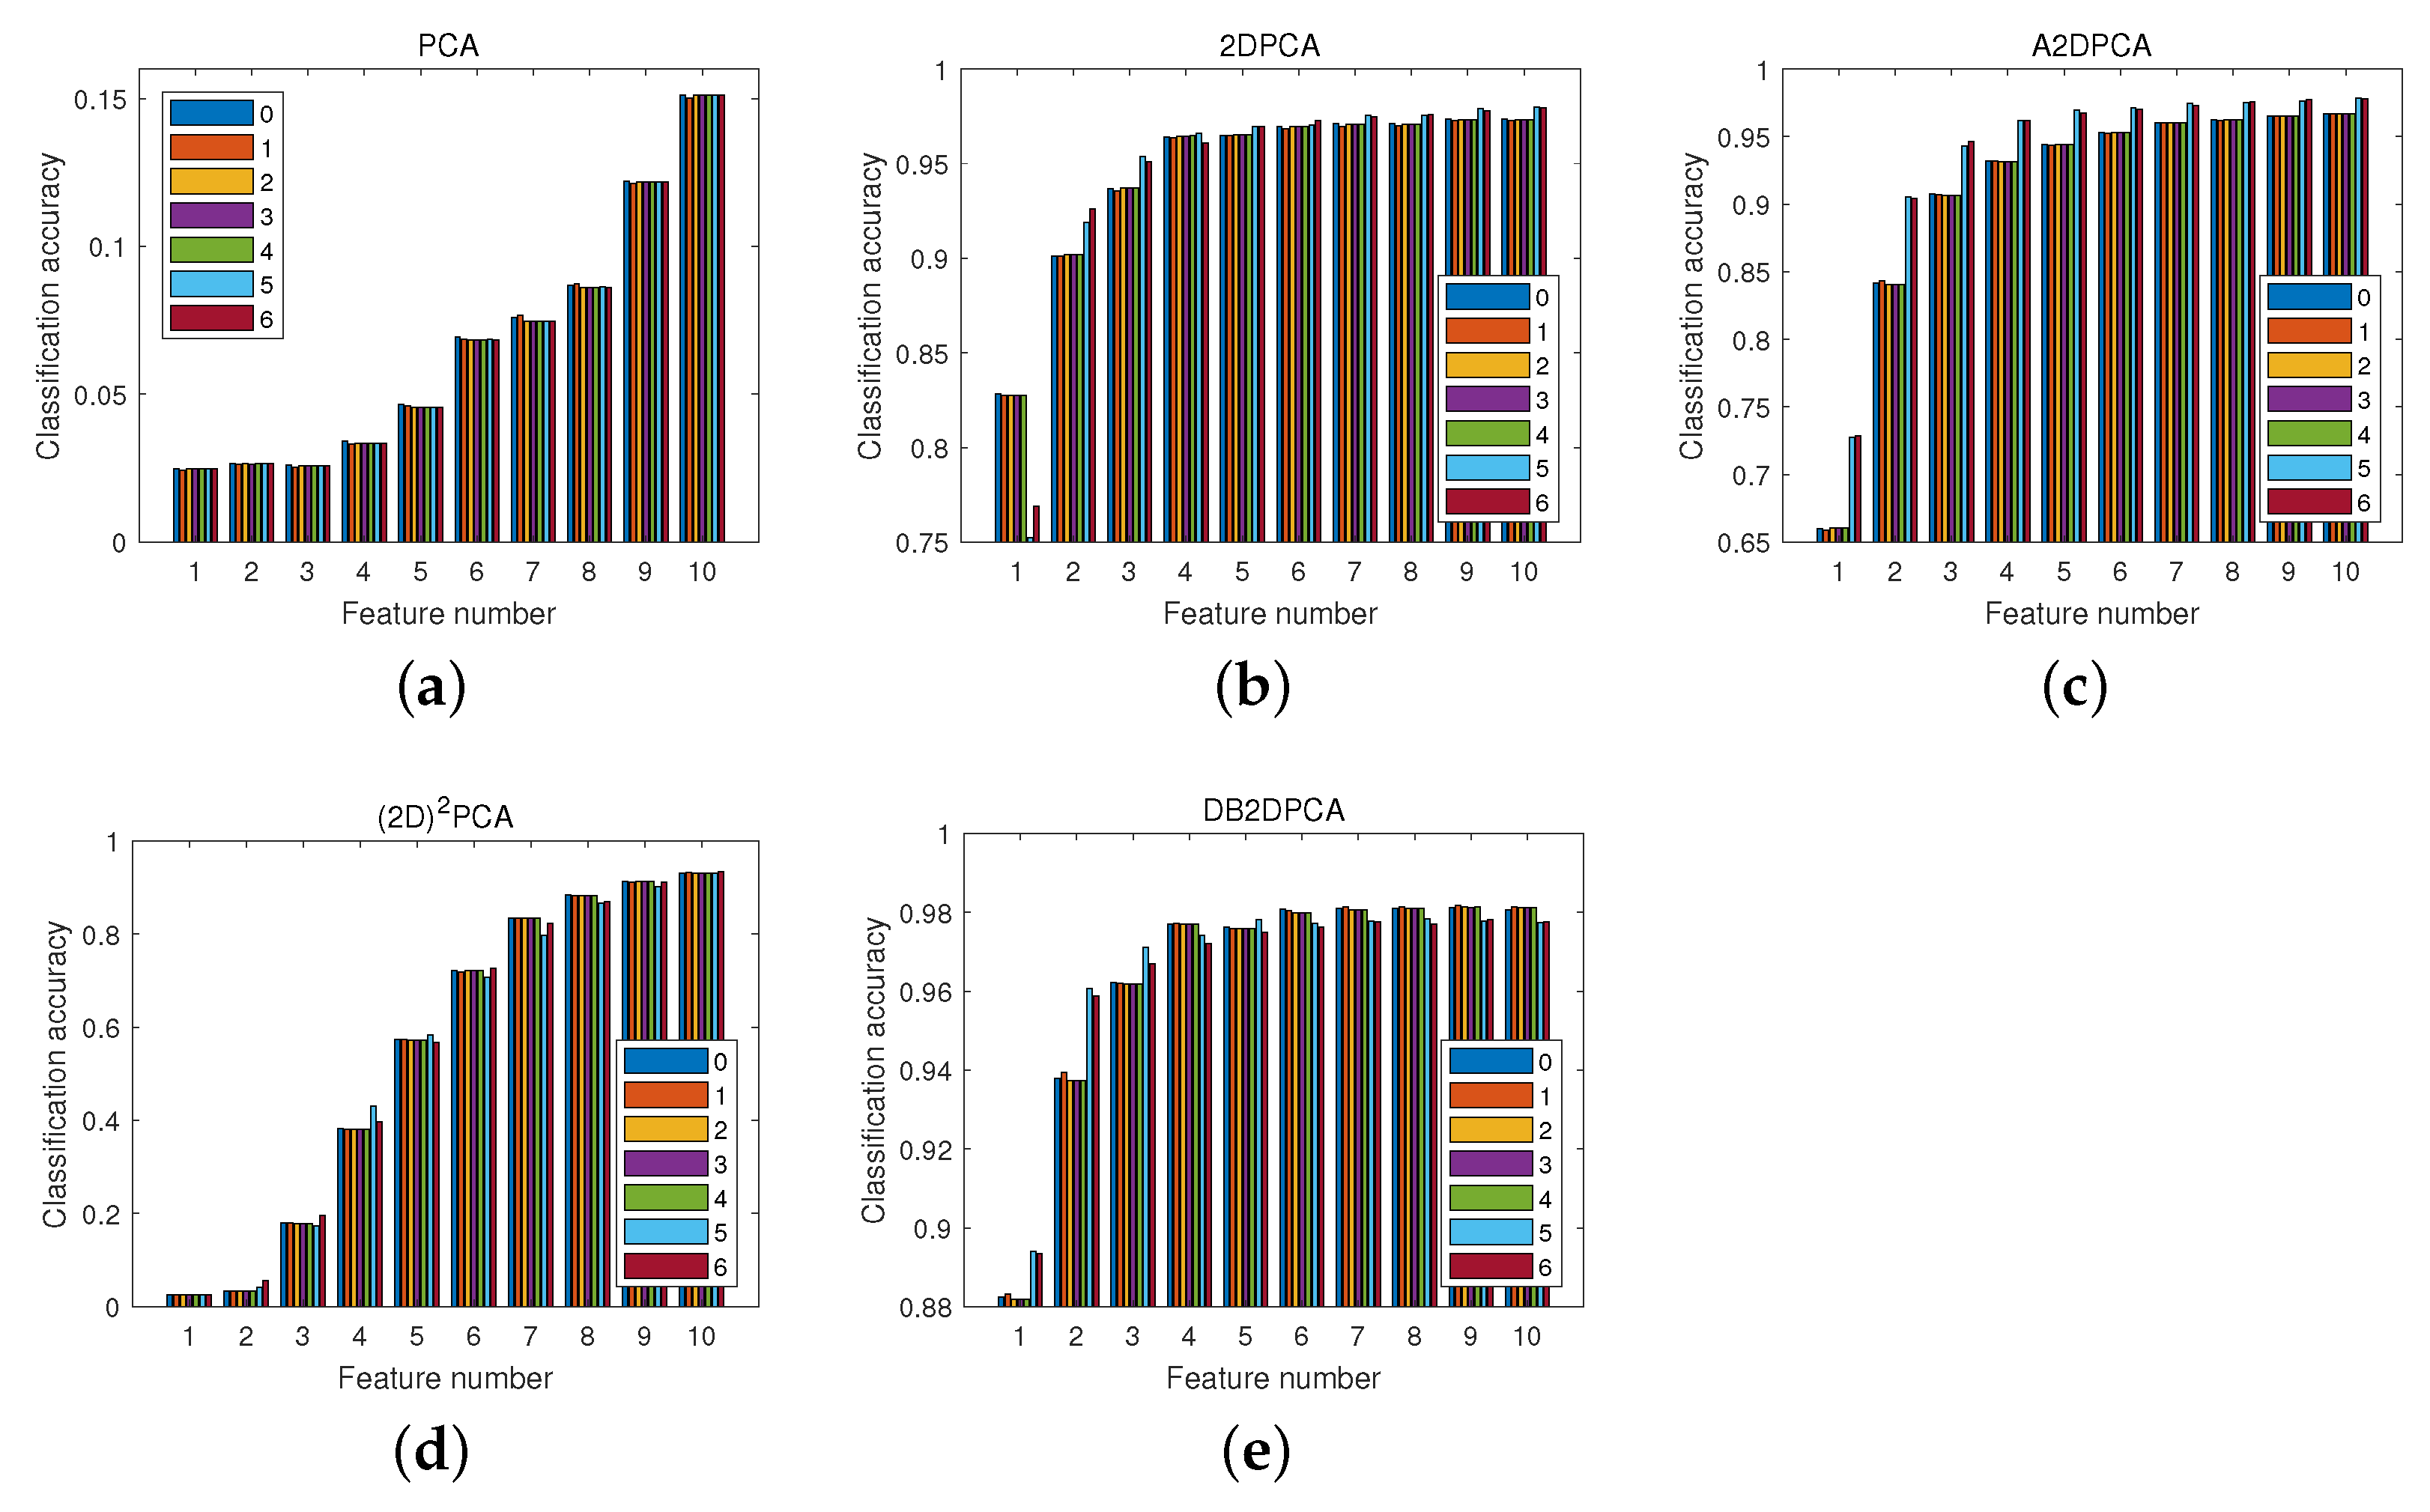
Figure 8 shows the average classification accuracies of the five algorithms followed by three different classifiers on four databases. By averaging the results in
Figure 8 across different feature numbers, we obtain
Table 6. PCA underperforms compared with 2DPCA-based algorithms in most cases. The reason is similar to that discussed in
Section 5.2. With the exceptions of
Figure 8a,d,i, DB2DPCA obtains the highest classification accuracies among the five algorithms.
Two exceptions where 2DPCA outperforms DB2DPCA exist in
Figure 8a,d, in which cases the classifier is chosen to be NN. The accuracies of NN in both cases are much lower than corresponding results of SVM and CRC in
Figure 8b,c,e,f where DB2DPCA outperforms 2DPCA. Therefore, we conclude that NN cannot make the most of the information extracted by DB2DPCA in the two cases.
Comparing between the two bilateral 2D algorithms, DB2DPCA outperforms
in most cases. The only exception occurs on the Binary Alphadigits database in
Figure 8i, when CRC is applied as the classifier and the feature number is larger than four. The reason might be that the image size of the Binary Alphadigits database is much smaller than the other three databases. With the exception of
Figure 8i, DB2DPCA greatly outperforms
in image recognition. It is also due to the fact that
projects the rows and columns of images onto the corresponding projection matrices simultaneously, thus mixing bilateral information together and leading to information loss. On the other side, DB2DPCA concatenates bilateral information directly and extracts more features that can improve the image recognition performance.
The curves of the four 2D algorithms on the Binary Alphadigits database in
Figure 8g–i are different from the corresponding curves in other figures in that they do not monotonically increase with feature number; this is because the image size of the Binary Alphadigits database (20 × 16) is much smaller than those of the other three databases. Since we extract at most 16 features for this database, there exist redundant features when the feature number is large. The redundant features deteriorate the classification performances. For the other three databases, the maximal feature number is much smaller than the image size of the databases; so, their classification accuracies tend to increase with feature number. If we focus on the results when the feature number is small and no redundant features are extracted, DB2DPCA has obvious advantages over competing algorithms.
Since DB2DPCA can make the most of bilateral information from images, it is natural that DB2DPCA generally outperforms the other four algorithms in image classification.
Based on the results in
Table 6, it is straightforward to compare classification performances among the three classifiers. CRC greatly outperforms the other two classifiers on the Extended Yale B face database; SVM greatly outperforms the other two classifiers on the AR face database; SVM slightly outperforms NN on the Binary Alphadigits database; NN greatly outperforms the other two classifiers on the PolyU 3D palmprint database. Therefore, no classifier has an absolute advantage over the others.
5.4. The Effect of Reordering Pixels in Images
For illustration of the effect of reordering pixels in images, we focus on the Extended Yale B face database with CRC as the classifier. Similar experiments have been conducted on the original database and the results are shown in
Figure 8c. Therefore, in the current experiment, we emphasize the effect of reordering pixels in images rather than the comparison between different feature extraction algorithms.
Figure 9 shows the average classification accuracies on the Extended Yale B face database and its six reordered variants. For illustration, only the results when the feature number is smaller than 11 are displayed. As an example of the detailed results,
Table 7 shows the accuracies when only the first two features are used to perform classification.
The accuracies of PCA are very close among the variants; this is due to the fact that PCA does not incorporate 2D image structure during the feature extraction procedure. For the other four algorithms, the results on variants 0–4 are very close to each other while the results on variants 5–6 tend to be quite different; this is because variants 0–4 preserve the original image structure but variants 5–6 only have random image structures. Therefore, reordering pixels in images can affect the classification performances of the 2D algorithms. In other words, the image structure information is incorporated in the feature extraction procedure of the 2D algorithms.
5.5. The Effect of Reshaping Images
Figure 10 shows the average classification accuracies with different image heights and different thresholds
on the Extended Yale B face database and its reordered and reshaped variants. Specifically, the three columns show the results corresponding to the three series of modified databases, i.e., variants 0–2 in order, and the four rows show the results corresponding to the four thresholds in order. The classifier is chosen to be CRC for illustration. By averaging the results in
Figure 10 across different image heights, we obtain
Table 8.
The experiments corresponding to the three columns in
Figure 10 differ in the way of reordering pixels in images. It again demonstrates that reordering pixels in images will affect the classification performances of the four 2D algorithms. The results on variants 1–2 (column 2–3) are much better than the results on variant 0 (column 1). The reason might be that the features extracted from the original images contain more redundant information than the features extracted from the randomly reordered and reshaped images. In other words, by randomly reordering the pixels in images and reshaping the image size, we can extract more valuable information that can improve the classification performance.
In the first column of
Figure 10, the accuracy of 2DPCA generally increases with image height and the accuracy of A2DPCA generally decreases with image height. The reason is that 2DPCA projects the rows of images onto its projection matrix while A2DPCA projects the columns of images onto its projection matrix. As a result, the number of features extracted by 2DPCA increases with image height and the number of features extracted by A2DPCA decreases with image height. More features generally indicate higher classification accuracies, especially when the percentage of total variance explained by these features is small. Therefore, the accuracy of 2DPCA generally increases with image height and the accuracy of A2DPCA generally decreases with image height in the first column of
Figure 10. This is not the case in the last two columns since the reordering and reshaping effect dominates these results.
The accuracies of DB2DPCA are rather stable with different image heights in all cases in
Figure 10; this is because that DB2DPCA can extract features from both laterals of images. In this way, it inherits the advantages of 2DPCA and A2DPCA, and can achieve high classification accuracies with different image heights. From
Table 8, DB2DPCA greatly outperforms competing algorithms except A2DPCA on all of the three variants. To be specific, DB2DPCA is significantly better than A2DPCA on variant 0 and slightly worse than A2DPCA on variants 1–2. The reason why DB2DPCA is slightly worse than A2DPCA on variants 1–2 might be that the features extracted from the randomly reordered and reshaped images by A2DPCA are sufficient for image classification, and extracting more features by DB2DPCA introduces redundant information that deteriorates the classification performances. Generally speaking, DB2DPCA achieves the best classification performances among the five competing algorithms on the reordered and reshaped images.
The experiments corresponding to the four rows in
Figure 10 differ in the preset
value. Generally speaking, the classification accuracies increase with increasing
value; this is due to the fact that the number of extracted features increases when the percentage of total variance explained by these features—i.e., the
value—increases. Having more features leads to better classification performance, especially when the percentage of total variance explained by these features is not large enough, e.g., smaller than 0.95. Therefore, the classification accuracies increase with increasing
value.
Figure 10 exhibits the classification performances of the four 2D algorithms only when
. Based on symmetries of these algorithms, their classification performances when
can be directly inferred. Let
c be an arbitrary divisor of
d; then, 2DPCA with
approximates to A2DPCA with
,
with
approximates to
with
, and DB2DPCA with
approximates to DB2DPCA with
. Consequently, we can further conclude that DB2PCA can achieve the best classification performances among the five competing algorithms when the image height
p is in the full range of
.


