Abstract
Making all types of public and private transport services available to users through a single and integrated digital platform is the new urban mobility paradigm called Mobility as a Service (MaaS). This scheme allows both a more sustainable urban transportation system and a more efficient transport service for users. For MaaS to be successful, its implementation should adapt to the specific features of the location covered by the service. The city maturity level has to be considered in terms of multimodality, infrastructures, regulations, user goals, and user willingness to use and pay for MaaS services. This paper discusses and analyses the results of a survey on MaaS conducted in three Italian metropolitan areas: Turin, Rome, and Genoa, which have very different and specific characteristics. The comparative analysis enables the definition of drivers, obstacles, and requisites for MaaS implementation to be successful. When it comes to cities with conservative mobility policies or cities that are new to MaaS experiences, resistance to adoption of the service might occur. The results of the research discussed in this paper can be a useful resource to enable decision makers to develop more effective and efficient transportation policies.
1. Introduction
Many European cities developed at the beginning of 1900s in a self-centered way, with limited livable spaces for the citizens and roads often congested. Massive use of private vehicles, insufficient infrastructural capacity, and reduction of green areas are the main consequences of this urban structure in recent years as far as mobility issues are concerned. This context made a radical change in transport schemes increasingly urgent, so that innovative paradigms such as Mobility as a Service are now becoming pivotal.
The term MaaS was first introduced during the 10th European Congress on Intelligent Transport in 2014, as “a system in which a complete range of mobility services is provided to customers by transport operators”, referring to a new business model for the supply of transport services that represents a real alternative for users to the use of personal cars.
It can be useful to recall that MaaS systems provide users, through a single application on their smartphone, with a service available to plan trips and to choose the most suitable means of transport for each journey, paying for trips individually (pay-per-ride) or through the use of monthly passes or flat rates for several different means of transport.
Cooperation and collaboration between public transport service providers (such as buses, trams, and trains) and private individuals (car sharing, bike sharing, etc.) are indeed necessary to fully develop MaaS potential, in order to supply users with bespoke solutions based on their real travel needs. All mobility providers need to integrate on infrastructural, service, and digital levels to offer a mature MaaS service. Sharing a single platform and offering an intermodal and coherent mobility supply enabling users to plan and pay for their trip using a single account is the way to fully achieve the goals of MaaS. The impacts of such a system on mobility patterns and habits as well as administration organizational aspects [1], have been recently discussed and assessed by many scholars, providing the first dataset about early-stage initiatives [2]. That is what the authors of [3] did in Zurich, where they showed how transportation efficiency increased when shared modes were used as a substitute for public transport in lower-density areas, whereas the effect of ride-hailing appeared less positive. The authors concluded, through an all-modal-choices microsimulation, that a MaaS scheme with the coordinated proposal of shared mobility may allow for slightly enhanced system efficiency, substantially reducing energy consumption.
Moreover, some studies have tried to focus on specific issues giving rise to specific analyses. Motivation behind travelers’ adoption of MaaS is the focus of [4]: qualitative interviews’ results highlighted connections with psychological and behavioral issues arise, like autonomy and being related to peer groups, thus reaching final reflections on the importance of psychology in transportation, similar to [5]. Downscaling and declining models and best practices within the territorial context have their own value, as well: indeed, local context features in terms of modal split, facilities, and environmental mindset must be the pivotal core to design tailored MaaS solutions which guarantee proactive involvement of cities [6]. As far as future implementation of Maas and consequent barriers and reactions are concerned, recent studies [7,8,9,10] should be taken into account. Some analyses focused on the assessment of the willingness-to-pay related to MaaS and the level of preparedness of potential developers of the system, in order to reach a commercially viable uptake level [11,12]. All these studies evolve around the concept of the level of maturity a city is required to have to successfully operate MaaS. Maturity hinges on five dimensions, i.e., (i) transport operators’ openness and data sharing; (ii) policy, regulation, and legislation; (iii) citizens’ familiarity and willingness; (iv) ICT infrastructure; and (v) transport services and infrastructure [13]. It is clear that the citizens’ dimension is the most challenging to study.
Accordingly, in this paper the authors tackle this dimension by addressing the levels of awareness among the citizens from three metropolitan areas in Italy, specifically Turin, Rome and Genoa, which are going to develop their MaaS ecosystems in the near future, through the analysis of the results of a social media survey.
This study was prompted by the general research question to outline the awareness for MaaS applications as the extent to which citizens are familiar with the specificities of this travel option (not much differently from the way consumers are familiar with the qualities of a given brand of goods). Coherently with that, the specific research goals are to determine the willingness to become MaaS customers and to pay for the supplied options among the three cities’ inhabitants, according to the respondents’ own ideal MaaS bundle, as further explained. These contribute to introduce one more research goal, i.e., to determine the social acceptability of MaaS in these three Italian metropolitan areas, in light of the launch of MaaS as planned within the recently issued National Recovery Plan. The Plan will soon fund the development of MaaS ecosystems in major metropolitan areas, as explained in Section 3, thus already complying with the second dimension of the MaaS maturity.
Once acknowledged the underpinning awareness, understanding the local social acceptability of MaaS is extremely important, with neither the flexibility of the local mobility environments to include MaaS (which is in all three cities based on multimodal supplies, including paratransit and micro-mobility, thus naturally open to innovation and compliant with dimensions (i) and (v)), nor the technological quality (all cities relying on advanced IT technologies in the mobility management, thus suitable to meet the requirements of dimensions (i) and (iv)) being in dispute.
The final goal is to advance knowledge farther afield. The comparison of perception of MaaS in three large metropolitan areas in Southern Europe can contribute to expand the set of case studies beyond northern countries and qualify the presented results as a reference case for other cities in the same region.
The article, following this brief introduction, is structured into the following sections: the methodology description, the presentation of the case studies, and the discussion of results, with some final remarks and future perspectives of the research. The main aim of this paper is to help fill the research gap concerning the development level of MaaS initiatives in cities, since the MaaS system is still a quite recent topic and in need of further development.
2. A Methodology for Three Cities
To frame the present work, the methodology originally applied to the Rome case [14] was adopted, given the novelty of MaaS experiences in the investigated contexts (Rome, Genoa, and Turin). First, a preliminary desk analysis was carried out to highlight practices, barriers, and drivers to launch MaaS initiatives in Europe; then a survey to profile potential users and identify their travel behaviors, requirements, and willingness to pay was later launched. Past similar successful experiences in European Commission-funded projects [15] led the questionnaire design process, aiming at creating a user-friendly and easy-to-fill-in online tool, further detailed below. Rome was chosen as pilot case to test the questionnaire due to its particularly conservative transport policy. The survey was submitted in the last quarter of 2020 and closed at the beginning of 2021 (city-specific results have been already discussed elsewhere [14]). The number of respondents was beyond expectations and similar surveys were later repeated in Turin and Genoa. Finally, data from the three cases were benchmarked, and results are presented in the following sections. The main characteristics of the survey respondents are summarized in Table 1.

Table 1.
The main characteristics of the survey respondents divided by city.
A 40-question survey was provided via social media, designed to be completed in no more than 15 min. Data collection lasted until it was possible to reach an average of 150 full sets of responses for each city, although the number of respondents was markedly different among the three contexts (a total of 748 individuals, out of which 165 were in Turin, 208 in Genoa, and 375 in Rome).
The questionnaire was structured into two parts: the first section aimed at investigating travel behaviors and habits of the respondents, while the second one focused on the evaluation of their interest in mobility bundles and understanding their preferences towards them; respondents also had the opportunity to “design” their own personal bundle (the “ideal MaaS bundle”), thus defining which services to include to meet their needs and proposing a price, among a range of multiple options. In the first part it was also possible to glean information on respondents’ car ownership and typical modal share patterns, travel frequency, purpose and duration, multimodal options, and average expenditures for transit. In the second part, the “ideal MaaS bundle” was to be created from the following options: bus, metro, rail, parking, car, bike or moped sharing, and ride-hailing. The related willingness to pay ranged from “less than 30 Euros (30 USD)” per month to “more than 50 Euros (50 USD)” per month, also including the pay-as-you-go option. To make the bundle more attractive, respondents were also asked to express their interest in bonuses like cashback, free tickets to entertainment, free home deliveries, or special discounts for recharging electric vehicles.
3. Case Studies
Three Italian metropolitan areas (Turin, Rome, and Genoa) were chosen for this study on MaaS potential, coherently with the original concept of MaaS as an ecosystem for urban areas [16], although studies on less dense and rural areas are available [17,18]. The selection criterion of the three metropolitan areas relied on their being different enough to cover the major mobility options and behaviors, to be representative of the national situation. The three cities have a similar demographic structure (Figure 1), and a Gross Domestic Product (GDP) trend classified as “low” for the 2000–2018 period [19], although compared to other Italian cities they can be considered wealthier areas. The main sociodemographic features of the three case studies are reported in Table 2. The three cities show a common background typical of Italian large metropolitan areas, i.e., high density and aging population counterbalanced by a high rate of young population (15–25-year-old), the latter associated with the local immigration phenomena as the higher foreigner populations than the average urban areas’ evidence. The cities also show lower unemployment rate and above all a massive use of transit to daily commute. This and the specificities of each city, reported in the next sections, make them suitable test areas to launch MaaS. All cities have long enforced Sustainable Mobility Plans, thus providing an appropriate regulatory background to MaaS applications.
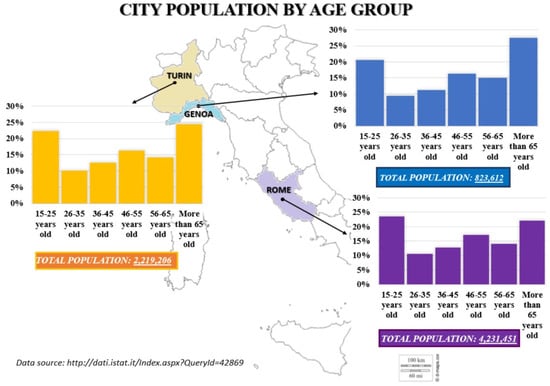
Figure 1.
Turin, Rome, and Genoa populations by age group in 2021 [19].
Table 2.
The socio-demographic background and facts (average 2018–2022) [20,21,22,23].
This also explains why Rome, Turin, and Genoa have recently gained attention thanks to their ranking—respectively third, fourth, and eighth—in the National Recovery Plan funding program to launch MaaS initiatives in Italy. More specifically, Rome will become a leading city in the national test lab for MaaS (which includes the development of a specific digital platform), while Turin and Genoa will be followers.
3.1. The City of Turin
Turin, the fourth largest Italian town by population, counts about 850,053 inhabitants, and is the heart of a metropolitan area of 2,219,206 inhabitants [20], 68.34% of which are over 35 years of age [19]. According to 2019 data, Turin is the Northern Italian city with the highest number of cars in relation to its population (600 cars for every 1000 inhabitants, against the Northern Italy average of 507 in 2020) [20]. From 2010 to 2019, the city counted a growth in registered cars from 544,000 to 554,000 [21].
The subway and urban railway mobility system is developed for 29 km globally, divided into 8 lines served by 28 stations. As regards public transport, in 2006 the first section of Line 1 of the first automatic metro in Italy was opened, with 20.1 million passengers transported within the first month of operations.
The metropolitan area of Turin provides a wide range of paratransit options: bike-sharing, car-sharing, scooter-sharing, motorcycle-sharing, and ride-hailing. In 2019 Turin was one of the largest free-floating car-sharing rentals implementers [22,23]. Furthermore, its flat morphology facilitates the use of non-motorized modes such as bicycles. As a result, the city has 207 km of cycle paths and cycle–pedestrian paths along with the above mentioned several bike sharing services and rental points. Turin is a pioneer in Mobility as a Service. A local government-owned company has been working on the so-called BIPforMaaS project for some years, developing the first regional MaaS project in Italy with public governance, considered essential to implement an effective MaaS ecosystem. The characteristics outlined emphasize a good level of maturity of the city regarding mobility and, thus, the implementation of Mobility as a Service.
3.2. The City of Rome
The Rome metropolitan area counts a global population of over 4.2 million inhabitants [19] with almost 3,000,000 living within the urban area. Rome provides a very mixed land use to accommodate the different administrative, commercial, and tourist activities, the latter mostly located in the city center (a district of just 100,000 inhabitants). The hilly morphology and form laid out more than 2700 years ago still affect local mobility patterns. These features result in congestion phenomena across the whole urban area, due to commuting and non-systematic trips occurring not only from/to the city center, but also inter-districts, as evidenced by the modal split where cars are highly used (50% in peak time), according to the following modal share: 60% private cars, 20% transit, 18% walking, and 2% bike [24]. This is consistent with the high local motorization rate: 0.91 in 2019 (amount of vehicles/number of inhabitants, excluding infant and senior populations, including Powered Two-Wheelers (PTWs)), which becomes 0.63 considering the total population and only passenger cars [24]. In addition, the local public transport provider manages both the 2286-km bus network (with a coverage index of 1.78 km/km2) and the 60-km underground metro (18 km out of which are automated and driverless) resulting in a more modest production than that forecasted (161.1 × 10⁶ veh/km vs. a planned one of 185 × 106 veh/km in 2019, according to [25]). Transit management problems and low customer satisfaction (with a positive assessment of just around 40% for the 2017–2019 period, from [26]), possibly the result of conservative local transport policies, are long-standing problems for the city. Paratransit and micro-mobility can be considered additional options to mitigate the use of passenger cars, but among the different experimental services launched at the beginning of the 2000s, only car-sharing is the most consolidated one. However, boosted by the recent pandemic, other bikes and PTW-sharing and micro-mobility services were launched too, giving rise to a series of problems: a plethora of operators, poor space management, and poor road safety [27,28]. The increased multimodal supply might support the introduction of MaaS in Rome, along with the local Sustainable Urban Mobility Plan vision, which enforces the implementation of a digital platform, managed by the Municipality, designed to integrate operations [29]. Furthermore, the extensive availability of mobility apps which meet the requirements of low levels of integration of MaaS must be considered, according to the classification provided in [30].
3.3. The City of Genoa
Genoa is a densely populated area characterized by a complex territory: roads often climb towards the hills and the lack of space does not allow ample room for maneuvering. These factors significantly affect the way people move around the city. Data related to the Municipality of Genoa show a local public transport share of 32%, a rather high percentage for the Italian scenario. In addition, the share of non-motorized internal movements, i.e., on foot or by bike, is 22%, an extremely high score for a city that is not exactly flat, third only after Turin (32%) and Bologna (28.2%), cases where this is generated mostly by bicycles rather than pedestrians. However, a key feature for Genoa is the local motorization rate of 0.49 ([vehicles/inhabitants] × 1000) [31], the lowest compared to other metropolitan cities, and especially Rome.
In Genoa, the population is aging and contracting significantly. The ratio between the population aged over 64 and those under 15 is higher (2.4) than the weighted average of the 14 Italian Metropolitan Cities (equal to 1.5) [32].
Looking at favorable preconditions for MaaS implementation in the city, some features from the local context must be highlighted: recent Sustainable Urban Mobility Plan updates focus on local administration and mobility providers’ intention to support MaaS pilot initiatives, with some pilot actions currently ongoing.
4. Results and Discussion: Potential and Limits
The questionnaire responses reveal some relevant features in terms of travel behaviors, often in common for Turin and Genoa, and partly shared by Rome, but all very useful to assess the feasibility of local MaaS ecosystems.
4.1. MaaS Potential User Profile
In the three cities, the majority of the respondents own conventional vehicles (i.e., no hybrid or fully electric) older than five years (Figure 2). These data could be read as an economic issue related to the cost of purchasing a new hybrid or electric car; in fact, Figure 3 highlights that respondents would consider buying a hybrid/electric vehicle. However, the three cities share an evident reluctance in giving up private vehicles; 74% of the respondents in Genoa, almost 85% in Turin, and 75% in Rome are against giving up their car (Figure 2), although several reasons for not owning a car emerged among respondents (Figure 2). The limited use of private vehicles in Genoa (52.2%) and Turin (48.7%) suggests a good level of attractiveness of the local transit supplies or walking and/or bike-riding to cover longer legs of the trips; in Rome, the percentage is significantly lower (30%). Another important factor among respondents’ reasons for not owning a private vehicle is the high costs this entails (17.4% in Genoa, 30% in Turin, and 42.2% in Rome); environmental concerns, however, are not a major reason (13% in Genoa, 0% in Turin, and 8.8% in Rome), thus stressing an overall poor environmental-consciousness when it comes to car ownership.
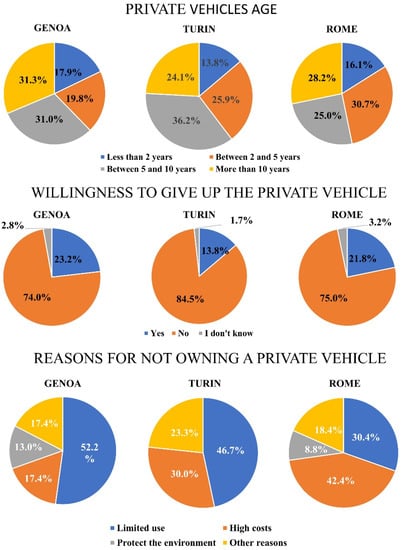
Figure 2.
Private vehicle age, willingness to give up the private vehicle, and reasons for not owning a private vehicle.
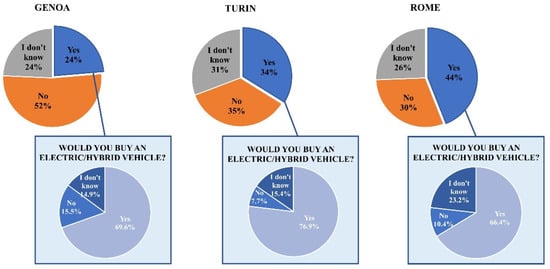
Figure 3.
Intention of purchasing a new vehicle.
However, when asked about the purchase a new vehicle (Figure 3) in the near future, 52% of respondents in Genoa did not plan to do that.
Since MaaS is often associated with environmental-consciousness and sustainability, due to an expected consequence in the change of travel behaviors in favor of MaaS-managed shared or collective modes [33,34], the respondents’ environmental awareness was also analyzed (Figure 4). In contrast with the low consideration of environmental aspects related to private car ownership among the reasons for not owning a private vehicle, the environmental concern is clear in all the cities (64.2% Genoa, 60.2% Rome, and 52.8% Turin), evidenced by the willingness to buy an electric or hybrid vehicle (Figure 3) if needed (69.6% in Genoa, 76.9% in Turin, and 66.4% in Rome).
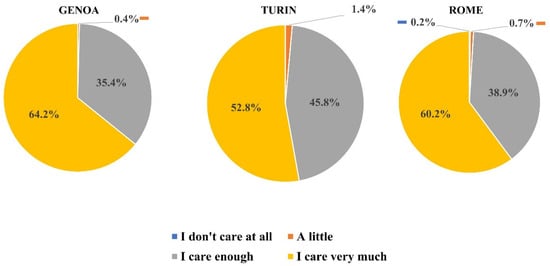
Figure 4.
Environmental care.
It was important to assess the respondents’ familiarity with sharing options (Figure 5), where three different situations arise. In Turin, where the sharing option has been available for a few years, 58.5% of the respondents stated to having already exploited such services, whereas in Genoa 73.6% of the respondents have never used a sharing service (thus underlining this type of service is neither very present nor used). In Rome, where car sharing is in place since the first decade of the 2000s and bike and PTW services followed in the years after, the percentage of sharing service customization or familiarity was expected to be high. However, 49.7% of the respondents stated having already used sharing options vs. 50.3% who did not, which evidences how this type of service is still perceived as a niche option.
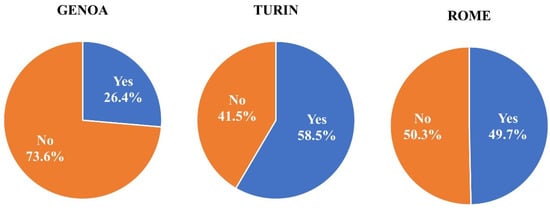
Figure 5.
Sharing mobility experiences.
When considering the effect of COVID-19 on mobility (Figure 6), the pandemic does not seem to have changed the travel habits of the majority of respondents in Turin and Genoa, whereas only 41.4% stated the same in Rome.
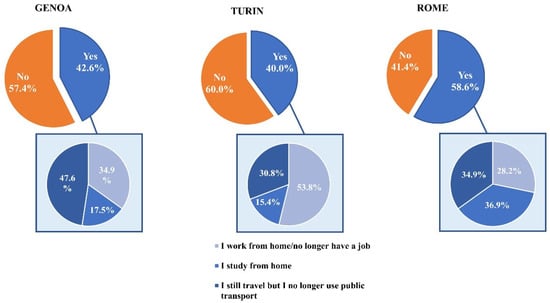
Figure 6.
COVID-19 influence on changing travel behaviors.
The resulting snapshot, according to the respondents, is clear: private cars are still central in everyday mobility patterns and considered an asset hard to divest from, although the environmental concern is genuine and the appreciation towards non-conventional propulsion systems (either electric or hybrid) sufficiently good. At the same time, sharing (a pillar of the MaaS ecosystem) seems to be the weak link.
4.2. Ideally Bundling MaaS
In order to further explore mobility preferences, respondents positively answering to the question “Would you be interested in using a subscription service that includes multiple modes of transportation?”, were then asked to create their own “ideal” bundle of services. Based on these responses, the following analyses were conducted (as shown in Figure 7 and Figure 8, where positive answers in percentage are reported according to age and income groups, respectively). In general, most respondents would be interested in a multi-modal bundle (65.5% in Genoa and 61.5% in Turin). In Rome, preferences were consistent with the expected effect of the local conservative approach that has been in place for many years; respondents would create packages with what they already have for a long time, i.e., transit (both rail and rubber-tired, surface and underground), parking, and car sharing, whereas more recent micro-mobility and ride-hailing appear to be less required. Likewise, Genoa respondents, regardless of the age group or income considered, stated recurring preferences for a subscription package including public transport (bus, metro, and urban and regional railway), while ride-hailing (including taxis and car rental with drivers, also known by the acronym of “NCC” in Italy) was again less requested, probably because in Italy it is considered a very expensive service, especially among the youngsters. Only 17.24% of respondents under 35 would include NCC in their subscription package and only 10.34% would include taxi in their bundle. Referring to the aggregate value of the ride-hailing service, only 27.58% of the “15 to 35 years old” category includes the service (37.8% in the case of the “More than 35 years old” category). In line with this, the analysis of preferences per age group (more than 35 years old, and between 15 and 35 years old) shows a kind of “age division” for some modal options (Figure 7).
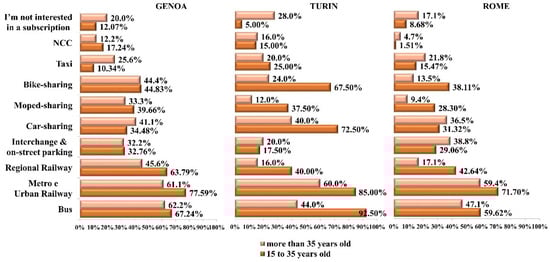
Figure 7.
Turin, Rome, and Genoa stated preferences by age group in the bundle creation.
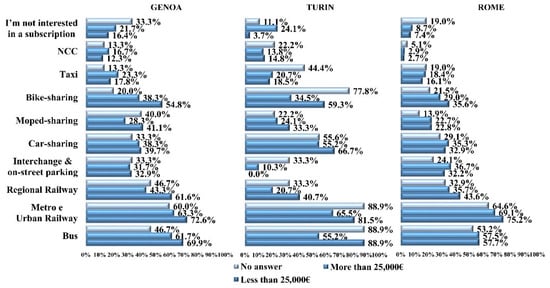
Figure 8.
Turin, Rome, and Genoa stated preferences by income group in the bundle creation.
Certainly, greater favor towards transit among young people can be associated with reasons such as affordability, lack of driving license for teenagers, and preferences towards bike sharing explained with physical status. However, this assessment is challenged by the observation of the Genoa case, where bike sharing is equally favored by the two age groups, thus debunking the myth that riders must necessarily be young. Moreover, options in Genoa seem more evenly distributed among the two age groups. In Turin, in addition to bus, metro, and railway, the 15–35 age group largely favor car-sharing (72.5%) and bike-sharing (67.5%) as the most popular services for potential MaaS bundles. Also in this case, taxi, NCC, and interchange/on street parking are of little interest to respondents, even in the highest income groups. However, income in general does seem to steer the bundle creations especially in Turin, whereas Genoa and Rome seem rather less affected (Figure 8). For the Rome case, one possible explanation could be the low costs of transit fees.
In terms of willingness to pay (i.e., how much a given respondent would be willing to pay for a monthly subscription for the bundle he or she created), the majority of respondents considered a reasonable cost for the ideal bundles “between 31–50 Euros (31–50 USD)” per month, and “less than 30 Euros (30 USD)” per month as a second option. The result does not change substantially when considering the two age groups separately (Figure 9).
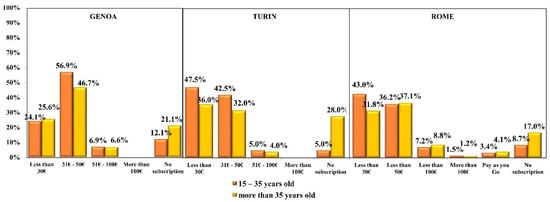
Figure 9.
Willingness to pay by age group.
Looking at income groups (Figure 10), a large number of respondents in Genoa and Turin consider the EUR 31–50 per month (USD 31–50) price range appropriate for the proposed bundles. However, in Turin the majority consider a price range of less than EUR 30 (USD 30) per month to be more appropriate. Unexpectedly, in the case of Turin, those with incomes above EUR 25,000 (USD 25,500) also consider the lower price range more adequate (58.62%). At the same time, it should be noted that residents in Genoa and Turin are not willing to pay more than EUR 100 (USD 100) per month (a reference value for many existing MaaS case studies in Europe), while this value is deemed appropriate for a small percentage in Rome. It is worth noticing, on this issue, that the subscription cost varies depending on the range of options a given MaaS might include; therefore, in literature, different sets of rates are currently reported: for example, a study from the Netherlands states that 57% of respondents are willing to pay up to EUR 200 [35]); an International Transport Forum simulation to assess the supranational impact of the attractiveness of MaaS subscriptions moves from a range between USD 40 and 160 [36]; and a monthly subscription valid for the Helsinki area costs EUR 99, although more expensive bundles might reach EUR 499 [37]. Higher costs are reported in literature [11,38] but are consistent with the local costs of living.
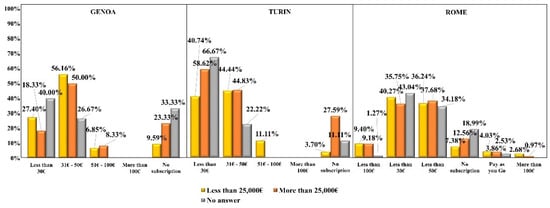
Figure 10.
Willingness to pay by income group.
Some respondents indicated a substantial lack of interest in MaaS, mostly due to the supposed little convenience of the service and the uncertainty of being able to use it.
5. Conclusions
Worldwide attention and policies seem currently directed towards MaaS progressive implementation, as a system considered most promising disruptive innovation for urban mobility.
Nevertheless, in terms of acceptance of the service, uncertainty dominates, in particular in the unclear perception of the advantages and in the insecurity, as the authors of [8] underline. Uncertainty is related to an exclusive use of private car as a status symbol and to the wavy and evolving sensibility of users towards it, but this is not the only concern. Basically, the percentage resulting from the interviews showed perplexing responses that referred to a general moment of transition, in terms of vehicle fuels, awareness of travel expenses, and information about new technologies. In these terms, war in Ukraine and fuel supply issues could represent a key variable influencing results had the survey been conducted in 2022. The Ukraine crisis made fuel pricing and supply criticalities evident and dramatically real even to non-expert citizens. Consequently, the need to shift to collective, shared, and sustainable mobility options could be felt more urgent than before, even among those who felt not particularly committed to environmentally-based travel options.
The results obtained here for the cities of Turin, Genoa, and Rome are fairly representative of the Italian situation, corroborated by the conclusions of other studies focusing on other Italian metropolitan areas [39,40,41].
First results in terms of MaaS implementation pre-conditions and users’ attitude show lights and shadows for all the investigated contexts. Evidently, there is a lack of experimentations of novel uses (sharing, hybrid vehicles) by those interviewed, which influenced the propensity to change. Generally speaking, old ways of scheduling daily habits are considered more efficient and affordable, as they are consolidated and tested by personal experience.
Nevertheless, a shared environmental concern and the openness of young people to similar actions, are shown to be encouraging elements to foster MaaS initiatives implementation.
These considerations prove to be particularly interesting, being the three contexts deeply different in terms of demography, territorial, and socio-economic features, thus allowing a certain degree of generalization and extension to the Northern-Central Italy area.
The questionnaire results pointed out that willingness to pay is a sensitive issue, and the modest rates are justified by the novelty of MaaS and respondents’ poor recognition of its potential, although rates in Turin and Genoa are commensurate with those in other European cities.
Effective information and awareness campaigns could contribute to improve the level of maturity of MaaS initiatives, especially when it comes to support users’ propensity towards them and to overcome initial barriers and suspicion towards innovative mobility schemes [4,42,43]. This is part of the “integration of information”, a requirement to foster MaaS societal goals, as recommended by [30]. Moreover, information and awareness become much required if the goal is to have MaaS reach vulnerable social groups [44]. As some scholars highlight [45], MaaS initiatives in their turn may contribute to a modal-shift, making sustainable mobility alternatives easier to be identified and chosen. MaaS high potential to effectively convey information on multi-modal urban choices and to support seamless integration could finally help fostering more environmentally-aware attitudes.
To reply to the research questions, from the conclusions reported above, it is clear that no specific economic, geographical, or infrastructural conditions affect the local MaaS implementation; on the contrary, when it comes to maturity, in cities like Turin, Rome, and Genoa the “weak” dimension is that of citizens’ familiarity and willingness. The observation that in the three cities there is a general interest for multi-modal bundles indicates that citizens want to modify their travel behaviors in favor of alternatives like paratransit and rails, thus stressing their awareness of adopting more sustainable travel options, which positively responds to the research question of the social acceptability of MaaS.
In turn, concerning the awareness for MaaS applications, i.e., the research question about the extent to which citizens in the three cities are familiar with the specificities of MaaS as a commodity or a commercial service, some contrasting elements are evident. The little willingness to pay (in general less than EUR 50, with a hard core of respondents stating EUR 30 or less, for a monthly subscription, which replicates the costs of the local transit passes in place) evidenced that the conventional public transport fees are still the only reference to assess the maximum price for a transit service. The first interpretation of that is simple: the respondents are still traditional “transit” passengers and not yet MaaS customers. In other words, moving in the city is a basic service, no matter how many multi-modal or innovative options are supplied, and its cost must be aligned with those typical of the public services.
The discrepancy between the acceptance of MaaS as a travel supply and the poor acknowledgement of its status of commercial service, different from conventional transit services, shifts the focus to the policy level as the arena for improving familiarity and willingness among the maturity dimensions. Willingness to adopt and pay for a given commercial service is not static and evolves according to how much it might fit in the market. However, if there is no real market and just the contraposition between public transport services at low costs (which are subsidized) and MaaS as an innovation or niche travel option, the willingness to pay is not going to change. This means that more facts are needed to shape people perceptions of MaaS, especially in terms of major environmentally-friendliness of some options in the bundles and unsustainability of some forms of subsidies for public transport (cheap parking fees, typically). This will help to re-align the value of MaaS within the communities. Transport and mobility policies must move from this and create conditions to have each “piece” of the local mobility options (conventional or innovative like MaaS) hosted within a unique supply framework and create balanced conditions between willingness to accept and willingness to pay.
Author Contributions
The authors confirm contribution to the paper as follows: study conception and design: M.V.C.; data collection: C.C., M.V.C. and I.D.; analysis and interpretation of results: C.C., M.V.C., I.D., V.C. and E.O.; draft manuscript preparation: C.C., M.V.C., I.D., V.C. and E.O. All authors have read and agreed to the published version of the manuscript.
Funding
This research received no external funding.
Institutional Review Board Statement
Not applicable.
Informed Consent Statement
Not applicable.
Data Availability Statement
Data are available upon request to the authors.
Conflicts of Interest
The authors declare no conflict of interest.
References
- Arias-Molinares, D.; García-Palomares, J.C. The Ws of MaaS: Understanding mobility as a service from a literature review. IATSS Res. 2020, 44, 253–263. [Google Scholar] [CrossRef]
- Esztergár-Kiss, D.; Kerényi, T.; Mátrai, T.; Aba, A. Exploring the MaaS market with systematic analysis. Eur. Transp. Res. Rev. 2020, 12, 1–16. [Google Scholar] [CrossRef]
- Becker, H.; Balac, M.; Ciari, F.; Axhausen, K.W. Assessing the welfare impacts of Shared Mobility and Mobility as a Service (MaaS). Transp. Res. Part A Policy Pract. 2020, 131, 228–243. [Google Scholar] [CrossRef]
- Schikofsky, J.; Dannewald, T.; Kowald, M. Exploring motivational mechanisms behind the intention to adopt mobility as a service (MaaS): Insights from Germany. Transp. Res. Part A Policy Pract. 2020, 131, 296–312. [Google Scholar] [CrossRef]
- Tomaino, G.; Teow, J.; Carmon, Z.; Lee, L.; Ben-Akiva, M.; Chen, C.; Leong, W.Y.; Li, S.; Yang, N.; Zhao, J. Mobility as a service (MaaS): The importance of transportation psychology. Mark. Lett. 2020, 31, 419–428. [Google Scholar] [CrossRef]
- Esztergár-Kiss, D.; Kerényi, T. Creation of mobility packages based on the MaaS concept. Travel Behav. Soc. 2020, 21, 307–317. [Google Scholar] [CrossRef]
- Hensher, D.A.; Mulley, C.; Nelson, J.D. Mobility as a service (MaaS)—Going somewhere or nowhere? Transp. Policy 2021, 111, 153–156. [Google Scholar] [CrossRef]
- Jittrapirom, P.; Marchau, V.; van der Heijden, R.; Meurs, H. Future implementation of mobility as a service (MaaS): Results of an international Delphi study. Travel Behav. Soc. 2020, 21, 281–294. [Google Scholar] [CrossRef]
- Cottrill, C.D. MaaS surveillance: Privacy considerations in mobility as a service. Transp. Res. Part A Policy Pract. 2020, 131, 50–57. [Google Scholar] [CrossRef]
- Alonso-González, M.J.; Hoogendoorn-Lanser, S.; van Oort, N.; Cats, O.; Hoogendoorn, S. Drivers and barriers in adopting Mobility as a Service (MaaS)—A latent class cluster analysis of attitudes. Transp. Res. Part A Policy Pract. 2020, 132, 378–401. [Google Scholar] [CrossRef]
- Ho, C.Q.; Hensher, D.A.; Mulley, C.; Wong, Y.Z. Potential uptake and willingness-to-pay for Mobility as a Service (MaaS): A stated choice study. Transp. Res. Part A Policy Pract. 2018, 117, 302–318. [Google Scholar] [CrossRef]
- Li, Y.; Voege, T. Mobility as a Service (MaaS): Challenges of Implementation and Policy Required. J. Transp. Technol. 2017, 07, 95–106. [Google Scholar] [CrossRef]
- Kamargianni, M.; Goulding, R. The Mobility as a Service Maturity Index: Preparing the Cities for the Mobility as a Service Era. In Proceedings of the 7th Transport Research Arena TRA 2018, Vienna, Austria, 16–19 April 2018; Zenodo: Vienna, Austria, 2018. [Google Scholar]
- Corazza, M.V.; Carassiti, G. Investigating Maturity Requirements to Operate Mobility as a Service: The Rome Case. Sustainability 2021, 13, 8367. [Google Scholar] [CrossRef]
- Bousse, Y.; Corazza, M.V.; Arriaga, D.S.; Sessing, G. Electrification of public transport in Europe: Vision and practice from the ELIPTIC project. In Proceedings of the 2018 IEEE International Conference on Environment and Electrical Engineering and 2018 IEEE Industrial and Commercial Power Systems Europe (EEEIC/I&CPS Europe), Palermo, Italy, 12–15 June 2018; pp. 1–6. [Google Scholar]
- Heikkilä, S. Reorganization of the Mobility Service provision—Public governance as a contributor. In Proceedings of the 21st World Congress on Intelligent Transport Systems, ITSWC 2014: Reinventing Transportation in Our Connected World, Detroit, MI, USA, 7–11 September 2014; Intelligent Transportation Society of America: Washington, DC, USA, 2014. [Google Scholar]
- Eckhardt, J.; Nykänen, L.; Aapaoja, A.; Niemi, P. MaaS in rural areas-case Finland. Transp. Bus. Manag. 2018, 27, 75–83. [Google Scholar] [CrossRef]
- Barreto, L.A.; Amaral, A.; Baltazar, S. Mobility as a Service (MaaS) in rural regions: An overview. In Proceedings of the 2018 International Conference on Intelligent Systems (IS), Funchal, Portugal, 25–27 September 2018; pp. 856–860. [Google Scholar]
- OECD. Regions and Cities at a Glance—Country Note: Italy. 2020. Available online: https://www.oecd.org/cfe/Italy-Regions-and-Cities-2020.pdf (accessed on 28 March 2022).
- ISTAT Istituto Nazionale di Statistica. Popolazione e Famiglie. 2021. Available online: http://dati-censimentopopolazione.istat.it/Index.aspx (accessed on 4 April 2022).
- Italian Ministry for Infrastructures and Sustainable Mobility, Investimenti, Programmi e Innovazioni per lo Sviluppo della Mobilità Sostenibile nelle Città Metropolitane. 2022. Available online: https://www.mit.gov.it/nfsmitgov/files/media/notizia/2022-10/Doc%20Strat%20Citt%C3%A0%20metropolitane_17_10_22.pdf (accessed on 25 November 2022).
- ANFIA, Associazione Nazionale Filiera Industria Automobilistica. Dati Statistici, Immatricolazioni in Italia. 2020. Available online: https://www.anfia.it/it/dati-statistici/immatricolazioni-italia (accessed on 31 May 2022).
- ISFORT. 17° Rapporto Mobilità. 2020. Available online: https://www.isfort.it/wp-content/uploads/2020/12/RapportoMobilita2020.pdf (accessed on 7 April 2022).
- EPOMM. TEMS—The EPOMM Modal Split Tool. 2015. Available online: http://tems.epomm.eu/ (accessed on 10 June 2022).
- Rome Municipality—Roma Mobilità. Rapporto della Mobilità. 2020. Available online: https://romamobilita.it/sites/default/files/RSM_RapportoMobilit%C3%A0_2020_Web_.pdf (accessed on 5 June 2020).
- ATAC. Carta dei Servizi. 2020. Available online: https://www.atac.roma.it/docs/default-source/pubblicazioni/carta-serviziroma_20209447080e09054edda8f94596f53204d1.pdf?sfvrsn=52a8aab3_12 (accessed on 28 May 2021).
- Corazza, M.V.; Musso, A. Urban transport policies in the time of pandemic, and after: An ARDUOUS research agenda. Transp. Policy 2021, 103, 31–44. [Google Scholar] [CrossRef]
- Corazza, M.V.; Moretti, L.; Forestieri, G.; Galiano, G. Chronicles from the new normal: Urban planning, mobility and land-use management in the face of the COVID-19 crisis. Transp. Res. Interdiscip. Perspect. 2021, 12, 100503. [Google Scholar] [CrossRef]
- Rome Municipality. Piano Urbano della Mobilità Sostenibile. 2018. Available online: https://www.pumsroma.it/download/Volume1-allegato-D251-18_2.pdf (accessed on 22 May 2022).
- Sochor, J.; Arby, H.; Karlsson, I.C.M.; Sarasini, S. A topological approach to Mobility as a Service: A proposed tool for understanding requirements and effects, and for aiding the integration of societal goals. Transp. Bus. Manag. 2018, 27, 3–14. [Google Scholar] [CrossRef]
- SISTAN Sistema Statistico Nazionale. Annuario Statistico Comune di Genova. 2019. Available online: https://www.sistan.it/index.php?id=319&no_cache=1&tx_ttnews%5Btt_news%5D=7718 (accessed on 6 May 2022).
- ISPRA. XIII Rapporto sulla Qualità dell’Ambiente Urbano. 2017. Available online: https://www.isprambiente.gov.it/files2017/eventi/rapporto-aree-urbane-2017/XIIIRAU_Presentazione_22gen2018.pdf (accessed on 10 May 2022).
- Hensher, D.; Ho, C.Q.; Reck, D.J. Mobility as a service and private car use: Evidence from the Sydney MaaS trial. Transp. Res. Part A 2021, 145, 17–33. [Google Scholar] [CrossRef]
- Chang, J.; Chen, H.Y.; Chen, H.C. Mobility as a service policy planning, deployments and trials in Taiwan. IATSS Res. 2019, 43, 210–218. [Google Scholar] [CrossRef]
- STATISTA Preferred Price Range for Mobility-as-a-Service (MaaS) Subscriptions in the Netherlands in 2019. Available online: https://www.statista.com/statistics/1177789/netherlands-maas-acceptable-price-for-consumers/ (accessed on 25 November 2022).
- Hörcher, D.; Graham, D. Pricing and Efficient Public Transport Supply in a Mobility as a Service Context. International Transport Forum Discussion Paper. Available online: https://www.itf-oecd.org/pricing-and-efficient-public-transport-supply-mobility-service-context (accessed on 25 November 2022).
- Ramboll. WHIMPACT—Insights from the World’s First Mobility-as-a-Service (MaaS) System. Available online: https://ramboll.com/-/media/files/rfi/publications/Ramboll_whimpact-2019.pdf (accessed on 25 November 2022).
- Caiati, V.; Rasouli, S.; Timmermans, H. Bundling, pricing schemes and extra features preferences for mobility as a service: Sequential portfolio choice experiment. Transp. Res. Part A Policy Pract. 2020, 131, 123–148. [Google Scholar] [CrossRef]
- Vitetta, A.; Rindone, C.; Musolino, G.; Vitale, A. Indagine pilota su scenari Mobility as a Service (MaaS) nello stretto di Messina. Laborest 2022, 24, 50–56. [Google Scholar]
- Signorile, P.; Larosa, V.; Spiru, A. Mobility as a service: A new model for sustainable mobility in tourism. Worldw. Hosp. Tour. Themes 2018, 10, 185–200. [Google Scholar] [CrossRef]
- Baldassa, A.; Ceccato, R.; Orsini, O.; Rossi, R.; Gastaldi, M. MaaS Bundling and Acceptance in the Pandemic Era: Evidence from Padua, Italy. J. Adv. Transp. 2022, 9833689. [Google Scholar] [CrossRef]
- Likelihood of using Mobility-as-a-Service: A case study on innovative mobility services among residents in the Netherlands. Case Stud. Transp. Policy 2019, 7, 790–801. [CrossRef]
- Casady, C.B. Customer-led mobility: A research agenda for Mobility-as-a-Service (MaaS) enablement. Case Stud. Transp. Policy 2020, 8, 1451–1457. [Google Scholar] [CrossRef]
- Dadashzadeh, N.; Woods, L.; Ouelhadj, D.; Thomopoulos, N.; Kamargianni, M.; Antoniou, C. Mobility as a Service Inclusion Index (MaaSINI): Evaluation of inclusivity in MaaS systems and policy recommendations. Transp. Policy 2022, 127, 191–202. [Google Scholar] [CrossRef]
- Matyas, M. Opportunities and barriers to multimodal cities: Lessons learned from in-depth interviews about attitudes towards mobility as a service. Eur. Transp. Res. Rev. 2020, 12, 7. [Google Scholar] [CrossRef]


Publisher’s Note: MDPI stays neutral with regard to jurisdictional claims in published maps and institutional affiliations. |
© 2022 by the authors. Licensee MDPI, Basel, Switzerland. This article is an open access article distributed under the terms and conditions of the Creative Commons Attribution (CC BY) license (https://creativecommons.org/licenses/by/4.0/).