Abstract
In this paper, we investigate our mobility-assisted and adaptive broadcast routing mechanism, called Mobility Tolerant Firework Routing (MTFR), which utilizes the concept of potentials for routing and improves node reachability, especially in situations with high mobility, by including a broadcast mechanism. We perform detailed evaluations by simulations in a mobile environment and demonstrate the advantages of MTFR over conventional potential-based routing. In particular, we show that MTFR produces better reachability in many aspects at the expense of a small additional transmission delay and intermediate traffic overhead, making MTFR a promising routing protocol and feasible for future mobile Internet infrastructures.
1. Introduction
Recently, there has been increased research on future Internet infrastructures in the field of information and communication technology (ICT), and new basic principles of network management are currently being developed. From the viewpoint of the societal requirements toward a prosperous future communication infrastructure, one goal of the future Internet is to pursue and guarantee reliability and efficiency. In addition, ubiquitous mobility and wireless communication is anticipated to play an even more essential role in the future, due to the high flexibility that mobile systems can provide to users. Hence, reliable and efficient mobile systems are especially important for the future Internet. Moreover, the number and type of mobile nodes, as well as the mobile services and applications have been increasing and diversifying. This phenomenon accelerates the increase of complexity in mobile systems at a large scale. Therefore, future mobile systems should have scalability and cost efficiency from the viewpoint of system performance and business operation.
Infrastructure-free systems of mobile ad hoc networks (MANETs) are flexible in unstable network connectivity situations, for example after natural disasters, and can cope with highly dynamic network topology changes caused by node mobility. Compared to wired networks, they can be configured and deployed more rapidly, and since they operate without central nodes in a flat network topology, MANETs have better scalability, due to more dynamic and adaptive routing mechanisms. Potential based routing [1] is one of the promising techniques for routing in an autonomous manner. In analogy with thermodynamics, a temperature potential is used for a loop-free and generalized routing method of shortest path routing. There have been several proposals of potential routing variants, and the autonomous exchange of potential information among nearby nodes is the underlying principle for most of these protocols. Since a certain time is needed until the potential information is propagated within the network, the convergence time for potential updates and assurance of node reachability are important indicators for the performance of these protocols.
Each potential routing scheme has its benefits under certain conditions. However, to the best of our knowledge, none of them can deal well with situations of highly changing topologies caused by the geographic movement of nodes. Therefore, we proposed in [2] a mobility-oriented extension for potential routing, called Mobility Tolerant Firework Routing (MTFR), in order to improve the data transmission reachability among nodes. The potential value of a node is an indicator of its relative distance to the destination, and we include a broadcast-based data replication scheme to improve reachability in combination with a potential threshold to restrict the number of unnecessary broadcasts to the expected vicinity of the destination node. Our method works in an autonomous and self-organizing manner on both cellular systems and infrastructure-free systems, resulting in a higher reachability.
The rest of this paper is organized as follows. In Section 2, we discuss related work. Then, in Section 3, we first explain the basic mechanism of potential-based routing before describing our firework routing mechanism in detail. In Section 4, the performance of our proposal is compared with conventional potential routing for the random walk mobility model, and the results from the theory of random geometric graphs are briefly discussed. Finally, Section 5 concludes this paper.
2. Related Work
Among the first studies on potential-based routing, Basu et al. [1] proposed potential-based routing (PBR) as a traffic-aware routing method. The potential of each node and link is calculated from both distance and traffic volume information with a weighting factor. The authors showed that PBR works well in a slowly varying traffic situation, but did not present any results on adaptation to dynamic traffic conditions. Following their work, several other researchers proposed slight variations of potential-based routing.
Baumann et al. [3] proposed HEAT using anycast routing for wireless mesh networks. HEAT assumes a potential value analogous to thermal conductivity. This conductivity level is exchanged among neighboring nodes and used as an indicator for traffic routing. Similarly, Lenders and Baumann [4] proposed link-diversity routing using the finite difference method routing (FDMR) algorithm, which is also based on an analogy to heat levels, but has a more lightweight potential calculation scheme than HEAT. The nodes exchange their temperatures with their neighbors, and the temperature difference between source and destination node is propagated over the network. Kwon et al. [5] proposed potential management-based proactive routing (PMPR), where nodes update their potential on demand, leading to a reduction in signaling cost. Balasubramaniam et al. [6] proposed parameterized gradient-based routing (PGBR), where the potential gradient is calculated in a stochastic manner using the load of links and nodes. PGBR is considered for Internet Protocol Television (IPTV) services run by different operators on a single Internet Protocol (IP) network infrastructure.
In terms of theoretical analysis, Toumpis and Tassiulas [7] proposed “packetostatics” and analyzed potential routing, especially from the viewpoint of physics. They focused on traffic flows in a densely populated sensor network identical to an electrostatic field. The theoretical analysis of potential functions is discussed with electromagnetic field analysis. In addition, Toumpis [8] also surveyed wireless sensor network management approaches based on an analogy with physics.
Apart from the potential based routing in MANET, Sidera et al. [9,10] proposed Delay Tolerant Firework Routing (DTFR) using an efficient flooding approach in delay tolerant networks (DTN). DTFR is a delay-tolerant version of geographic routing and therefore appears in a different context compared with our MTFR, using reliable paths calculated in a potential-based manner.
As stated above, most of the potential routing methods have their benefits to achieving robustness, but usually, they are assumed and evaluated in slow or non-mobile conditions. We believe that mechanisms that operate well in highly dynamic traffic conditions, while improving data transmission reachability, are also very important for the future Internet infrastructure. As a first step to perform the above mission, we introduced in [2] our initial research on Mobility Tolerant Firework Routing (MTFR), which is evaluated in greater detail in this paper.
In addition, Ad hoc On-Demand Distance Vector (AODVv2) [11] and Optimized Link State Routing (OLSRv2) [12] are also two well-known conventional routing methods in MANET. Although AODVv2 can use efficient flooding, MTFR drastically can reduce flooding packets in comparison to AODVv2. In OLSRv2, routing paths are reactively selected, and therefore, the cost of path calculation is not negligible when nodes move frequently. Hence, we believe that our MTFR has benefits over those two methods.
3. Description of the Firework Routing Protocol
In this section, we discuss our extension of potential routing to improve node connectivity. First, we start with conventional potential routing as an example of link-diversity routing before presenting our Mobility Tolerant Firework Routing to deal with node disconnections.
3.1. Conventional Potential Routing
We now explain conventional potential routing as an example of link-diversity routing [4] for which a typical network model is shown in Figure 1.

Figure 1.
Setting up the temperature in generalized potential-based routing (link-diversity routing). (a) After the initial route to the destination node is found through broadcasting, the temperature is iteratively updated at each node as the average of neighbor temperature values; (b) the potential is constructed, and each node forwards packet to its neighbor with the steepest temperature gradient.
When the source attempts to establish a connection to the destination, it broadcasts a route request to its neighbors, who forward the requests in a flooding manner, until the destination node is found. Each node, , has its own temperature parameter, , at time step t that is iteratively calculated as the average of its neighbors’ temperatures and is exchanged among neighbor nodes (Figure 1(a)).
While this method is very effective for static node scenarios, it faces problems under dynamic conditions. Depending on the network size, many iteration steps may be required until the temperature potential, i.e., the correct route to the destination node, has converged. Thus, each time a potential is calculated, it is only valid for the period of time when the topology does not change. If the destination node leaves the transmission range of its last hop node, the correct route cannot be found, and a new flooding of the entire network is required to update the potential. In our MTFR method, which will be described in the following section, we improve this behavior by including a limited broadcast process in the potential-based routing.
3.2. Mobility Tolerant Firework Routing (MTFR)
3.2.1. Basic Principle
In our method, MTFR [2], potential-based routing and limited broadcast are combined. Packets that the source node sends are started as being transmitted along the steepest temperature gradient path in the beginning and middle and then are broadcast to the neighbors, which are closer to the destination. Hence, the robustness against node mobility is achieved with a small transmission workload. We introduce two additional parameters, firework threshold and firework hop limit, to react faster in situations when the destination node becomes unreachable. We assume that if the destination node moves away from its last position, it will be most likely somewhere near its last location. Since the temperature can be regarded as a relative distance of a node to the destination, the firework threshold is used to limit the broadcast to only those nodes that are in the vicinity of the destination’s previous location. If the temperature of a node lies below the firework threshold, the node only forwards all data packets it receives to the neighboring node with the highest temperature, just like in regular PBR. On the other hand, if the temperature is above the threshold, it broadcasts the packets to all of its neighbors. In order to limit the unnecessary overhead, broadcasts are only replicated up to the firework hop limit.
Figure 2 shows the basic procedure in MTFR when a disconnection of the destination occurs. Let us assume that the destination node moves in the direction of the arrow and becomes unreachable over the current path, due to leaving the wireless transmission range of node i (Figure 2(a)). Instead of involving all nodes in the network in broadcasting, only those with temperatures above the firework threshold (dashed line) are included (Figure 2(b)). Finally, a new route to the destination node via node j is established, and the route with reachability is sustained (Figure 2(c)). Although we only talked so far about the last hop to the destination node being lost, our method can equally handle the situation if an intermediate node leaves the current path. In those cases, the data replication of MTFR will also contribute to higher packet reachability for intermediate nodes to forward data packets to the next hop. As stated above, our MTFR can provide a higher reachability without recalculation of potentials on all nodes to cope with sudden changes in network topology.
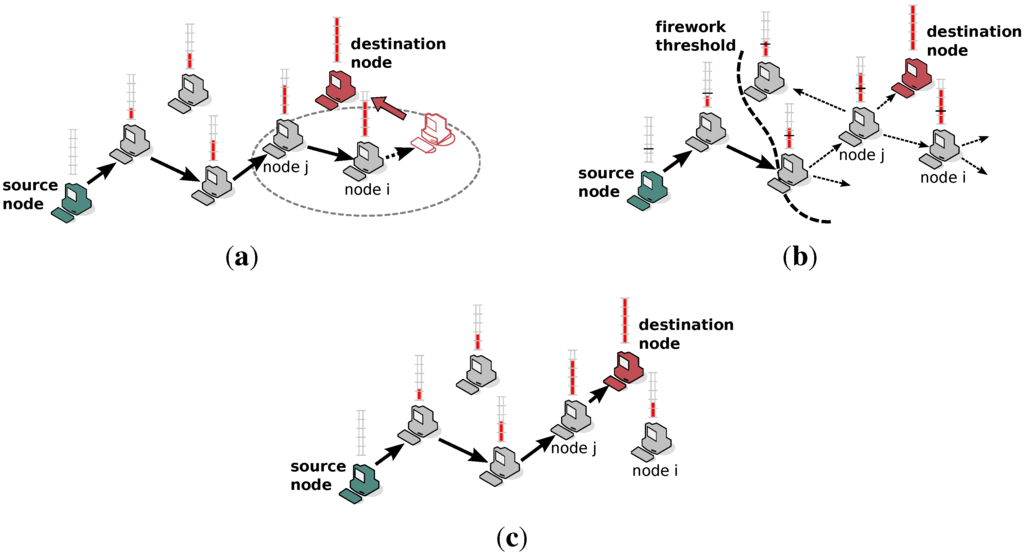
Figure 2.
Basic principle of recovery from disconnections in Mobility Tolerant Firework Routing (MTFR). (a) Disconnection due to movement of the destination node outside of the coverage area of node i; (b) all nodes beyond the firework threshold participate in broadcasting up to the firework hop limit to find a new route to the destination; (c) after finding a new route, reachability is recovered and maintained.
3.2.2. Algorithm Details
The protocol sequence is described in pseudocode in Algorithm 1 and mainly consists of three parts: the system parameter revision procedure, the temperature update procedure and the packet forwarding procedure. In Algorithm 1, preparations for being in-service by a mobile node are done (Lines 1–5) and communication is started (Line 6). During the call busy state, the mobile node performs mainly three tasks periodically (Line 7). First, the mobile node maintains several system management timers to update system parameters, such as the temperature update timer, the hop limit update timer and the system condition timer. After the system condition timer has expired, the mobile node adjusts each system parameter value at the right time (Lines 8–12).
Second, if the temperature update timer expires, the mobile node starts temperature recalculation (Line 13). Concerning each active link with the neighbor nodes, their temperature values are collected (Line 15), and the node’s own temperature is recalculated with them (Line 16). If its own temperature has changed after recalculation, the mobile node sends the new temperature to all its neighbor nodes (Line 19), and if not, a short notification message indicates that no change is sent (Line 21). On the contrary, updated temperature messages from neighbor nodes are also received (Line 22). Each node utilizes the sequence number in exchanging temperature messages to avoid confusion among each node’s update timing gap.
Third, the mobile node looks up the packet transmission table and sends packets to appropriate neighbor nodes according to its own temperature value (Line 23). If the temperature is above the firework threshold, the packet will be sent to all neighbor nodes with a greater temperature than its own (Line 25); otherwise, the packet will be sent only to the single neighbor node with the highest temperature (Line 27). Different broadcast algorithms can be considered, as well as another threshold to select nodes for broadcasting packets can be defined. Finally, the mobile node terminates the call (Line 28).
Note that our MTFR method is a disconnection recovery mechanism and can be used in conjunction with any potential routing method described in Section 2.
| Algorithm 1: Firework routing protocol algorithm |
| Power on the device; Node initialization procedure; Establish links with neighboring nodes; Initial temperature calculation with all nodes before in-service; Collection of call condition; Call origination procedure; 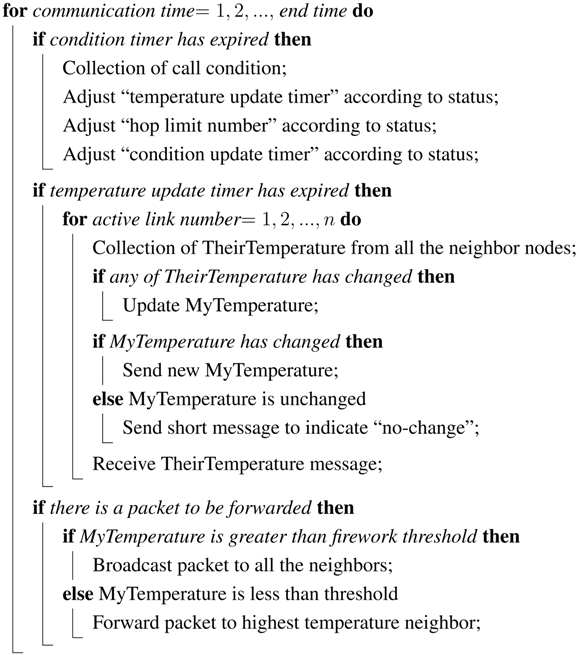 Call termination procedure; |
4. Numerical Evaluations
In this section, we evaluate our proposed method by a simulation program developed in C using the random walk (RWK) mobility model for N nodes. In our mobility model, nodes are distributed in a uniformly random manner at initial setup and move in one randomly selected direction for a certain fixed time (0.1 s). In addition, we introduced a bouncing rule when nodes encounter the area boundary. The time until the convergence of the potential is considered as the transient phase, after which simulation results start to be monitored. Unlike in [2], evaluations are performed to study the detailed behavior of our proposed method, and hence, parameter values are used that cover a wide range from optimistic to pessimistic scenarios. Basic simulation parameters are listed in Table 1, where default values are shown in bold. Each presented result is obtained as the average of 1000 simulation runs, so we omit showing confidence intervals. If not mentioned otherwise, the default number of nodes is 4000, the mobile speed is 100 m/s, the firework hop limit is set to 5 hops, the firework temperature threshold is 0.5 and the simulation time is 100 s. Note that the high vehicular speed only represents the relative difference between the traveled distance of a node and the transmission range, and we assumed a rather large value of 100 m/s in this paper in order to cause sufficiently large changes in connectivity, although it may appear unrealistic to actually occur in reality. Moreover, from the viewpoint of simplicity, an ideal wireless transmission channel is assumed in our simulation, and therefore, the success or failure of packet transmissions depends on the wireless range and the mutual distance of nodes. The bandwidth of the wireless channel is set at 2 Mbps, representing the practical bandwidth of WiFi.

Table 1.
Basic simulation parameters with default values marked in bold.
| Parameter | Value | |
|---|---|---|
| Layout | initial layout | uniformly random |
| area size | ||
| Nodes | number of nodes | 2000–4000 (4000) |
| wireless range | 100–500 m | |
| node speed | 100 m/s | |
| mobility model | random walk (RWK) | |
| Firework | hop limit | 3–7 hops (5) |
| threshold | 0.3–0.9 (0.5) | |
| Simulation | time | 100 s |
| repetitions | 1,000 |
4.1. Effects of Wireless Coverage
First, we investigate the basic tendency of the firework effect on the influence of packet reachability over the number of nodes and the wireless transmission range for both MTFR and conventional potential-based routing (PBR). In this paper, reachability probability is defined as the ratio of the number of packets successfully reaching the destination over the number of all transmitted packets. From Figure 3, we can conclude that packet reachability improves with a growing number of nodes and with transmission range. This is because increasing both values results in a wider wireless coverage area. MTFR is able to restore reachability almost completely to that of the theoretically maximum possible without mobility. The wireless transmission range affects the node density with an exponent of two, which produces a stronger relationship with reachability. Therefore, steeply increasing curves are observed.
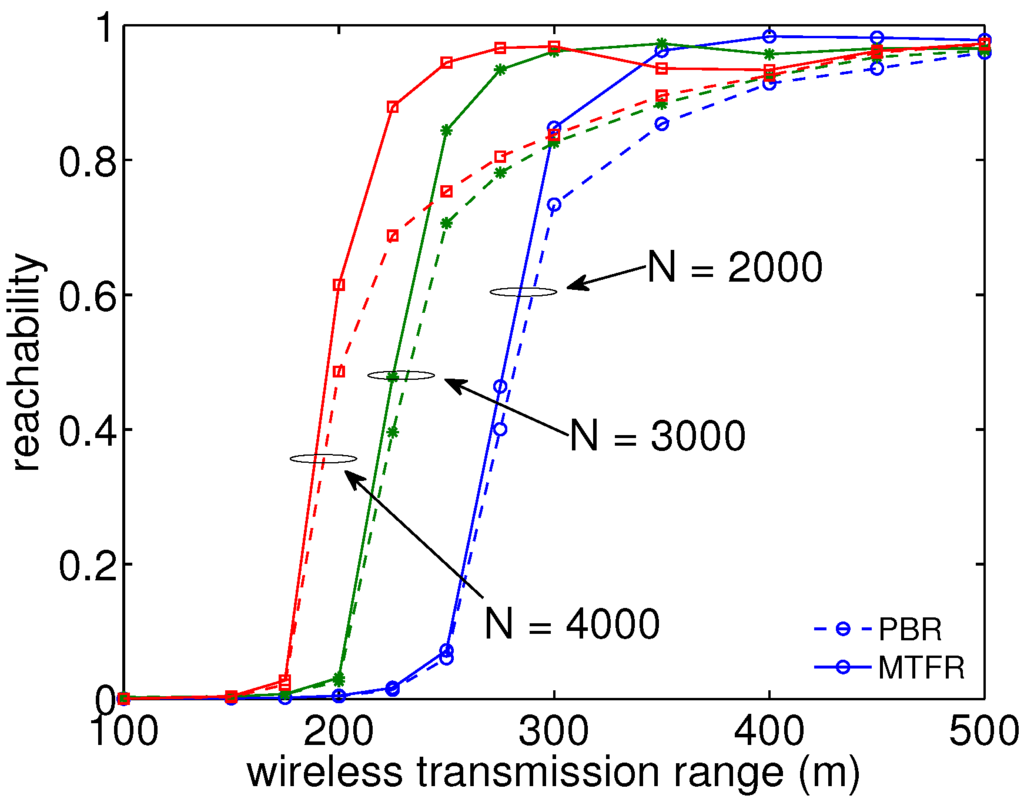
Figure 3.
Reachability increases in an S-shape manner with growing transmission range and number of nodes. PBR, potential-based routing.
It was also observed that there are some unrecoverable conditions in certain densely populated cases, like 4000 nodes and over 400 m wireless ranges. This is because the increase of possible links with more neighbors has the side effect of increasing the hop count between the source node and the destination node. The wider the transmission range becomes, the more links one node has, which eliminates the firework effect by the hop number limit. In conclusion, there is an optimal point against the number of nodes and wireless transmission range on the reachability improvement under some specific conditions. Here, the firework improvement effect represents the difference between results obtained with and without firework.
In addition, Figure 4 shows the simulation results of reachability improvement by firework with different numbers of nodes under RWK at the speed of 100 m/s and with different wireless ranges for packet transmission. Here, reachability improvement is defined as the difference in reachability between the methods with firework and without firework and for which absolute values can be found in Figure 3. In smaller and larger wireless transmission ranges, reachability improvement is almost zero, due to the lack of connectivity and no room for improvement, respectively. On the other hand, in middle ranges, there is a peak for each curve in which the wireless range is increasing as the number of nodes decreases. In addition, the maximum value slightly decreases as the number of nodes decreases, and therefore, as mentioned above, the wireless range has a larger effect on producing full reachability than the number of nodes.
In [2], we also investigated the effects of vehicular speed, the node mobility model, the temperature update interval and transmission delays against the traffic overhead. Those results are left out for the sake of brevity, and the reader is referred to [2] for further details.
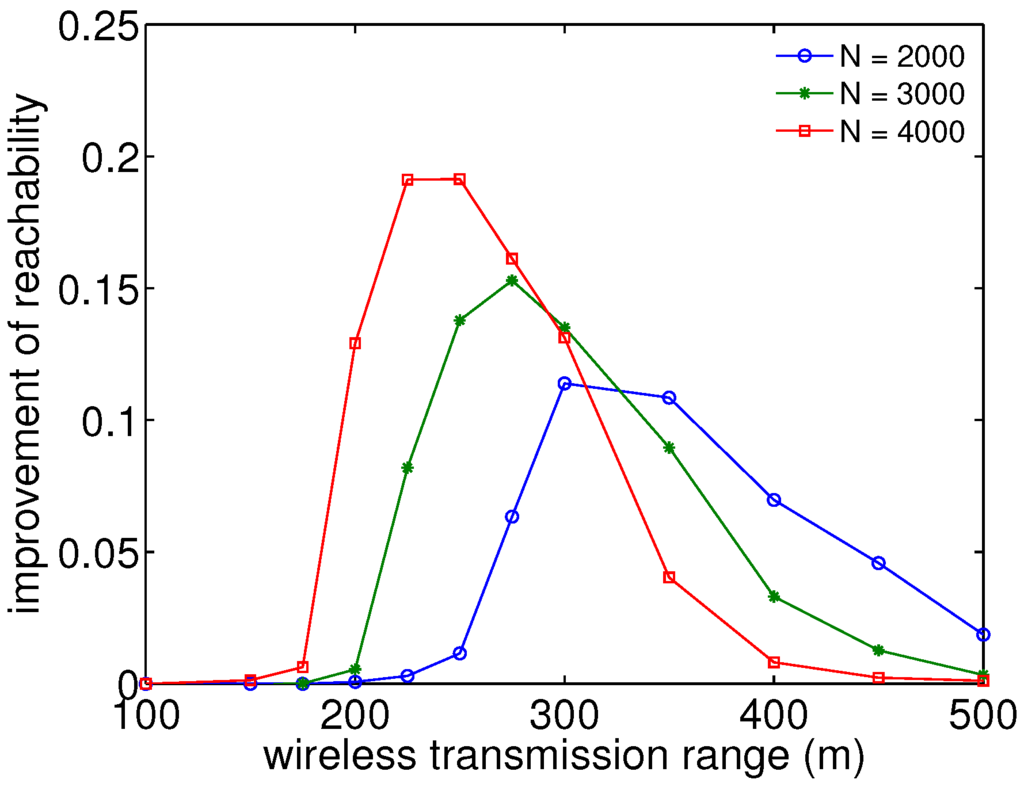
Figure 4.
Reachability improvement analysis as the difference between results with and without firework shows the largest improvements for intermediate transmission ranges.
4.2. Evaluation of Transmission Delay
Figure 5 shows the simulation results of end-to-end transmission delays per packet transmission generated with different numbers of nodes under RWK at the speed of 100 m/s and with different ranges for packet transmission. Here, end-to-end delay corresponds to the average time period for completing a packet transmission from the source node to the destination node, which is equivalent to the number of hops under the condition that each hop-by-hop transmission time is equal. In smaller wireless ranges, transmission delays are observed as almost zero in all conditions, due to the lack of reachability, and in addition, in larger wireless ranges, delays converge to around 15–20 hops in all conditions, due to almost full reachability. In middle wireless ranges, we can recognize some additional transmission delays, due to the firework procedure. However, even in the worst conditions, delays are in total less than 40 hops in Figure 5. In addition, it turned out that delay differences between results with and without firework were limited to at most eight hops in all cases. This fact indicates that our MTFR is feasible enough for real communication scenarios. As a result, MTFR produces better reachability at the expense of a small additional transmission delay from the overall viewpoint.
In addition, Figure 6 shows the simulation results of the end-to-end delay increase per packet transmission generated with different numbers of nodes under RWK at the speed of 100 m/s and with different ranges for packet transmission. Here, the difference of end-to-end delay is the discrepancy in delay between with firework and without firework for the absolute values shown in Figure 5. In smaller and middle wireless transmission ranges, the tendency of maximum delay increase shows similar results as those of reachability. However, in larger wireless transmission ranges, degradation is saturated at the level of about 4 hops. This is because the temperature gradient sustains the basic principal communication route on one side, but it does not allow shortcut routes on the other side. The sufficient number of nodes with a sufficient wireless transmission range redundantly increases the average number of links that each node has. This produces a higher probability of equal cost links than in the situations with a smaller density of wireless coverage, and hence, a random selection feature is taken into account for path selection. In addition, our firework mechanism emphasizes this randomness more. Hence, it produces a certain fixed delay.
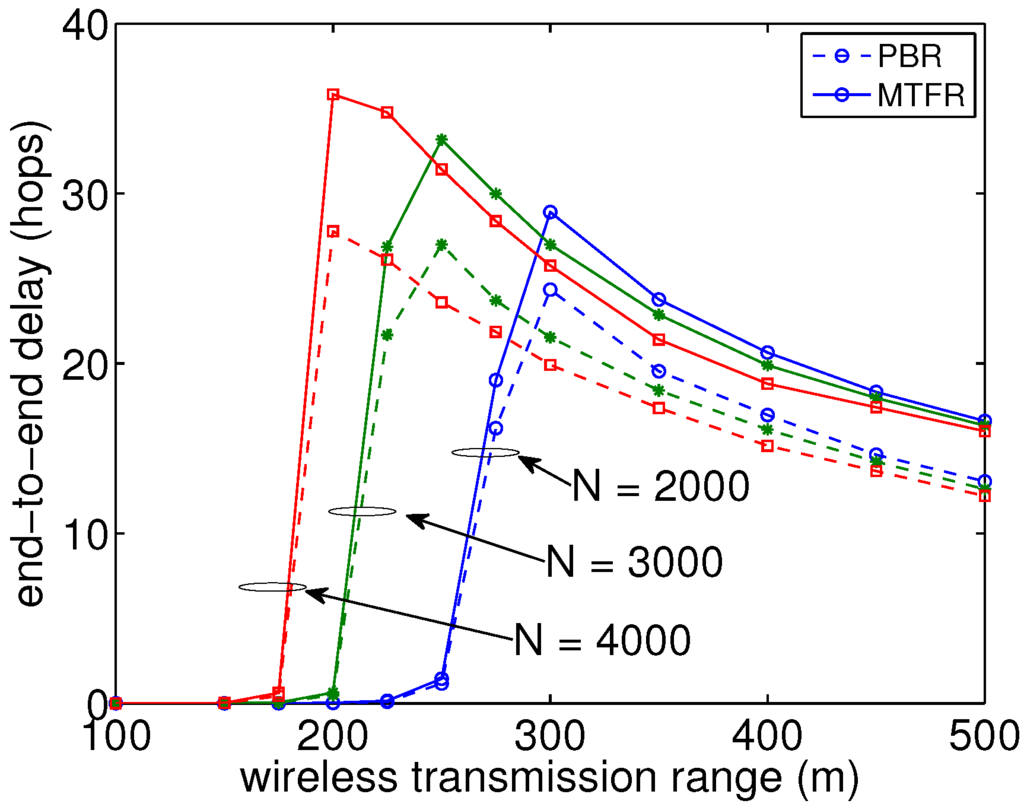
Figure 5.
Transmission delays (hop count) show clear differences between with and without firework for larger wireless transmission ranges.
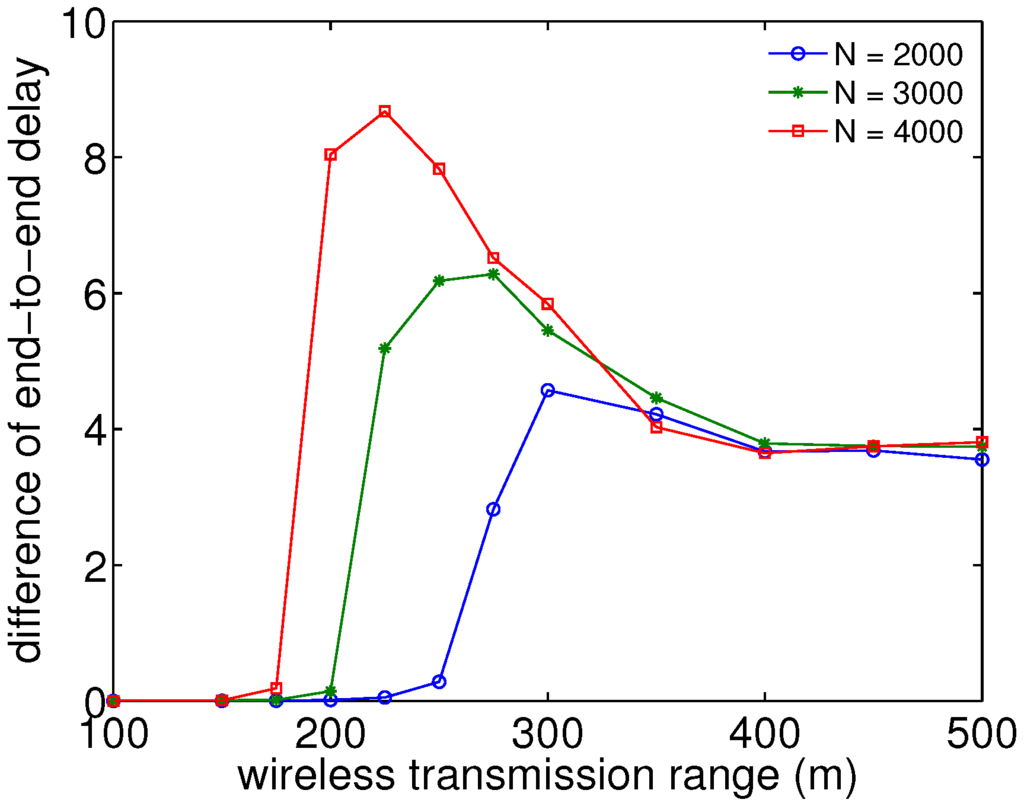
Figure 6.
The difference of end-to-end delay per packet transmission shows saturation for larger wireless transmission ranges, due to the effects of randomness.
4.3. Evaluation of Traffic Overhead
In addition, we analyze the tendency from the viewpoint of traffic overhead accompanied by the firework procedure. Figure 7 shows the simulation results of additional traffic overhead by firework with different numbers of nodes under RWK at the speed of 100 m/s and with different wireless ranges for packet transmission. Here, traffic overhead is defined as the total number of hops traveled by transmitted packets, including replicated packets, which is substituted by the total number of hops under the condition that the size of all transmitted and replicated packets is equal. In Figure 7, traffic overhead is normalized by the number of nodes and the total amount of transmitted packets.
The normalized traffic overhead without firework is almost zero, which can be used as a criteria to evaluate our method. From Figure 7, in higher wireless transmission ranges, such as more than 350 m, it is shown that there is not much difference between without and with firework. On the other hand, in the middle wireless transmission ranges from 200 m to 350 m, additional traffic overhead by firework is observed, but remains less than 0.2 hops. In addition, in lower wireless transmission ranges, such as less than 200 m, there is no difference between without and with firework, due to poor reachability in both cases. Even though firework routing requires in the medium range cases additional traffic overhead, reachability recovery has more importance over overhead increases for the future network infrastructure, since it allows a connection to the destination compared to the case without firework. Moreover, here, in our simulation, we use a fixed firework threshold (0.5 ), and the higher the firework threshold we utilize, the less additional traffic overhead produced. We can also easily embed some additional intelligence to reduce the overhead by avoiding unwanted replicated packets, for example by not broadcasting packets to nodes that have a low expectation of recovery, due to their temperature or vehicular motion. As a consequence, the above results can be seen as the worst case scenario and indicate that firework inevitably produces an increase of traffic overhead to some extent, but the benefits of higher connectivity with MTFR outweigh this drawback to make it feasible enough for an actual system implementation.
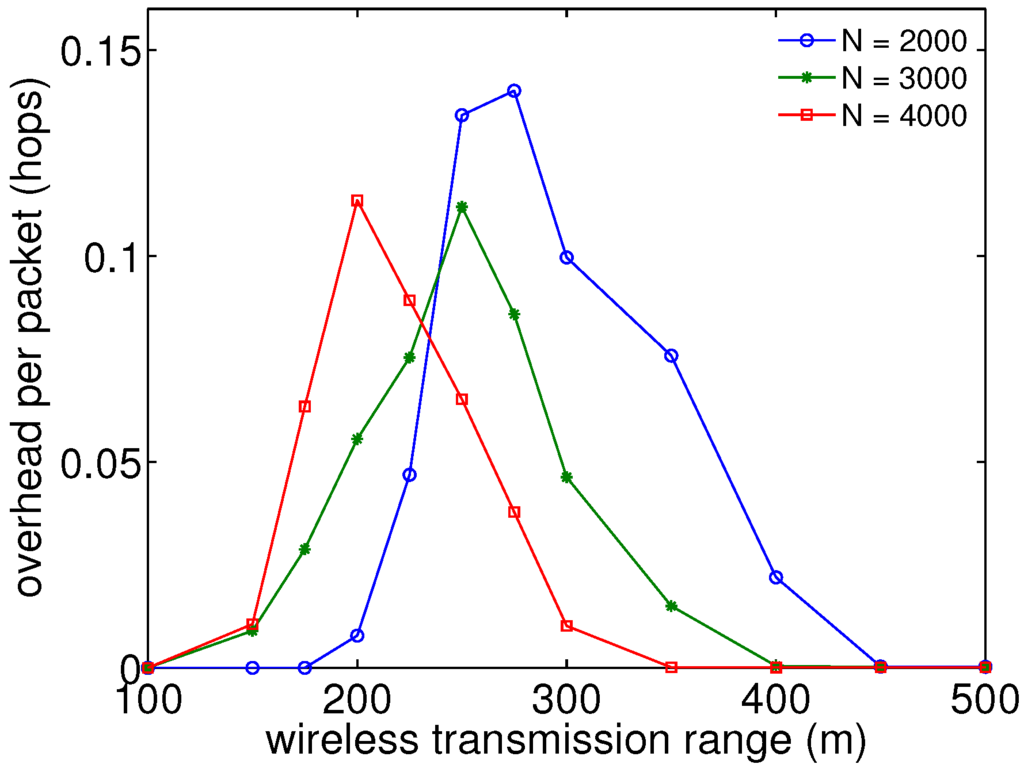
Figure 7.
Traffic overhead analysis shows differences between with and without firework for intermediate wireless transmission ranges.
In addition, Figure 8 shows the simulation results of an additional traffic overhead increase by firework with different numbers of nodes under RWK at the speed of 100 m/s and with different wireless ranges for packet transmission. Here, traffic overhead is expressed as the average number of traversed hops by a packet transmission from the source node to the destination node. The difference of traffic overhead is the discrepancy in traffic overhead between the results with firework and without firework. In addition, absolute values for the traffic overhead with and without firework are given in Figure 8. As the number of nodes increases, the difference of traffic overhead increases, though the overhead per packet in Figure 7 remains almost constant irrespective of the number of nodes. In smaller and larger wireless transmission ranges, the overhead increase is almost zero for the same reason as in the reachability improvement analysis of Section 4.1. The wireless range for each maximum overhead peak shifts similarly from a small range to a large range.
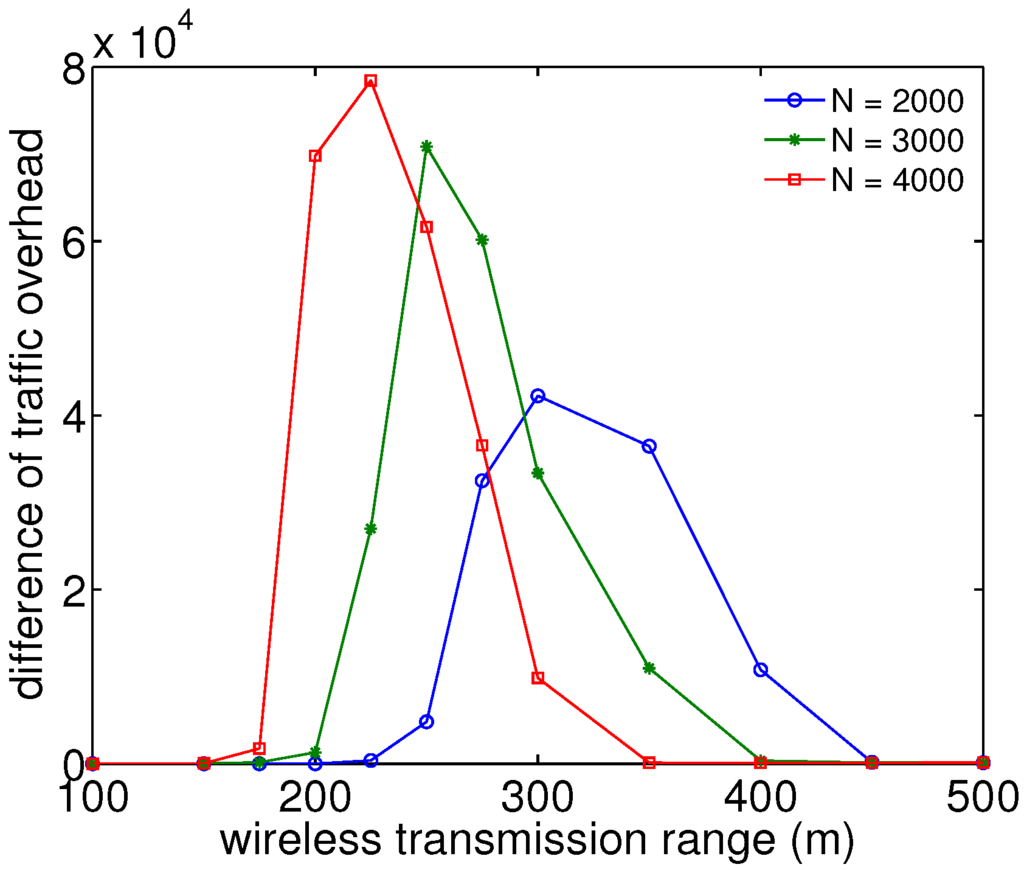
Figure 8.
Traffic overhead degradation analysis shows that the peak of overhead difference between with and without firework shifts as the number of nodes decreases.
4.4. Firework Parameter Study
Finally, we analyze parameter influences by the firework method. Figure 9 and Figure 10 show the simulation results of the improvement of reachability, the difference of delay and the difference of overhead by firework routing with different firework hop limits and firework threshold values, respectively, which are simulated for 4000 nodes under RWK at the speed of 100 m/s and with different wireless ranges for packet transmission. Here, the firework hop limit is defined as the maximum number of hops for packets to be replicated and transferred to neighboring nodes by intermediate nodes. In other words, the intermediate nodes replicate and transfer packets with a hop count up to the firework hop limit and stop broadcasting packets beyond the firework hop limit. In addition, the firework threshold is defined as the minimum temperature value at which intermediate nodes replicate and transfer packets received from neighboring nodes. Hence, intermediate nodes with the temperature of a firework threshold value or larger replicate and transfer intercepted packets, while, on the other hand, nodes with a smaller temperature than firework threshold do not replicate them and operate the same way as conventional potential-based routing.
From Figure 9(a), a firework hop limit of five hops appears to achieve high reachability, while trying to maintain a low delay (Figure 9(b)) and overhead (Figure 9(c)) to some extent. It is observed that the best hop limit value depends on current conditions, such as node density. Increasing the hop limit too much does not yield much improvement in reachability, but increases delay and especially overhead. An interesting observation can be further made in Figure 9(c). Although it would be expected that an increased firework hop limit would lead to more overhead, for transmission ranges between 300–400 m, the overhead actually drops below that of a hop limit of three. The reason for this is that with a large wireless transmission range and hop limit, there is a large overlap of neighboring nodes, and since each node only participates once in each broadcast process beyond the firework threshold, the overhead for large ranges becomes less after the first hop of the broadcast.
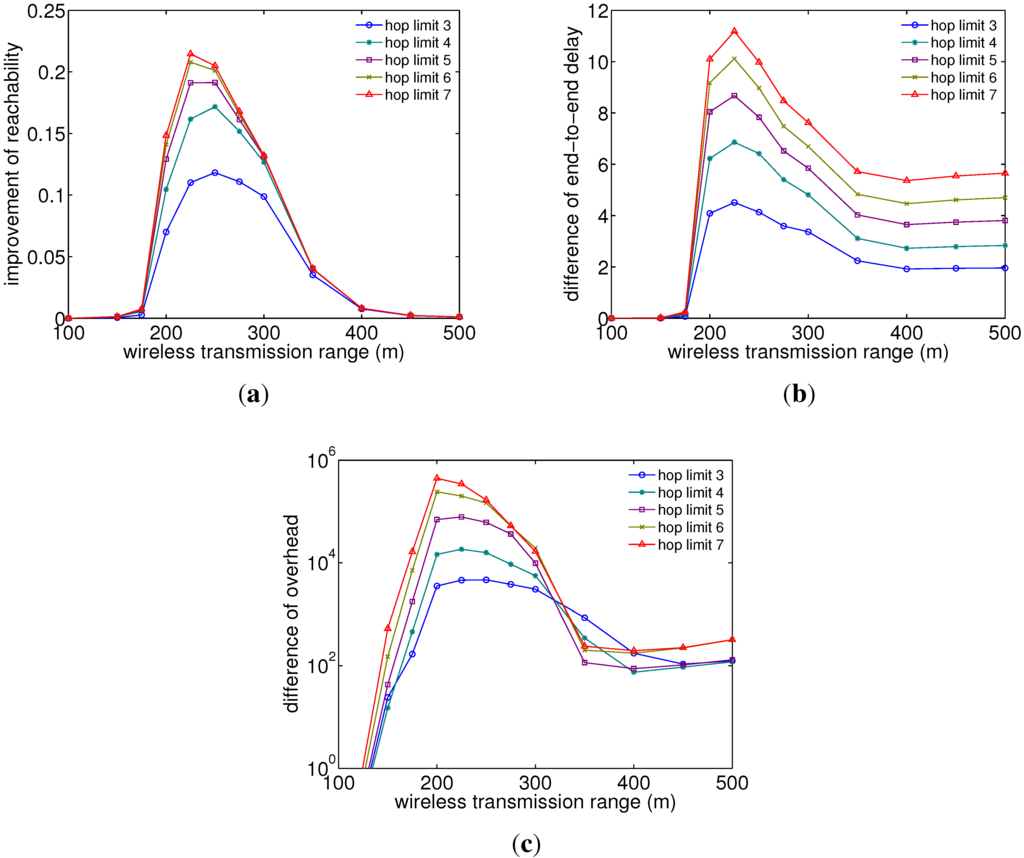
Figure 9.
Evaluation of the hop limit versus the transmission range shows that even a hop limit threshold = 3 yields a fair improvement, while a hop limit of five appears to produce sufficient reachability (). (a) Reachability difference; (b) delay difference; (c) overhead difference.
In addition, from Figure 10, it is shown that the firework threshold value should be selected in a more precise manner than the hop limit value. For example, the firework thresholds between 0.5 and 0.7 might be the best parameters in the case of wireless transmission ranges 250 m, 300–350 m and 400 m or above, respectively. A firework threshold between 0.5 and 0.7 produces overall better reachability improvement, much closer to the best performance at a firework threshold of 0.3, while at the same time having a smaller traffic overhead. However, the threshold of 0.5 has a slightly higher delay difference than the other values, and all thresholds converge for large ranges to the same values. Note that a firework threshold of zero means that we have a pure broadcasting mechanism, while a threshold of one is the same as conventional potential-based routing.
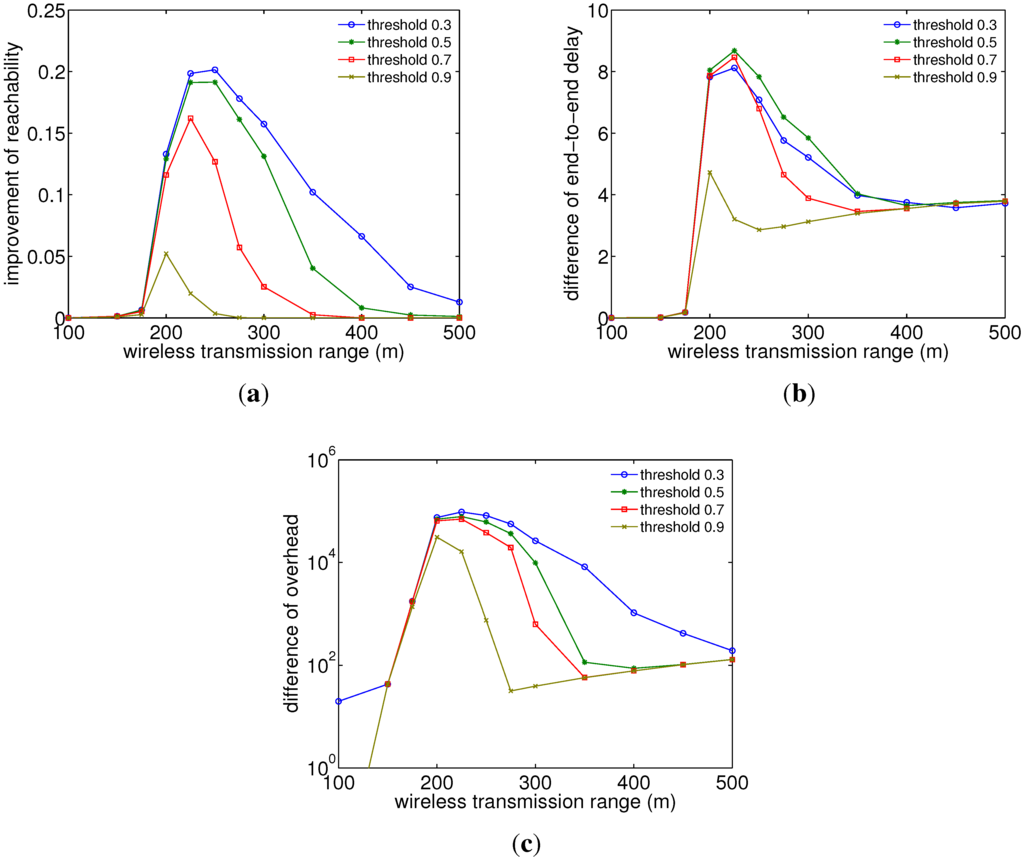
Figure 10.
Reachability improvement versus firework threshold shows that a firework threshold of 0.5 reveals a good tradeoff between reachability improvement and delay/overhead (). (a) Reachability difference; (b) delay difference; (c) overhead difference.
4.5. Theoretical Discussion
From the results, we saw that there is a fundamental relationship between the number of nodes, the wireless transmission range and reachability. In this subsection, we will briefly discuss some results on random geometric graphs [13,14] that provide theoretical insights into this relationship. Random geometric graphs have become a useful theoretical tool for modeling connectivity in static networks [15] or dynamic networks [16], i.e., where nodes move with a random walk, and they are defined as follows.
Let N nodes be placed at independent and identically distributed random positions in the unit torus . We define the random geometric graph over this set of N nodes and the set of edges connecting each pair of nodes, and , if , where r is a positive real-valued number and denotes the Euclidean distance in the torus. This definition resembles our static network configuration in a MANET for nodes having the wireless transmission range, r.
It was shown that for such a random geometric graph, a critical radius,
exists for which connectivity occurs with high probability as . By rescaling from the unit torus to our modeled area side , we obtain the scaled radius, , which we can compare with our simulated results (Figure 11). For the considered number of nodes in this paper of , 3000 and 4000, we obtain numerical values of , 291.46 m and 256.91 m, respectively. It should be noted that these values can only be roughly compared, since the theoretical values only consider static nodes, while our simulation includes an RWK mobility model. However, they show that for our considered number of nodes, the critical transmission ranges lie around 250–350 m, as we could also see from the simulation results.
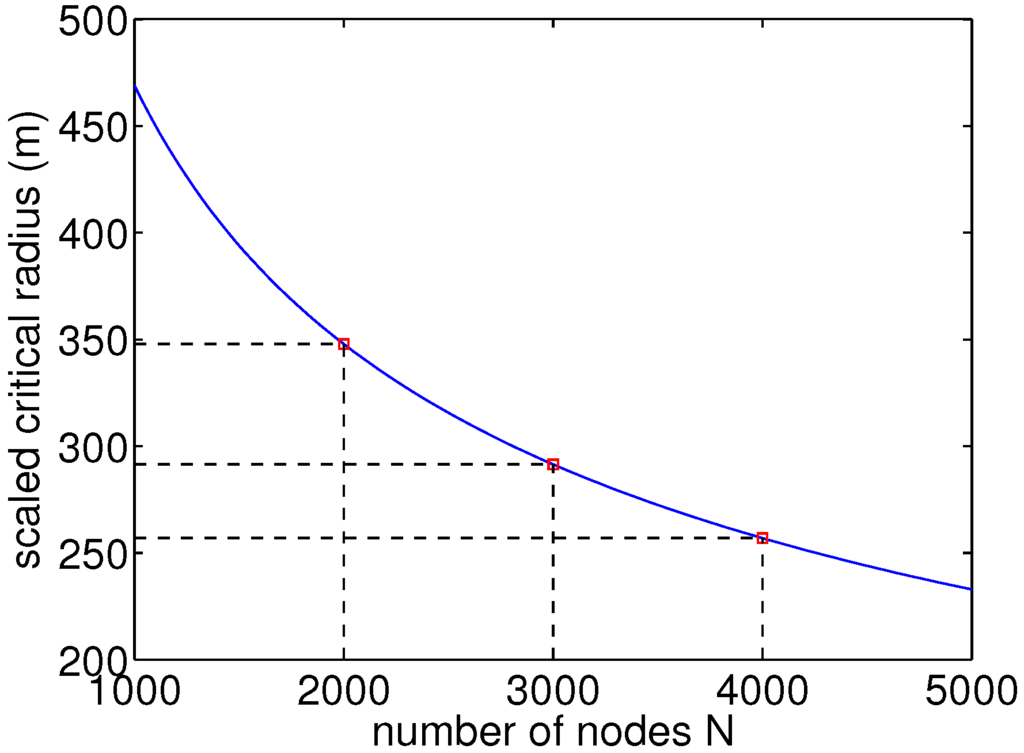
Figure 11.
Scaled critical radius for the investigated number of nodes, N, in this study.
Furthermore, Diaz et al. [16] investigated the analytical properties of random geometric graphs with mobility. Similar to our simulations, each node performs a random walk with a speed, s. The expected length of the connectivity period is derived in [16] as:
where . By rescaling from the unit torus to our real-world values as , we obtain Figure 12, where is plotted over r. We limited the y-axis to 100, which is the length of our simulation time, and can see that the radius for which reaches 100 matches quite well to the ranges in which we have a reachability probability of nearly one, as shown in Figure 3.
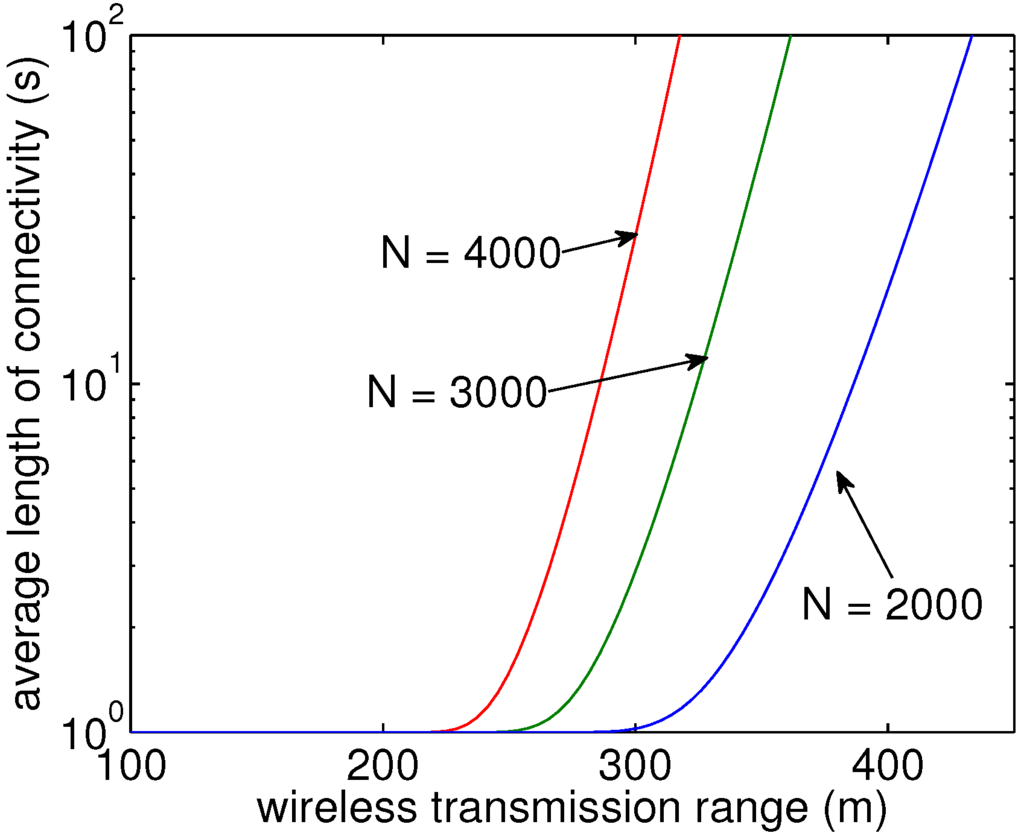
Figure 12.
Scaled connection lengths for different numbers of nodes N within 100 s simulation time.
5. Conclusions
In this paper, we investigated a novel mobility-assisted firework routing mechanism named Mobility Tolerant Firework Routing to improve packet reachability, and we evaluated it by simulations with the random walk mobility model to study the effect of its parameters on reachability, end-to-end delay and overhead. In addition, we discussed some related theoretical models for random geometric graphs and showed that the simulation results match well with the analytical values regarding the critical transmission radius at which global connectivity can be maintained.
First, we studied the performance of our method from the wireless coverage viewpoint. It turned out that our method showed a good improvement in reachability by the firework effect, and the increase in wireless coverage resulted in general in a higher reachability. Second, we analyzed the tendency of additional end-to-end delay and traffic overhead with our method. Both results showed that the better reachability came at the expense of a higher delay and overhead. However, this may be overcome by the appropriate choice of parameters to make our method feasible enough for implementation in an actual system. Third, we analyzed two parameters, the firework threshold and hop limit, against packet reachability. We also confirmed that optimal values for both parameters exist that vary depending on the system conditions, such as the wireless transmission environment and the number of nodes. We believe that MTFR has the ability to improve reachability in MANETs for providing a robust and adaptive social communication network infrastructure.
Conflicts of Interest
The authors declare no conflict of interest.
References
- Basu, A.; Lin, A.; Ramanathan, S. Routing Using Potentials: A Dynamic Traffic-Aware Routing Algorithm. In Proceedings of the ACM SIGCOMM’03, Karlsruhe, Germany, 25–29 August 2003; pp. 188–191.
- Motoyoshi, G.; Leibnitz, K.; Murata, M. MTFR: Mobility Tolerant Firework Routing. In Proceedings of the 4th IEEE International Workshop on Dependable Network Computing and Mobile Systems (DNCMS’11), Madrid, Spain, 4 October 2011.
- Baumann, R.; Heimlicher, S.; Lenders, V.; May, M. HEAT: Scalable Routing in Wireless Mesh Networks Using Temperature Fields. In Proceedings of the IEEE Symposium on a World of Wireless, Mobile and Multimedia Networks (WoWMoM’07), Helsinki, Finland, 18–21 June 2007.
- Lenders, V.; Baumann, R. Link-Diversity Routing: A Robust Routing Paradigm for Mobile Ad Hoc Networks. In Proceedings of the IEEE International Conference Wireless Communications and Networking Conference, 2008 (WCNC ’08), Las Vegas, NV, USA, 31 March–3 April 2008; pp. 2585–2590.
- Kwon, D.Y.; Chung, J.H.; Suh, T.; Lee, W.G.; Hur, K. A Potential Based Routing Protocol for Mobile Ad Hoc Networks. In Proceedings of the 11th IEEE International Conference on High Performance Computing and Communications (HPCC’09), Seoul, Korea, 25–27 June 2009.
- Balasubramaniam, S.; Mineraud, J.; McDonagh, P.; Perry, P.; Murphy, L.; Donnelly, W.; Botvich, D. An evaluation of parameterized gradient based routing with QoE monitoring for multiple IPTV providers. IEEE Trans. Broadcast. 2011, 57, 183–194. [Google Scholar]
- Toumpis, S.; Tassiulas, L. Packetostatics: Deployment of Massively Dense Sensor Networks as An Electrostatics Problem. In Proceedings of the IEEE International Conference on Computer Communications (INFOCOM’05), Miami, FL, USA, 13–17 March 2005.
- Toumpis, S. Mother nature knows best: A survey of recent results on wireless networks based on analogies with physics. Comput. Netw. 2008, 52, 360–383. [Google Scholar] [CrossRef]
- Sidera, A.; Toumpis, S. DTFR: A Geographic Routing Protocol for Wireless Delay Tolerant Networks. In Proceedings of the 10th IEEE/IFIP Annual Mediterranean Ad Hoc Networking Workshop 2011 (MedHocNet’11), Favignana Island, Italy, 12–15 June 2011.
- Sidera, A.; Toumpis, S. Delay tolerant firework routing: a geographic routing protocol for wireless delay tolerant networks. EURASIP J. Wirel. Commun. Netw. 2013, 2013. [Google Scholar] [CrossRef]
- Perkins, C.; Ratliff, S.; Dowdell, J. Dynamic MANET On-Demand (AODVv2) Routing. Available online: http://tools.ietf.org/html/draft-ietf-manet-dymo-26 (accessed on 8 January 2014).
- Clausen, T.; Dearlove, C.; Jacquet, P.; Herberg, U. The Optimized Link State Routing Protocol Version 2. Available online: http://tools.ietf.org/html/draft-ietf-manet-olsrv2-13 (accessed on 8 January 2014).
- Penrose, M. The longest edge of the random minimal spanning tree. Ann. Appl. Probab. 1997, 7, 340–361. [Google Scholar] [CrossRef]
- Penrose, M. On K-connectivity for a geometric random graph. Rand. Struct. Algorithms 1999, 15, 145–164. [Google Scholar] [CrossRef]
- Gupta, P.; Kumar, P.R. Critical Power for Asymptotic Connectivity in Wireless Networks; Birkhauser: Boston, MA, USA, 1999; Chapter 4; pp. 547–566. [Google Scholar]
- Diaz, J.; Mitsche, D.; Gimenez, P.X. Large connectivity for dynamic random geometric graphs. IEEE Trans. Mobile Comput. 2009, 8, 821–835. [Google Scholar] [CrossRef]
© 2014 by the authors; licensee MDPI, Basel, Switzerland. This article is an open access article distributed under the terms and conditions of the Creative Commons Attribution license (http://creativecommons.org/licenses/by/3.0/).