1. Introduction
Bitcoin is a decentralized cryptographic currency system, proposed by Satoshi Nakamoto [
1]. Based on a peer-to-peer (P2P) architecture, Bitcoin users are able to issue transactions carrying payments in bitcoins. To provide some form of anonymity, direct personally identifiable information are omitted from any transaction; instead, source and destination are encoded in the form of public keys, which serve as pseudonyms. Every party can generate as many public keys as he wishes; the corresponding private keys are used to authenticate (sign) transactions and are stored in private wallets either locally on a user’s computer or in cloud-storage providers.
In order to use Bitcoin, one must run a client software that is able to communicate with other nodes (peers) based on a standardized protocol. The official client is the Satoshi client [
2], but several other clients have been developed since Bitcoin emerged. Transactions are broadcast by the Bitcoin client into the peer-to-peer system and get definite (confirmed) once they are added to the “block chain”—a hash chain containing blocks of all (signed) transactions since the existence of Bitcoin. Peer discovery takes place either through a private database of known peers or through a public IRC channel. By design, there is no central instance that could check all transactions for validity (such as looking for traces of double spending attacks); every node in the network is required to do so once its Bitcoin client receives new incoming transactions. Indeed, the possibility of double-spending attacks against Bitcoin has been shown in [
3] for fast payments.
For verification purposes, the block chain is public knowledge and stored in all Bitcoin clients today. Generating a new block is a computationally expensive operation, requiring a “proof of work” based on the concept of Hashcash [
4], initially proposed to limit e-mail spam by requiring the sender to spend some CPU time in order for the mail to be accepted by the receiver. The central idea of a proof of work is to make it expensive for a single peer to rewrite the history of transactions once it has been accepted as definite. The proof of work system requires choosing a nonce for each block in a way that the hash of the block together with the nonce contains a number of preceding zeros. The number of zeros (and thus the complexity of finding such a nonce through brute force) varies and is adapted periodically. Peers who devote computation resources to block generation are issued a reward; block generation is called bitcoin mining.
Only limited information is available on the graph structure of the Bitcoin P2P network, as it is formed dynamically and a client only has knowledge of the peers to which its client is connected to. In contrast, the graph of all transactions can be re-constructed accurately from the publicly available block chain: the nodes of the graph correspond to Bitcoin addresses and the edges to transactions performed between these addresses. Some basic facts on the structure of this graph were published by Reid and Harrigan [
5] and recently by Ron and Shamir [
6]. The structure and the dynamics of the graph play a key role to assess the level of anonymity each Bitcoin user enjoys. Two studies investigated the complexity of de-anonymizing a Bitcoin user: Reid and Harrigan [
5] focused on an exemplary case study and Androulaki
et al. [
7] relied on simulations that faithfully mimic the usage of Bitcoin in a closed community.
In this paper, we empirically study important global properties of the Bitcoin transaction graph. For our analysis, we used the data of the Bitcoin block chain up to block number 215,399, which was created on 6 January 2013. In contrast to existing works, we focus on the time evolution of these properties since the emergence of Bitcoin in order to capture the dynamics of the transaction network. Furthermore, we assess the implications of these properties on the practical level of anonymity that Bitcoin users achieve; in contrast to prior work, we focus on global network properties, rely on empirical data and refrain from performing simulations.
Traditionally, the anonymity of users in a communication system can be analyzed using two complementary approaches. First, one can employ notions similar to
k-anonymity proposed by Sweeney [
8]: a user is
k-anonymous if there are
other users in the system whose actions cannot be distinguished from the user in question; all
k users form the anonymity set, the larger
k the better (one “hides in the crowd”). Second, one can employ notions based on unlinkability, which informally states that one is unable to decide whether two actions were performed by the same user or not (the latter was used in the study by Androulaki
et al. [
7]). In this paper we focus on a global passive adversary, who retrieves the Bitcoin block chain and tries to link transactions or infer user identities.
Estimating the level of
k-anonymity provided by Bitcoin amounts to estimating the number of active economic entities within the Bitcoin network; we do this in
Section 2. Without external knowledge, those entities cannot be distinguished by an adversary (as all transactions are generated pseudonymously and do not contain any personally identifiable information) and form the anonymity set of Bitcoin.
Section 3 empirically analyzes the ability of a passive adversary to link different transactions to one economic entity due to a design feature of Bitcoin. Finally, we consider the problem of dormant coins in
Section 4.
2. Public Keys and Economically Active Entities
We first consider the number of public keys and try to estimate the number of active entities within the Bitcoin system. The number of
all public keys (or addresses) is the number of public keys present in any transaction, whereas the notion of
used public keys corresponds to those public keys that were used as input to any transaction at least once. Such used public keys belong to an actor who has control over these bitcoins. Therefore, we regard this as an economically active entity. Addresses used together as input for a single transaction belong to the same entity, because, in order to use an address as an input, one must be in possession of the corresponding private key for that address (this observation was already made by Reid and Harrigan [
5]). It is of course possible that some entity has never used two or more addresses together, but is still in possession of both private keys. In such a case both addresses would be perceived as belonging to two different entities by an adversary (and our experimental analysis) due to lack of data. Thus, the number of entities reported here serves as an upper bound.
As defined by the Bitcoin protocol, the balance associated with an address cannot be divided into smaller amounts. Nevertheless it is possible to use the same input address again as output address; this way only a fraction of the balance can be transferred to another address, whereas the remainder of a balance can be transferred back to the originator. This has, of course, negative implications on privacy: it allows to link different transactions, as an attacker can more accurately estimate the number of active entities (if there was no linkability, the new transaction would look as if it originated from a new entity). To counter this, the Satoshi client creates a new address for the balance in the background; via this mechanism it remains unclear which address is used by the recipient and which address is used for the remaining balance.
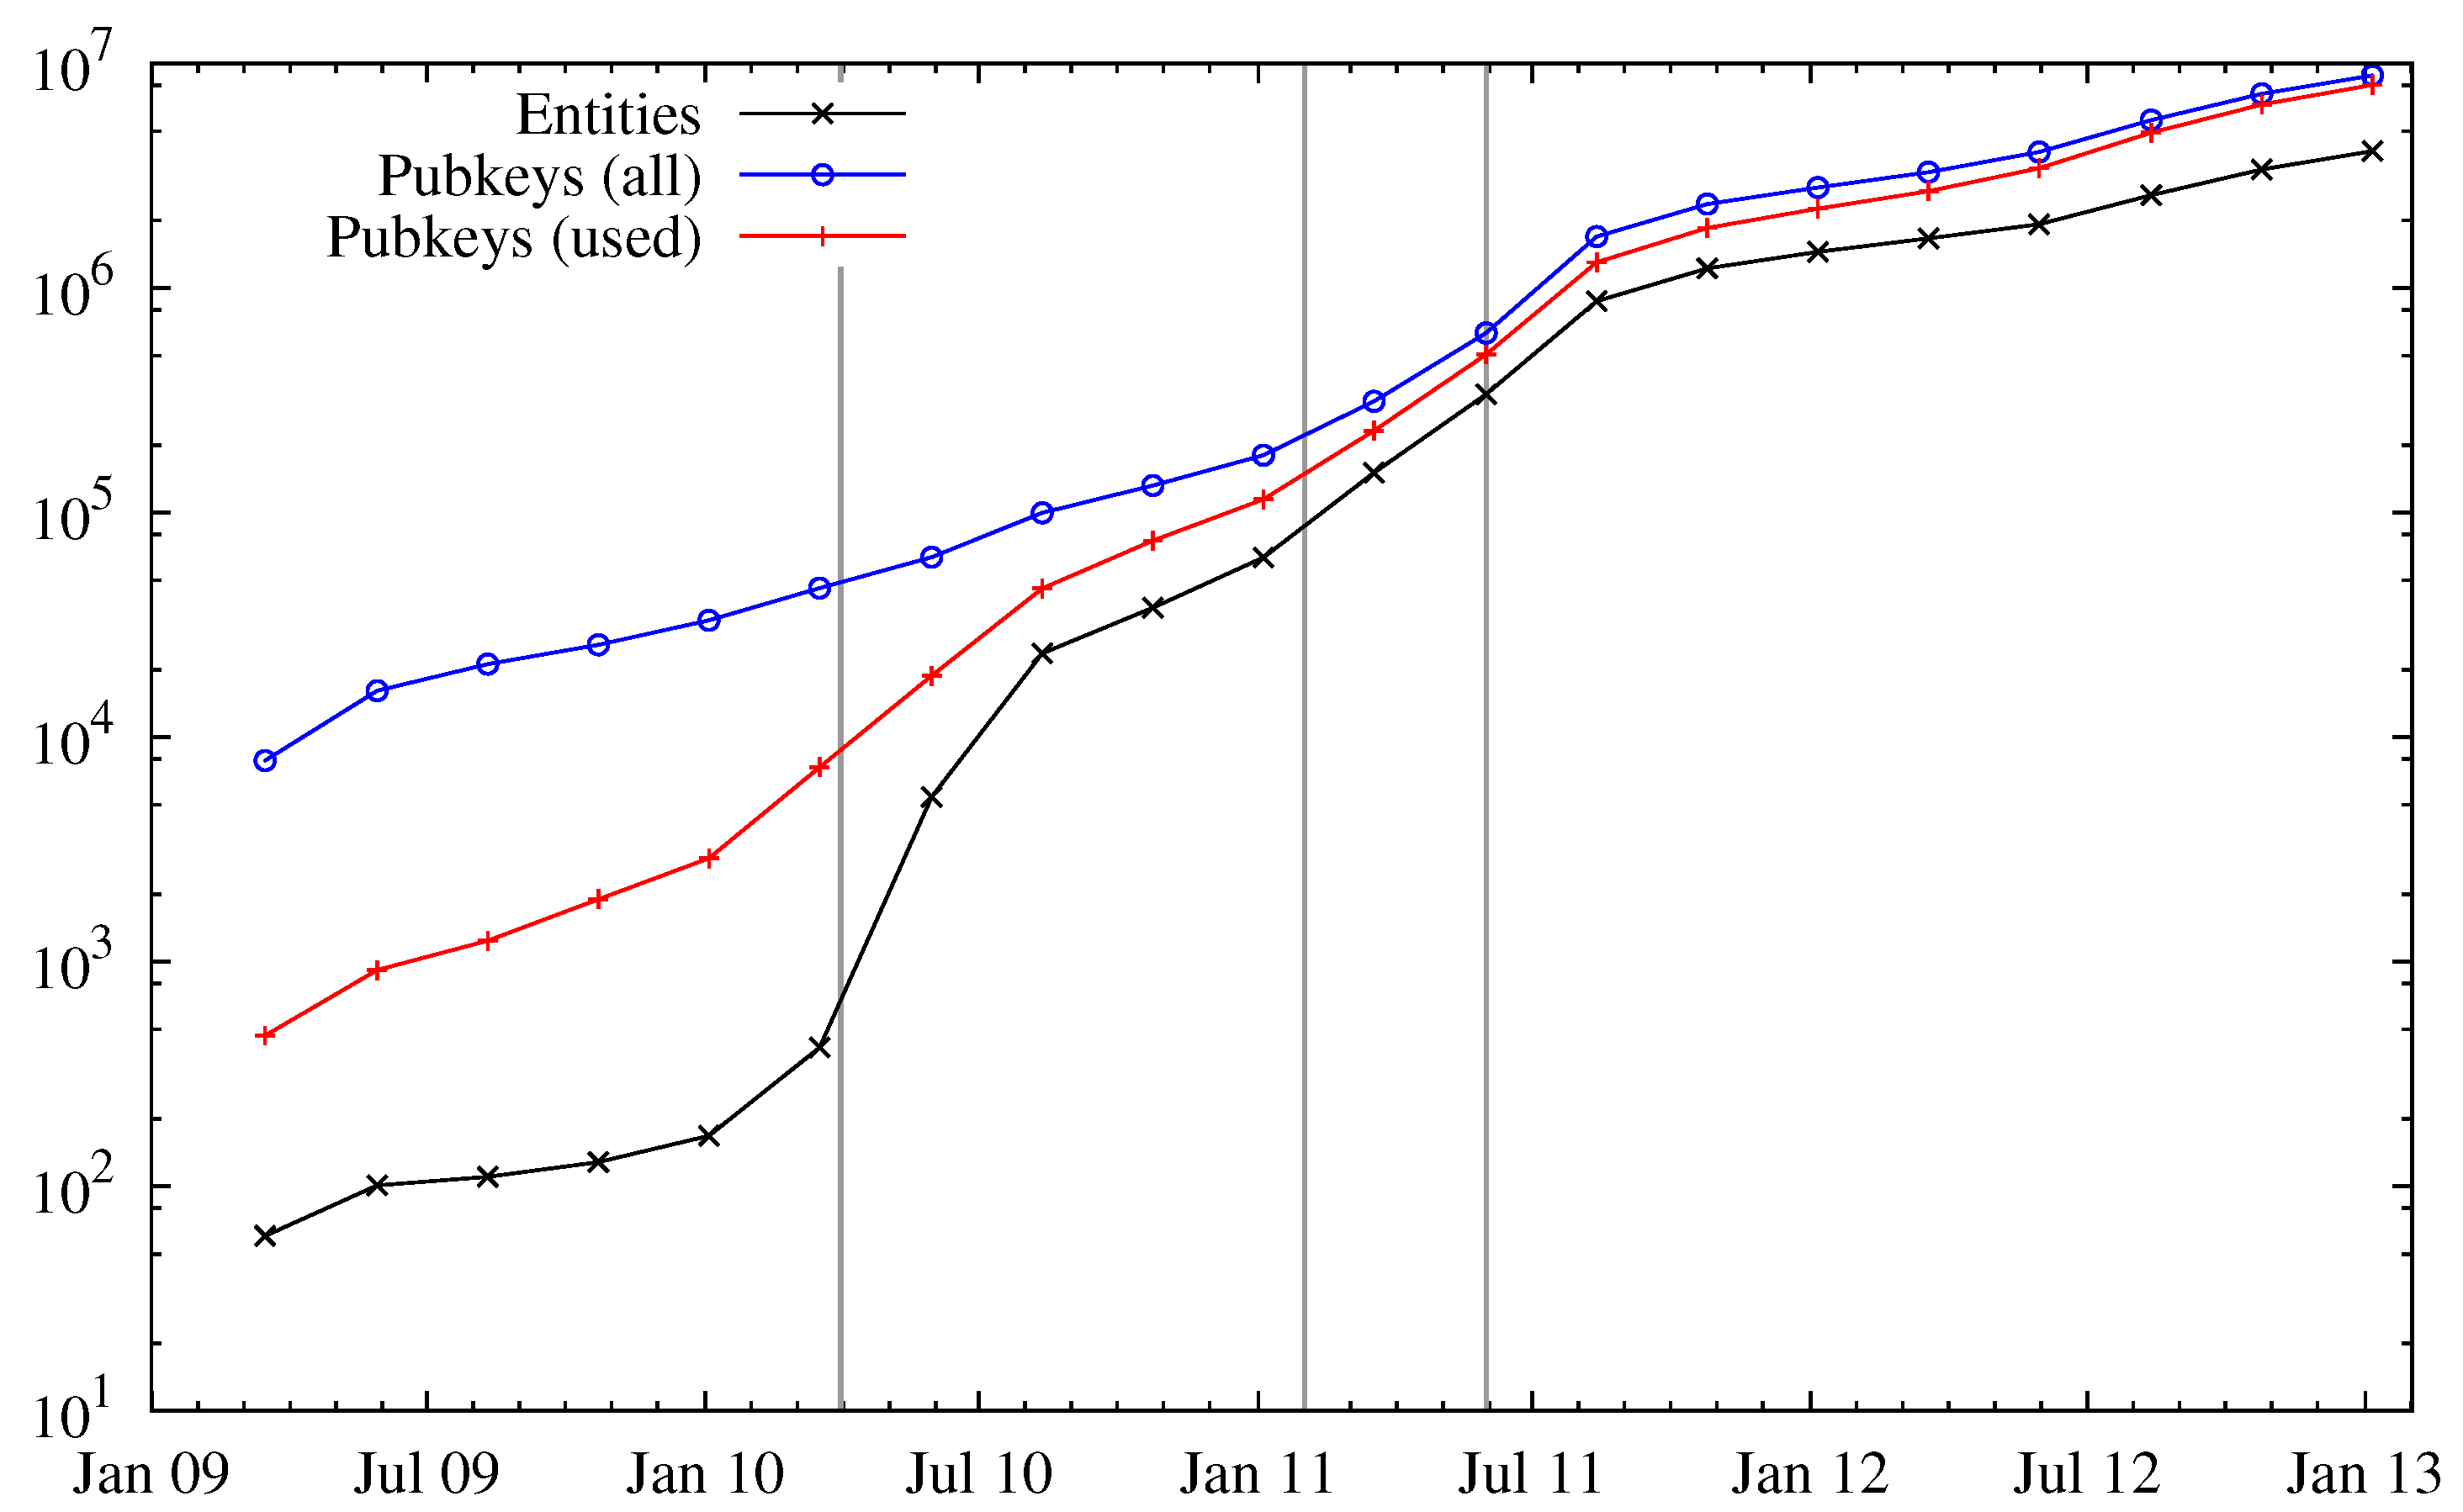
Figure 1 shows the number of public keys, used public keys, and entities over time. We can see a huge increase in the number of entities in April 2010. The reason for the increased interest in Bitcoin is most likely the fact that around this time (late April 2010) public trading of bitcoins began at an exchange rate of 0.003 USD per one bitcoin (in batches of 1000) [
9]. More publications on Slashdot [
10] (for “reaching dollar parity”), Forbes [
11] and Gawker [
12] have created further interest in Bitcoin, which can be seen by a fast-increasing number of entities. After all, a hype was created and found its peak in June/July 2011, where the exchange rate reached about 30 USD. After the latter article, the exchange rate dropped below 2 USD. Despite this bubble, Bitcoin was still popular enough that a sustainable user base exists and still new users are recruited. The ratio of public keys (used or unused) to the number of entities seems to be stationary at a factor of about two, which means on average two public keys can be assigned to one entity solely based on the Bitcoin block chain.
Figure 1.
Number of all public keys, used public keys and entities. The three vertical gray bars indicate three important events in the history of Bitcoin: start of public trading (leftmost), a post on Slashdot (middle) and an article on Gawker (rightmost).
Figure 1.
Number of all public keys, used public keys and entities. The three vertical gray bars indicate three important events in the history of Bitcoin: start of public trading (leftmost), a post on Slashdot (middle) and an article on Gawker (rightmost).
In
Figure 1 we can also observe a notable gap between the number of used and all public keys. Addresses that were only used to receive funds are probably generation transactions, which do not have any inputs. If an address appeared as an input at least once, it is considered as used. As addresses are used, they get assigned to entities.
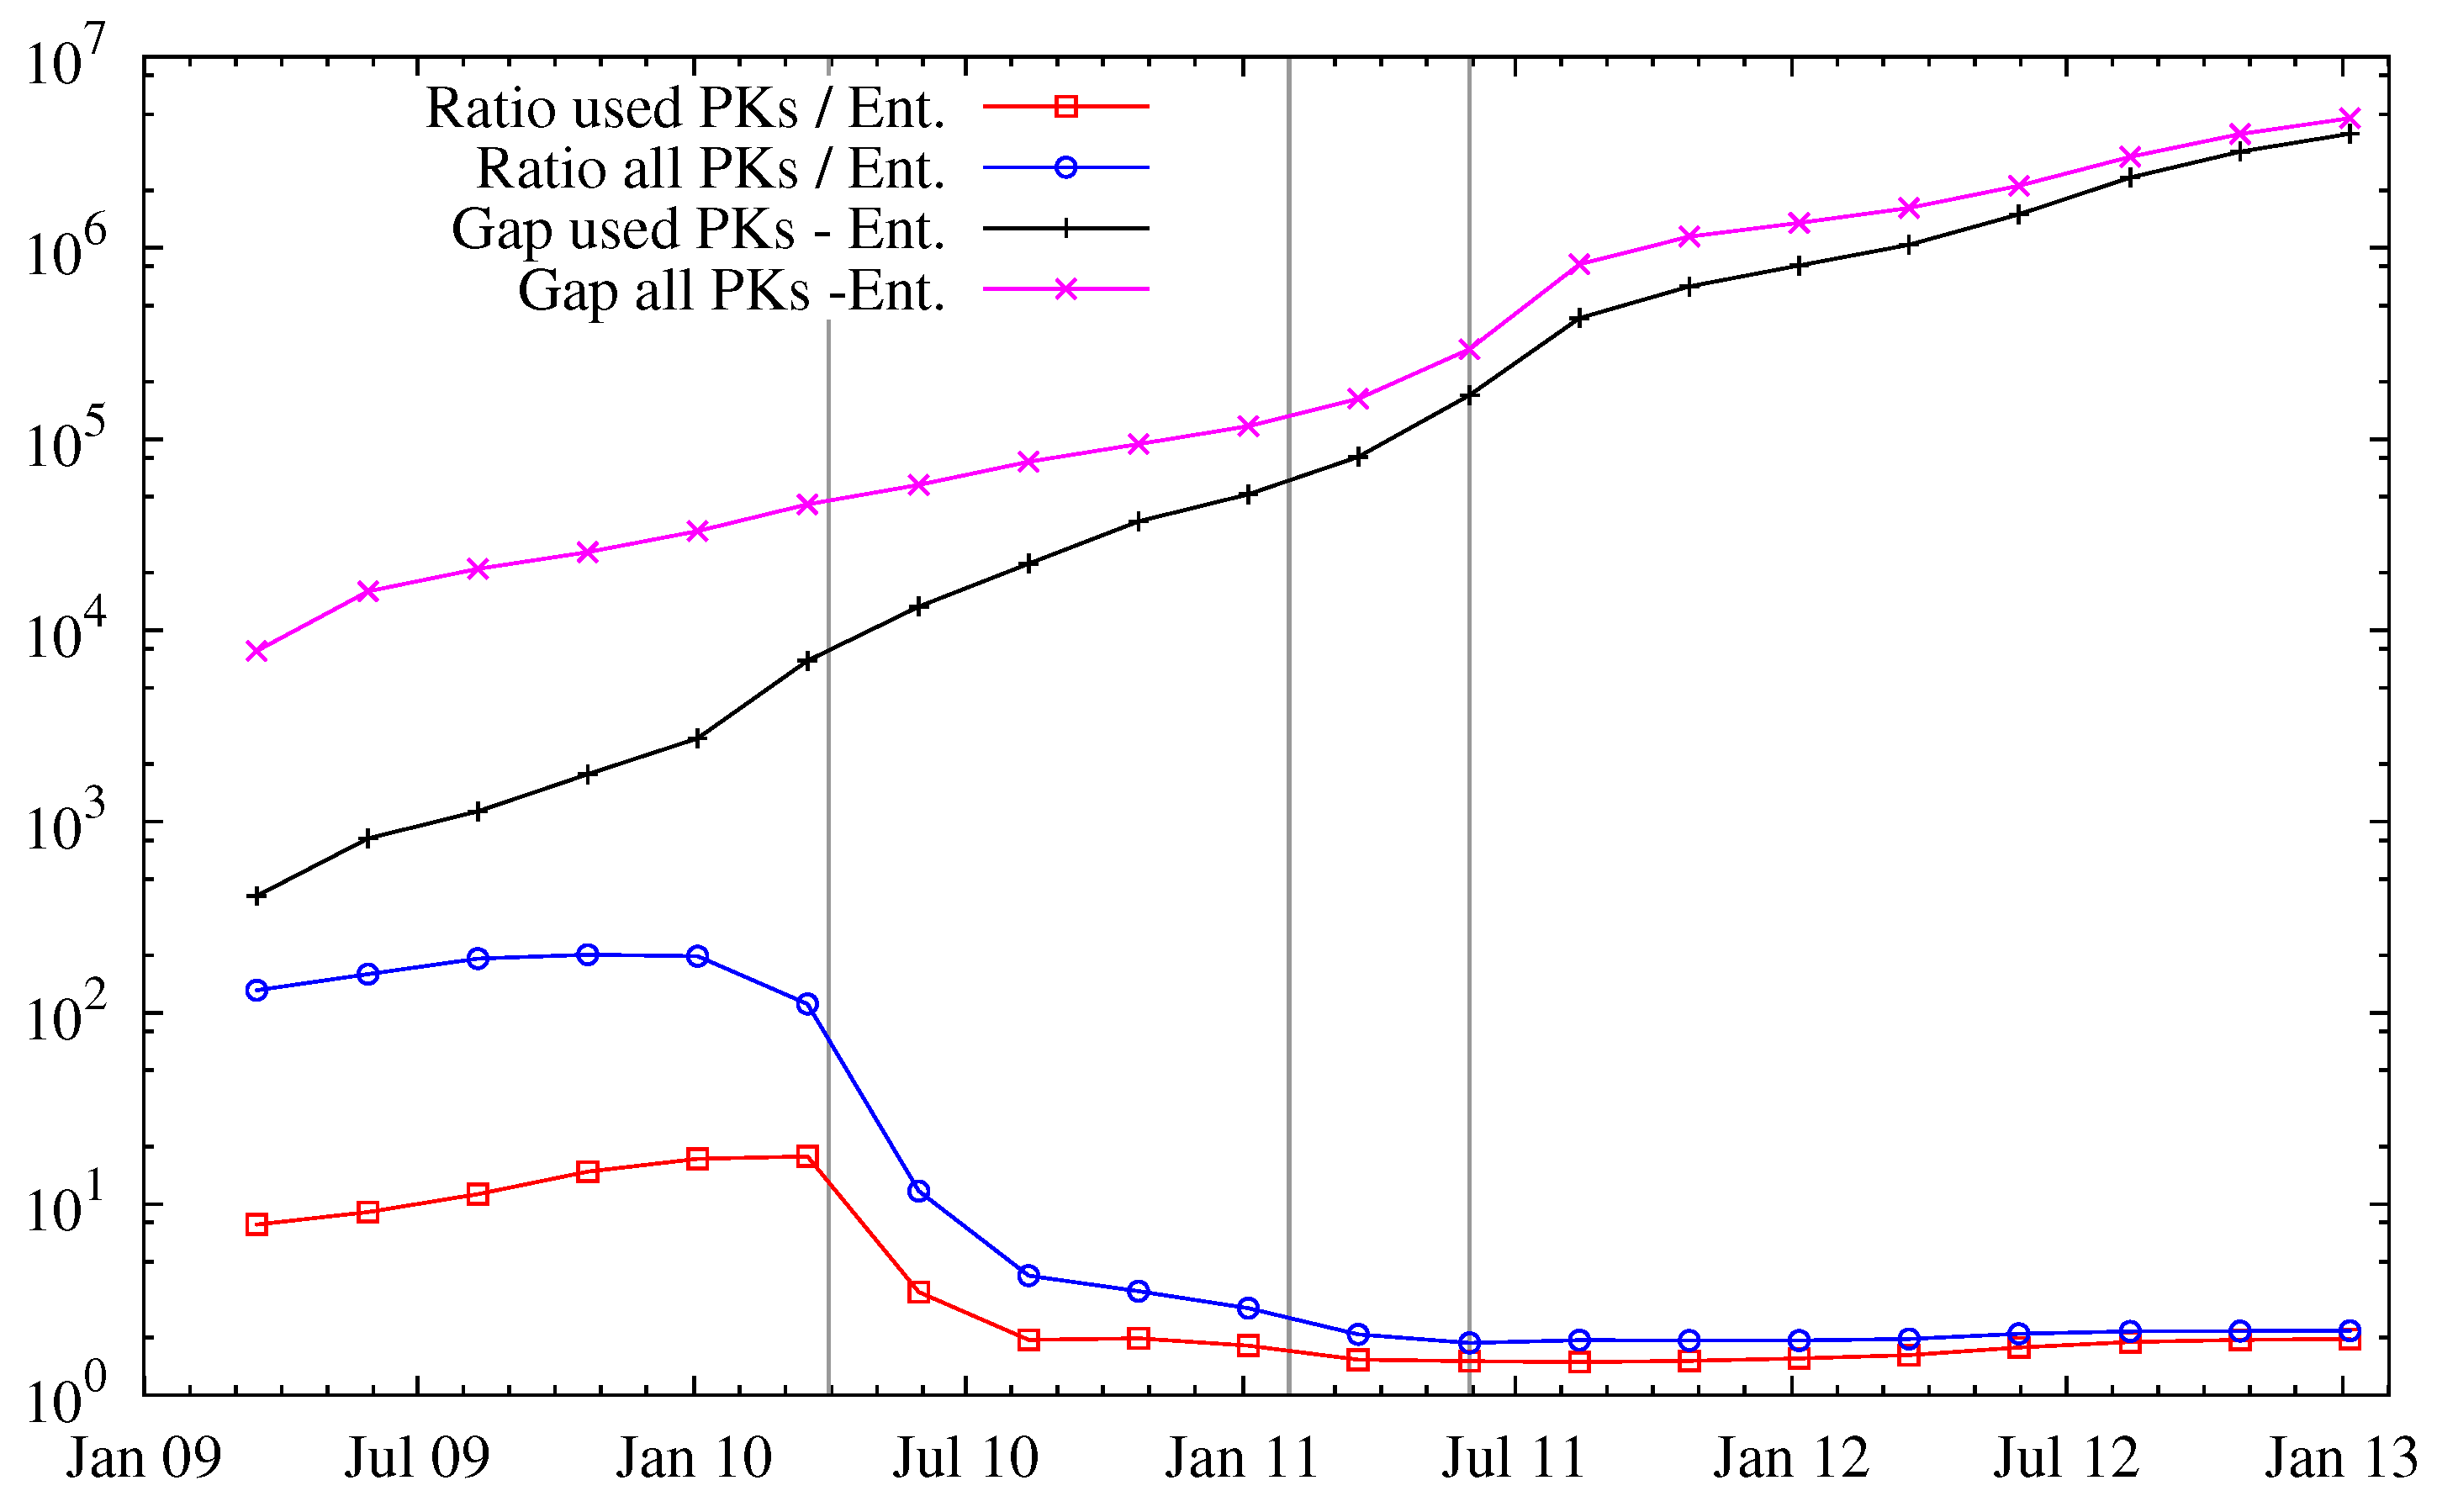
Figure 2 explores this in more detail: in particular, the ratio of public keys per entity decreases over time, but saturates to a stationary regime since Bitcoin’s popularity. We note that this does not necessarily reflect carelessness of the users, but rather could be attributed to an increased awareness of anonymity issues and thus avoidance of entity mergings.
Entities and Their Activity Periods We now investigate the size of entities—where the size of an entity is the number of public addresses that can be associated with the respective entity.
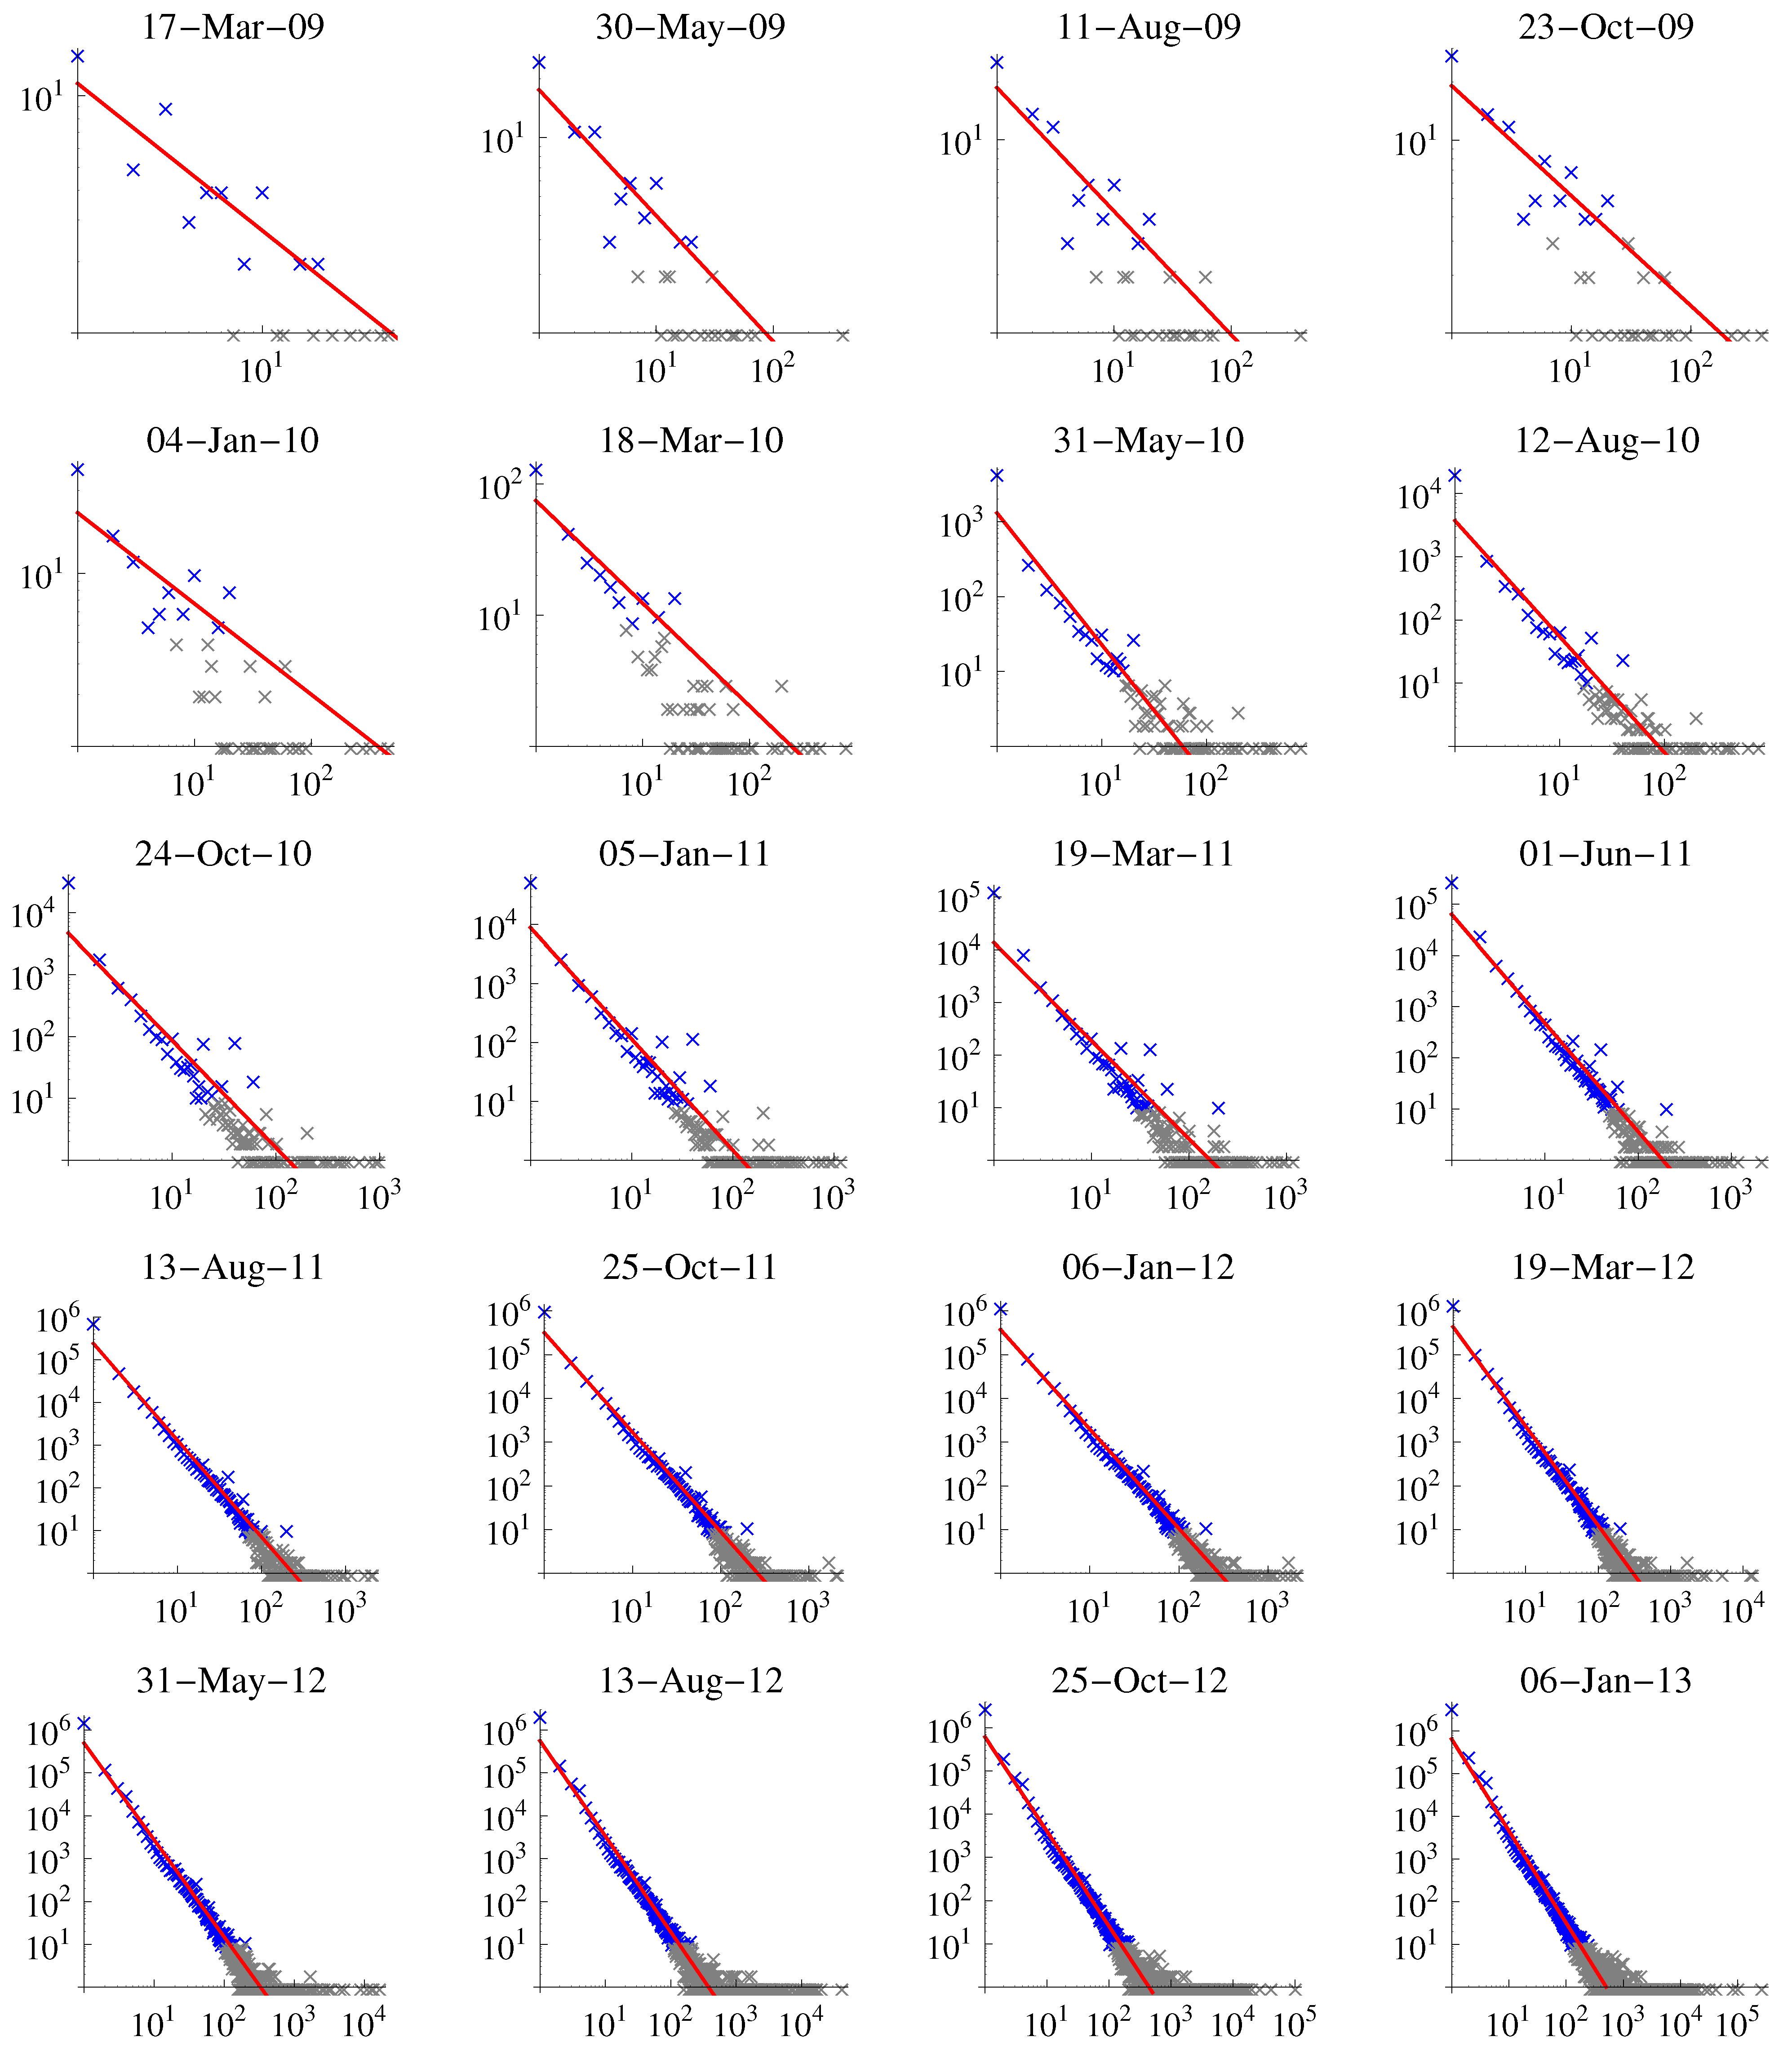
Figure 3 shows the number of entities of a given size at different times. We can observe a strong signal for an entity size of one and many outliers for very big entities with 1000 or more public keys associated. We fitted a function of type
to the data. Smaller exponents of Γ indicate a distribution of entity sizes that decreases more drastically, thus entities with many used addresses are quite infrequent. A less negative Γ, on the other hand, is related to a situation where a noticeable number of large entities exists. In general, the more negative Γ the better: more indistinguishable entities result in a larger anonymity set for the Bitcoin network.
Figure 2.
Gap (difference) and ratio between known public keys and entities. See
Figure 1 for the vertical bars.
Figure 2.
Gap (difference) and ratio between known public keys and entities. See
Figure 1 for the vertical bars.
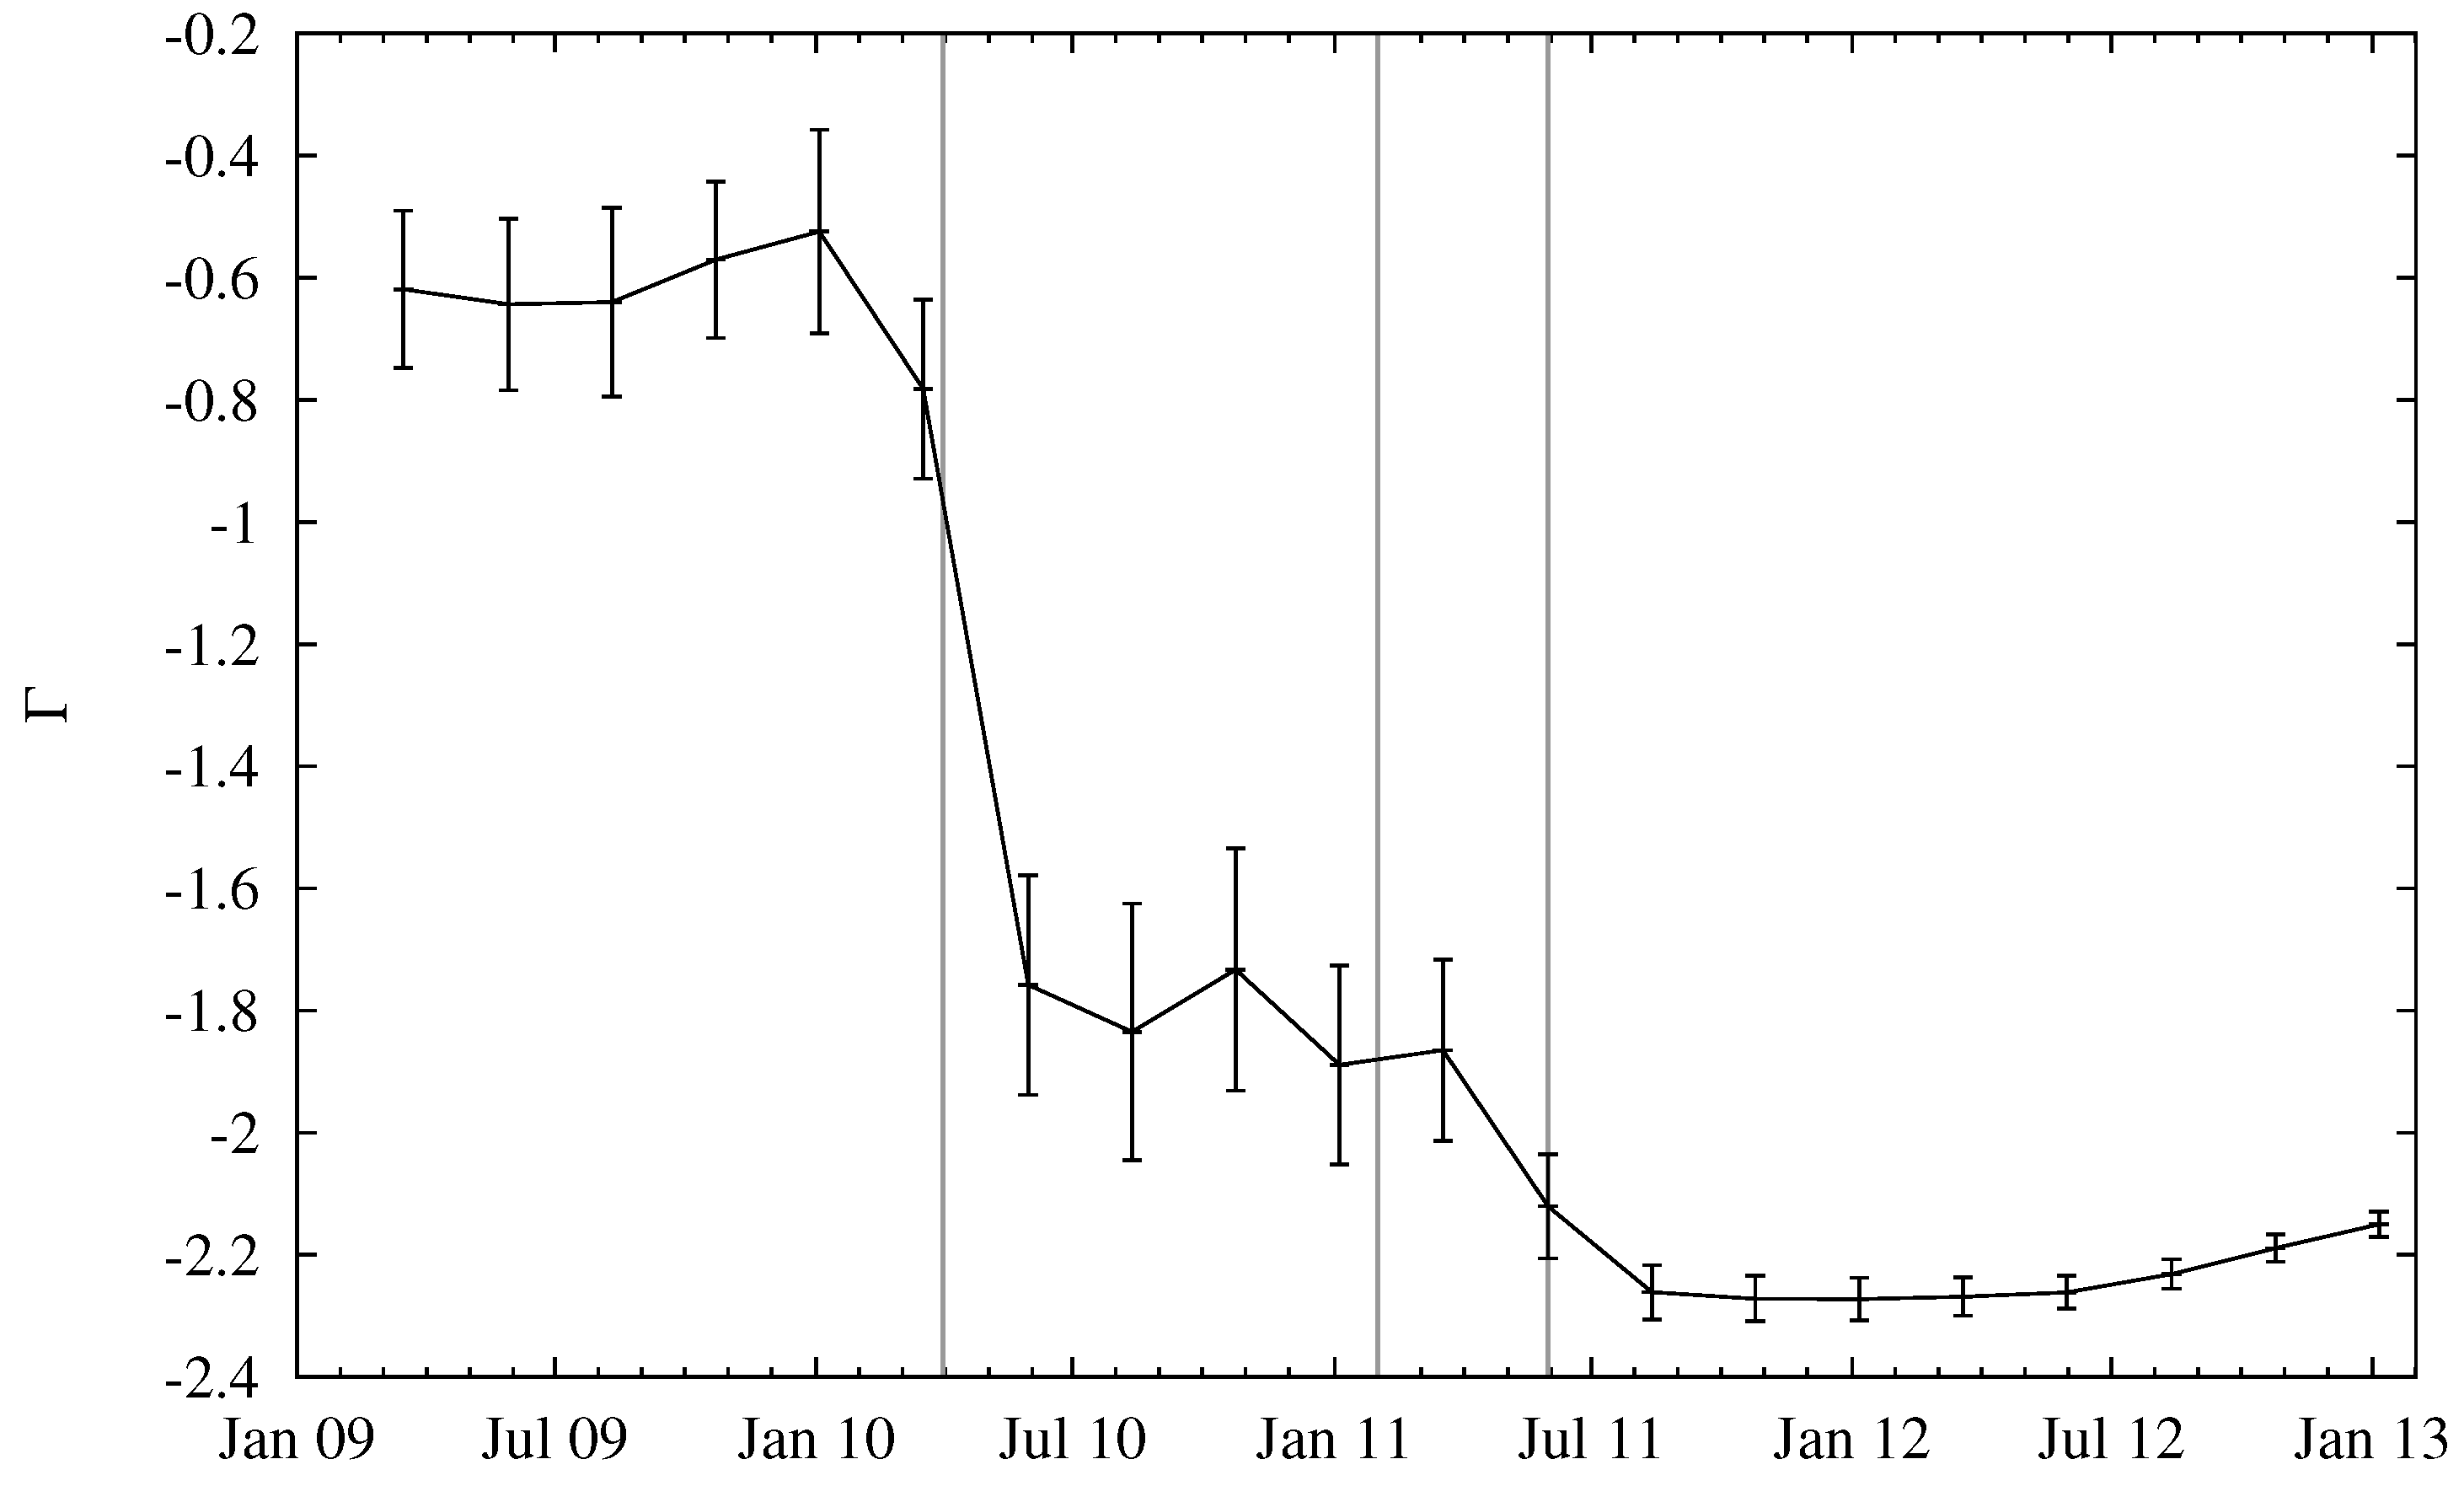
Figure 4 depicts the fitted slope Γ as a function of time. For later dates, the slope saturates, indicating that the distribution of entity sizes might have become stationary.
The number of active entities in Bitcoin has a large impact on the practical privacy single users can achieve. While the overall number of entities gives a rough bound on the level of k-anonymity of Bitcoin, some of the entities may be active for only a short period of time; for example, some Bitcoin users may try the new currency but then abandon its use—nevertheless, the transactions issued by these users resulted in entities visible in the block chain. A better estimate of the k-anonymity of Bitcoin at a certain point in history is this the number of economic entities that were active in a window of time around this point (assuming that all other entities are “dormant” and thus do not increase the level of anonymity).
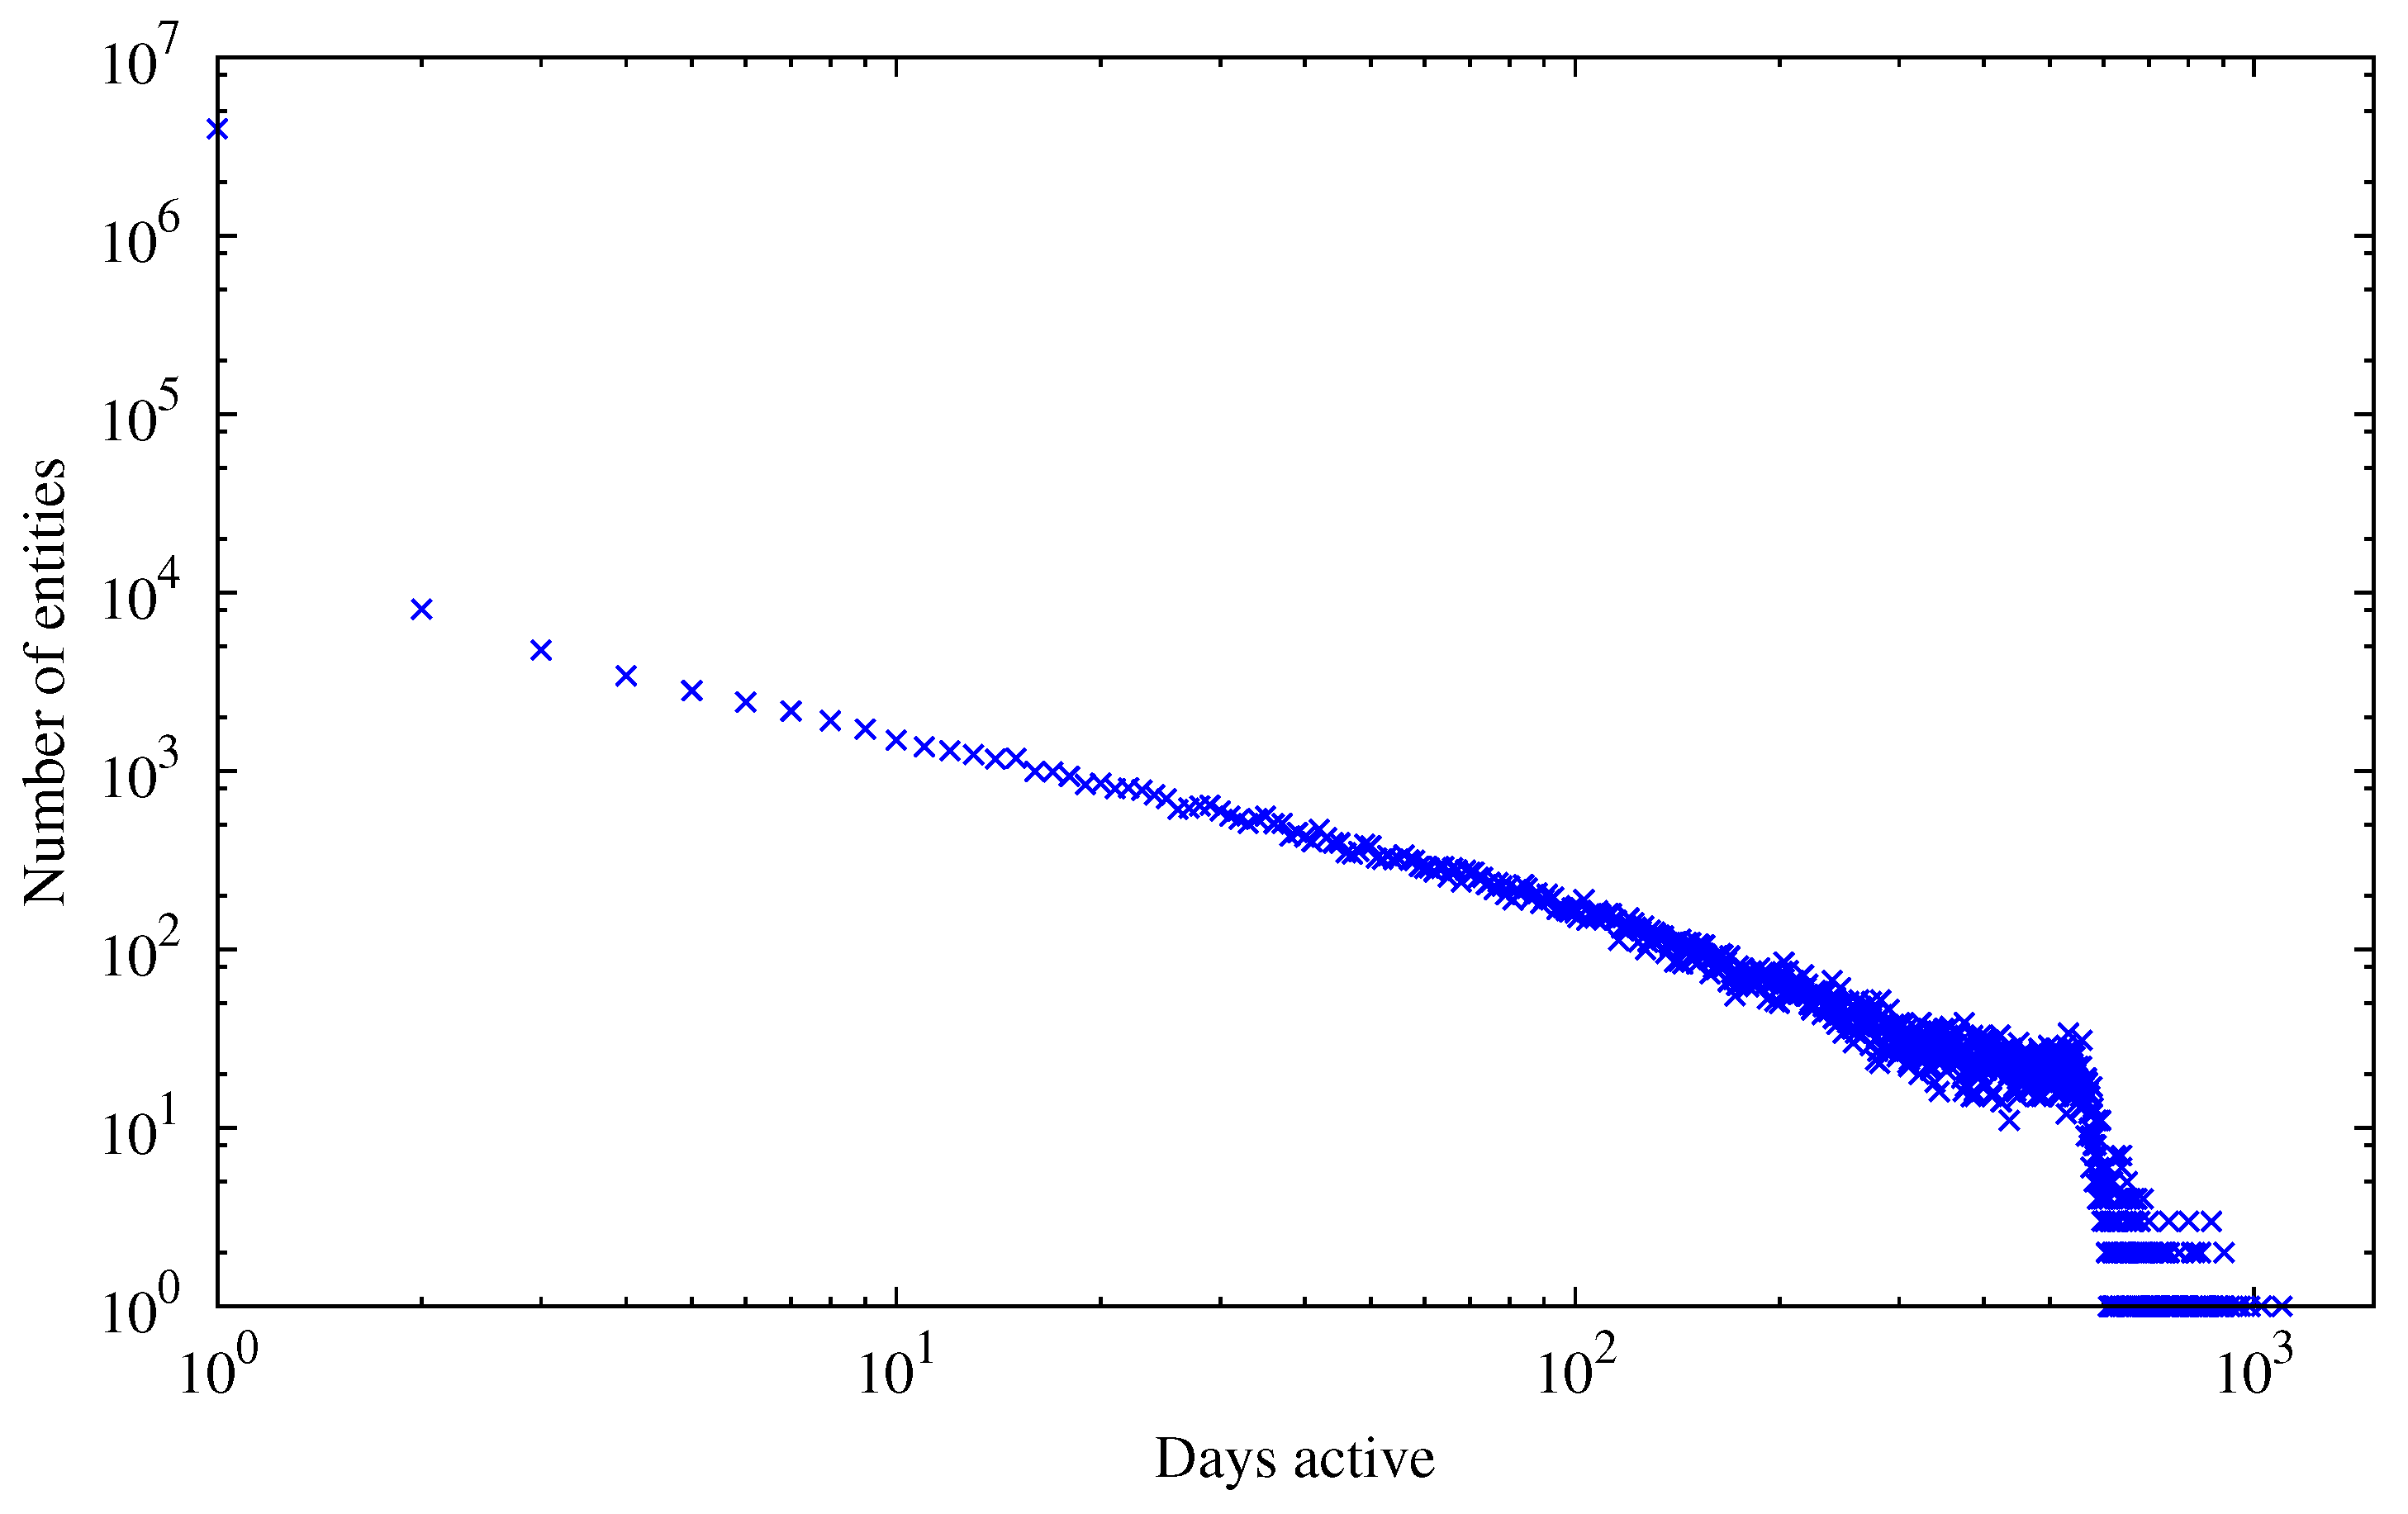
When looking at the distribution of the total number of entities active for a given time (depicted in
Figure 5), we can see a scale-free distribution of the number of entities as a function of active days, analogous to Equation
1. We define the activity period of an entity as the difference (in days) between the first and the last transaction in the block chain that involved any of the public keys of the entity. As evident from the figure, there are many entities that are active for only one day and many single entities that are active for a very long period of time.
For maximizing both the anonymity set of Bitcoin and the unlinkability of transactions, an entity that is observable by an adversary by inspecting the Bitcoin block chain should be as small as possible (best case: single address, increasing the anonymity set) and only active for a short time (best case: single transaction, limiting transaction linkability). There can be numerous reasons why this is not achievable in practice. First of all, addresses belonging to known public entities like mining pools are of course active for a very long time and it would not be of much use to obfuscate those addresses. On the other hand, a user mining on a pool with the same payout address all the time or some entity accepting donations on a single address will weaken the privacy of those entities. Even though the Satoshi Bitcoin client generates a new address for remaining change—which should strengthen privacy—as the user still receives funds on the old/original address, both addresses are likely to be used as inputs in some future transaction the users makes, which then again allows a connection between the addresses to be made.
Figure 3.
Number of entities (y-axis) vs. size (x-axis). Depicted in blue are data points and in red the fit to the blue points; gray values indicate data points ignored in the fit due to small sample size.
Figure 3.
Number of entities (y-axis) vs. size (x-axis). Depicted in blue are data points and in red the fit to the blue points; gray values indicate data points ignored in the fit due to small sample size.
Figure 4.
Slope of regression line Γ for entity-size distribution over time. Error bars indicate goodness-of-fit, computed as the root of summed squared residuals between data and a fitted linear model.
Figure 4.
Slope of regression line Γ for entity-size distribution over time. Error bars indicate goodness-of-fit, computed as the root of summed squared residuals between data and a fitted linear model.
Figure 5.
Total number of entities active for a given amount of days.
Figure 5.
Total number of entities active for a given amount of days.
To quantify the activity on the Bitcoin network,
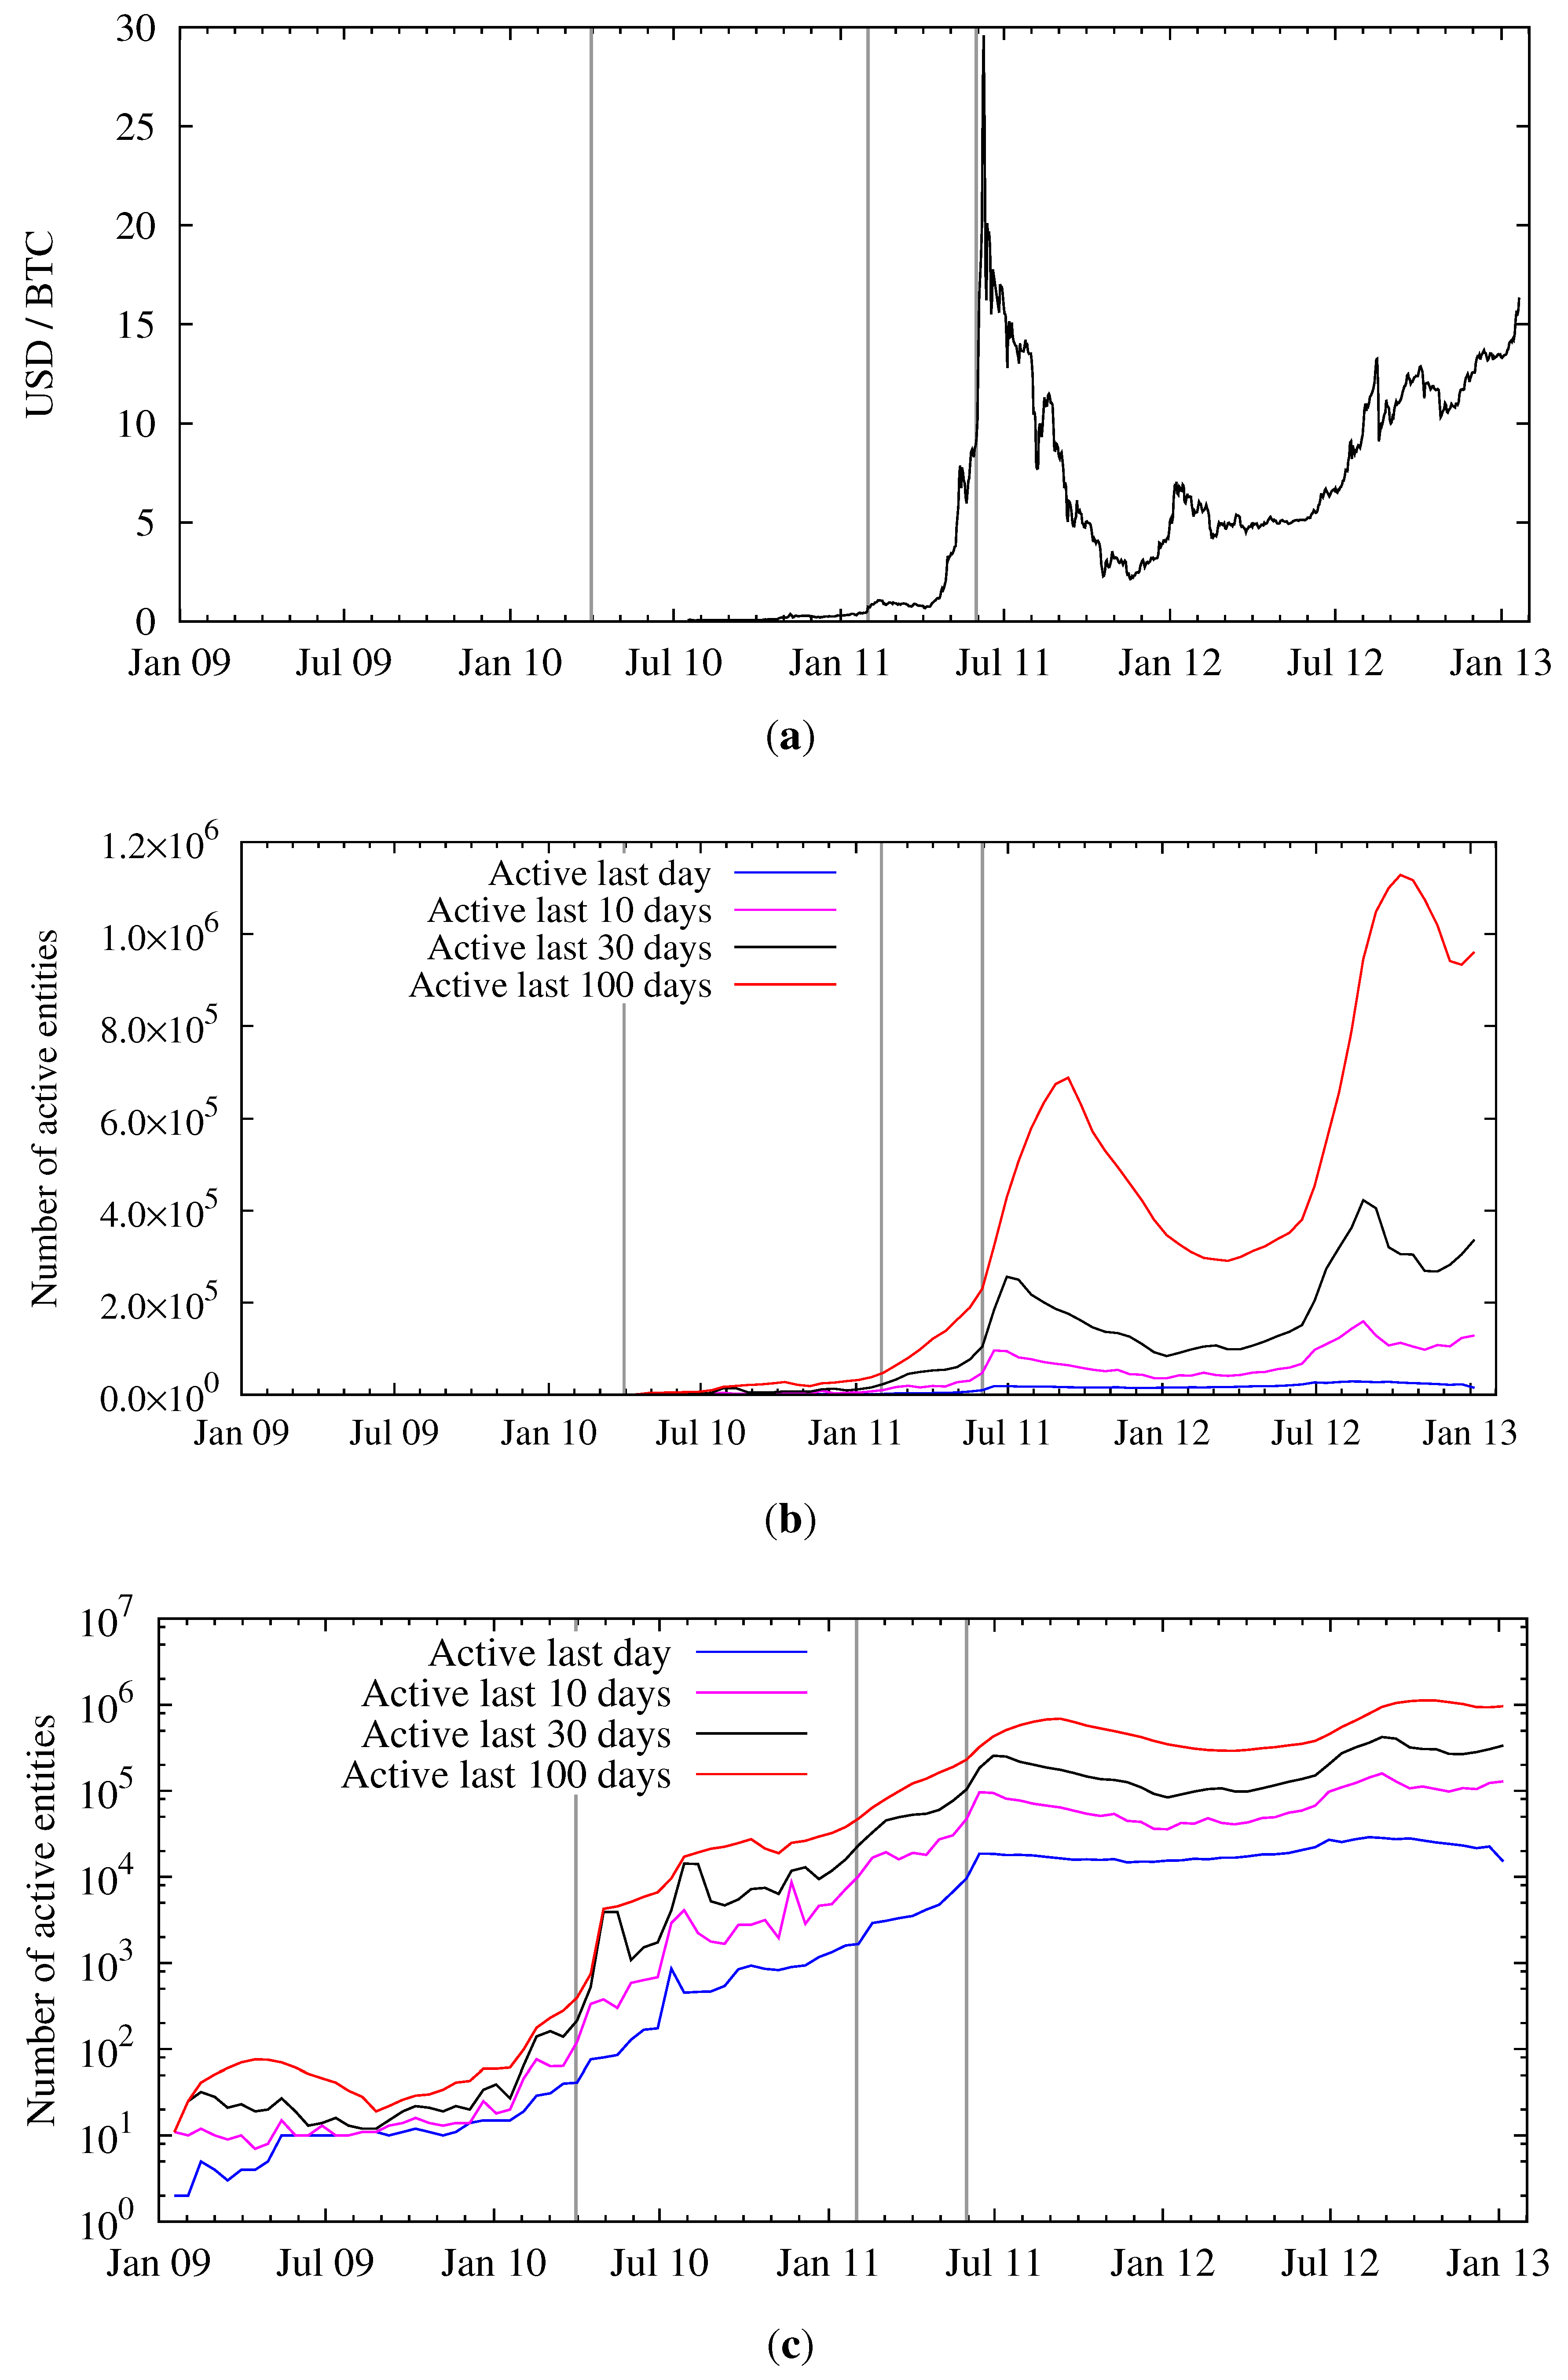
Figure 6b,c shows (over time) the number of entities that were active within the last day, and within the last 10, 30, and 100 days. Both plots show the same data, one with a linear and one with a logarithmic
y-axis. We also show the exchange rate between USD and bitcoins in
Figure 6a.
Comparing
Figure 1 and
Figure 6c, one can conclude that the number of active entities can be several orders of magnitude lower than the total number of entities. This needs to be taken into account when estimating the size of the anonymity set of Bitcoin by computing the number of active economic entities. For example, reducing the activity period from 100 days to just one day reduces the size of the Bitcoin anonymity set by a factor of 32 (averaged over the last year).
Figure 6.
Price per bitcoin and activity of entities over time. (
a) Exchange rate in USD at Mt. Gox (weighted average) [
14]; (
b) Entity activity over time (linear scale); (
c) Entity activity over time (logarithmic scale).
Figure 6.
Price per bitcoin and activity of entities over time. (
a) Exchange rate in USD at Mt. Gox (weighted average) [
14]; (
b) Entity activity over time (linear scale); (
c) Entity activity over time (logarithmic scale).
Furthermore, as evident from
Figure 6c, since Bitcoin’s nascent days the ratio between the number of active entities for various time scales is constant. Therefore, the overall pattern of usage has become stationary and the above argument on the reduction of the anonymity set will likely hold for the future.
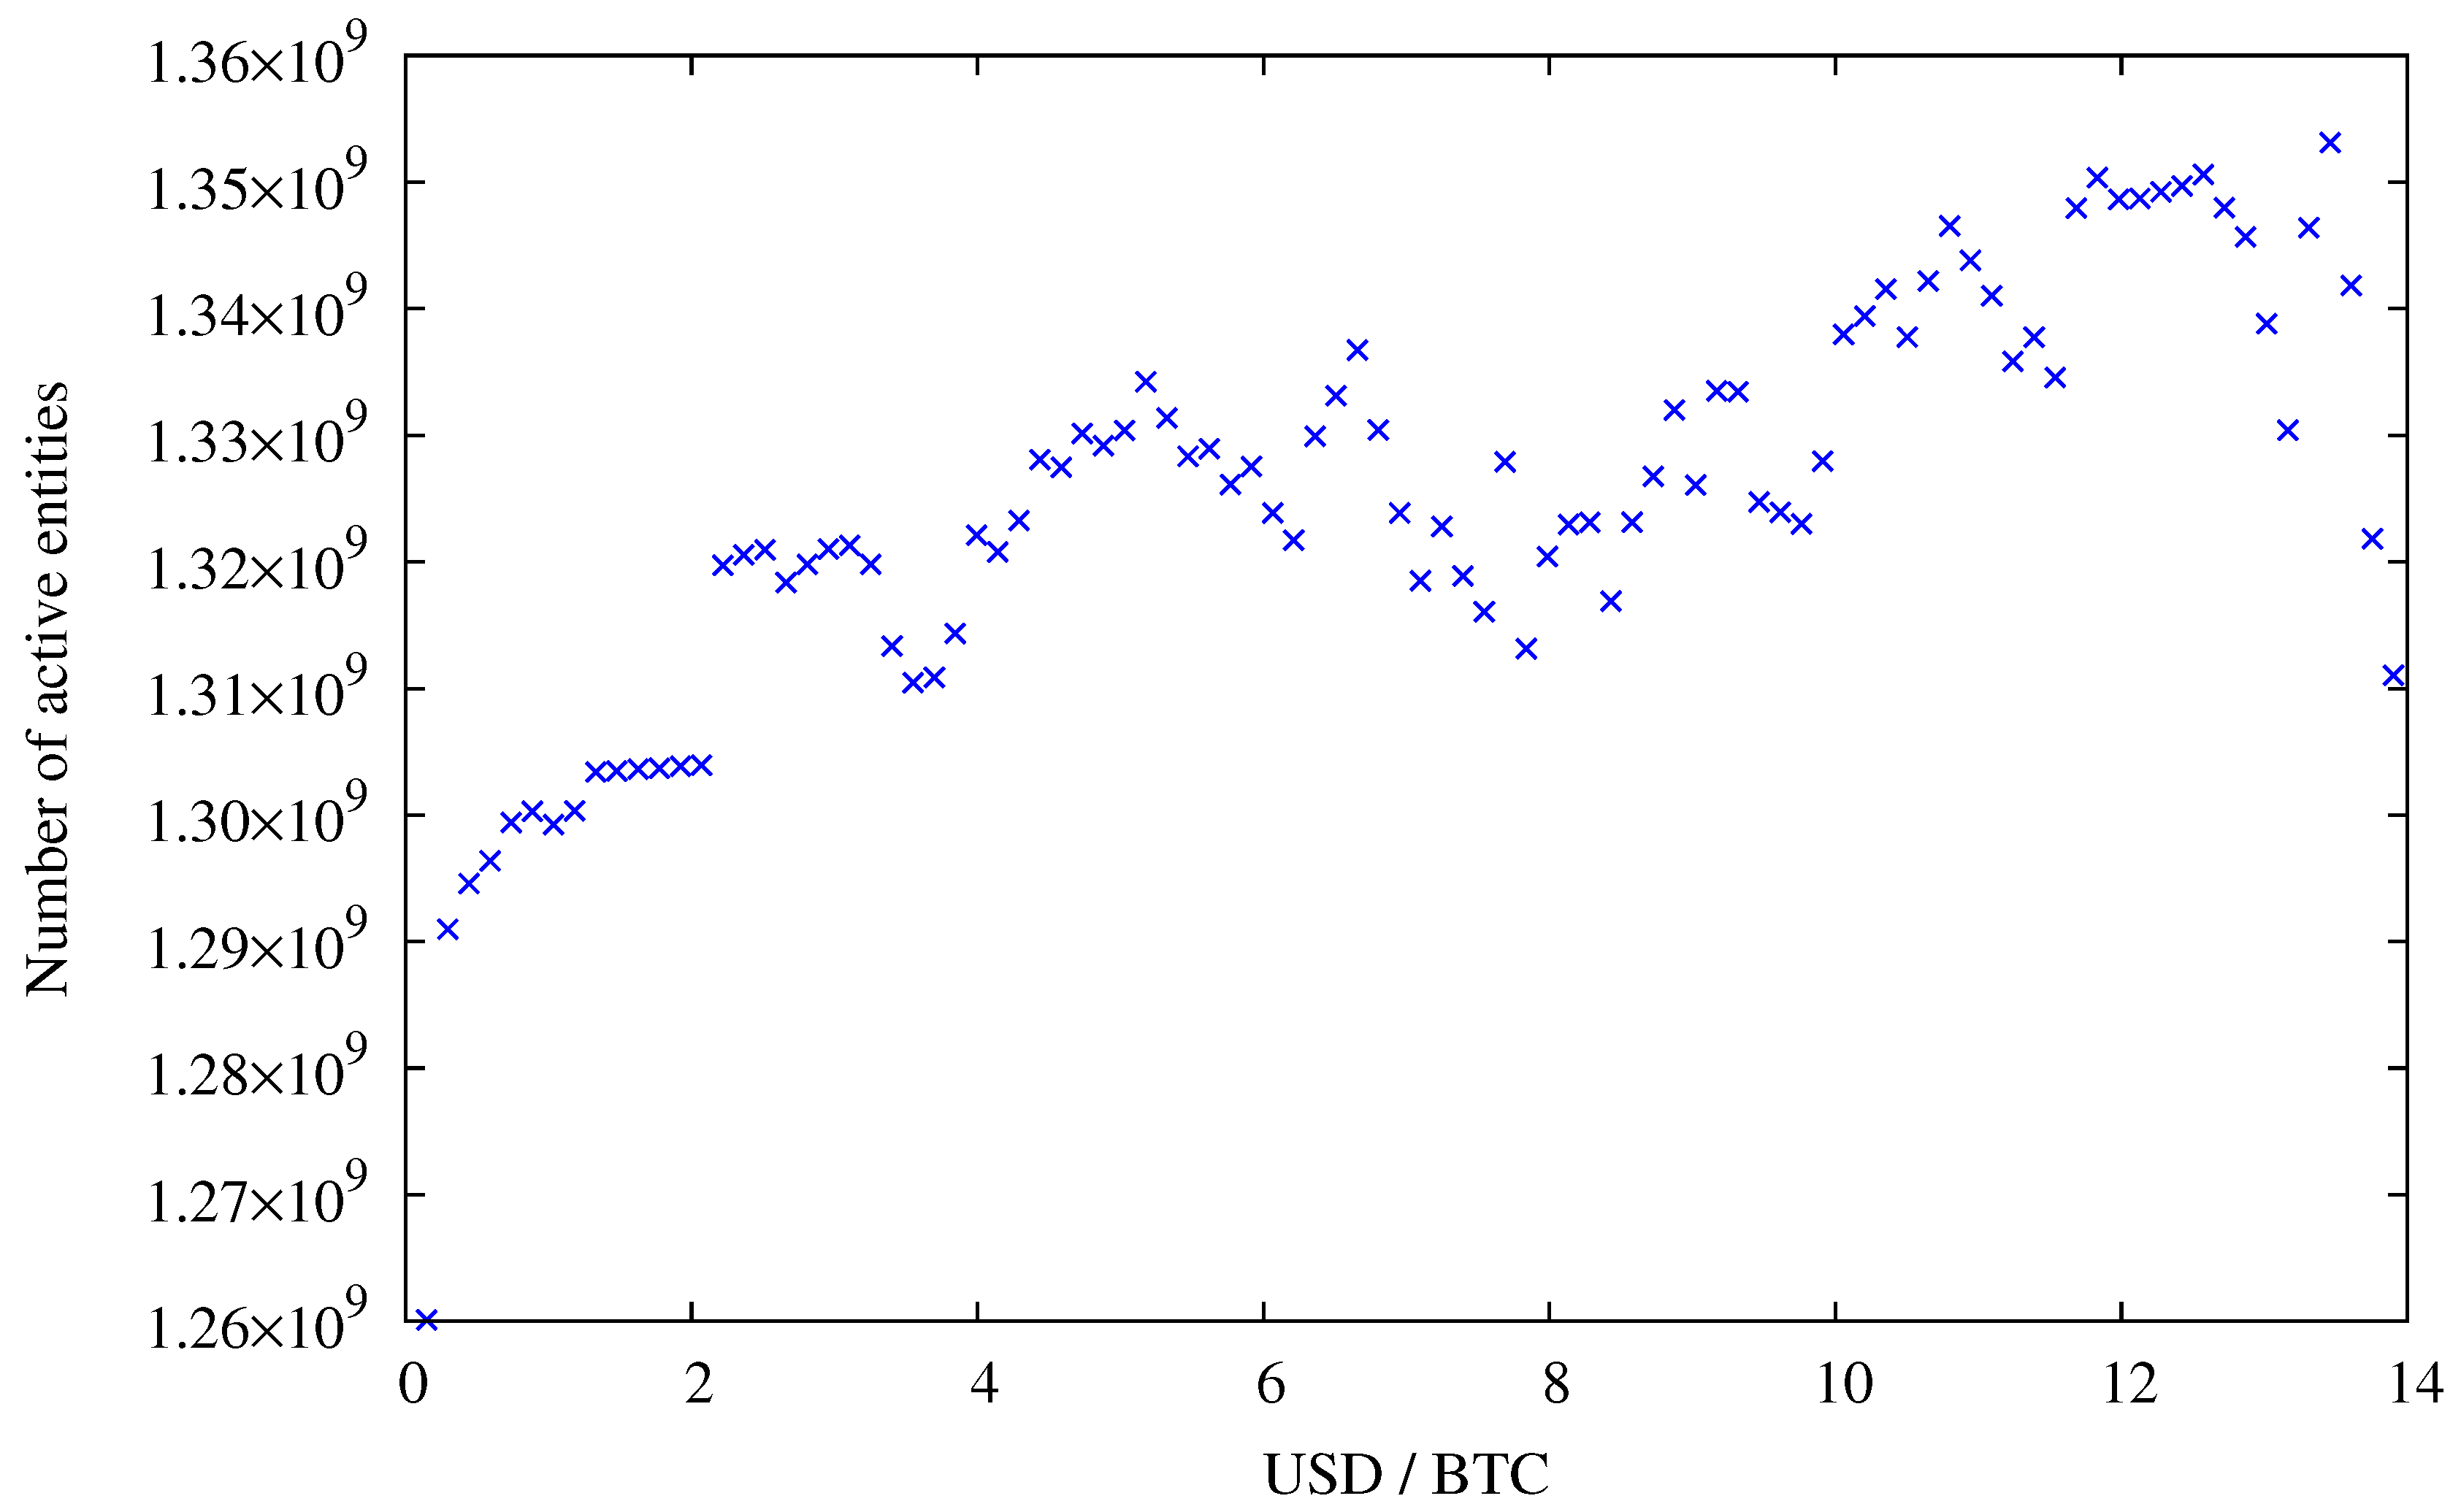
In contrast—until the end of July 2011—we observe a strong correlation between the number of active entities and the exchange rate, see
Figure 7. Since then, the exchange started to slowly rise again, now hovering at around 10 to 15 USD, whereas the activity on the network surpasses the peak activity during the hype in June 2011. Typically a higher exchange rate is explained by speculation and not pure monetary usage, which implies that speculation is good for anonymity.
Figure 7.
Price per bitcoin and active entities. Data points for exchange rates above 14 USD were omitted because for higher exchange rates not enough data points are available (see
Figure 6a),
i.e., an exchange rate of 14 USD or more was reached for 52 days only.
Figure 7.
Price per bitcoin and active entities. Data points for exchange rates above 14 USD were omitted because for higher exchange rates not enough data points are available (see
Figure 6a),
i.e., an exchange rate of 14 USD or more was reached for 52 days only.
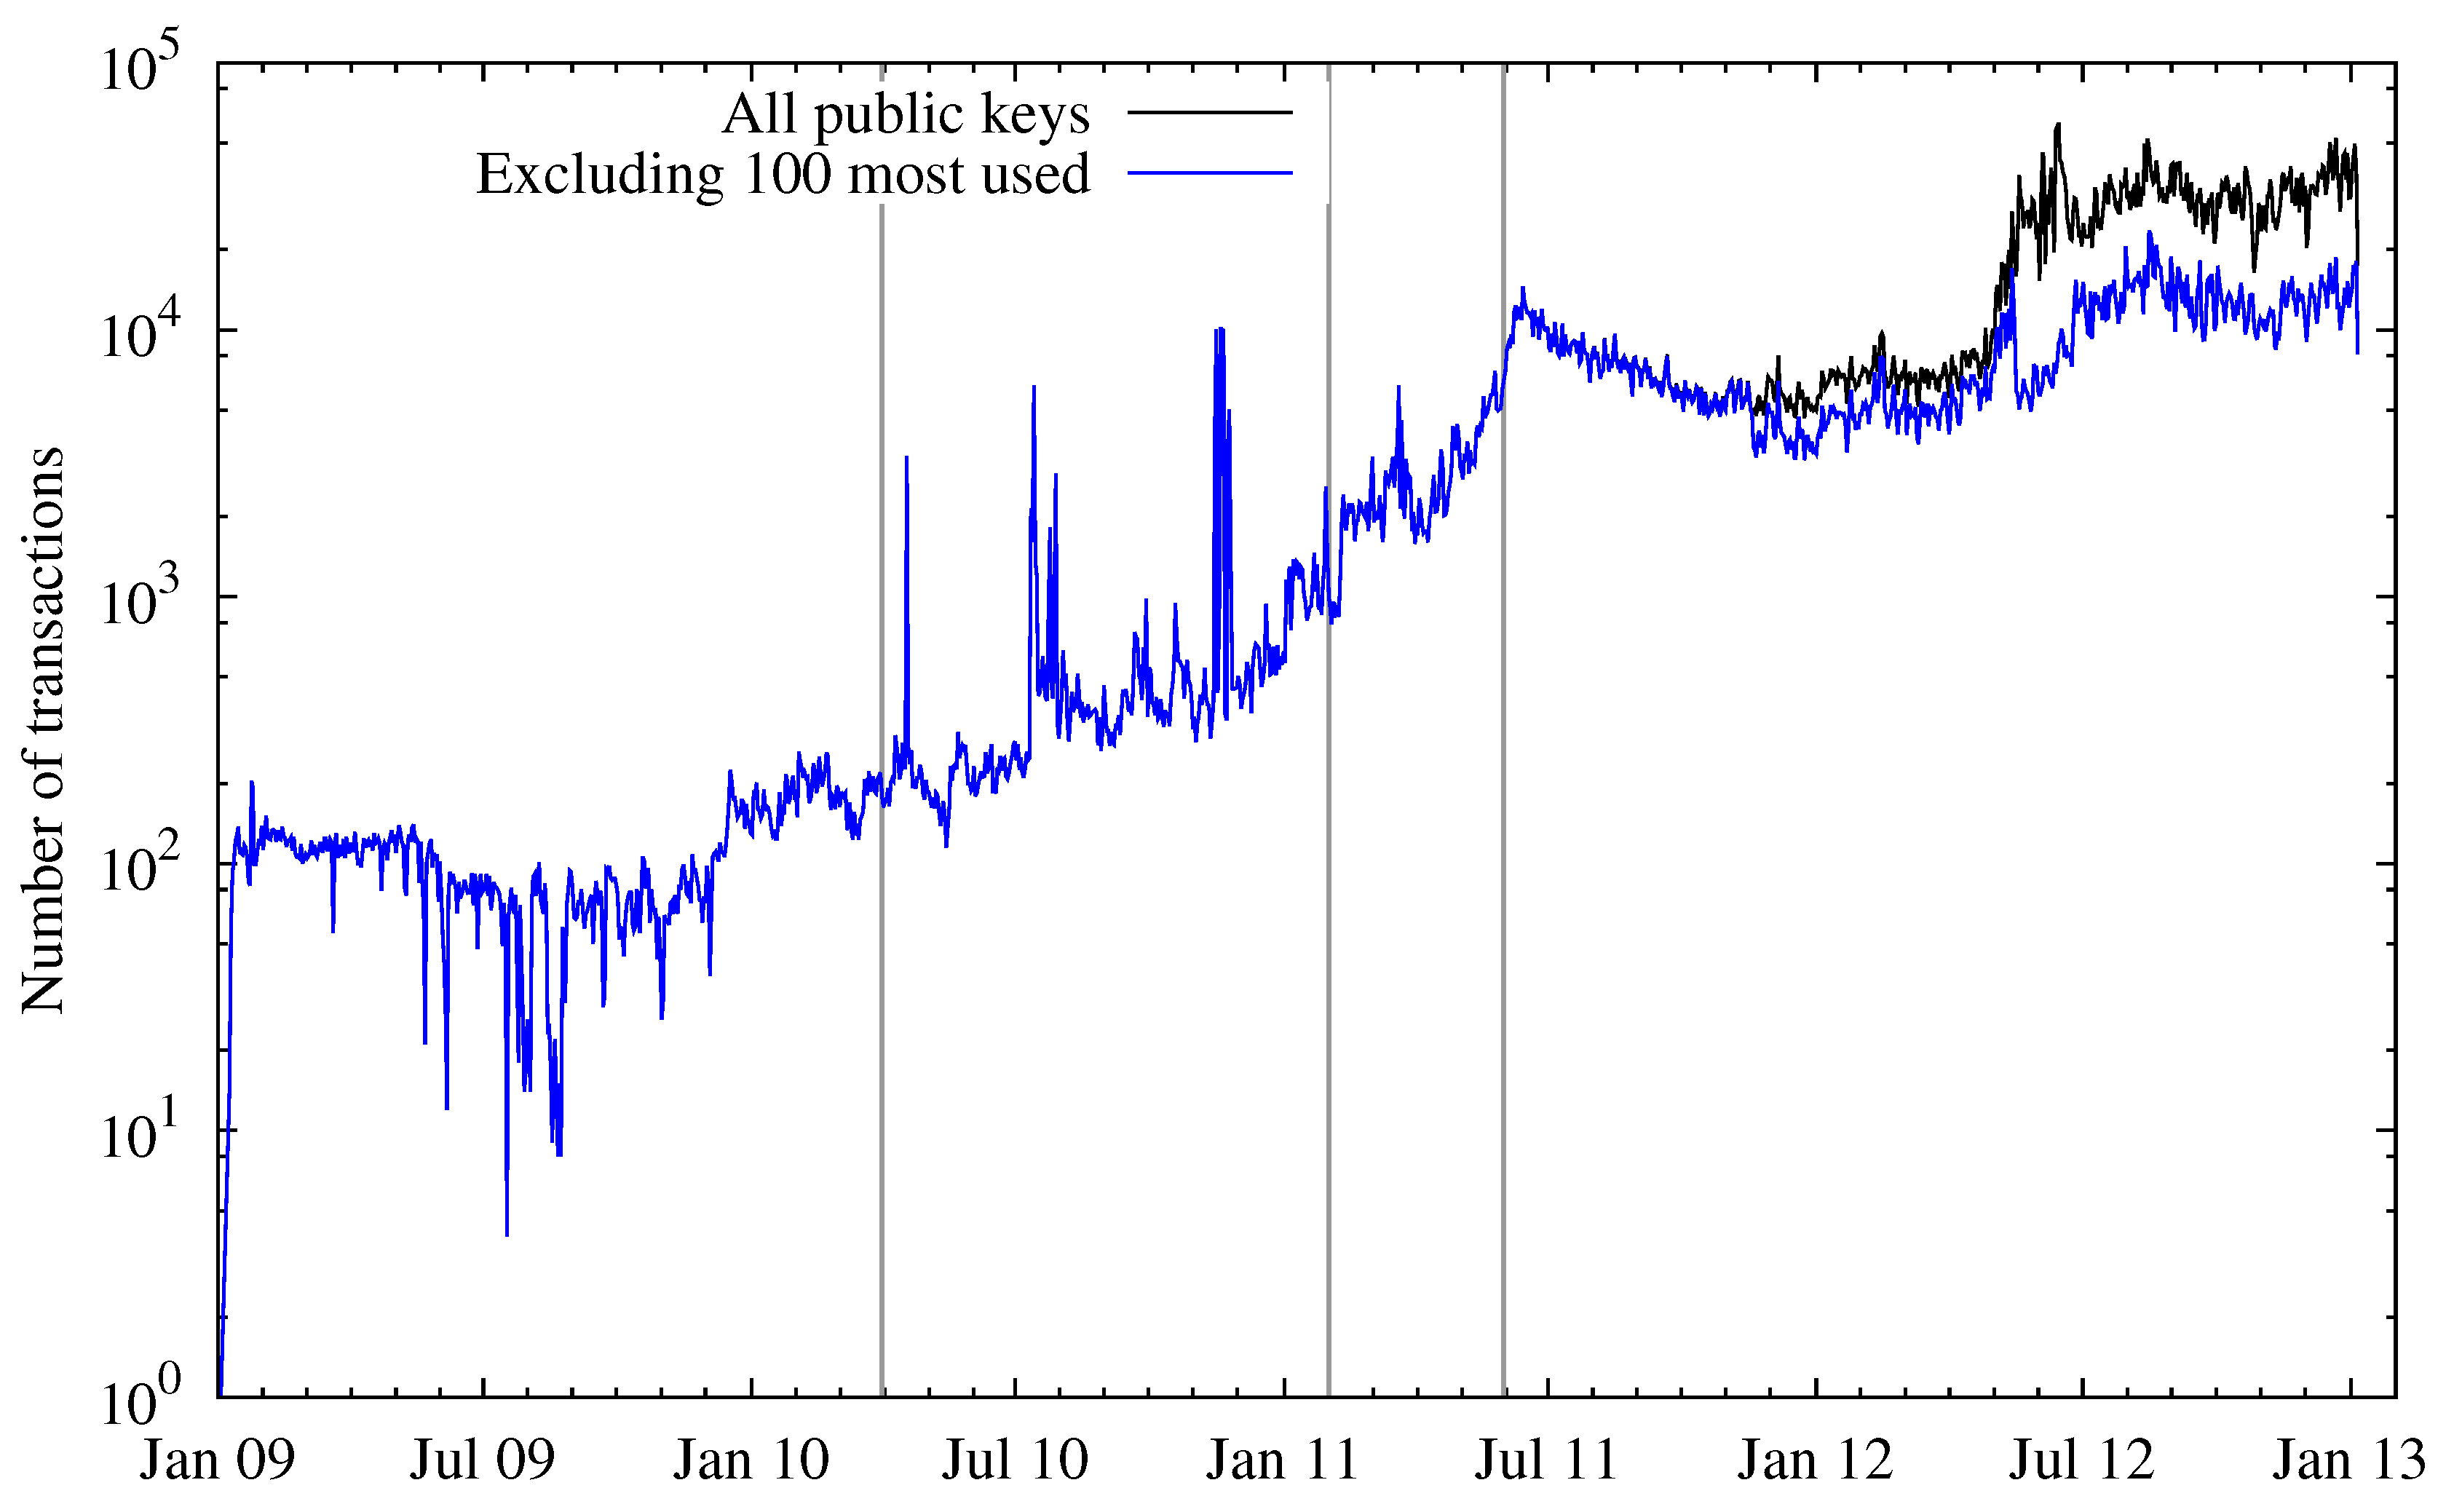
Looking at the number of transactions over time (depicted in
Figure 8), this observation can be confirmed. During the Bitcoin hype the number of transactions peaked and then fell again. After this incident, the number of transactions surpassed the pre-hype level, which is consistent with the number of active entities. Besides the total number of transactions, the figure also depicts the number of transactions where one or more of the 100 most-used public keys were not involved, either as input or output. As both curves started to spread at about January 2012, this means there are some addresses (entities) that account for a large number of transactions on the Bitcoin network. Two of those entities can easily be named: one is the Deepbit mining pool, the other is a gambling service called SatoshiDice, which was announced on 24 April 2012 and gained great popularity within weeks. The way this service works introduces many transactions on the network, which explains most of the separation of the two lines in the figure.
Figure 8.
Total number of transactions (logarithmic scale).
Figure 8.
Total number of transactions (logarithmic scale).
3. Linkability of Transactions
Once an adversary has established a list of active entities on the Bitcoin network, he may continuously update this list based on incoming new transactions. Whenever he observes that two (or more) public keys associated with purportedly different entities appear as input in one transaction at the same time, he can merge all these entities into a new entity, as the transaction must have been authorized by the same economically active person or institution. We call such an event a “merging event”. Every merge operation indicates a successful attack on unlinkability: a passive adversary who looks at the block chain can be certain that all merged transactions were authorized by the same entity. For individuals participating in Bitcoin, it is advisable to maintain several independent entities and avoid merging events. This limits linkability of transactions and increases the anonymity set.
Despite the availability of all transaction data, one must be very careful when trying to establish links between addresses. Some Bitcoin services are designed to obfuscate the ownership of bitcoins, such as laundries and mixers. Other services, namely online wallets, do not promise enhancing the privacy of Bitcoin, but nevertheless make it more difficult to trace bitcoins. Typically these services work as follows: Some user X sends bitcoins to the service using address A and can then use this service to send coins to another address B. While the user “owns” address A, he most likely owns none of the addresses that are used to send coins to address B. Associating the addresses with user A would be a wrong conclusion, as those addresses actually belong to one or more different user(s) or the wallet service itself.
Figure 9 shows a two-dimensional histogram of the number of such merging events depending on date and the total number of merged public keys. As the most used public keys account for a significant portion of the network activity (
cf. Figure 8), the number of merging events increased drastically. Also, there is a hot spot around the time of the hype (June/July 2011). This can probably be explained by users transferring a significant fraction of their bitcoins to another address, most likely because they sold them in exchange for fiat currency at this time. When considering the public keys assigned to an entity for the first time before and after block 180,000 (13 May 2012), we note that the number of public keys that received a single so-called satoshi (
bitcoins, currently the smallest unit that can be used) greatly increased. Most of them can be attributed to the SatoshiDice game (receiving a satoshi signals a loss to a player). Before the said block, those public keys only made about 0.08% of all newly assigned public keys, whereas after this time this value increased to 1.12%. This also leads to the conclusion that SatoshiDice has a big influence on the number of merging events: Outputs consisting of tiny (or even, as in this case, smallest possible) amounts can, in almost all cases, only be used as a combined input.
Figure 9.
Histogram on the number of entity merging events depending on date and the total number of merged public keys. The data is binned both in time (100 steps) and merging size (). (a) Histogram of merging events over time; (b) Histogram of merging events over time (zoomed in to last year).
Figure 9.
Histogram on the number of entity merging events depending on date and the total number of merged public keys. The data is binned both in time (100 steps) and merging size (). (a) Histogram of merging events over time; (b) Histogram of merging events over time (zoomed in to last year).
4. Dormant Coins
We call Bitcoins that have not been in use for a certain amount of time dormant coins. The number of dormant coins is an important quantity for anonymity: dormant coins can only be found for those entities that are no longer active in the Bitcoin network, thereby further reducing the anonymity set.
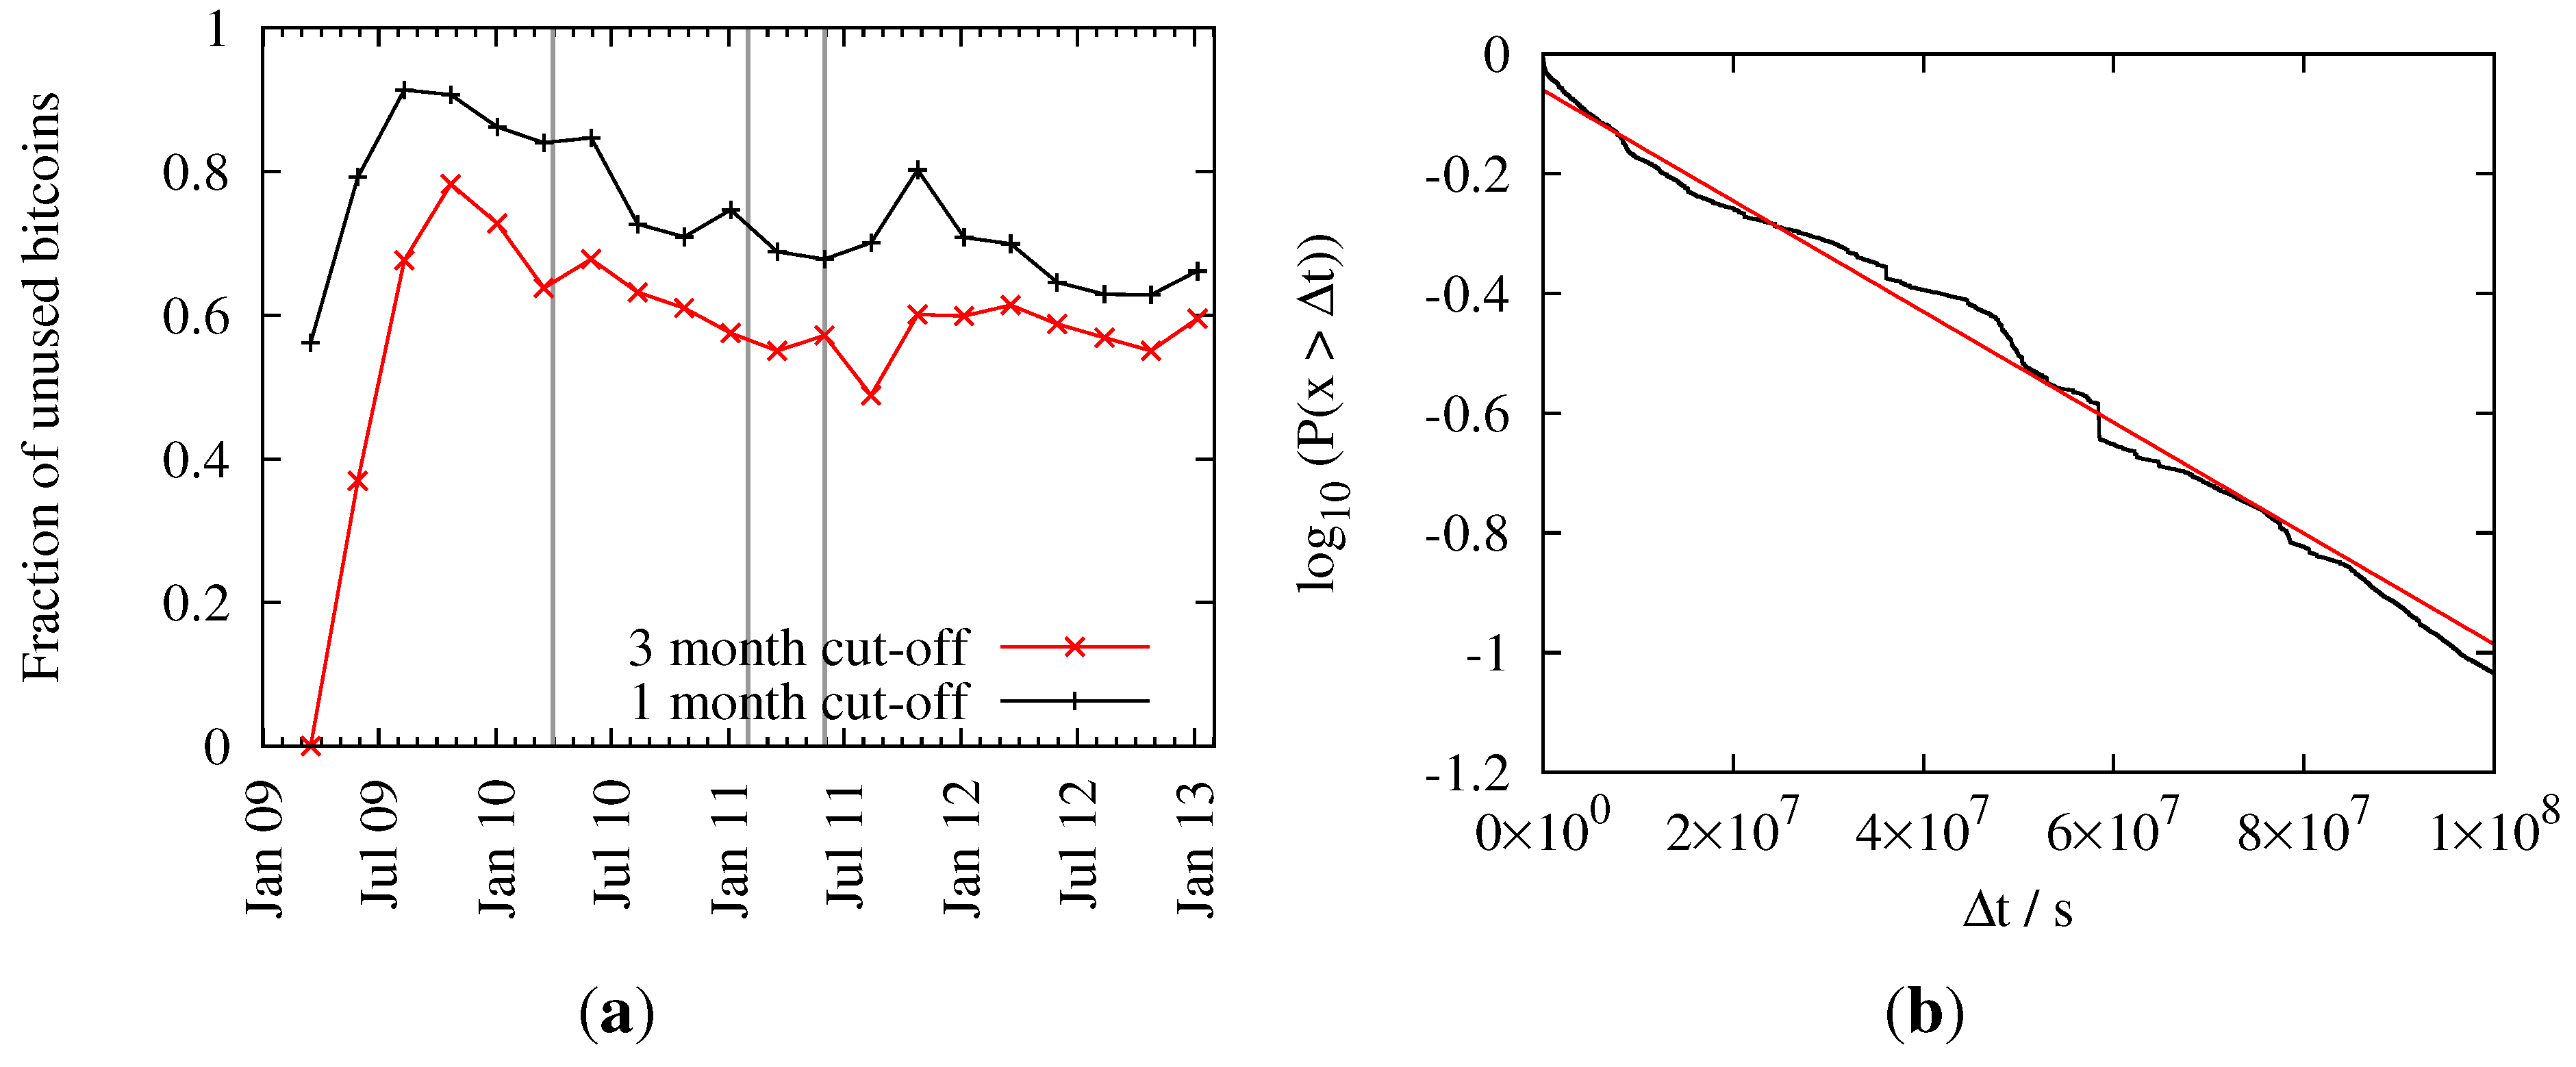
The relative number of dormant coins for different cut-off periods can be seen in
Figure 10a. The graph shows an all-time high of the relative number of dormant coins just before public trading of bitcoins began. After that we can see a steady decrease with a local minimum during the hype in July 2011. Subsequently, users started to maintain their bitcoin balance, so the percentage of dormant coins has again increased to a now almost steady value of around 60 percent (given a cutoff of three months). This translates to an amount of 6.3 million dormant bitcoins as of January 2013.
Figure 10.
Time evolution of dormant coins. (a) Fraction of dormant coins for different cutoffs; (b) Probability that a bitcoin was not used for a certain amount of time . The black line shows empirical data and the red line a fitted exponential function.
Figure 10.
Time evolution of dormant coins. (a) Fraction of dormant coins for different cutoffs; (b) Probability that a bitcoin was not used for a certain amount of time . The black line shows empirical data and the red line a fitted exponential function.
In
Figure 10b we show the frequency
that an amount of bitcoins was not used (as input) for a given amount of time
. Of course, for
the probability
.
never reaches one, as some bitcoins are always used in the last block under consideration. The maximum
has been set to
seconds (
years), because bigger differences would introduce artifacts from the early days of Bitcoin. Fitting an exponential distribution
to the data yields parameters
and
sec
.
This finding allows one to derive a statistical model on the reduction of k-anonymity due to dormant entities: setting some probability threshold , one can exclude all those entities from the anonymity set that were inactive during the last seconds with . Therefore we can—at least conceptually—derive a mapping that computes the reduction in k-anonymity for any probability threshold. Thus, while speculation supports anonymity (cf. above), other dynamical features such as dormant coins reduce anonymity.
