1. Introduction
Smart care systems typically require continuous monitoring, real-time analysis, and rapid response, and these demands are particularly pronounced in home care and remote health monitoring scenarios [
1,
2]. Early systems in this domain largely relied on cloud-centric architectures, in which data collected by terminal devices were uploaded to remote servers for storage, analysis, and decision support. However, with the rapid proliferation of wearable devices, video monitoring systems, and Internet of Things terminals, pure cloud-based models have gradually exposed several limitations, including high communication latency, substantial bandwidth consumption, increased energy use, and heightened privacy risks [
3,
4]. As a result, deploying computing capabilities closer to the data source has become an important approach for improving the responsiveness of smart care systems. In this context, mobile edge computing and task offloading have attracted increasing attention [
5,
6].
As workloads continue to shift toward the edge, edge nodes are required to handle video analytics, health monitoring, and related tasks under constrained budgets of computation, storage, and energy [
7,
8]. At the same time, Edge AI deployment on embedded heterogeneous devices has continued to advance. On such devices, system performance depends not only on the inference capability of individual models but also on the coordination of heterogeneous computing units, runtime organization, and the overhead associated with communication and synchronization [
9,
10]. Therefore, how to reliably support the collaborative execution of multiple related workloads on a single resource-constrained heterogeneous edge node has become a key system-level issue in edge-side design.
Existing studies have advanced edge-side intelligent computing from the perspectives of platform abstraction and local runtime mechanisms. Prior work has explored abstraction frameworks for heterogeneous platforms [
11] while also investigating local scheduling optimization and inter-process communication mechanisms [
12,
13]. However, these studies mainly focus on abstraction-layer design or individual runtime mechanisms and do not directly address the collaborative execution of multiple workloads on a single pure-edge heterogeneous node in smart care scenarios. Therefore, constructing a collaborative execution framework for pure-edge embedded heterogeneous systems remains a key issue in edge-side system design.
Based on this gap, this study addresses the following research question: how can multiple smart care workloads be collaboratively organized on a single pure-edge CPU–TPU heterogeneous node to efficiently reuse shared front-end perception results while reducing inter-process communication and synchronization overhead?
To answer this question, the main contributions of this paper are summarized as follows. First, to address the need for multi-workload collaborative execution based on shared front-end perception results, a pure-edge embedded heterogeneous collaborative execution framework is proposed, and a CPU–TPU-based task scheduling and management platform is developed. Second, a multi-process collaboration mechanism integrating fine-grained process partitioning, shared memory, and event management is designed. This mechanism reduces the communication and synchronization overhead incurred during multi-workload execution while improving runtime efficiency and system stability. Third, the proposed framework and mechanism are implemented and validated in a pure-edge smart care system. Experiments are conducted under single-workload, multi-workload, multi-resolution, and long-term runtime conditions. The results demonstrate that the proposed method achieves favorable overall performance in terms of frame rate, latency, memory usage, power consumption, and runtime stability. The remainder of this paper is organized as follows.
Section 2 reviews the related work.
Section 3 introduces the smart care scenario and the hardware platform.
Section 4 presents the platform design and collaborative execution mechanism.
Section 5 reports the experimental results and analysis.
Section 6 concludes the paper and discusses future work.
2. Related Work
Existing research on edge-side intelligent services has gradually formed several relatively clear technical directions. In light of the problem addressed in this paper, the related work can be grouped into three main categories: edge-enabled application systems for smart care tasks, heterogeneous execution on embedded platforms, and the scheduling and communication mechanisms that support such systems. Based on this categorization, the following subsections review representative studies and further analyze their relevance to the research problem addressed in this work.
2.1. Edge-Enabled Smart Care Application Systems
Research on edge-enabled smart care application systems mainly focuses on the deployment and implementation of specific monitoring and service functions in real-world scenarios. A common characteristic of these studies is that edge deployment is used within particular task workflows or service processes to improve real-time performance, reduce unnecessary data transmission, or enhance privacy protection.
In video surveillance, warning systems, and privacy protection, existing studies have shown that smart care applications are continuing to migrate toward the edge. In ref. [
14], medical video streams were filtered through an edge gateway to reduce unnecessary video uploads and relieve cloud-side pressure. In ref.[
15], an intelligent video surveillance system based on edge computing was developed to enable multi-stream detection, tracking, and counting on edge nodes. In ref. [
16], privacy-preserving mechanisms were incorporated into an edge AI monitoring system to support abnormal behavior recognition without uploading raw sensitive video. In ref. [
17], an edge-based visual care system using skeleton recognition was designed for tasks such as bed-exit detection and bedside fall warning. These studies indicate that edge devices are already capable of supporting multiple concrete visual tasks in smart care scenarios.
In terms of system integration, security, and continuous monitoring, another line of research has focused more on how edge architectures support persistent service requirements. In ref. [
18], the role of edge computing in securing smart healthcare systems was discussed. In ref. [
19], an edge-enabled secure healthcare framework was proposed. In ref. [
20], an end-to-end edge-cloud integrated system for diabetes prediction was developed. From a broader perspective, Ref. [
21] reviewed the role of edge intelligence in IoT-based healthcare systems. In ref. [
22], the potential of wearable technologies and far-edge AI for long-term chronic disease management was discussed. In ref. [
23], Edge-AI, IoT, and federated anomaly detection were combined for real-time healthcare monitoring and security alerting. In ref. [
24], an edge-fog-cloud framework was proposed for real-time cardiac monitoring and rapid clinical alerts in hospital wards. In ref. [
25], the feasibility of privacy-preserving localization and group identification using a distributed edge camera network was demonstrated. Together, these studies show that the application of edge computing has expanded from single-task processing to system integration, security support, and continuous monitoring.
Overall, these studies show that smart care-related applications are steadily moving toward edge-side deployment and that edge computing has demonstrated clear practical value in tasks such as video surveillance, behavior warning, and continuous health monitoring. However, most of this work focuses on function implementation and system integration in specific scenarios, with an emphasis on application deployment rather than system-level execution organization. Therefore, these studies provide important application background for this paper, but they do not directly address the platform-level collaborative execution problem considered here.
2.2. Embedded Deployment and Heterogeneous Edge Execution
Research on heterogeneous execution over embedded platforms has primarily focused on two aspects: the feasibility of using edge devices as practical deployment targets and the performance trade-offs among models, hardware platforms, and resource constraints. A common objective of this line of work is to improve the deployability and real-time capability of specific models or tasks on edge devices.
One representative line of research has concentrated on deployment performance evaluation for embedded devices and heterogeneous accelerators. In ref. [
26], the practicality of combining the Raspberry Pi (Raspberry Pi Foundation, Cambridge, UK) with the Coral Edge TPU (Google LLC, Mountain View, CA, USA) for object detection was investigated, showing that resource-constrained devices can still deliver application-relevant real-time performance. In ref. [
27], systematic benchmarking of object detection was conducted on Jetson platforms (NVIDIA Corporation, Santa Clara, CA, USA), Coral Dev Board (Google LLC, Mountain View, CA, USA), and Xilinx platforms (Xilinx, Inc., San Jose, CA, USA), revealing significant trade-offs among speed, accuracy, and resource cost across heterogeneous platforms. In ref. [
28], the real-time object detection performance on Jetson Nano and Xavier NX (NVIDIA Corporation, Santa Clara, CA, USA) was analyzed, and deployment recommendations were provided regarding the matching of models and devices. In ref. [
29], the performance of YOLO-based models on multiple edge intelligence devices was further compared, emphasizing the close relationship between model selection and hardware configuration. In ref. [
30], the model constraints, compilation workflow, and deployment limitations of Edge TPU (Google LLC, Mountain View, CA, USA) were summarized. Collectively, these studies demonstrate that embedded devices and heterogeneous accelerators have become practical carriers for edge deployment.
Another line of research has focused more on how specific tasks are executed on heterogeneous edge devices. In ref. [
7], real-time ECG monitoring and compressive sensing processing were implemented on a heterogeneous multicore edge device, demonstrating that resource-constrained edge devices are already capable of supporting continuous health monitoring tasks. These studies further suggest that heterogeneous edge platforms are not limited to visual task deployment but can also support continuous real-time processing scenarios such as health monitoring.
Overall, this body of work indicates that embedded heterogeneous platforms already provide a practical foundation for edge deployment, while also revealing the complex trade-offs among models, devices, and resource constraints. However, most existing studies focus on specific models, specific tasks, or individual performance metrics, with their main emphasis placed on deployment feasibility and execution efficiency optimization. In contrast, this paper focuses on collaborative execution and runtime organization on a given pure-edge embedded heterogeneous node.
2.3. Runtime, Scheduling, and Communication Mechanisms
From the perspective of system mechanisms, existing studies have mainly focused on runtime organization, scheduling strategies, and inter-process communication. Compared with application-oriented systems and deployment studies, this line of work more directly addresses system-level overhead in multi-workload execution, such as task organization, resource management, and data exchange costs.
In terms of platform abstraction and programming models, prior research has attempted to reduce the complexity of using heterogeneous systems. In ref. [
11], a general-purpose platform for heterogeneous computing was proposed, with the main goal of lowering the barrier for non-expert users through unified abstraction and semi-automated deployment. In ref. [
31], a unified programming model for heterogeneous computing was proposed to improve portability and consistency across different computing resources at the programming interface level. These studies provide support at the abstraction layer, but they do not directly address multi-workload collaborative execution in smart care scenarios.
In terms of scheduling and runtime organization, Ref. [
32] directly compared the suitability of multi-process and multi-thread architectures on a single edge device under concurrent multi-input-stream and multi-model conditions, showing that software organization can significantly affect edge execution efficiency. In ref. [
12], a workload-aware soft-preemptive real-time scheduling method was proposed for NPU tasks, with a focus on real-time scheduling and resource management for heterogeneous execution units. In [
33], a hierarchical scheduler for multiple deep neural networks on edge devices was further proposed to improve resource utilization and scheduling efficiency in concurrent inference scenarios. With regard to communication mechanisms, Ref. [
13] presented EQueue, a core-to-core lock-free FIFO communication queue for multi-core processors, showing that IPC mechanisms themselves can become a critical bottleneck in high-throughput pipelined systems.
Although existing studies have provided important foundations in platform abstraction, localized scheduling, and inter-process communication, their focus remains largely on localized mechanisms. They do not directly address the collaborative execution of multiple workloads on a single pure-edge heterogeneous node in smart care scenarios. The next section therefore introduces the smart care scenario and hardware platform to further motivate the platform design requirements of this work.
3. Smart Care Scenario and Hardware Platform
This section introduces the task pipeline, data sources, and experimental platform in the smart care scenario. It first presents the video-stream and sensor-stream workloads processed at the edge side, then describes the task definitions and data characteristics, and finally introduces the hardware and software environment. These elements provide the basis for the subsequent platform design and experimental analysis.
3.1. Smart Care Scenario and Task Pipeline
In the smart care scenario, the edge node is required to process both video streams and sensor streams simultaneously. The video branch is responsible for front-end pose estimation and subsequent visual analysis, whereas the sensor branch supports continuous monitoring of physiological and environmental states. Because different workloads exhibit clear differences in computational cost, latency requirements, and data dependencies, the overall performance of a single-node system depends not only on the inference speed of an individual model but also on how multiple workloads are collaboratively organized.
This paper adopts smart care as the validation scenario for the proposed platform. All tasks are executed locally on a single pure-edge node. In this setting, cameras, multiple sensors, and the edge device together form the physical infrastructure of the edge-side task pipeline.
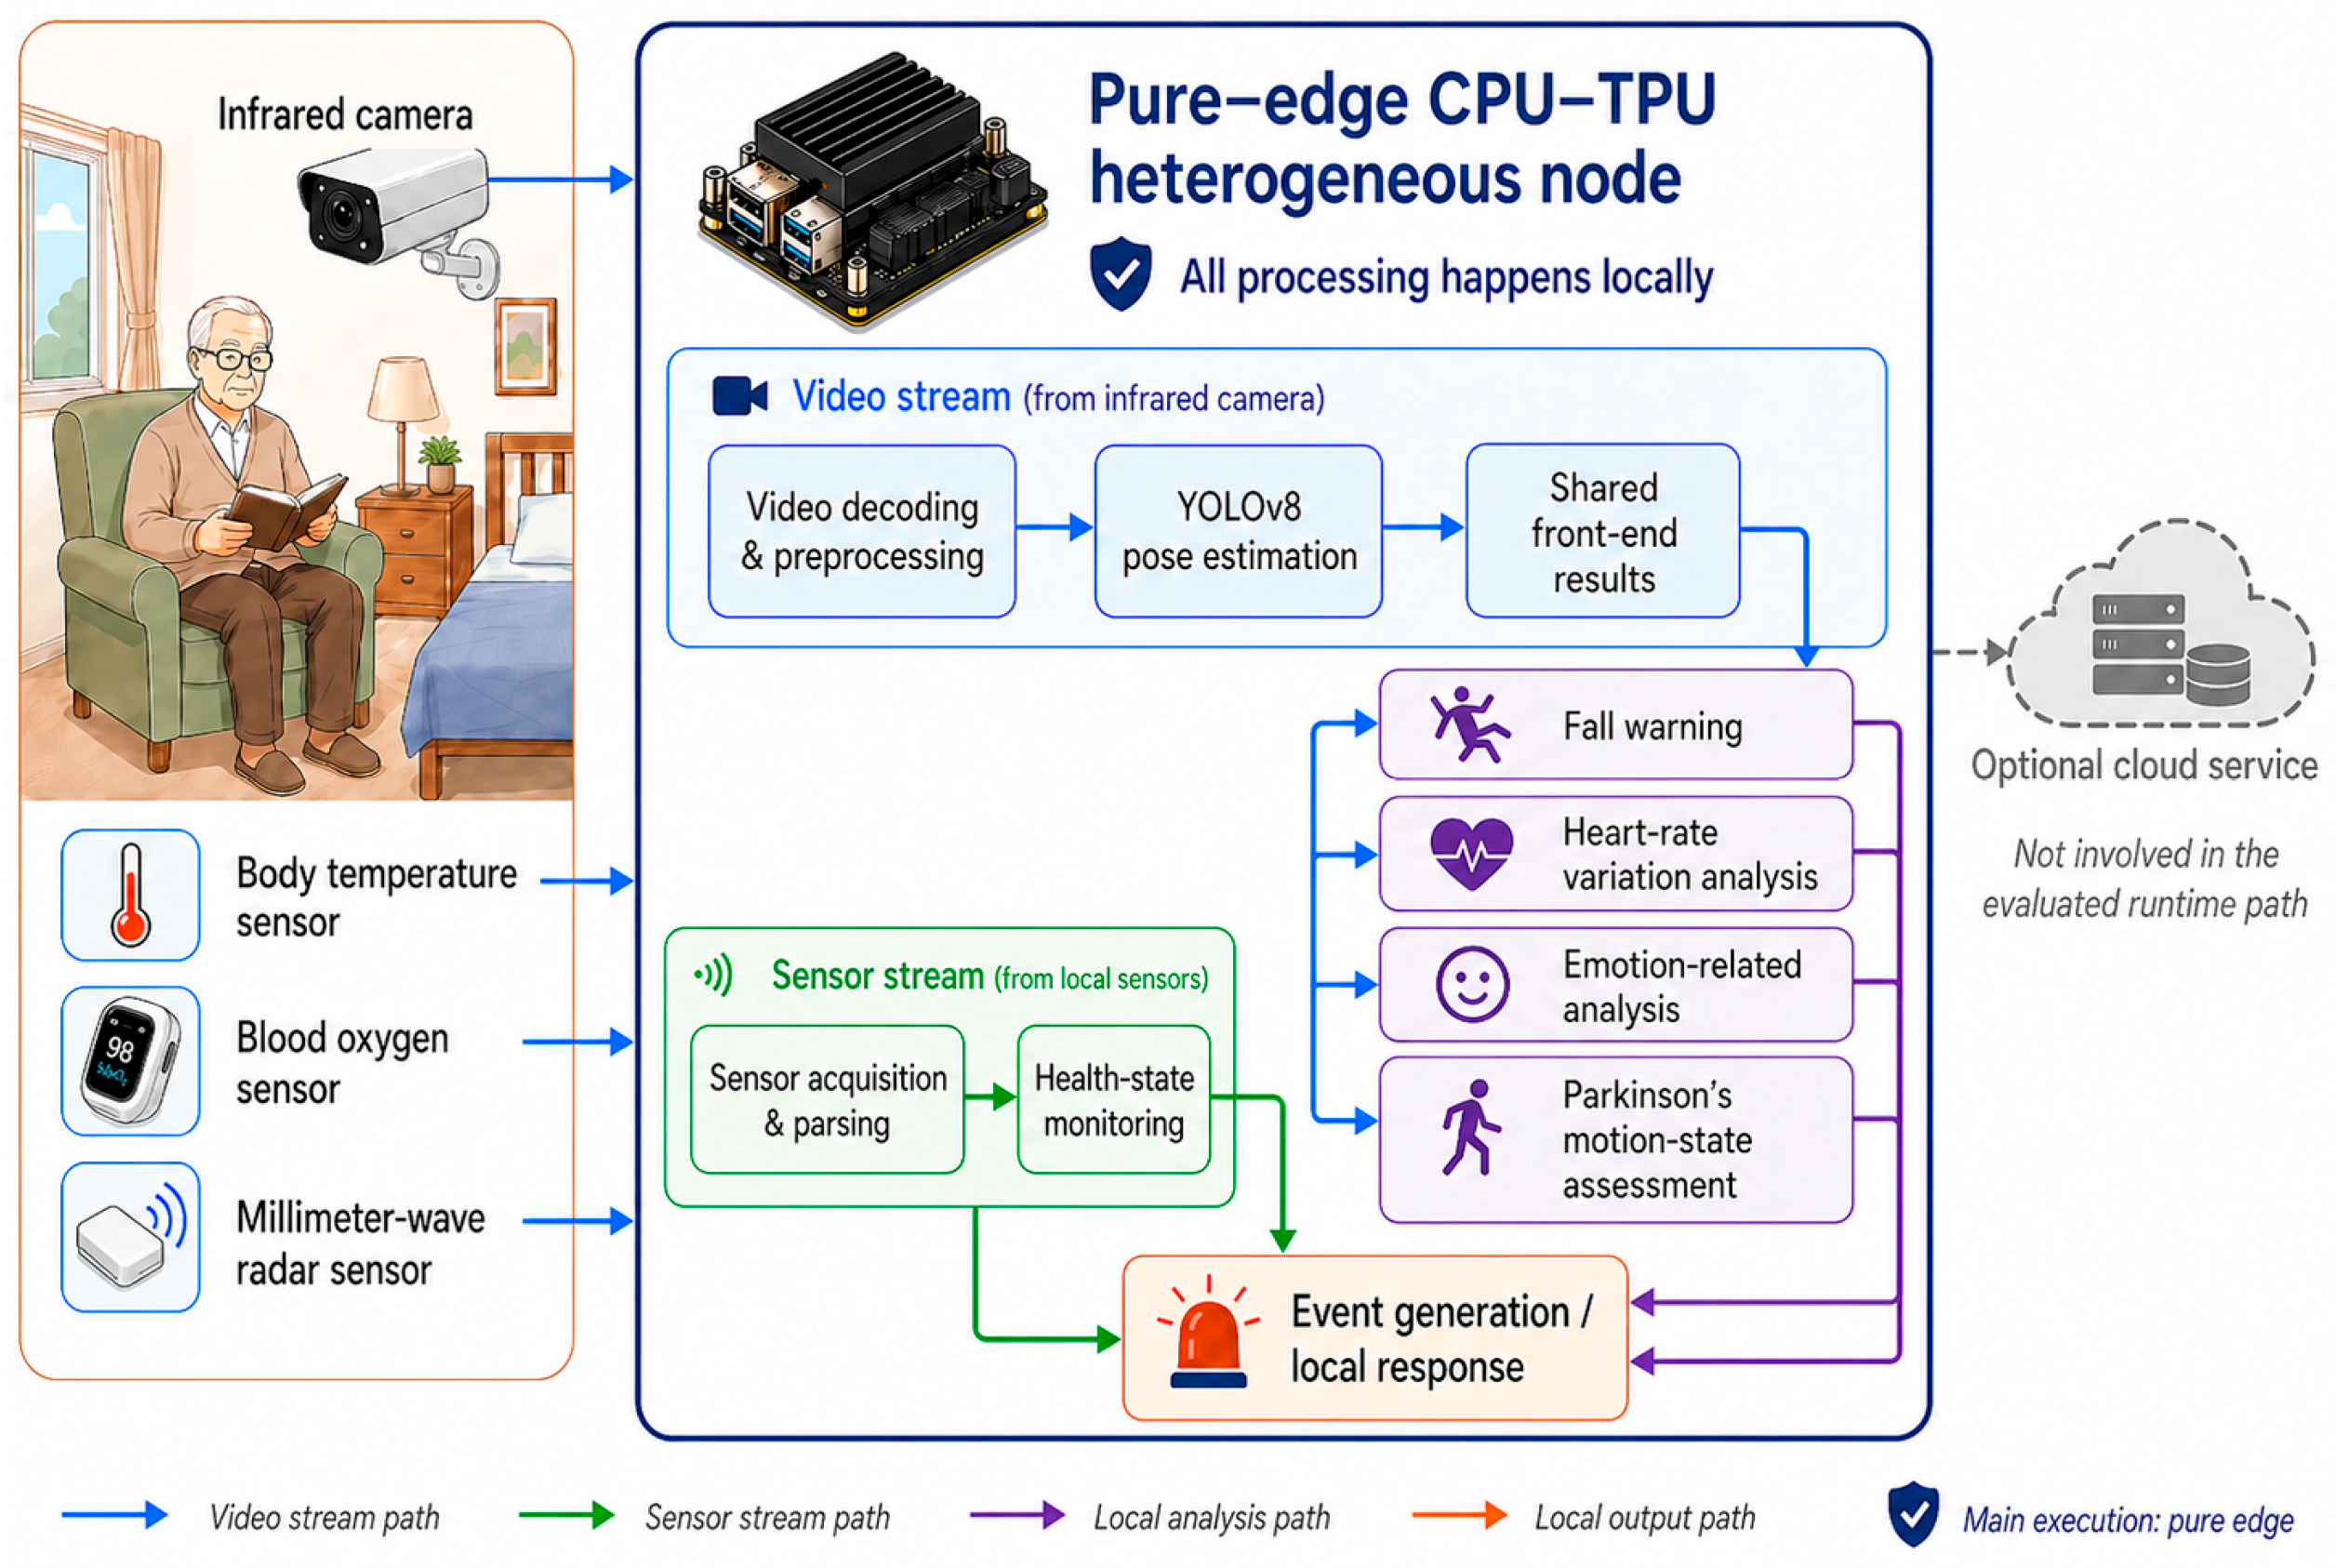
From the perspective of the task pipeline, the system receives two types of inputs: video streams and sensor streams. In the video branch, input frames first undergo decoding and preprocessing and are then fed into a YOLOv8-based front-end pose estimation model. The structured outputs of this model are subsequently reused by multiple downstream modules for fall warning, heart-rate variation analysis, emotion-related analysis, and Parkinson’s-related motion-state assessment. In the sensor branch, the platform acquires physiological and environmental sensor data streams, parses valid data packets, and distributes them to lightweight task modules for continuous health-state monitoring and event generation. Through this organization, smart care functions are represented as a set of integrated yet decoupled edge workloads. These workloads share upstream results while jointly competing for limited edge computing resources. As shown in
Figure 1, the pure-edge smart care scenario consists of cameras, multiple sensors, and an edge node, which together form the physical infrastructure of the edge-side task pipeline.
3.2. Data Sources and Task Definitions
The experimental workloads consist of locally collected video streams and synchronized sensor data streams. To clearly describe the experimental conditions,
Table 1 summarizes key information, including participant information, acquisition scenarios, data sources, and ground-truth generation.
For experimental clarity, the workloads in this study are divided into three categories: front-end pose estimation, downstream video analysis, and sensor monitoring. Front-end pose estimation is responsible for generating shared structured results, whereas downstream video analysis and sensor monitoring correspond to visual event analysis and continuous state monitoring, respectively. The multi-workload execution demand introduced by result reuse, together with the continuous processing demand introduced by sensor streams, provides the system basis for the subsequent platform design and experimental analysis.
3.3. Hardware and Software Platform
The proposed platform is deployed on a Sophgo SE5 edge device (Sophgo Technologies Ltd., Beijing, China). The hardware environment consists of a CPU and a TPU and adopts an overall pure-edge CPU–TPU collaborative architecture. In this architecture, the TPU is primarily responsible for front-end visual processing, whereas the CPU mainly handles post-processing, shared-result management, task execution, sensor data processing, and runtime coordination. This division of labor provides the hardware foundation for the subsequent design of the collaborative execution mechanism.
At the software level, the system operates in a local edge environment At the software level, the system uses the Sophon SAIL interface (Sophgo Technologies Ltd., Beijing, China) for model loading and inference invocation. for model loading and inference invocation. The front-end visual workload adopts the YOLOv8 pose estimation model (Ultralytics Inc., New York, NY, USA). This model was selected primarily for deployment-oriented considerations, including model maturity, inference efficiency, and compatibility with the target platform. The structured outputs generated by the model can be reused by multiple downstream tasks, thereby establishing a unified input basis for the subsequent collaborative execution process.
Based on the above hardware and software environment, the next section presents the platform design and its core coordination mechanism.
4. Platform Design and Collaborative Execution Mechanism
This section presents the overall design of the proposed platform and its collaborative execution mechanism. Unlike the previous section, which described the application scenario, task composition, and hardware conditions, this section focuses on platform organization on pure-edge CPU–TPU heterogeneous nodes and on the collaborative execution process of multiple smart care workloads on that platform. Specifically, it first introduces the overall platform architecture, then describes the process organization and workload partitioning strategy, and finally compares the implementation differences among three communication and synchronization schemes. The analysis focuses on system-level mechanisms such as shared front-end result reuse, data transfer paths, and runtime synchronization control.
4.1. Overall Platform Architecture
Based on the task pipeline and scenario definition introduced in the previous section, this work develops a unified runtime framework for the proposed task scheduling and management platform on a pure-edge CPU–TPU heterogeneous node so as to support the collaborative execution of multiple smart care workloads.
As shown in
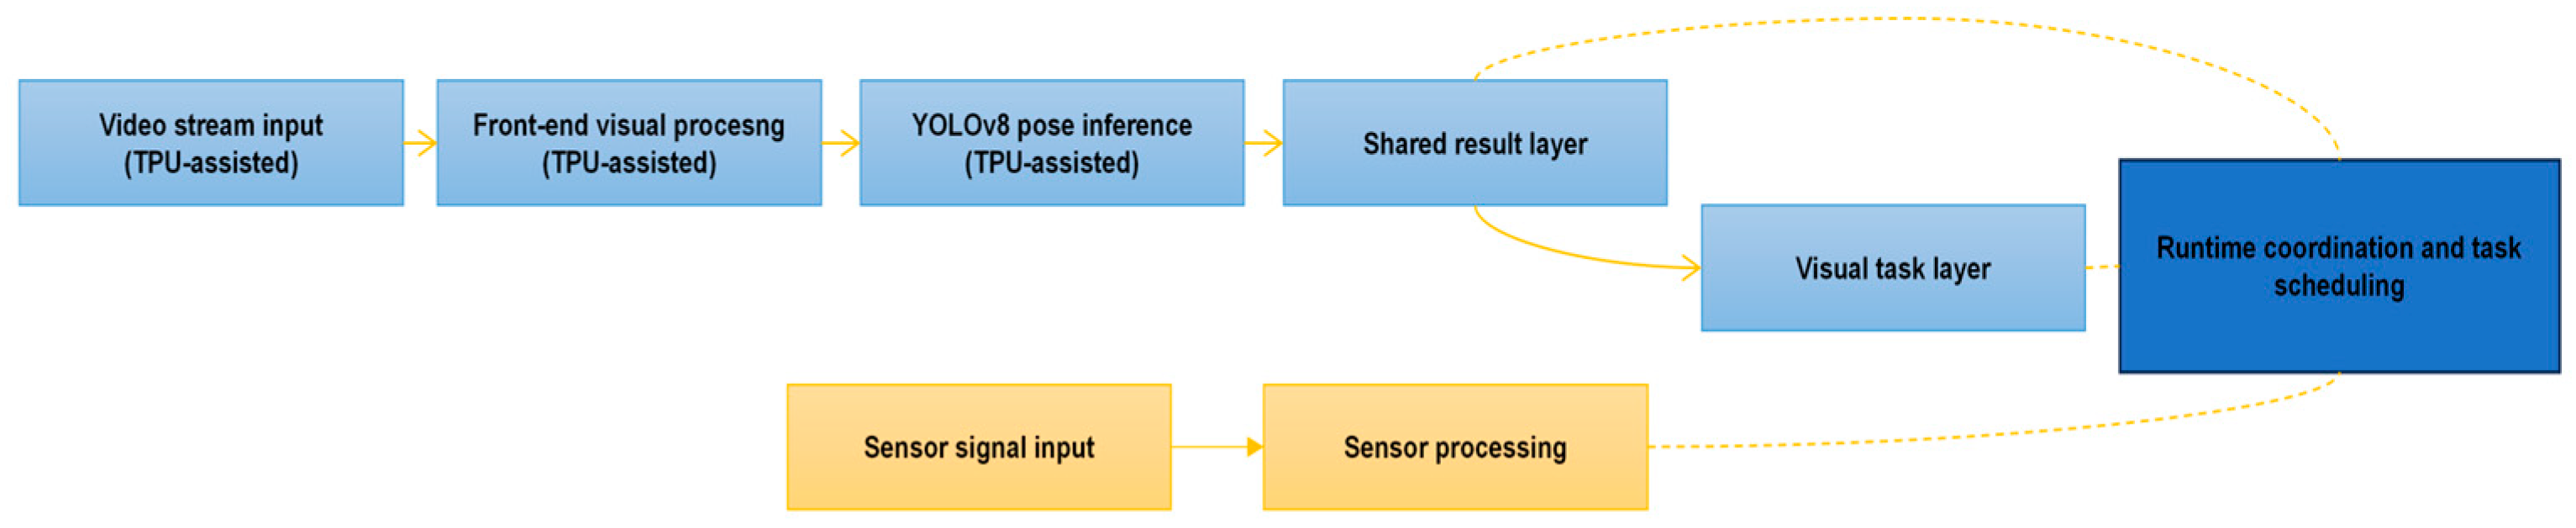
Figure 2, the overall platform architecture consists of video-stream input, front-end visual processing, a shared-result layer, a visual-task layer, sensor processing, and runtime coordination and task scheduling. Within the front-end visual processing pipeline, the video stream sequentially undergoes decoding, preprocessing, and YOLOv8 pose inference, after which the outputs are post-processed to generate structured results that can be reused by downstream tasks. Sensor signals, by contrast, enter the platform through an independent data acquisition and processing path. Through this organization, originally separate smart care functions are unified as a set of representative workloads on the same edge node and are collaboratively executed within a unified runtime framework.
In terms of hardware coordination, the platform adopts a pure-edge CPU–TPU collaborative architecture. The TPU is responsible for front-end visual processing tasks, including video decoding, image preprocessing, and front-end pose inference, whereas the CPU handles YOLOv8 post-processing, shared-result organization, visual task execution, sensor data processing, and workflow control. This division of labor consolidates computationally intensive front-end visual operations into a unified accelerated inference path, while enabling downstream visual tasks to be collaboratively executed on the CPU side based on shared results, thereby forming a heterogeneous execution architecture suitable for deployment on resource-constrained edge nodes.
On top of the above overall architecture, this work further implements three comparable collaborative execution schemes, namely, plan1, plan2, and plan3. These three schemes share the same task pipeline and hardware deployment conditions and differ mainly in their data transfer methods, shared-result organization, and synchronization control mechanisms. The following subsections first describe the platform’s process organization and workload partitioning strategy and then compare how different collaborative mechanisms affect system execution efficiency.
4.2. Process Organization and Workload Partitioning
Building on the above overall architecture, the platform further adopts a fine-grained multi-process organization of runtime execution units to accommodate the concurrent processing requirements of pure-edge CPU–TPU heterogeneous nodes. The basic idea is to partition platform functions according to computation stages, data dependencies, and resource types, and to organize front-end visual processing, shared-result generation, downstream task execution, and global coordination control into relatively independent processing units. In this way, a clear runtime structure is established for multi-workload collaborative execution.
In terms of specific process organization, the platform groups video decoding, image preprocessing, and front-end pose inference into a unified front-end processing process, denoted as Process 1, while YOLOv8 post-processing and key-result generation are grouped into Process 2. The former is responsible for handling raw video-frame input and front-end inference computation, whereas the latter extracts structured results from the inference outputs and generates keypoints and intermediate results that can be reused by downstream tasks. This organization maintains the continuity of the front-end processing pipeline while separating shared results from the front-end computation path, thereby providing a unified entry point for downstream task reuse.
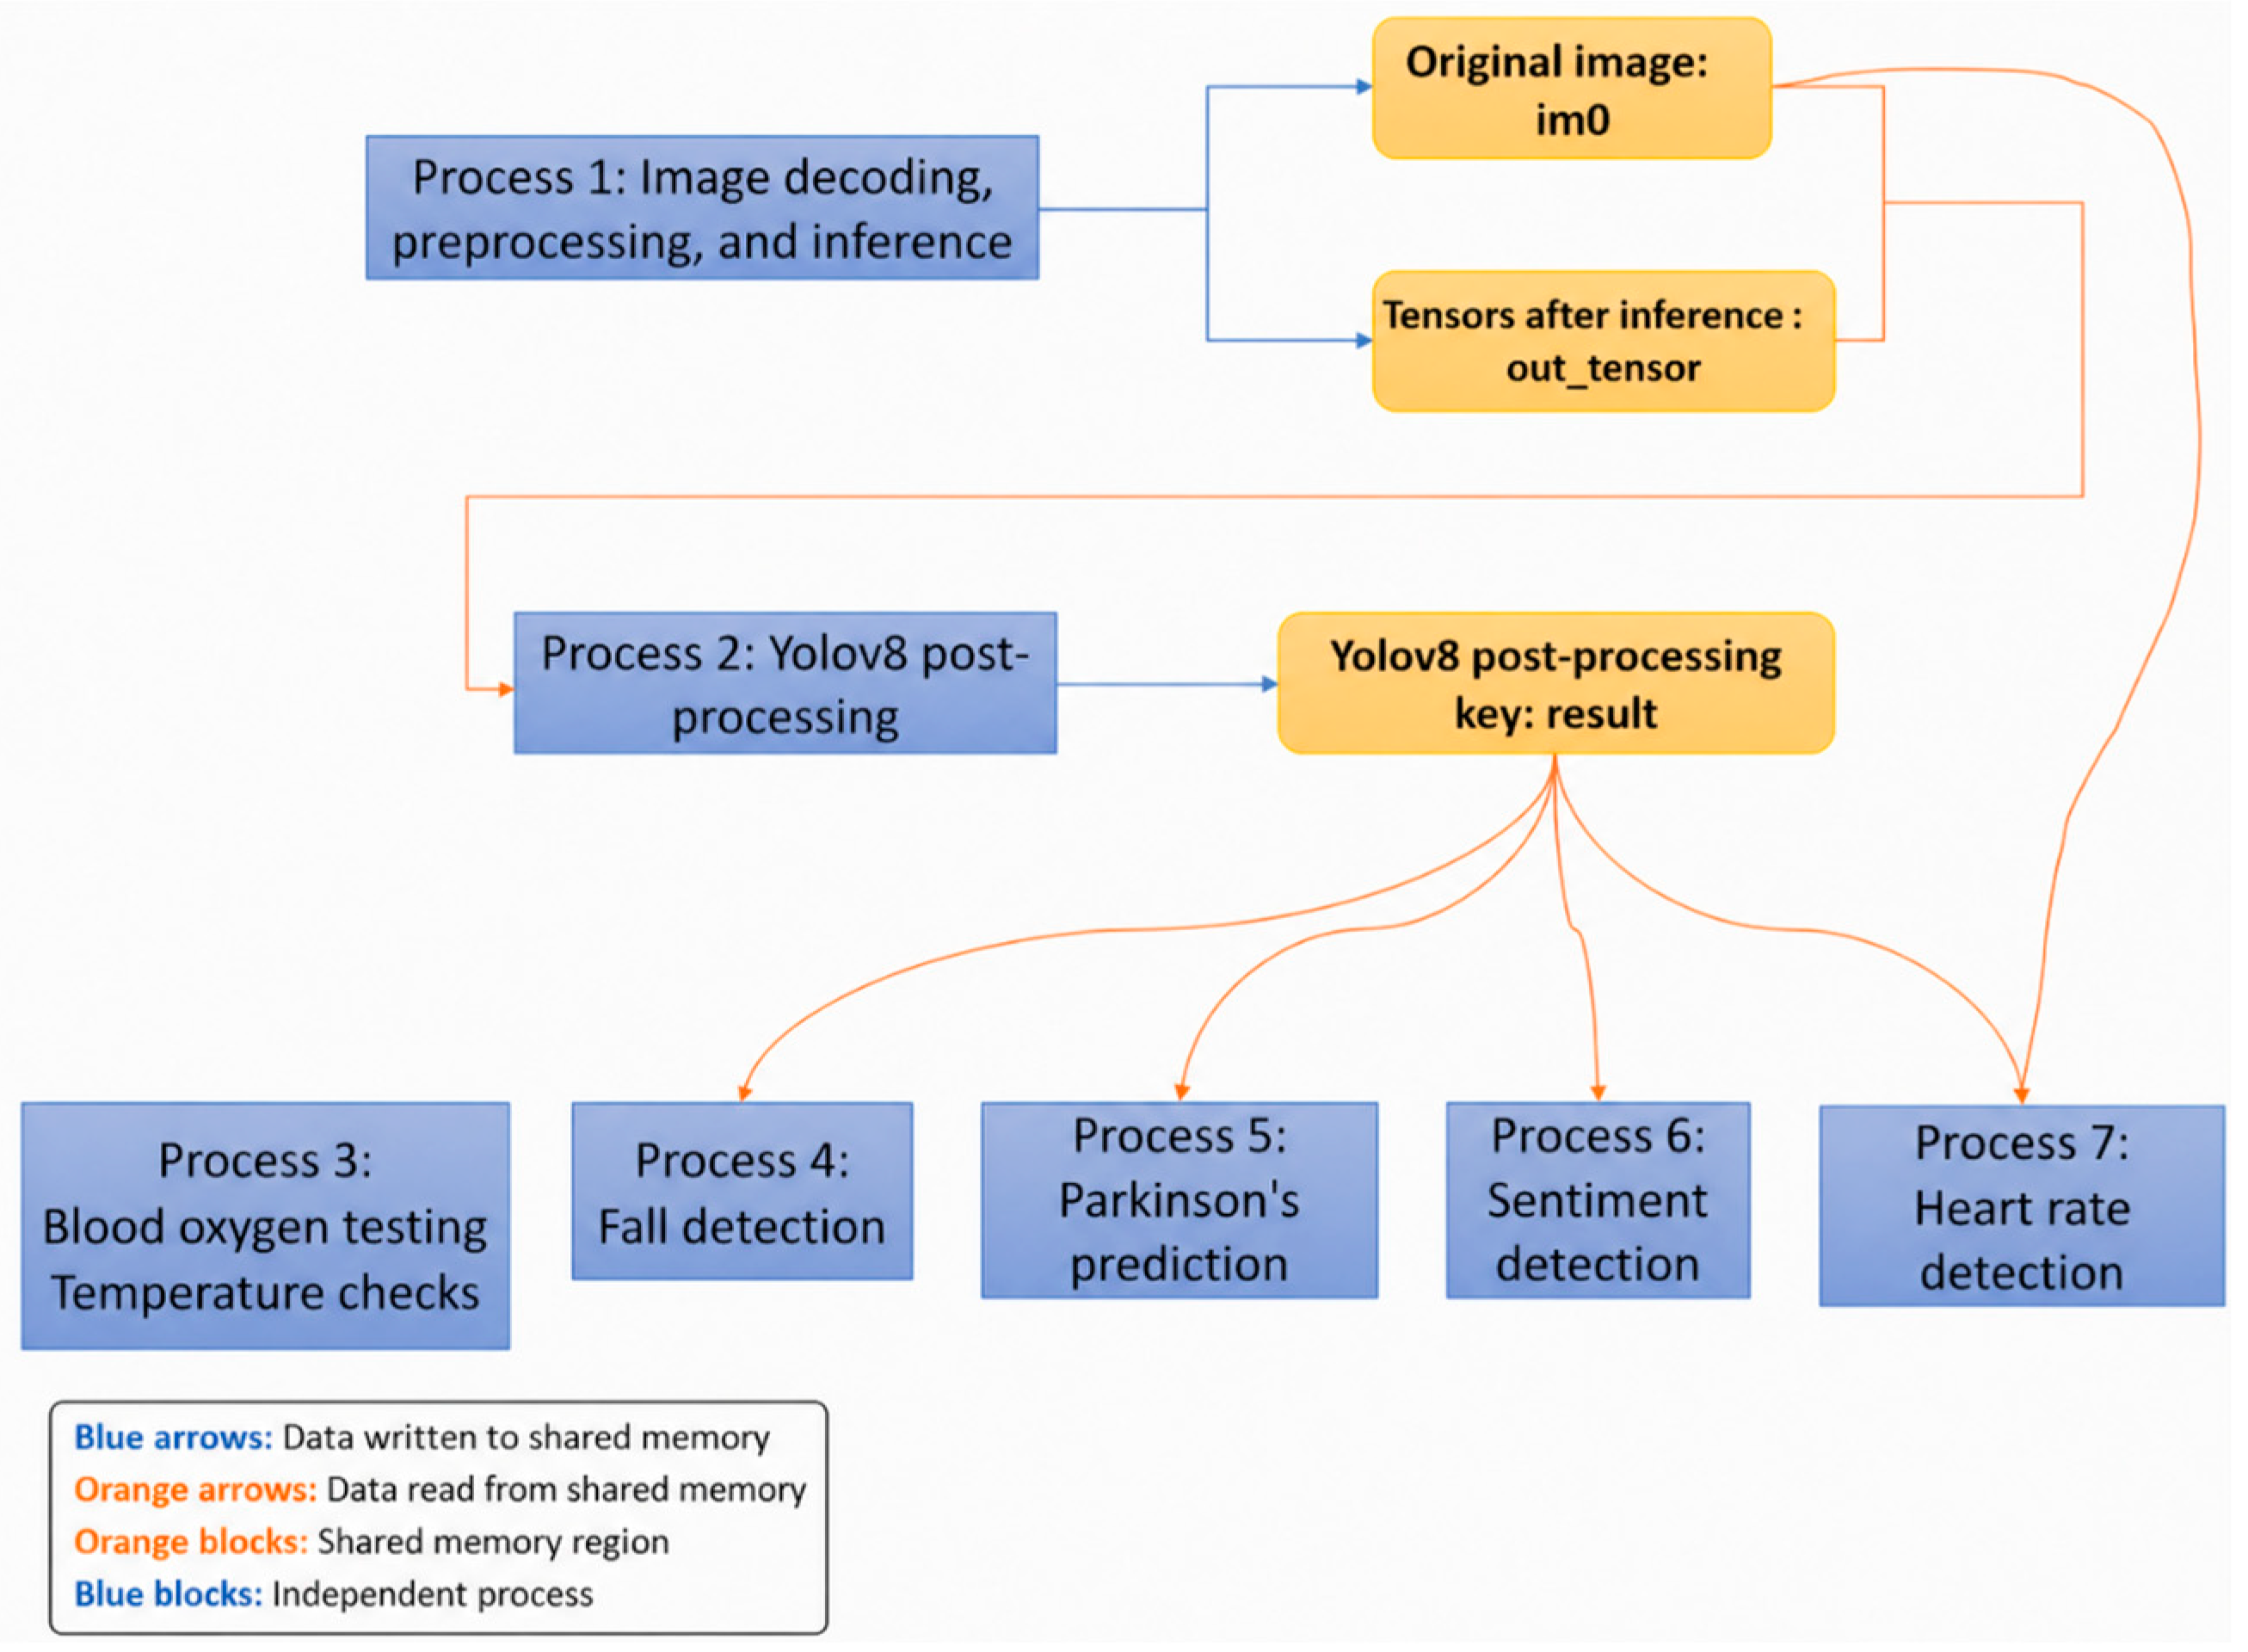
To reduce the overhead of inter-process data transfer, the platform defines three shared-memory regions: ‘shm_im0’ for raw image data, ‘shm_tensor’ for tensor outputs generated by front-end inference, and ‘shm_result’ for keypoint coordinates produced by post-processing. On the downstream side, subsequent functions are organized as extensible ‘Process 3_x’ workload instances, where different instances may carry representative tasks such as heart-rate detection, emotion recognition, fall detection, and Parkinson’s-related motion-state assessment. In addition to the functional processing units, the platform also introduces ‘Process 0’ as a global coordination unit to maintain task triggering order and manage runtime events. As shown in
Figure 3, the blue modules denote processing units, whereas the yellow modules denote the shared-memory regions managed centrally by the task scheduling and management platform. Blue arrows indicate data written to shared memory, while orange arrows indicate data read from shared memory.
This partitioning is not a simple functional decomposition but is instead guided by representative profiling results from key processing stages, as summarized in
Table 2. In the front-end pipeline, video decoding, image preprocessing, and pose inference are tightly coupled in execution order and jointly determine front-end throughput. By contrast, YOLOv8 post-processing and keypoint generation are positioned after the front-end pipeline and also serve as shared inputs for multiple downstream tasks. Therefore, the platform separates the front-end inference-related stages from the shared-result generation stage, so as to reduce redundant processing and define a clear unified input boundary for downstream tasks.
Based on this process organization, the study further constructs runtime scenarios with different concurrency scales by expanding workload instances. In the experiments, 1algo, 3algo, 5algo, and 10algo denote the numbers of Process 3_x instances concurrently supported by the platform on top of the same front-end results. These configurations are used to examine the scalability of the platform mechanism as concurrency increases, rather than to compare different front-end models. On this basis, the next subsection further compares the three collaborative execution schemes—plan1, plan2, and plan3—in terms of data transfer, shared-result organization, and synchronization control.
4.3. Comparison of Collaborative Execution Mechanisms
Based on the above process organization, three comparable collaborative execution schemes are implemented under the same task pipeline, front-end model, and hardware deployment conditions, namely, plan1, plan2, and plan3. The differences among these three schemes are mainly reflected in their inter-process data transfer methods, shared-result organization, and synchronization control mechanisms.
4.3.1. Queue-Based Baseline Scheme
plan1 adopts a message-queue-based inter-process communication method. Intermediate results are passed between processing stages through queues: once a preceding stage finishes execution, it writes the relevant data into a queue, and the subsequent stage reads the data from the queue to continue processing. The implementation logic of this scheme is relatively straightforward, making it suitable as the most basic system-level baseline.
Under this organization, image data, inference outputs, and structured results are mainly transferred across processes through queues. When front-end results need to be shared by multiple downstream tasks, the relevant data must be continuously propagated along the control flow. Therefore, the runtime behavior of plan1 is mainly characterized by queue-based serial communication.
4.3.2. Queue-and-Shared-Memory-Based Baseline Scheme
To reduce the data-copying overhead associated with pure queue-based transmission, plan2 introduces shared memory while retaining queue-based control flow. In this scheme, large-volume data are written into shared-memory regions, while addresses, indices, or control information are passed through queues, allowing the relevant processes to read the required content from the shared regions.
As shown in
Figure 3, under this scheme, part of the data exchange is shifted from direct queue-based value passing to shared-memory read/write combined with queue notification. For data such as front-end inference outputs and keypoint results that need to be accessed by multiple downstream tasks, plan2 provides a unified data-carrying region. However, in terms of runtime organization, the execution order of processes is still maintained mainly through queues. As a result, shared-data access and synchronization control are not yet fully separated.
4.3.3. Shared-Memory- and Event-Driven Collaborative Execution Scheme
Building on plan2, plan3 further refines the design of data sharing and synchronization control, thereby forming a collaborative execution mechanism based on shared memory and event-driven coordination. In this scheme, image data, front-end inference outputs, and the structured results generated by post-processing are all stored in shared objects managed centrally by the platform. Each processing unit performs data read and write operations through the shared regions, while the execution order and dependency relationships among processing stages are controlled in a unified manner by event objects. This design separates the data access path from the synchronization control path at runtime.
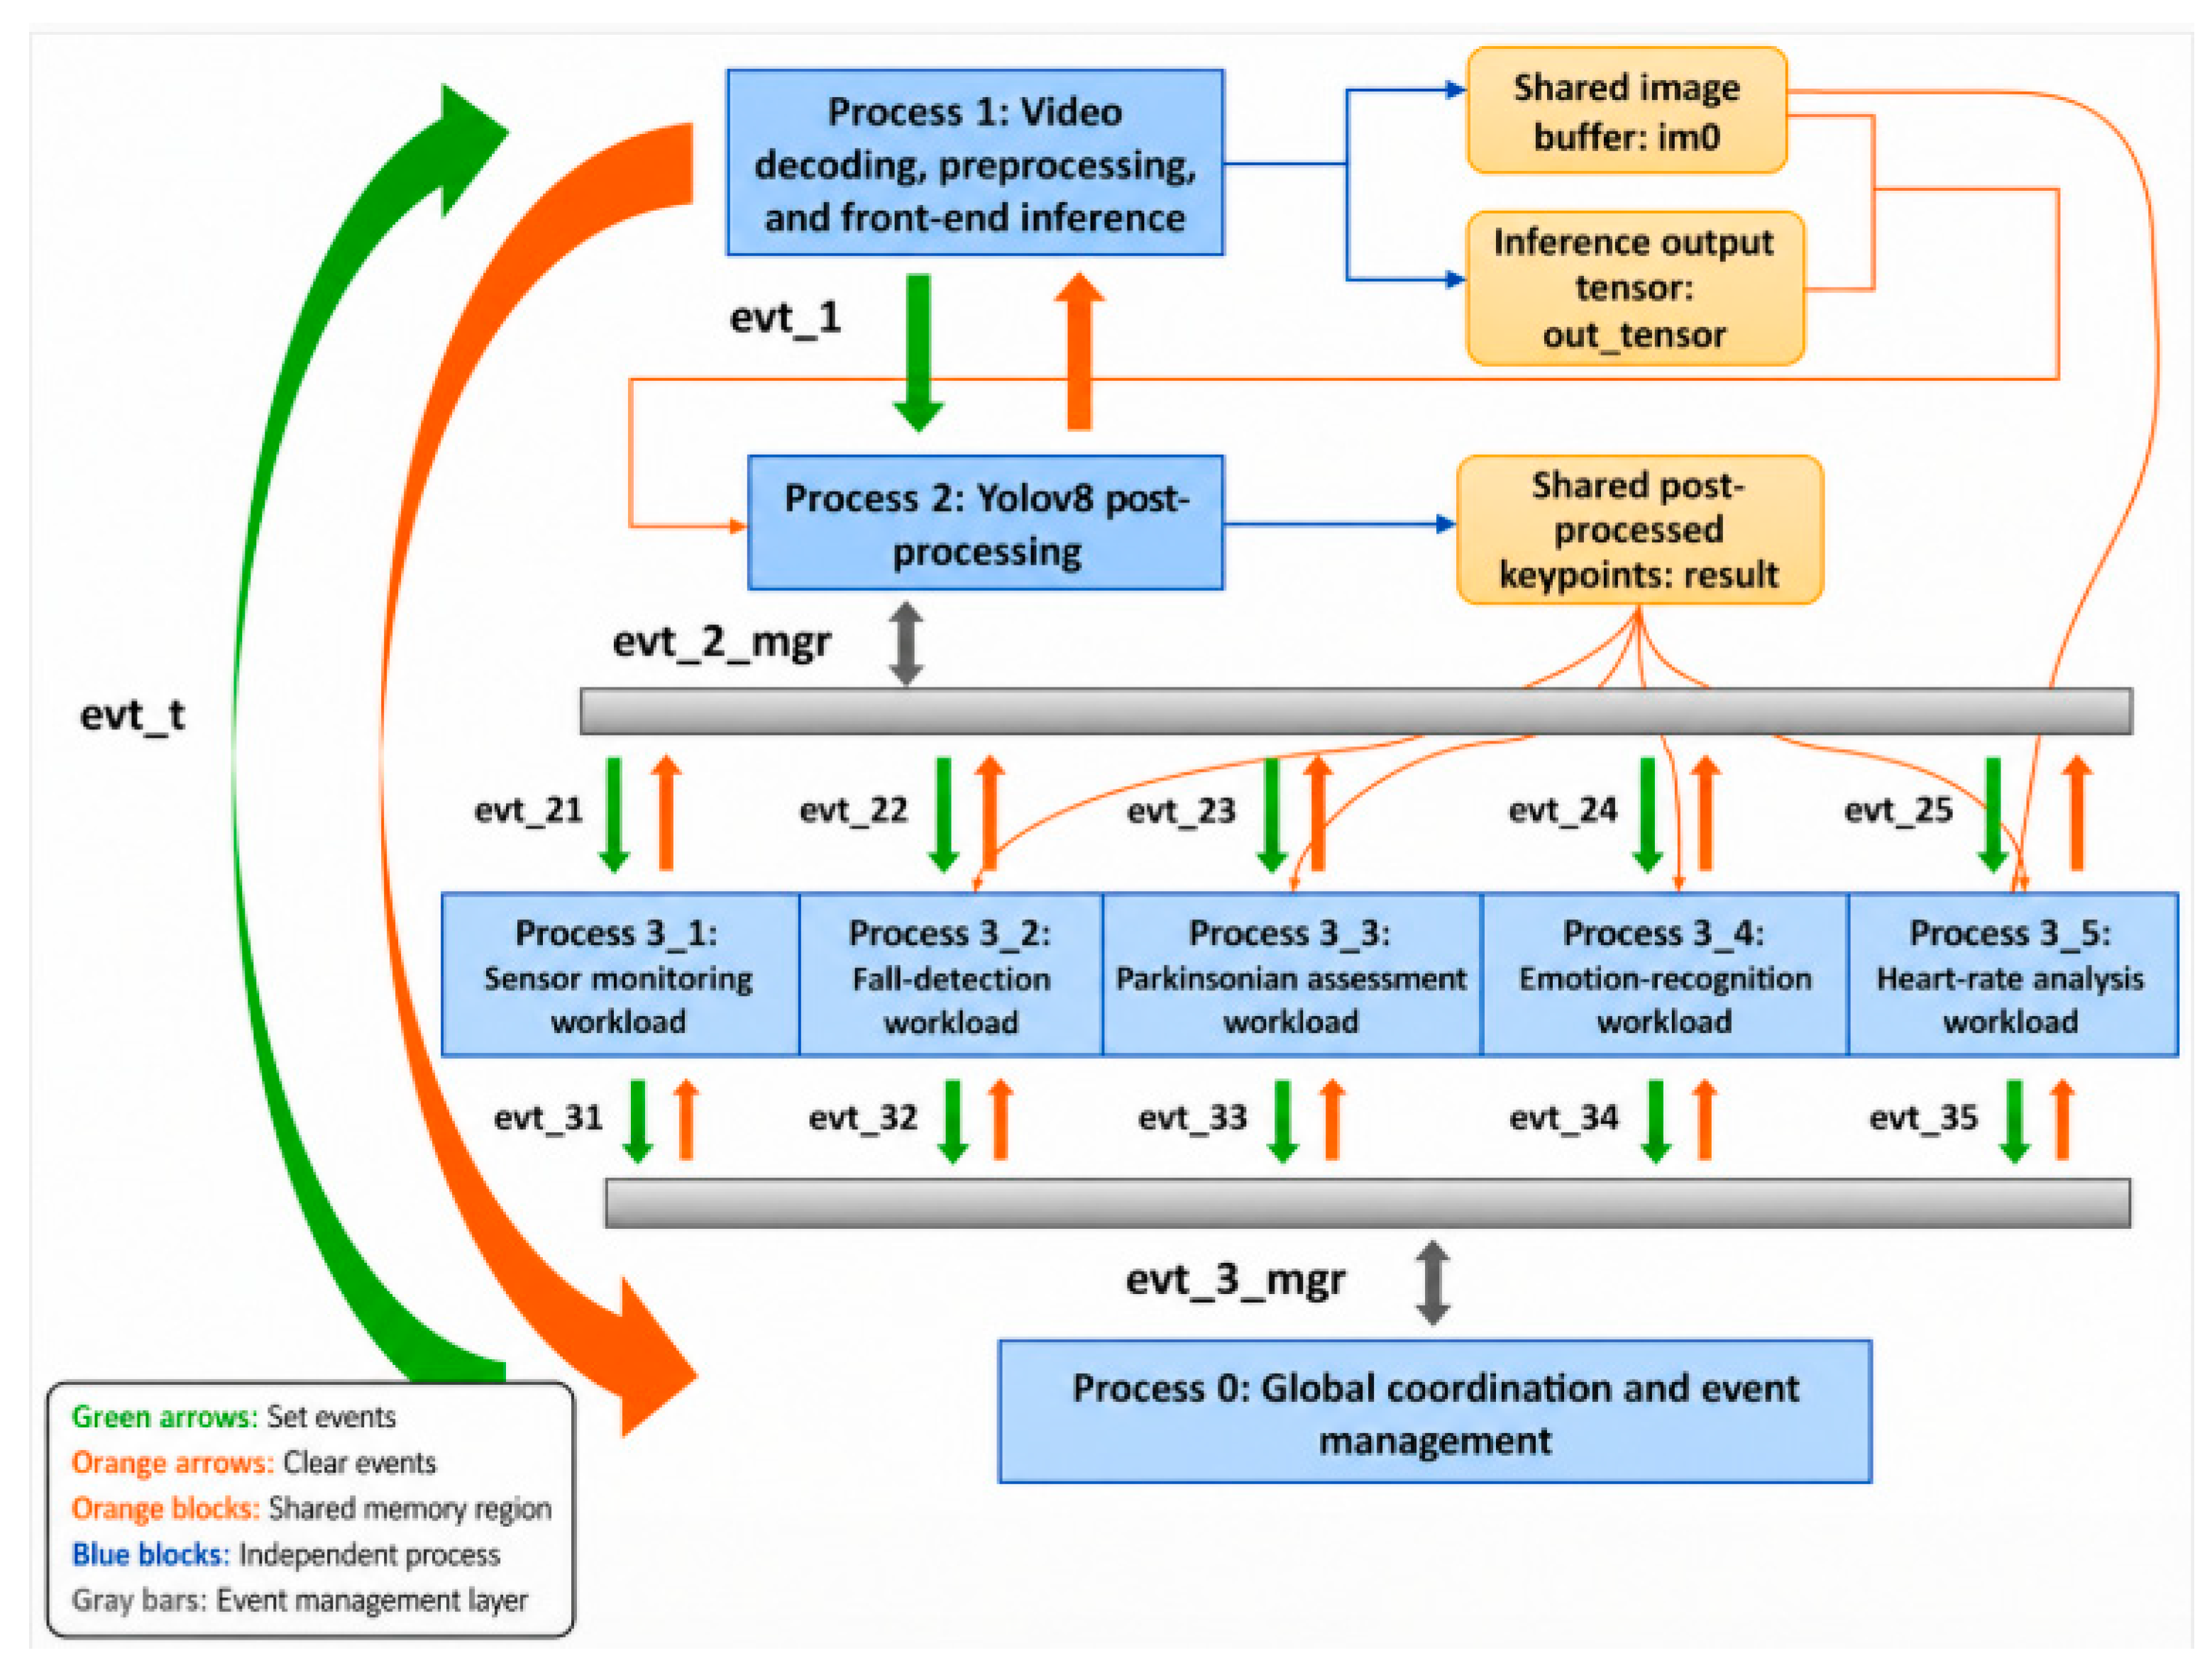
With reference to
Figure 4, one execution cycle of plan3 proceeds as follows. First, Process 1 completes video decoding, image preprocessing, and front-end pose inference and writes the relevant results into the shared regions. It then triggers the corresponding event to notify the subsequent stage to begin execution. After receiving this event, Process 2 reads the shared data, performs post-processing and keypoint generation, and writes the structured results into ‘shm_result’. Once the shared results are ready, the coordination process triggers a result-ready event. Multiple ‘Process 3_x’ workload instances then read the same shared results and execute their respective task-specific analyses. After all workload instances in the current round have completed execution, the system clears the event states and proceeds to the next processing round.
The key feature of plan3 lies in the establishment of a unified runtime coordination framework. Shared memory is used to hold data objects reused across stages, while the event mechanism describes the triggering conditions and execution dependencies among stages. In this way, the coordination relationships among front-end processing, shared-result generation, and multiple downstream workloads can be organized within a single framework. This mechanism reduces repeated propagation of intermediate results along the control flow and also lowers the waiting overhead introduced by serial stage notification.
When the system scales from ‘1algo’ to ‘3algo’, ‘5algo’, or ‘10algo’, plan3 does not require any adjustment to the front-end visual processing pipeline or to the organization of shared results. The system only needs to add the corresponding ‘Process 3_x’ instances and their associated events in order to expand the concurrency scale. Therefore, plan3 is better suited to multi-workload collaborative execution on pure-edge heterogeneous nodes. Based on this characteristic, this paper treats plan3 as the primary implementation scheme while using plan1 and plan2 as system-level baselines to compare the effects of different collaborative mechanisms on throughput, latency, and resource utilization.
To further clarify the runtime behavior of plan3, Algorithm 1 presents its event-driven coordination procedure.
| Algorithm 1. Runtime coordination procedure of plan3 |
Initialize shared-memory objects shm_im0, shm_tensor, and shm_result
Initialize global trigger event evt_t
Initialize stage event evt_1
Initialize manager events evt_2_mgr and evt_3_mgr
Initialize workload events evt_2[i] and evt_3[i] for each Process 3_i
Set evt_t
while the system is running do
Process 1 waits for evt_t
Decode the input frame and perform image preprocessing
Execute front-end pose inference
Write the image data to shm_im0
Write the inference output tensor to shm_tensor
Set evt_1
Clear evt_t
Process 2 waits for evt_1
Read shared data from shm_im0 and shm_tensor
Perform YOLOv8 post-processing and keypoint generation
Write structured results to shm_result
Set evt_2_mgr
Clear evt_1
Event manager waits for evt_2_mgr
for each workload process Process 3_i do
Set evt_2[i]
end for
Clear evt_2_mgr
for each workload process Process 3_i in parallel do
Wait for evt_2[i]
Read the required shared results from shm_result
Execute workload-specific analysis
Set evt_3[i]
Clear evt_2[i]
end for
Process 0 waits until all evt_3[i] are set
Set evt_3_mgr
Event manager waits for evt_3_mgr
Clear all evt_3[i]
Clear evt_3_mgr
Set evt_t
end while |
5. Experimental Evaluation
This section experimentally evaluates the runtime performance of the proposed platform. The evaluation includes comparisons of different schemes under single-workload and multi-workload settings, as well as the platform performance under multi-resolution inputs and long-term runtime settings. The experimental results are used to analyze the differences among collaborative execution mechanisms in terms of throughput, resource consumption, and runtime stability.
5.1. Experimental Setup
All experiments were conducted on the pure-edge CPU–TPU heterogeneous platform described in
Section 3.3. To ensure comparability, the three collaborative execution schemes shared the same front-end visual processing pipeline, the same downstream workload templates, and the same hardware deployment conditions, while the input video was uniformly replayed locally. The only varying factor in the experiments was the collaborative execution scheme, namely, plan1, plan2, or plan3, as defined in
Section 4.3.
To evaluate platform performance under different concurrency scales, four workload configurations were defined, namely, ‘1algo’, ‘3algo’, ‘5algo’, and ‘10algo’, where the number indicates the number of workload instances running concurrently. The single-workload experiment was used to provide a direct comparison among the three schemes under the basic configuration, whereas the multi-workload experiments were used to examine how platform behavior changed as the concurrency scale increased.
The single-workload benchmark used the heart-rate detection workload as the baseline test case. This workload depends on both raw image data and the front-end YOLOv8 outputs, and its data-access path is relatively complete while being more sensitive to single-frame latency. It therefore provides a suitable representation of the overall capability of the platform in terms of data transfer, concurrent processing, and synchronization management. The multi-workload experiments were constructed by increasing the number of concurrent instances of the same heart-rate detection workload to form the ‘3algo’, ‘5algo’, and ‘10algo’ configurations. Both the single-workload and multi-workload benchmarks used locally replayed video at 1280 × 720 p as the baseline input.
In addition to the workload-scale experiments, this study also included multi-resolution tests and long-term runtime tests. The multi-resolution tests used input sequences derived from the same source video at different resolutions to analyze the effect of input-scale variation on platform performance. The long-term runtime tests were designed to examine runtime continuity and resource stability under continuous operation.
The main metrics reported in this section include frame rate, single-frame latency, memory usage, CPU utilization, TPU utilization, and power-related indicators. Among them, power consumption is uniformly represented by estimated power, so as to reflect the relative power variation across different schemes. For the long-term runtime tests, particular attention is paid to changes in resource usage and runtime continuity during continuous system operation.
5.2. Single-Workload Comparison
To compare the runtime differences among the three collaborative execution schemes under the basic configuration, this subsection first presents the experimental results for the single-workload setting. The single-workload benchmark corresponds to one heart-rate detection workload instance. In this experiment, the input video replay, the front-end YOLOv8 pose estimation model, the downstream workload template, and the hardware deployment conditions were all kept unchanged. The only varying factor was the collaborative execution scheme, namely, plan1, plan2, or plan3, as defined in
Section 4.3. Therefore, these results directly reflect the impact of different collaborative mechanisms on platform performance without being affected by variations in task logic or input conditions.
The experimental results of the three schemes under the single-workload setting are presented in
Table 3.
As shown in
Table 3, plan3 achieves the best overall performance under the single-workload setting. Its average frame rate reaches 42.83 ± 0.28 fps, which is clearly higher than those of plan1 and plan2, while the average single-frame latency is reduced to 23.3 ± 0.15 ms. Compared with the other two schemes, plan3 delivers higher throughput and lower latency, indicating that the shared-memory and event-driven synchronization mechanism can effectively improve platform execution efficiency.
In terms of resource usage, plan3 also exhibits better resource control capability. Its net memory usage and net power consumption are both lower than those of plan1 and plan2, and its average power efficiency reaches 39.29 fps/W, significantly outperforming the other two schemes. These results indicate that the performance improvement of plan3 is not achieved through higher power input but rather through better system-level performance under lower resource consumption.
Taken together, the single-workload results show that the differences among the three schemes mainly stem from their runtime data-transfer and collaborative execution mechanisms. plan1 adopts a pure queue-based transmission method, which tends to introduce high communication overhead when data flow across multiple processes. Although plan2 introduces shared buffering, its overall workflow still retains strong queue dependence, and therefore its performance improvement remains limited. By contrast, plan3 reduces redundant data copying and waiting overhead through shared memory and event-driven synchronization, thereby achieving the best results across multiple system-level metrics, including frame rate, latency, memory usage, and energy efficiency. Further inspection of
Table 3 also shows that plan1 already exhibits a clear resource disadvantage under the single-workload condition, particularly in terms of net memory usage, which is substantially higher than that of the other two schemes. This suggests that the pure queue-based transmission mechanism is unlikely to support stable operation at higher concurrency levels on the current platform. Therefore, plan1 is more appropriate as a basic reference scheme than as the primary comparison target in the subsequent multi-workload scaling experiments. On this basis, the next subsection focuses on comparing the runtime differences between plan2 and plan3 under multi-workload settings.
5.3. Multi-Workload Comparison
To further evaluate platform performance under increasing concurrency, three configurations, namely, ‘3algo’, ‘5algo’, and ‘10algo’, were defined in this subsection, corresponding to 3, 5, and 10 concurrent heart-rate detection workload instances, respectively. The analysis focuses on the runtime differences between plan2 and plan3 under multi-workload settings. The corresponding results are presented in
Table 4,
Table 5 and
Table 6.
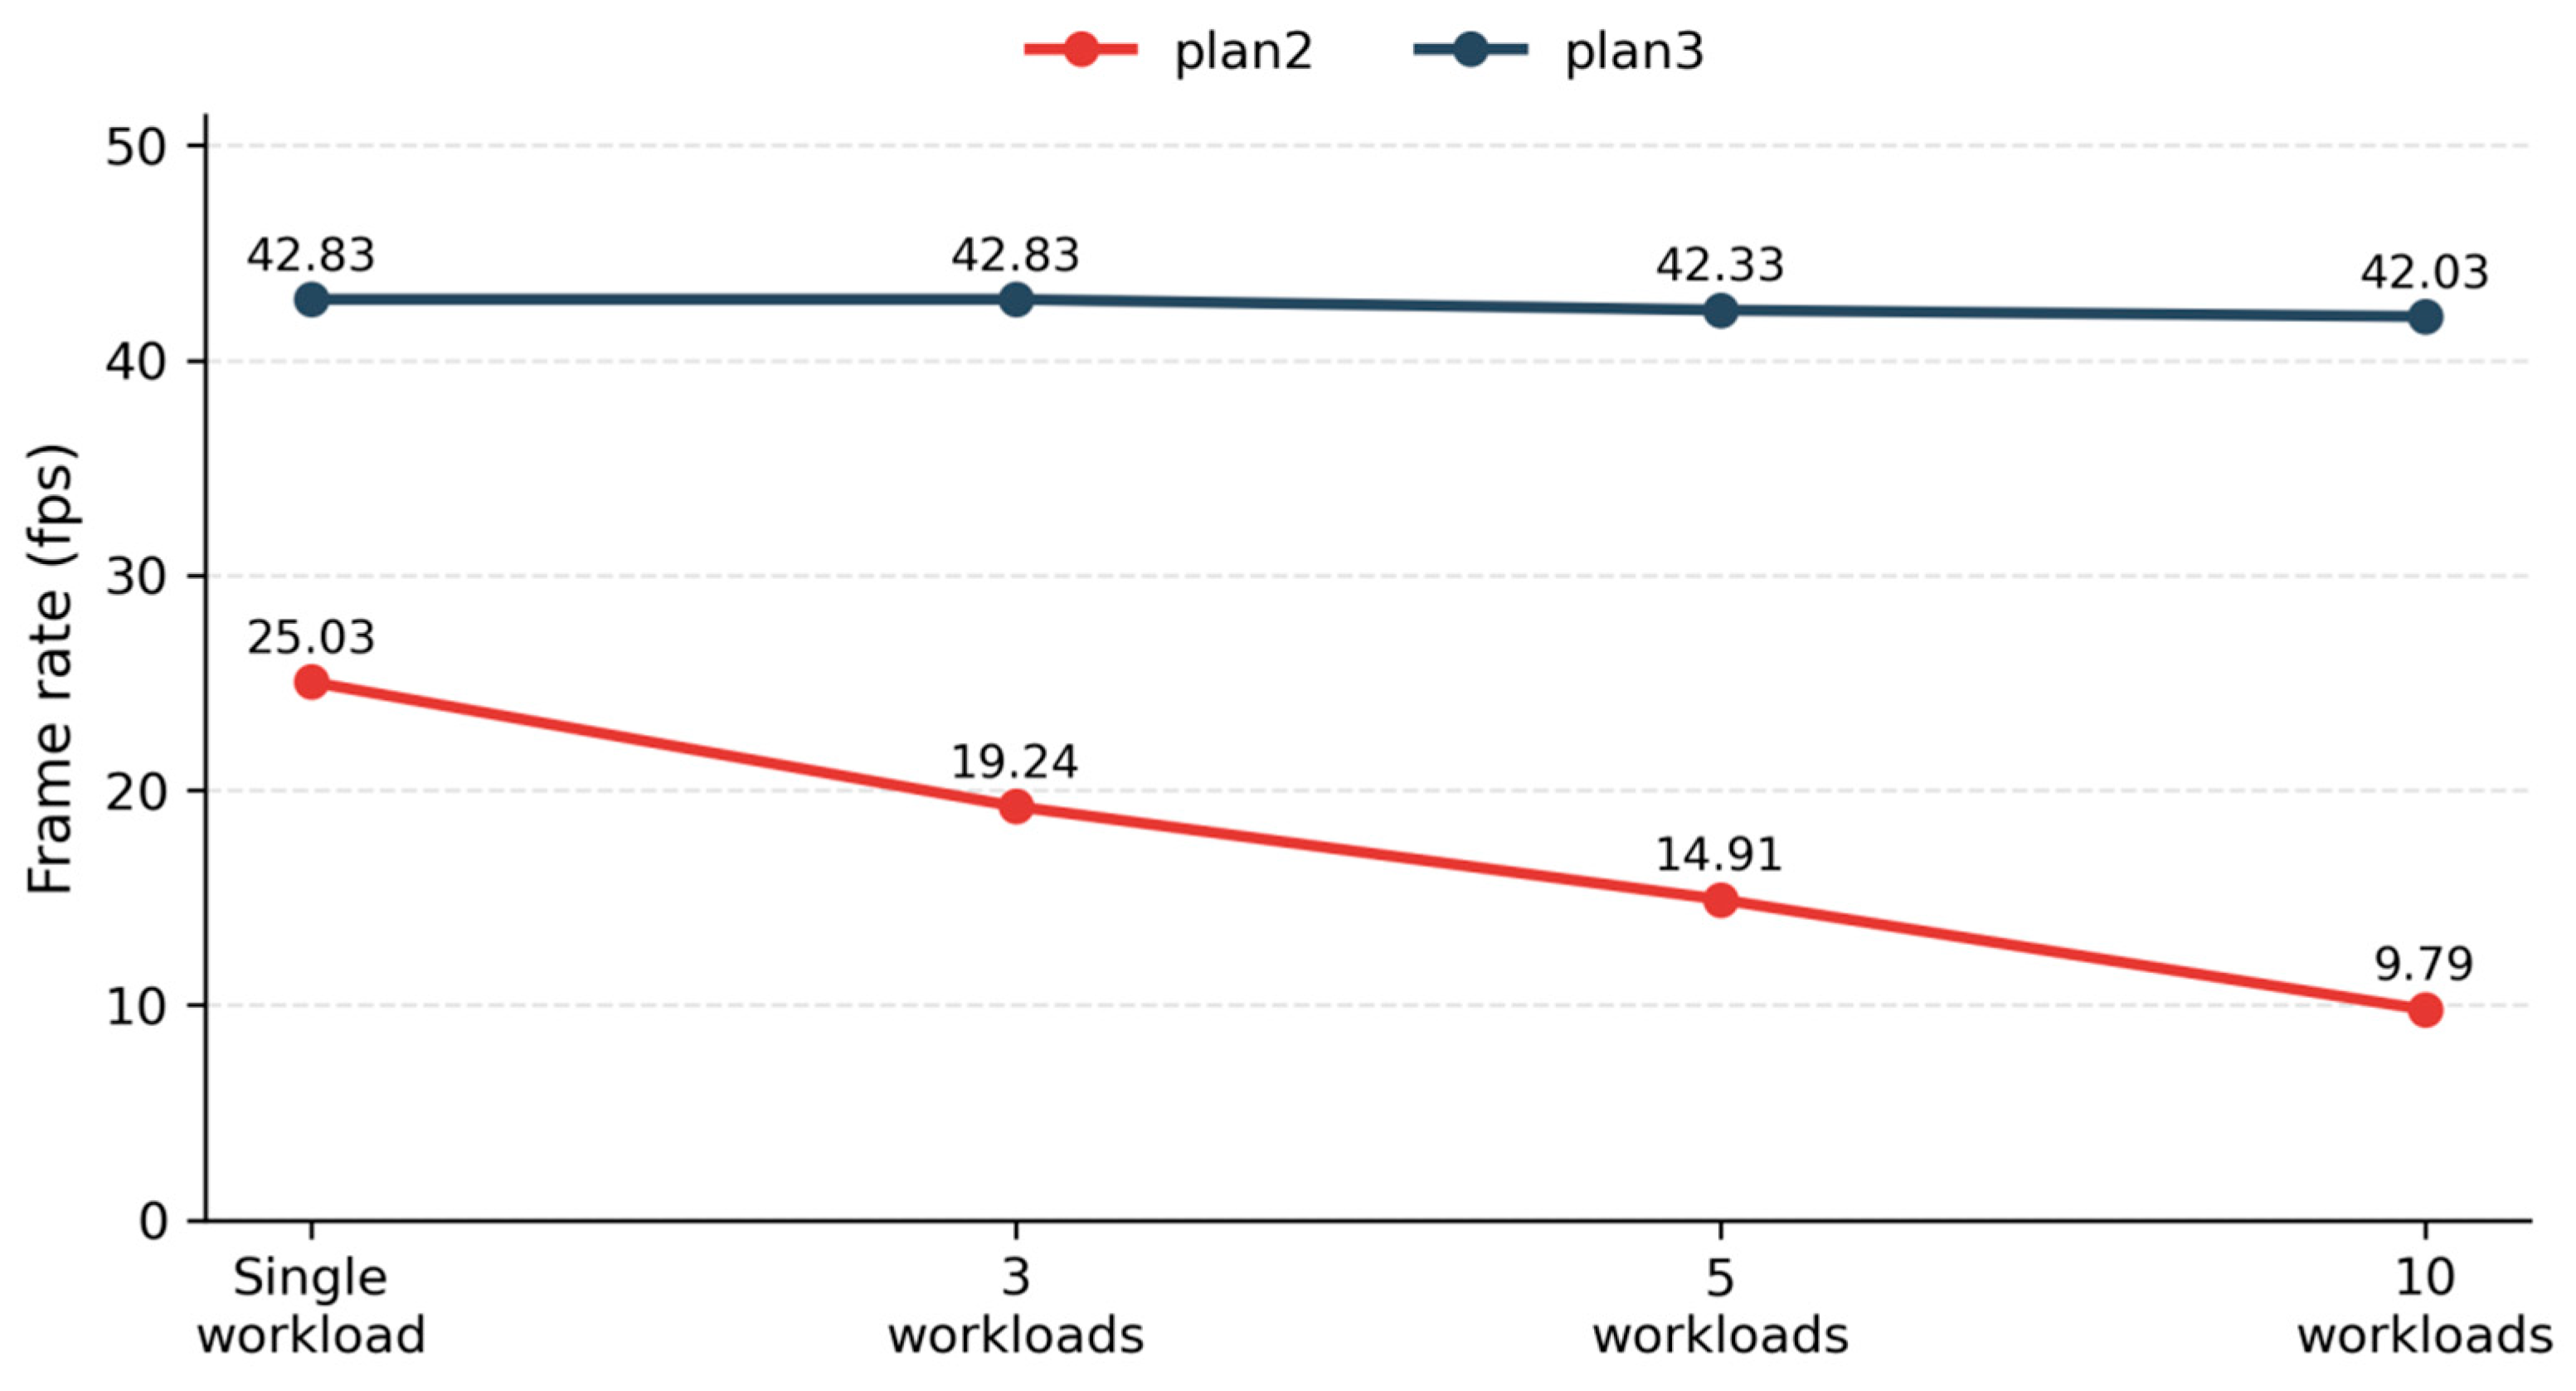
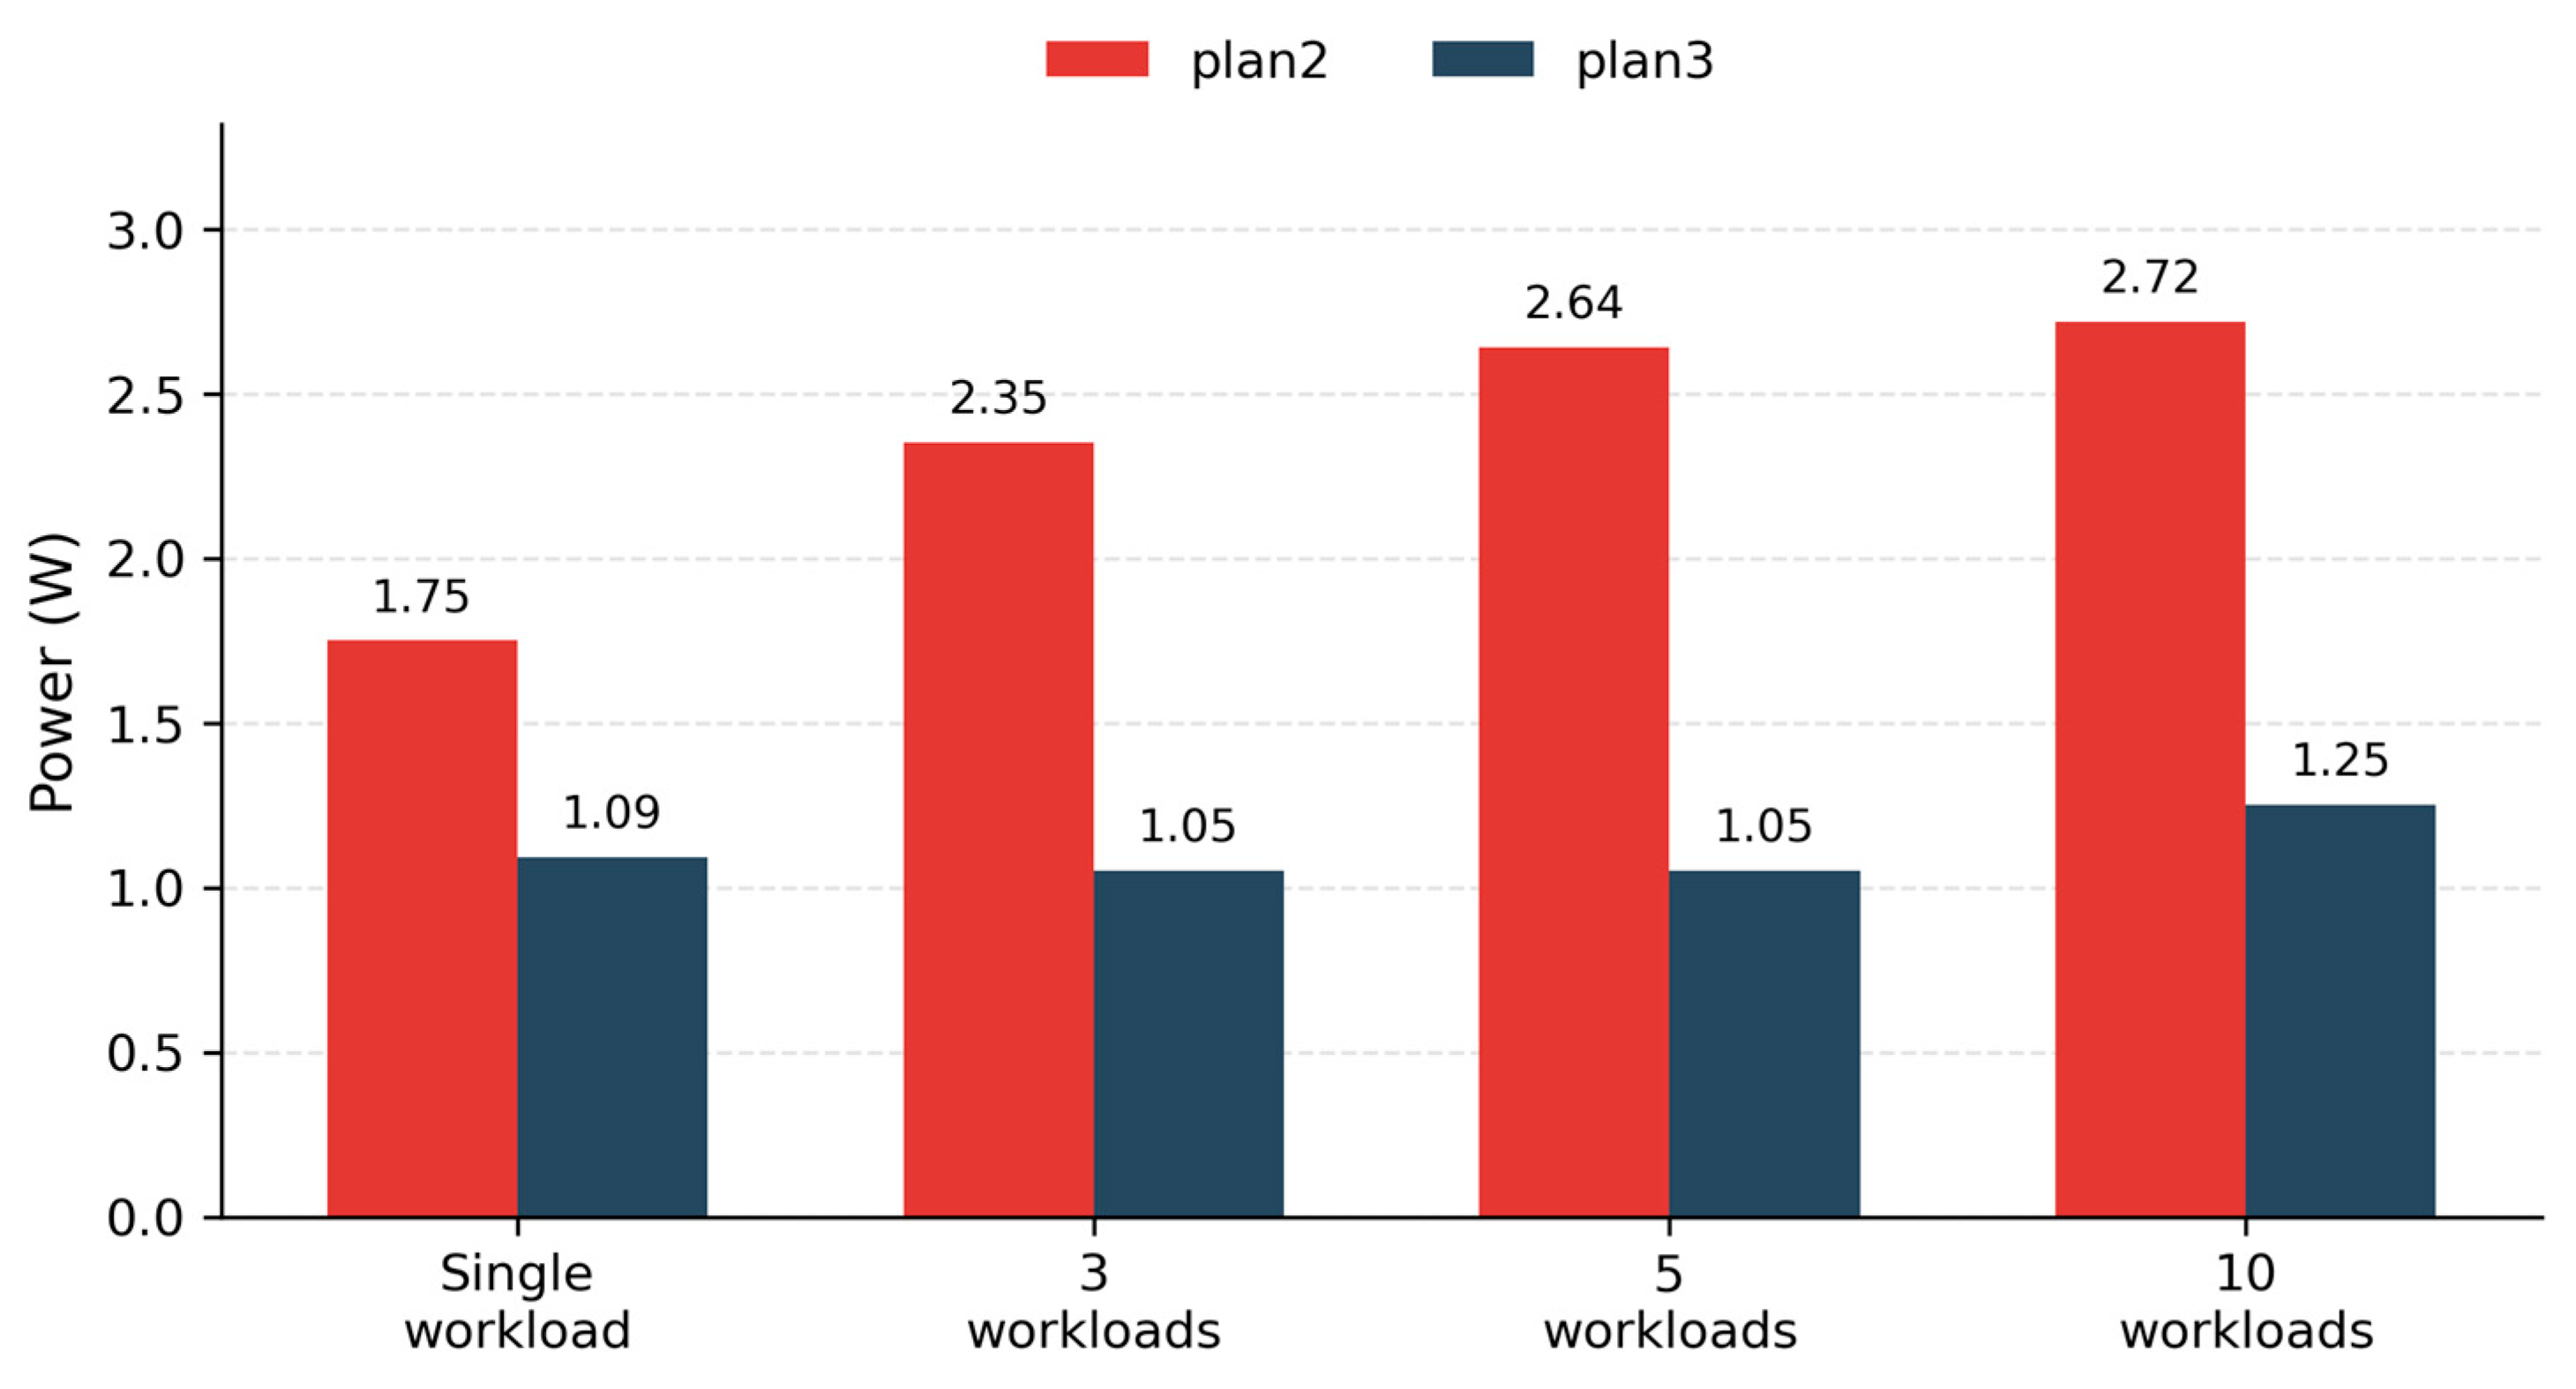
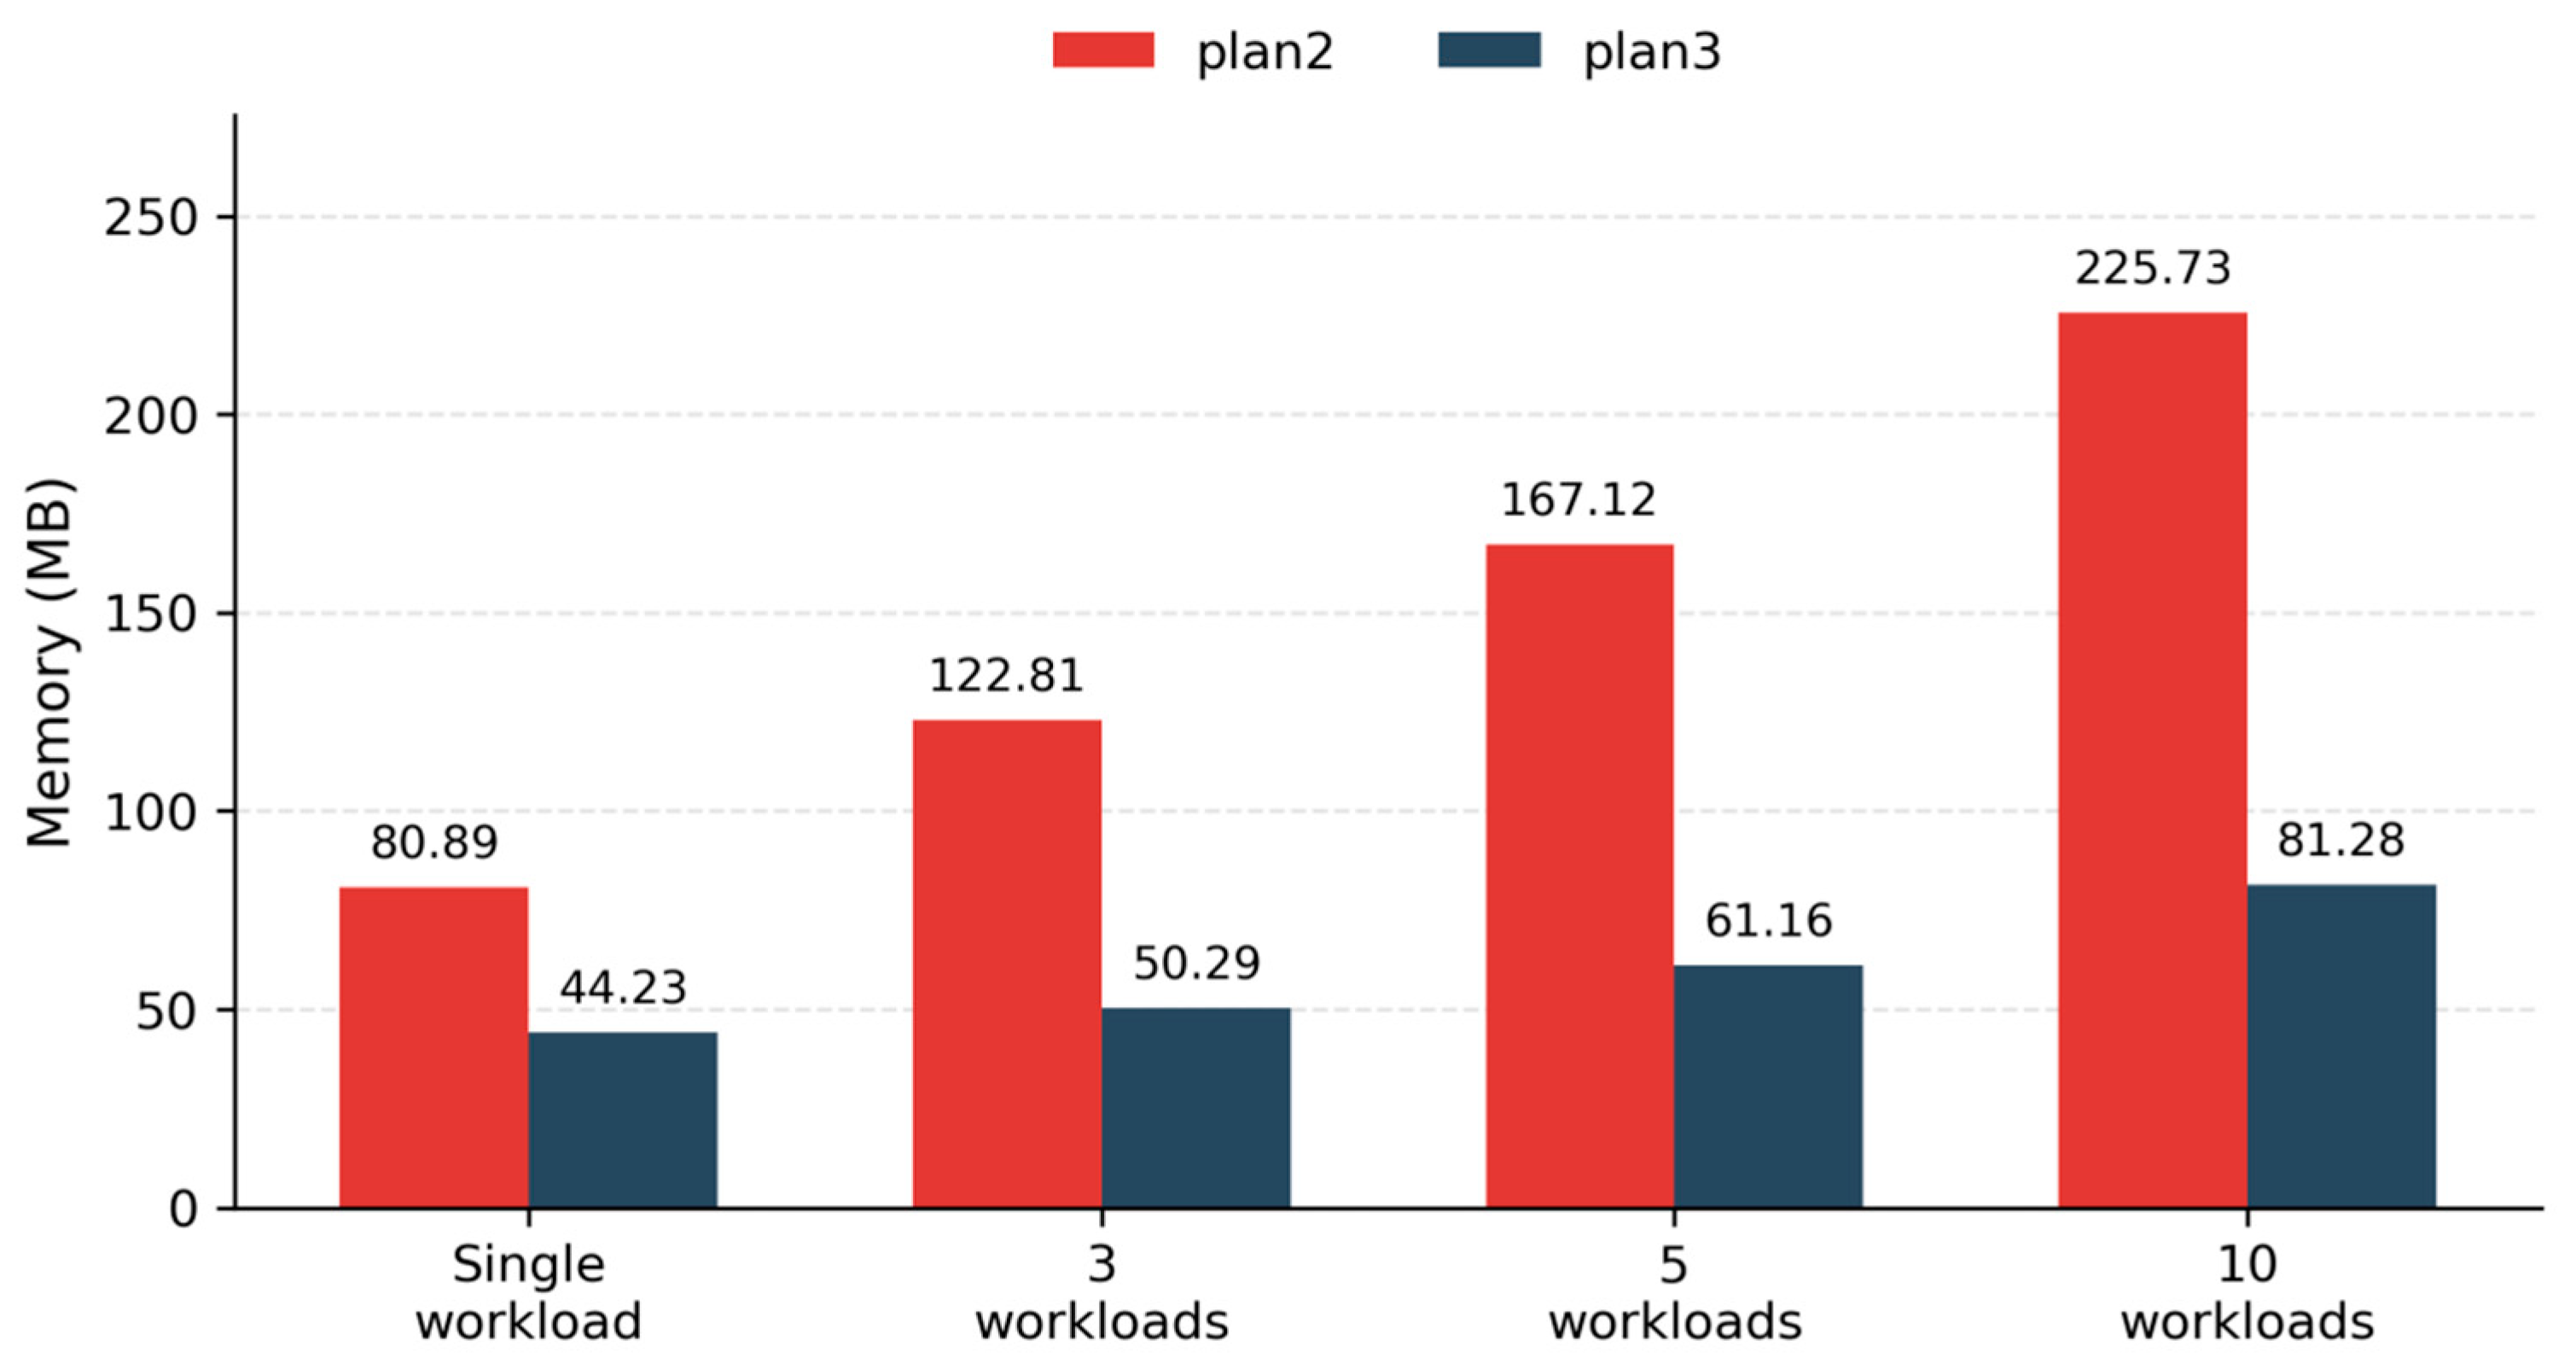
To facilitate observation of the variation trends from the single-workload setting to the multi-workload settings,
Figure 5,
Figure 6 and
Figure 7 present the changes in power consumption, memory usage, and average frame rate of plan2 and plan3 under different workload configurations, respectively.
Under the ‘3algo’ configuration, plan2 and plan3 already show a clear divergence in performance. The results indicate that the average frame rate of plan2 drops to 19.24 fps, whereas plan3 remains above 42 fps. This suggests that when the downstream workload expands from a single instance to three concurrent instances, the throughput of plan2 decreases markedly, while plan3 is still able to maintain high and stable processing efficiency.
As the concurrency scale continues to increase, the performance degradation of plan2 becomes even more pronounced. Under the ‘5algo’ and ‘10algo’ configurations, the average frame rate of plan2 continues to decline, while memory usage continues to increase. Taking the single-workload result as a reference, the average frame rate of plan2 decreases from 25.03 fps to 9.79 fps under the ‘10algo’ condition, whereas the average net memory usage increases from 80.89 MB to 225.73 MB. These results indicate that as the number of workload instances keeps increasing, the communication and coordination overhead of plan2 accumulates rapidly, thereby constraining platform throughput.
By contrast, plan3 exhibits better scalability and stability under multi-workload settings. When the system scales from the single-workload setting to ‘10algo’, the average frame rate of plan3 decreases only slightly, from 42.83 fps to 42.03 fps. Meanwhile, the average net memory usage remains at a relatively low level, the single-frame latency is controlled within 24 ms, and the power consumption stays within the range of 1.05–1.25 W. These results indicate that plan3 is still able to maintain high throughput and stable resource control as the concurrency scale increases.
Taken together, the results in
Table 4,
Table 5 and
Table 6,
Figure 5,
Figure 6 and
Figure 7 show that the platform differences under multi-workload settings are mainly reflected in concurrency scalability. As the number of workload instances increases, plan2 suffers from a clear throughput decline and continuously accumulating resource overhead, whereas plan3 maintains a stable frame rate, lower latency, and a more gradual resource growth trend even at higher concurrency levels. These results indicate that the collaborative execution mechanism based on shared memory and event-driven synchronization is better suited to concurrent multi-workload execution on pure-edge heterogeneous nodes and further validates the scalability and stability of the proposed task scheduling and management platform under high-concurrency conditions.
5.4. Multi-Resolution Evaluation
The foregoing experiments have verified the runtime advantages of the proposed platform under the baseline resolution. However, in practical edge deployment scenarios, the input video resolution may vary, and it is therefore necessary to further analyze the impact of resolution changes on system-level performance and resource consumption. To highlight the effect of input resolution on platform behavior, this subsection fixes plan3 and ‘5algo’ as the test configuration. By processing locally replayed video sequences at different resolutions, the influence of input-scale variation on frame rate, single-frame latency, memory usage, power consumption, and TPU/CPU utilization is examined, thereby enabling an analysis of the performance boundary of the current platform for sustaining real-time processing.
As shown in
Table 7, when the input resolution increases from 1280 × 720 p to 2560 × 1438 p, the average frame rate of the system decreases from 42.33 fps to 23.33 fps, while the average single-frame latency increases from 23.62 ms to 42.88 ms. This indicates that a larger input scale reduces system throughput and prolongs task response time. Meanwhile, the average memory usage rises from 61.16 MB to 82.0 MB, suggesting that higher-resolution inputs introduce additional data buffering and processing overhead. By contrast, the average power consumption remains within the range of 1.03–1.06 W, indicating that the platform still maintains relatively stable resource control across different resolution settings.
It is worth noting that as the resolution increases, TPU utilization does not rise but instead decreases from 43.5% to 26.4%. This phenomenon suggests that the performance degradation at higher resolutions does not mainly originate from the TPU inference stage but is more likely related to the front-end data supply process. To further analyze this issue, the time overhead of key processing stages under different resolution settings was measured, and the results are reported in
Table 8.
Taken together,
Table 7 and
Table 8 show that the CPU-side decoding and preprocessing times increase by 76% and 42%, respectively, whereas the TPU inference time increases by only 2%. This indicates that as the input resolution increases, the front-end data production cycle becomes significantly longer, preventing subsequent tasks from being submitted to the TPU in a timely manner and causing the TPU to wait for input data. This is also the main reason why the frame rate decreases while TPU utilization declines rather than increases. By contrast, although the post-processing stage also shows some increase, it is not the dominant factor causing the throughput reduction.
Overall, the multi-resolution experiments demonstrate that the proposed task scheduling and management platform still maintains relatively stable resource control under different input scales. The performance degradation caused by higher resolutions mainly reflects the bottleneck of the front-end data processing pipeline under the current hardware conditions, rather than a failure of the shared-memory- and event-driven collaborative mechanism itself. This result further indicates that the proposed platform can operate stably under different resolution settings, while also revealing the real-time processing boundary of the current system under high-resolution inputs.
5.5. Long-Term Runtime Stability Evaluation
To further validate the operational stability of the platform under continuous deployment conditions, long-term runtime testing was conducted in this subsection. The experiment was carried out on the Sophgo SE5 hardware platform equipped with a 1920 × 1080p@30 fps camera module and integrated sensor modules for body temperature, health monitoring, and millimeter-wave radar sensing. Under this hardware and sensor configuration, the system ran continuously for 10 days, during which multiple representative real-time video-based workloads and sensor data acquisition tasks were processed in parallel. The purpose of this experiment was not to repeat the controlled benchmark tests presented earlier but rather to evaluate runtime continuity and resource stability of the platform under pure-edge deployment conditions from a long-term operational perspective. The corresponding results are shown in
Table 9.
As shown in
Table 9, under continuous operation, the system achieves an average frame rate of 29.3 ± 0.6 fps, which is close to the hardware output limit of the 30 fps camera, while the average single-frame latency is 34.1 ± 0.75 ms. These results indicate that the platform is still able to maintain stable video-stream processing during long-term continuous operation, suggesting that the overall processing pipeline—from video acquisition and decoding to multi-workload collaborative execution—retains high operational efficiency.
From the perspective of computing-resource utilization, the system maintains relatively stable resource usage throughout the long-term runtime test. The TPU utilization is 32.1%, indicating that the heterogeneous computing resources remain in a stable working state under continuous operation. Meanwhile, the system CPU utilization stays at approximately 25%, and the system memory usage remains stable at around 790 MB. These results suggest that no obvious resource expansion occurs while the platform continuously executes multiple representative workloads and sensor-processing tasks. The system therefore retains sufficient computation and storage margins, which is beneficial for long-term deployment in continuous-operation scenarios.
Overall, the long-term runtime experiment verifies the sustained operating capability of the proposed platform under pure-edge deployment conditions. During the 10-day continuous runtime, the platform maintains stable frame-rate output, low latency, and steady system resource usage. This demonstrates that the platform not only achieves favorable throughput and resource efficiency under controlled experiments but also satisfies the stability and reliability requirements of long-term continuous-operation scenarios. These results further support the deployment feasibility of the proposed platform as a collaborative execution foundation for pure-edge heterogeneous nodes.
5.6. Discussion and Limitations
Under controlled conditions with the same hardware deployment, front-end visual processing pipeline, input video, and workload template, the differences in throughput, single-frame latency, memory usage, power consumption, and energy efficiency reported in
Table 3,
Table 4,
Table 5 and
Table 6 can be attributed to differences in collaborative execution mechanisms. From the single-workload to the multi-workload results, it can be seen that the proposed plan3 not only achieves higher processing efficiency under the basic configuration but also exhibits more gradual resource growth and more stable frame-rate retention as the concurrency scale increases. This indicates that the shared-memory- and event-driven synchronization mechanism is better suited to concurrent execution on pure-edge heterogeneous nodes.
In this section, a unified heart-rate detection workload and its scaled concurrent instances are used as the test workload in order to maintain consistent experimental boundaries across different workload scales, thereby allowing the comparison to focus on the platform’s capabilities in data sharing, task scheduling, and synchronization management. Accordingly, the platform is evaluated using system-level metrics, including frame rate, single-frame latency, memory usage, power consumption, and CPU/TPU utilization, whereas task-level recognition accuracy is not treated as a primary evaluation metric in this section.
Table 7,
Table 8 and
Table 9 further provide system-level evidence of platform behavior under varying input scales and continuous runtime conditions. The multi-resolution experiments show that the performance degradation at higher resolutions is mainly related to the increased overhead of the front-end data supply stage, whereas the long-term runtime experiment verifies the sustained operating capability of the platform under pure-edge deployment conditions. Taken together, these results show that the effectiveness of the proposed platform is mainly reflected in three aspects: collaborative execution efficiency, concurrency scalability, and long-term runtime stability.
Nevertheless, the results of this study should be interpreted within several scope boundaries. First, the proposed platform focuses on node-level runtime coordination on a single pure-edge CPU–TPU heterogeneous node. Inter-node communication, distributed edge scheduling, network protocol optimization, and edge–cloud offloading decisions are beyond the scope of this work. Second, the experiments are conducted on one specific hardware platform and software environment. The quantitative results may vary across different heterogeneous edge devices and runtime configurations. Third, this study evaluates system-level performance, including throughput, latency, resource usage, and runtime stability. Task-level recognition accuracy and clinical effectiveness are not the primary objectives of this work and require further evaluation in larger and more diverse smart care scenarios.
6. Conclusions
This paper presents a node-level task scheduling and management platform for multi-workload smart elderly care on a single pure-edge CPU–TPU heterogeneous node. Centered on shared memory and an event-driven synchronization mechanism, the platform establishes a data-sharing and task-scheduling path suitable for pure-edge deployment. Among the implemented schemes, plan3 is the collaborative execution scheme proposed in this work.
The experimental results show that, under controlled conditions with the same hardware deployment, front-end visual processing pipeline, input video, and workload template, the proposed plan3 outperforms plan1 and plan2 across multiple system-level metrics, including throughput, single-frame latency, memory usage, power consumption, and energy efficiency. In particular, under multi-workload settings, plan3 maintains more stable frame-rate performance and a more gradual resource growth trend as the concurrency scale increases, thereby demonstrating better concurrency scalability. The multi-resolution experiments further show that the platform maintains relatively stable resource control under different input scales, whereas the long-term runtime experiments verify its sustained operating capability and system stability under pure-edge deployment conditions.
Overall, this work demonstrates the effectiveness of node-level collaborative execution for multi-workload smart care on pure-edge heterogeneous devices. The proposed platform improves runtime efficiency, concurrency scalability, and long-term stability through shared-memory data reuse and event-driven synchronization. This study focuses on runtime coordination within a single pure-edge CPU–TPU heterogeneous node. It does not address inter-node communication, distributed edge scheduling, network protocol optimization, or edge–cloud offloading decisions. Future work will extend the proposed node-level coordination mechanism to multi-node edge environments and edge–cloud collaborative architectures. Further studies will focus on distributed task offloading, resource scheduling, and adaptive service management.