


Abstract
Network dismantling—the targeted removal of nodes to degrade large-scale connectivity—plays a central role in resilience analysis, epidemic containment, and systemic-risk mitigation. Recent work shows that dismantling performance depends strongly on mesoscale modular structure, suggesting that community-aware strategies may offer advantages over classical centrality-based heuristics. In this work, we perform a large-scale, systematic evaluation of dismantling strategies and introduce gateways as a new mesoscale dismantling concept. While similar experiments exist using degree- and betweenness-based dismantling strategies, we check a new strategy based on gateways, which capture asymmetric entry points into communities and generalize the notion of inter-community connectors. Furthermore, we process a massive dataset of 568,584 LFR benchmark graphs, covering a wide range of degree distributions, community sizes, and mixing parameters. For evaluation, we use both extrinsic (ARI, NMI, FMI, VI) and intrinsic (Modularity, Coverage, Performance, Average Conductance, Average Internal Density) metrics. We find that across parameter regimes and evaluation metrics, classical strategies (degree, betweenness, community connections) and gateway-based dismantling exhibit broadly similar performance. Our results also corroborate recent findings that dismantling effectiveness is robust to the specific partitioning algorithm and that inter-community connectivity plays a dominant role in global fragmentation. The evaluation provides large-scale evidence that gateway-aware dismantling captures an operationally relevant mesoscale mechanism as good as previous approaches and motivates further empirical studies on real networks and cost-aware settings.
1. Introduction
Community detection—identifying groups of nodes more tightly connected to each other than to the rest of a network—is a central tool in network science, because communities often correspond to functionally or semantically meaningful units (e.g., modules in biological networks, functional clusters in infrastructure, and topical groups in social systems). Accurately finding communities enables targeted interventions, interpretable summaries of large-scale systems, and improved downstream tasks (recommendation, spreading control, resilience analysis); therefore, it is crucial for both basic research and applied decision-making [1,2,3].
Network dismantling—the strategic removal of nodes to disrupt connectivity in complex systems—is a foundational task in domains such as infrastructure protection, epidemic containment, and systemic-risk mitigation. While existing approaches range from simple heuristics based on centrality (degree, betweenness, etc.) to optimization- or learning-based algorithms, they often fail to generalize across very different topologies and do not always learn task-specific notions of node importance. Recent work frames dismantling as a supervised or ranking problem that can leverage graph learning architectures to predict node importance and thereby improve dismantling performance while remaining scalable [4,5].
This perspective is supported by empirical findings across multiple domains. In social networks, individuals occupying brokerage positions between communities facilitate information diffusion and innovation, as formalized in Burt’s theory of structural holes [6]; removing or down-weighting such actors can expose latent community boundaries. In epidemiological networks, inter-community links are critical pathways for disease propagation [7,8] between otherwise localized outbreaks, and targeted immunization of bridge nodes has been shown to significantly reduce epidemic size [9]. Similarly, in infrastructure systems such as power grids or transportation networks, inter-modular connectors often represent critical vulnerabilities whose failure can trigger large-scale fragmentation [10]. In biological networks, proteins or genes that connect functional modules are frequently associated with pleiotropic effects and system-level regulation, and are associated with system-level regulation and cross-module coordination, aiding functional decomposition [11].
From a methodological standpoint, several lines of work have hinted at the interplay between dismantling and community detection. Percolation-based approaches and optimal percolation theory identify minimal sets of influential nodes whose removal dismantles the giant connected component [12], and these sets are often enriched in inter-community connectors. Likewise, spectral and modularity-based methods implicitly rely on the relative sparsity of inter-community edges, which are precisely the links targeted during effective dismantling [13]. More recently, robustness studies have emphasized that modular networks exhibit characteristic fragmentation patterns when subjected to targeted attacks, further reinforcing the idea that dismantling trajectories encode information about community structure [3].
Recent studies highlight that targeting inter-community connectors effectively fragments networks [14]. We reuse the gateway nodes introduced by Rollo et al. [15] and later used in [16], which act as asymmetric entry points into communities and generalize the notion of inter-community connectors. Our study evaluates how gateway-based dismantling compares to classical heuristics across a wide range of synthetic network conditions, particularly in scenarios where controlling flow into communities is operationally relevant.
2. Methods
2.1. Overall Methodological Framework
Our methodology follows a five-stage workflow designed to isolate how dismantling strategies affect post-removal community structure. First, we generate LFR benchmark graphs over a broad parameter grid and retain only valid parameter combinations accepted by the generator. Second, for each generated graph, we apply one of the considered dismantling strategies to remove a prescribed fraction of nodes. Third, we run community detection on the residual graph using the Leiden algorithm, chosen for its robustness and scalability. Fourth, we compare the recovered partitions using both extrinsic metrics against the planted LFR communities and intrinsic quality metrics defined on the detected partition itself. Finally, we aggregate results over seeds and parameter settings, and summarize variability using dispersion measures, sign tests, and 95% Student-t confidence intervals for the mean.
This framework separates the roles of graph generation, intervention, partition recovery, and evaluation, making it easier to interpret whether observed differences arise from network structure, from the dismantling heuristic, or from the downstream community detection step. The following subsections detail each component of this pipeline.
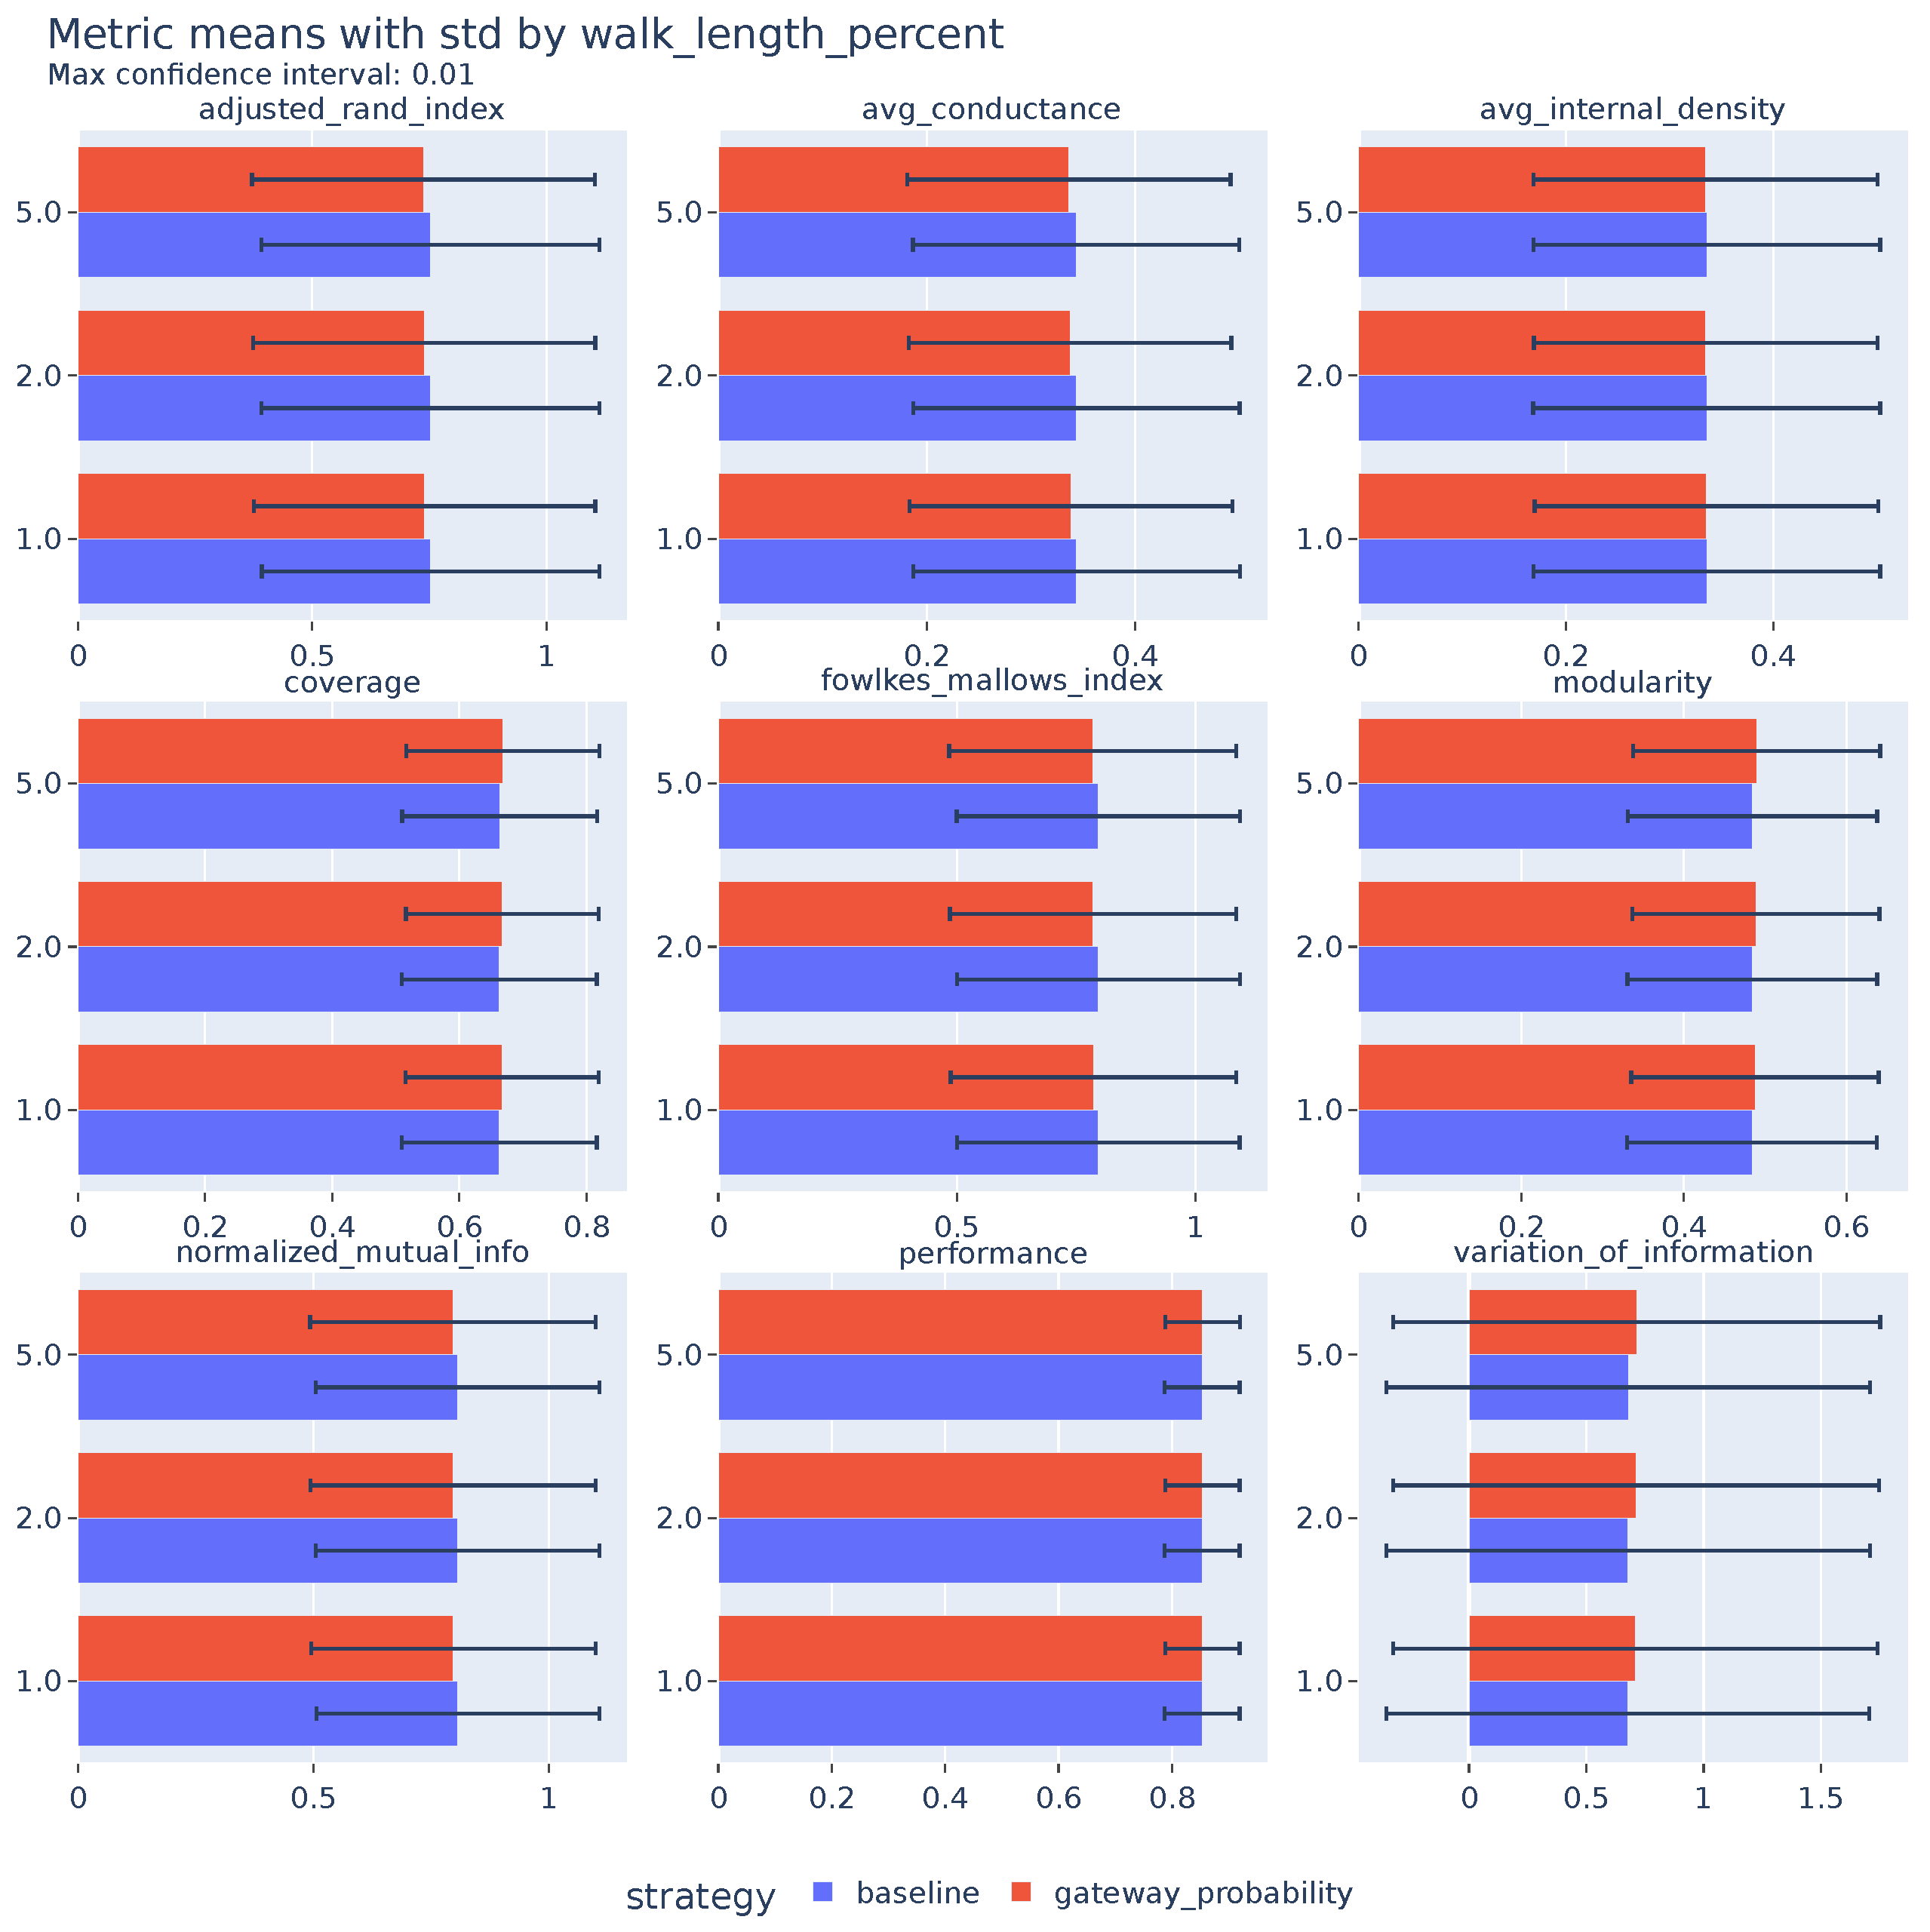
2.2. Graph Dismantling
We investigate how different graph dismantling strategies influence community detection outcomes. Specifically, we consider three foundational heuristics—degree-based, betweenness-based, and community connection removal—chosen for their simplicity, interpretability, and strong baseline performance. Each heuristic captures a distinct notion of what constitutes a “structurally important” node and can alter the modular structure after dismantling, thereby affecting subsequent community detection.
Degree-based dismantling removes nodes in descending order of degree, targeting hubs that maintain substantial local connectivity. Early studies showed that scale-free networks are highly vulnerable to the removal of high-degree nodes, rapidly shrinking the giant connected component [17]. However, because degree does not differentiate between intra- and inter-community links, this strategy may be inefficient in networks where global connectivity depends on a small number of inter-community bridges rather than high-degree nodes within dense communities [18].
Betweenness-based dismantling targets nodes with high betweenness centrality, i.e., nodes lying on many shortest paths. As a classical proxy for flow intermediaries [19], betweenness effectively identifies bottlenecks in modular networks, where global connectivity relies on narrow bridges. Studies show that betweenness-based attacks can outperform degree-based strategies when connectivity is path-mediated [20]. Limitations include higher computational cost and reliance on shortest-path assumptions, which may not reflect real diffusion processes.
Community connection dismantling prioritizes nodes that link multiple communities, either by counting distinct communities connected or by evaluating the strength of cross-community edges. Nodes with modest degree but extensive inter-community connections may be more critical than high-degree nodes confined to a single module [14,21]. This heuristic operationalizes a mesoscale principle of network robustness: global fragmentation occurs primarily when inter-community structure is disrupted.
Together, these heuristics span the spectrum of dismantling strategies: local density disruption (degree), path-mediated control (betweenness), and mesoscale structural severing (community connections). They provide the foundation for more advanced approaches, including community-aware and flow-based extensions such as gateways, conditional betweenness, and learned dismantling policies.
Recent work has highlighted the importance of inter-community connectors in controlling network structure. Musciotto and Miccichè [14] propose a unifying framework that prioritizes nodes bridging distinct communities. Across diverse synthetic and empirical networks and multiple community detection realizations, targeting inter-community connectors consistently yields robust dismantling outcomes, largely independent of the partitioning algorithm. This confirms that inter-community links are a broadly effective mesoscale target.
Building on these insights, we use the concept of gateways as a complementary dismantling target, following [16]. Gateways are related to bridges, but are defined differently because they focus on asymmetric entry points into communities under a probabilistic flow model: while bridges describe inter-community connectors, gateways represent nodes through which externally induced probabilistic flow (from random walk dynamics) predominantly enters a module [15,16]. Intuitively, a bridge highlights structural connectivity between communities, whereas a gateway highlights a primary ingress point for externally originating flow.
Formally, the following applies:
- Bridges connect two specific communities by mediating directed probabilistic flow between them (i.e., random walk transition flow on an undirected graph). Let be an undirected graph with adjacency matrix A and degree matrix D, and let denote the transition matrix of a simple random walk. Let denote the restart probability.Consider two distinct communities . Define the restart distribution concentrated on X:Let denote the stationary distribution of the corresponding random walk with restart (RWR), satisfyingFor nodes , we define the bridge score from X to Y asThus, measures the steady-state probability mass assigned to node s under a random walk biased to originate in X. Nodes in Y with high serve as primary conduits through which flow originating in X reaches Y, and are therefore designated as bridges from X to Y.
- Gateways act as asymmetric entry points into a single community from the rest of the network. Let be an undirected graph with adjacency matrix A and degree matrix D. Let denote the row-stochastic transition matrix of a simple random walk. Let denote the restart probability.For a given community , define the restart distributionConsider a random walk with restart (RWR) whose stationary distribution satisfiesFor nodes , we define the gateway scoreThus, measures the steady-state probability mass assigned to node s under a random walk biased to originate outside X. Nodes with high spend more long-run walk mass under externally seeded dynamics and are interpreted as high-exposure ingress nodes for X. This is a stationary-flow notion (occupation probability), not a first-passage probability. Removing such nodes reduces the accessibility of X from the rest of the network while largely preserving its internal structure.
Integrating gateways with bridge-focused strategies generalizes Musciotto & Miccichè’s framework, enabling interventions that disrupt both global connectivity and community-specific ingress. We evaluate this approach on 568,584 LFR benchmark graphs, far exceeding previous studies in number of graphs analyzed, providing statistically robust evidence on gateway-based dismantling and its interaction with classical heuristics.
Gateway scores can be computed via attention-flow or random walk models conditioned on origin communities, or via conditional betweenness measures that weight entry paths more heavily than exit paths. In this paper, we use the stationary RWR-based definition above; if first-entry (first-passage) probabilities are desired, they should be modeled explicitly as a different quantity. These conditional definitions allow for cost-aware removal schedules and can be combined with other centrality or learned importance scores (see Section 2.3).
Empirical evidence shows that inter-community connector strategies are robust across network types and community detection methods [14]. Adding gateway-focused interventions is therefore a low-risk extension likely to improve performance in applications where controlling community ingress—such as blocking contagions, misinformation, or coordinated flows—is critical [14,15,16].
Although both concepts (bridges and gateways) can be applied to graph dismantling, previous work shows that differences on practical datasets are minor, with most (around 80%) gateways also being bridges [16]. Therefore, to reduce computational cost while retaining most structural information, we focus exclusively on gateways in this analysis.
2.3. Leiden Algorithm
For all experiments, we use the Leiden algorithm to compute partitions. The Leiden algorithm is an improvement on the popular Louvain approach: it retains the modularity-optimization spirit while guaranteeing that communities are well-connected and improving both partition quality and convergence behavior. Practically, Leiden alternates between local moving of nodes, refinement of communities into subcommunities, and aggregation; these improvements avoid the problem that Louvain can produce disconnected communities and allow Leiden to continue making improvements after early iterations where Louvain stalls. Empirically, Leiden often finds higher-quality partitions and runs faster than Louvain on both benchmark and empirical networks [22].
Recent engineering and algorithmic advances have focused on scaling Leiden to very large graphs and on shared-memory parallel implementations that preserve Leiden’s quality guarantees while dramatically increasing throughput. Notably, recent work describes a fast, shared-memory implementation of Leiden (GVE-Leiden/Fast Leiden) that achieves substantial speedups on multi-core servers by careful parallelization of the local-move and refinement steps, enabling Leiden-based partitioning on graphs with hundreds of millions to billions of edges in practical timescales [23].
Using Leiden for our community-aware dismantling evaluation provides two advantages: (1) robust, well-connected communities that avoid spurious disconnected clusters which could confound gateway/bridge identification, and (2) a scalable pipeline so that community-aware dismantling methods can be evaluated on larger synthetic or empirical networks with realistic sizes.
2.4. Community Detection Evaluation
We evaluate the impact of each removal strategy on post-dismantling community detection using the LFR benchmark (Lancichinetti–Fortunato–Radicchi), a standard synthetic generator for community-structured networks that allows power-law degree and community size distributions and tunable mixing parameters. LFR remains the reference benchmark for controllable ground-truth communities [24]. The LFR model is widely used in modern complex-network work and is often paired with empirical-case evaluations; recent surveys and reviews continue to rely on LFR as a primary synthetic testbed for robustness studies [3,24].
- LFR setup and parameters.
For our experiments, we start from the full Cartesian product of parameter values and retain only valid combinations accepted by the LFR generator using the networkit library [25]. This discards invalid parameters, e.g., where is smaller than .
- ‘‘N’’: [100, 1000],
- ‘‘k_fraction’’: [0.05, 0.1],
- ‘‘maxk_fraction’’: [0.05, 0.1, 0.2, 0.3],
- ‘‘minc_fraction’’: [0.05, 0.1, 0.2, 0.3],
- ‘‘maxc_fraction’’: [0.05, 0.1, 0.2, 0.3],
- ‘‘tau’’: [2.0, 2.5, 3.0],
- ‘‘tau2’’: [1.0, 1.5, 2.0],
- ‘‘mu’’: [0.1, 0.3, 0.5],
- ‘‘seed’’: range(0, 3)
The LFR generator requires that certain combinations of these parameters be internally consistent to produce a feasible graph (for example, average degree cannot exceed the maximum degree, and community sizes must partition the node set without overlap). In this context, a valid combination means a parameter configuration that satisfies the LFR model’s intrinsic constraints—i.e., one that allows the generator to successfully construct a connected graph with the desired distributions and without producing empty or overlapping communities. Invalid combinations (e.g., those where the maximum community size exceeds the number of nodes, or the degree exponent and average degree are incompatible) are automatically filtered out.
Table 1 describes the meaning of each parameter:
Table 1.
Summary of network generation parameters.
Together, these parameters allow for systematic exploration of the LFR space, spanning from small, dense, clearly modular graphs to large, sparse, weakly modular ones. By including all valid combinations, we ensure that each experimental condition corresponds to a realizable network configuration and that the subsequent evaluations sample broadly from the space of plausible topologies and modular structures.
Node removal is performed using a static ranking protocol for all strategies. Specifically, for each generated graph, we compute each strategy score once on the original (pre-removal) network, rank nodes accordingly, and then remove the top fraction of nodes without recomputing scores after intermediate deletions. Thus, this study evaluates one-shot targeted dismantling, not adaptive (iterative re-scoring) dismantling.
The graph dismantling parameters for all methods are shown in Table 2.
Table 2.
Dismantling parameters for different strategies.
Taking into account the full Cartesian product of all LFR parameters, we initially obtain 20,736 unique parameter configurations. Combining these with the Cartesian product of all dismantling strategies (180) yields a theoretical total of 3,732,480 experimental configurations. After filtering out invalid parameter combinations (e.g., those where ) and excluding cases where graph generation failed due to random-seed issues or intrinsic LFR limitations, we successfully generated and analyzed 568,584 graphs. This corresponds to roughly 15% of the full configuration space. Although this fraction may seem low, it primarily reflects the necessary removal of infeasible or unstable configurations, rather than an arbitrary reduction. Configurations that fail during generation due to the LFR benchmark framework itself represent an area for potential future investigation, but are beyond the scope of this study.
Evaluation is performed with both extrinsic (supervised, by comparison to ground-truth partitions) and intrinsic (unsupervised, quality-of-partition) metrics. This choice is intentional: classical dismantling studies typically optimize global connectivity targets (e.g., minimizing the giant connected component), whereas our primary research question is complementary—how different node removal policies reshape mesoscale recoverability of communities after “damage”. In other words, we evaluate not only whether the graph fragments, but also whether the remaining structure is easier or harder to partition into meaningful modules. Table 3 shows the summary of intrinsic and extrinsic evaluation metrics.
Table 3.
Summary of intrinsic and extrinsic clustering evaluation metrics.
2.4.1. Extrinsic (Partition Comparison) Metrics
These metrics compare an algorithm’s partition to a reference (ground-truth) partition and therefore require labeled communities (as in LFR).
- Adjusted Rand Index (ARI)
The Rand index counts pairwise agreements (pairs of nodes that are in the same cluster in both partitions or in different clusters in both partitions). The Adjusted Rand Index corrects the Rand index for chance, producing a score of 1 for perfect agreement and an expected value of 0 for random labelings (under the generalized hypergeometric model). Unlike unadjusted pairwise agreement measures, ARI can take negative values when agreement is worse than expected by chance. ARI is symmetric, bounded above by 1, and is widely used because of its interpretability in terms of pair-counting agreement. See Hubert & Arabie for the original formulation and modern discussions of ARI properties and interpretation [26,27].
- Normalized Mutual Information (NMI)
NMI measures shared information between two partitions, normalized to produce values typically in (with 1 indicating identical partitions). It is based on mutual information from information theory and has variants that differ in normalization (arithmetic mean, geometric mean, or maximum entropy). NMI captures how much knowing the cluster label from one partition reduces uncertainty about the other partition and is robust to differing numbers of clusters between partitions [28].
- Fowlkes–Mallows Index (FMI)
The Fowlkes–Mallows index is the geometric mean of precision and recall when viewing clustering as a pairwise classification problem: pairs assigned to the same cluster by the algorithm that are actually in the same ground-truth cluster count as true positives, etc. FMI ranges from 0 to 1 (1 = perfect match); it is sensitive to pairwise agreement and has recent analyses comparing it to other binary-pair measures such as Matthews correlation coefficient [29,30].
- Variation of Information (VI)
VI is an information-theoretic distance between partitions: it measures the amount of information lost and gained when moving from one partition to another (equivalently, the sum of entropies minus twice the mutual information). VI is a true metric on the space of partitions (satisfies the triangle inequality) and has useful additive properties that make it attractive for rigorous comparisons across experimental conditions. Lower VI indicates more similar partitions; unlike ARI or NMI, VI is not normalized to and is unbounded as the system size grows, but for a fixed number of nodes n, it is bounded (with a maximum on the order of , depending on the logarithm base and partition conventions) [31].
2.4.2. Intrinsic (Quality) Metrics
These scores evaluate partition quality without reference to ground-truth; they measure structural properties of the partition that often correlate with usefulness for downstream tasks.
- Modularity
Modularity quantifies the density of edges within communities compared to a null model (typically the configuration or Erdős–R’enyi model); high modularity indicates more within-community edges than expected at random. It is probably the most widely used objective and evaluation measure for community detection, though it is known to suffer from a resolution limit (missing small communities) and degeneracy issues in very large graphs [1,32].
- Coverage
Coverage is the fraction of edges that fall within communities (the number of intra-community edges divided by the total number of edges). It is a simple measure of how much of the network’s connectivity is captured as internal to communities; by itself, it can be misleading (e.g., trivial partitions that put all nodes in one community have coverage 1) but in combination with other metrics, it is informative [2].
- Performance
Performance measures the fraction of correctly classified node pairs (pairwise accuracy): node pairs in the same cluster that are connected, plus node pairs in different clusters that are not connected, divided by the total number of possible node pairs. Like coverage, it can be biased by trivial partitions but is useful as a quick structural diagnostic [2].
- Average Conductance
Conductance for a single community is a measure of how well the community is separated from the rest of the graph. A common definition normalizes the number (or weight) of edges leaving the community by the minimum of the volumes of the community and its complement:
where is the sum of degrees of nodes in S, and counts edges connecting S to .
Average Conductance is the mean of across all communities. Lower values indicate communities that are more internally dense and well-separated from the rest of the graph. Note that other variants exist, e.g., normalizing by the total degree of the community or by the total number of edges in the graph [33].
- Average Internal Density
Average Internal Density is the fraction of possible internal edges that actually exist inside a community. Averaging this over communities gives a sense of how densely connected communities are internally (high values indicate cohesive modules). This metric complements conductance by focusing on intra-community cohesion rather than separation from the rest of the graph [34].
Both extrinsic and intrinsic metrics are useful: extrinsic metrics (ARI, NMI, FMI, VI) permit direct quantification of how well an algorithm recovers planted or labeled structure (crucial for the LFR benchmark), while intrinsic metrics (Modularity, Coverage, Performance, Average Conductance, Average Internal Density) reveal structural qualities that often matter for downstream interventions such as dismantling. Because Musciotto et al. show strong robustness of dismantling performance across community detection algorithm realizations, our evaluation reports both classes of metrics so that the effect of algorithmic variation and the structural role of gateways/bridges can be disentangled [14]. We therefore position this framework as complementary to classical giant-component analyses: the latter quantify global collapse, while our metrics quantify post-dismantling community fidelity and separability.
3. Results
We first investigated the effect of node removal strategies on community detection performance. The analysis was conducted on a total of 568,584 unique graphs, including 292,104 graphs of size 100 and 276,480 graphs of size 1000. In line with the study objective, results are interpreted through the lens of community recoverability rather than as a replacement for canonical giant-component dismantling benchmarks.
Figure 1, Figure A1, Figure A2, Figure A3, Figure A4, Figure A5, Figure A6, Figure A7, Figure A8, Figure A9, Figure A10 and Figure A11 summarize key evaluation metrics across four node removal strategies, betweenness, degree, community connections, and gateway probability, alongside the baseline (no nodes removed). Figure A10 and Figure A11 present parameters specific to the gateway probability dismantling strategy.
3.1. Metric and Strategy by Single Parameter
We first examine the impact of individual parameters on each removal strategy. This analysis identifies patterns in how parameters influence evaluation metrics. For instance, if high and low Adjusted Rand Index (ARI) values occur across both large and small graphs for a given strategy, it indicates no systematic relationship between the parameter and the metric. Notably, this lack of consistent trends occurs for most parameter–metric–strategy combinations, and we focus here only on anomalies.
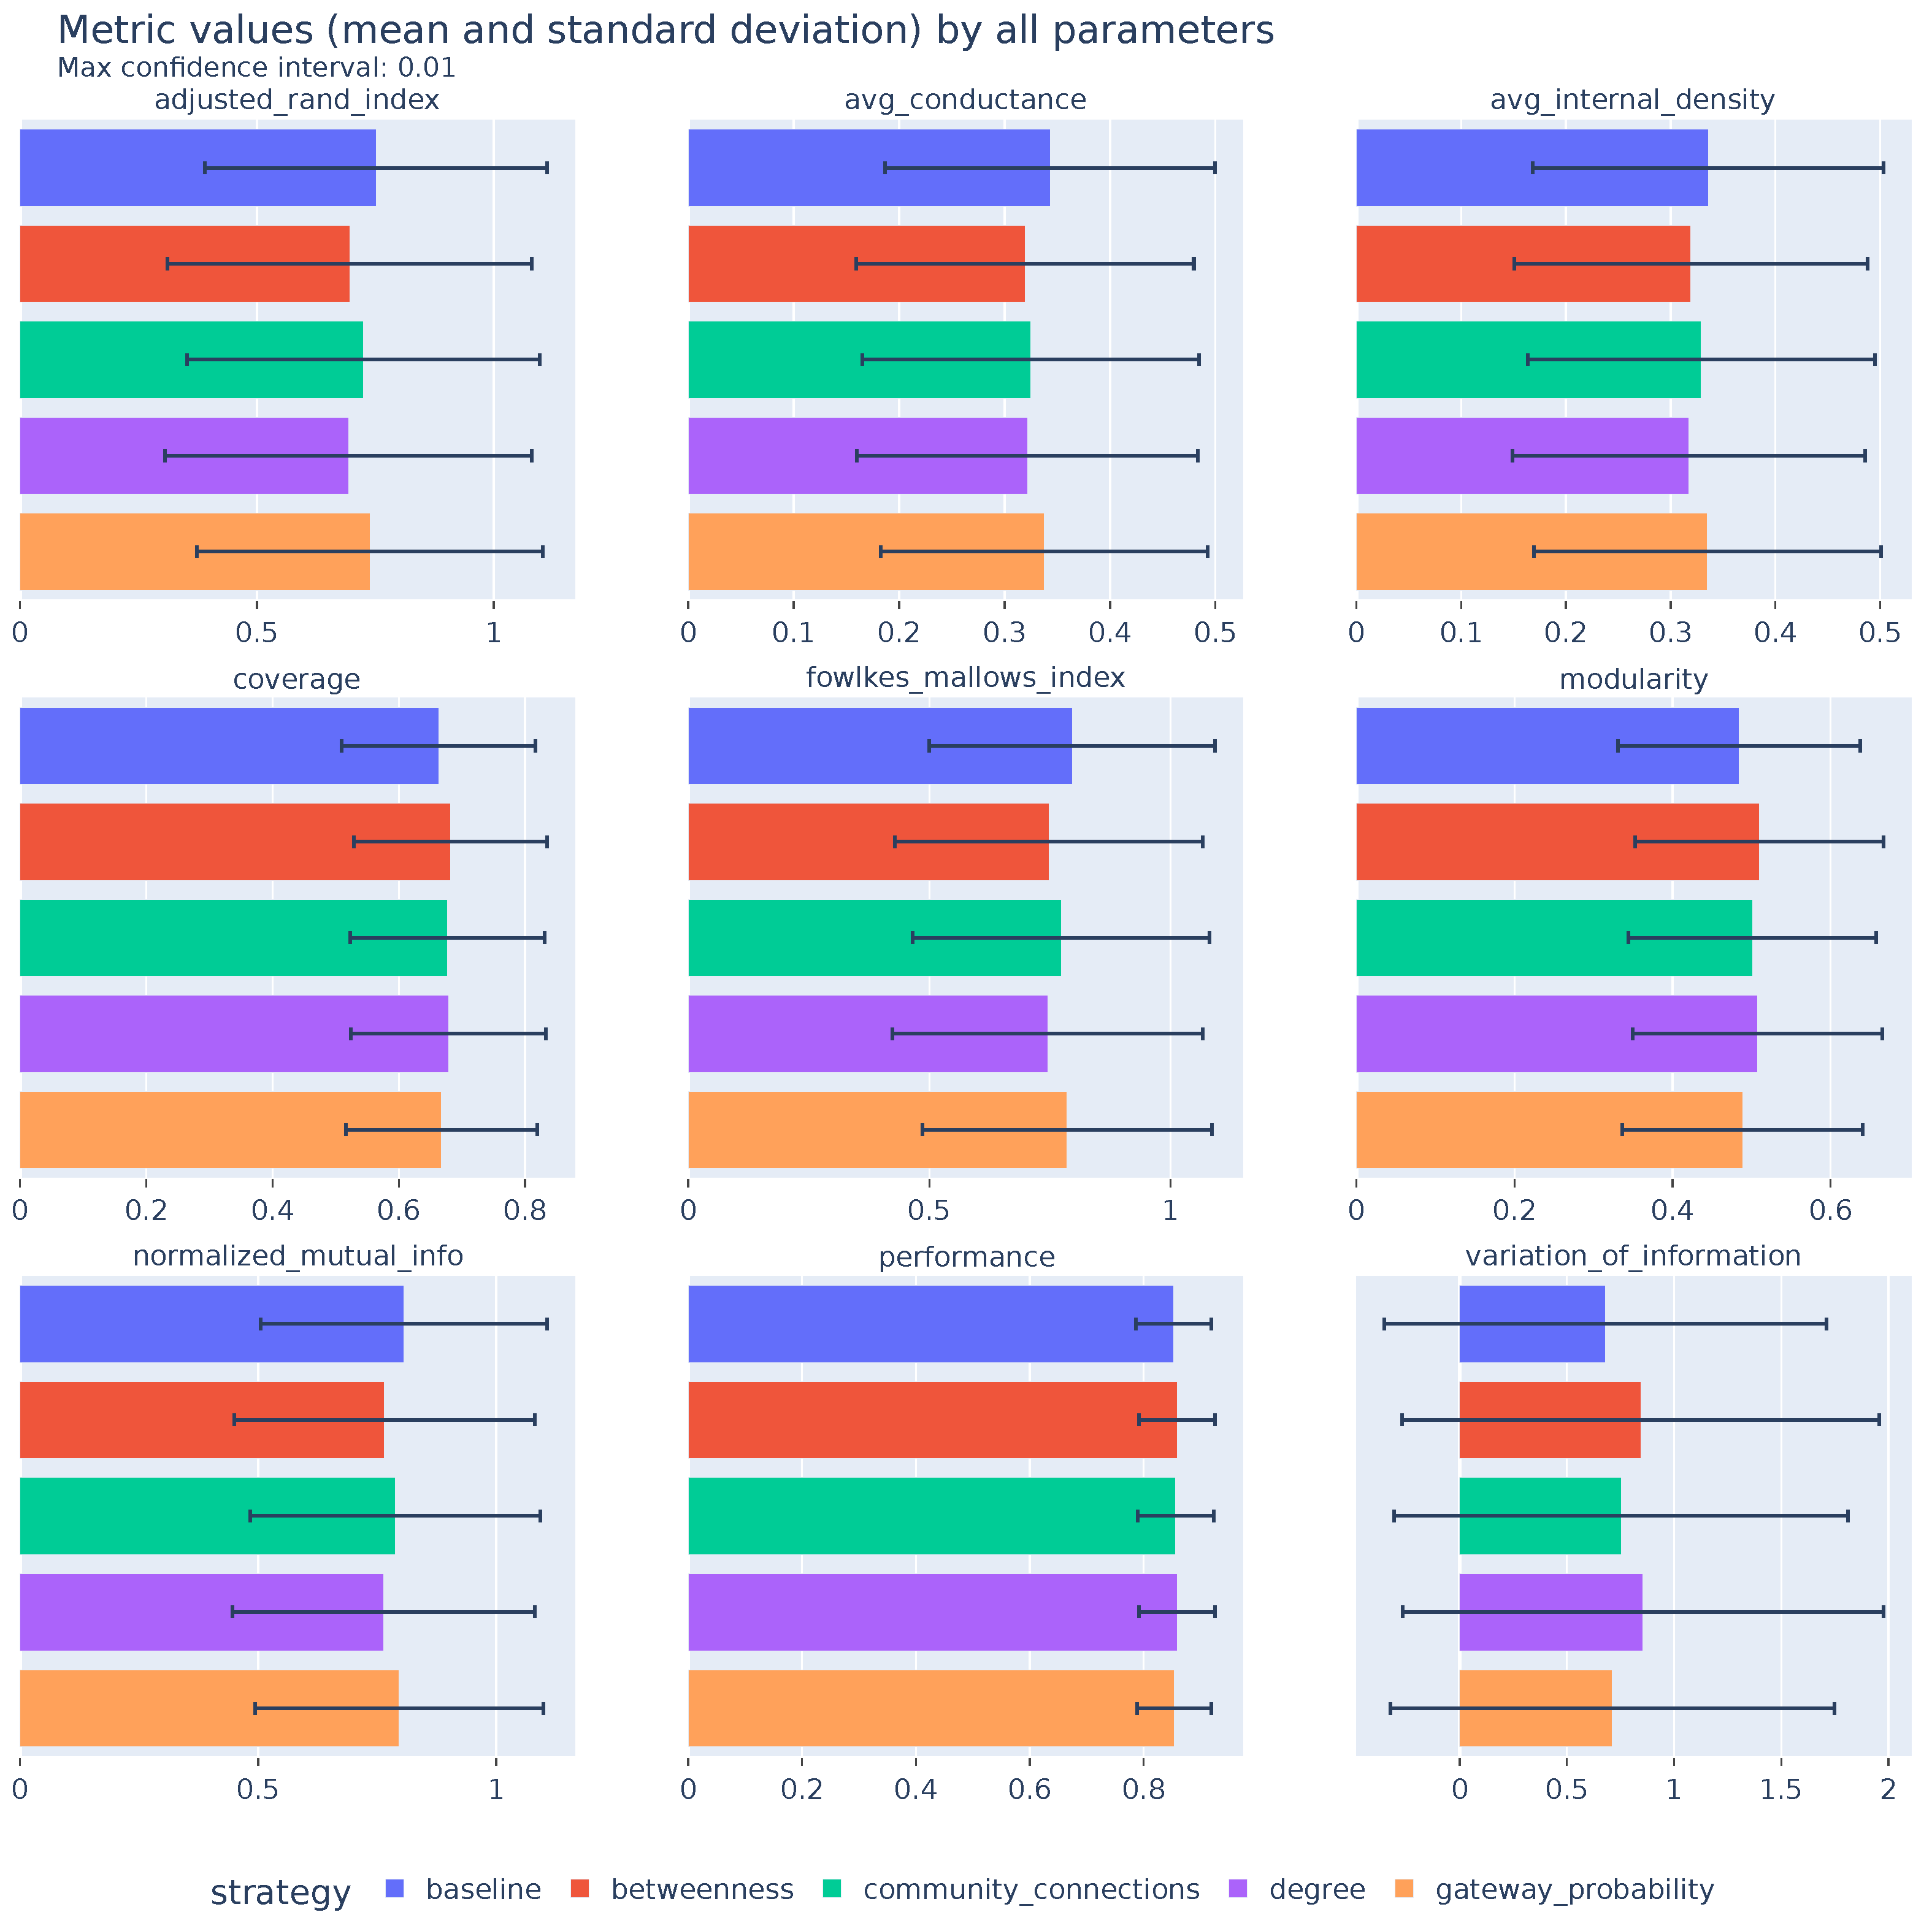
Figure A1, Figure A2, Figure A3, Figure A4, Figure A5, Figure A6, Figure A7, Figure A8, Figure A9, Figure A10 and Figure A11 present detailed results of each of the performance metrics and are available in the Appendix A. The aggregated results are presented in Figure 1 with averages of each metric for each dismantling strategy.
For transparency, the summary statistics were computed after removing missing values, and the confidence intervals around the mean were estimated parametrically as 95% Student-t intervals, i.e., , where s is the sample standard deviation with Bessel’s correction (ddof = 1). All presented graphs include the median, standard deviation, and these mean confidence intervals, together with the p-value of the sign test, to better characterize uncertainty and statistical significance. Across all configurations, the standard deviation is consistently high for all metrics, indicating substantial variability in the results. In particular, Variation of Information exhibits the highest standard deviation among all considered metrics, to the extent that meaningful comparison of its median values becomes difficult. This overall high variance should be taken into account when interpreting apparent differences between strategies, as many observed effects fall within broad dispersion ranges.
Figure 1.
Evaluation metrics aggregated for all paramters.
The comments per-metric results are the following.
Figure A1 presents the relationship between N (number of nodes) and evaluation metrics. No significant anomalies were observed except for the stabilization of most metrics with the size increase, particularly visible in Average Conductance. Figure A2 shows the effect of k_fraction (average degree fraction). Variation of Information for degree- and betweenness-based strategies increases with k_fraction. Figure A3 shows maxc_fraction (maximum community size fraction). No significant anomalies were observed. Figure A4 depicts maxk_fraction (maximum degree fraction). Adjusted Rand Index, Normalized Mutual Information, Fowlkes–Mallows Index, Average Conductance, and Average Internal Density increase with maxk_fraction for the community connections and gateway probability strategies. Conversely, Variation of Information increases with maxk_fraction for degree- and betweenness-based strategies. Figure A5 shows minc_fraction (minimum community size fraction). No notable anomalies were observed. Figure A6 illustrates mu (mixing parameter). As expected, higher mu values degrade all evaluation metrics, reflecting increased community overlap and reduced detectability. Figure A7 depicts tau (degree distribution exponent). No major anomalies were observed. Figure A8 presents tau2 (community size distribution exponent). No major anomalies were observed. Figure A9 shows the relationship between node removal fraction and evaluation metrics. Normalized Mutual Information, Fowlkes–Mallows Index, Average Conductance, and Average Internal Density increase with node removal fraction for the community connections strategy and, more prominently, for gateway probability strategies. Modularity decreases with node removal fraction under the gateway probability strategy, whereas Variation of Information increases with the degree- and betweenness-based strategies. Figure A10 and Figure A11 present parameters specific to the gateway probability strategy, including the number of runs, number of walks, and walk length as a fraction of graph size. No major anomalies were observed.
Figure 1 summarizes overall evaluation metrics showing averages of each metric per dismantling strategy. Across aggregated metrics, all dismantling strategies perform similarly, with only small metric-dependent fluctuations and no consistently dominant method. Degree and betweenness remain close on most measures, while community connections and gateway probability are marginally higher on selected separability metrics (e.g., ARI/NMI/FMI) in some settings; however, these differences are not large enough to change the overall interpretation of comparable performance.
Note that the “baseline” is given for reference, but the goal of this summary is to compare the metrics of dismantling strategies with one another, not with the baseline. Comparison with the baseline is not appropriate as the graphs taken into account are much different (nodes removal ranges from 1% to 20%).
No strong interaction patterns were apparent in the descriptive results across parameters, so a deeper analysis of parameter combinations is left for future work.
3.2. Metric and Strategy by Parameter Combinations
Table 4 summarizes the top three parameter combinations for each strategy across all metrics.
Key observations include:
- All metrics achieve their highest values at low k_fraction (0.05), except for Average Internal Density.
- All metrics achieve their highest values at low mu (0.1), except Average Conductance and Variation of Information (VI), which peak at .
- Average Conductance and Performance achieve higher values for larger graphs (N = 1000).
3.3. Highest Difference of Strategies Performance by Parameter Combinations
Table 5 presents the parameter combinations that yield the largest performance gaps between the best- and worst-performing strategies for each evaluation metric. These cases highlight configurations where the choice of dismantling strategy has the strongest impact on community detection outcomes.
The results reveal a clear pattern of metric-dependent dominance. For clustering-similarity metrics such as (1) Adjusted Rand Index (ARI), (2) Normalized Mutual Information (NMI), and (3) Fowlkes–Mallows Index (FMI), the community connections strategy consistently achieves the best performance, while betweenness yields the worst results, leading to very large performance gaps (up to 0.94).
In contrast, for structural quality metrics such as Modularity, Coverage, Performance, and Average Internal Density, the degree strategy most frequently attains the highest values. In these same settings, gateway probability often appears as the worst-performing strategy, producing substantial differences (e.g., 0.44 for Modularity and 0.39 for Average Internal Density).
Table 4.
Top 1 parameter settings by strategy and metric.
Table 5.
Metric difference between best and worst strategies by parameter combinations and metric.
An exception to this trend is observed for Average Conductance, where gateway probability achieves the best result and degree performs worst. This indicates that certain metrics favor strategies that target inter-community connectivity rather than intra-community structure.
Finally, for Variation of Information (VI), the largest discrepancy is observed between degree (worst) and community connections (best), further reinforcing that different metrics reward fundamentally different structural properties.
Overall, these edge cases confirm that the relative effectiveness of dismantling strategies is highly dependent on both the evaluation metric and the underlying network configuration. No single strategy is uniformly superior; instead, strategies exhibit complementary strengths depending on the aspect of community structure being measured.
4. Discussion
Our large-scale evaluation shows that degree-, betweenness-, community connection-, and gateway-based dismantling strategies produce broadly comparable outcomes across both extrinsic and intrinsic metrics. Interpreted together with the standard dismantling literature, these findings suggest that strategies with similar global fragmentation behavior may still differ in how they preserve or distort residual modular organization. The theoretical mechanism underlying this effect is rooted in mesoscale connectivity: networks with community structure rely disproportionately on a small set of nodes that mediate inter-community flow. Gateways represent the dominant ingress points for external flow into a module; removing them reduces accessibility from the rest of the network while largely preserving internal cohesion.
Formally, under the stationary RWR model used here, a gateway node has high occupation probability for trajectories repeatedly restarted outside its community. Eliminating such nodes selectively blocks external flow, effectively isolating communities and increasing global fragmentation. In contrast, high-degree or high-betweenness nodes may primarily affect intra-community paths without significantly disrupting inter-community connectivity.
This mechanism explains why intrinsic metrics like Average Internal Density can remain high under gateway-based dismantling, while extrinsic measures such as ARI, NMI, and FMI may show slightly better separability in some regimes. It also accounts for robustness across networks with heterogeneous degree distributions, where hubs are often confined within modules. Overall, gateway removal should be interpreted as a principled mesoscale-targeted alternative that performs comparably to classical heuristics rather than as a uniformly superior strategy.
5. Limitations
Our evaluation is currently restricted to the LFR synthetic framework and a selected range of parameter settings (degree and community size exponents, mixing parameter , planted community sizes). LFR is a well-established benchmark that provides the ground-truth communities, but it does not capture all features of empirical systems (heterogeneous temporal activity, multilayer interactions, metadata correlations). Consequently, the conclusions drawn here about gateway-based dismantling and robustness across community detection realizations should be validated on additional empirical datasets and alternative generative models and under heterogeneous cost models for node removal. Additionally, this study does not include a direct comparison of computational cost across dismantling strategies, which limits practical conclusions about efficiency. In particular, future work should pair this mesoscale evaluation with explicit classical dismantling indicators (e.g., giant-component decay curves and critical removal thresholds) to jointly assess global collapse and community-level degradation within a single framework. Future work will expand the parameter sweep and incorporate real-world case studies to probe generalization.
6. Conclusions
In this work, we conducted a large-scale evaluation of network dismantling strategies on 568,584 LFR benchmark graphs, focusing on how different dismantling heuristics affect post-dismantling community detection. Unlike prior studies that compare dismantling to a baseline without removal, we systematically compared multiple strategies: degree-based, betweenness-based, community connection-based, and a new gateway-based approach. Our evaluation perspective is explicitly complementary to classical dismantling objectives: instead of only asking how fast connectivity collapses, we ask how removals reshape the detectability and quality of residual community structure.
Our contributions are as follows:
- 1.
- Introduction of a gateway-based strategy: We operationalize gateway nodes as asymmetric entry points into communities, generalizing inter-community connectors and providing a mesoscale-aware dismantling target.
- 2.
- Large-scale systematic evaluation: We assessed all strategies across a wide range of network parameters, generating a dataset far larger than previous studies, providing statistically robust evidence of their performance.
- 3.
- Comprehensive performance assessment: Using both extrinsic (ARI, NMI, FMI, VI) and intrinsic (Modularity, Coverage, Performance, Average Conductance, Average Internal Density) metrics, we evaluated the effect of each strategy on community detection outcomes.
- 4.
- Empirical insight on strategy influence: We find that gateway-based dismantling performs similarly to classical heuristics and that, overall, the choice of dismantling strategy has very little impact on community detection performance.
These results reinforce the insight that mesoscale network structure, rather than the specific dismantling heuristic, drives robustness. While gateway-based strategies offer a conceptually meaningful alternative by targeting community ingress, their performance gains over simpler strategies are modest. A direct comparison of computational cost across dismantling strategies was not performed in this work, which is an important limitation for practical deployment. Our findings suggest that additional computational sophistication provides limited practical benefit within synthetic modular networks, motivating future studies on empirical networks, cost-aware settings, and dynamic or multilayer systems where asymmetric community ingress may be more operationally significant.
Future work should address these limitations by:
- 1.
- Extending evaluation to real-world networks with complex structures and dynamic interactions.
- 2.
- Incorporating cost-aware dismantling frameworks, where node removal may have heterogeneous or context-dependent costs, enabling more realistic intervention planning.
- 3.
- Exploring adaptive and iterative gateway-based interventions that recompute importance scores after each removal step.
- 4.
- Investigating applications in multiagent and distributed systems, where gateway nodes can act as control points for coordination, consensus, or cooperative behavior [35,36].
Author Contributions
Conceptualization, J.S. and S.S.; methodology, J.S.; software, J.S. and S.S.; validation, J.S. and J.H.; formal analysis, J.S. and J.H.; investigation, J.S. and S.S.; resources, J.S. and M.G.; data curation, J.S.; writing—original draft preparation, J.S. and J.H.; writing—review and editing, J.S., S.S. and J.H.; visualization, J.S. and S.S.; supervision, M.G. and M.P.; project administration, M.G.; funding acquisition, M.G. All authors have read and agreed to the published version of the manuscript.
Funding
This research received no external funding.
Institutional Review Board Statement
Not applicable.
Informed Consent Statement
Not applicable.
Data Availability Statement
All data is available within the text of the paper.
Acknowledgments
During the preparation of this manuscript/study, the author(s) used ChatGPT (GPT-5.2, accessed February 2026) for the purposes of editing, proof-reading, and fixing grammar and typo issues in the text of the paper. The authors have reviewed and edited the output and take full responsibility for the content of this publication. This research was carried out with the support of the High Performance Computing Center at Faculty of Mathematics and Information Science Warsaw University of Technology.
Conflicts of Interest
The authors declare no conflicts of interest.
Appendix A
The following section contains all detailed results for all performance metrics for all methods.
Figure A1.
Evaluation metrics by N.
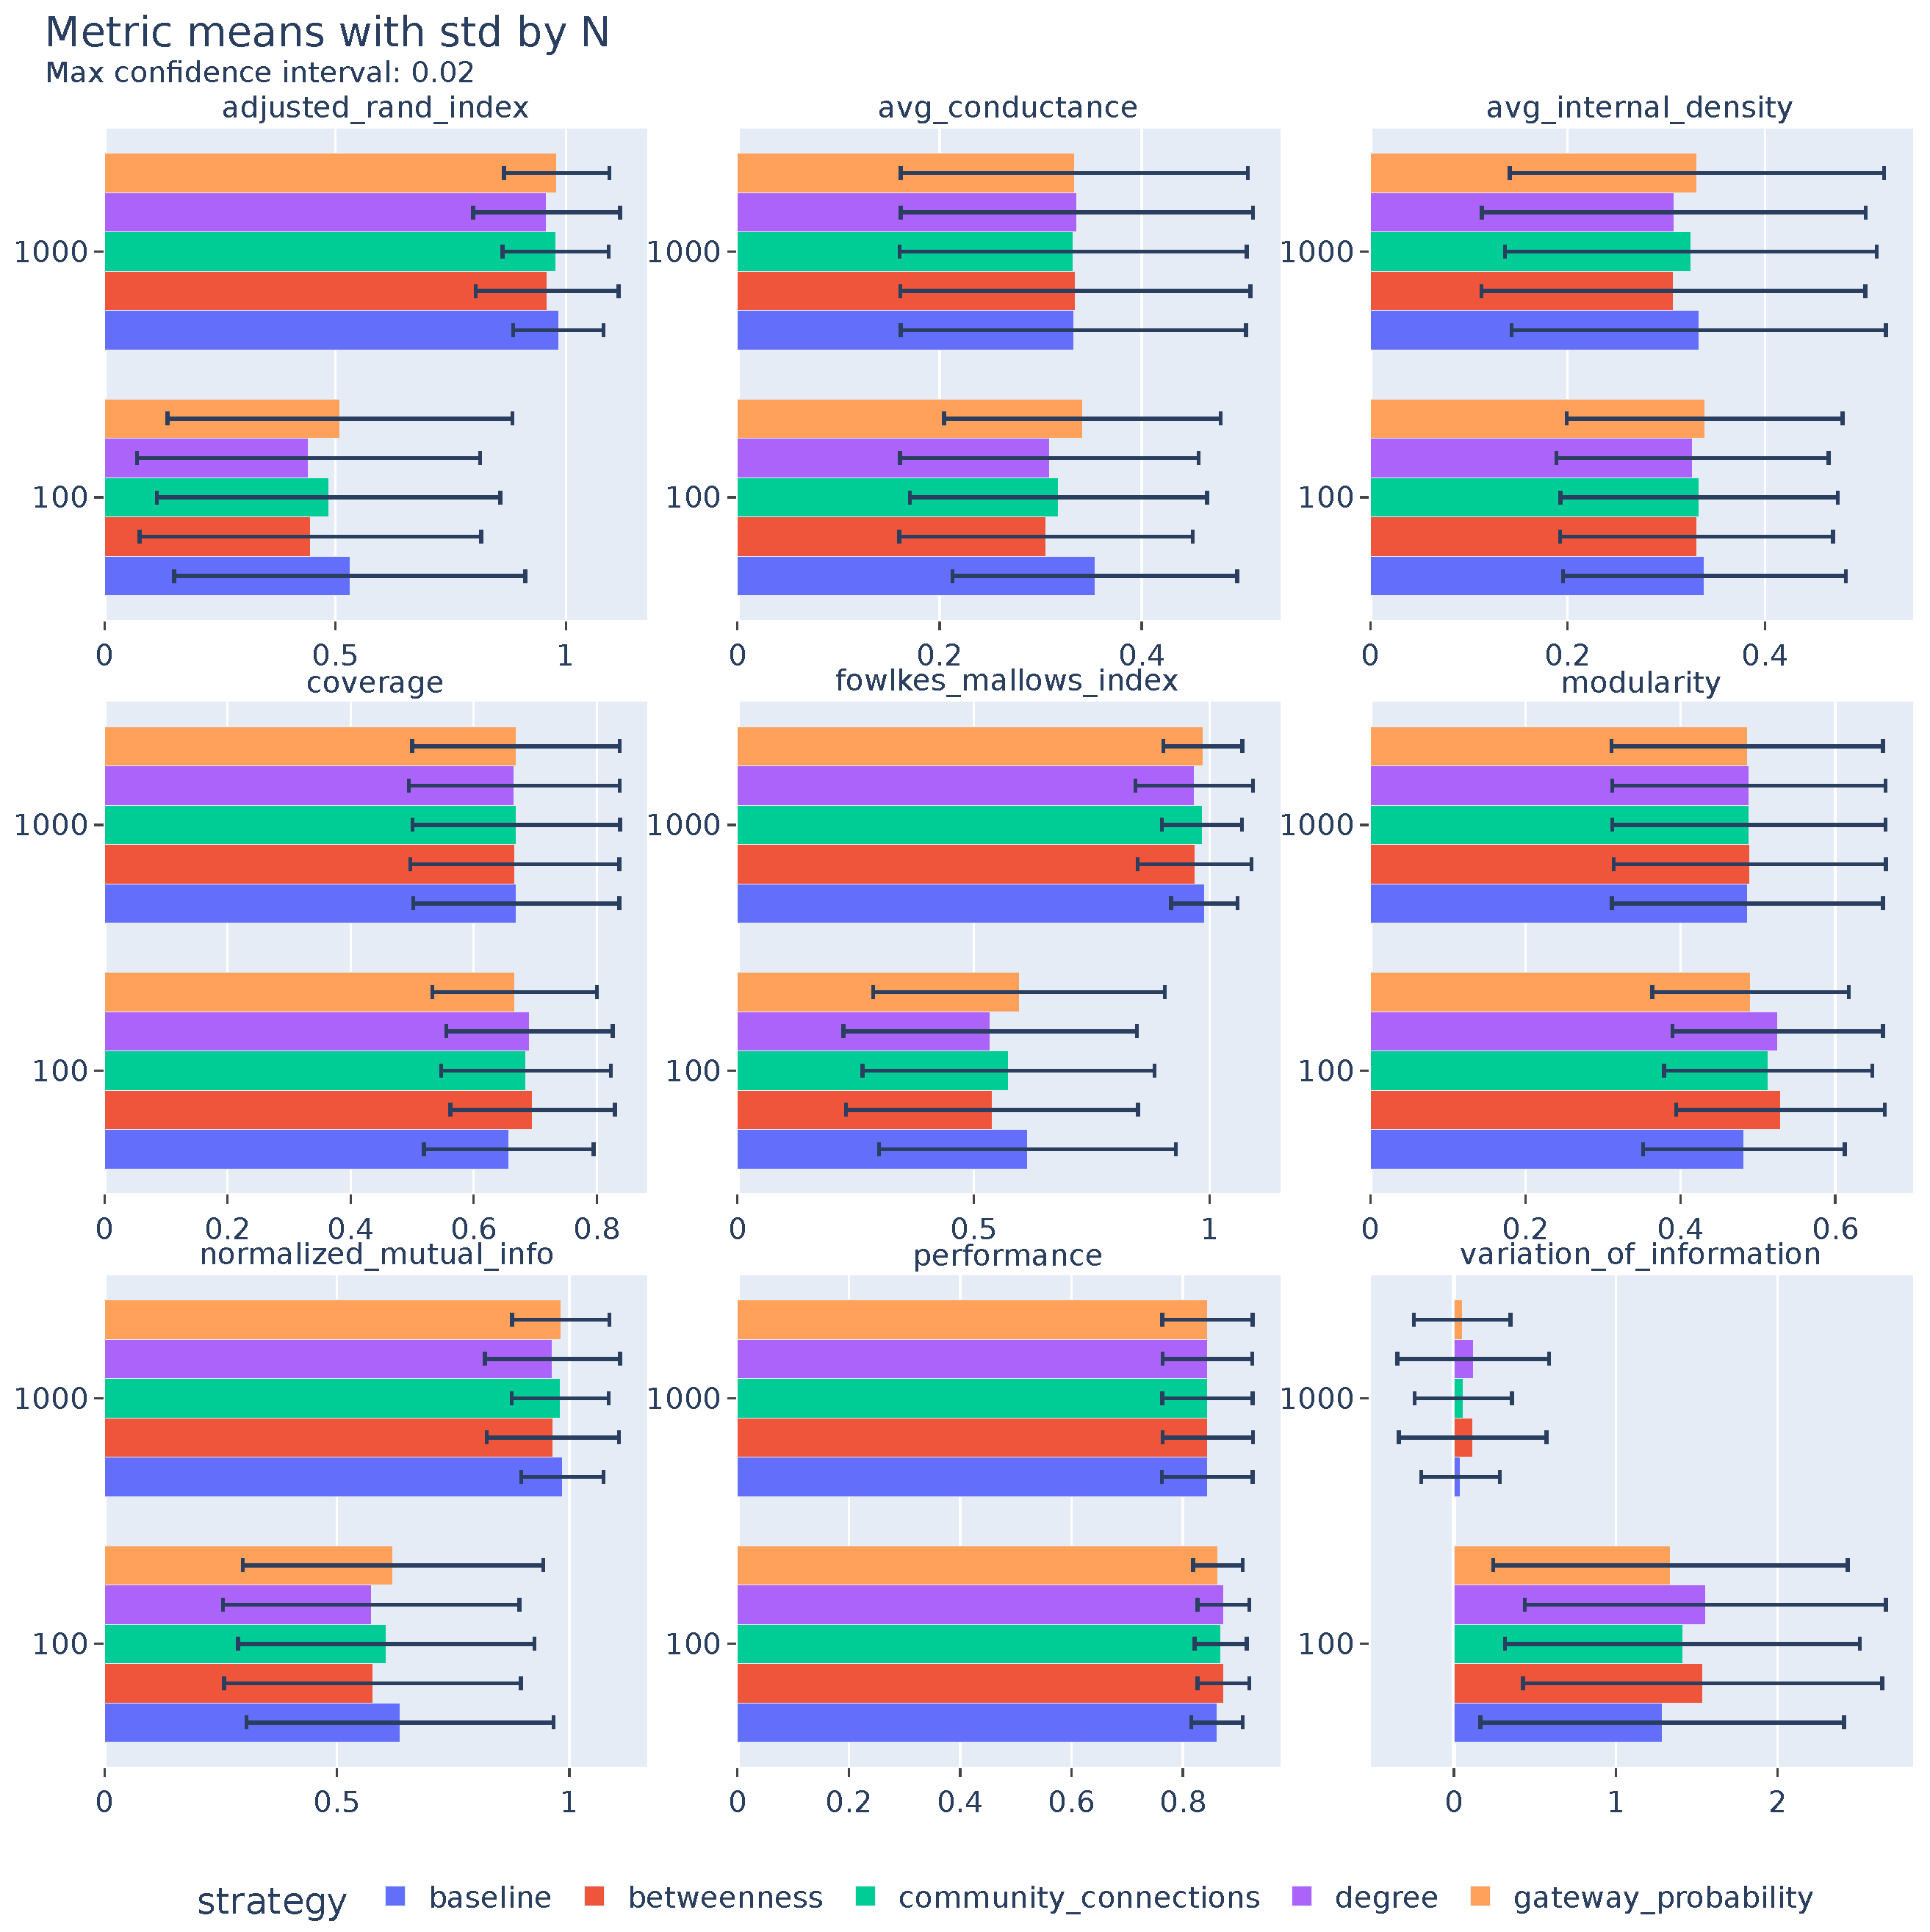
Figure A2.
Evaluation metrics by k_fraction.
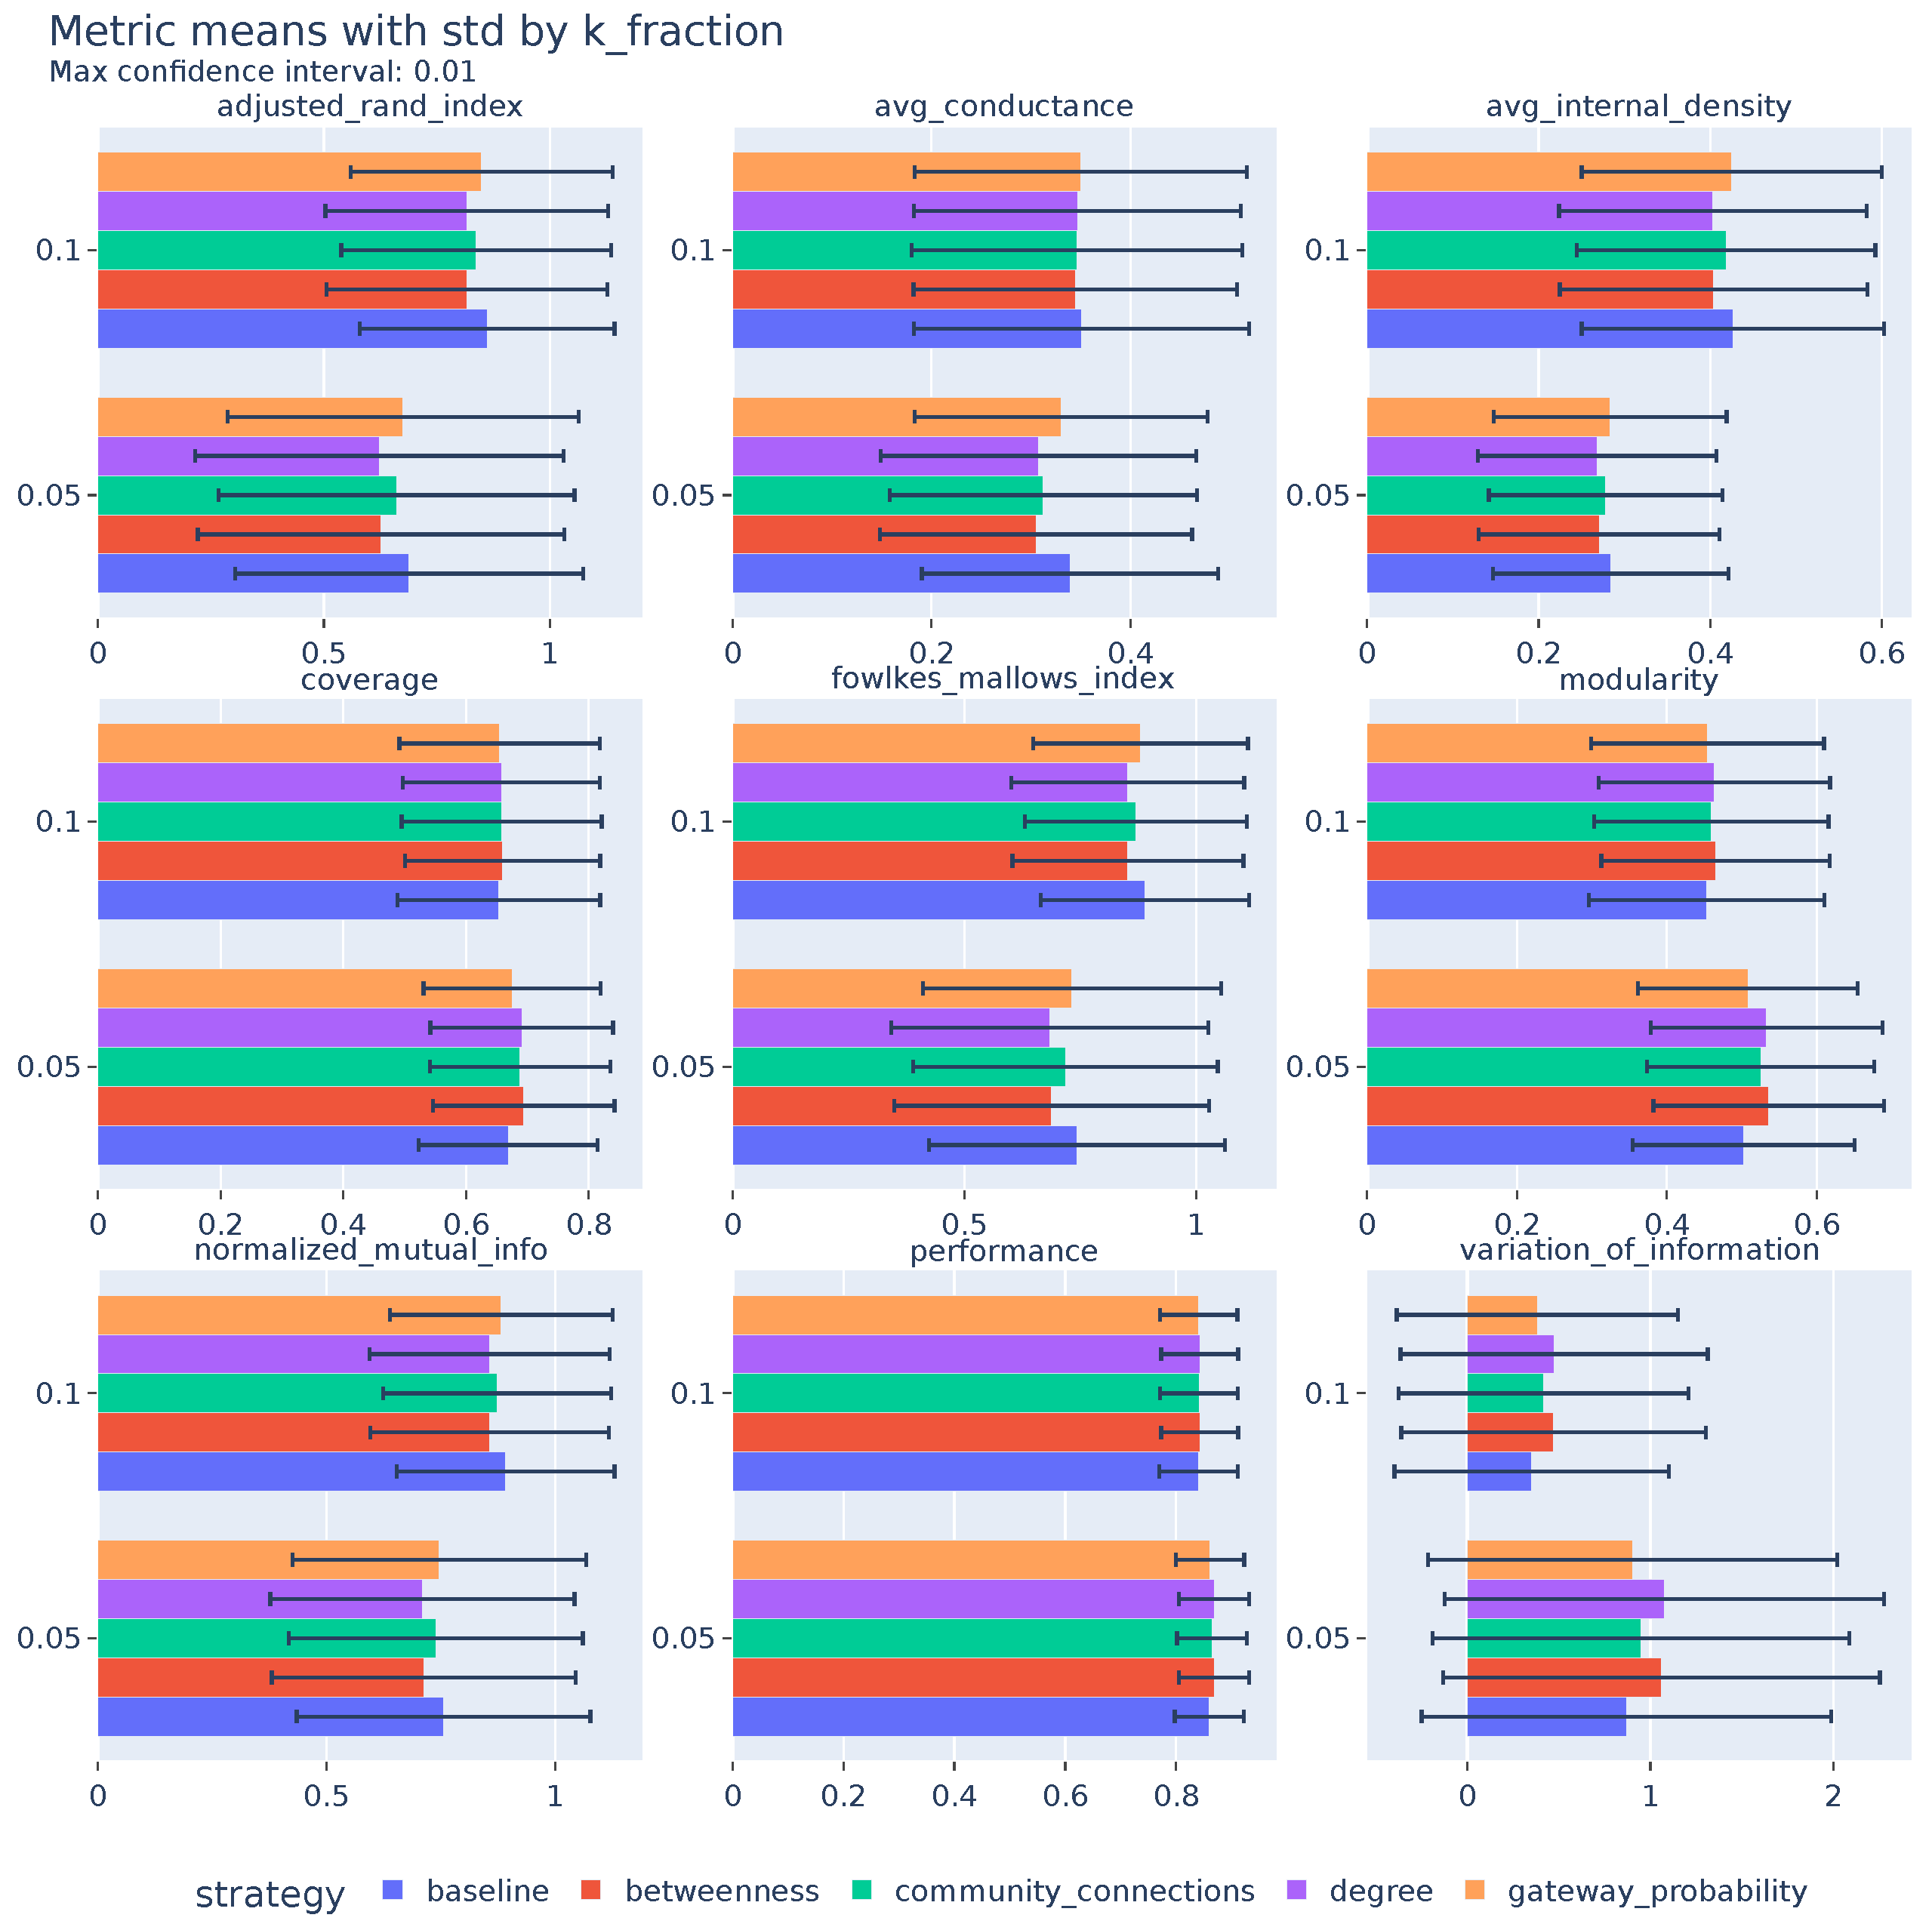
Figure A3.
Evaluation metrics by maxc_fraction.
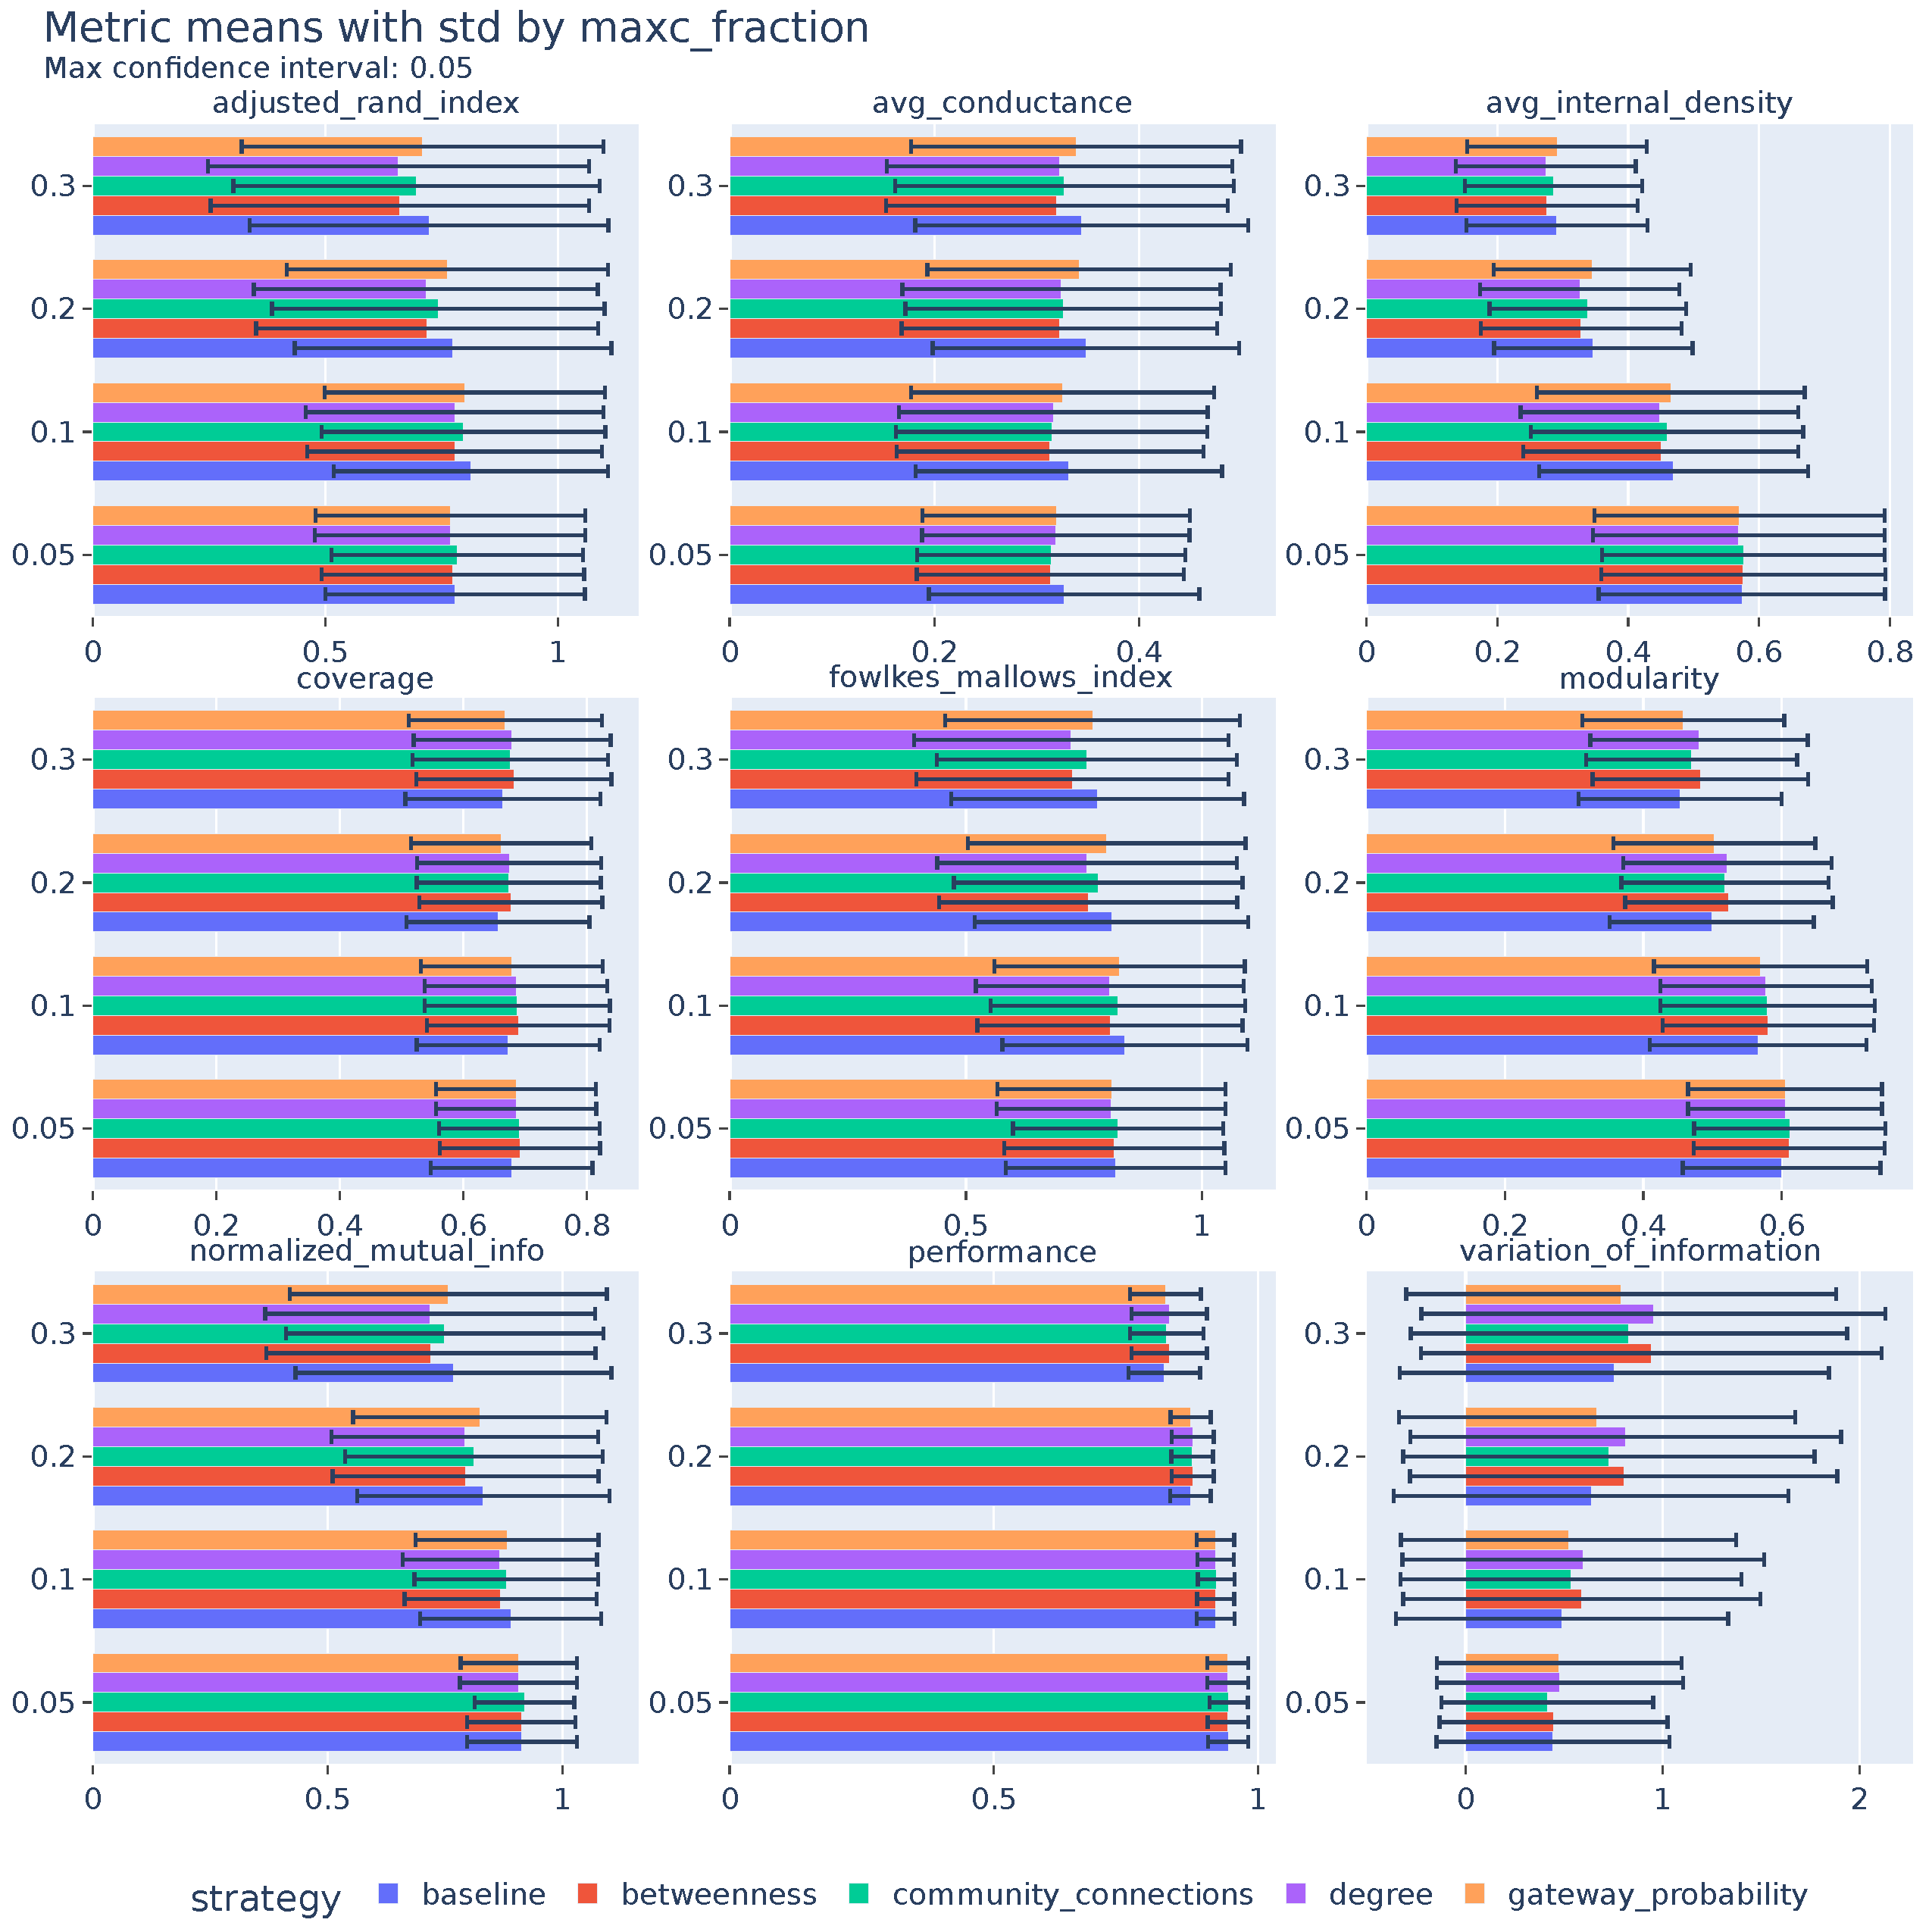
Figure A4.
Evaluation metrics by maxk_fraction.
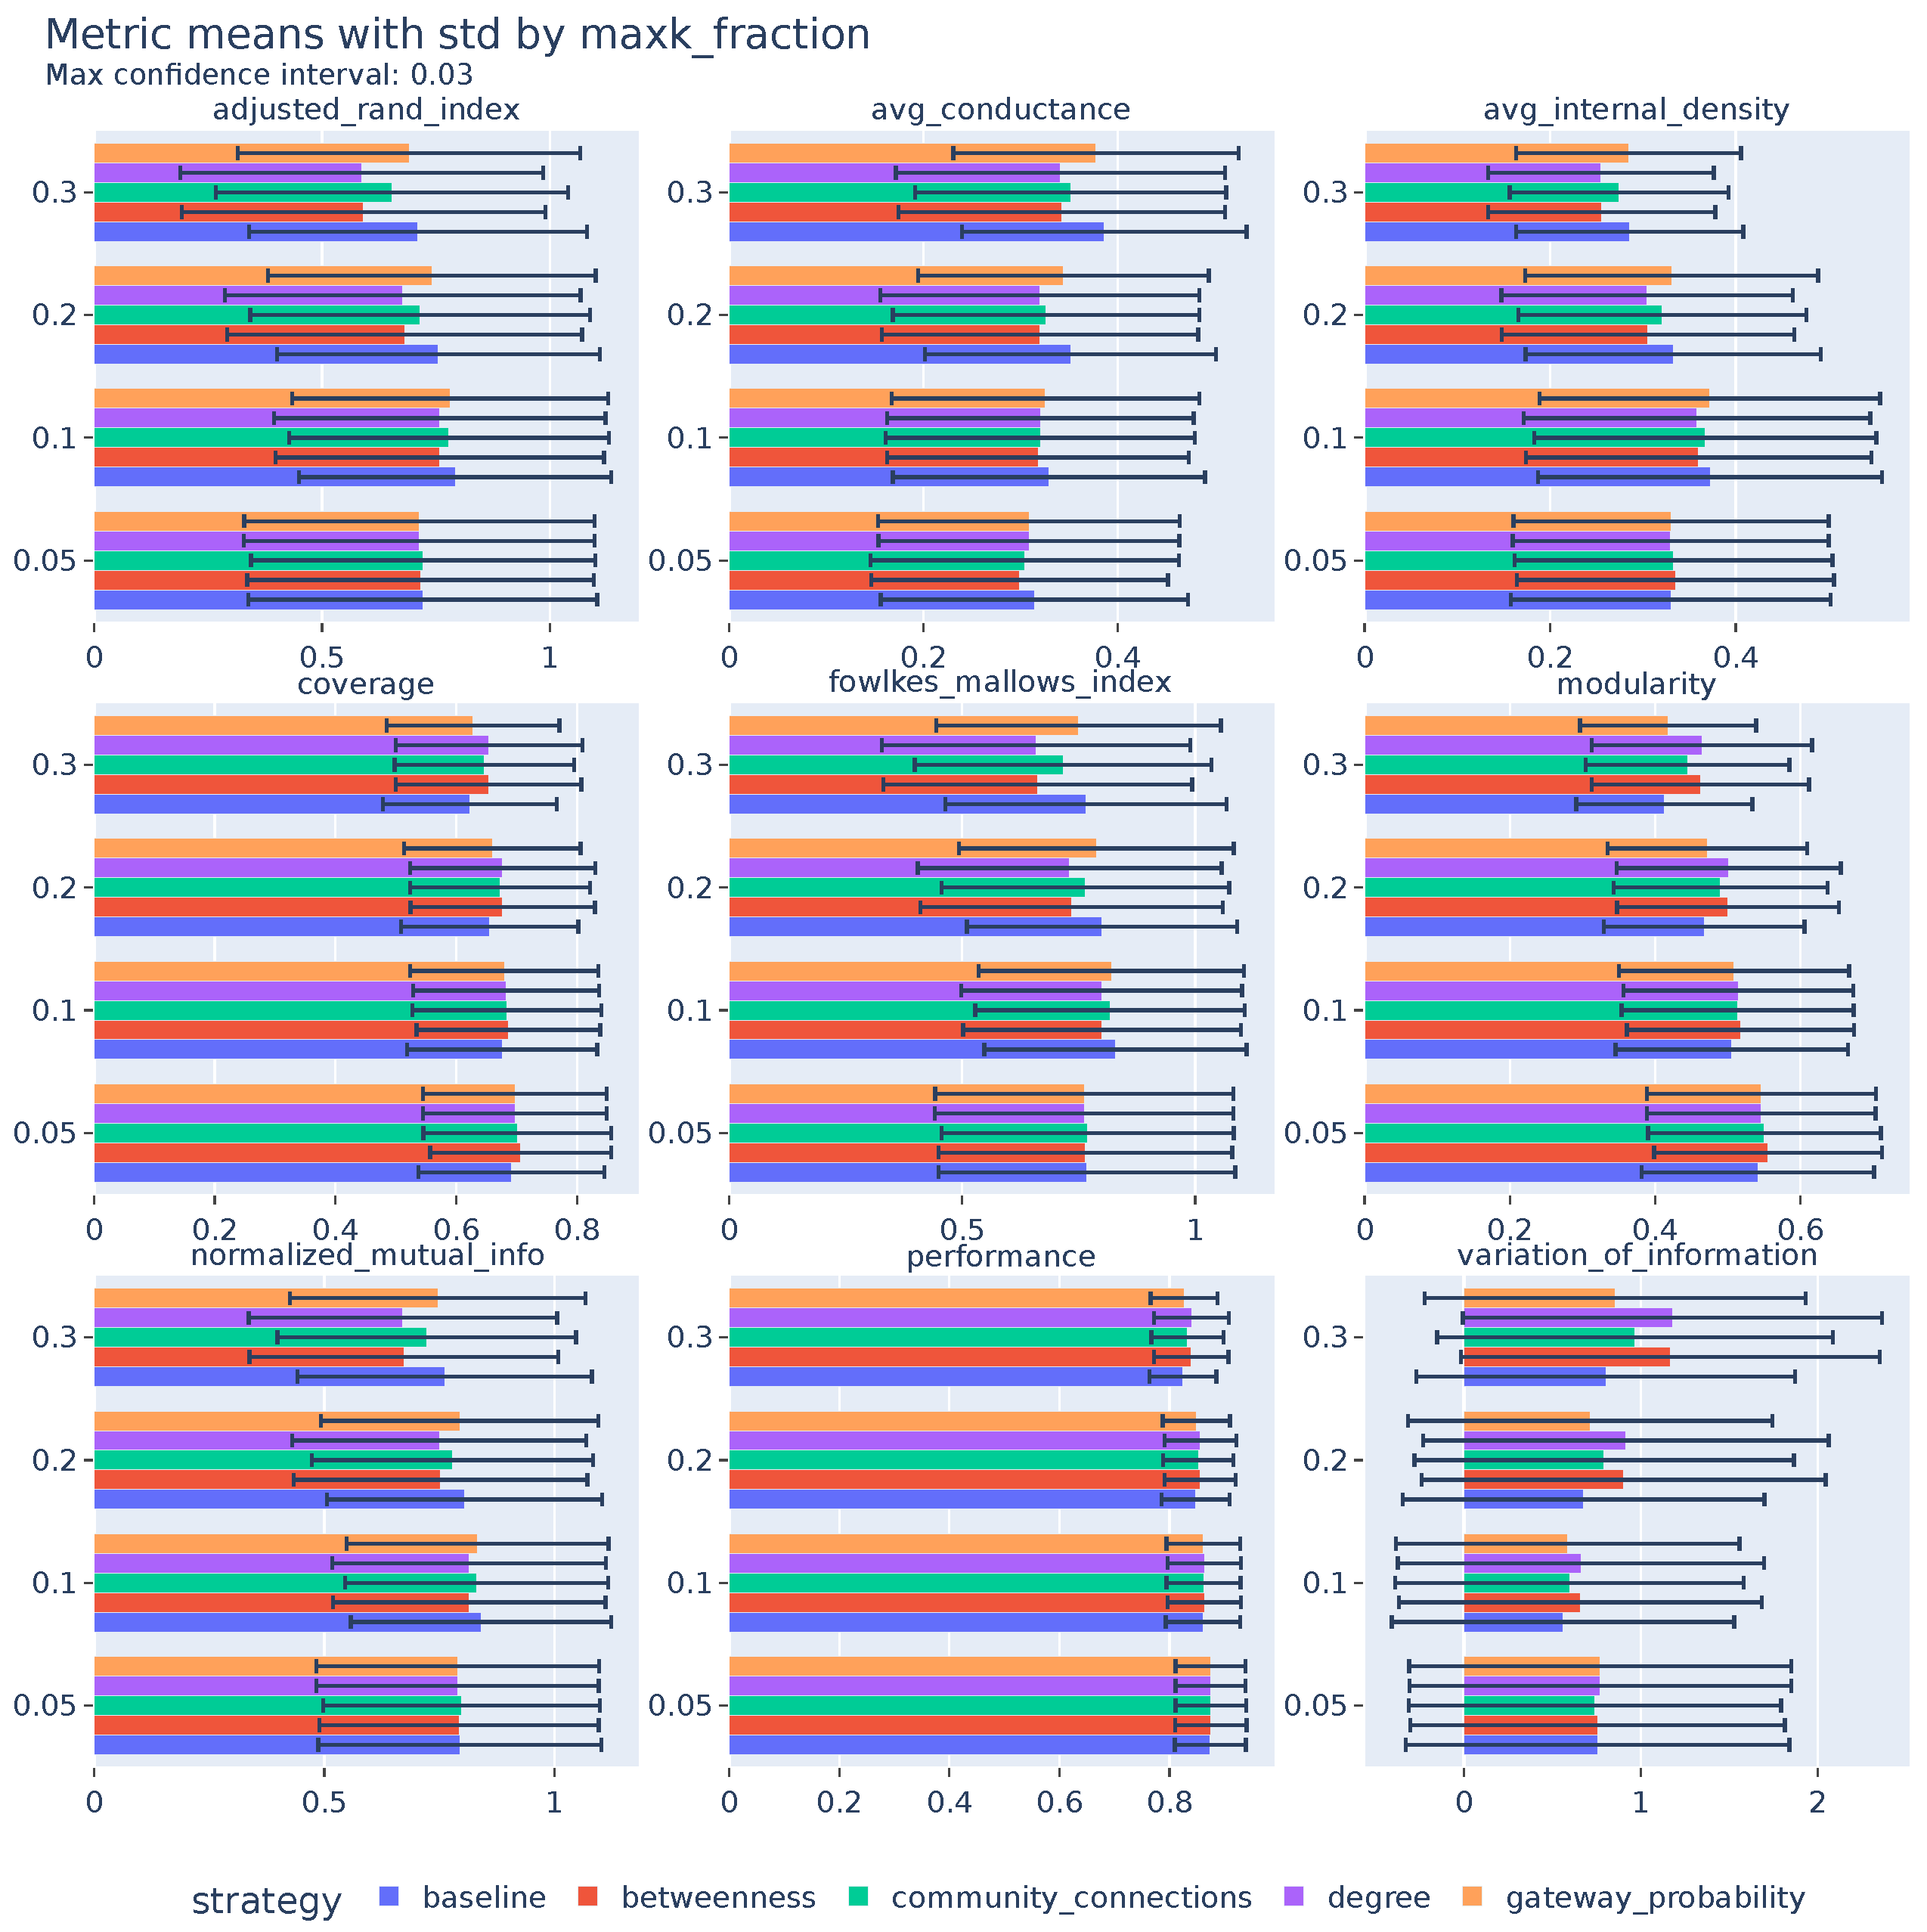
Figure A5.
Evaluation metrics by minc_fraction.
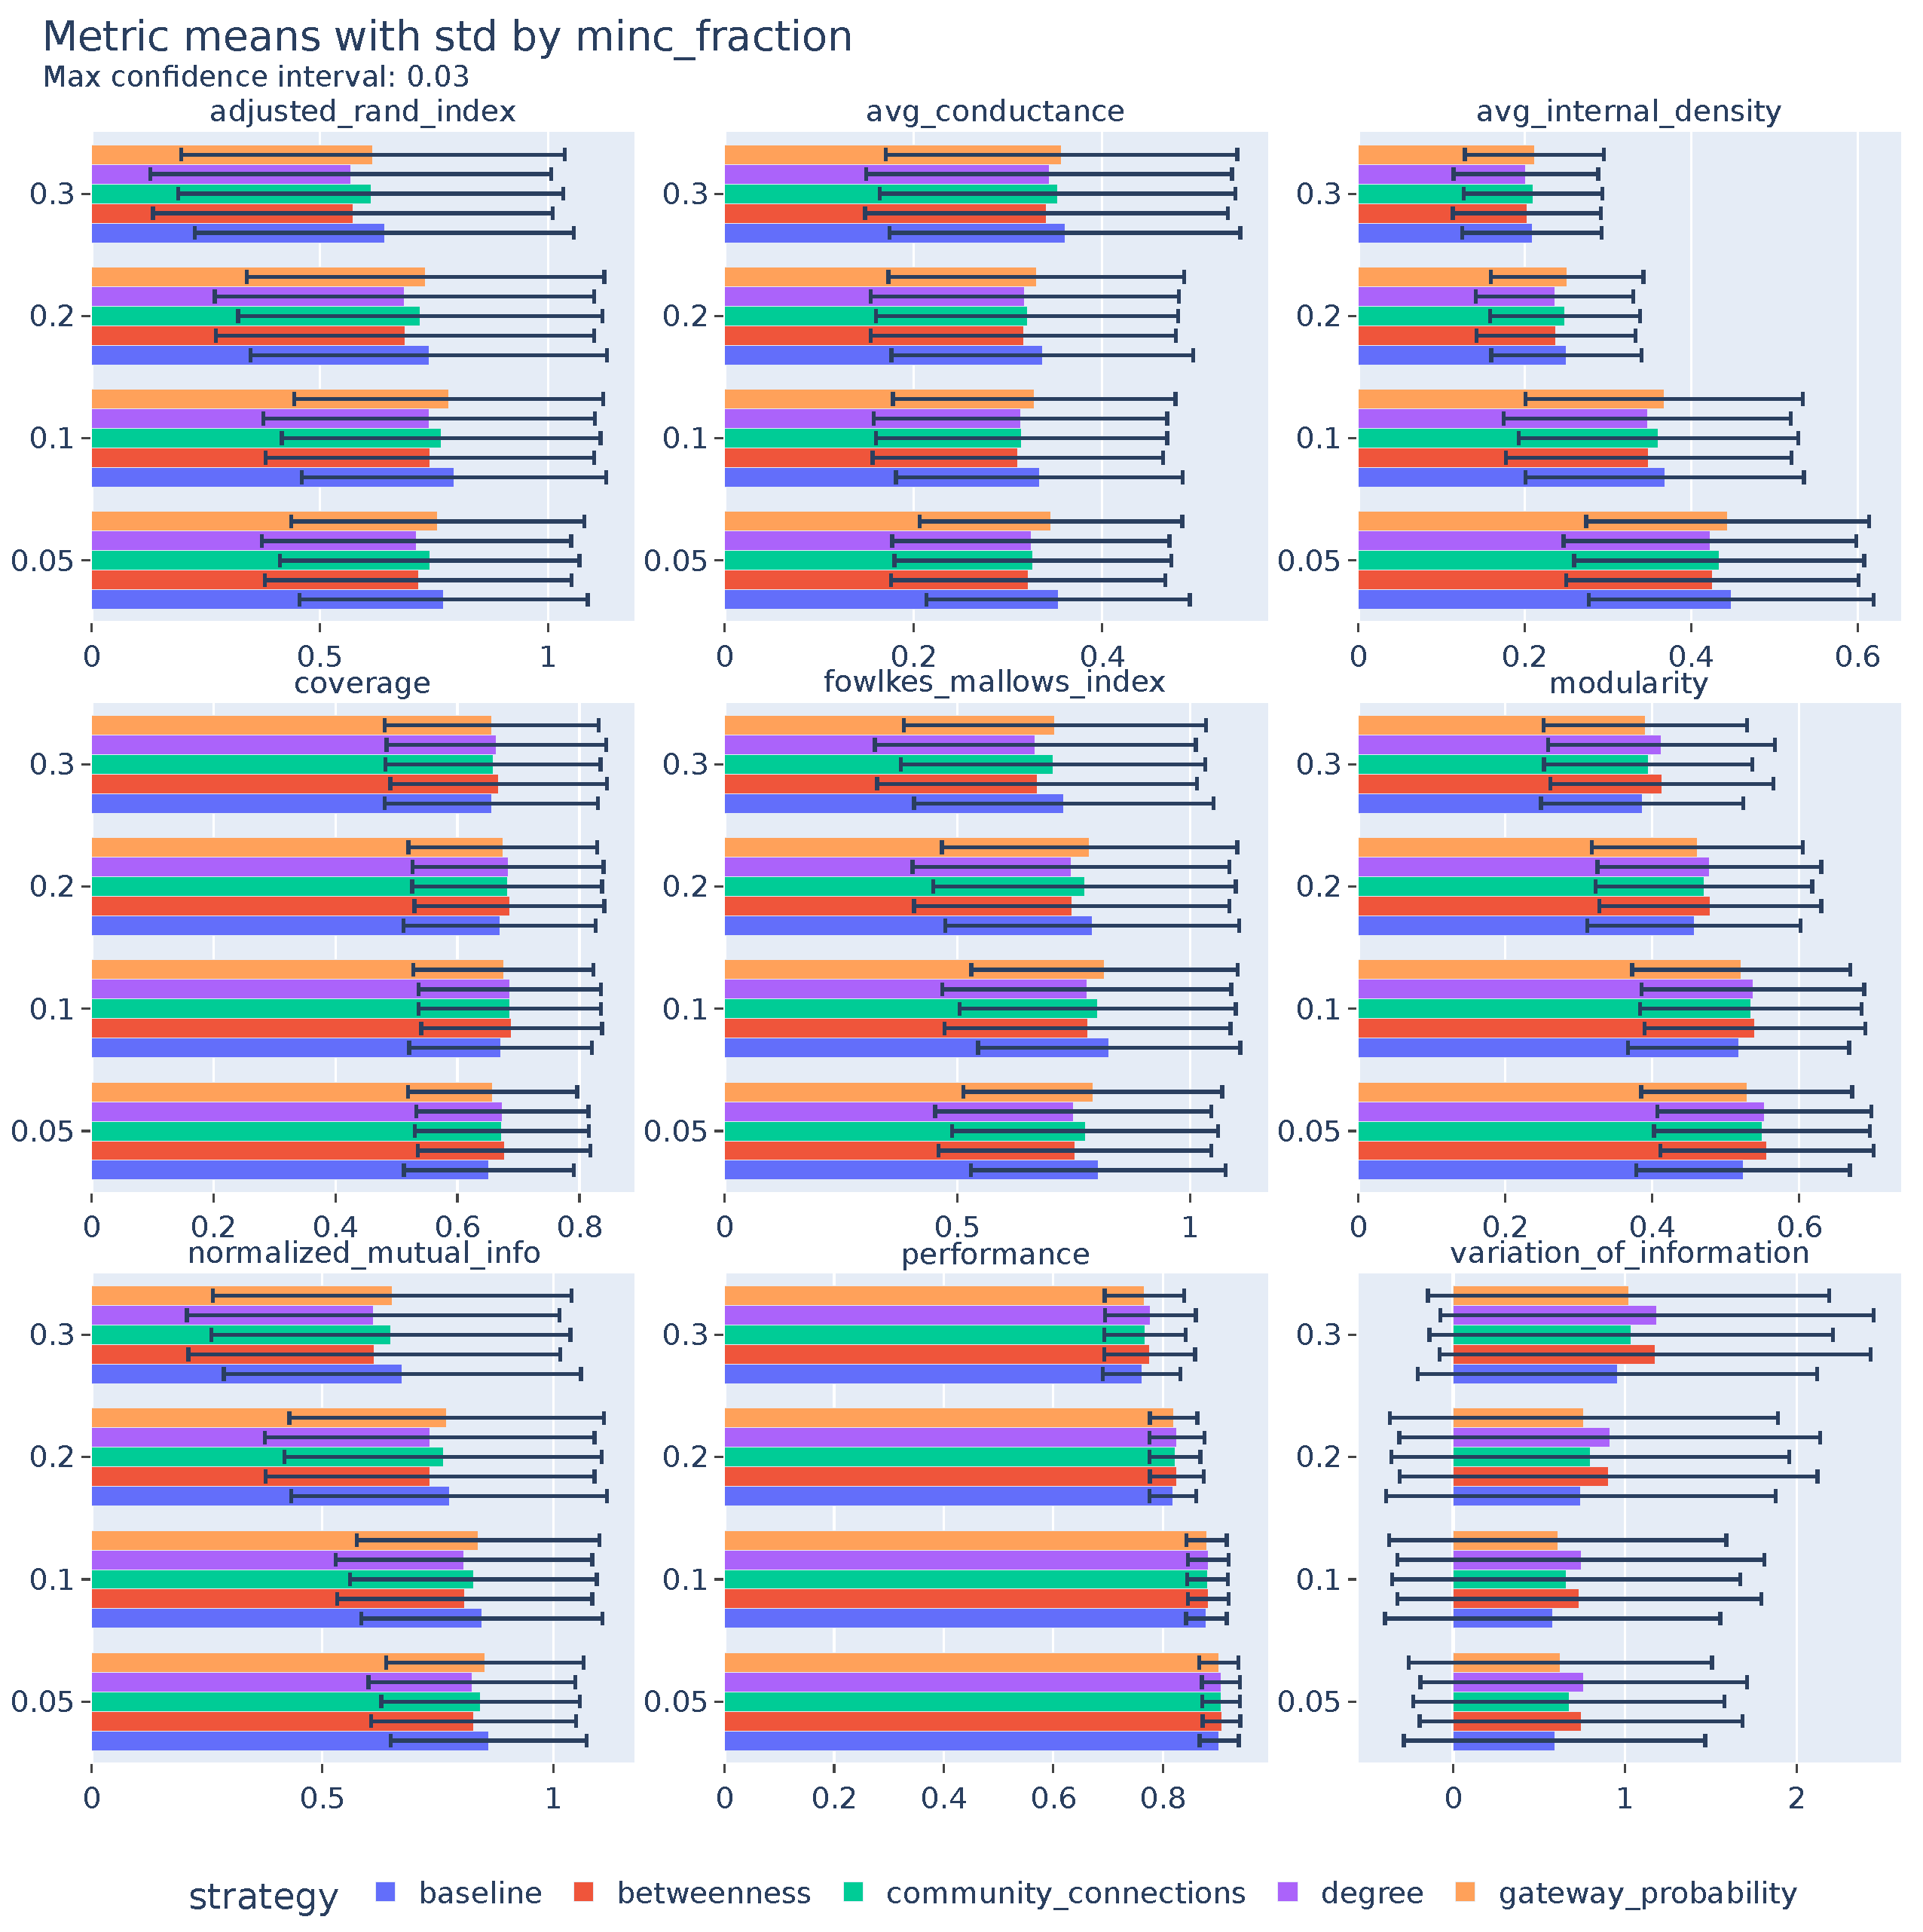
Figure A6.
Evaluation metrics by mu.
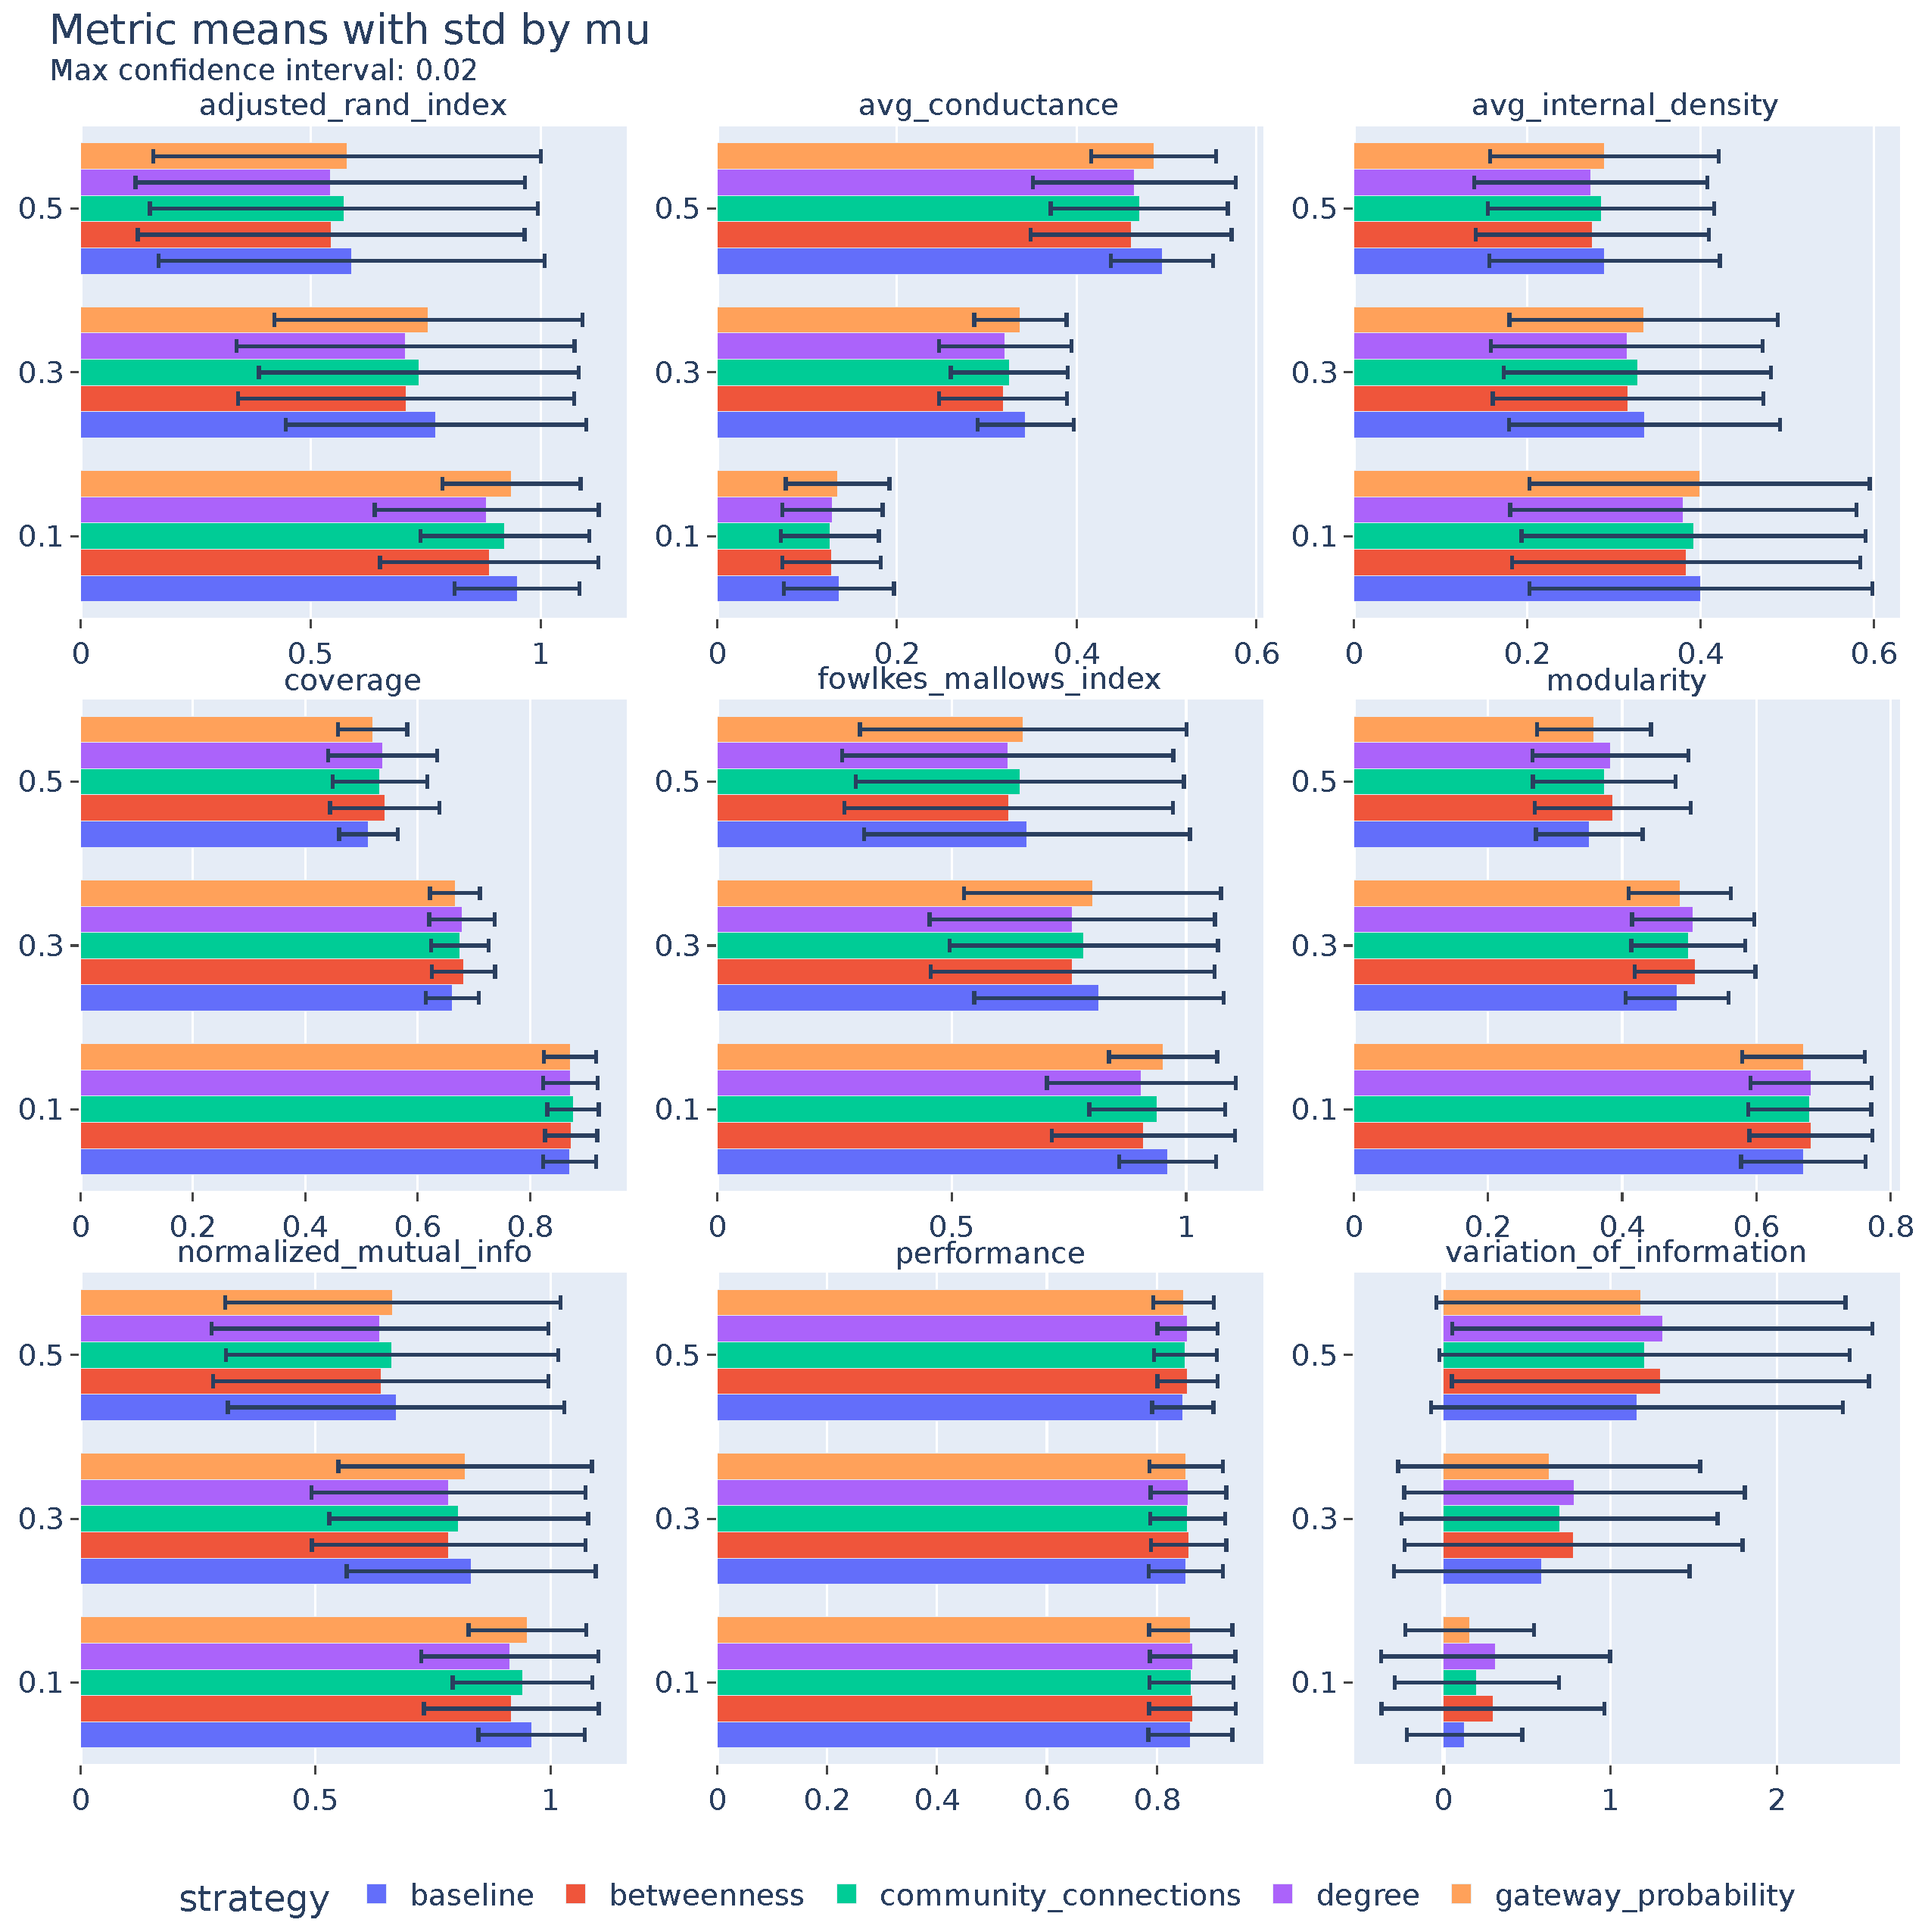
Figure A7.
Evaluation metrics by tau.
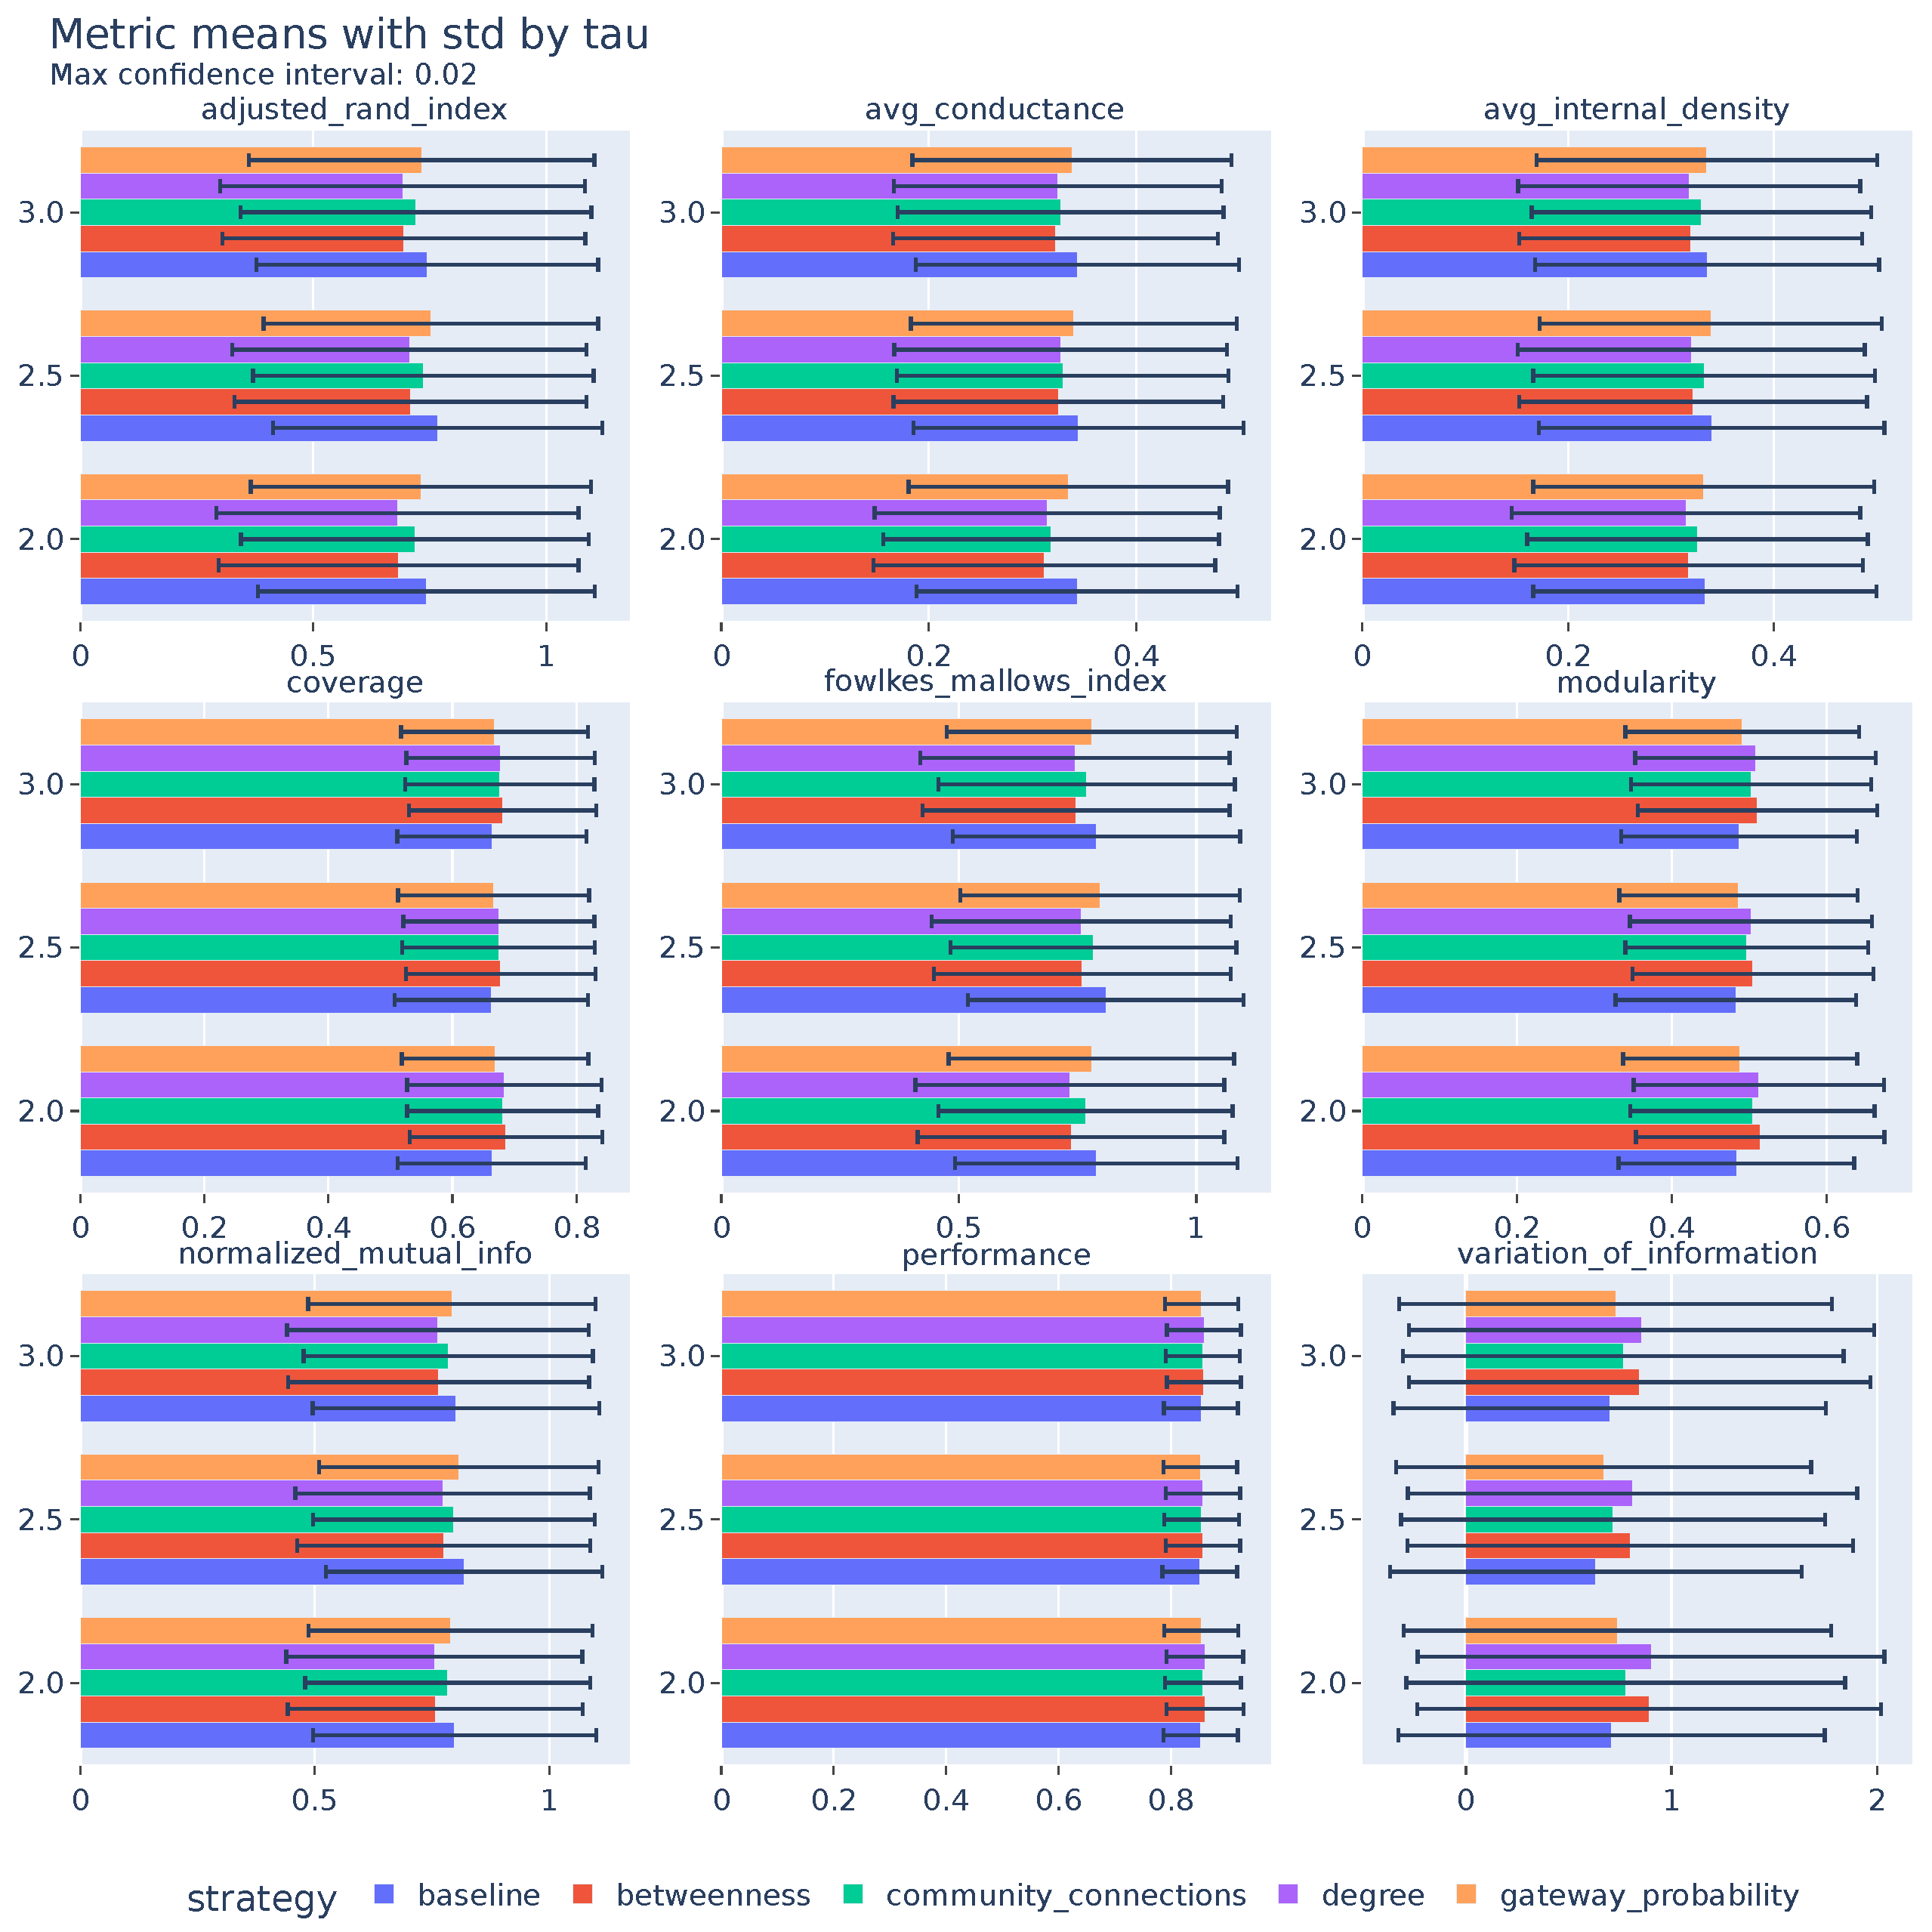
Figure A8.
Evaluation metrics by tau2.
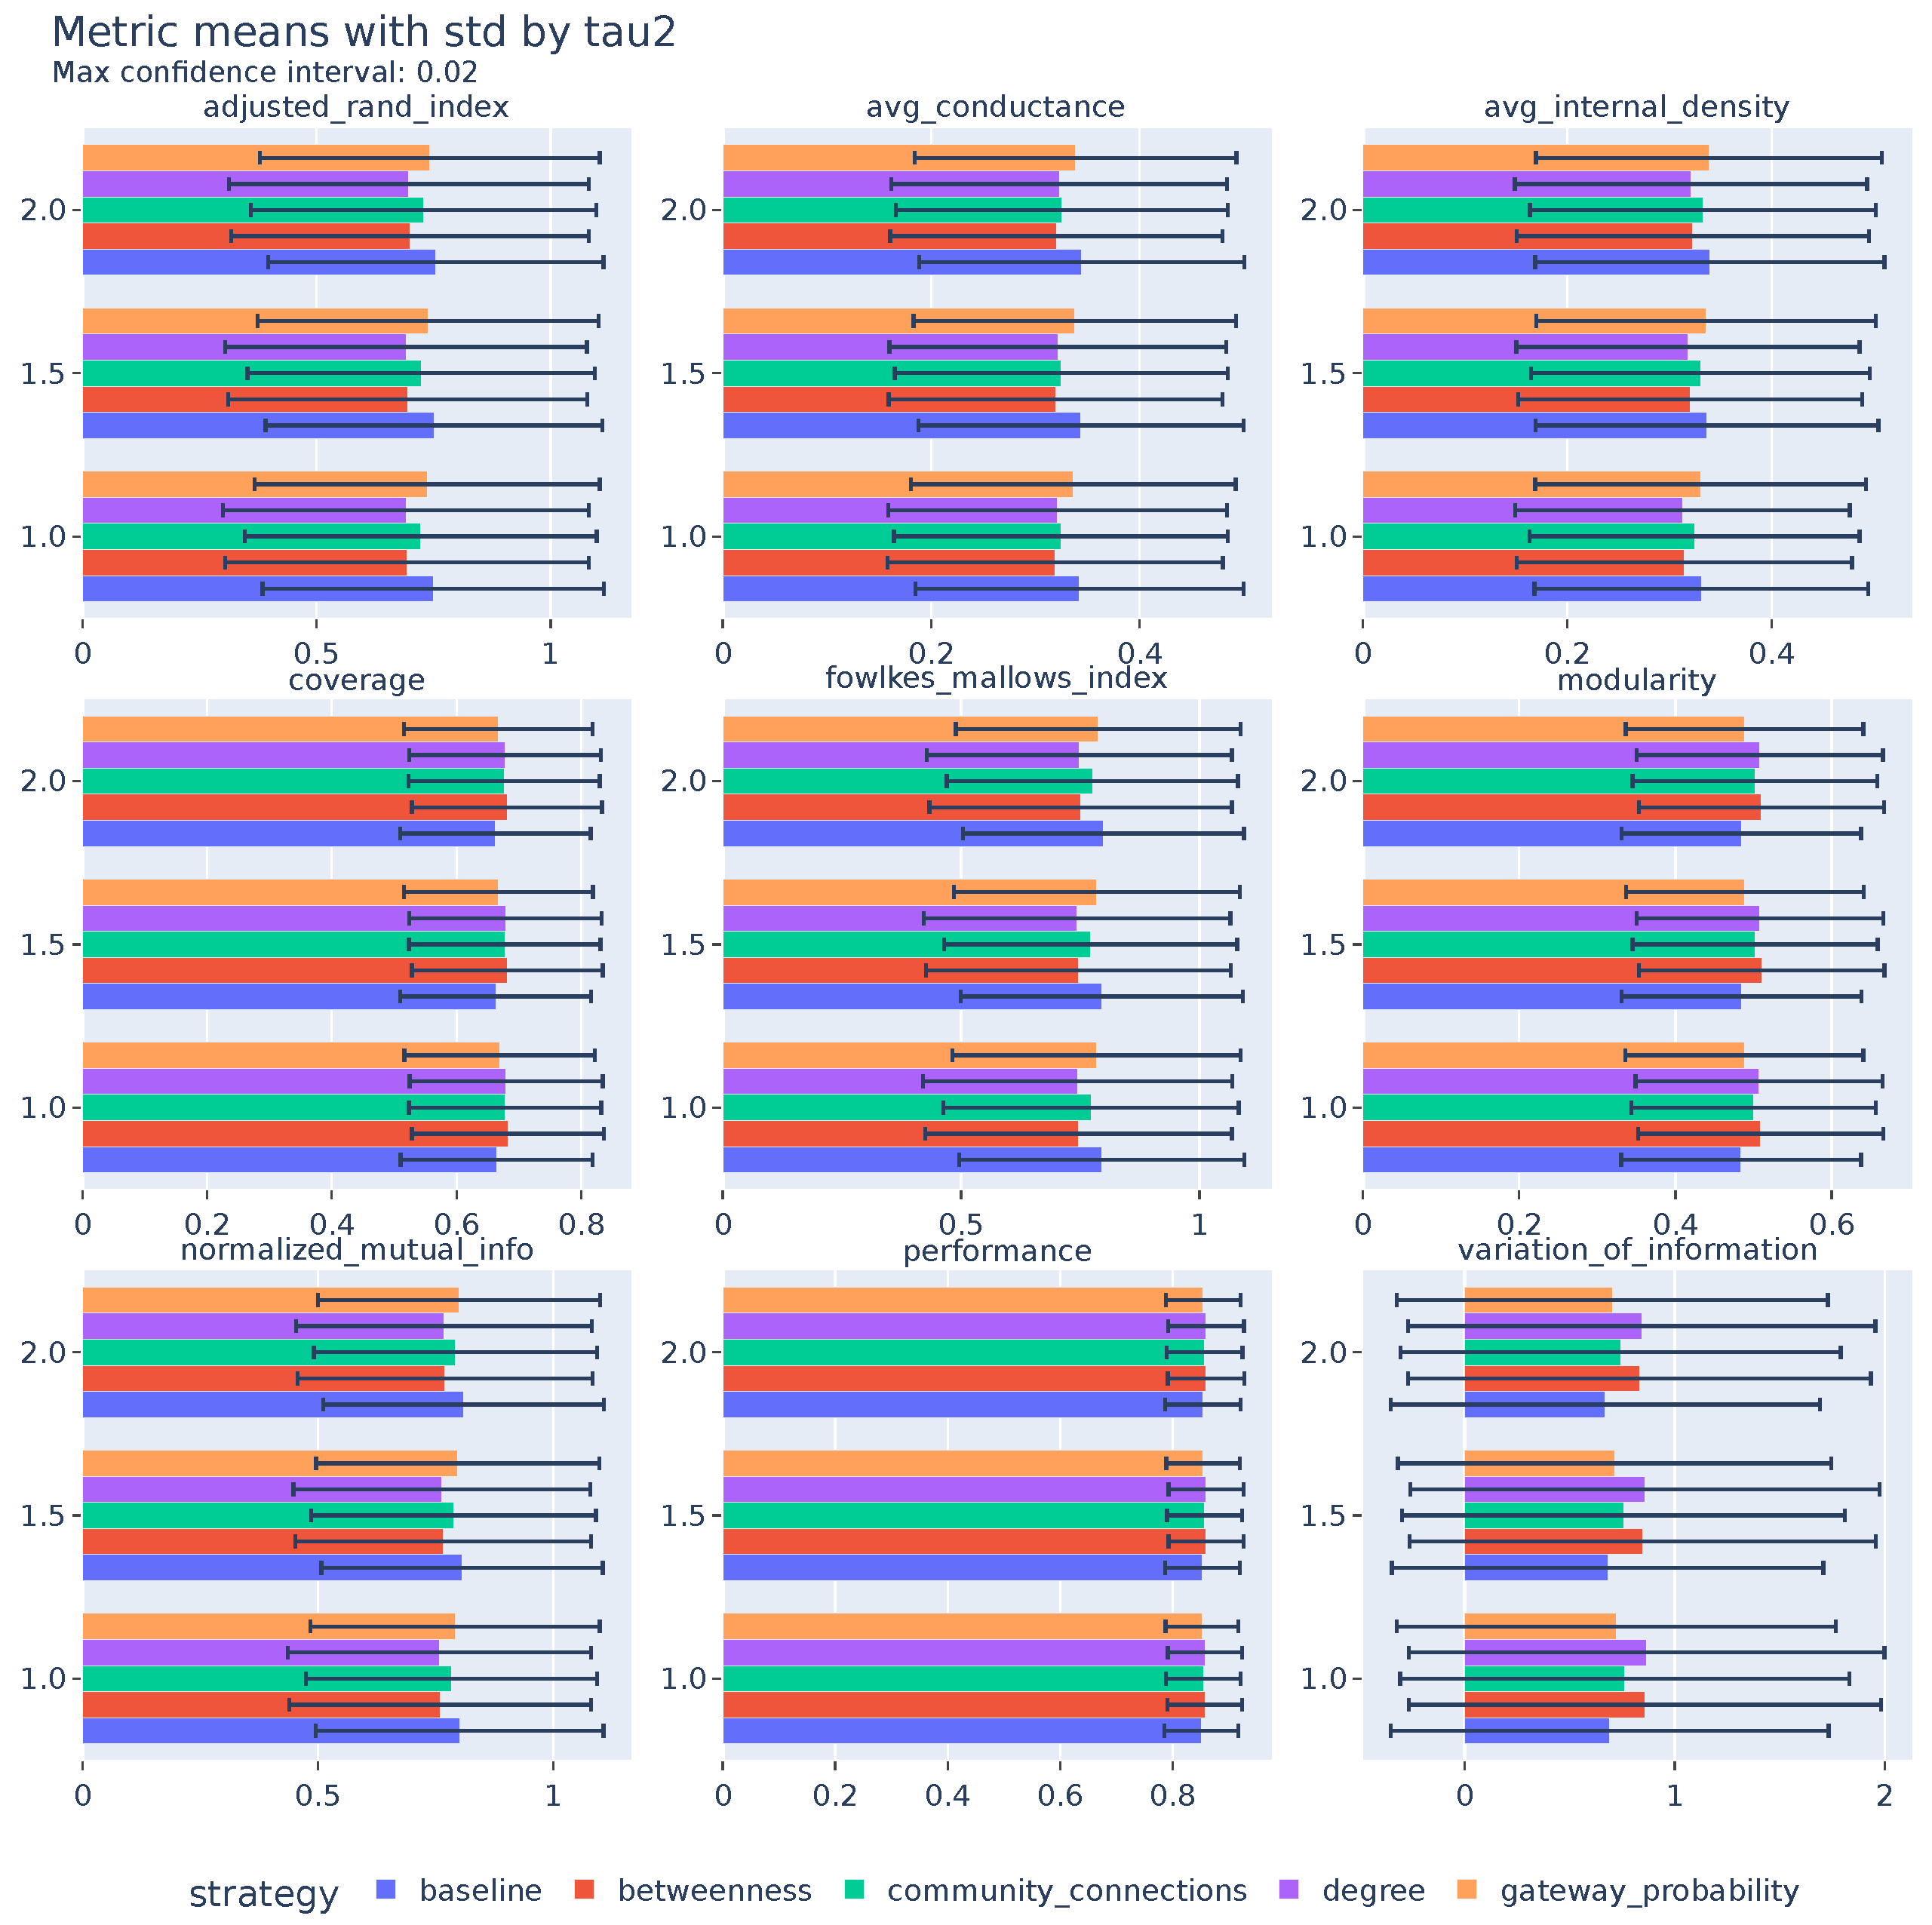
Figure A9.
Evaluation metrics by node removal fraction.
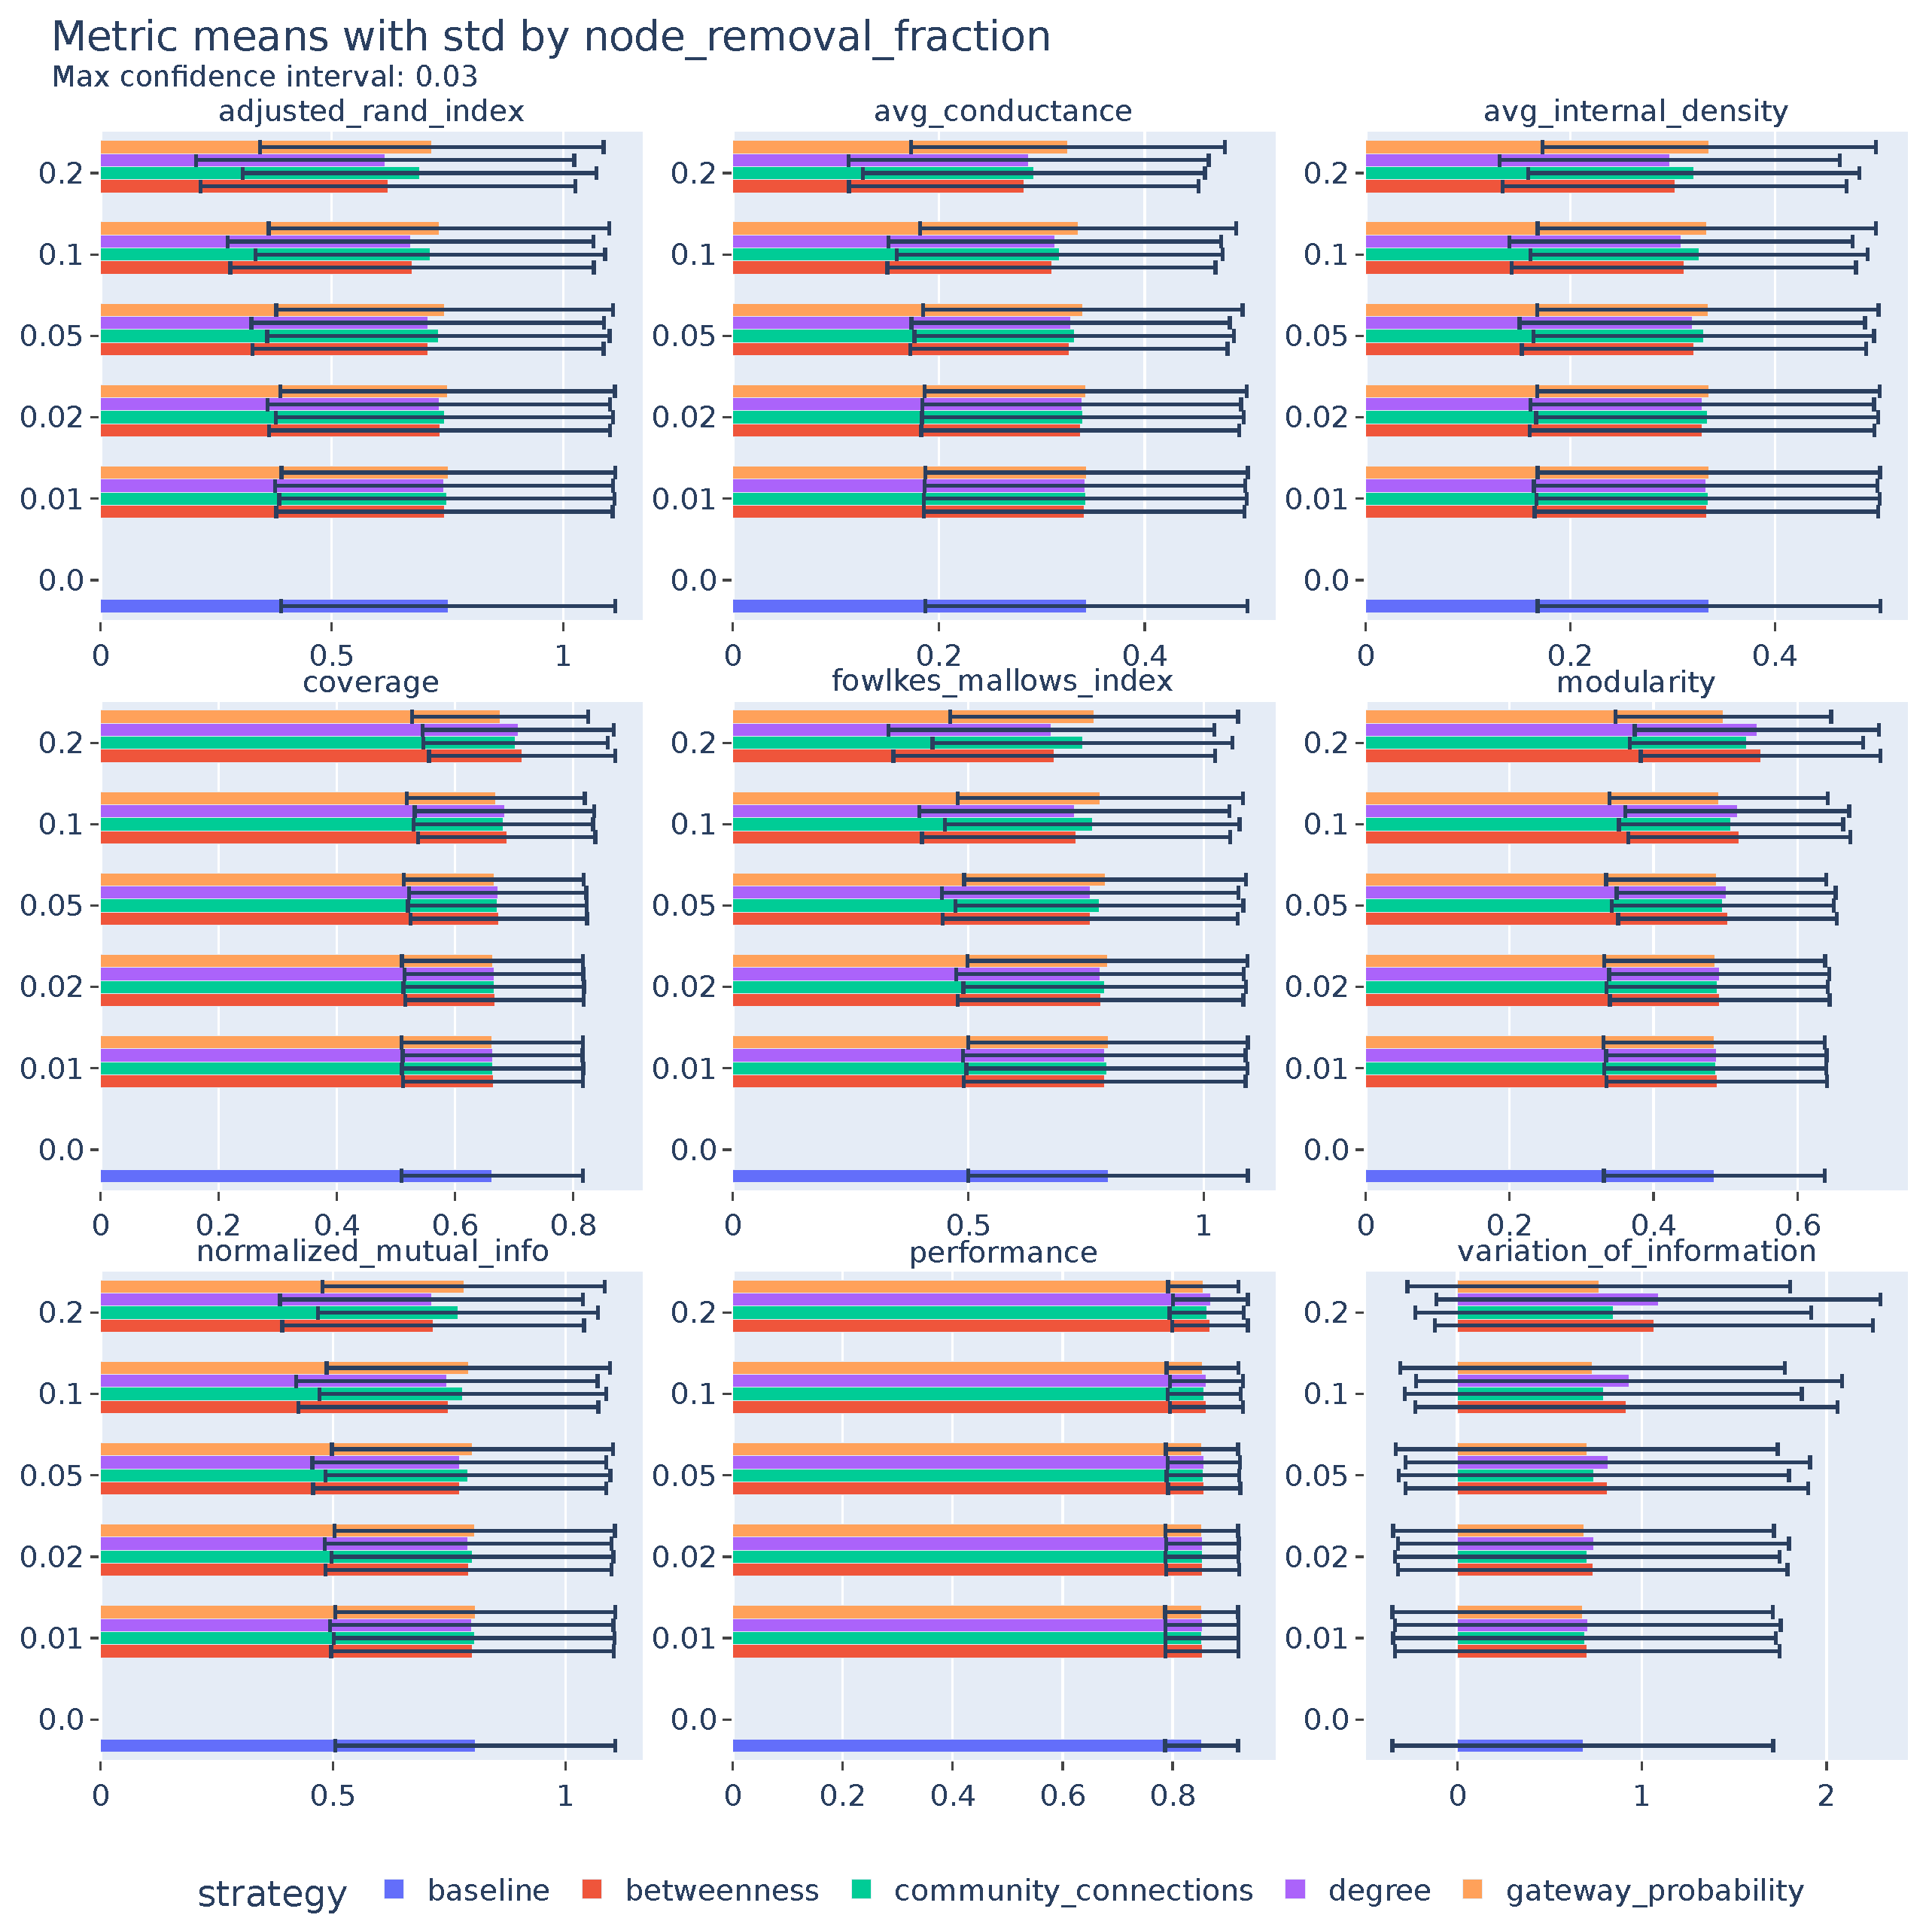
Figure A10.
Evaluation metrics by number of runs (only for dismantling by gateway probability).
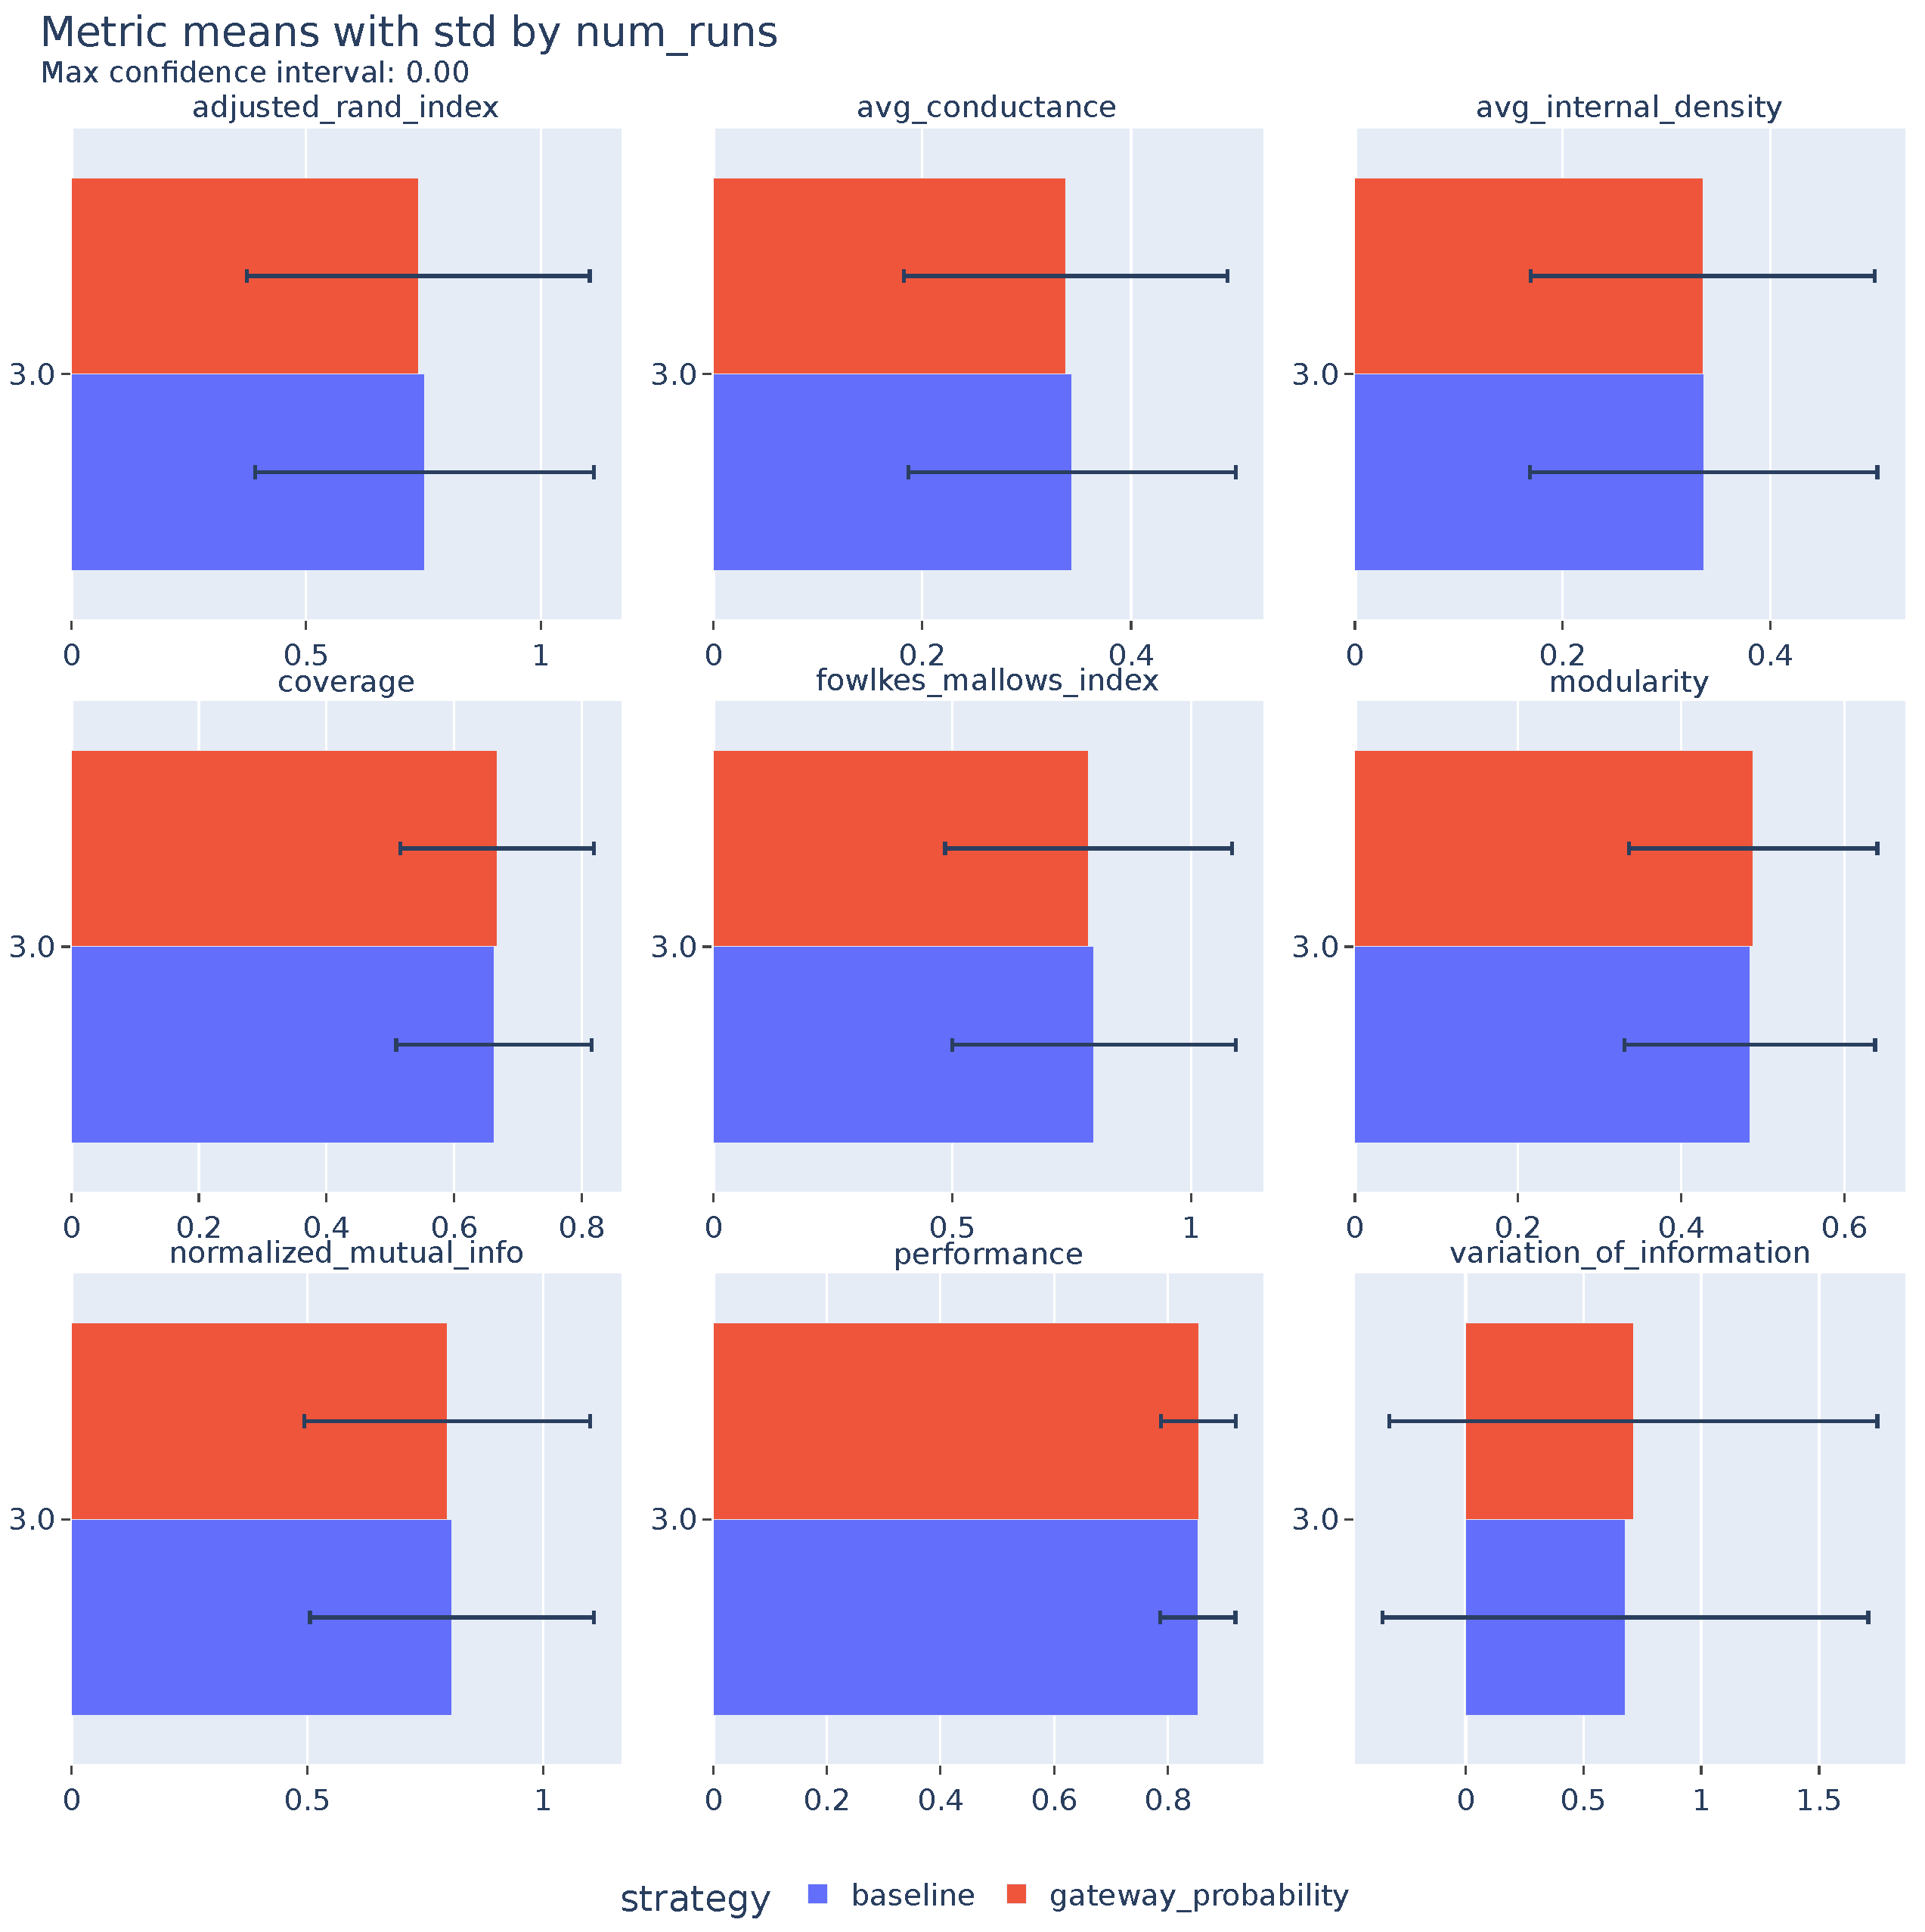
Figure A11.
Evaluation metrics by number of walks (only for dismantling by gateway probability).
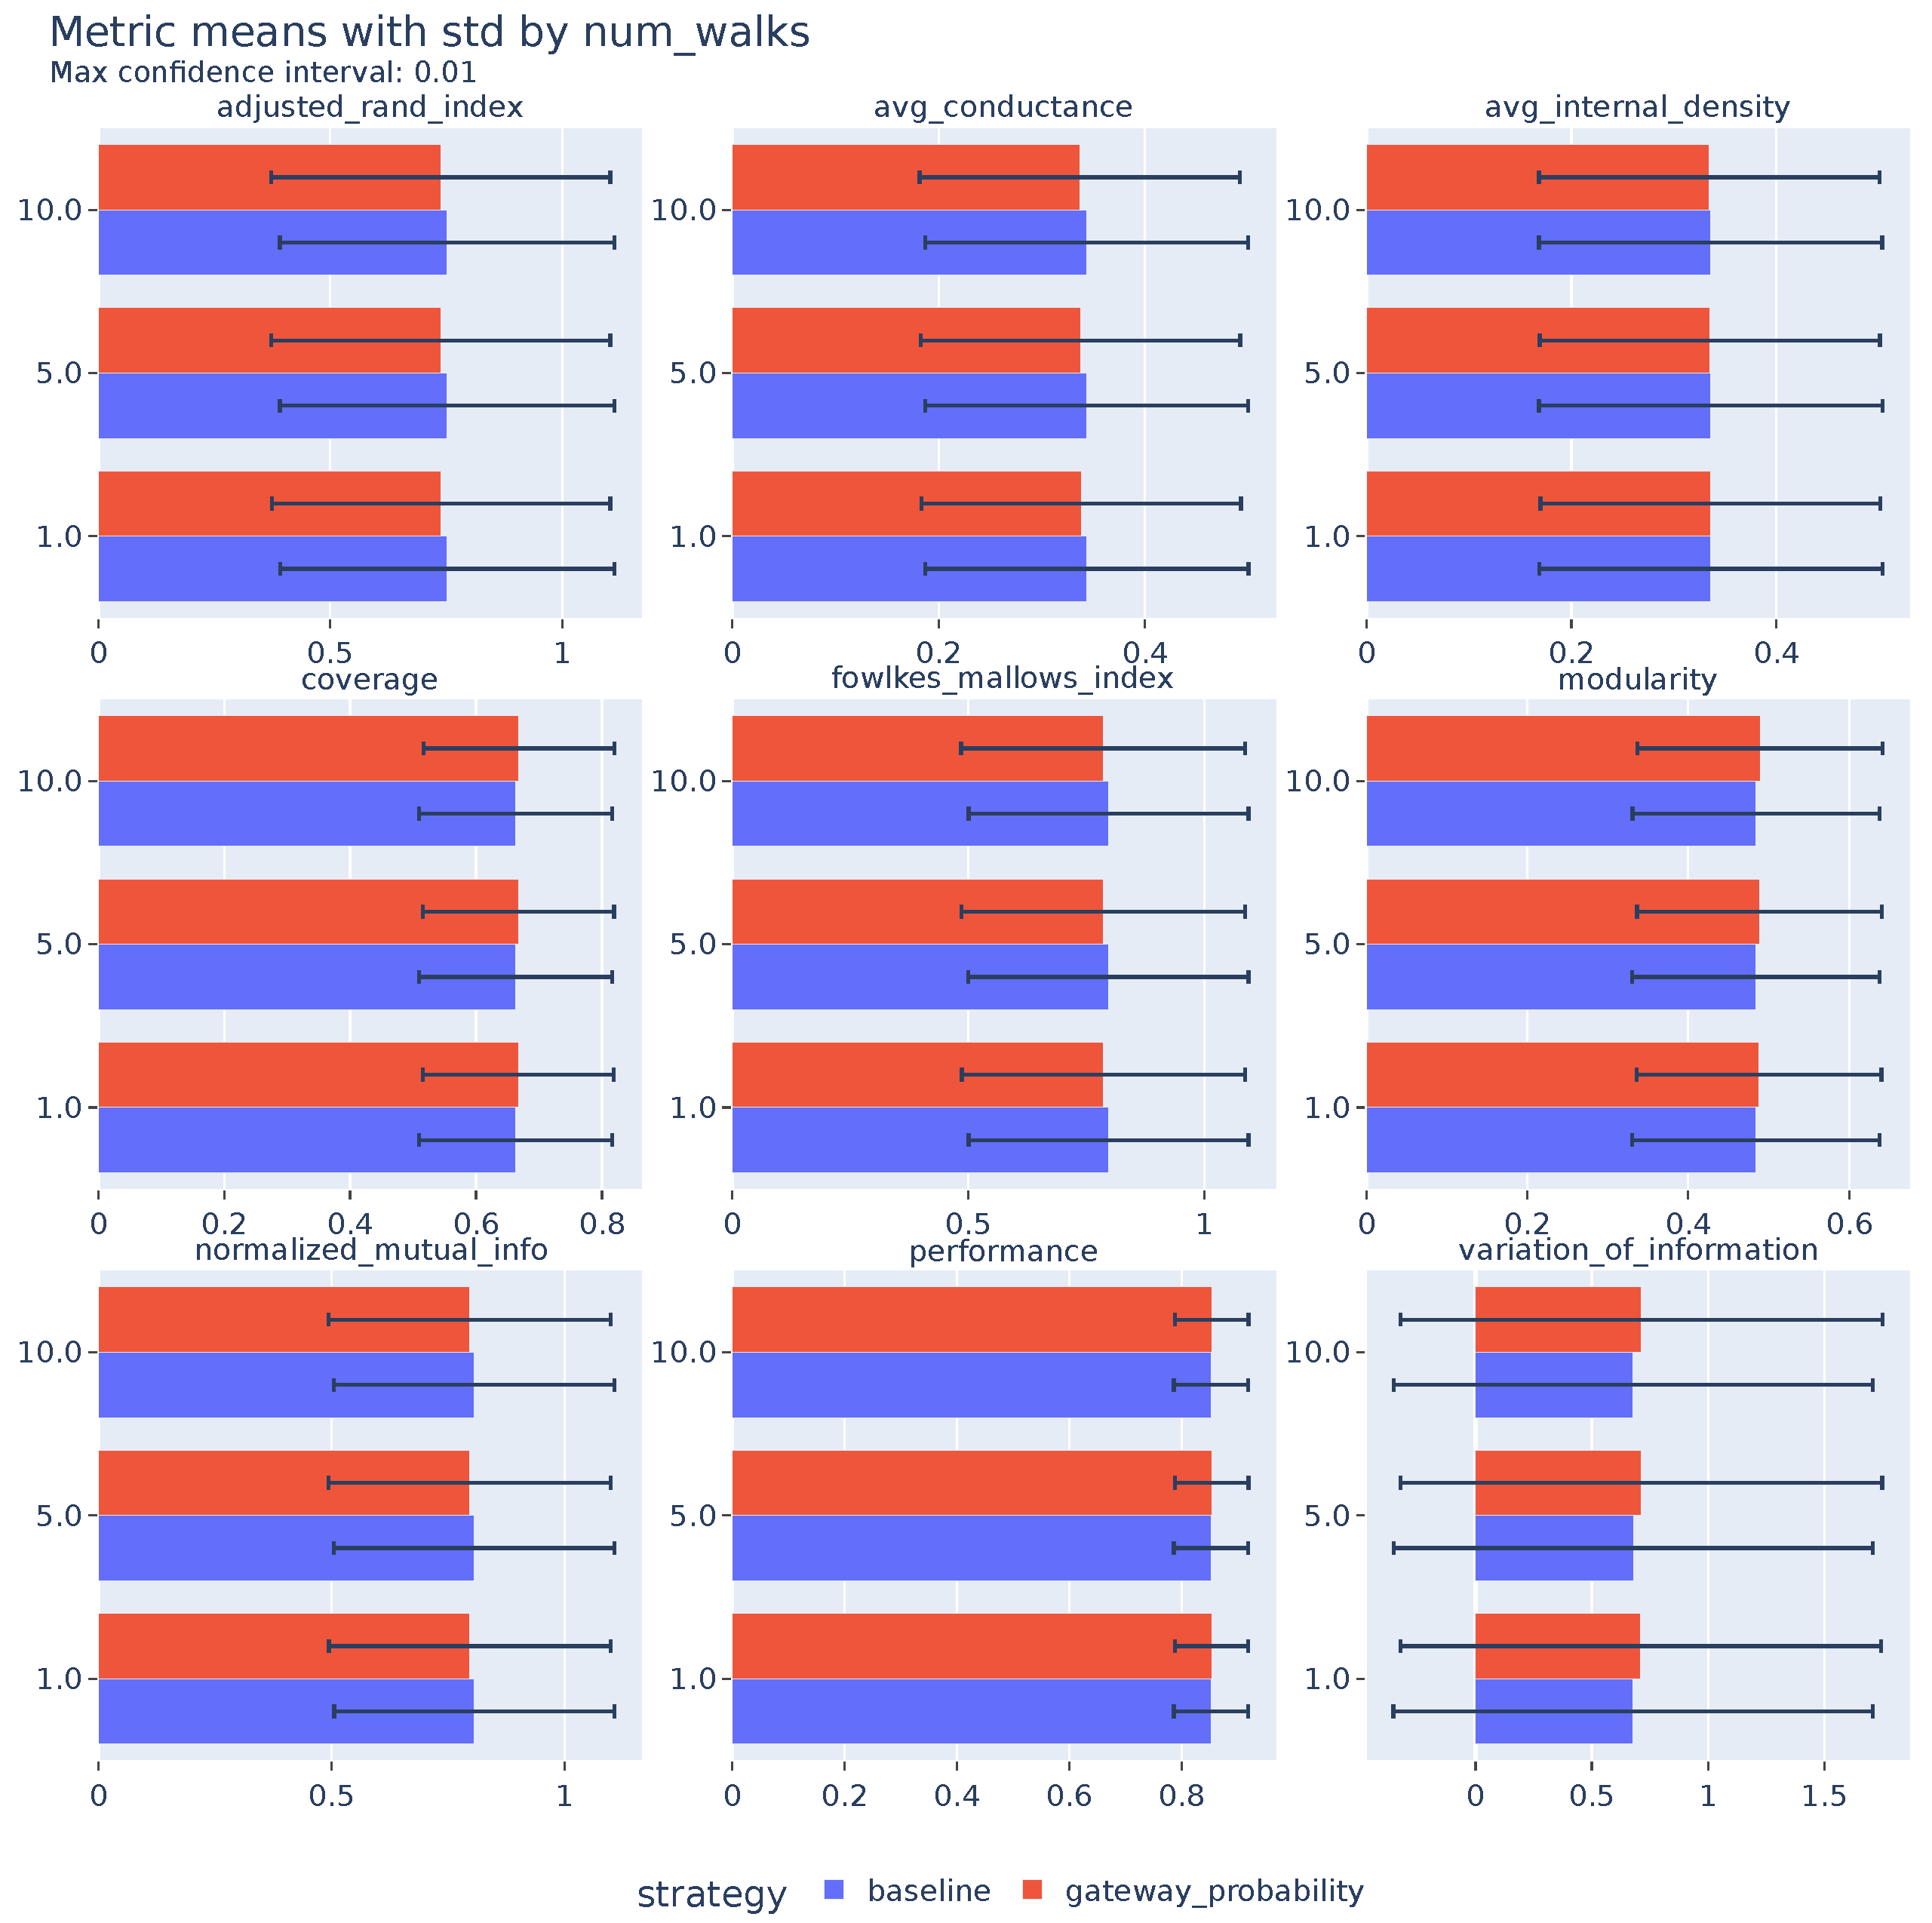
Figure A12.
Evaluation metrics by random walk length (only for dismantling by gateway probability).
References
- Newman, M. Networks; Oxford University Press: Oxford, UK, 2018. [Google Scholar]
- Fortunato, S. Community detection in graphs. Phys. Rep. 2010, 486, 75–174. [Google Scholar] [CrossRef] [Scilit]
- Artime, O.; Grassia, M.; De Domenico, M.; Gleeson, J.P.; Makse, H.A.; Mangioni, G.; Perc, M.; Radicchi, F. Robustness and resilience of complex networks. Nat. Rev. Phys. 2024, 6, 114–131. [Google Scholar] [CrossRef] [Scilit]
- Han, J.; Shi, Y.; Huang, D.; Huang, Z.; Zhang, A. Graph Learning–Based Network Dismantling via hierarchical feature fusion and margin–ranked optimization. J. Complex Netw. 2025, 13, cnaf015. [Google Scholar] [CrossRef] [Scilit]
- Han, J.; Zhang, C.; Dong, G.; Zhao, L.; Shi, Y.; Zou, Y. Generalized network dismantling based on cost–aware source–sampling betweenness. Chaos Interdiscip. J. Nonlinear Sci. 2025, 35, 053114. [Google Scholar] [CrossRef] [Scilit]
- Burt, R.S. Structural holes and good ideas. Am. J. Sociol. 2004, 110, 349–399. [Google Scholar] [CrossRef] [Scilit]
- Salathé, M.; Jones, J.H. Dynamics and control of diseases in networks with community structure. PLoS Comput. Biol. 2010, 6, e1000736. [Google Scholar] [CrossRef] [Scilit] [PubMed]
- Pastor-Satorras, R.; Castellano, C.; Van Mieghem, P.; Vespignani, A. Epidemic processes in complex networks. Rev. Mod. Phys. 2015, 87, 925–979. [Google Scholar] [CrossRef] [Scilit]
- Li, P.; Sun, X.; Zhang, K.; Zhang, J.; Kurths, J. Role of structural holes in containing spreading processes. Phys. Rev. E 2016, 93, 032312. [Google Scholar] [CrossRef] [Scilit] [PubMed]
- Buldyrev, S.V.; Parshani, R.; Paul, G.; Stanley, H.E.; Havlin, S. Catastrophic cascade of failures in interdependent networks. Nature 2010, 464, 1025–1028. [Google Scholar] [CrossRef] [Scilit]
- Guimera, R.; Nunes Amaral, L.A. Functional cartography of complex metabolic networks. Nature 2005, 433, 895–900. [Google Scholar] [CrossRef] [Scilit]
- Morone, F.; Makse, H.A. Influence maximization in complex networks through optimal percolation. Nature 2015, 524, 65–68. [Google Scholar] [CrossRef] [Scilit]
- Newman, M.E. Spectral methods for community detection and graph partitioning. Phys. Rev. E 2013, 88, 042822. [Google Scholar] [CrossRef] [Scilit]
- Musciotto, F.; Miccichè, S. Exploring the landscape of dismantling strategies based on the community structure of networks. Sci. Rep. 2023, 13, 14448. [Google Scholar] [CrossRef] [Scilit] [PubMed]
- Rollo, C.; De Francisci Morales, G.; Monti, C.; Panisson, A. Communities, gateways, and bridges: Measuring attention flow in the reddit political sphere. In Proceedings of the International Conference on Social Informatics; Springer: Berlin/Heidelberg, Germany, 2022; pp. 3–19. [Google Scholar]
- Sawicki, J.; Ganzha, M. Exploring Reddit Community Structure: Bridges, Gateways and Highways. Electronics 2024, 13, 1935. [Google Scholar] [CrossRef] [Scilit]
- Albert, R.; Jeong, H.; Barabási, A.L. Error and attack tolerance of complex networks. Nature 2000, 406, 378–382. [Google Scholar] [CrossRef] [Scilit] [PubMed]
- Cohen, R.; Erez, K.; Ben-Avraham, D.; Havlin, S. Breakdown of the internet under intentional attack. Phys. Rev. Lett. 2001, 86, 3682. [Google Scholar] [CrossRef] [Scilit]
- Freeman, L.C. A set of measures of centrality based on betweenness. Sociometry 1977, 40, 35–41. [Google Scholar] [CrossRef] [Scilit]
- Holme, P.; Kim, B.J.; Yoon, C.N.; Han, S.K. Attack vulnerability of complex networks. Phys. Rev. E 2002, 65, 056109. [Google Scholar] [CrossRef] [Scilit]
- Girvan, M.; Newman, M.E. Community structure in social and biological networks. Proc. Natl. Acad. Sci. USA 2002, 99, 7821–7826. [Google Scholar] [CrossRef] [Scilit]
- Traag, V.A.; Waltman, L.; Van Eck, N.J. From Louvain to Leiden: Guaranteeing well–connected communities. Sci. Rep. 2019, 9, 5233. [Google Scholar] [CrossRef] [Scilit]
- Sahu, S.; Kothapalli, K.; Banerjee, D.S. Fast leiden algorithm for community detection in shared memory setting. In Proceedings of the 53rd International Conference on Parallel Processing; Association for Computing Machinery (ACM): New York, NY, USA, 2024; pp. 11–20. [Google Scholar]
- Lancichinetti, A.; Fortunato, S.; Radicchi, F. Benchmark graphs for testing community detection algorithms. Phys. Rev. E 2008, 78, 046110. [Google Scholar] [CrossRef] [Scilit]
- Staudt, C.L.; Sazonovs, A.; Meyerhenke, H. NetworKit: A tool suite for large-scale complex network analysis. Netw. Sci. 2016, 4, 508–530. [Google Scholar] [CrossRef] [Scilit]
- Hubert, L.; Arabie, P. Comparing partitions. J. Classif. 1985, 2, 193–218. [Google Scholar] [CrossRef] [Scilit]
- Warrens, M.J.; Van Der Hoef, H. Understanding the adjusted rand index and other partition comparison indices based on counting object pairs. J. Classif. 2022, 39, 487–509. [Google Scholar] [CrossRef] [Scilit]
- Danon, L.; Diaz-Guilera, A.; Duch, J.; Arenas, A. Comparing community structure identification. J. Stat. Mech. Theory Exp. 2005, 2005, P09008. [Google Scholar] [CrossRef] [Scilit]
- Fowlkes, E.B.; Mallows, C.L. A method for comparing two hierarchical clusterings. J. Am. Stat. Assoc. 1983, 78, 553–569. [Google Scholar] [CrossRef]
- Chicco, D.; Jurman, G. A statistical comparison between Matthews correlation coefficient (MCC), prevalence threshold, and Fowlkes–Mallows index. J. Biomed. Inform. 2023, 144, 104426. [Google Scholar] [CrossRef] [Scilit]
- Meilă, M. Comparing clusterings—An information based distance. J. Multivar. Anal. 2007, 98, 873–895. [Google Scholar] [CrossRef] [Scilit]
- Newman, M.E. Modularity and community structure in networks. Proc. Natl. Acad. Sci. USA 2006, 103, 8577–8582. [Google Scholar] [CrossRef] [Scilit]
- Leskovec, J.; Lang, K.J.; Dasgupta, A.; Mahoney, M.W. Statistical properties of community structure in large social and information networks. In Proceedings of the 17th International Conference on World Wide Web; Association for Computing Machinery (ACM): New York, NY, USA, 2008; pp. 695–704. [Google Scholar]
- Yang, J.; Leskovec, J. Defining and evaluating network communities based on ground–truth. In Proceedings of the ACM SIGKDD Workshop on Mining Data Semantics; Association for Computing Machinery (ACM): New York, NY, USA, 2012; pp. 1–8. [Google Scholar]
- Shi, L.; Yan, S.; Li, W. Consensus and products of substochastic matrices: Convergence rate with communication delays. IEEE Trans. Syst. Man Cybern. Syst. 2025, 55, 4752–4761. [Google Scholar] [CrossRef] [Scilit]
- Li, W.; Yan, S.; Shi, L.; Yue, J.; Shi, M.; Lin, B.; Qin, K. Multiagent consensus tracking control over asynchronous cooperation–competition networks. IEEE Trans. Cybern. 2025, 55, 4347–4360. [Google Scholar] [CrossRef] [Scilit]

Disclaimer/Publisher’s Note: The statements, opinions and data contained in all publications are solely those of the individual author(s) and contributor(s) and not of MDPI and/or the editor(s). MDPI and/or the editor(s) disclaim responsibility for any injury to people or property resulting from any ideas, methods, instructions or products referred to in the content. |
© 2026 by the authors. Licensee MDPI, Basel, Switzerland. This article is an open access article distributed under the terms and conditions of the Creative Commons Attribution (CC BY) license.