1. Introduction
The rapid urbanization of cities in the Gulf region, particularly in Saudi Arabia, has placed increasing pressure on transportation infrastructures, leading to traffic congestion, elevated carbon emissions, and degraded air quality. Riyadh, as a fast-growing metropolis, exemplifies these challenges with its high vehicle dependency and limited adoption of sustainable mobility solutions. In response, the integration of AVs into urban transportation systems is gaining attention as a potential catalyst for improved traffic efficiency and environmental performance. When properly coordinated, AVs offer the potential to reduce reaction time, improve traffic flow, and optimize fuel usage; however, for the foreseeable future the majority of road networks will feature mixed traffic composed of both AVs and traditional human-driven vehicles (HVs). The transitional phase of AV adoption necessitates robust frameworks capable of managing these heterogeneous fleets in order to harness the benefits of AVs without compromising safety or throughput. Recent advances in vehicular communication, specifically V2V, V2I, and V2N technologies, enable connected and automated vehicles (CAVs) to make collaborative driving decisions. Nevertheless, simulating such coordinated behavior in large-scale urban settings remains computationally challenging. Traffic microsimulation platforms such as the Simulation of Urban Mobility (SUMO) platform can serve as powerful tools for evaluating policy and infrastructure interventions, but require enhancements to reflect the coordination and intelligence enabled by V2X technologies. This study introduces a harmonized AV–HV coordination framework, termed HARMONY-AV, which approximates communication-driven behavior using SUMO and its TraCI interface. The framework is tested on a major corridor in Riyadh Prince Mohammed bin Salman bin Abdulaziz Road using real traffic data and emissions models. By simulating four AV penetration scenarios (0%, 10%, 30%, 50%), we quantify the effects of increasing AV integration on key performance indicators such as the travel time, stop frequency, average speed, and CO2 emissions.
The contributions of this work are threefold:
Proposing a reproducible SUMO-based simulation pipeline tailored for mixed AV-HV traffic scenarios in Saudi Arabia;
Modeling V2X-inspired AV behavior through realistic parameter tuning and API-based coordination;
Demonstrating the environmental and mobility benefits of AV coordination under varying levels of penetration.
By offering a scalable and context-aware simulation framework, this study supports data-driven planning for future smart mobility deployments and provides practical guidance for policymakers and urban planners seeking to reduce emissions and improve traffic efficiency in mid-sized Gulf cities.
2. Related Work
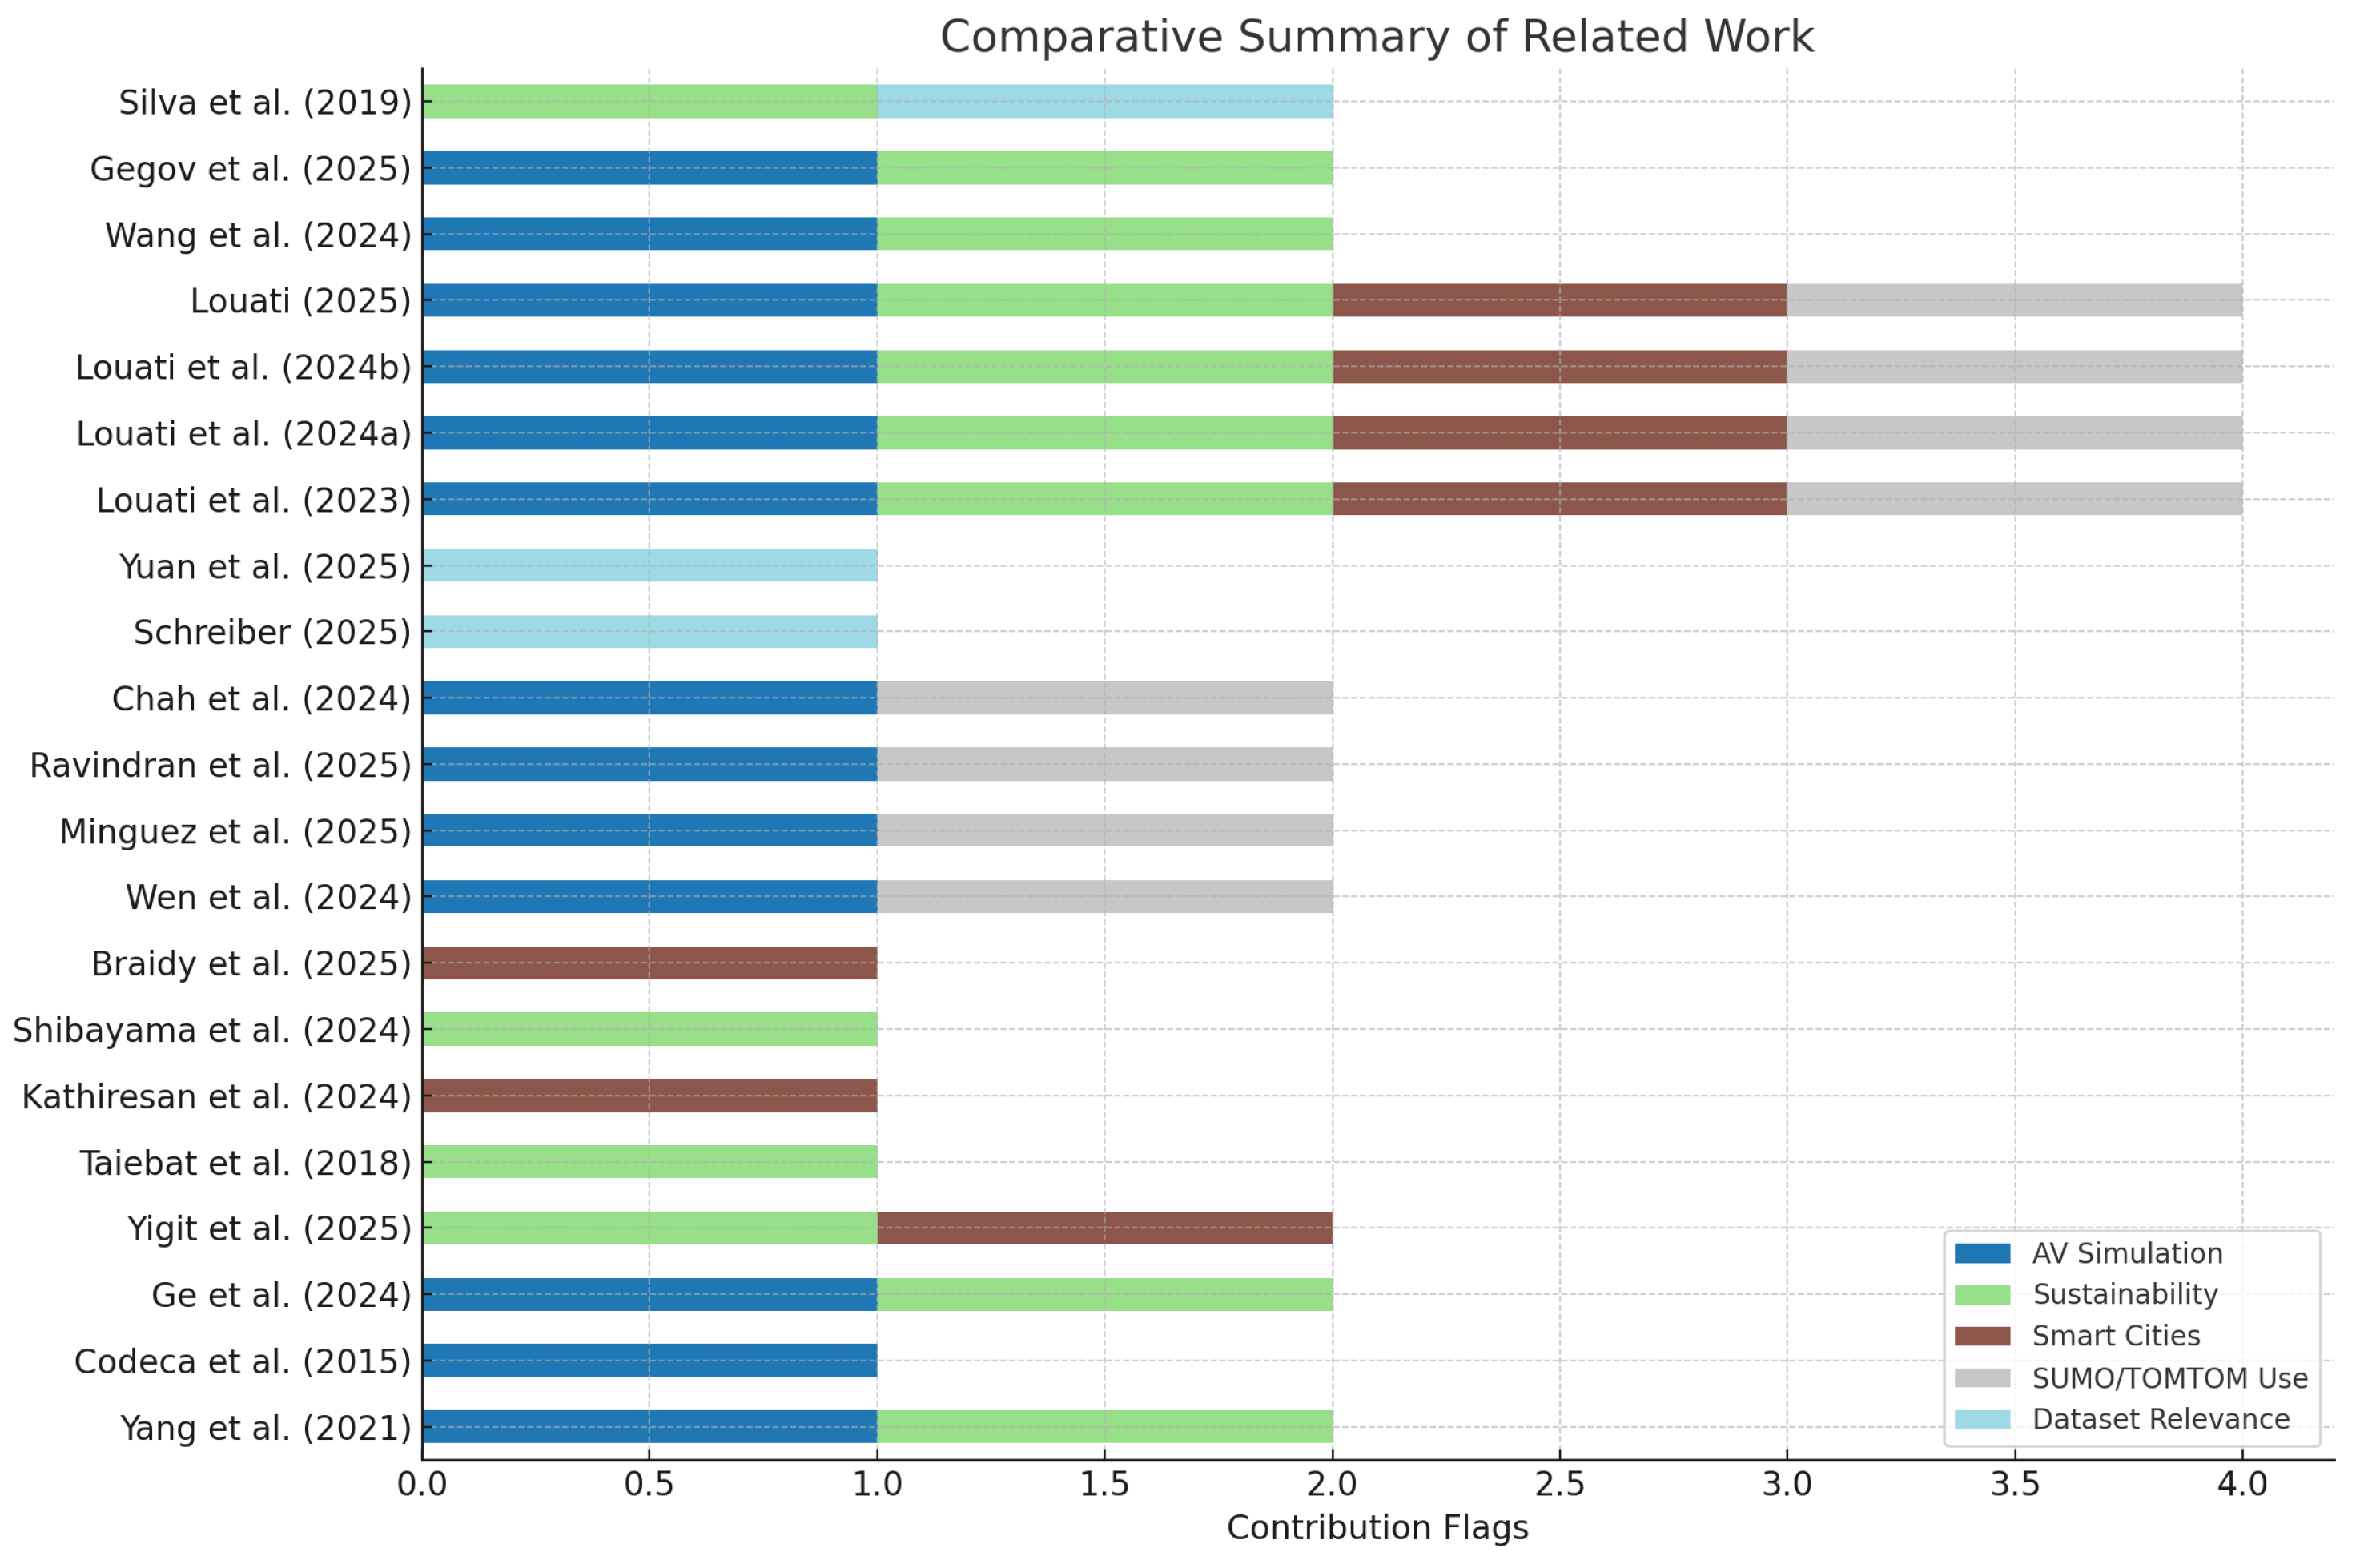
The research landscape on connected and autonomous vehicles (CAVs) and their integration within smart cities has seen substantial progress. Yang et al. [
1] highlighted the effect of CAVs on traffic efficiency at on-ramps, while Codeca et al. [
2] introduced the LUST scenario, a foundational SUMO dataset for vehicular simulation. Ge et al. [
3] examined environmental impacts in mixed traffic flows of CAVs and human-driven vehicles. Yigit and Karabatak [
4] applied deep reinforcement learning to reduce emissions, showing the promise of AI in real-time control. Taiebat et al. [
5] provided a broad review of sustainability and energy implications for AVs, supporting the long-term planning of sustainable cities. Kathiresan et al. [
6] explored deep learning for urban aerial mobility, offering a relevant methodological parallel for urban simulation studies. Shibayama and Laa [
7] proposed the Sustainable Mobility Guarantee concept, which reframes planning practices to support inclusivity and accessibility. Similarly, Braidy et al. [
8] discussed innovations in automotive sectors, positioning our focus within broader technological trends. Several studies have utilized SUMO for simulation-based traffic evaluations. Wen et al. [
9] developed a co-simulation with AirSim for UTM systems, while Minguez et al. [
10] built a SUMO-based simulator for emergency vehicle dispatch optimization. Ravindran et al. [
11] and Chah et al. [
12] focused on analyzing heterogeneous traffic and driver behavior datasets, respectively. Regarding data sources, Schreiber [
13] introduced TomTom-lite for large-scale pattern extraction, while Yuan et al. [
14] reviewed third-party traffic datasets such as TomTom and HERE Technologies. HERE Technologies is a company that provides a widely used location and mapping platform. HERE offers traffic and mobility datasets similar to TomTom, and their data are commonly used in transportation research, smart city applications, and AV simulations. Recent contributions by Louati et al. [
15,
16] applied machine learning and collaborative cloud techniques for sustainable mobility and traffic management in Saudi Arabia, particularly in AlKharj. These works are foundational for contextual simulation-based approaches in traffic control, AV integration, and additional emerging urban contexts. Future Internet-oriented studies such as Wang et al. [
17] have surveyed AV scenario generation, while Gegov et al. [
18] proposed fuzzy-based traffic flow control for urban networks. In addition, Silva et al. [
19] proposed a crowd-sensing platform for emission monitoring, demonstrating the fusion of IoT and urban mobility analytics.
In contrast to these works, our contribution lies in simulating AV communication and coordination mechanisms via SUMO using real urban topology and traffic data from AlKharj (
Figure 1). We incorporate TraCI-based logic to emulate V2X effects and test coordinated AV behavior using localized TomTom-based scenarios, a combination that has not previously been presented. Moreover, our focus on sustainability-aware simulations using accessible tools aligns strongly with the Future Internet vision.
3. Materials and Methods
This study focuses on the simulation and analysis of traffic emissions along Prince Mohammed bin Salman bin Abdulaziz Road in Riyadh, Saudi Arabia. The corridor spans approximately 20 km, connecting King Khalid International Airport to Diriyah and traversing major intersections with Olaya Street, King Abdullah Road, Abu Bakr As-Siddiq Road, and Uthman bin Affan Road. The network was extracted from OpenStreetMap (OSM) and simulated using the Simulation of Urban Mobility (SUMO) framework.
3.1. Datasets and Sources
To evaluate the impact of AVs on traffic efficiency and emissions, a comprehensive dataset was constructed using both real-world and simulated sources. The raw datasets underwent standard preprocessing and cleaning procedures to ensure consistency and reliability. Redundant entries were removed, column names were normalized, and all timestamps were aligned to a consistent 24-hour format using UTC+3 to match the local time zone of Riyadh. Inconsistencies due to format differences between data providers were resolved through a parsing and validation script. Outlier handling was conducted using an interquartile range (IQR)-based method to detect and smooth anomalous traffic counts or travel times, especially those occurring due to sensor noise or atypical reporting. Detected outliers were corrected using a locally weighted smoothing function to preserve the general pattern without distorting peak or off-peak distributions. Intersections were geocoded and mapped to SUMO nodes using a Python-based matching algorithm that cross-referenced OpenStreetMap (OSM) data and official Saudi road maps. Vehicle types were proportionally allocated based on regional transport fleet distributions published by the Saudi Ministry of Transport and cross-referenced with urban mobility studies relevant to Riyadh’s vehicle mix. While the dataset provides rich temporal coverage throughout the year, it does exhibit certain limitations. Traffic data collected during national holidays, religious events, and major public gatherings may not fully represent regular weekday patterns. These periods were flagged and considered in the analysis, but were not removed in order to preserve overall traffic behavior variance. These datasets were ultimately selected for their accuracy, comprehensiveness, and relevance to the specific traffic conditions in Riyadh. An overview of the dataset sources is illustrated in
Figure 2, and more details are discussed in the following subsections.
3.1.1. TomTom Traffic Index Data (2024)
This dataset is sourced from TomTom’s official traffic index portal (
https://www.tomtom.com/traffic-index/riyadh-traffic/, accessed on 15 July 2025). It provides monthly insights into traffic congestion and average travel times in Riyadh. We extracted and compiled data from January to December 2024, including metrics such as average travel time per 10 km, congestion level percentage, and peak hour delays. A sample of the TomTom dataset can be found in
Table 1.
3.1.2. Saudi Traffic Flow and Intersections Data (2023)
This dataset was collected from open Saudi datasets (
https://open.data.gov.sa/en/datasets?searchValue=riyadh20traffic, accessed on 15 July 2025) and field logs. It includes hourly vehicle counts at major intersections along Prince Mohammed Bin Salman Road. Intersections were characterized by their control type (e.g., signalized, roundabout). This dataset was used to support calibration of the SUMO simulations. A sample of the Saudi traffic flow and intersections data is shown in
Table 2.
3.2. SUMO Simulation (2025)
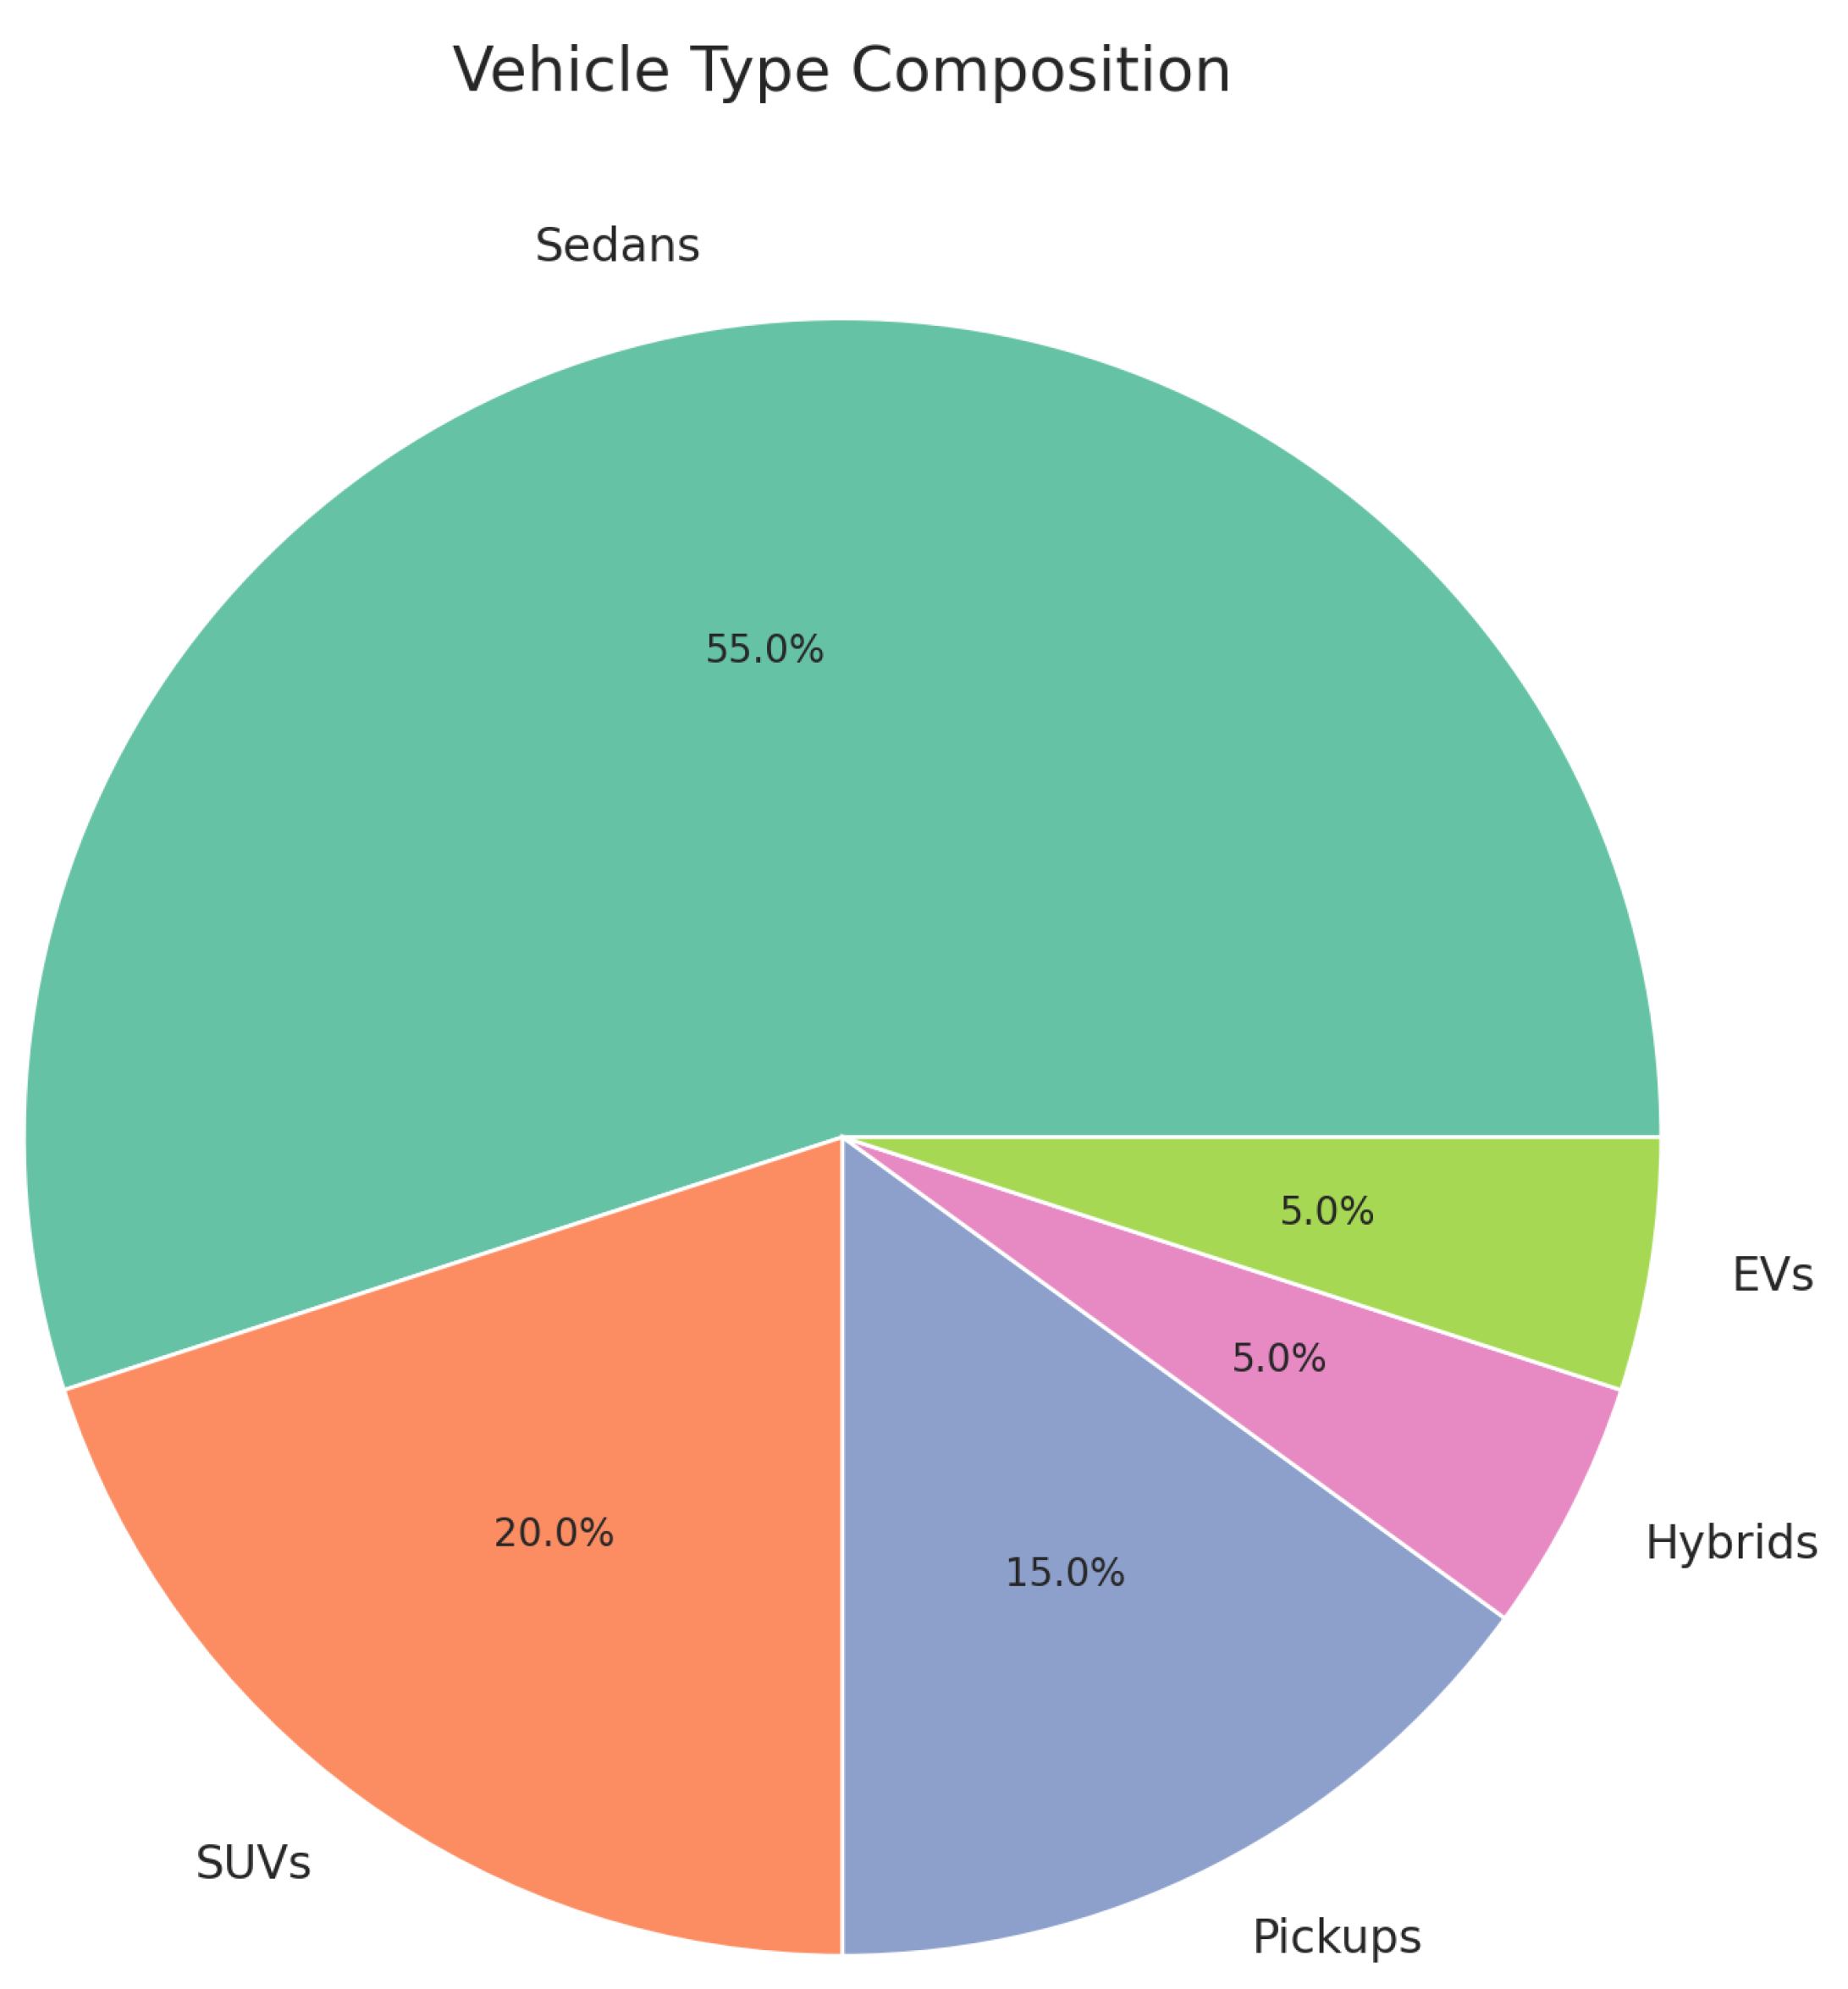
We used the Simulation of Urban Mobility (SUMO) framework to model mixed AV–HV traffic conditions along a 20 km corridor of Prince Mohammed bin Salman Road in Riyadh. The simulation network was extracted from OpenStreetMap (OSM) and processed using SUMO’s netconvert and NetEdit tools. To replicate real-world fleet diversity, vehicle types in the simulation were distributed based on publicly available statistics from the Saudi Ministry of Transport and regional fleet composition reports. The resulting vehicle mix included 55% sedans, 20% SUVs, 15% pickup trucks, 5% hybrid vehicles, and 5% electric vehicles (EVs), reflecting typical private and commercial vehicle proportions in Saudi Arabia. This distribution was implemented using SUMO’s vehicle distribution functions and applied uniformly across all scenarios to ensure comparability. This corridor was chosen due to its strategic role in connecting airport traffic with central Riyadh, diverse traffic patterns, and candidacy for smart mobility upgrades in the near future. The network was extracted from OpenStreetMap (OSM) using the SUMO netconvert tool and visualized in NetEdit. The map shown in
Figure 3 illustrates the detailed urban structure of the simulation region, where green areas represent accessible road infrastructure and pink polygons indicate restricted or building zones.
The simulation was configured using the osm.sumocfg file with the following components:
Simulation duration: 54,589 s (approx. 15 h)
Vehicle types: Passenger cars only (HVs and AVs)
Routing: Dynamic trip assignment based on demand profile
Traffic scale: Set to 1.0 using the GUI traffic scaling tool
Output: tripinfos.xml, stopinfos.xml, vehroutes.xml, emissions.xml
In total, 9215 trips were simulated with a traffic pattern representative of Riyadh’s weekday peak (7:00–9:00 a.m., 4:00–6:00 p.m.) and off-peak periods. AV behavior was modeled using SUMO’s Krauss car-following model, with the parameters set to reflect typical AV improvements: reduced reaction time (0.5 s), shorter minimum gap (1.5 m), and increased acceleration/deceleration capacities. Vehicle types were randomly assigned using SUMO’s distribution functions based on regional vehicle composition statistics: 55% sedans, 20% SUVs, 15% pickups, 5% hybrids, and 5% electric vehicles (EVs). A sample of the simulated dataset using SUMO is shown in
Table 3. All experiments were executed using SUMO version 1.17.0 on a system with an Intel i7-12700 CPU, 32GB RAM, and Ubuntu 22.04. Simulations were conducted via SUMO’s command-line interface (CLI) for reproducibility and batch processing.
3.3. Estimated CO2 Emissions Baseline (Pre-AV)
To estimate CO
2 emissions under traditional (non-AV) traffic conditions, we employed an empirical factor-based approach that integrates vehicle-specific emission coefficients with real-world trip distance data from the SUMO simulation. Emission factors were obtained from Gulf-region transport reports and IPCC Tier 1 guidelines, representing average tailpipe CO
2 emissions for various vehicle classes operating under urban driving conditions. These factors were multiplied by the corresponding route lengths simulated in SUMO to yield trip-level emissions. The total CO
2 emissions were computed using the following formula:
The average simulated route length was 13.2 km, with a standard deviation of 0.6 km. Vehicle category shares were assigned based on regional fleet statistics for Saudi Arabia: 55% gasoline sedans, 20% diesel SUVs, 15% pickup trucks, 5% hybrids, and 5% electric vehicles. These proportions were consistently used across all baseline simulation runs. The resulting CO
2 emissions per trip as stratified by vehicle type are shown in
Table 4.
This pre-AV emission baseline serves as a critical benchmark for evaluating the environmental benefits of autonomous vehicles, allowing for quantification of potential CO2 savings under the alternative mobility scenarios introduced in subsequent sections.
4. Modeling AV Communication and Coordinated Behavior
The simulation of autonomous vehicle (AV) communications remains a challenge in microscopic traffic simulators such as SUMO, which do not natively support explicit vehicle-to-vehicle (V2V), vehicle-to-infrastructure (V2I), or vehicle-to-network (V2N) protocols. However, the behavioral effects of these communication types can be approximated using parameter tuning, API interaction, and modular scripting. This section presents how such communication paradigms are represented in our simulations as well as the assumptions and modules used to replicate real-world coordinated AV behavior. In this study, AVs were configured using the Krauss car-following model, which was adjusted to reflect coordinated behavior enabled by V2X systems. Parameters such as a reduced reaction time (
s), shorter minimum following gap (
m), and enhanced acceleration/deceleration thresholds were used to simulate smoother movement and anticipatory control. Cooperative lane-changing was enabled through
lcStrategic and
lcCooperative. This allowed for predictive and synchronized merging, which is critical in congested intersections. To emulate communication-driven coordination, we used the TraCI API to dynamically control vehicle behavior during simulation runs. The TraCI interface was called at a frequency of
1 Hz (one API call per simulated second), allowing each AV to retrieve traffic signal states, adjust its speed relative to neighbors, and receive routing updates in near-real time. Specifically, functions such as
traci.vehicle.getNeighbors() and
traci.trafficlight.getRedYellowGreenState() were employed to approximate V2V and V2I behavior, respectively, while a centralized logic was used to govern V2N-like coordination. Although this 1-s resolution captures essential behavioral dynamics with manageable computational overhead, it abstracts finer network-layer effects such as sub-second communication delays, jitter, and packet loss. We acknowledge this limitation in
Section 6 and highlight the potential for future studies to incorporate full-stack V2X simulation platforms (e.g., OMNeT++ or Eclipse MOSAIC) for more granular validation and protocol-aware experimentation.
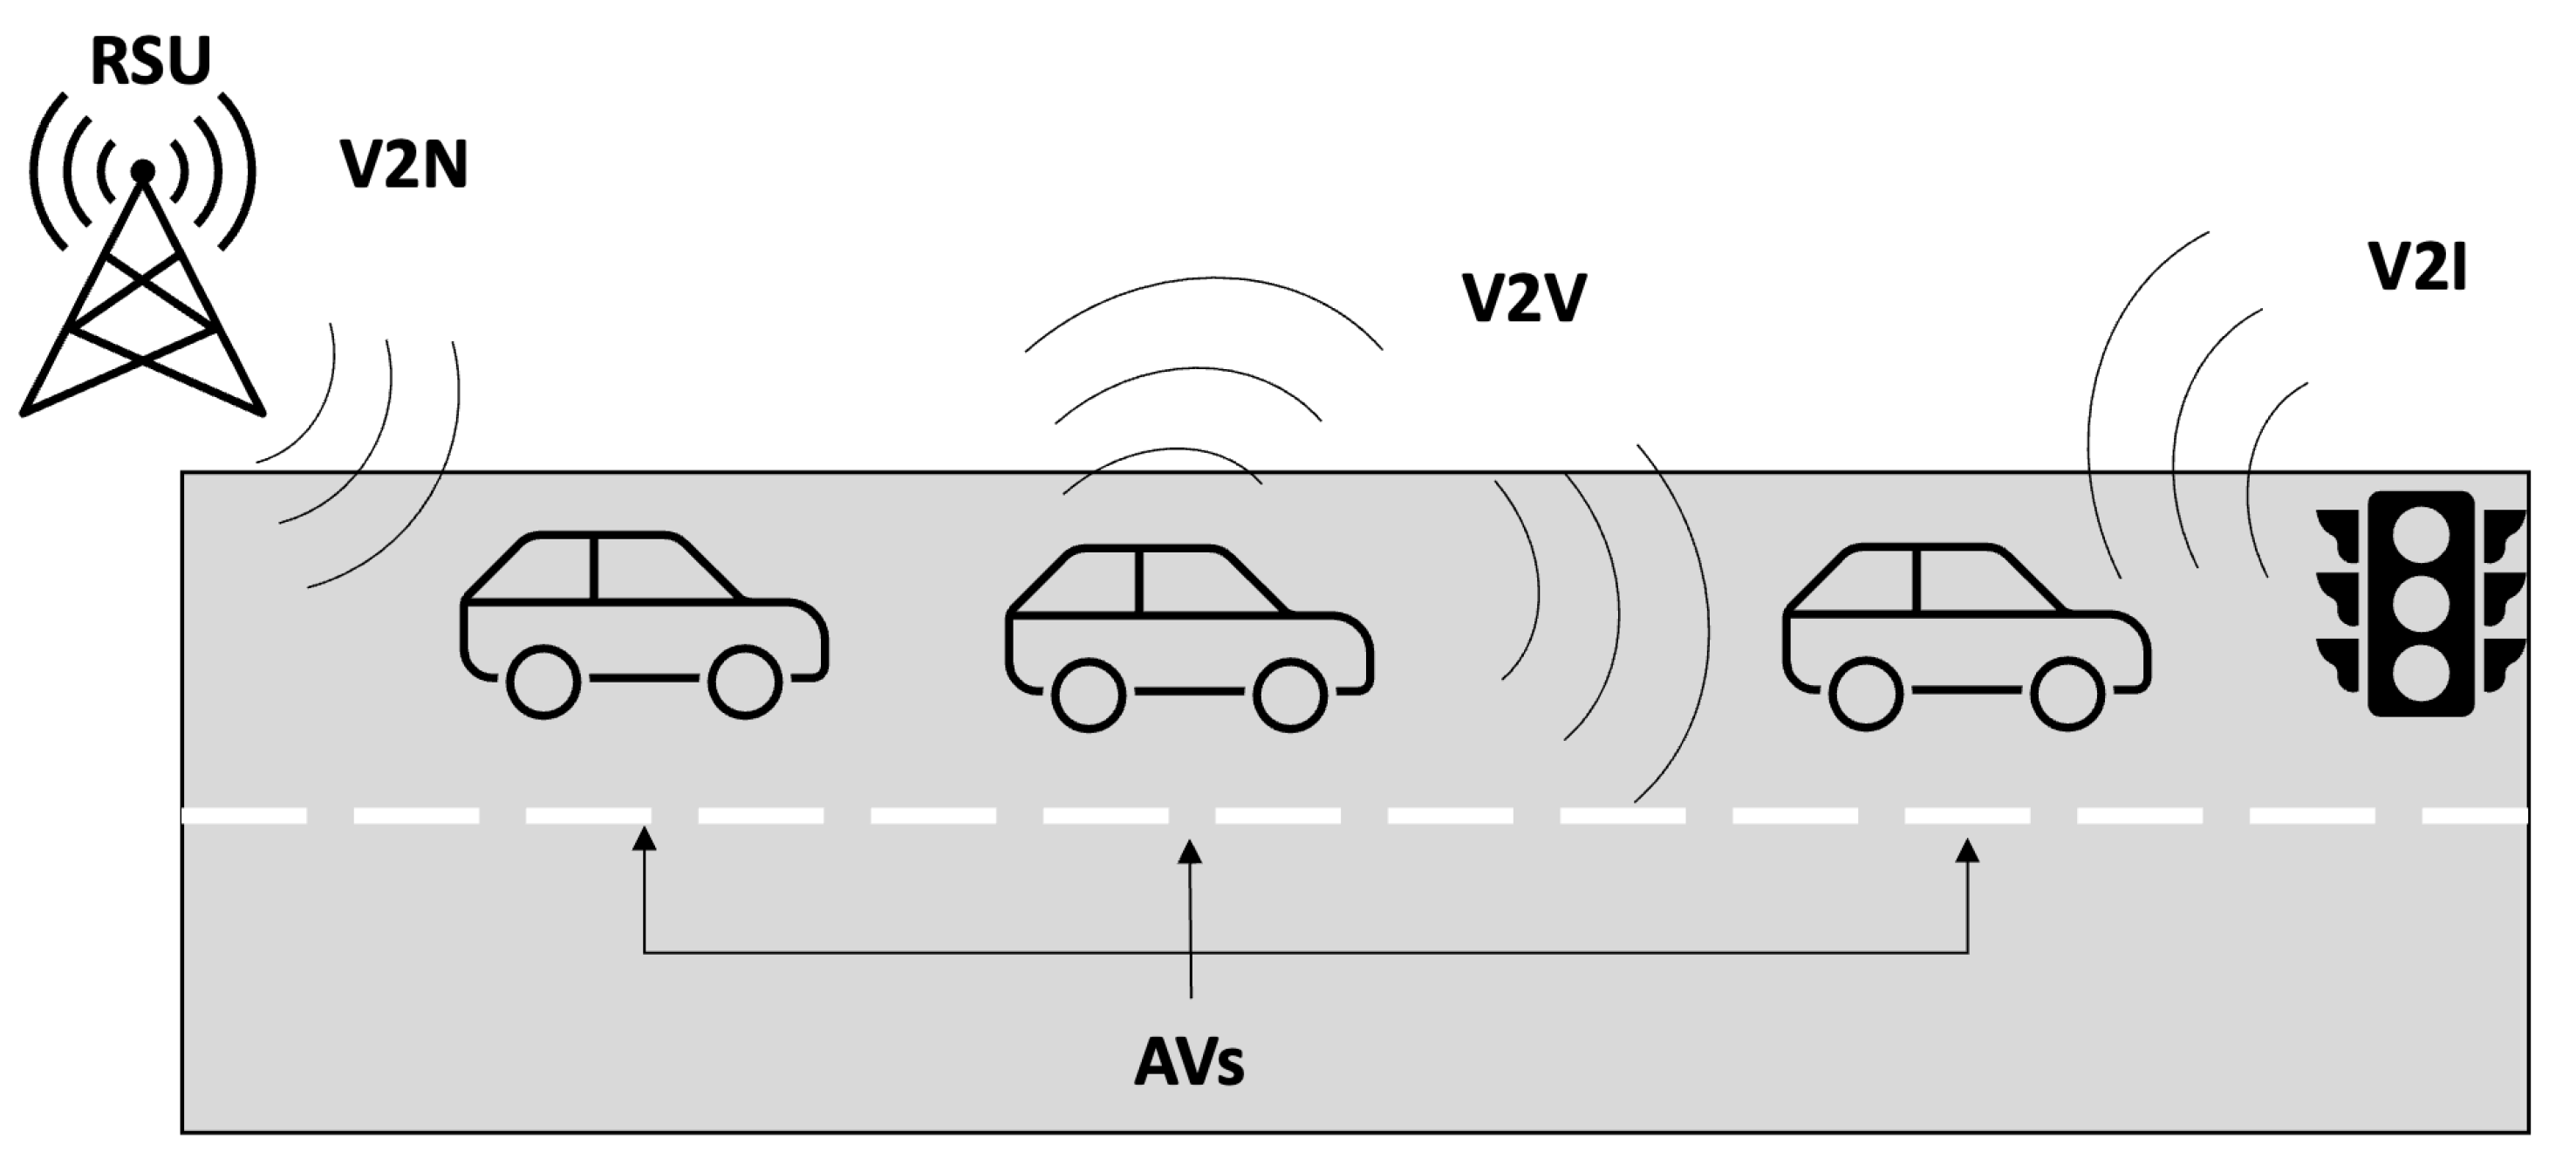
Figure 4 illustrates the conceptual architecture of AV communication, highlighting how AVs interact through V2V, receive signal information via V2I, and maintain connectivity with a remote control unit or RSU via V2N. This architecture represents the baseline for emulating real-world connectivity in traffic systems.
In our SUMO-based implementation, this architecture is approximated using the Traffic Control Interface (TraCI) Python 3.8 (Python Software Foundation, Wilmington, DE, USA). API. As shown in
Figure 5, V2V behavior is emulated via synchronized control of surrounding vehicles using vehicle ID and neighbor information. V2I communication is achieved through traffic light access using
traci.trafficlight.getRedYellowGreenState(), allowing AVs to adapt speed proactively. V2N is simulated through centralized logic via external Python scripts, mimicking an RSU dispatching instructions to vehicles using TraCI.
- 1.
Behavioral Approximation (SUMO Parameters):
Car-following (Krauss): tau, minGap, accel, decel, sigma
Lane-changing (LC2013): lcStrategic, lcCooperative, lcSpeedGain
- 2.
Dynamic AV Coordination (Python + TraCI):
Access AV positions, speeds, and neighbors
Control vehicle behavior dynamically (e.g., speed synchronization, rerouting)
- 3.
Python Snippet for Cooperative AV Control:
import traci
traci.start([‘‘sumo’’, ‘‘-c’’, ‘‘your_sumo_config.sumocfg’’])
for step in range(1000):
traci.simulationStep()
av_ids = [v for v in traci.vehicle.getIDList() if ‘‘AV’’ in v]
for av in av_ids:
neighbors = traci.vehicle.getNeighbors(av)
for neighbor_id, _ in neighbors:
traci.vehicle.setSpeed(neighbor_id,
traci.vehicle.getSpeed(av))
traci.close()
- 4.
Future Frameworks (Full Communication Stack):
In conclusion, this hybrid communication modeling approach (
Table 5) provides an effective and computationally feasible alternative for approximating AV behavior in connected environments. It supports real-time response simulation and lays the foundation for integrating full-stack communication tools in future urban mobility frameworks.
5. Experiment and Results
5.1. Simulation Workflow Overview
Figure 6 outlines the pipeline used in this study, beginning with traffic data acquisition and continuing through SUMO simulation and environmental evaluation. This pipeline is applied to analyze Prince Mohammed bin Salman Road in Riyadh.
5.2. Experimental Design and Scenarios
Microscopic traffic simulations were conducted using SUMO to examine the influence of autonomous vehicles (AVs) on urban traffic composed primarily of human-driven vehicles (HVs). Four scenarios were modeled to reflect different AV penetration rates:
- 1.
Scenario 1 (Baseline): 100% HVs
- 2.
Scenario 2: 10% AVs
- 3.
Scenario 3: 30% AVs
- 4.
Scenario 4: 50% AVs.
Traffic volumes were derived from the Saudi Open Data and TomTom platforms, reflecting weekday peak (7–9 a.m., 4–6 p.m.) and off-peak patterns.
5.3. Vehicle Type Distribution and Traffic Volume Profile
Figure 7 illustrates the distribution of vehicle types motivating the emission analysis, which predominantly consist of internal combustion engine vehicles.
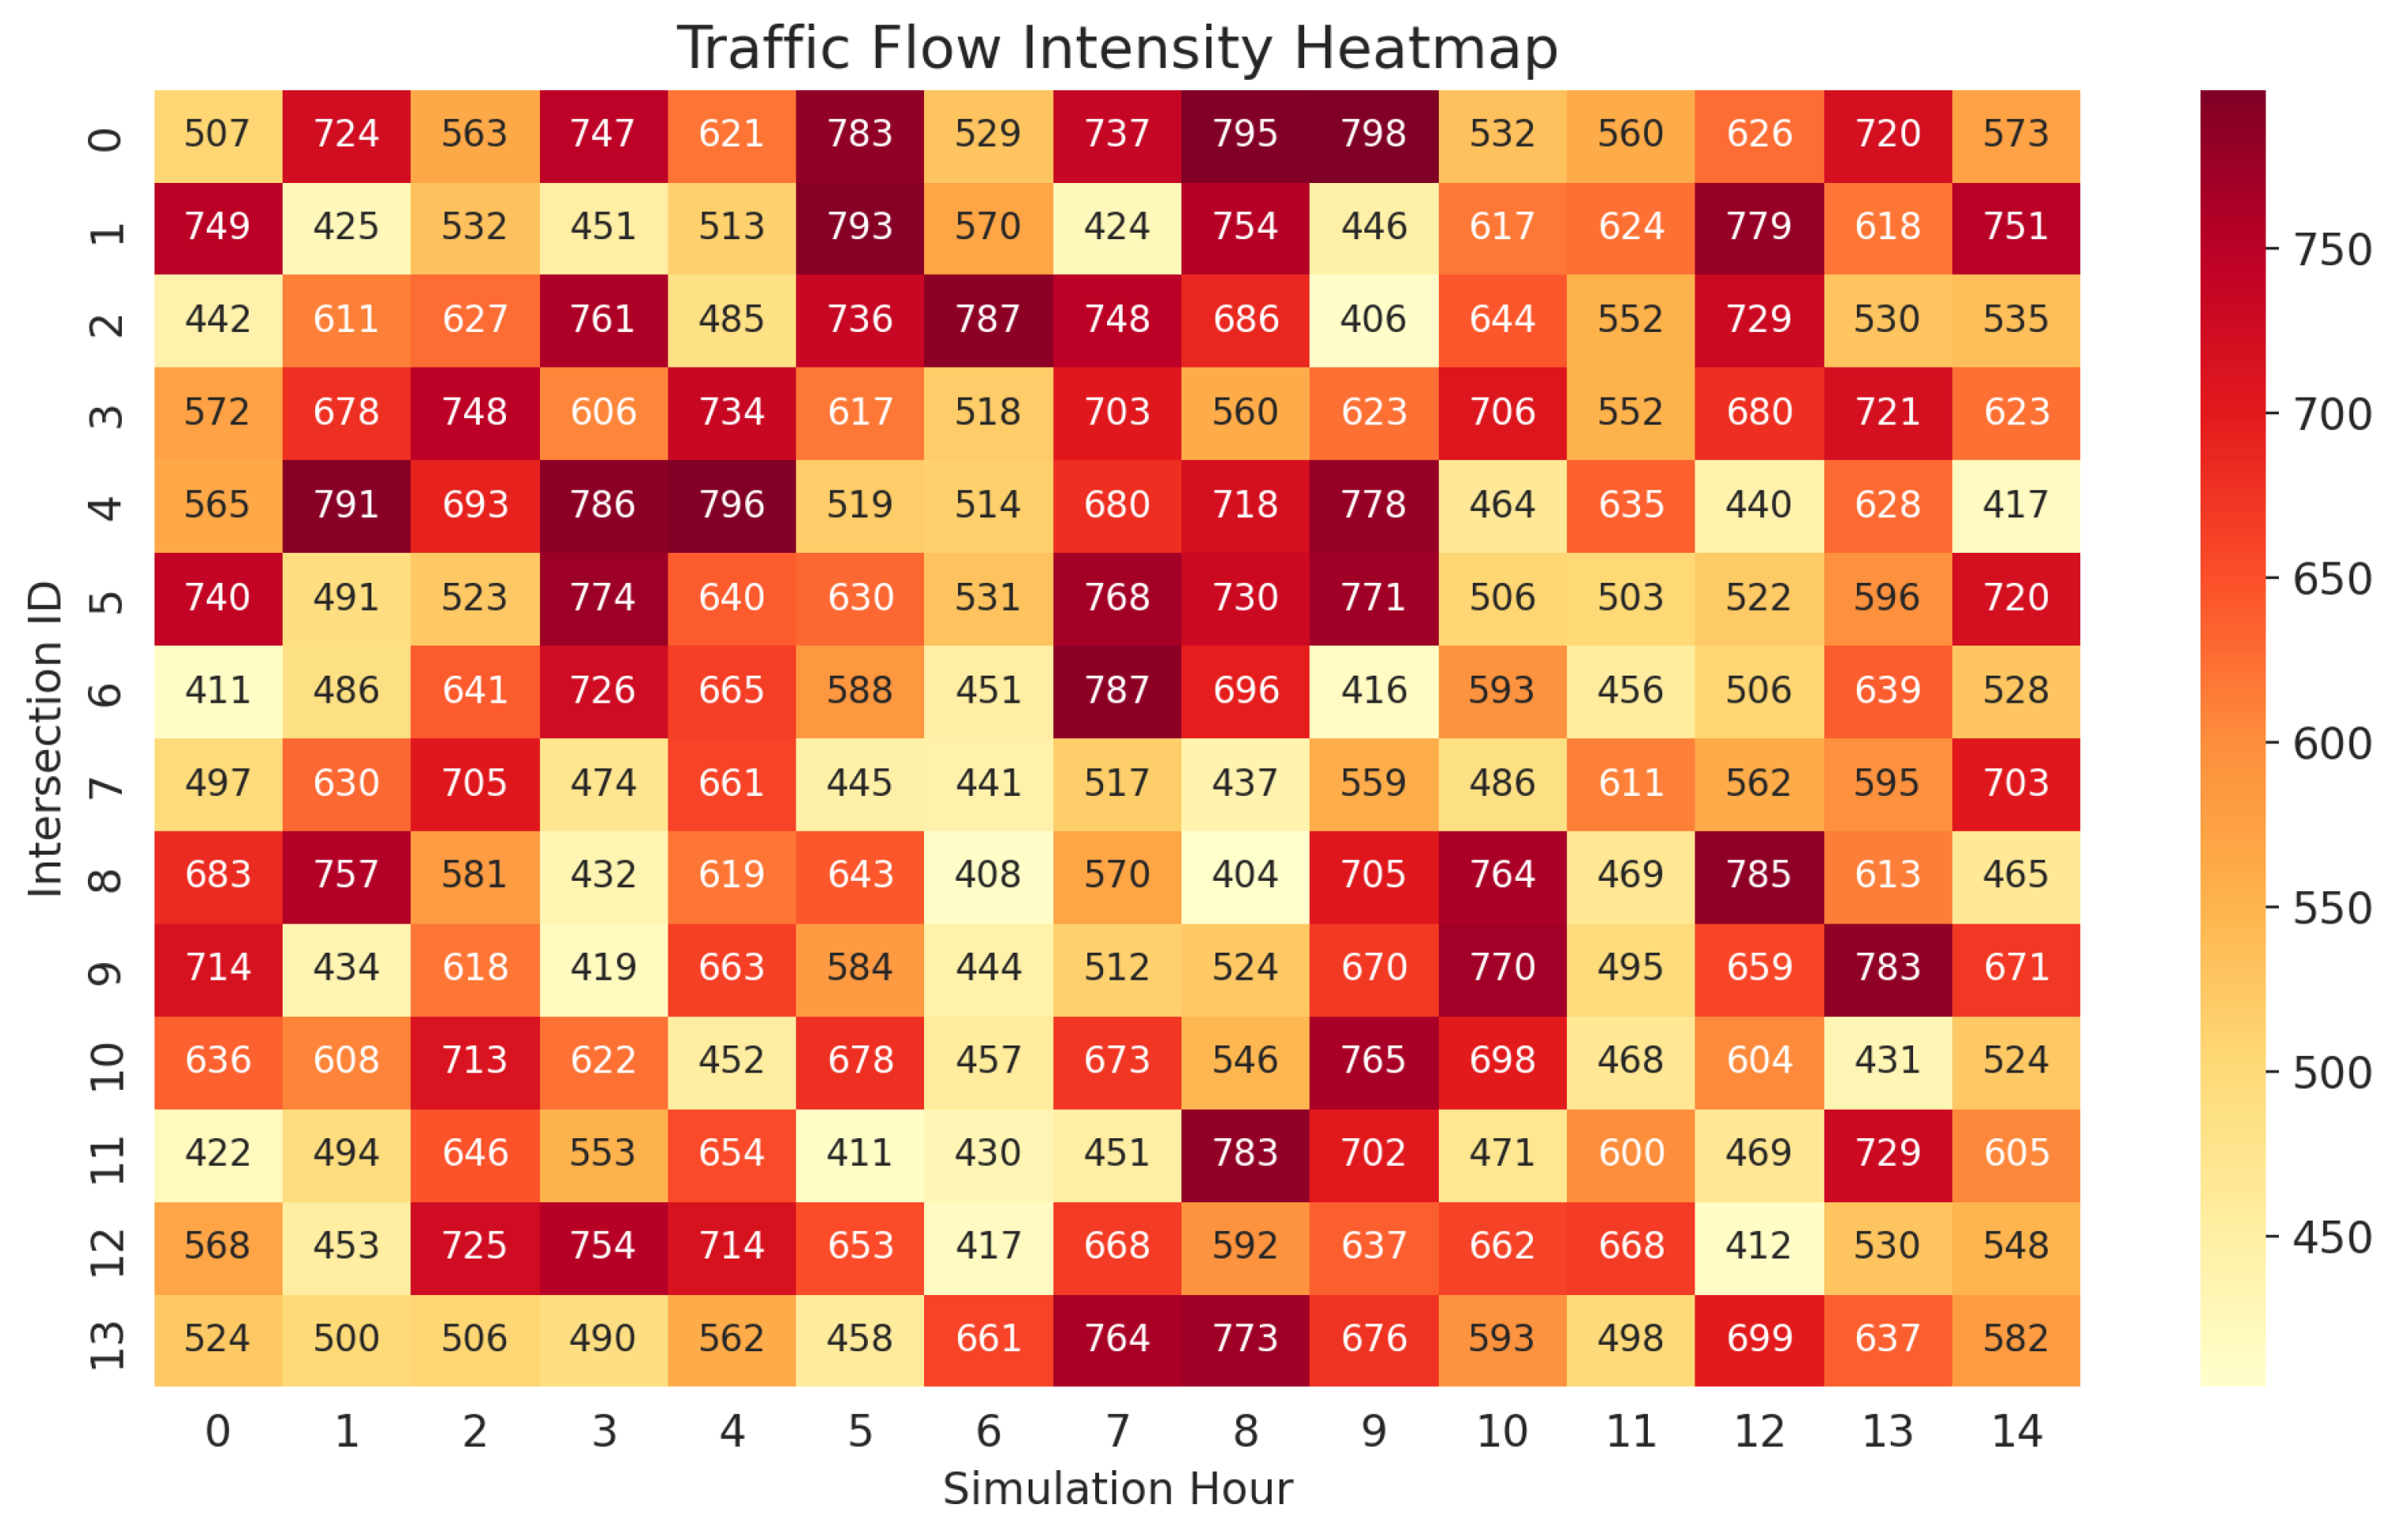
Figure 8 provides the temporal–spatial flow intensity across intersections, showing congestion peaks where AV coordination is most impactful.
5.4. Evaluation Metrics
We evaluated each scenario using the following metrics:
5.5. Simulation Results and Analysis
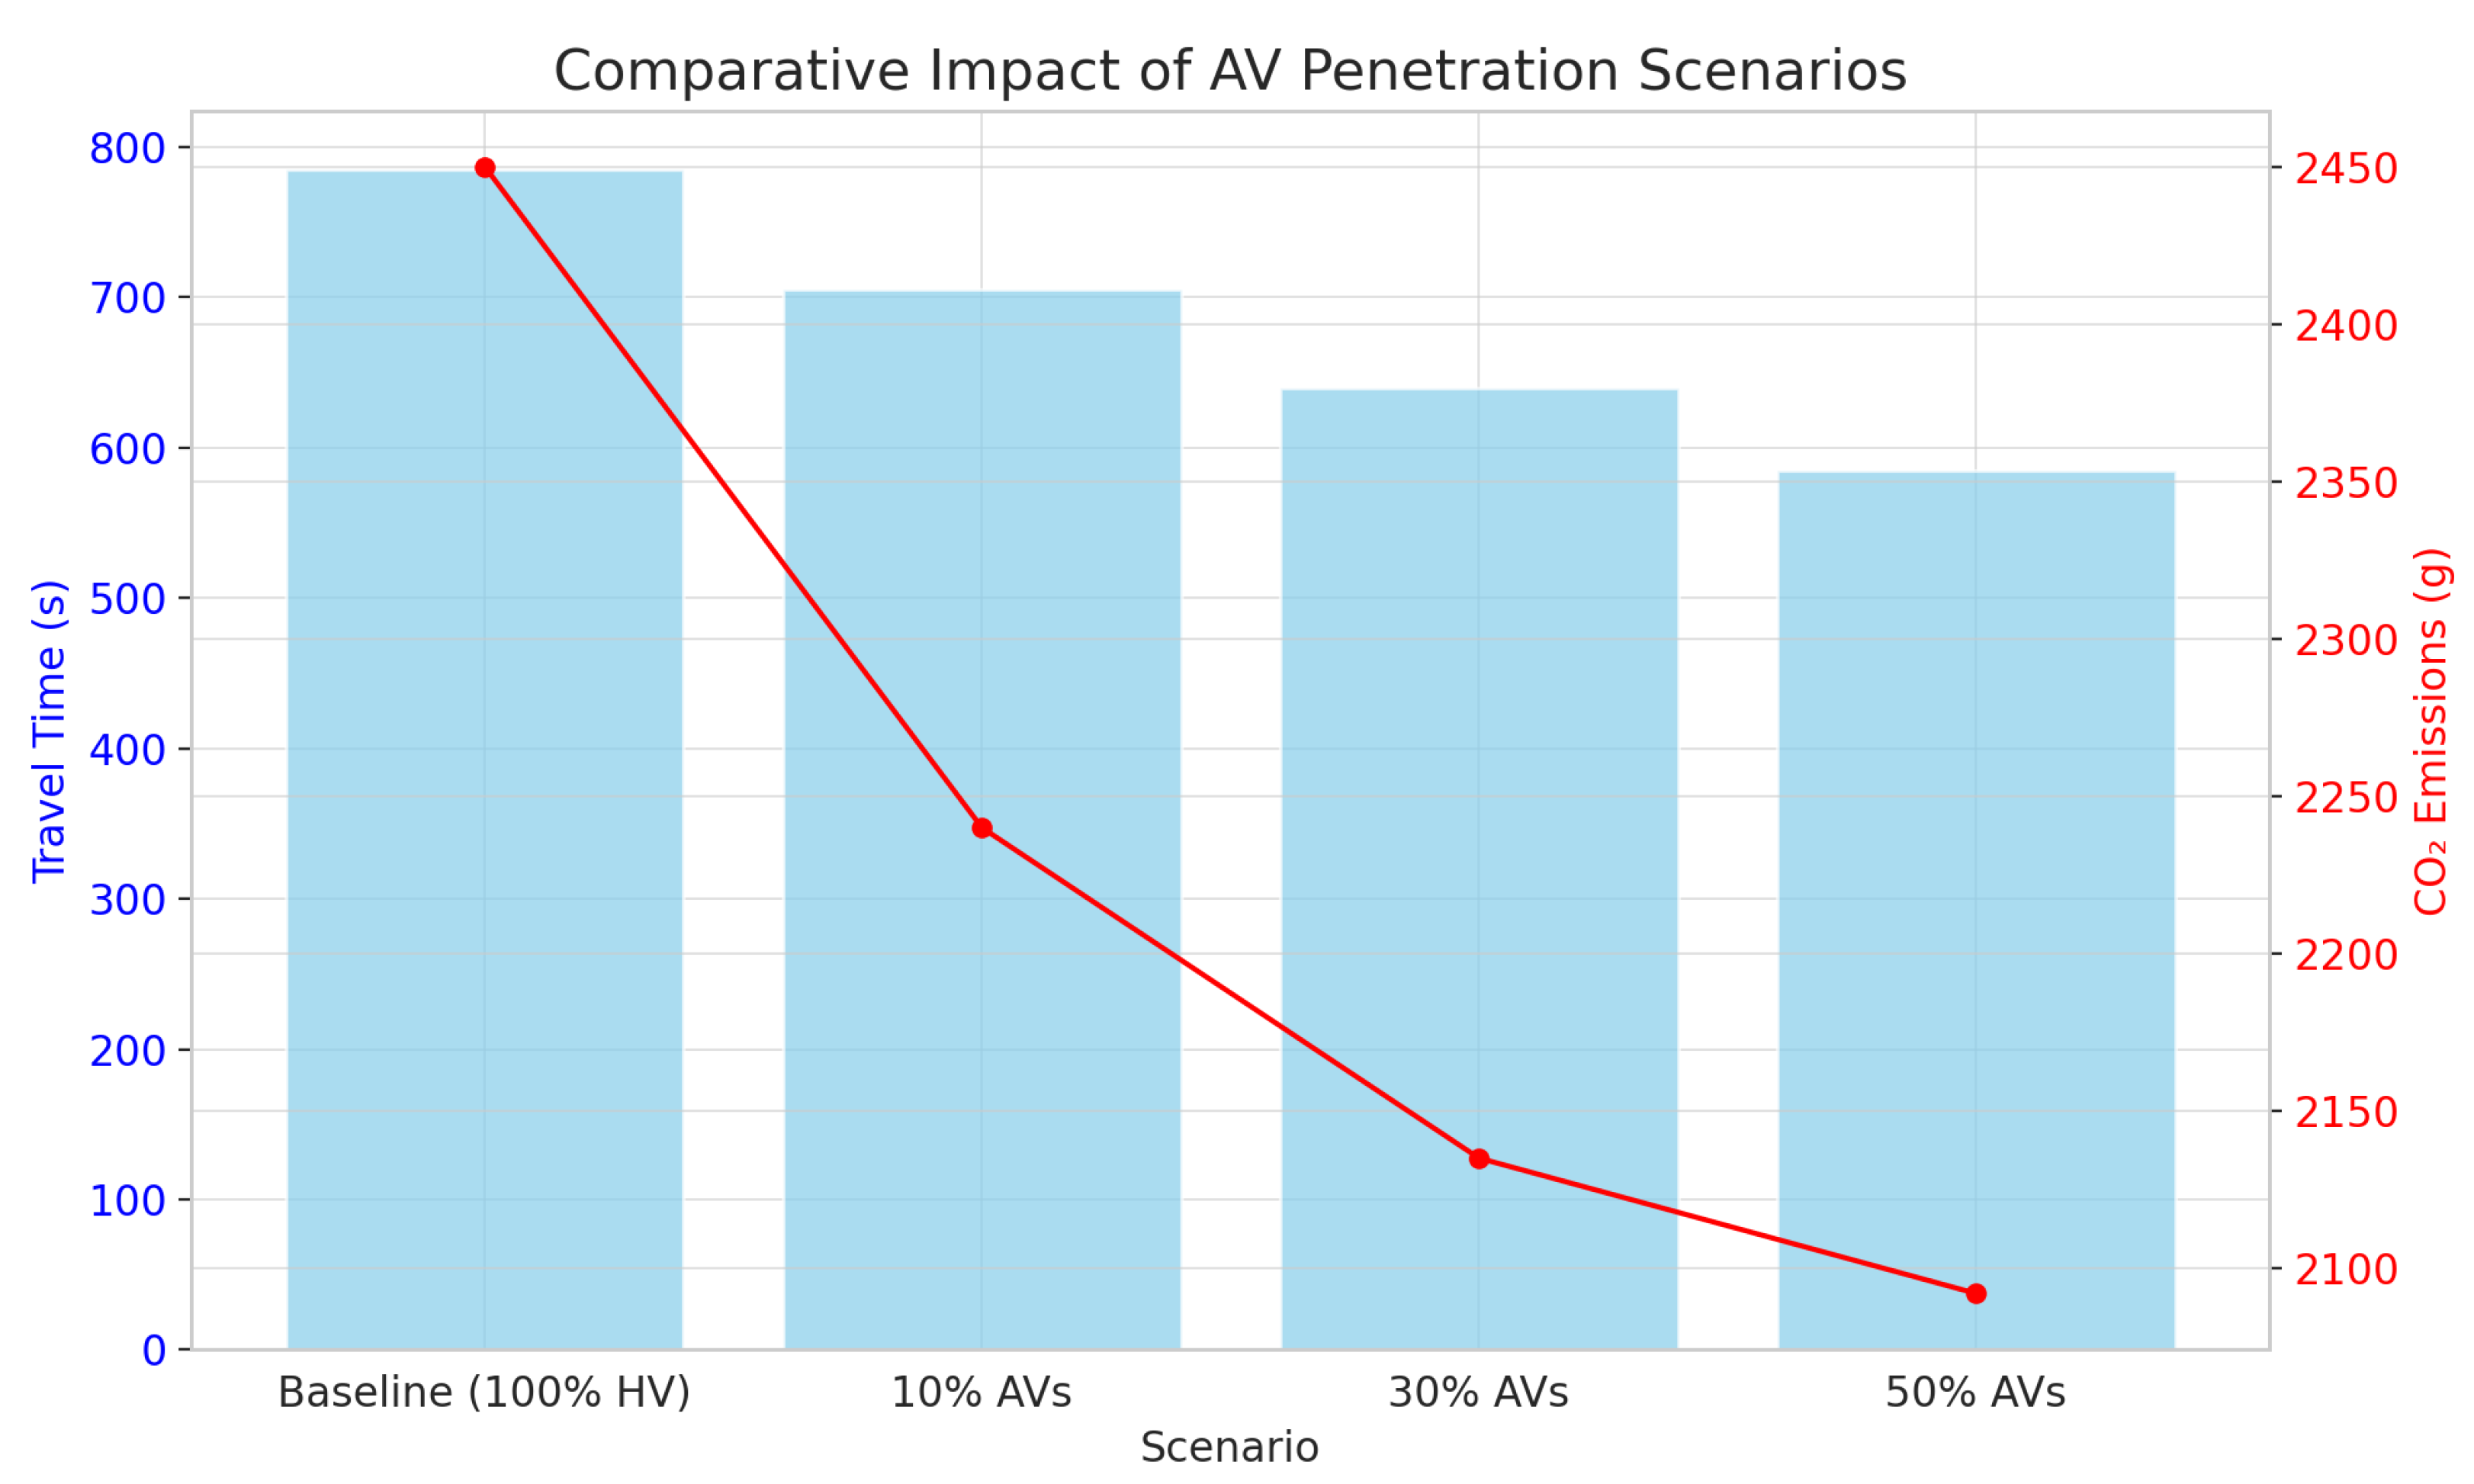
Table 6 and
Figure 9 demonstrate that increasing AV penetration reduces travel time, emissions, and stop frequency while increasing average speed. The 50% AV scenario achieves 25.5% faster trips and 14.6% lower CO
2 emissions than the baseline.
5.6. Stop Frequency and CO2 Trends over Time
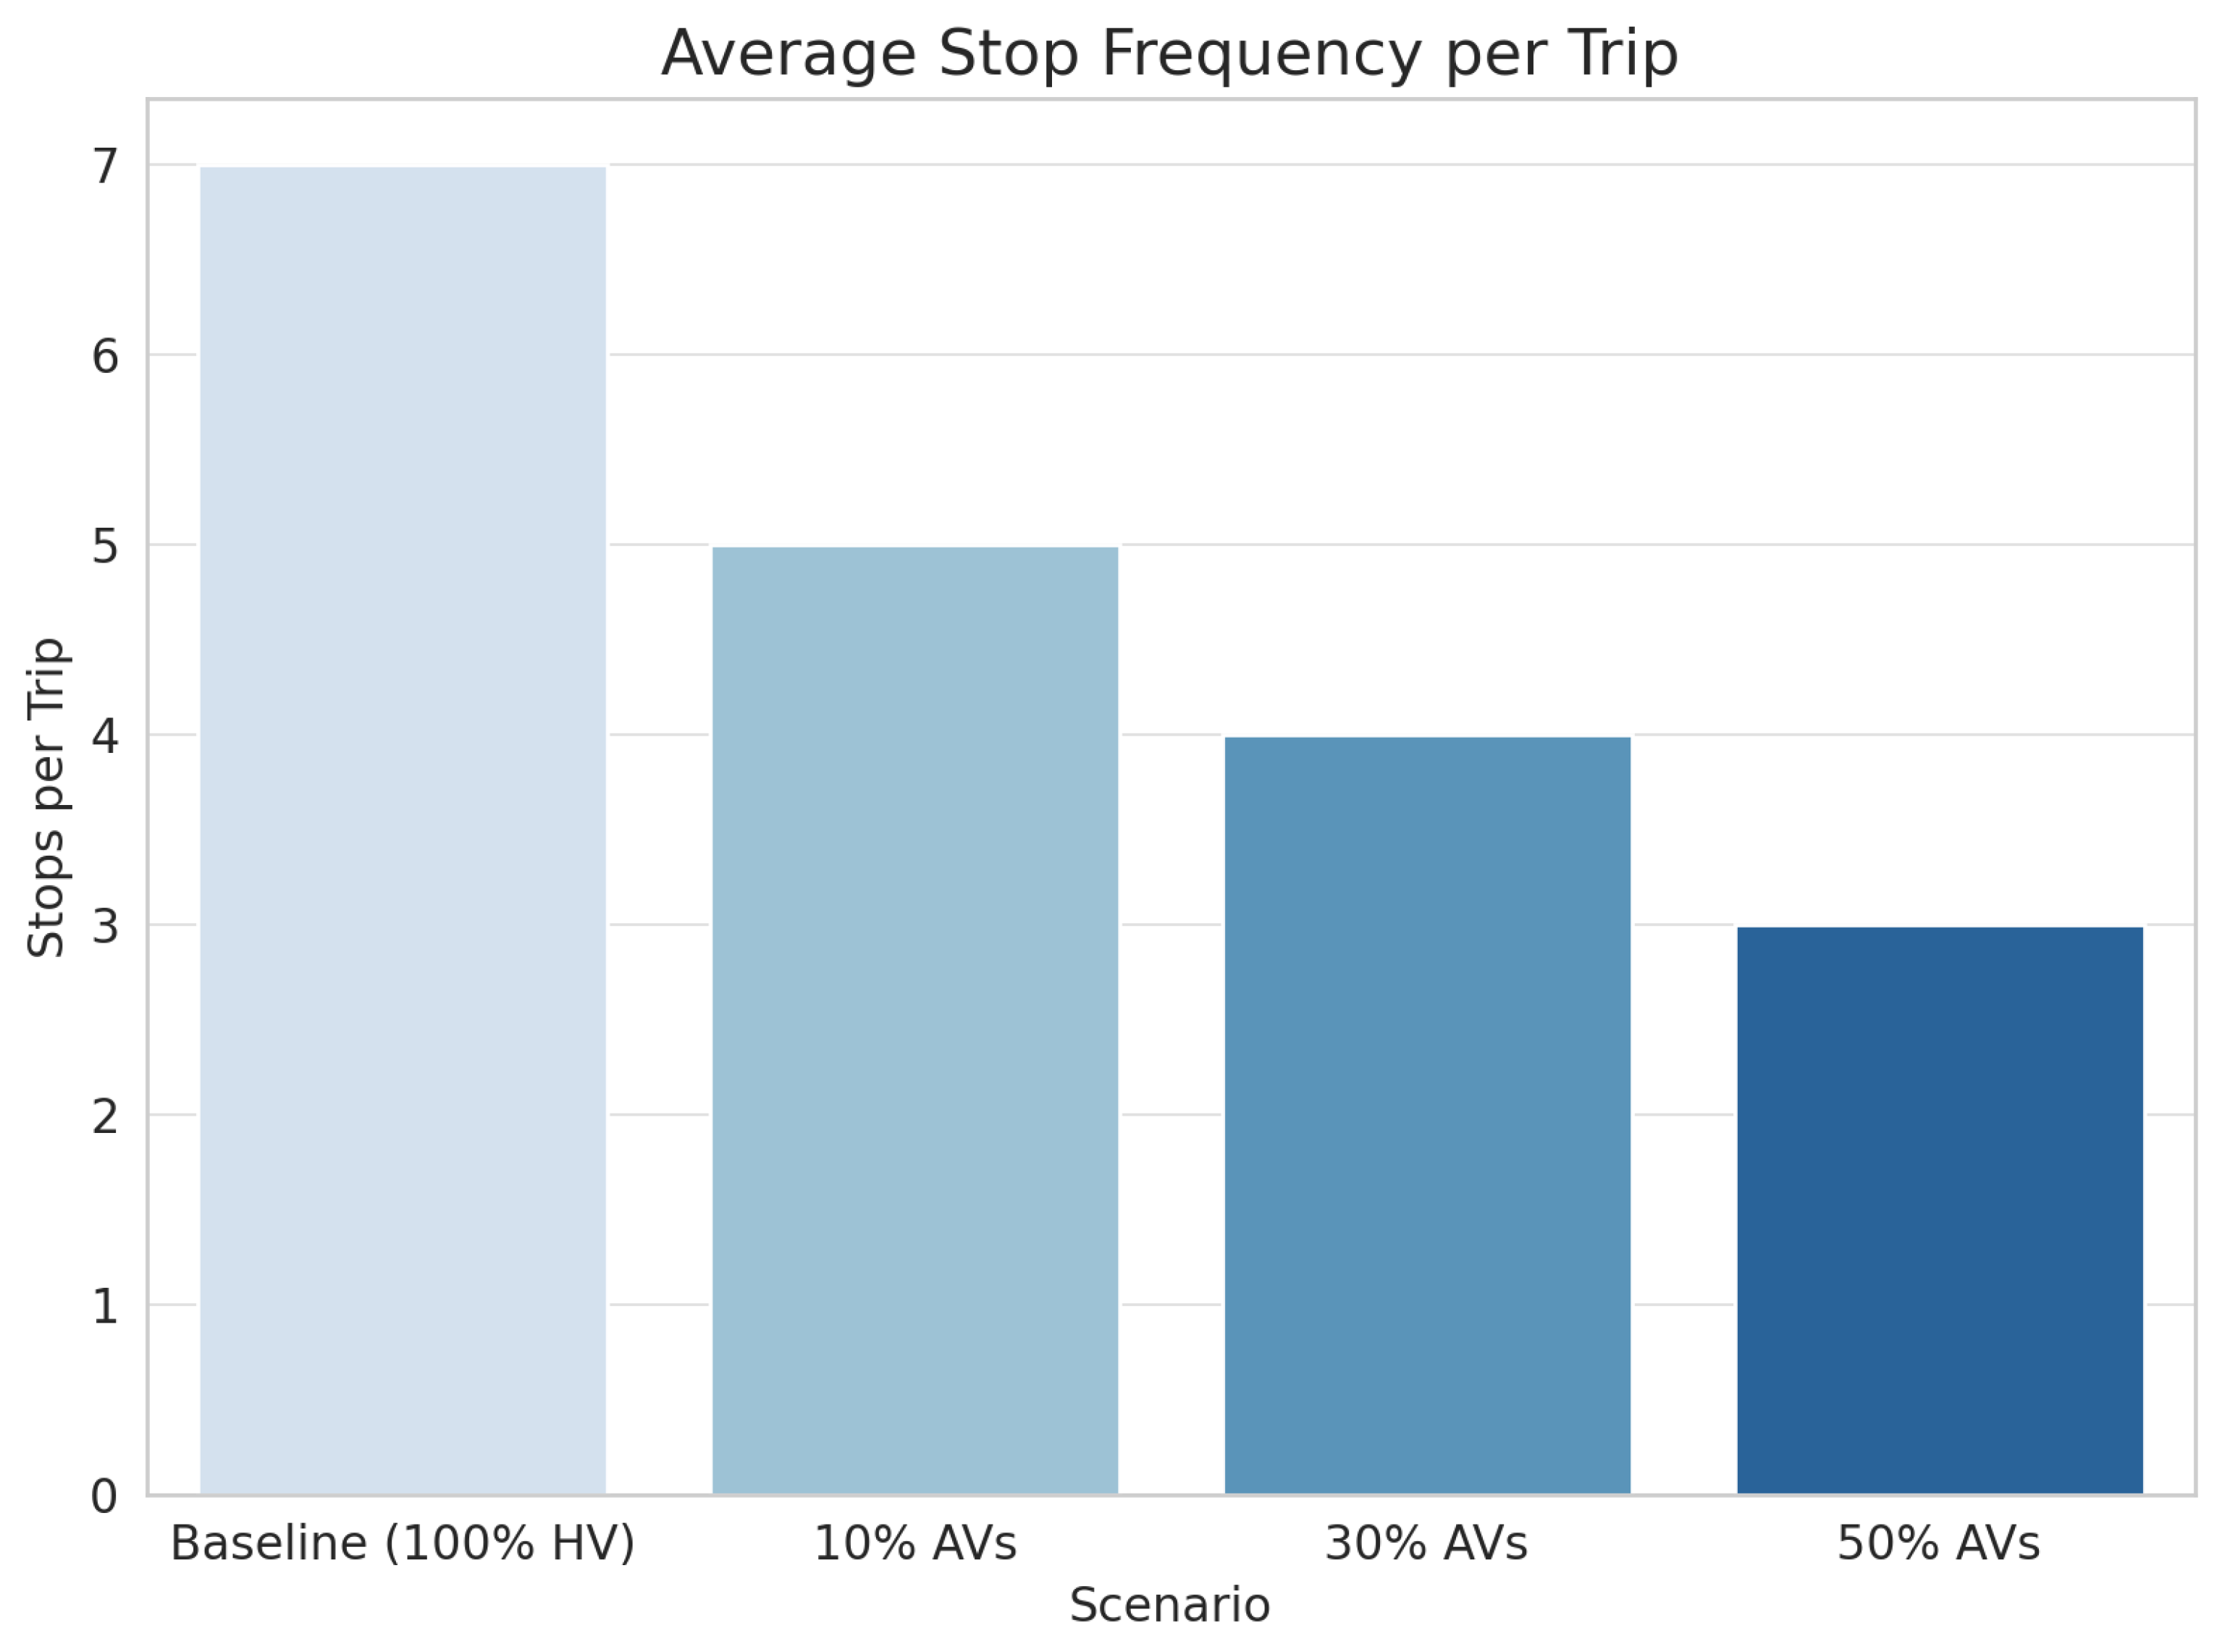
Figure 10 highlights the reduction in stop frequency from seven stops (100% HV) to three (50% AV).
Figure 11 shows cumulative emissions over the simulation period, confirming that higher AV penetration yields slower accumulation of emissions. The figure details hourly accumulation of emissions; notably, peak hours (7–9 a.m. and 4–6 p.m.) show the strongest benefit of AV smoothing effects, with the 50% AV scenario emitting 15.5% less CO
2 than baseline.
5.7. Statistical Validation
To assess the statistical significance of the observed improvements in traffic performance and emission metrics across the different AV penetration scenarios, we employed paired
t-tests comparing each scenario to the baseline (100% HV). This method is appropriate for evaluating whether the mean differences in paired observations (e.g., trip time, stop frequency, emissions per vehicle) are significantly different from zero. The tests were conducted on trip-level outputs sampled across the 15-hour simulation duration, ensuring temporal representativeness during both peak and off-peak periods. Each metric—average travel time, stop frequency, average speed, and CO
2 emissions—showed statistically significant differences at the 95% confidence level (
) for all AV scenarios when compared to the baseline. This indicates that the observed improvements are not due to random simulation variation but rather to structural behavioral differences introduced by AV integration, namely, reduced reaction times, smoother acceleration/deceleration profiles, and better coordination. These findings reinforce the reliability of the simulation results and the validity of the proposed HARMONY-AV framework as a tool for sustainable mobility planning in mixed traffic environments. To enhance transparency,
Table 7 provides the specific
p-values for each scenario and performance metric comparison.
6. Discussion
This study demonstrates the significant potential of autonomous vehicles (AVs) to enhance urban mobility and environmental sustainability within mixed traffic systems. Our simulation results reveal that even moderate integration of AVs (as low as 10%) can lead to measurable improvements in traffic efficiency and substantial reductions in carbon emissions. As AV penetration increases from 0% (baseline) to 50%, average travel times decrease by approximately 25.5%, stop frequencies decline by 57.1%, and average vehicle speeds improve by 27.8%. These improvements reflect smoother and more coordinated traffic flow facilitated by AV-specific adjustments to car-following and lane-changing behaviors.
The results of this study also align with and reinforce findings from prior simulation and modeling efforts in the AV domain. For example, the observed reduction in average travel time (up to 25.5%) and CO
2 emissions (up to 14.6%) at 50% AV penetration is consistent with the efficiency gains reported by Yang et al. [
1], who highlighted improved traffic flow and safety benefits of CAVs at on-ramps. Similarly, the emission improvements observed in our simulation support the environmental impact estimates of mixed traffic flows studied by Ge et al. [
3], who emphasized the importance of CAV ratios in achieving sustainability goals. Additionally, our results mirror trends reported by Yigit and Karabatak [
4], who used deep reinforcement learning to optimize vehicle speed and reduce fuel consumption in smart city environments. By validating these findings through localized, data-driven simulations for Riyadh, our work adds practical context to the global discourse on AV integration and supports region-specific mobility policy development.
Our study’s methodology leverages the Simulation of Urban Mobility (SUMO) platform, supported by extensive real-world datasets from TomTom and Saudi open data repositories. The statistical significance of these outcomes is validated through paired t-tests, reinforcing the robustness and reliability of the findings. Nevertheless, limitations remain. SUMO’s inherent inability to explicitly simulate wireless communication protocols means that the study relies on behavioral approximations; while these approximations effectively replicate key aspects of coordinated AV behavior, incorporating a full-stack V2X simulation (e.g., OMNeT++ or Eclipse MOSAIC) in future studies could provide deeper insights into the dynamics of real-time AV communication, including potential issues such as network latency and packet loss.
Furthermore, this study considered the potential scalability and practical deployment of the HARMONY-AV framework. Given the strategic importance of Prince Mohammed bin Salman Road in Riyadh, these findings provide actionable insights for urban planners and policymakers aiming to integrate AV technology into existing infrastructures. The realistic scenarios we tested can suggest a roadmap for gradual AV integration, emphasizing progressive benefits for mobility and emissions reduction.
In addition to its local relevance, the outcomes of this study offer valuable insights for other rapidly developing Gulf cities such as Dubai and Doha, which share similar urban growth patterns, car-centric infrastructure, and ambitions for smart mobility transformation. The observed improvements in traffic flow and emission reductions through coordinated AV–HV integration are highly likely to be generalizable in these contexts. While specific traffic conditions may vary, the behavioral advantages of AV coordination such as reduced stops, smoother lane transitions, and lower emissions are broadly applicable. Furthermore, our study carries key policy implications that emphasize the importance of infrastructure preparedness, such as enabling V2X-compatible intersections and deploying roadside units (RSUs); policymakers may also consider incentive-based strategies, including subsidies for AV-enabled fleets and phased implementation along strategic corridors. Overall, the HARMONY-AV framework provides a flexible simulation approach to support data-driven mobility planning across the region. While direct field observation data for the selected corridor in Riyadh were not available at the necessary resolution, we grounded our simulation using official traffic counts from Saudi open data sources and congestion metrics from the TomTom traffic index. The resulting outputs, including average travel times and speed profiles, aligned closely with published regional norms. Although formal calibration against real-time field measurements was not feasible, the combination of validated datasets with statistical testing lends credibility to the findings and supports their relevance for practical urban mobility planning. It is also important to consider the real-world feasibility and cost implications of achieving high AV penetration rates, particularly the 50% scenario used in this study. While our simulations illustrate the potential benefits of such integration, actual deployment would require substantial investment in AV hardware (e.g., LiDAR, radar, onboard processing units) as well as supporting infrastructure such as roadside units (RSUs), V2X-enabled traffic signals, and robust wireless communication networks (e.g., 5G or edge computing). The costs associated with sensorized fleets and continuous network maintenance may pose financial and logistical challenges, particularly in regions where existing infrastructure is not yet digitally mature. Therefore, our 50% AV scenario should be viewed as a long-term planning benchmark rather than an immediate implementation goal.
In practice, incremental adoption such as phased deployment along strategic corridors may offer a more feasible pathway to realizing the benefits of AV–human vehicle harmonization over time. In addition to simulation, the HARMONY-AV framework presents an opportunity for real-world application in Riyadh’s evolving smart mobility ecosystem. Saudi Arabia’s Vision 2030 and related initiatives led by entities such as the Royal Commission for Riyadh City and the Saudi Data and AI Authority (SDAIA) are already fostering advancements in digital infrastructure and data-driven urban management. The framework developed in this study aligns well with these goals, and could serve as a decision-support tool for evaluating AV integration strategies. Collaborations with local traffic authorities would be instrumental in refining the framework, helping to enable access to granular traffic data, pilot deployment zones, and validation platforms. Establishing such partnerships would also facilitate the gradual implementation of V2X infrastructure and policy development necessary for the safe and effective deployment of harmonized AV–HV traffic systems in Riyadh. It is worth noting that the selected corridor primarily includes signalized intersections and roundabouts, consistent with its role as a major arterial route within Riyadh; as such, our simulations did not incorporate uncontrolled intersections, which are more commonly found in suburban or residential areas. While this design choice reflects the operational realities of high-volume urban roads, it may limit the applicability of the results to less-regulated settings where vehicle behavior, right-of-way ambiguity, and AV decision-making challenges can be more complex. Future research could extend the HARMONY-AV framework to include networks with uncontrolled intersections in order to explore AV interaction strategies under less structured traffic control conditions.
While this study focused on the technical modeling of traffic dynamics and emissions under varying AV penetration levels, it is important to acknowledge that public perception and user acceptance are critical factors in the broader deployment of autonomous vehicle systems. Behavioral trust, perceived safety, and willingness to share the road with AVs can significantly influence real-world coordination between autonomous and human-driven vehicles. Although such socio-technical considerations were beyond the scope of this simulation-based research, future extensions of the HARMONY-AV framework could benefit from incorporating findings from recent studies on public attitudes and human factors in AV adoption [
22,
23,
24]. Integrating these dimensions would enable more holistic planning approaches that combine infrastructure readiness with social readiness in the context of smart urban mobility.
7. Conclusions
This research examined the impacts of integrating autonomous vehicles within human-driven traffic in Riyadh, Saudi Arabia by using detailed microscopic simulations. The results clearly indicate substantial benefits for urban mobility efficiency and environmental sustainability even at relatively modest levels of AV integration. With 50% AV deployment, carbon emissions dropped by nearly 15% and travel times were reduced by over 25% compared to baseline human-only scenarios. The study also provides a practical simulation approach for modeling AV communication and coordinated behaviors, highlighting the strengths and limitations of current microscopic traffic simulation tools. Future research directions include employing integrated traffic-communication simulation platforms to model network-level interactions and assess the impacts of real-world communication constraints. Overall, this study confirms the considerable promise of harmonized AV–HV traffic systems in achieving smart, sustainable urban mobility. It serves as a foundation for further research and practical application in Saudi Arabia and similarly structured urban environments globally. Despite these encouraging findings, several limitations should be acknowledged. This study was based on a simulation framework, and did not incorporate real-time wireless communication effects such as latency, signal interference, or packet loss. The simulated traffic network primarily included signalized intersections, which limits the generalizability of this study to uncontrolled or irregular road settings. Additionally, behavioral aspects such as public trust, compliance, and perception of AVs that were not modeled in this study may significantly affect AV–human interaction in practice. Finally, vehicle distributions and travel patterns were based on the most recent available datasets, which may not capture future variations or localized anomalies. Addressing these limitations in future work will help to improve the real-world applicability and policy relevance of the HARMONY-AV framework.


