1. Introduction
Efficient drinking water management is crucial for large cities like Mexico City, where population growth and environmental challenges have historically strained water resources. This article explores the use of Cyber-Physical Systems (CPS) to optimize the monitoring and control of water supply networks, with a focus on the Lerma Basin System, a critical component of Mexico’s National Hydraulic System. The transition from manual systems to advanced digital environments is analyzed, highlighting the benefits of integrating modern technologies such as SCADA (Supervisory Control and Data Acquisition) systems, 3D visualization, and real-time data analytics.
The Lerma River, a vital water source in central Mexico, flows through the states of Mexico, Querétaro, Guanajuato, Michoacán, and Jalisco. Although no exact figure exists on the number of people directly dependent on its water, around the Lerma-Chapala-Santiago basin live over 9 million inhabitants. However, because of severe pollution a significant portion of the river’s water is unsuitable for human consumption. To address this, the region also relies on a network of underground aquifers, from which water is extracted through wells. These aquifers play a crucial role complementing the river’s supply, providing water for domestic, agricultural, and industrial purposes.
The Lerma System, the first stage of the National Hydraulic System, was developed to address water shortages in the Valley of Mexico. Its origins date back to the early 20th century, following the Mexican Revolution. By 1951, the construction of the Atarasquillo–Dos Ríos Tunnel marked a significant engineering achievement, enabling the transport of water from the Lerma River to Mexico City. This system, which included canals, pipelines, tunnels, and storage tanks, culminated at the Cárcamo de Dolores, a storage facility in Chapultepec Forest adorned with murals by Diego Rivera. In the 1960s, a severe drought and rapid population growth led to the drilling of 230 wells in the Toluca Valley, completing the first stage of the Lerma System by 1975.
Today, the Lerma Basin System continues to play a vital role in supplying water to Mexico City. However, advanced monitoring and control systems are required to manage the increasing complexity of the infrastructure, combined with the challenges of water scarcity and pollution [
1]. This paper presents a cyber-physical system with 3D visualization for the Lerma Basin, enabling real-time monitoring of over 160 operational wells and nearly 200 additional wells under construction. The system integrates Geographic Information System (GIS) data, hybrid communication networks, and real-time teleoperation of water pumps, providing operators with a comprehensive view of the network’s current and future states. By leveraging advanced technologies, the system not only improves operational efficiency but also offers a scalable solution for managing water resources in the face of growing demands and environmental challenges.
This paper is organized as follows:
Section 2 briefly presents SCADA systems and their application to water supply management;
Section 3 presents the applied methodology for the design and implementation of the SCADA system for the Lerma Basin, whilst
Section 4 explains its architecture.
Section 5 presents the results of the implementation, and
Section 6 corresponds to the final discussion, which includes conclusions and future work.
2. Supervisory Control and Data Acquisition Systems
SCADA systems have been very important in industrial automation and infrastructure management for decades. Initially developed for monitoring and controlling industrial processes, they have evolved significantly due to advancements in computing, communication technologies, to deal with the increasing complexity of critical infrastructure [
2,
3]. This section reviews the evolution of SCADA systems, their applications in water resource management, and the emerging trend of integrating 3D and VR technologies for enhancing operational efficiency and a more intuitive user interaction.
2.1. Industrial Revolutions
The development of the different generations of SCADA systems is strongly related to the evolution of the industry. The advancement of technology has been the motor for this evolution, with the introduction of new production methods intended to reduce human efforts while increasing and improving production. The term industrial revolution is applied to describe stages separated by total changes in production techniques and technology. In this sense, five industrial revolutions can be clearly identified [
4], the first one (Industry 1.0) began in 1760 with the development of steam machines. The main characteristics of Industry 2.0 are the implementation of assembly lines and the use of electricity, starting in the late 19th and early 20th centuries. Industry 3.0 originated in the 70s with IT and electronics, focused on automation in production. At the end of the 20th century, advances in artificial intelligence (AI) and Internet-of-Things (IoT), among other developments, started Industry 4.0 [
5], which is evolving into Industry 5.0 on the basis of sustainability, resilience, and a human-centered approach.
2.2. Cyber-Physical Systems
The term was coined by the U.S. National Science Foundation in 2006, to describe systems that integrate cyber elements of embedded computing technologies into the physical world [
6]. CPS have an architecture strongly linked to next-generation technologies, in a continuous development that combines hardware and software components. AI has made modern CPS capable to adapt themselves to changing conditions, making autonomous decisions, and optimizing their performance by applying algorithms and real-time data analysis to monitor and control physical processes. With the advent of modern computing and networking technologies, AI and IoT in Industry 4.0 [
5], and sustainable growth in Industry 5.0, SCADA systems have been through a transformative evolution to become CPS, where the integration of humans and machines is the goal.
2.3. Evolution of SCADA
SCADA systems originated in the mid-20th century coinciding with Industry 2.0, developed as simple monitoring tools for industrial processes, relying on rudimentary hardware and limited communication capabilities. Early systems used 2D graphical representations to display data, with icons representing physical components such as pumps, valves, and pipelines. These systems were typically confined to local networks, with limited scalability and real-time capabilities [
2]. The most important aspects in the evolution of SCADA are as follows.
Digitalization: The transition from analog to digital systems enabled more precise data acquisition and control [
3].
Network Expansion: The integration of wired and wireless communication networks (e.g., Ethernet, cellular, and satellite) extended the reach of SCADA systems to remote and geographically dispersed locations [
7].
Internet of Things: The incorporation of IoT has enabled real-time data collection and remote control, enhancing the scalability and flexibility of SCADA systems [
8,
9].
Cloud Computing: Cloud-based SCADA systems have emerged, offering centralized data storage, advanced analytics, and remote access capabilities [
10].
2.4. SCADA in Water Resource Management
Water resource management is a critical application area for SCADA systems, particularly in regions facing water scarcity, aging infrastructure, and increasing demand [
11]. SCADA systems are widely used to monitor and control water supply networks, including the following: Water Treatment Plants; Monitoring chemical dosing, filtration processes, and water quality parameters [
12,
13]. Distribution Networks; Tracking water flow, pressure levels, and leak detection [
14]. Pumping Stations; Controlling pump operation and optimizing energy consumption [
8]. Reservoirs and Storage Tanks; Managing water levels and ensuring adequate supply [
11].
The integration of SCADA systems in water management has demonstrated significant benefits, including improved operational efficiency, reduced response times to failures, and enhanced decision-making through data-driven insights [
13]. However, traditional SCADA systems often rely on 2D graphical interfaces, which can limit the ability of operators to fully understand and interact with complex infrastructure [
15].
2.5. The Need for Advanced Visualization in SCADA
As water supply networks become increasingly complex, there is a growing need for more intuitive and immersive visualization tools. Traditional 2D interfaces, while effective for basic monitoring, often fail to provide a comprehensive understanding of spatial relationships and system dynamics [
15]. This limitation can hinder the ability of operators to identify issues, plan maintenance, and respond to emergencies effectively. The integration of 3D visualization into SCADA systems addresses these challenges by offering the following:
Enhanced Spatial Awareness: 3D models provide a realistic representation of physical infrastructure, enabling operators to visualize the system in its entirety [
16].
Improved Data Interpretation: Complex data, such as pressure gradients and flow patterns, can be more easily understood when represented in a 3D environment [
15].
Immersive Interaction: Operators can navigate and interact with the system in real-time, improving situational awareness and decision-making [
17].
Training and Simulation: 3D visualization can be used to create virtual training environments and simulate scenarios for contingency planning [
18].
2.6. Emerging Trends in SCADA Systems
Recent advancements in technology have paved the way for the next generation of SCADA systems, characterized by the integration of advanced visualization, artificial intelligence (AI), and cyber-physical systems (CPS) [
7]. Key trends include the following:
Virtual Reality (VR) and Augmented Reality (AR): VR and AR technologies are being explored to create immersive interfaces for SCADA systems, enabling operators to interact with virtual representations of physical infrastructure [
15].
Digital Twins: The concept of digital twins, which involves creating a virtual replica of a physical system, is gaining traction in SCADA applications. Digital twins enable real-time monitoring, predictive maintenance, and scenario analysis [
18].
Edge Computing: The use of edge computing capabilities in SCADA systems allows for localized data processing, reducing latency and improving response times [
8].
Cybersecurity Enhancements: As SCADA systems become more interconnected, ensuring robust cybersecurity measures is critical to protect against cyber threats [
19].
2.7. Case Studies and Applications
Several case studies highlight the successful implementation of SCADA systems with advanced visualization in water management:
Smart Water Networks: Cities like Singapore and Barcelona have implemented smart water networks that leverage SCADA systems with 3D visualization to optimize water distribution and reduce losses [
14].
Flood Management: In the Netherlands, SCADA and 3D visualization are used to monitor and control floodgates, ensuring timely responses to changing water levels [
13].
Remote Monitoring: In rural areas of Australia, SCADA systems with satellite communication and 3D visualization have been deployed to manage water supply in remote communities [
8].
These examples underscore the potential of advanced SCADA systems to transform water resource management, particularly in regions facing unique challenges such as water scarcity, aging infrastructure, and climate change [
11].
2.8. Justification for 3D Visualization in the Lerma Basin System
The Lerma Basin, a critical water source for Mexico City, presents a complex and geographically dispersed infrastructure that requires advanced monitoring and control capabilities [
16]. Traditional 2D SCADA systems are insufficient to address the challenges of this system, which includes the following:
Geographical Complexity: The basin spans multiple states, with numerous wells, pipelines, and pumping stations [
4].
Real-Time Monitoring: The need for real-time data on water levels, pressure, and flow rates to ensure efficient operation [
13].
Emergency Response: The ability to quickly identify and respond to issues such as leaks, pump failures, or contamination [
19].
By integrating 3D visualization into the SCADA system, operators can gain a comprehensive understanding of the Lerma Basin’s infrastructure, enabling more effective monitoring, control, and decision-making [
16]. This approach not only improves operational efficiency but also provides a scalable solution for future expansion and contingency planning [
18].
3. Methodology
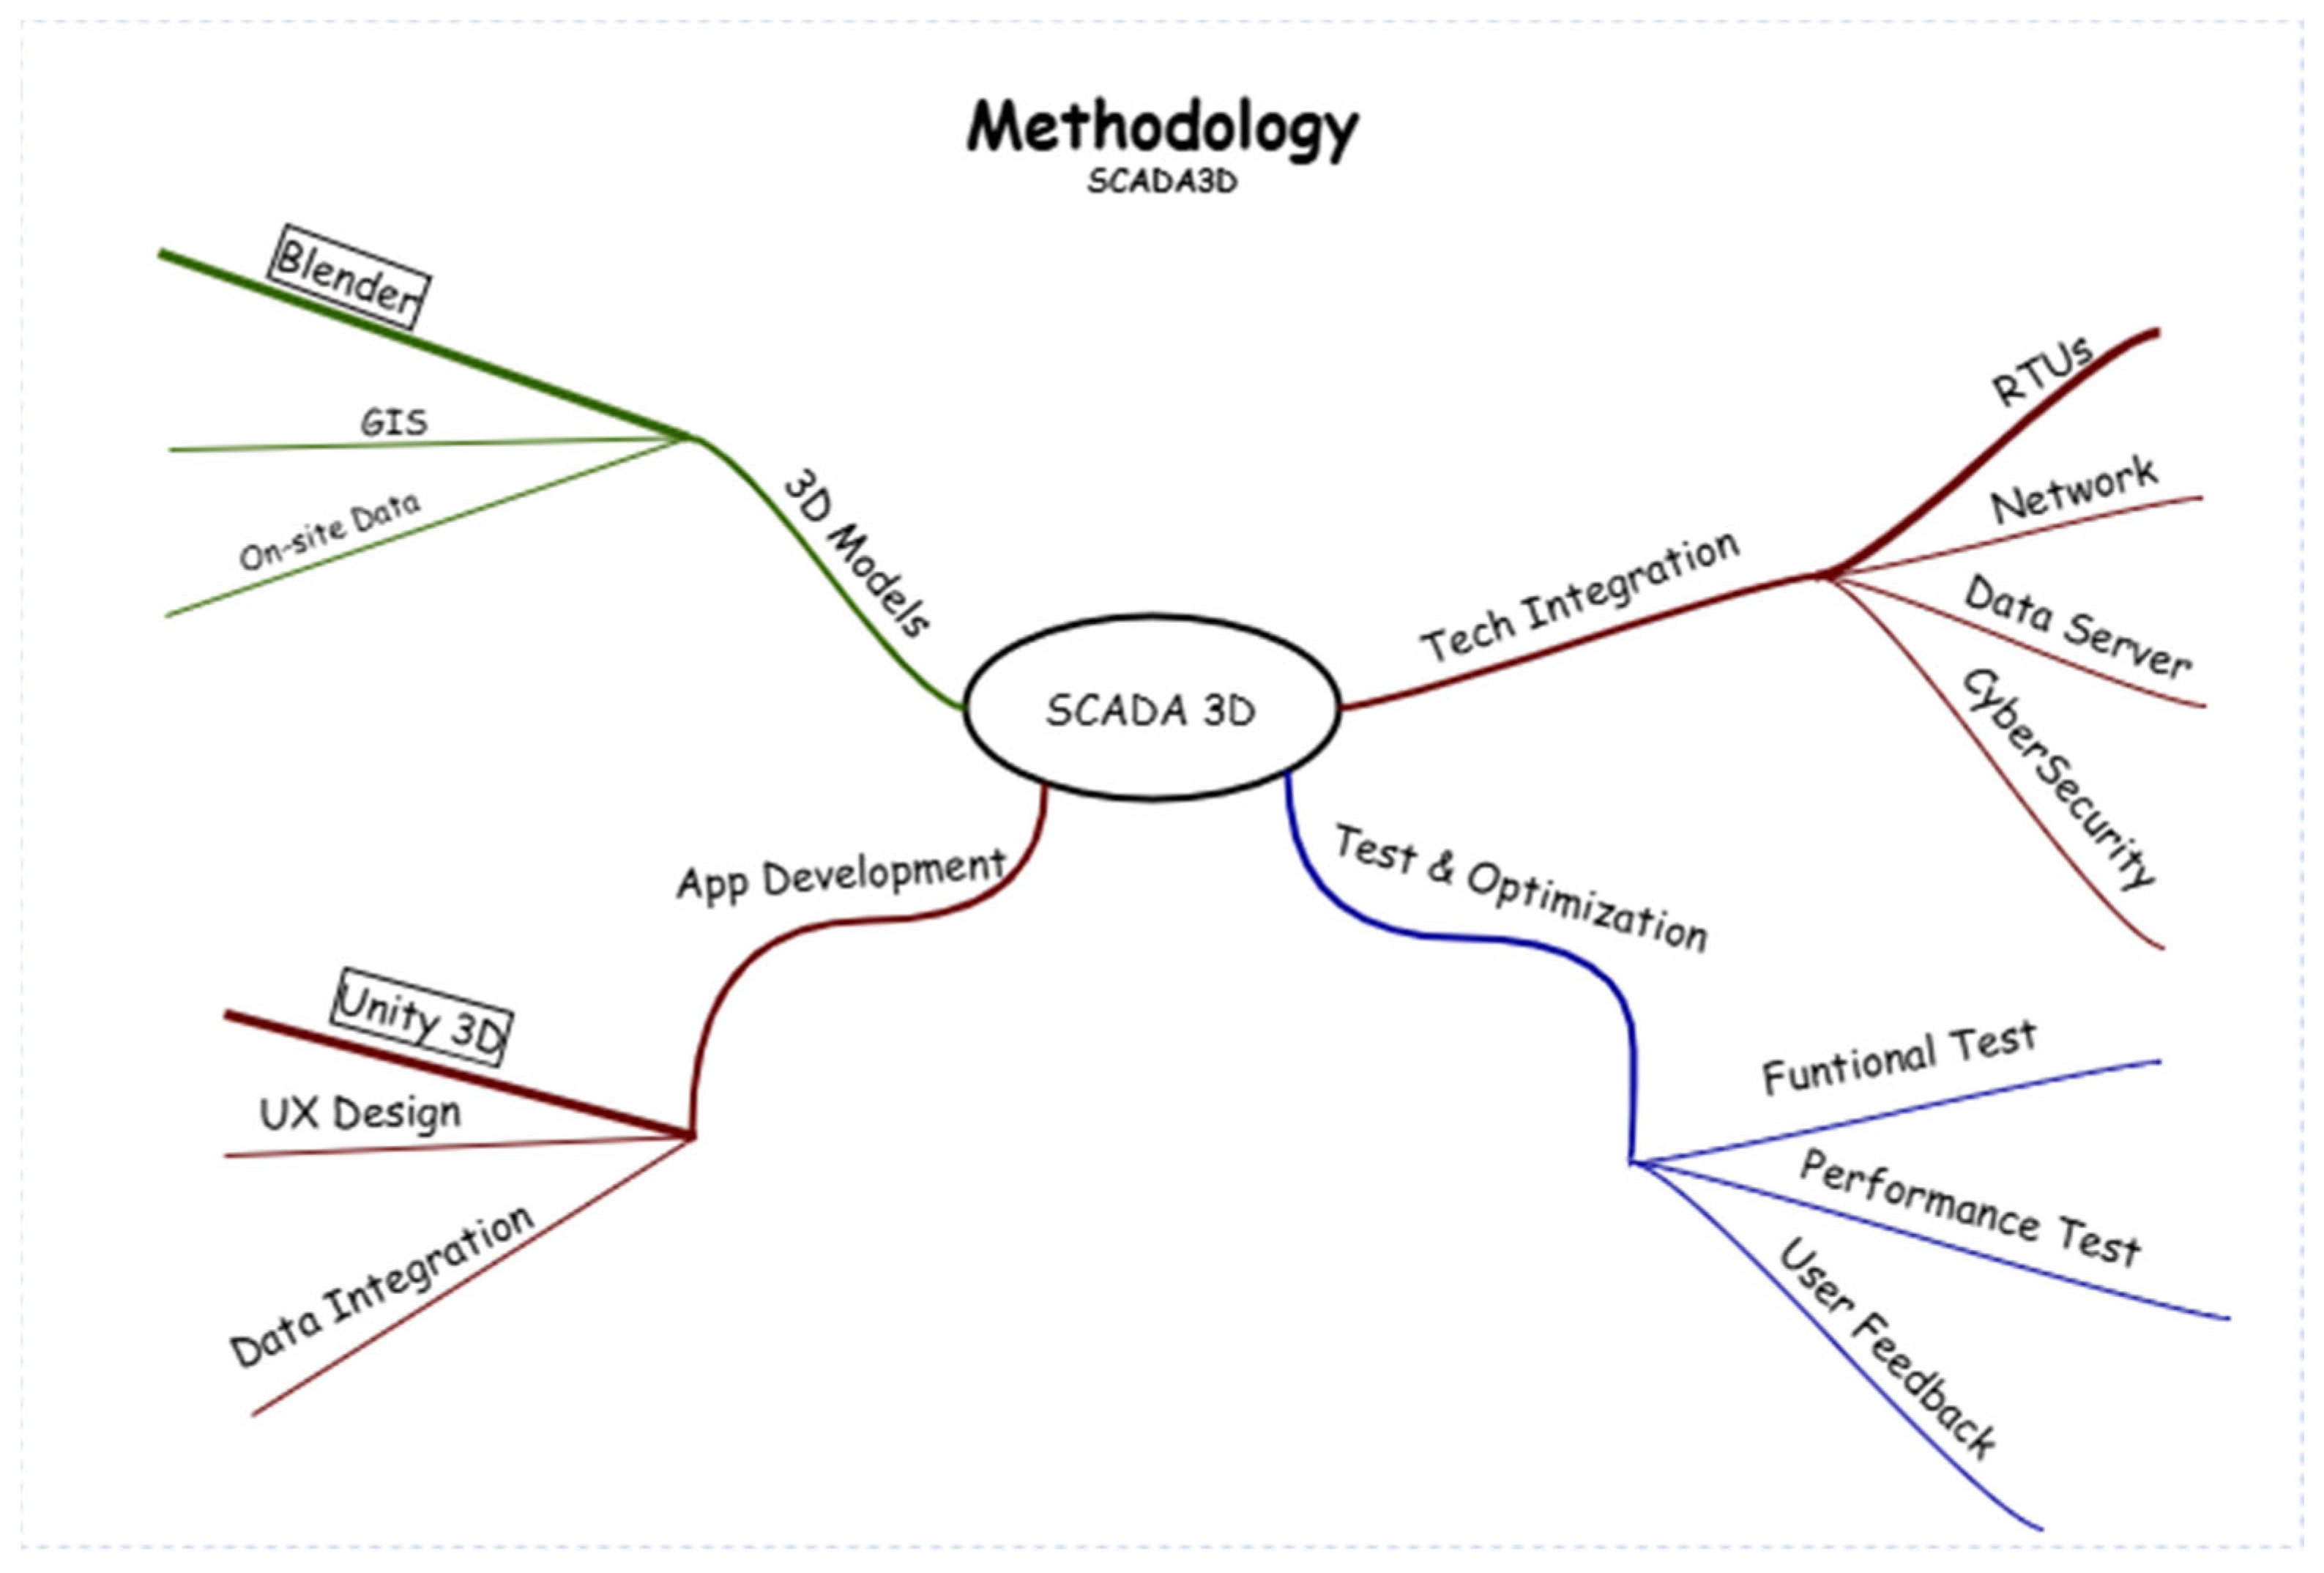
The development of the SCADA system with 3D visualization for the Lerma Basin water supply network involved a structured methodology, divided into four main phases: (1) creation of 3D models, (2) application development, (3) technological integration, and (4) testing and optimization (see
Figure 1). Each phase was designed to ensure the system’s functionality, scalability, and usability in real-world conditions.
3.1. Creation of 3D Models
The first phase focused on creating accurate 3D models of the Lerma Basin’s water infrastructure, including wells, pipelines, pumping stations, and storage tanks. These models were developed using Blender 4.0, an open-source 3D modeling software, due to its flexibility and compatibility with GIS data [
16].
Data Collection: GIS data was used to obtain precise spatial coordinates and dimensions of the infrastructure. This data included elevation maps, pipeline layouts, and well locations [
18].
Modeling Process: The 3D models were created by importing GIS data into Blender and refining the geometry to represent physical components accurately. Textures and materials were applied to enhance visual realism [
15].
Validation: The models were validated by comparing them with on-site measurements and existing technical drawings to ensure accuracy [
13].
3.2. Application Development
The second phase involved developing the SCADA application with 3D visualization capabilities. Unity, a cross-platform game engine, was chosen for this purpose due to its robust rendering capabilities and support for real-time data integration [
17].
User Experience Design (UX): The application’s interface was designed to be intuitive, allowing operators to navigate the 3D environment, monitor real-time data, and control system components [
15].
Data Integration: Real-time data from sensors, such as flow rates, pressure levels, and pump status, are integrated into the application using APIs and middleware [
8].
Interactivity: The application allows operators to interact with the 3D models, such as selecting a pump to view its operational status or adjusting its settings remotely [
16].
3.3. Technological Integration
The third phase is focused on integrating the various technological components of the SCADA system, including hardware, communication networks, and data servers. Remote Terminal Units (RTUs) were installed at key locations, such as wells and pumping stations, to collect data from sensors and control local equipment [
3]. A hybrid communication system was implemented, combining radio frequency (RF), satellite, and cellular networks to ensure reliable data transmission across the geographically dispersed infrastructure [
7]. For data management, a centralized data server was set up to store and process the collected data. The server was equipped with advanced analytics tools to generate insights and alerts for operators [
10]. Finally, robust cybersecurity protocols, including encryption and access control, were included to protect the system from cyber threats [
19].
3.4. Testing and Optimization
The final phase involved extensive testing and optimization to ensure the system’s reliability, accuracy, and performance under real-world conditions.
Functional Testing: The system was tested to verify that all components, including the 3D visualization, data integration, and control functions, worked as intended [
13].
Performance Testing: Stress tests were conducted to evaluate the system’s performance under high data loads and extreme conditions, such as network outages or equipment failures [
8].
User Feedback: Operators provided feedback on the system’s usability, which was used to refine the interface and improve the overall user experience [
15]. This feedback was based only on the operator’s experience, and its redesign is a point considered as future work.
Optimization: Based on the test results, the system was optimized to enhance its efficiency, reduce latency, and minimize energy consumption [
18].
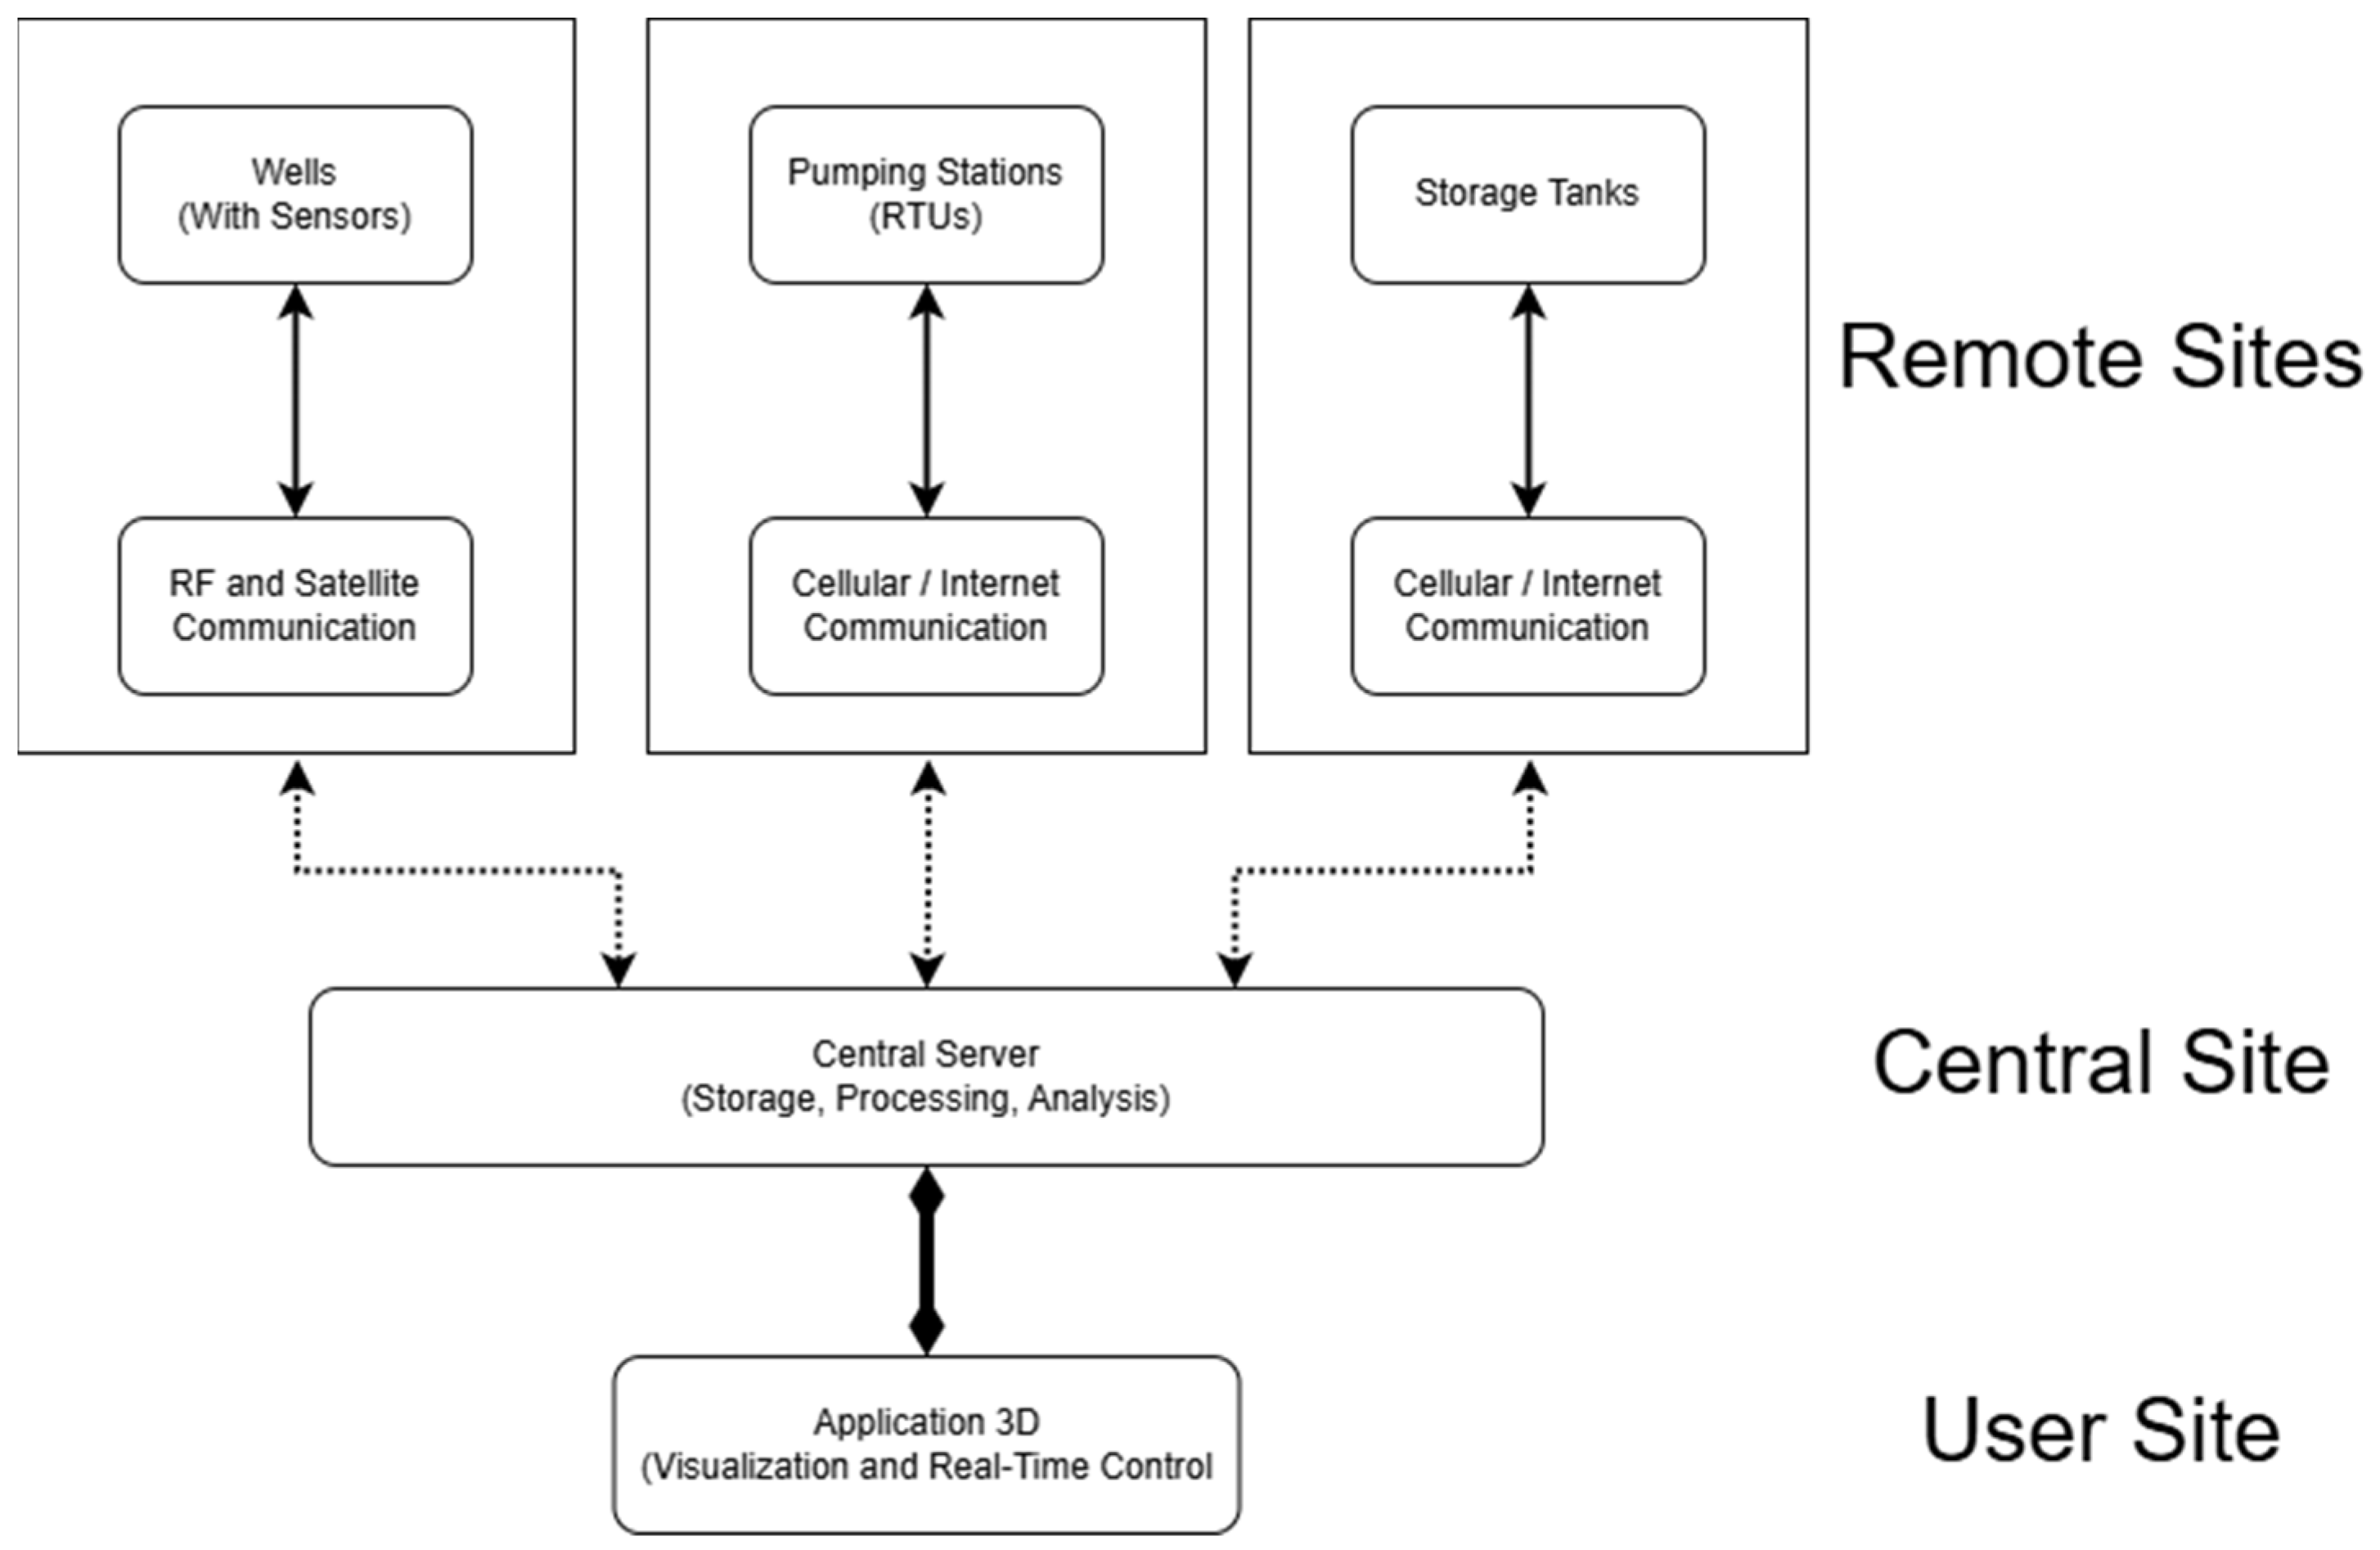
4. System Architecture
The architecture of the proposed SCADA system was designed to ensure robust monitoring, control, and data management. The system is composed of four main components, as can be seen in
Figure 2: (1) RTUs (remote sites), (2) Communication Network, (3) Data Server (central site), and (4) 3D Visualization Application (user site). Each component plays a critical role in the system’s functionality and performance.
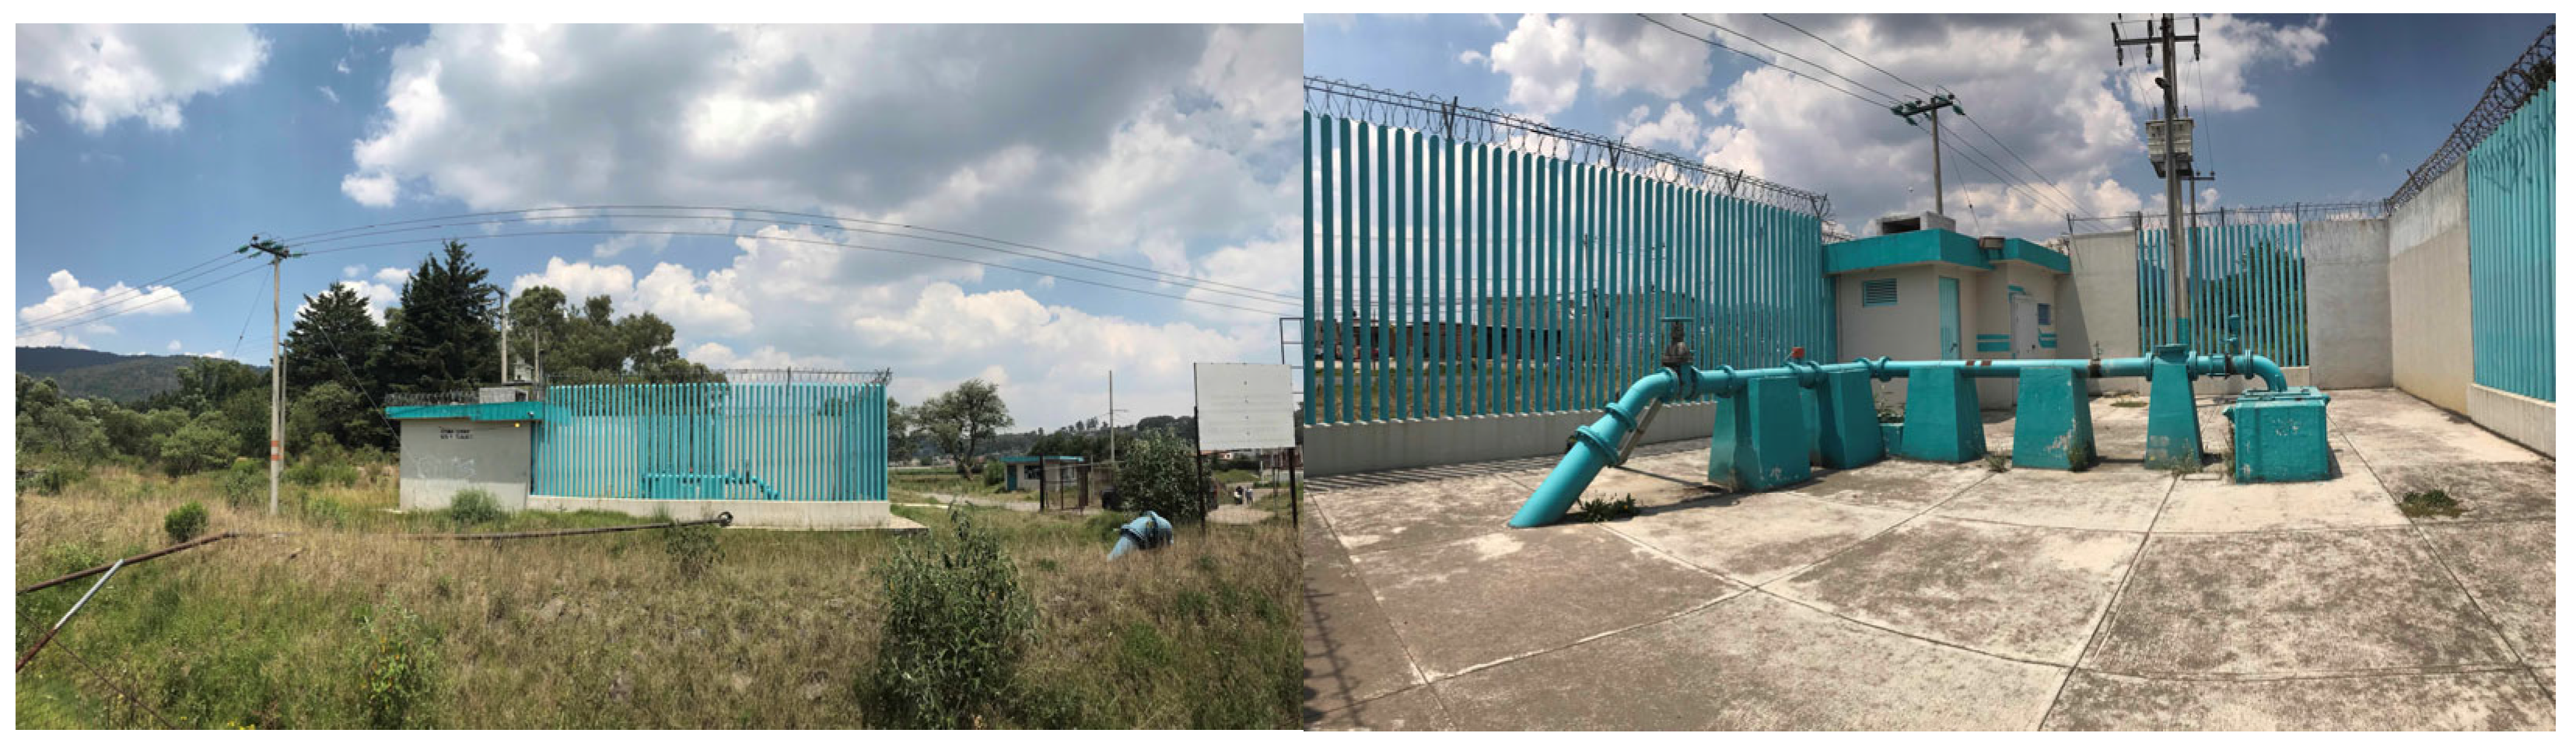
4.1. Remote Terminal Units
RTUs are the backbone of the SCADA system, responsible for collecting data from sensors and controlling local equipment at key locations such as wells (see
Figure 3), pumping stations, and storage tanks. These units are equipped with sensors that measure critical parameters, including water flow rates, pressure levels, and pump statuses, providing real-time data that is transmitted to the Central Server for further processing and analysis [
3]. RTUs (see
Figure 4) play a dual role in the system: they not only gather data but also execute local control commands based on predefined criteria or instructions from the central server. For example, an RTU can automatically start or stop a pump if water levels or pressure fall outside specified thresholds. This local control capability ensures that the system can respond quickly to changes in operational conditions, even in the absence of direct human intervention [
7].
To ensure reliability and minimize the risk of system failures, redundant RTUs are installed at critical locations. These backup units take over in the event of a primary RTU malfunction, ensuring continuous operation and data collection. This redundancy is particularly important in the Lerma Basin, where the water supply network spans a large and geographically diverse area, making manual intervention difficult in remote locations [
19].
The integration of RTUs with the broader SCADA system is facilitated by a hybrid communication network, which combines RF (Radio Frequency), satellite, and cellular/Internet technologies. This network ensures that data from RTUs is transmitted reliably to the central server, regardless of the location of the wells or pumping stations. The use of multiple communication methods allows the system to adapt to varying environmental conditions and infrastructure availability, ensuring robust and uninterrupted operation [
8]. In addition to their operational functions, RTUs contribute to the system’s cybersecurity framework. They are equipped with encryption and access control mechanisms to protect against unauthorized access and data breaches. These measures are critical for safeguarding the integrity and confidentiality of the data collected by RTUs, particularly in a system as critical as the Lerma Basin’s water supply network [
19].
4.2. Communication Network
The communication network is a hybrid system that combines Radio Frequency (RF), satellite, and cellular technologies to ensure reliable data transmission across the geographically dispersed infrastructure of the Lerma Basin [
8].
Radio Frequency: RF is used for short-range communication between RTUs and local hubs, providing a cost-effective solution for areas with limited cellular coverage [
7].
Satellite Communication: Satellite links are used for remote locations where RF and cellular networks are unavailable, ensuring continuous data transmission [
10].
Cellular Network: Cellular networks provide high-speed data transmission for areas with good coverage, enabling real-time monitoring and control [
13].
Network Security: The communication network is protected by robust cybersecurity measures, including encryption and access control, to prevent unauthorized access and data breaches [
19]. Since the system works over HTTPS, the secure variant of HTTP, the encryption of data applies a Transport Layer Security (TLS) protocol and a Secure Sockets Layer (SSL). TLS is an encryption system that employs two keys: a public key for anyone connecting with the server and a private key stored for the server itself.
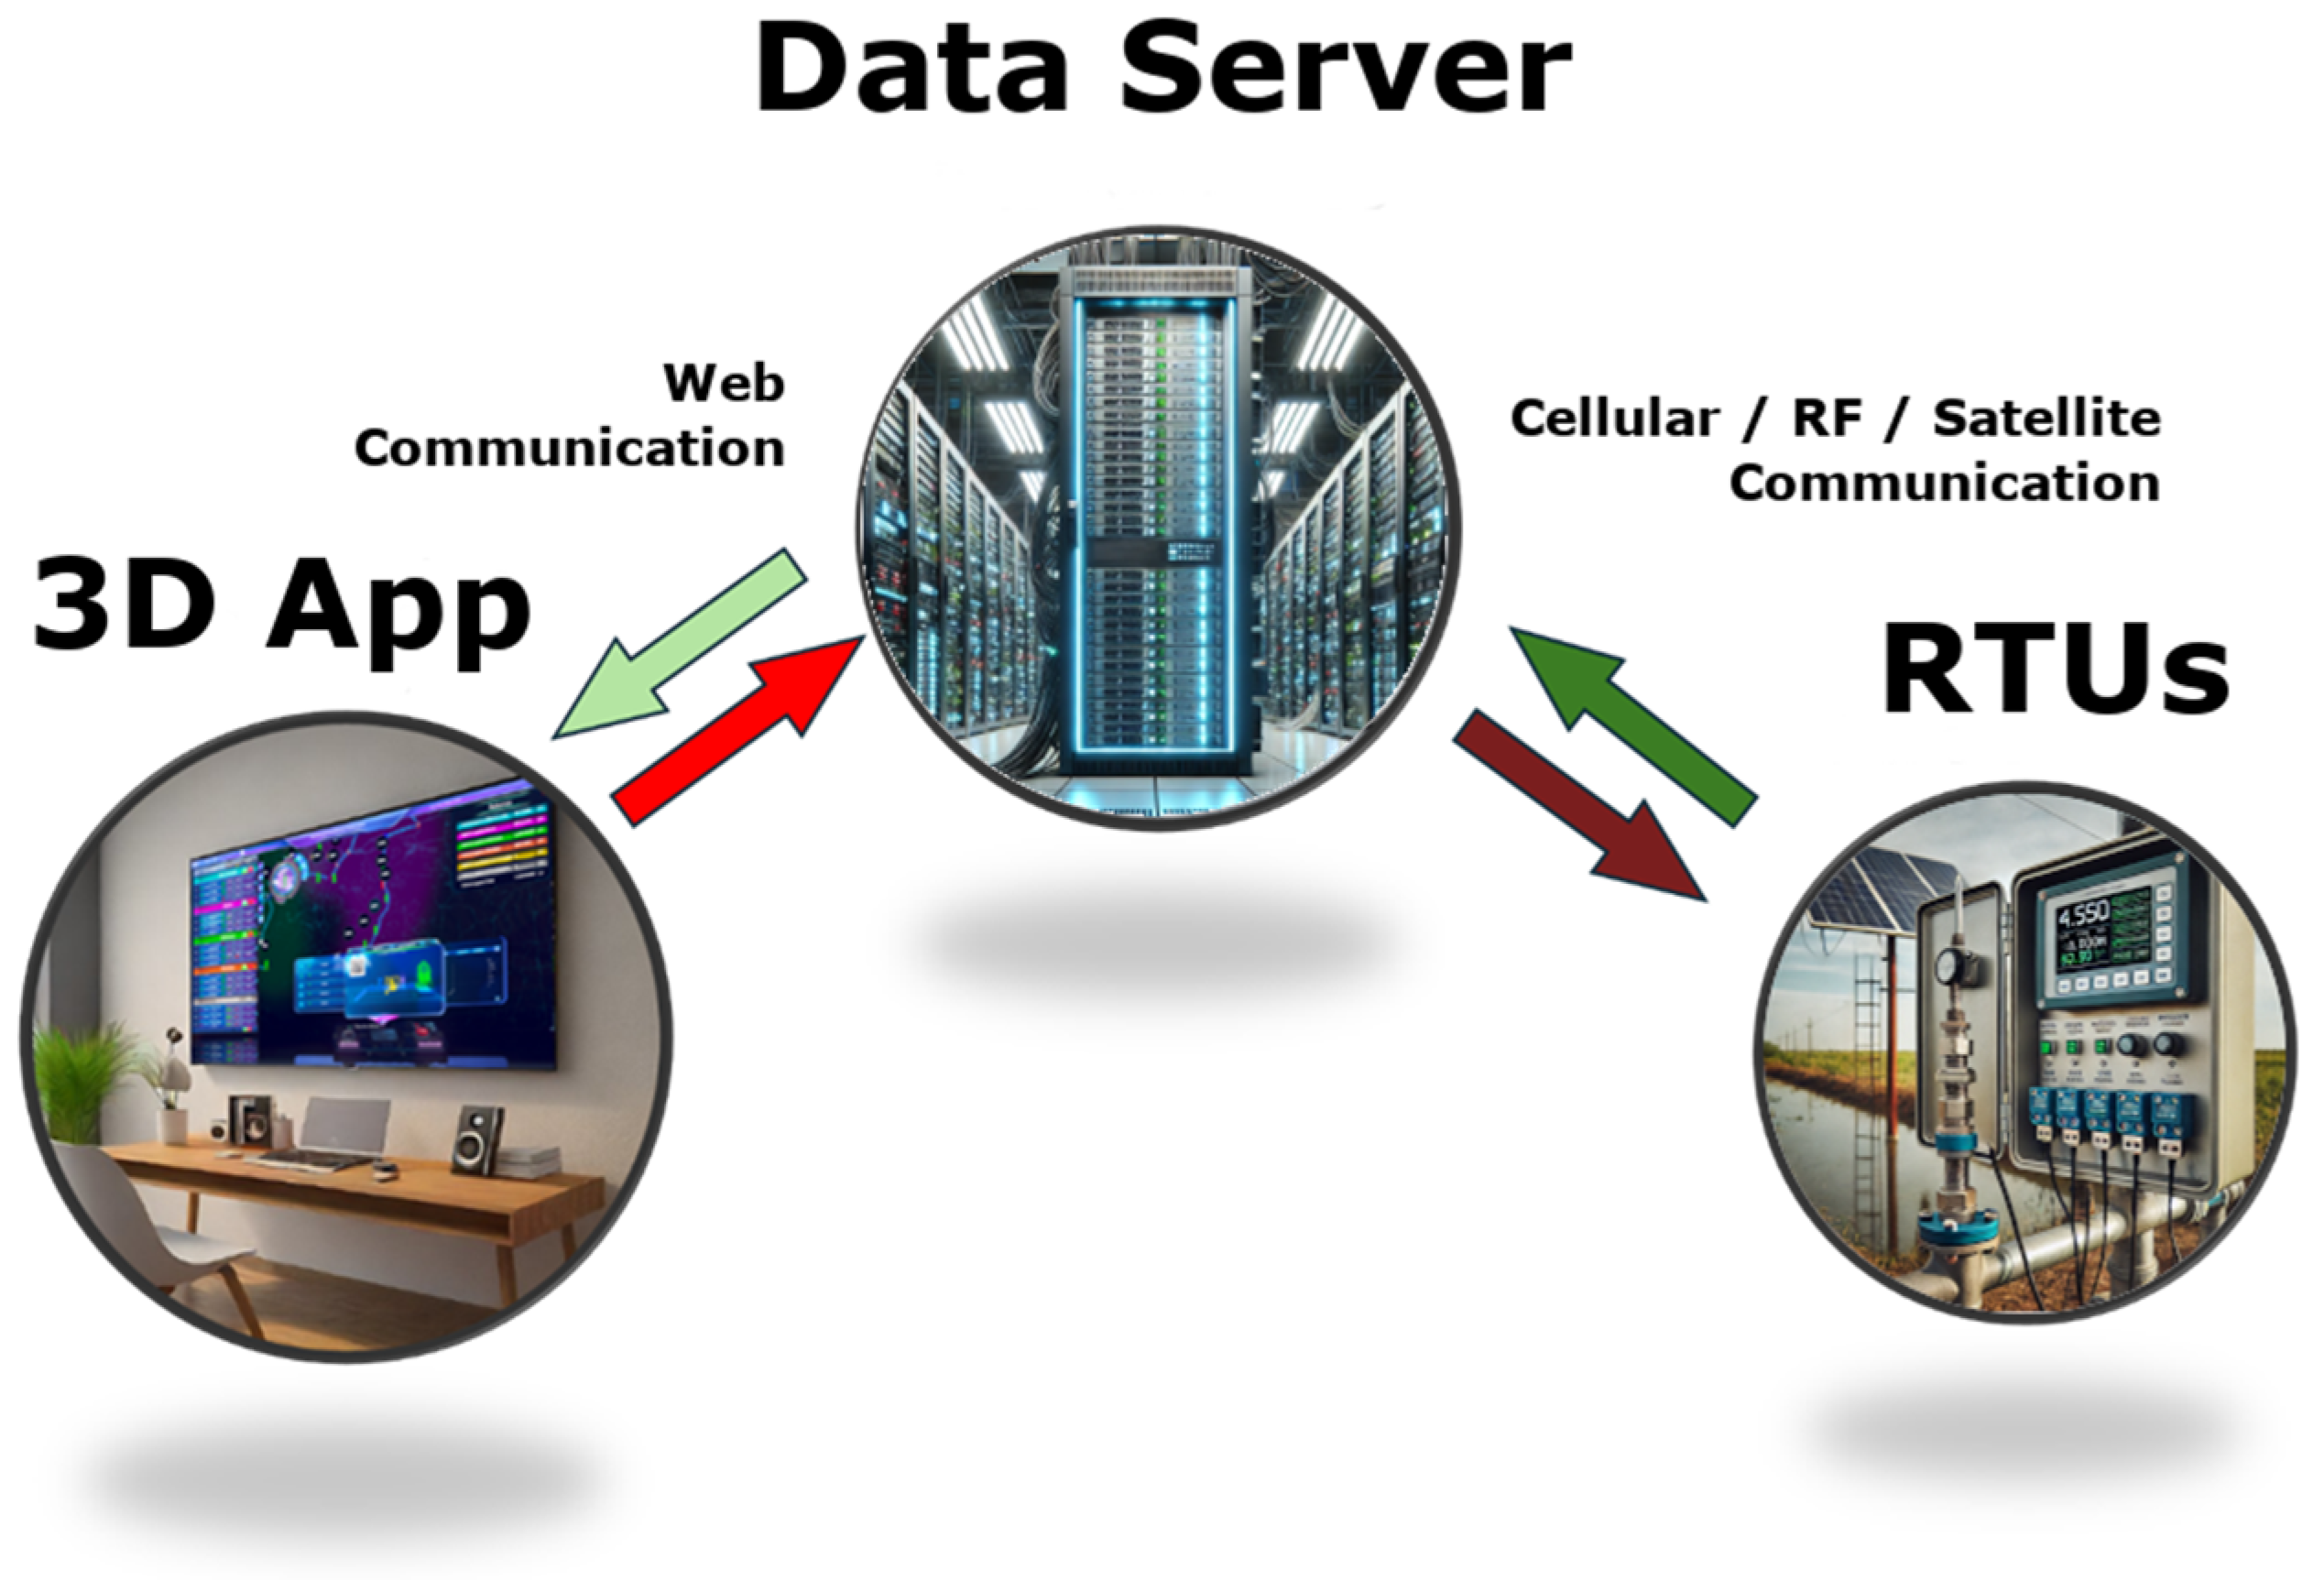
4.3. Data Server
As shown in
Figure 5, the data server is the central hub of the SCADA system, responsible for storing, processing, and analyzing the data collected from RTUs [
18].
Data Storage: The server stores historical data, allowing operators to analyze trends and generate reports [
8]. Data is stored automatically by polling executed periodically every with intervals of 5 min. The stored data includes a time stamp alongside the information characterizing each of the 160 nodes in the system: water pressure, pump state, and water flow.
Data Processing: Advanced analytics tools are used to process the data in real-time, generating insights and alerts for operators [
13].
System Integration: The server integrates data from multiple sources, including RTUs, GIS, and external databases, providing a comprehensive view of the system [
16].
Redundancy and Backup: To ensure data integrity, the server is equipped with redundant storage and backup systems, protecting against data loss [
19].
4.4. Three-Dimensional Visualization Application
The 3D Visualization Application serves as the user interface of the SCADA system, providing operators with an immersive and intuitive platform to monitor and control the water supply network of the Lerma Basin. Built using Unity, a powerful cross-platform game engine, the application integrates real-time data from the central server, enabling operators to visualize the entire system in a dynamic 3D environment. It is designed to include not only the 160 operational wells but also the 200 wells currently under construction, offering a comprehensive view of the system’s current and future states [
16] (see
Figure 6). The minimum characteristics of the computing platform required for executing the 3D Visualization Application are a quad-core processor I7 or equivalent, with a 6 GB VRAM video card, 16 GB RAM, and Windows 11 operating system.
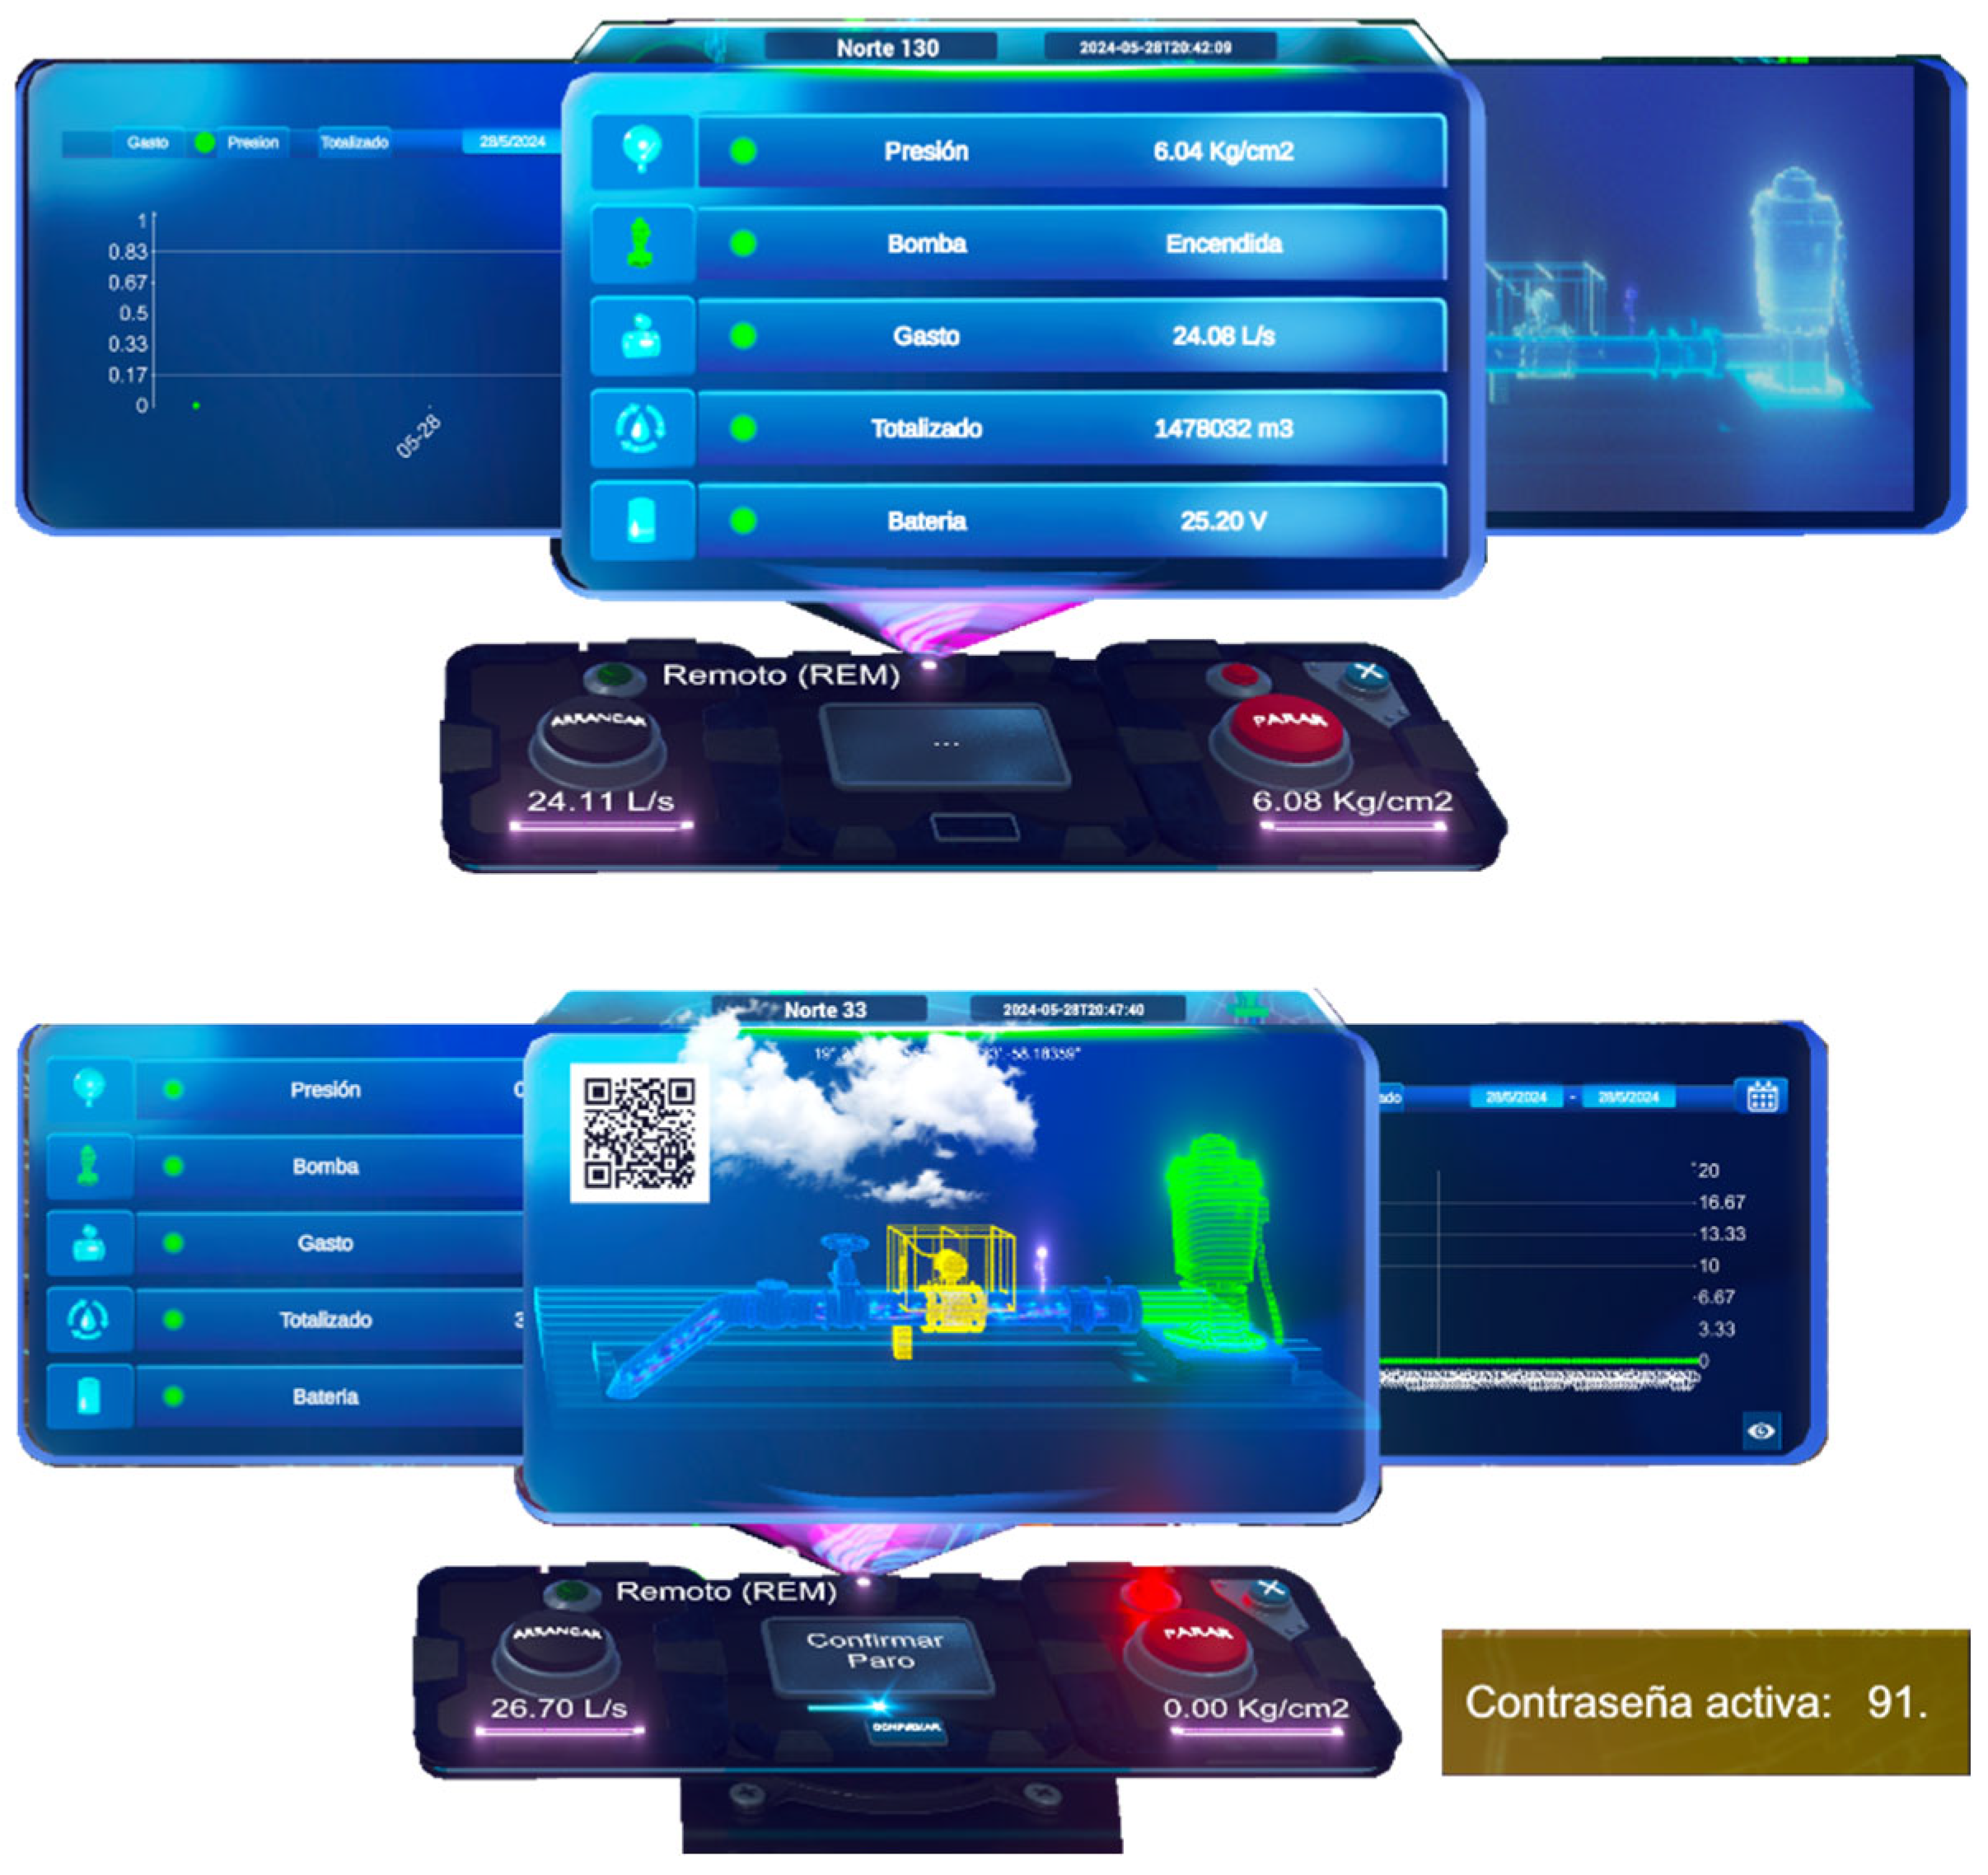
The application features a user-friendly interface designed to minimize the learning curve for operators while maximizing efficiency. Operators can navigate the 3D environment to monitor key parameters such as water flow rates, pressure levels, and pump status in real time, (see
Figure 7). The interactivity of the application allows users to select specific components, such as pumps or valves, to view detailed operational data or make adjustments remotely. This capability enhances situational awareness and enables quick decision-making, particularly in emergency scenarios [
15].
One of the most innovative aspects of the 3D visualization is its ability to simulate future scenarios. By incorporating data from wells under construction, the application provides a forward-looking perspective of the Lerma Basin’s water supply network. This feature is invaluable for planning and contingency management, as it allows operators to anticipate system behavior and optimize resource allocation [
18].
The integration of real-time data with 3D modeling ensures that the visualization is both accurate and up to date. Operators can observe changes in the system as they occur, such as fluctuations in water levels or pressure drops, and respond proactively. The application also includes tools for generating reports and analytics, which can be used to identify trends, evaluate performance, and support long-term planning [
8]. By combining advanced visualization techniques with robust data processing capabilities, the 3D interface transforms complex information into actionable insights, making it an indispensable tool for managing the Lerma Basin’s water resources, as shown in
Figure 8. The QR code shown on the pump control screen indicates the exact geographic location of the well.
4.5. Three-Dimensional Information Flow in the SCADA System
The information flow in the proposed SCADA system is bidirectional: data flows from the well sensors to the 3D interface for visualization and control. Control commands flow from the 3D interface to RTUs and physical equipment (pumps, valves). This design ensures efficient and real-time management of the water supply system in the Lerma Basin, improving operational efficiency and emergency response capabilities.
The flow of information within the SCADA system begins at the remote sites (wells), which are equipped with sensors to measure critical parameters such as water level, pressure, and flow. Currently, the system monitors over 160 operational wells, with an additional 200 wells under construction. These sensors collect real-time data and transmit it to the Pumping Stations. RTUs act as intermediaries, processing and consolidating the data before sending it to the Central Server. Additionally, RTUs execute local commands, such as turning pumps on or off, based on the received data or instructions from the central server. This stage is crucial as it ensures that raw data from the field is efficiently gathered and prepared for further analysis.
The data collected by the RTUs is transmitted to the Central Server through a hybrid communication network. This network combines RF (Radio Frequency) for nearby areas with limited coverage, satellite for remote locations without cellular access, and cellular/internet for urban areas with reliable connectivity. This hybrid approach ensures that data reaches the central server regardless of the geographical challenges posed by the Lerma Basin. Reliable communication is essential for real-time monitoring and remote control, enabling the system to operate seamlessly across diverse environments.
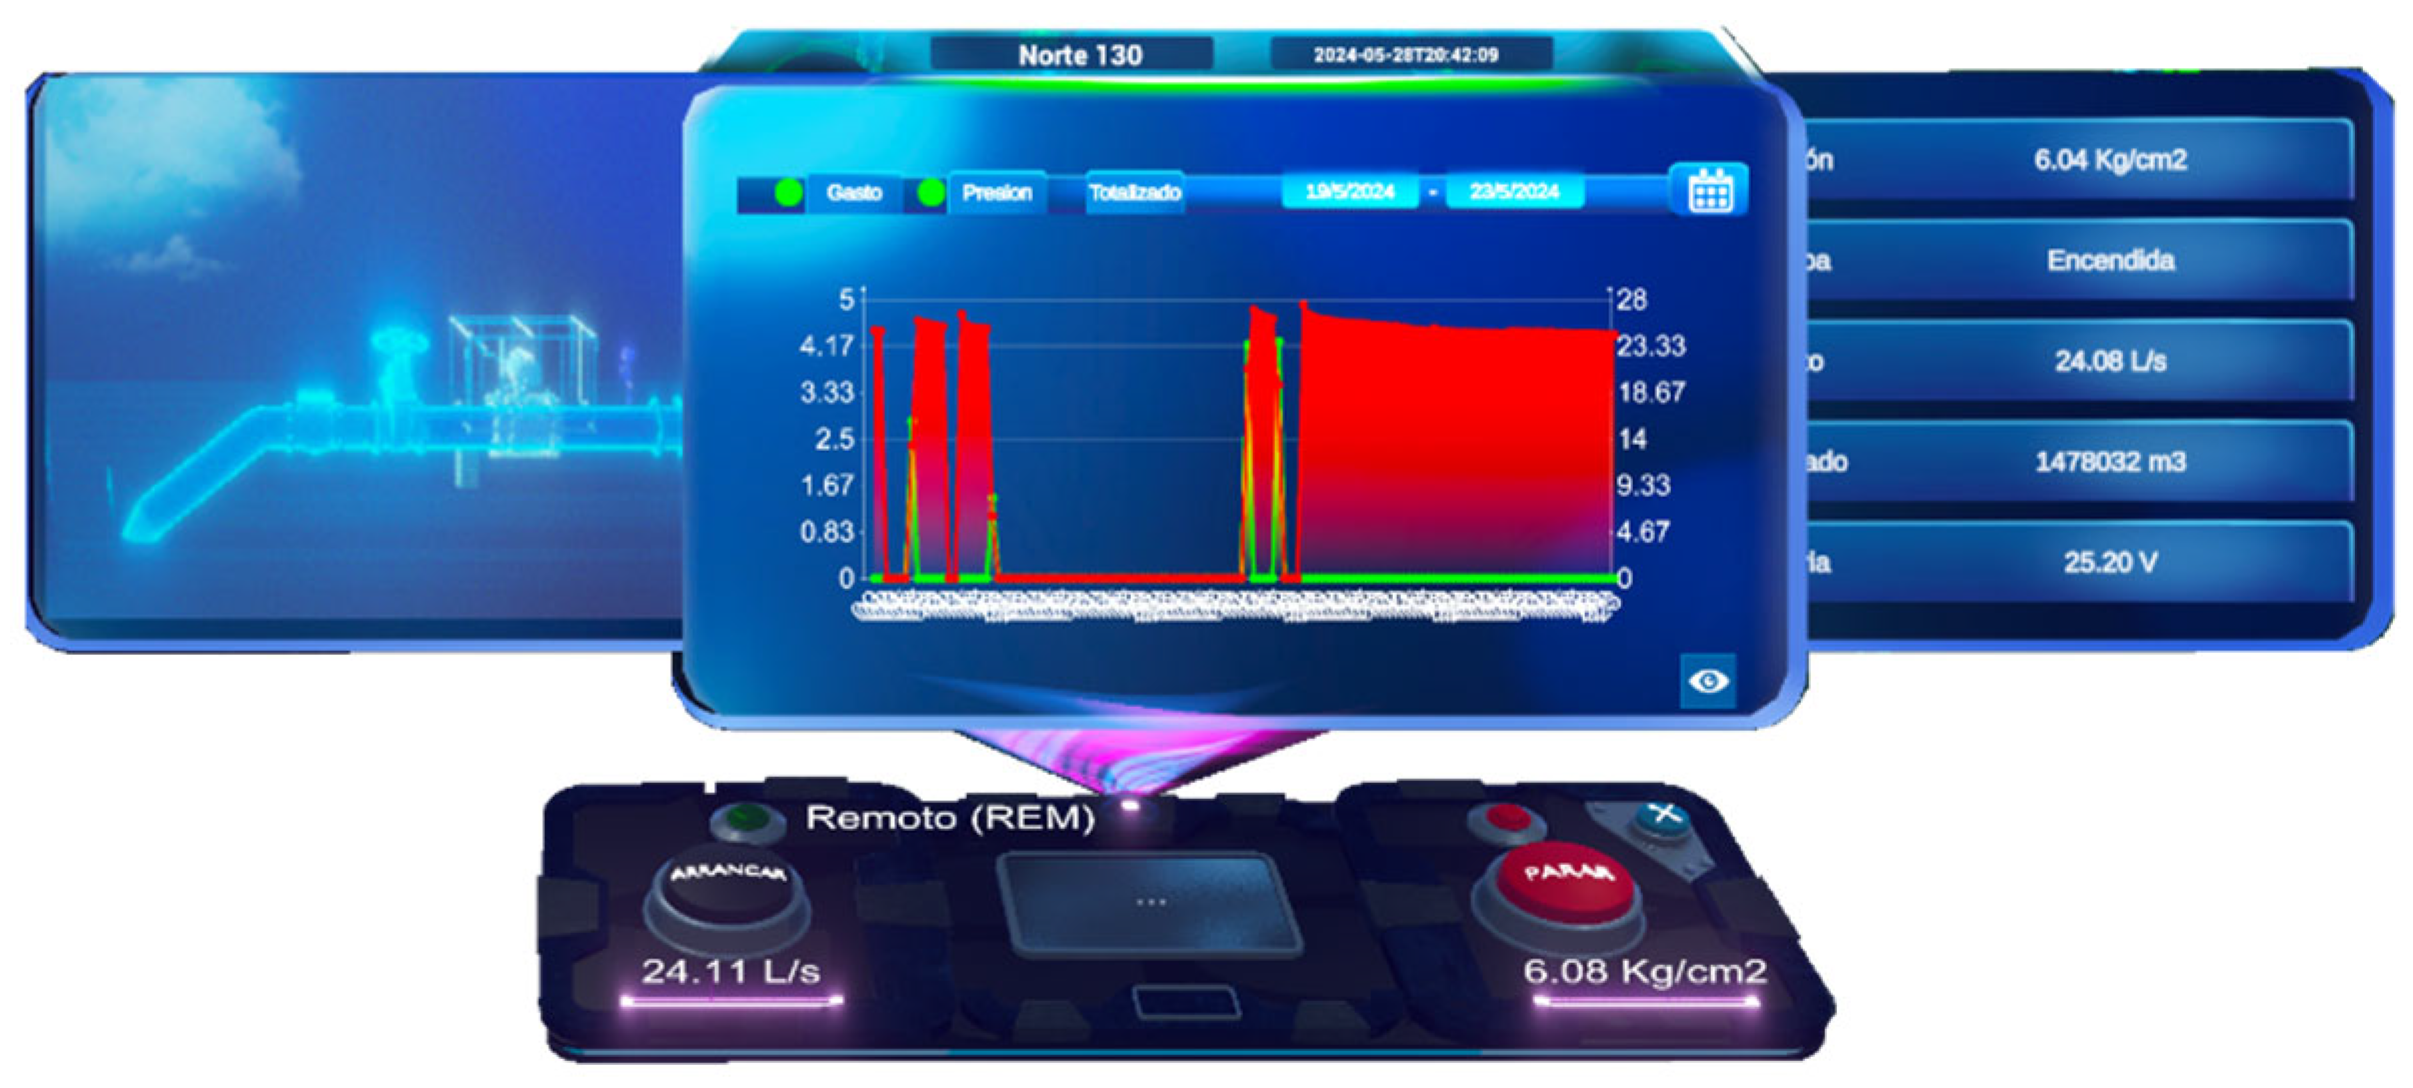
Once the data arrives at the Central Server, it is stored, processed, and analyzed. The server integrates information from multiple sources, including GIS (Geographic Information Systems), to provide a comprehensive view of the water supply network. Advanced analytics tools generate alerts, reports, and recommendations, allowing operators to make data-driven decisions. The central server also stores historical data (see
Figure 9), which is invaluable for identifying trends, planning maintenance, and optimizing system performance. This stage represents the core of the SCADA system, where raw data is transformed into actionable insights.
The processed data is sent to the User Site (3D Interface), where operators can visualize the entire water supply network in an interactive and immersive environment. The 3D interface not only displays the current state of the system, including the 160 operational wells, but also incorporates the 200 wells under construction. This allows users to view the complete Lerma system as it is expected to operate in the future. Operators can monitor in real time the status of wells, pumps, and storage tanks, and remotely control equipment, such as adjusting pump settings or opening and closing valves. The interface also supports training and simulation, enabling operators to practice contingency planning and explore potential system improvements. The 3D visualization enhances situational awareness and decision-making, making it a vital component of the SCADA system.
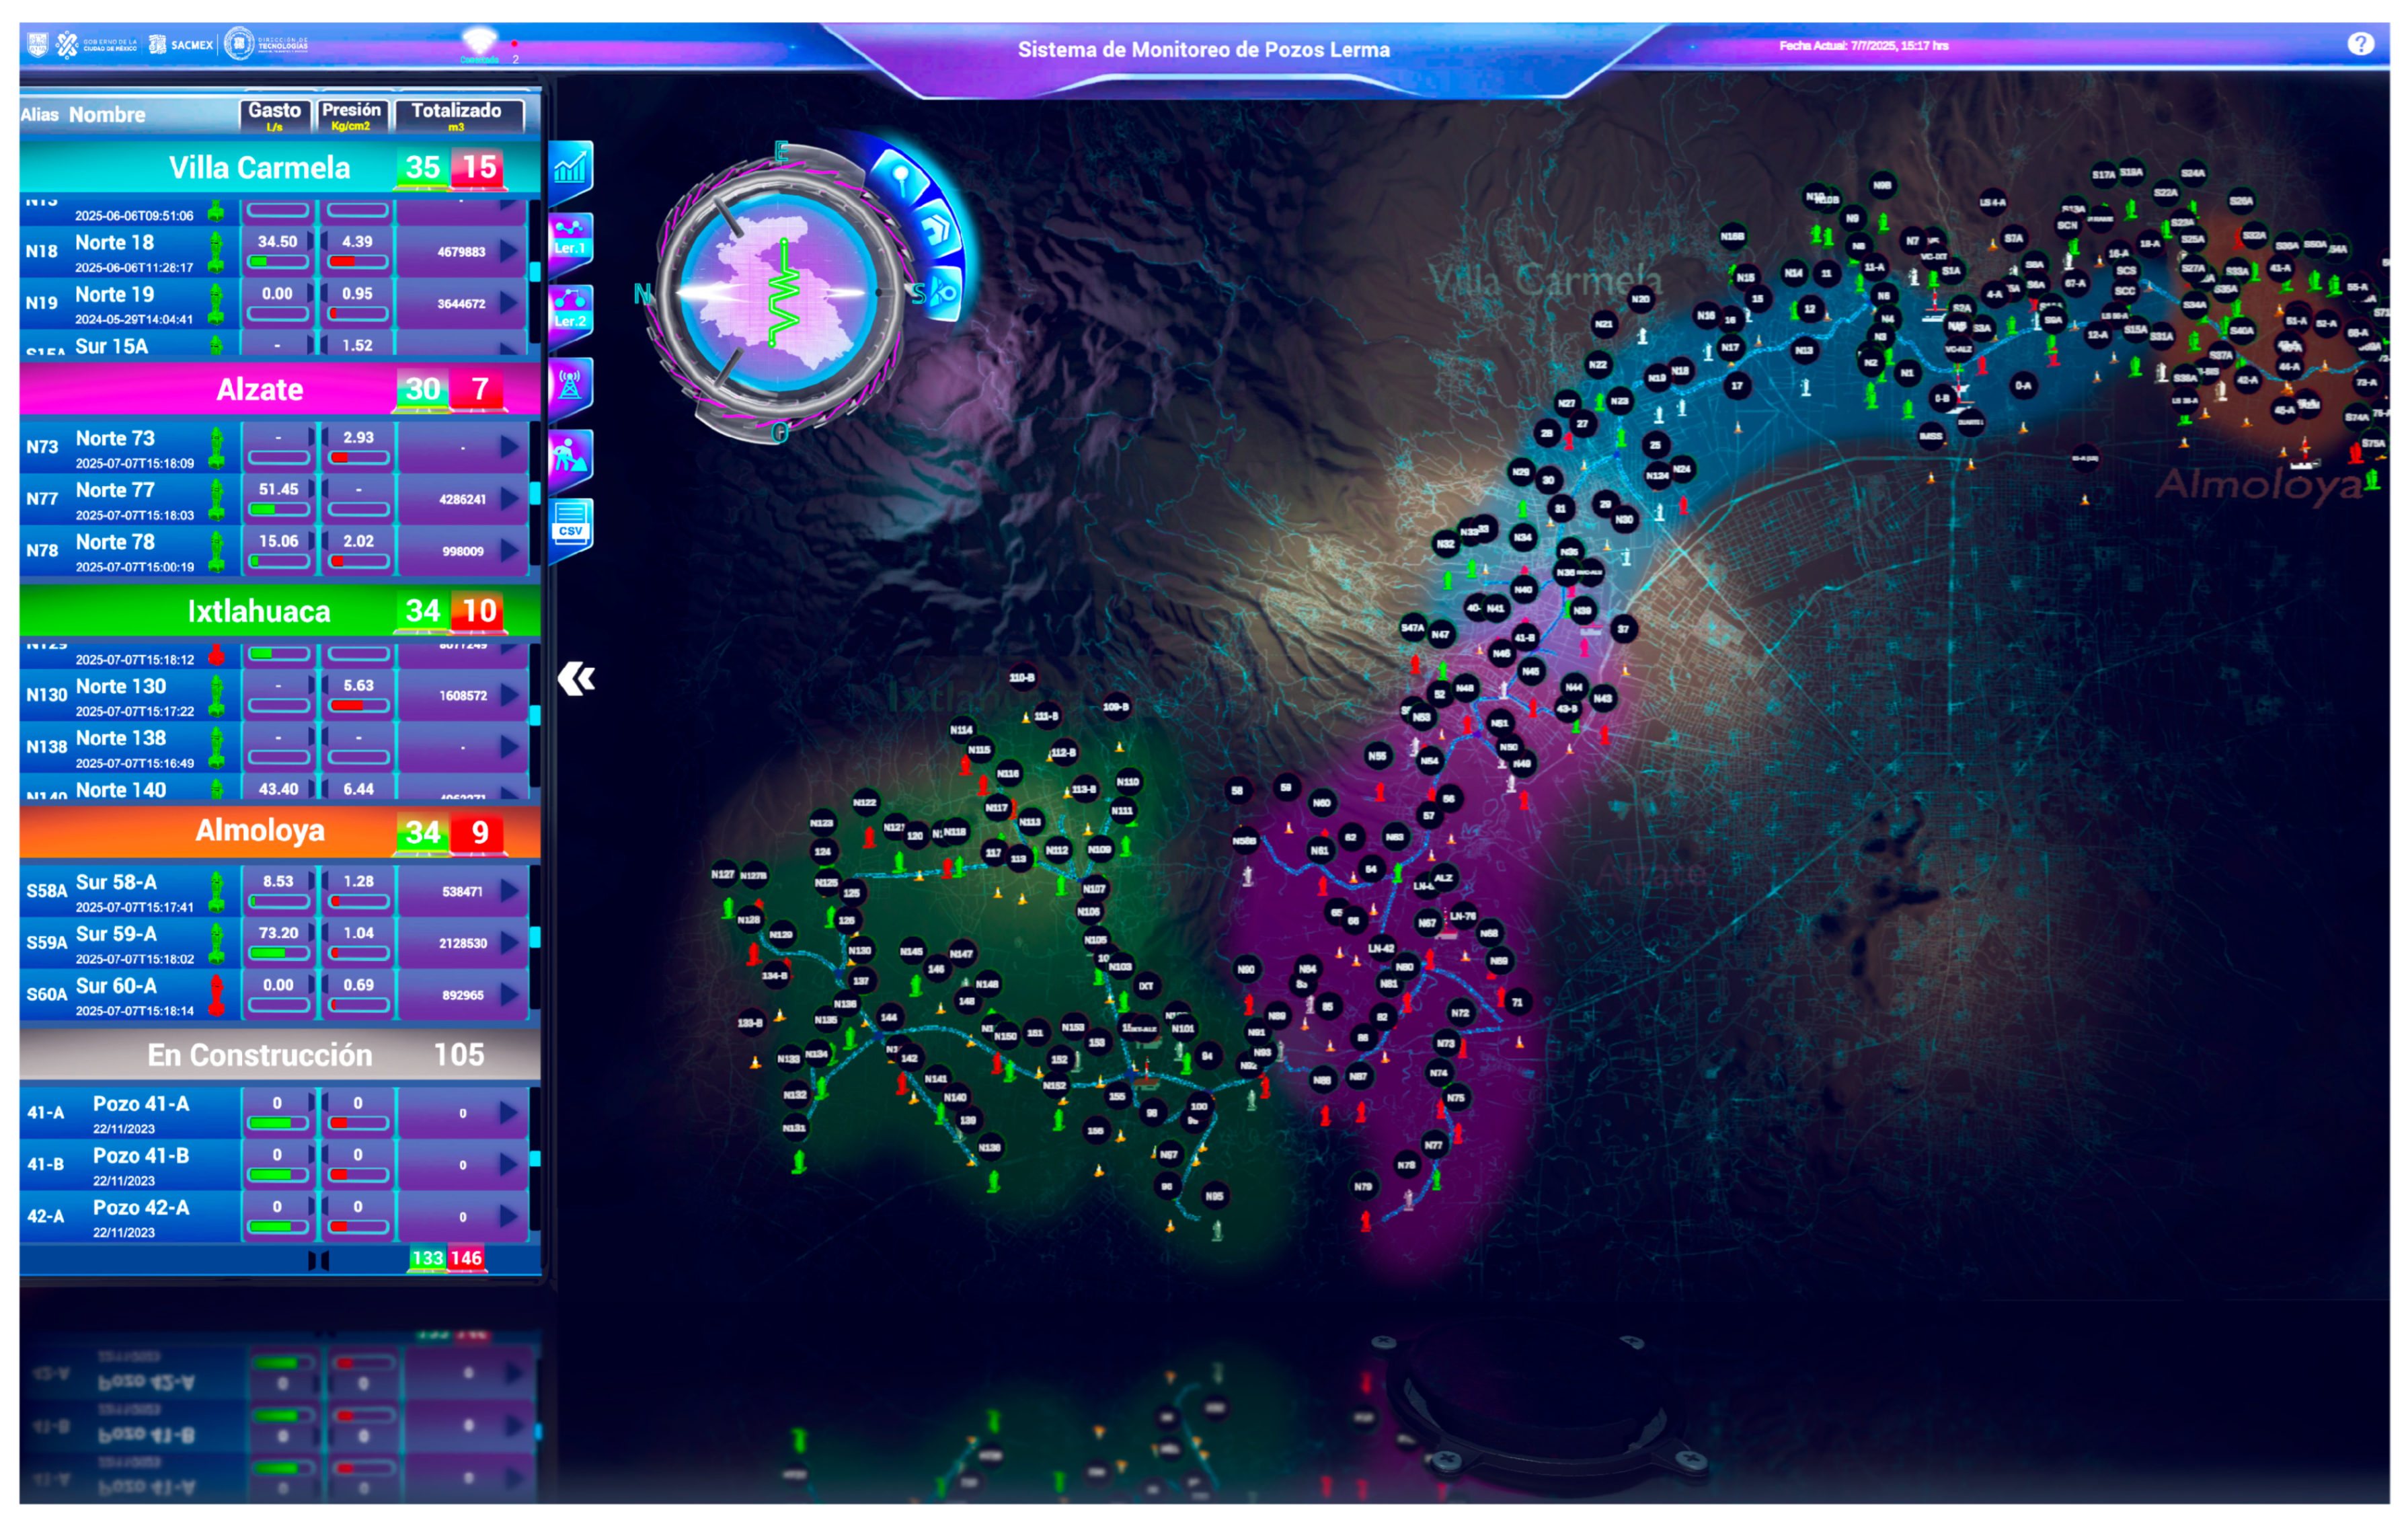
5. Operation Results
Instead of using normal quantifiable parameters to evaluate the performance of the developed SCADA system, the results of its implementation are reflected in the ability to manage, monitor and control the Lerma Basin’s water supply network. One of the most notable outcomes is the 24/7 access to real-time information about the status of the wells, pumping stations, and storage tanks. Operators can monitor critical parameters such as water levels, pressure, and flow rates at any time, ensuring continuous oversight of the system’s performance. This capability is particularly valuable in a region as complex and geographically dispersed as the Lerma Basin, where manual monitoring would be impractical and inefficient.
Another key result is the system’s ability to perform water balance calculations. By integrating data from the 160 operational wells and the sensors at the entrance of the main collector, the system can determine the exact amount of water being extracted from each well and compare it with the total volume entering the collector. This balance allows operators to identify discrepancies that may indicate water leaks or theft [
1]. For example, if the total volume of water entering the collector is significantly less than the sum of the volumes reported by the wells, it suggests a potential issue in the network that requires immediate attention.
The system’s advanced analytics tools further enhance its ability to detect anomalies. By analyzing historical data and real-time inputs, the SCADA system can generate alerts when unusual patterns are detected, such as sudden drops in pressure or unexpected changes in flow rates. These alerts enable operators to investigate and address issues promptly, minimizing water loss and ensuring the efficient operation of the network.
Additionally, the 3D visualization interface plays a crucial role in interpreting and acting on the data. Operators can visualize the entire network, including the location of wells, pipelines, and sensors, in an interactive 3D environment. This spatial awareness makes it easier to pinpoint the source of a leak or identify areas where water theft may be occurring. Overall, the SCADA system has demonstrated a reduction in response times to operational issues and a significant decrease in water losses due to leaks or theft. These improvements not only enhance the efficiency of the water supply network but also contribute to the sustainable management of the Lerma Basin’s water resources.
As mentioned previously, nowadays SCADA systems are specific CPS. In this sense, taking into account the accelerated development of the technology every day, this project includes not only the design and implementation of the system, but it also considers a periodic revision of the necessities, the technology advancement and the system performance, to carry out any required adjustment and even a redesign of the system modules. This measure will ensure flexibility to increase the number of wells controlled and monitored by the system, and the quality of the services generated. Among others, the following points are considered in this update stage:
Improvement of the real-time performance and accuracy of the 3D visualization systems.
Reduction in the data transmission latency.
Implementation of AI to further data processing.
Increase the network security protection capabilities of the system.
From the operational tests, some limitations of the system have been detected. Among the most important issues are the following:
The turn-off and start of pumps is not automatic, it has to be activated by the operator.
Some external variables that can affect the operation of the pumps are not yet considered, such as the quality of the electric energy supply or the lack of alarm signals corresponding to open cabinets.
There is no surveillance system associated with the SCADA system, and some failures due to physical intrusion can be misinterpreted by the system.
6. Final Considerations
The implementation of a cyber-physical system with 3D visualization has improved the management of the Lerma Basin’s water supply network, marking a significant advancement in the use of technology for resource management. By integrating SCADA systems, real-time data analytics, and 3D visualization, the system provides operators with unprecedented tools to monitor, control, and optimize the water supply network. This approach not only enhances operational efficiency but also addresses critical challenges such as water scarcity, infrastructure complexity, and the need for sustainable resource management.
The success of this system also highlights the importance of integrating modern technologies into critical infrastructure. By leveraging IoT devices, hybrid communication networks, and cybersecurity measures, the SCADA system ensures reliable and secure operation, even in geographically dispersed and challenging environments. This technological integration not only improves the efficiency of the Lerma Basin’s water supply network but also sets a precedent for other regions facing similar challenges.
In conclusion, the implementation of this cyber-physical system with 3D visualization has not only improved the operational efficiency of the Lerma Basin’s water supply network but also provided a scalable and sustainable model for water management. This approach demonstrates how technology can bridge the gap between historical infrastructure and modern demands, ensuring the reliable and efficient supply of water.
As for future work, the development of usability tests has been considered to improve the interaction between the operators and the system interface. Also, it is necessary to consider the present limitations of the system in order to correct them or reduce their effect.


 ,
, 