Explainable AI Assisted IoMT Security in Future 6G Networks
Abstract
1. Introduction
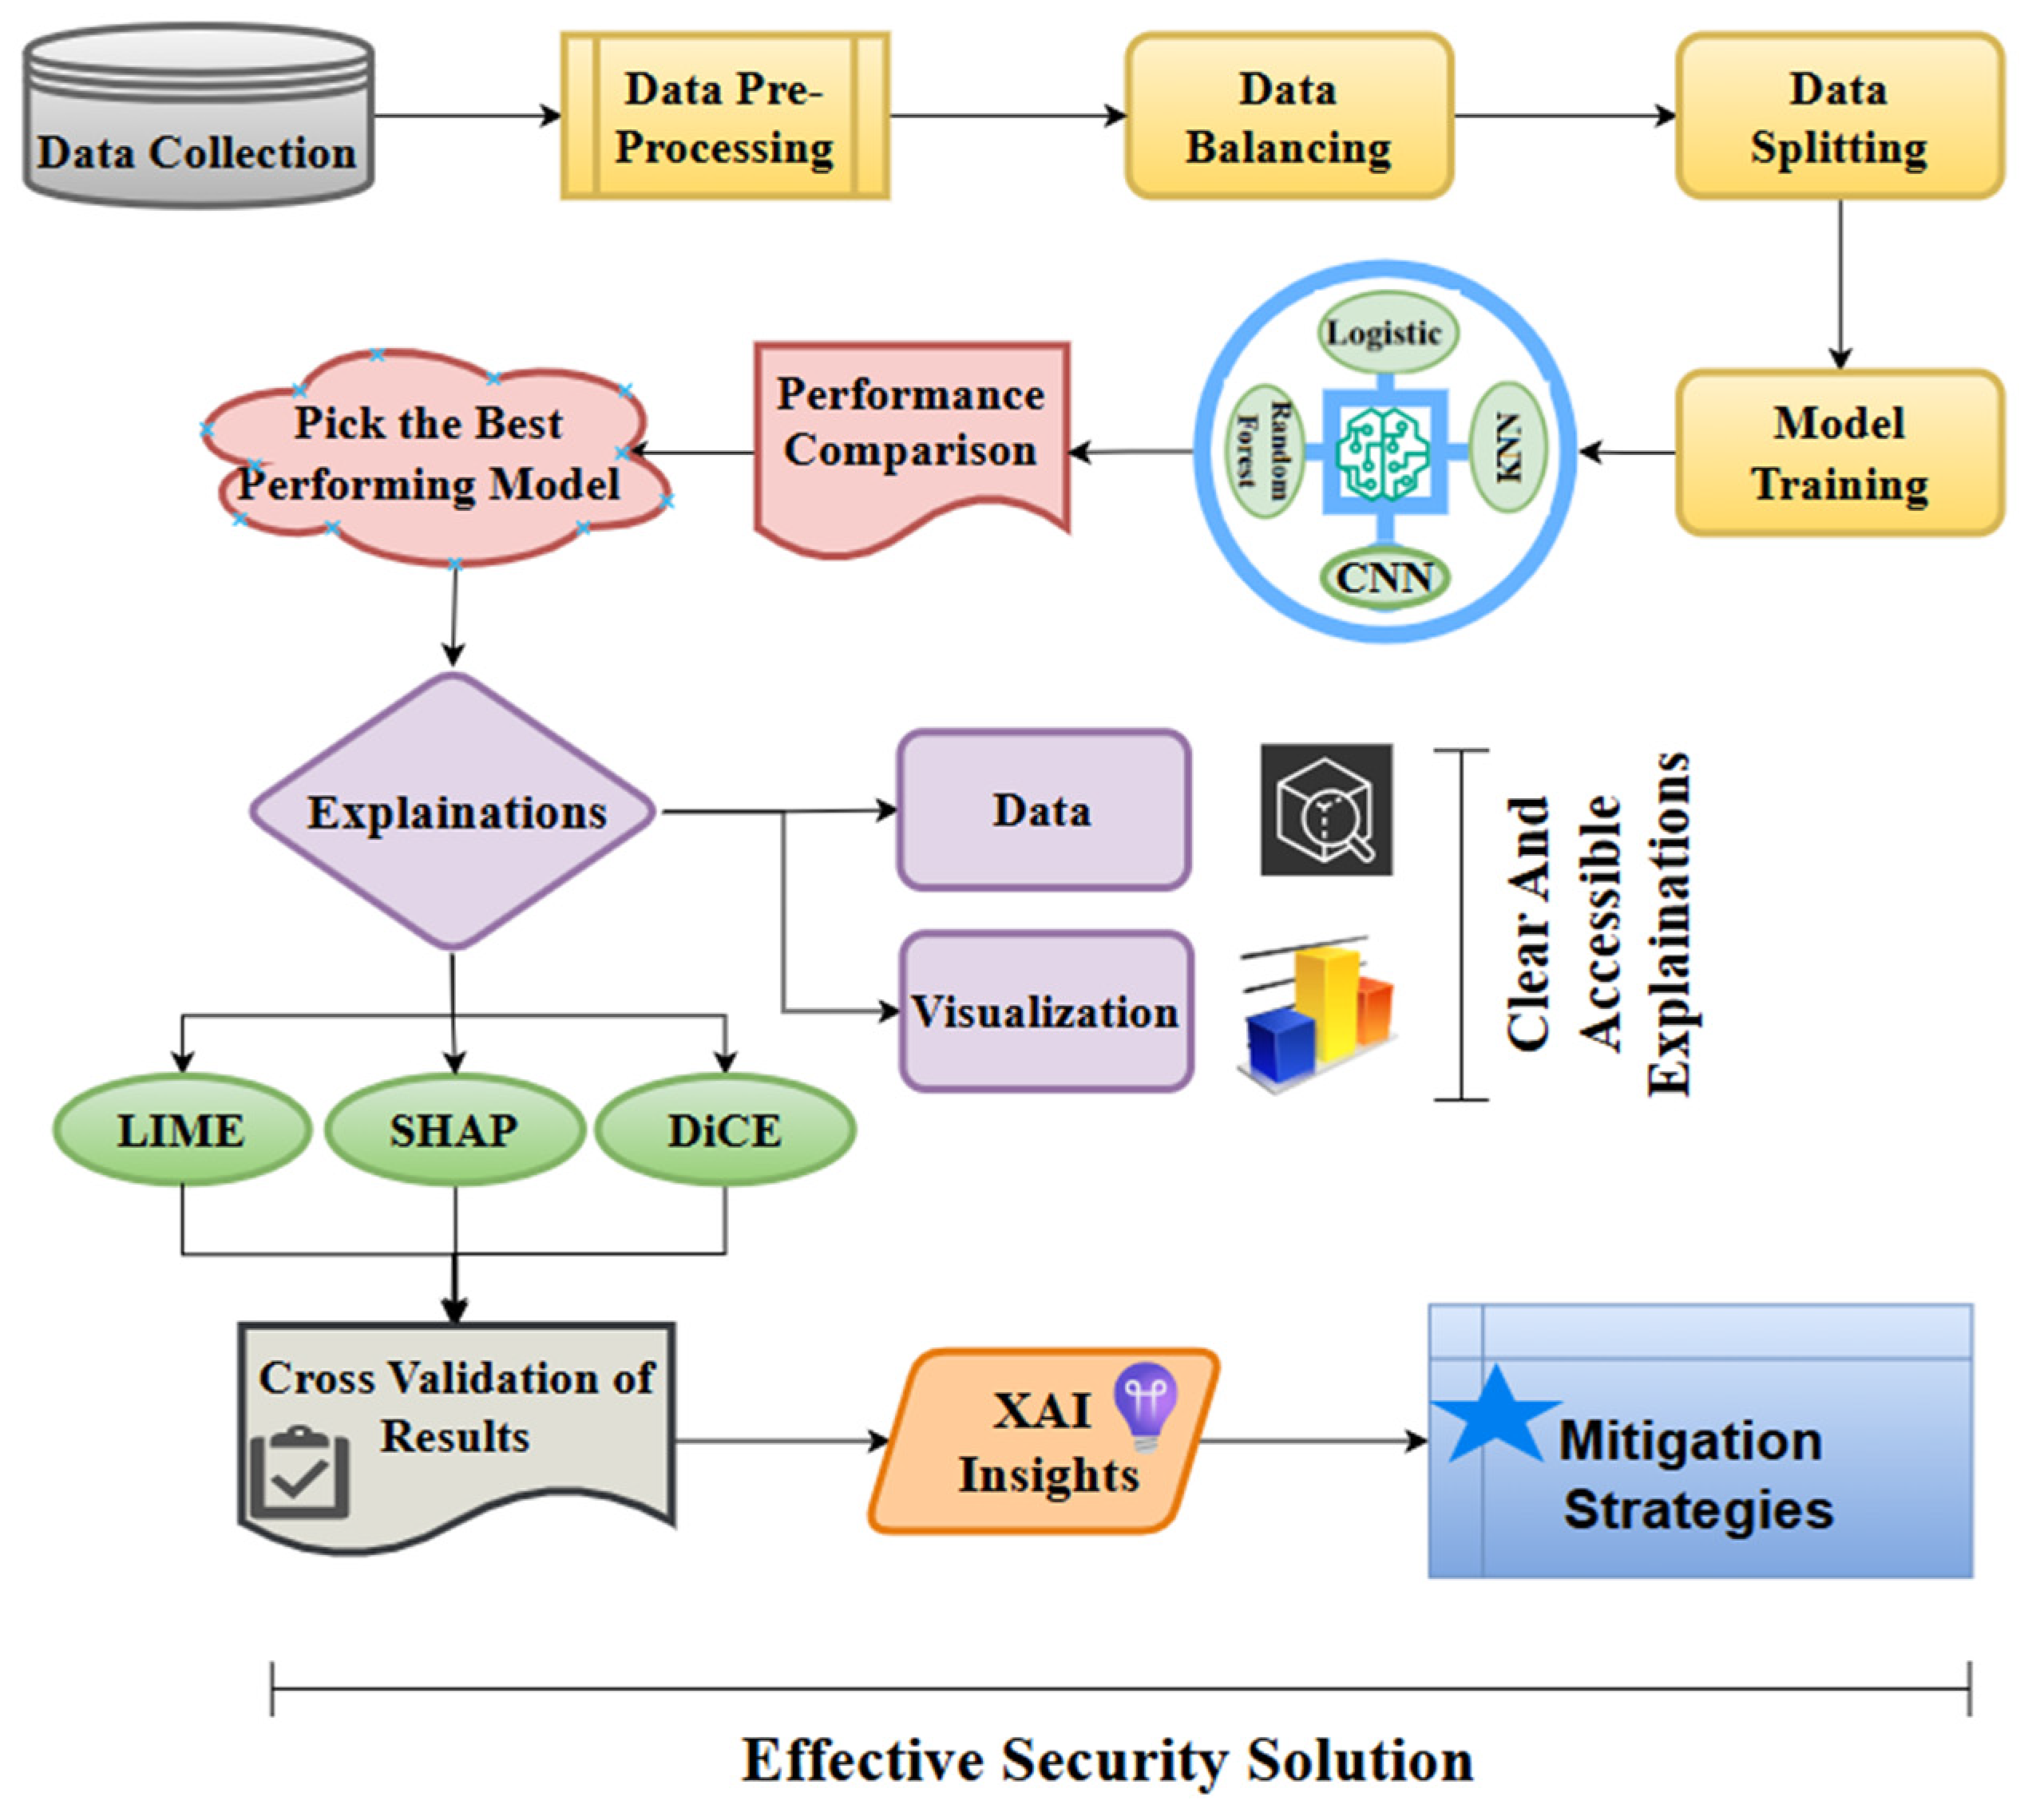
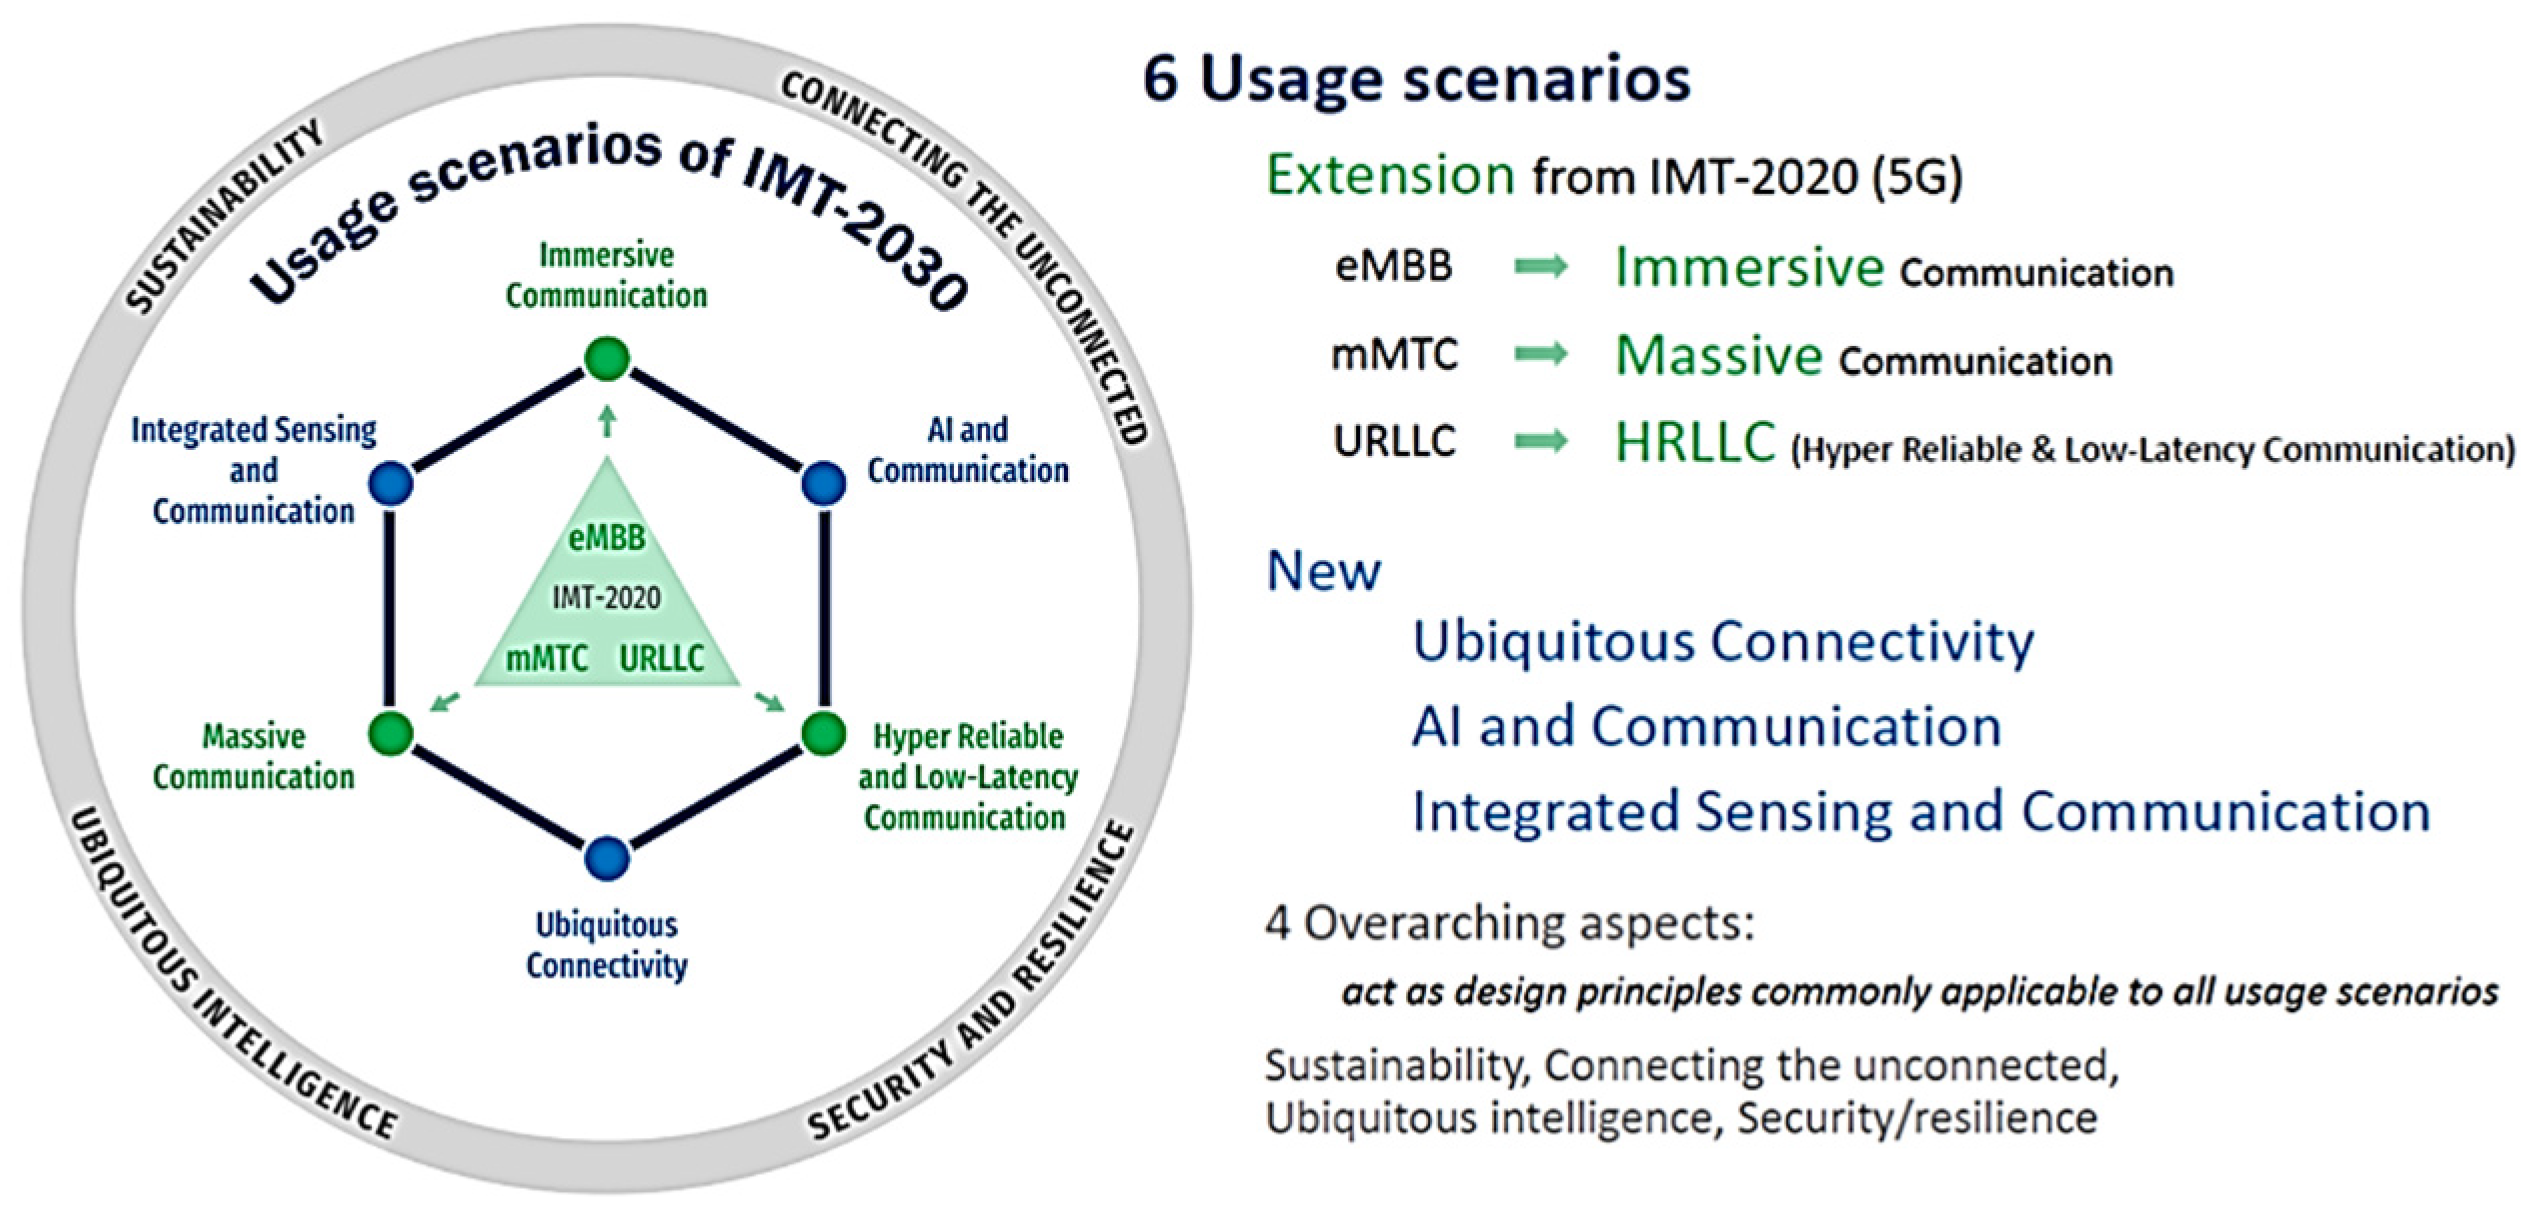
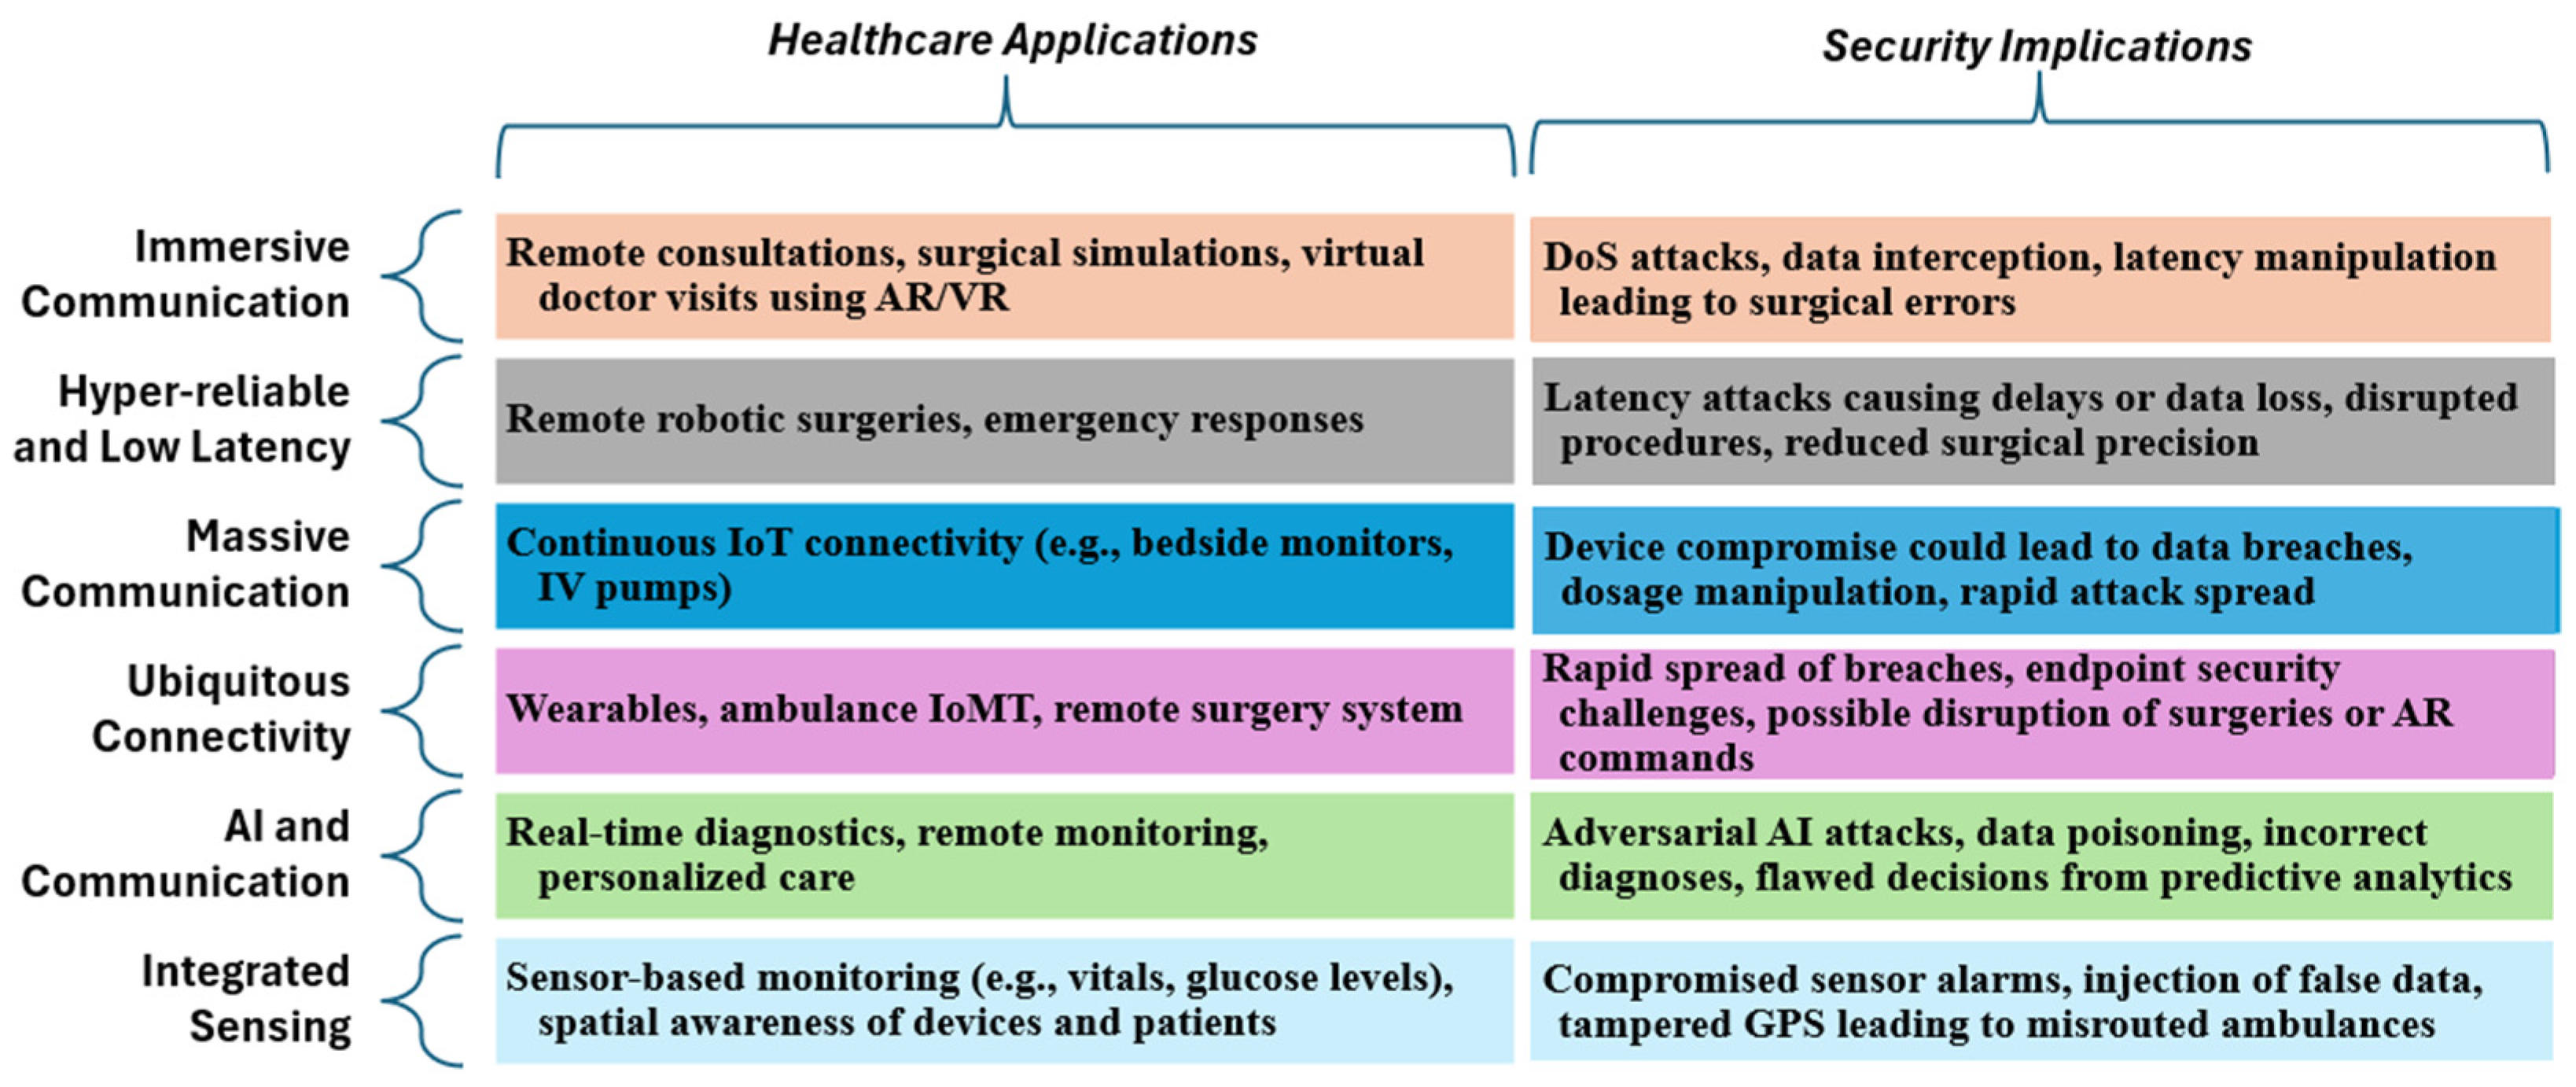
- Comprehensively mapping the emerging vulnerabilities of 6G usage scenarios within the healthcare domain, using the authoritative ITU-R IMT-2030 framework as a foundation.
- Leveraging and synthesizing SHAP, LIME, and DiCE to identify and interpret model behavior—uncovering the hidden patterns and feature sensitivities that expose critical security flaws in 6G-enabled IoMT environments.
- Cross-validating multiple XAI methods to assess the consistency and reliability of feature importance in model predictions.
- Aligning XAI insights with the specific needs and challenges of each 6G use case to identify relevant threats and performance issues.
- Proposing targeted mitigation strategies to address the unique vulnerabilities and requirements of each 6G usage scenario’s.
- Providing XAI-driven security enhancements to empower administrators with actionable insights and targeted security measures tailored to each 6G use case.
2. Review of Existing Research and Novel Contributions
2.1. Existing Research
2.2. Novel Contributions and the Proposd Approach
3. Emerging Security Vulnerabilities in IoMT-Driven 6G Healthcare Scenarios
4. Materials and Methods
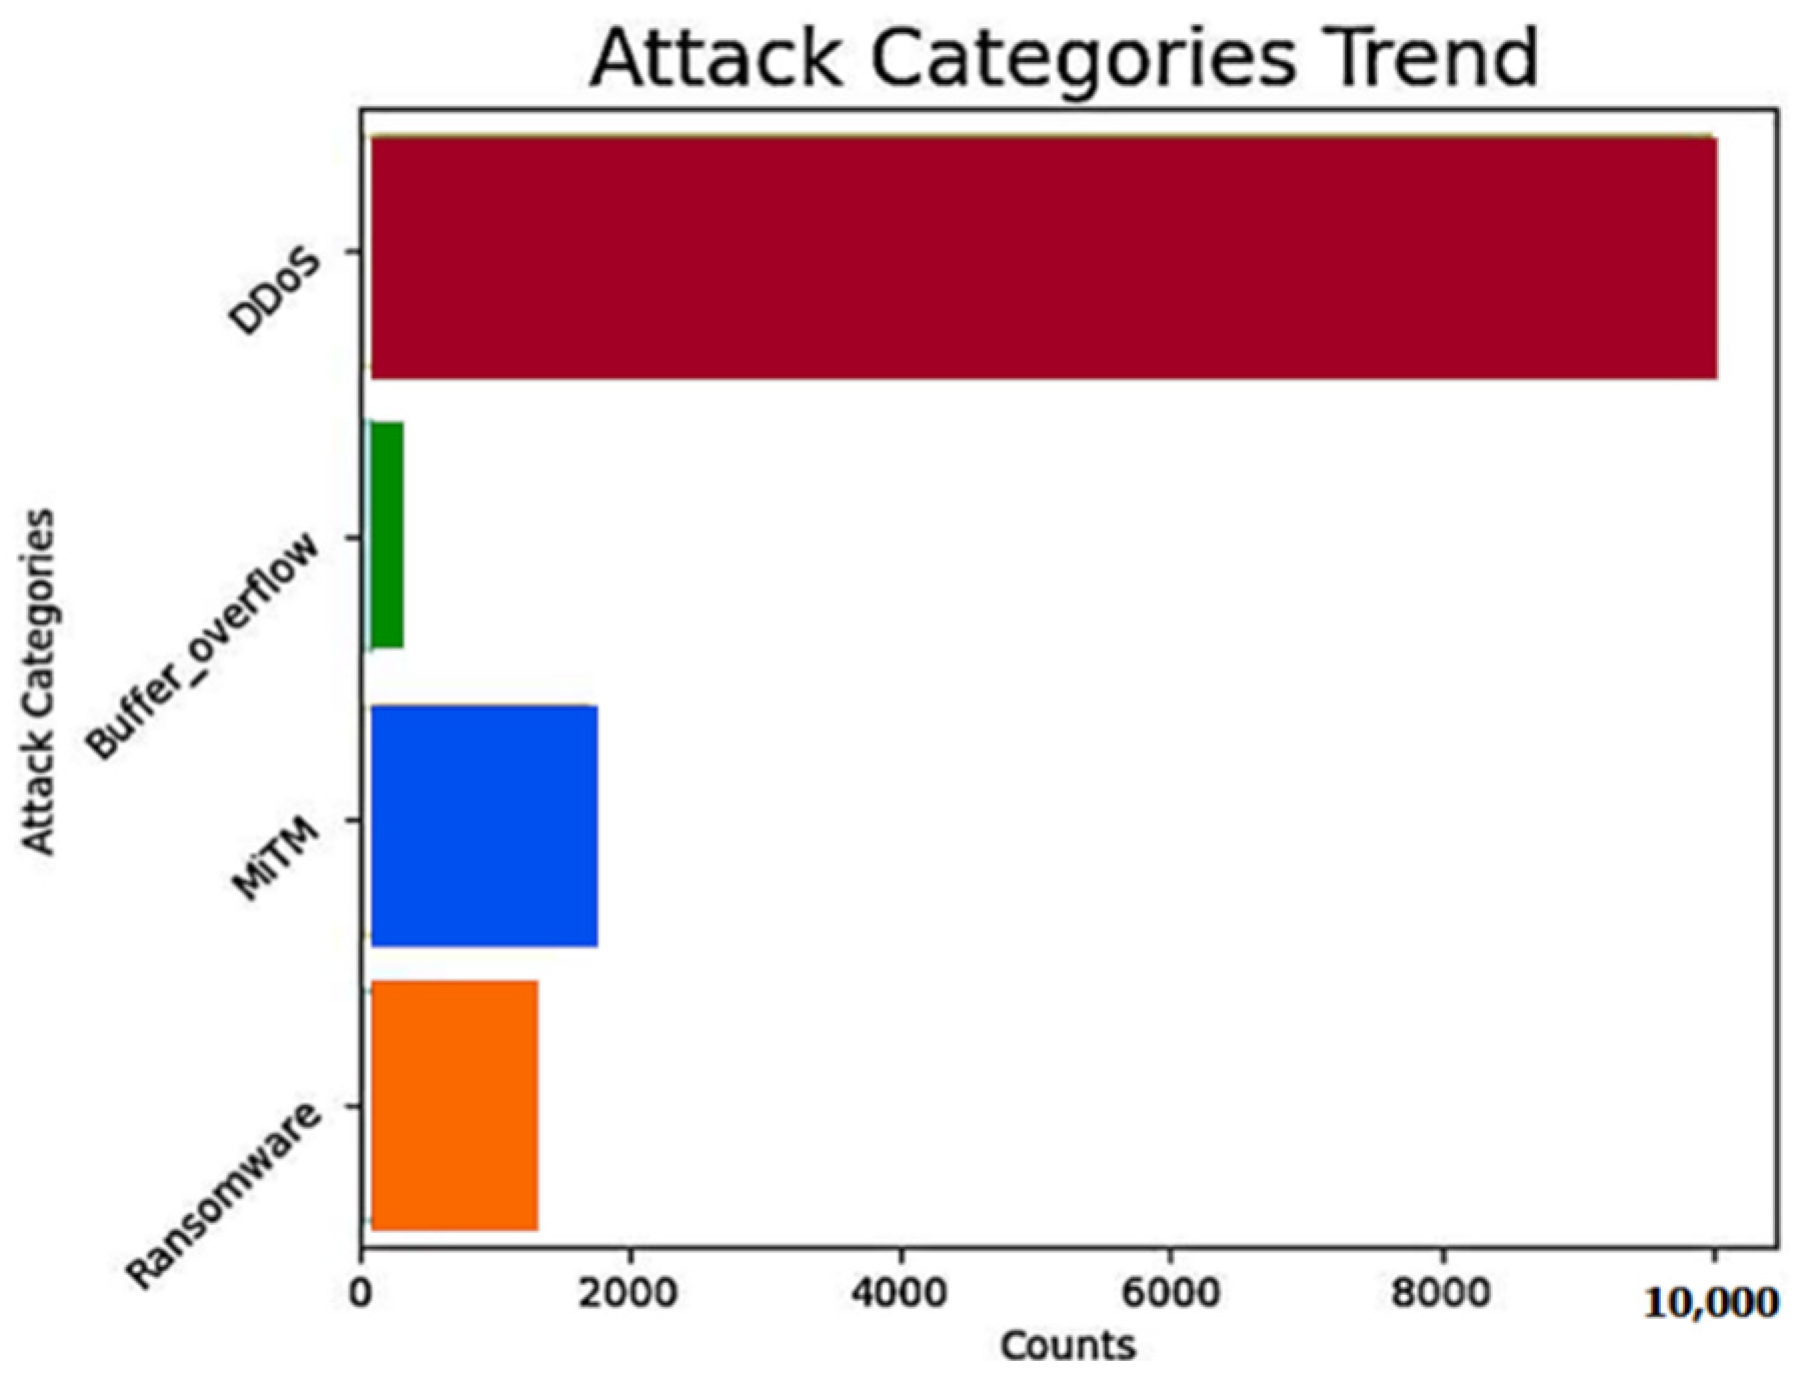
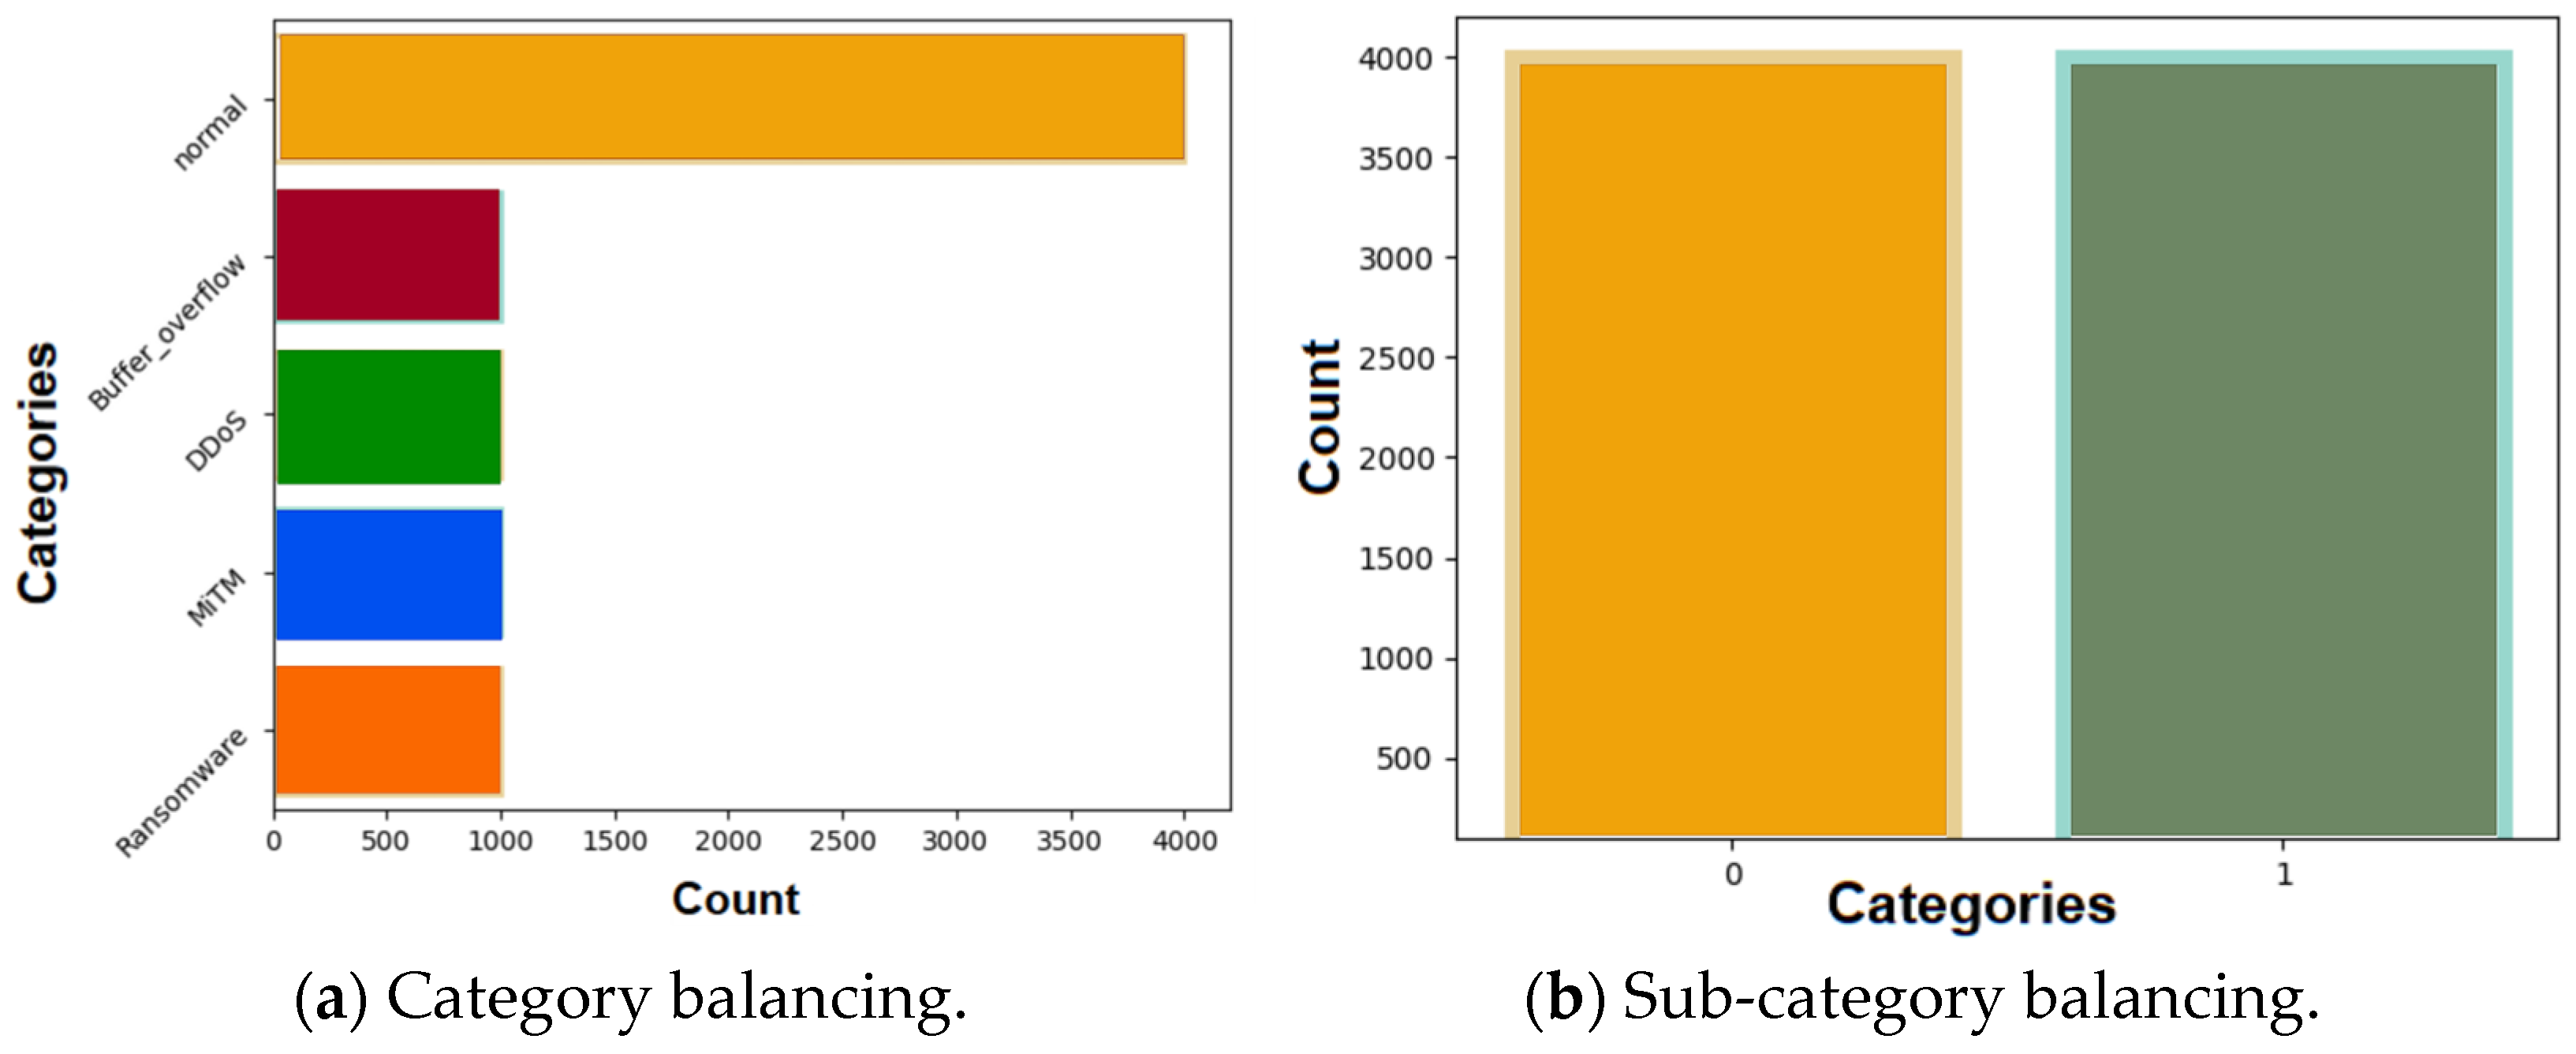
- Man-in-the-Middle (MiTM): This attack involves intercepting and potentially modifying communications between two parties, thereby enabling unauthorized access to sensitive information.
- Distributed Denial-of-Service (DDoS): In this type of attack, adversaries inundate systems with excessive traffic, depleting resources and resulting in service disruptions or complete outages.
- Ransomware: A form of malicious software that encrypts critical organizational data and demands a ransom for its decryption, leading to significant disruption of routine operations.
- Buffer overflow: This attack exploits vulnerabilities in memory management to inject and execute malicious code, which can compromise the integrity and security of the system.
5. Experiments and Results
5.1. Data PreProcessing and Splitting
5.2. Model Training
- Logistic Regression: The model is configured with random_state = 7 to ensure consistent results, max_iter = 5000 to allow sufficient iterations for convergence, solver = ‘lbfgs’ for efficient optimization using limited-memory BFGS, and class_weight = ‘balanced’ to automatically adjust for class imbalances in the dataset.
- CNN: The architecture consists of dense layers with 120, 80, 40, and 20 neurons, followed by a single-neuron output layer. It utilizes a batch size of 10 and the Adam optimizer for adaptive learning rate adjustments and is trained for 100 epochs to ensure convergence and minimize loss.
- Random Forest: The model uses n_estimators = 100 decision trees, with random_state = 42 sets to ensure the reproducibility of results across different runs by maintaining the same random state in the training process.
- KNN: The model is initialized with default hyperparameters, and random_state = 42 ensures consistent results in the training and evaluation process by controlling the randomization.
5.3. Model Selection for XAI Technique Application
5.4. Implementation of Explainable AI Techniques: SHAP, LIME, and DiCE
5.4.1. SHAP–Global Behavior Analysis
5.4.2. SHAP—Local Behavior Analysis
- Red indicates positive contributions (pushing prediction higher), increasing the likelihood of the predicted class.
- Blue represents negative contributions (pulling prediction lower), usually decreasing the likelihood of the predicted class, favoring the opposite prediction.
- The width of each bar reflects the magnitude of the feature’s influence, with wider bars indicating a stronger effect.
- It starts with the base value (average model output) and accumulates feature contributions to display the final prediction at the end.
- 1.
- SHAP Force Plot for Test Sample Record 1—‘Normal’ Traffic Prediction
- 2.
- SHAP Force Plot for Test Sample Record 2—‘Attack’ Traffic Prediction
- The actual target is labeled as “Attack”, meaning that in the dataset, this instance is truly an attack.
- The model’s prediction output (f(x) = 0.00) suggests that the model classified this instance as not an attack (likely normal or benign traffic).
- The cumulative effect of these features outweighs the benign contributions of others, leading the model to classify the prediction as an attack. For instance, high system resource usage (user, I/O wait time, and system-level processes) and interrupts (hardware and software) indicate a pattern of abnormal activity that is typical of an attack (e.g., DDoS, resource exhaustion, or other malicious behaviors).
5.4.3. LIME—Local Behavior Analysis
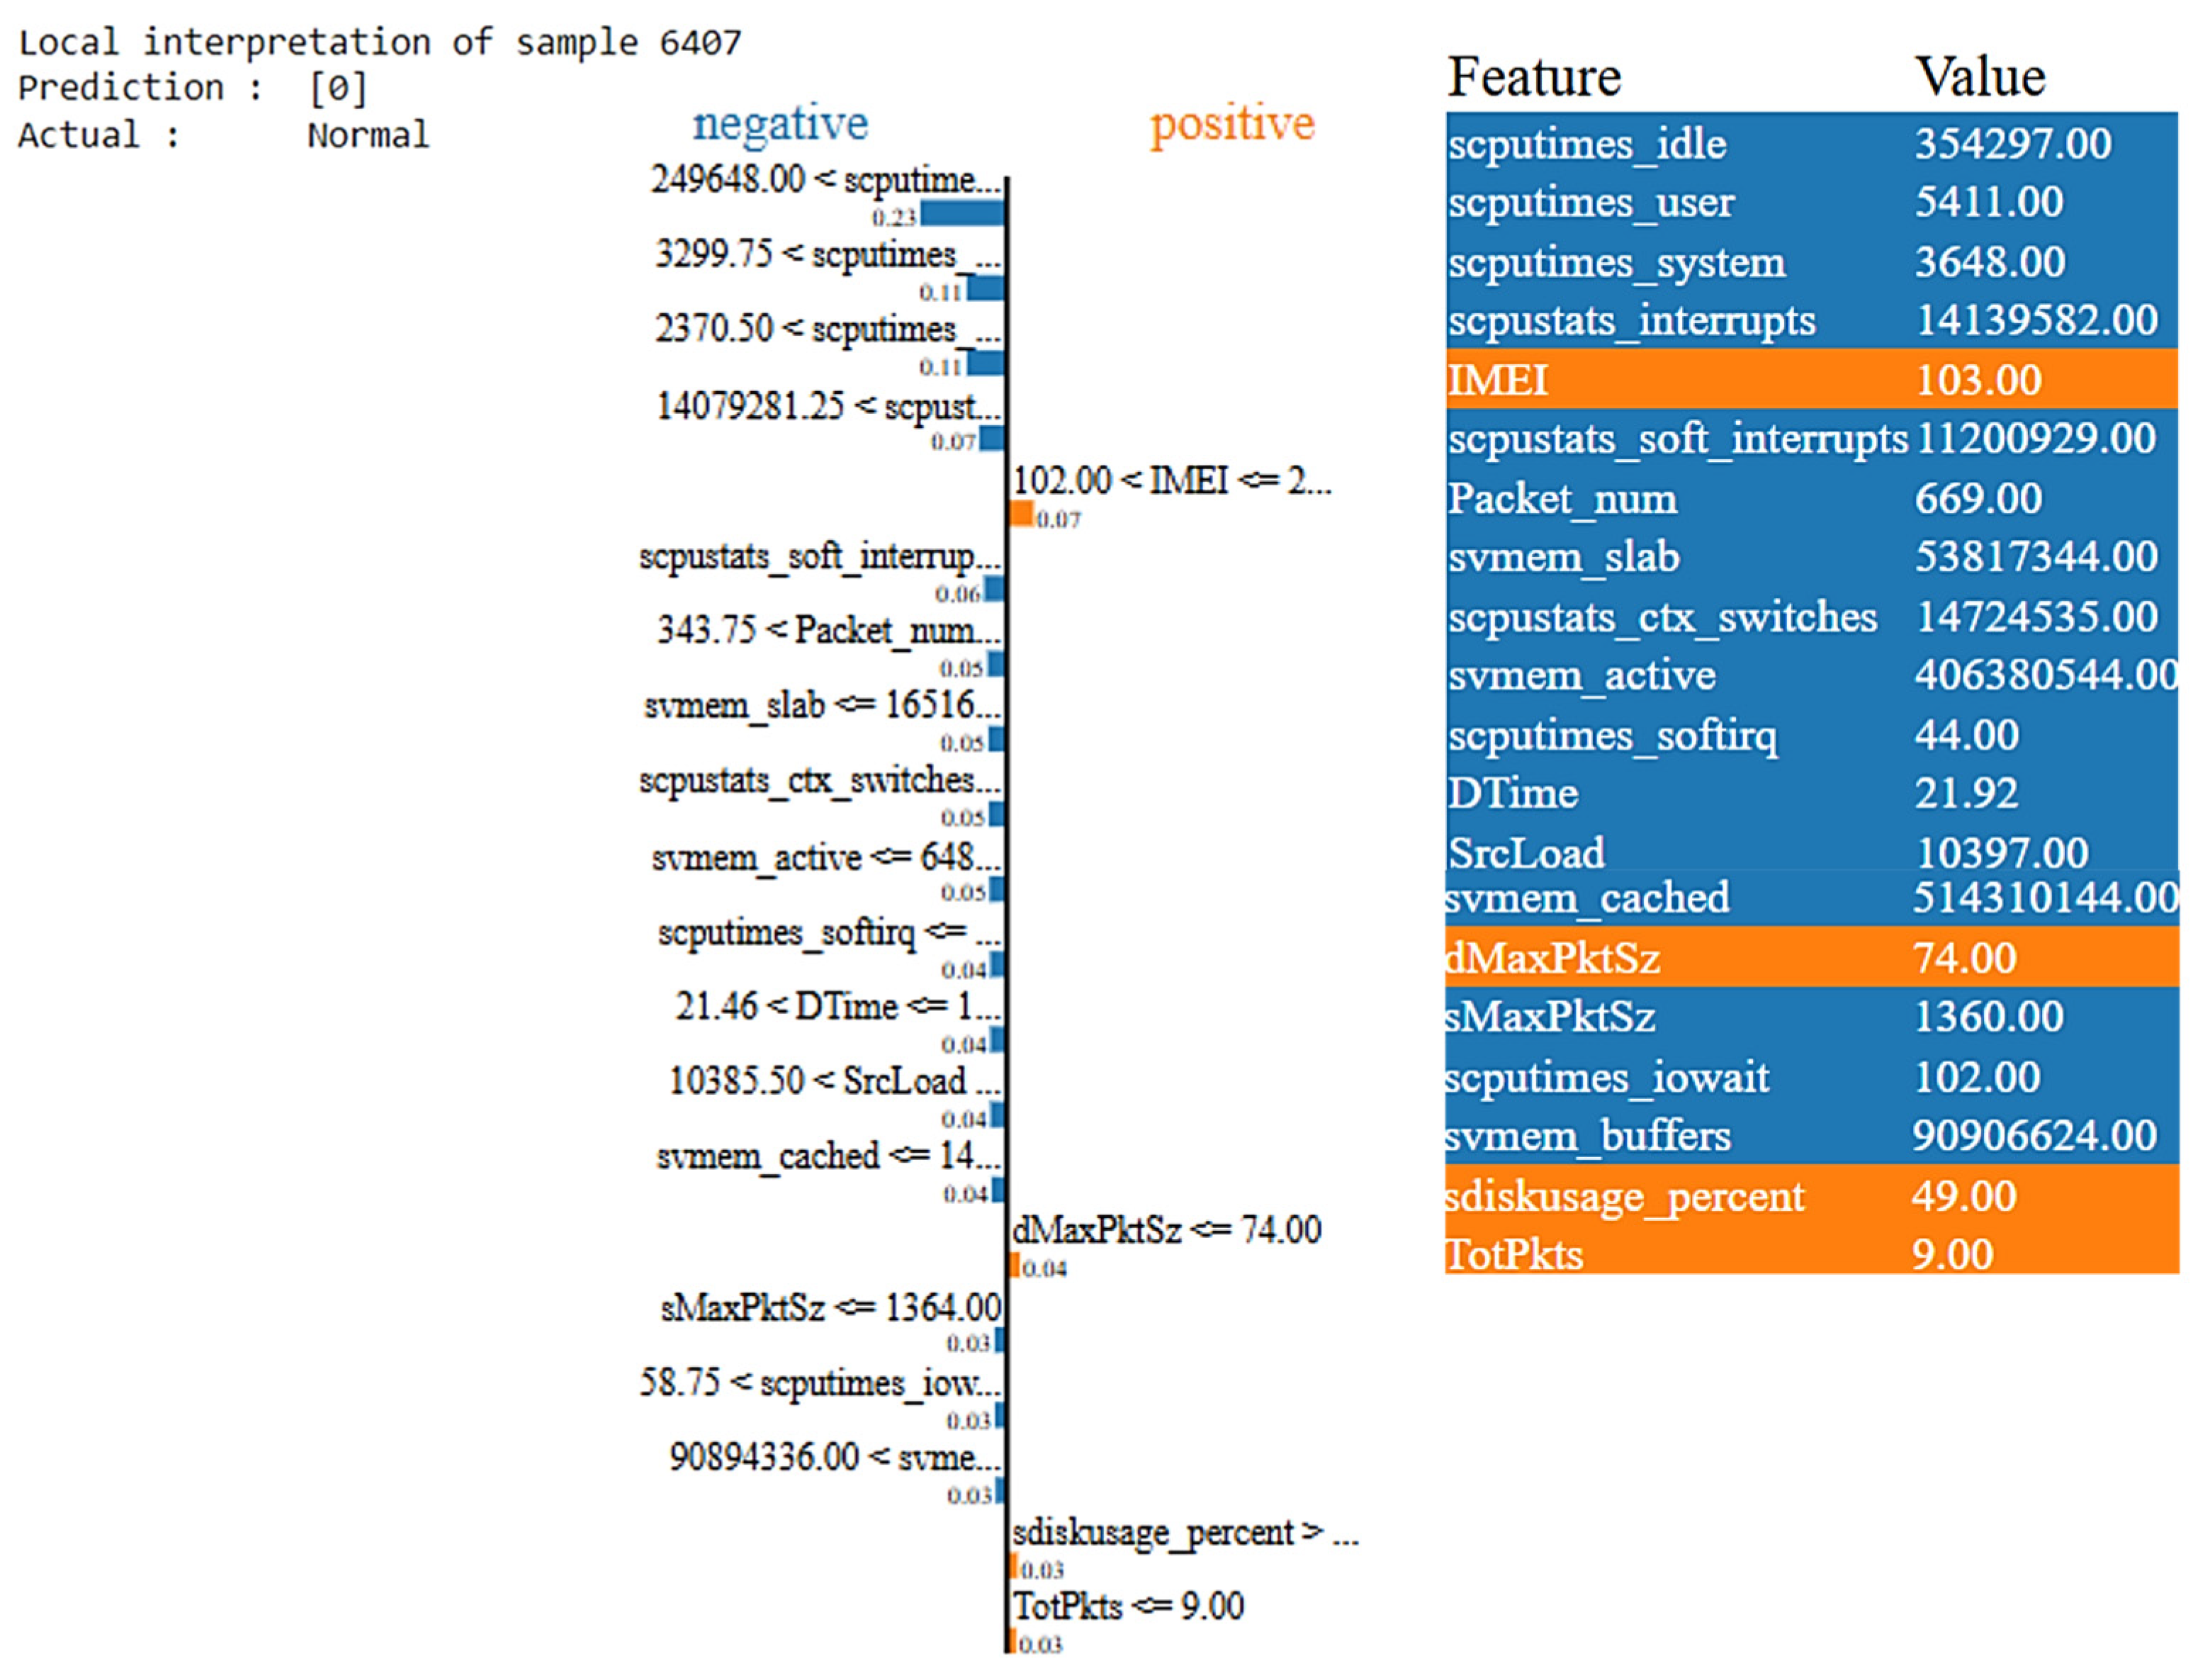
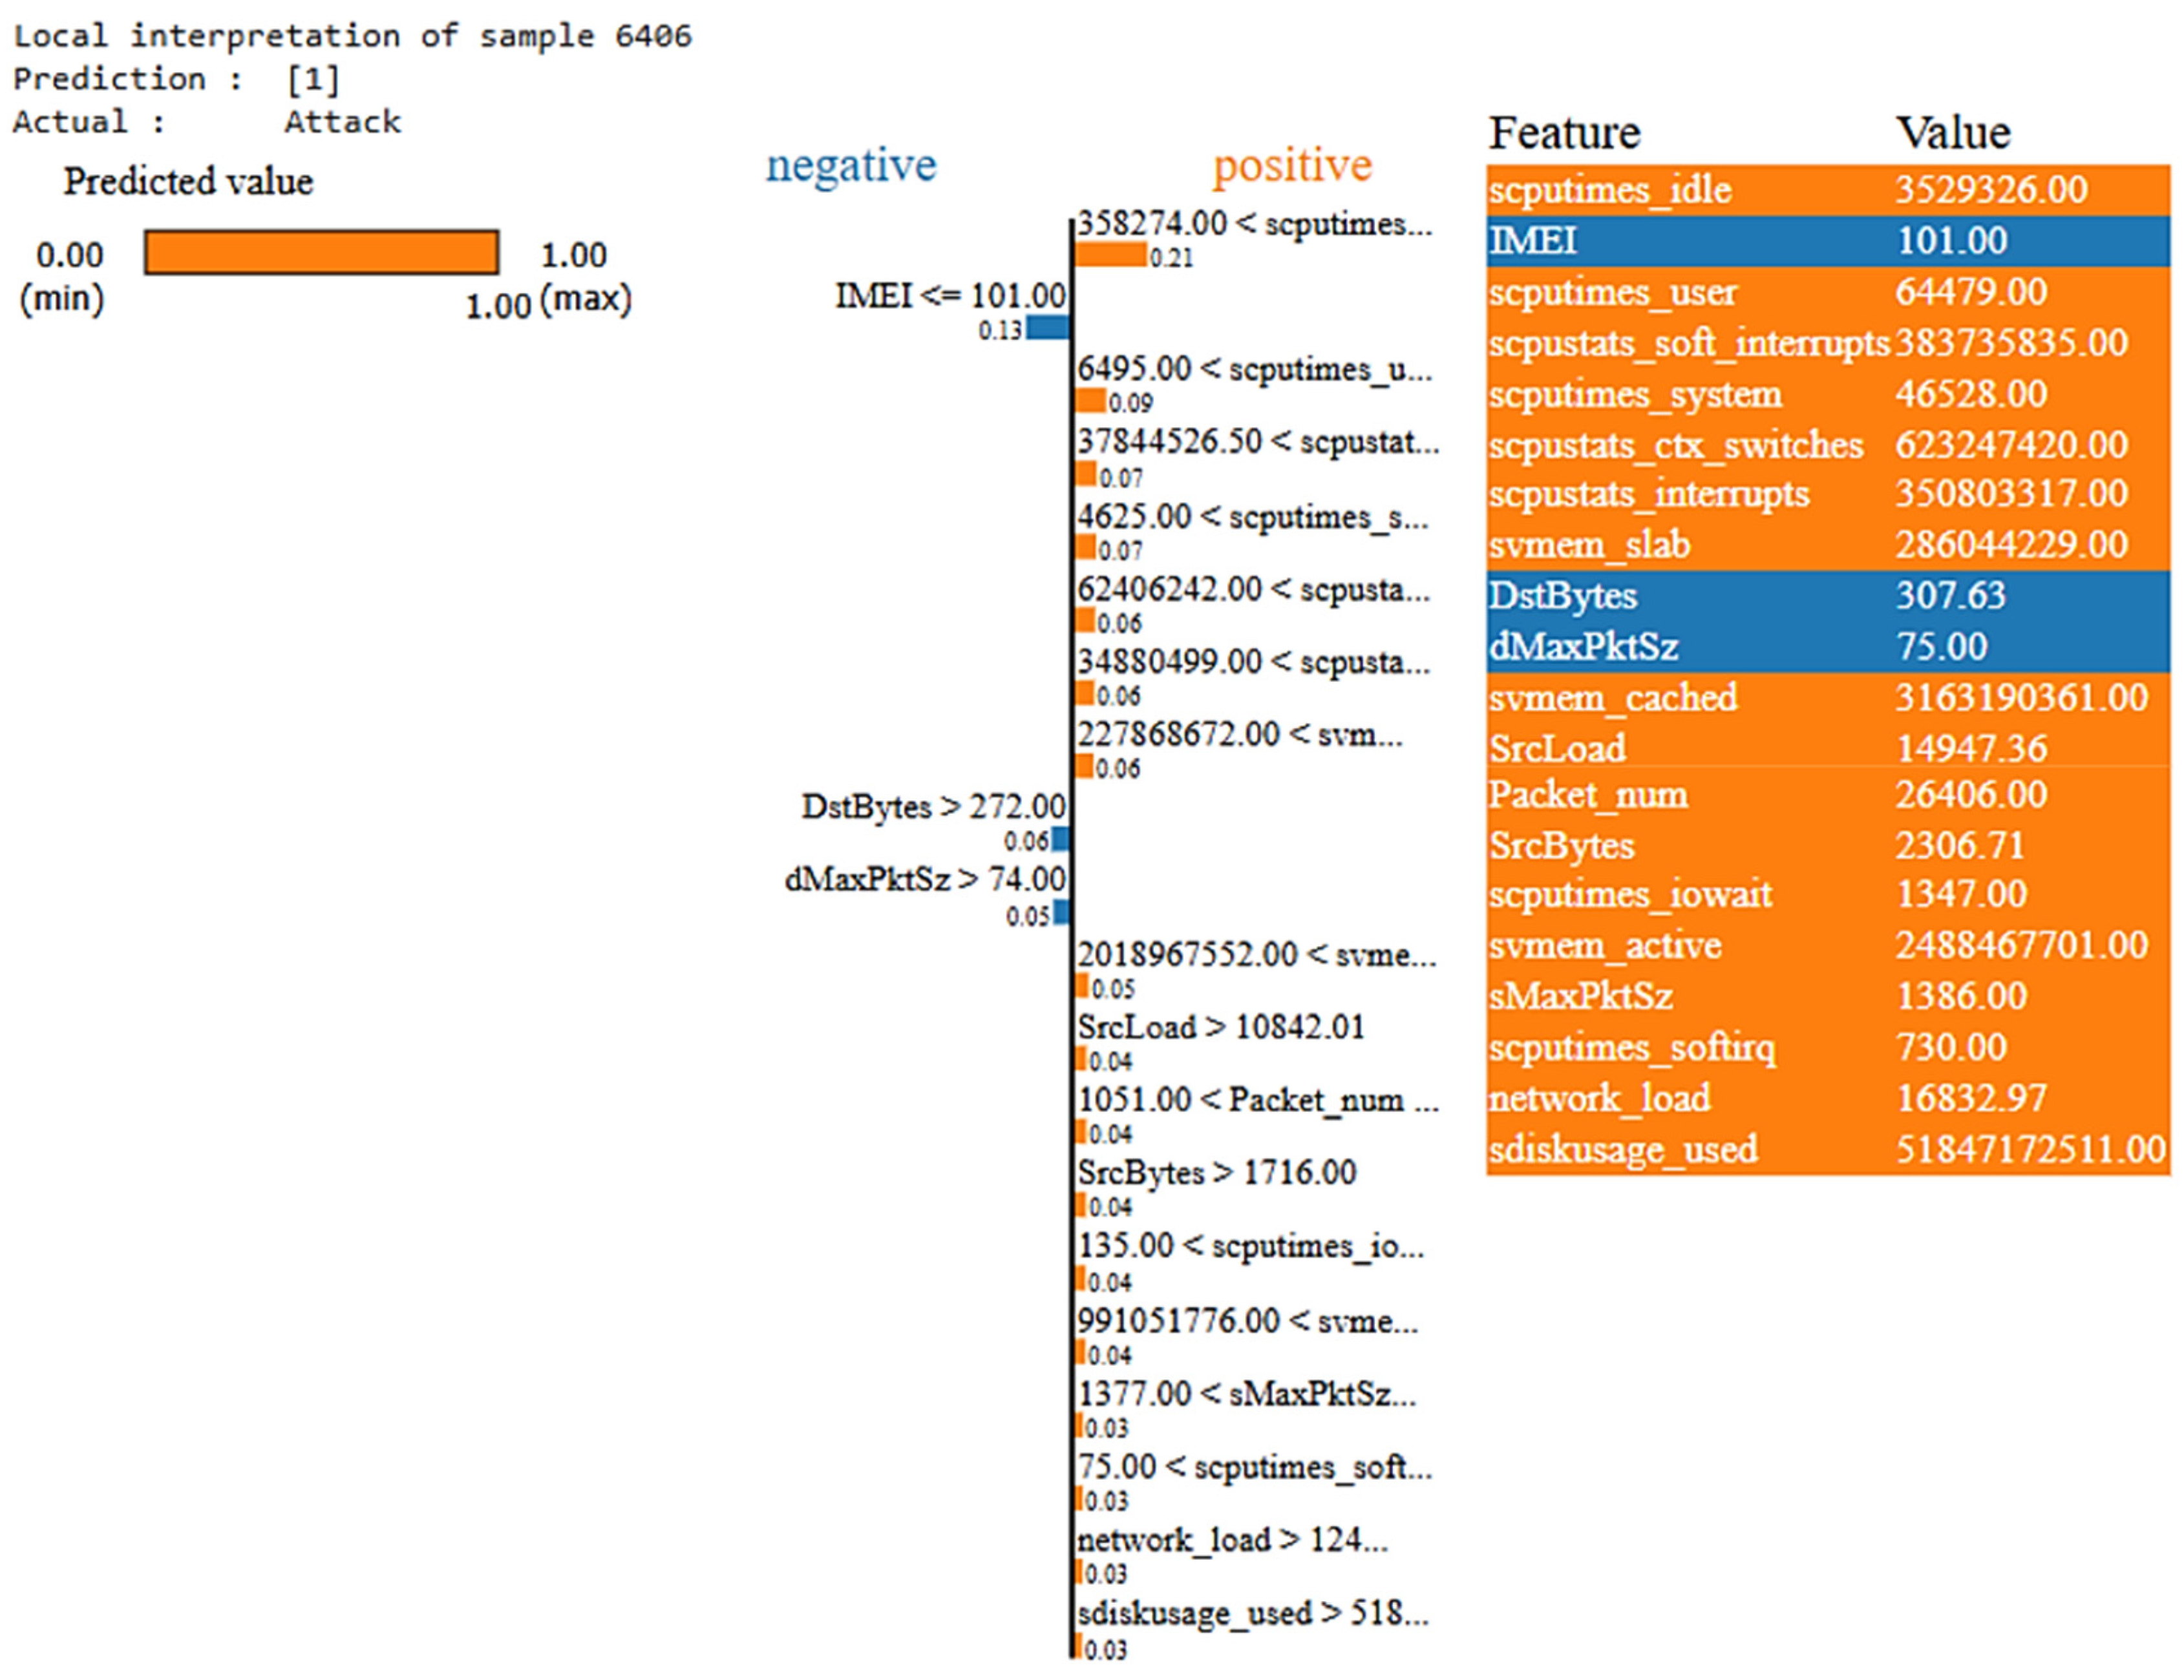
- The left shows the model’s predicted probability for the instance.
- The middle section shows key features: blue for benign (0), orange for attack (1). Bar length reflects feature impact, with longer bars indicating greater influence.
- The right section shows actual feature values. The features highlighted in blue contribute negatively to the prediction and the features highlighted in orange contribute positively to the prediction.
- 1.
- LIME Plot for Test Sample Record 1—‘Normal’ Traffic Prediction
- Although several features contribute negatively (blue) in the LIME plot, the prediction is still classified as “Normal” because the model evaluates the overall interactions of all features rather than assessing them individually.
- The positively contributing features (orange), such as dMaxPktSz, IMEI, and TotPkts, help to counterbalance the negative influences, leading to the final classification.
- 2.
- LIME Plot Test Sample Record 2—‘Attack’ Traffic Prediction
- The blue features (IMEI, DstBytes and dMaxPktSz) contribute slightly towards a benign classification, as they do not exhibit strong attack characteristics. Their presence slightly reduces the likelihood of an attack but does not override the dominant attack-related features.
- The orange features dominate the decision, reflecting the abnormal CPU, memory, network, and disk behaviors commonly associated with attacks.
5.4.4. DiCE—Local Behavior Analysis
- The combination of high traffic volume (SrcBytes, DstBytes), elevated system load (SrcLoad, DstLoad), and network instability (SrcJitter, DstJitter) indicates an anomalous network condition. These feature values typically suggest an ongoing attack, such as a DDoS attack, characterized by excessive data flow and network disruptions.
- The counterfactual examples state “normal” traffic due to significant reductions in traffic volume and jitter. Lower values for SrcBytes and DstBytes indicate typical network behavior with normal data flow, while the reduced SrcJitter and DstJitter suggest stable network conditions, which are characteristics of non-attack traffic patterns.
- Some values are marked with ‘-’, indicating that these features were not altered in the counterfactual examples.
6. Cross-Validation Results of XAI Methods
7. Mitigation Strategies in IoMT-Driven 6G Usage Scenarios
8. Conclusions
Author Contributions
Funding
Data Availability Statement
Conflicts of Interest
References
- Shen, Y.T.; Chen, L.; Yue, W.W.; Xu, H.X. Digital technology-based telemedicine for the COVID-19 pandemic. Front. Med. 2021, 8, 646506. [Google Scholar] [CrossRef] [PubMed]
- Osama, M. Internet of medical things and healthcare 4.0: Trends, requirements, challenges, and research directions. Sensors 2023, 23, 7435. [Google Scholar] [CrossRef] [PubMed]
- Yaqoob, T.; Abbas, H.; Atiquzzaman, M. Security vulnerabilities, attacks, countermeasures, and regulations of networked medical devices—A review. IEEE Comst 2019, 21, 3723–3768. [Google Scholar] [CrossRef]
- Framework and Overall Objectives of the Future Development of IMT for 2030 and Beyond. Available online: https://www.itu.int/dms_pubrec/itu-r/rec/m/R-REC-M.2160-0-202311-I%21%21PDF-E.pdf (accessed on 11 July 2024).
- Ghubaish, A.; Yang, Z.; Jain, R. HDRL-IDS: A Hybrid Deep Reinforcement Learning Intrusion Detection System for Enhancing the Security of Medical Applications in 5G Networks. In Proceedings of the 2024 International Conference on Smart Applications, Communications and Networking (SmartNets), Harrisonburg/Washington, DC, USA, 28–30 May 2024; pp. 1–6. [Google Scholar]
- Hossain, M.S.; Muhammad, G.; Guizani, N. Explainable AI and mass surveillance system-based healthcare framework to combat COVID-I9 like pandemics. IEEE Netw. 2020, 34, 126–132. [Google Scholar] [CrossRef]
- Dave, D.; Naik, H.; Singhal, S.; Patel, P. Explainable ai meets healthcare: A study on heart disease dataset. arXiv 2020, arXiv:2011.03195. [Google Scholar]
- Bárcena, J.L.C.; Ducange, P.; Marcelloni, F.; Nardini, G.; Noferi, A.; Renda, A.; Ruffini, F.; Schiavo, A.; Stea, G.; Virdis, A. Enabling federated learning of explainable AI models within beyond-5G/6G networks. Comput. Commun. 2023, 210, 356–375. [Google Scholar] [CrossRef]
- Mohanty, S.D.; Lekan, D.; Jenkins, M.; Manda, P. Machine learning for predicting readmission risk among the frail: Explainable AI for healthcare. Patterns 2022, 3, 100395. [Google Scholar] [CrossRef]
- Nguyen, V.L.; Lin, P.C.; Cheng, B.C.; Hwang, R.H.; Lin, Y.D. Security and privacy for 6G: A survey on prospective technologies and challenges. IEEE Commun. Surv. Tutor. 2021, 23, 2384–2428. [Google Scholar] [CrossRef]
- Kaur, N.; Gupta, L. Securing the 6G–IoT Environment: A Framework for Enhancing Transparency in Artificial Intelligence Decision-Making Through Explainable Artificial Intelligence. Sensors 2025, 25, 854. [Google Scholar] [CrossRef]
- Musa, A. History of security and privacy in wireless communication systems: Open research issues and future directions. In Security and Privacy Schemes for Dense 6G Wireless Communication Networks; The Institution of Engineering and Technology: Stevenage, UK, 2023; pp. 31–60. [Google Scholar] [CrossRef]
- Xiao, Y.; Jia, Y.; Liu, C.; Cheng, X.; Yu, J.; Lv, W. Edge computing security: State of the art and challenges. Proc. IEEE 2019, 107, 1608–1631. [Google Scholar] [CrossRef]
- Deng, J.; Han, R.; Mishra, S. Decorrelating wireless sensor network traffic to inhibit traffic analysis attacks. Pervasive Mob. Comput. 2006, 2, 159–186. [Google Scholar] [CrossRef]
- Wang, S.; Parsons, M.; Stone-McLean, J.; Rogers, P.; Boyd, S.; Hoover, K.; Meruvia-Pastor, O.; Gong, M.; Smith, A. Augmented reality as a telemedicine platform for remote procedural training. Sensors 2017, 17, 2294. [Google Scholar] [CrossRef]
- Newaz, A.I.; Sikder, A.K.; Rahman, M.A.; Uluagac, A.S. A survey on security and privacy issues in modern healthcare systems: Attacks and defenses. ACM Trans. Comput. Healthc. 2021, 2, 27. [Google Scholar] [CrossRef]
- Lundberg, S.M.; Lee, S.I. A unified approach to interpreting model predictions. Adv. Neural Inf. Process. Systems 2017, 30. [Google Scholar]
- Ribeiro, M.T.; Singh, S.; Guestrin, C. “Why should i trust you?” Explaining the predictions of any classifier. In Proceedings of the 22nd ACM SIGKDD International Conference on Knowledge Discovery and Data Mining, San Francisco, CA, USA, 13–17 August 2016; pp. 1135–1144. [Google Scholar]
- Mothilal, R.K.; Sharma, A.; Tan, C. Explaining machine learning classifiers through diverse counterfactual explanations. In Proceedings of the 2020 Conference on Fairness, Accountability, and Transparency, Barcelona, Spain, 27–29 January 2020; pp. 607–617. [Google Scholar]
- Amin, A.; Hasan, K.; Zein-Sabatto, S.; Chimba, D.; Ahmed, I.; Islam, T. An explainable ai framework for artificial intelligence of medical things. In Proceedings of the IEEE Globecom Workshops (GC Wkshps), Kuala Lumpur, Malaysia, 4–8 December 2023; pp. 2097–2102. [Google Scholar]
- Sai, S.; Sharma, S.; Chamola, V. Explainable ai-empowered neuromorphic computing framework for consumer healthcare. IEEE Trans. Consum. Electron. 2024. [Google Scholar] [CrossRef]
- Gürbüz, E.; Turgut, O.; Kök, I. Explainable ai-based malicious traffic detection and monitoring system in next-gen iot healthcare. In Proceedings of the 2023 International Conference on Smart Applications, Communications and Networking (SmartNets), Istanbul, Türkiye, 25–27 July 2023; pp. 1–6. [Google Scholar]
- Alani, M.M.; Mashatan, A.; Miri, A. Explainable Ensemble-Based Detection of Cyber Attacks on Internet of Medical Things. In Proceedings of the 2023 IEEE Intl Conf on Dependable, Autonomic and Secure Computing, Intl Conf on Pervasive Intelligence and Computing, Intl Conf on Cloud and Big Data Computing, Intl Conf on Cyber Science and Technology Congress (DASC/PiCom/CBDCom/CyberSciTech), Abu Dhabi, United Arab Emirates, 13–17 November 2023; pp. 0609–0614. [Google Scholar]
- Alani, M.M.; Mashatan, A.; Miri, A. XMeDNN: An Explainable Deep Neural Network System for Intrusion Detection in Internet of Medical Things. In Proceedings of the 9th International Conference on Information Systems Security and Privacy (ICISSP 2023), Lisbon, Portugal, 22–24 February 2023; pp. 144–151. [Google Scholar]
- Raza, A.; Tran, K.P.; Koehl, L.; Li, S. Designing ECG monitoring healthcare system with federated transfer learning and explainable AI. Knowl.-Based Syst. 2022, 236, 107763. [Google Scholar] [CrossRef]
- Chawla, N.V.; Bowyer, K.W.; Hall, L.O.; Kegelmeyer, W.P. SMOTE: Synthetic minority over-sampling technique. J. Artif. Intell. Res. 2002, 16, 321–357. [Google Scholar] [CrossRef]
- Nasralla, M.M.; Khattak, S.B.A.; Rehman, I.U.; Iqbal, M. Exploring the role of 6G technology in enhancing quality of experience for m-health multimedia applications: A comprehensive survey. Sensors 2023, 23, 5882. [Google Scholar] [CrossRef]
- Wood, A.D.; Stankovic, J.A. A taxonomy for denial-of-service attacks in wireless sensor networks. In Handbook of Sensor Networks: Compact Wireless and Wired Sensing Systems; CRC Press: Boca Raton, FL, USA, 2004; Volume 4, pp. 739–763. [Google Scholar]
- Kaur, N.; Gupta, L. An approach to enhance iot security in 6g networks through explainable ai. arXiv 2024, arXiv:2410.05310. [Google Scholar]
- Kaur, N.; Gupta, L. Enhancing IoT Security in 6G Environment With Transparent AI: Leveraging XGBoost, SHAP and LIME. In Proceedings of the 2024 IEEE 10th NetSoft, Saint Louis, MO, USA, 24–28 June 2024; pp. 180–184. [Google Scholar]
- Cramer, J.S. The Origins of Logistic Regression; Social Science Research Network: Rochester, NY, USA, 2002. [Google Scholar]
- Biau, G.; Scornet, E. A random forest guided tour. Test 2016, 25, 197–227. [Google Scholar] [CrossRef]
- Peterson, L.E. K-nearest neighbor. Scholarpedia 2009, 4, 1883. [Google Scholar] [CrossRef]
- Wu, J. Introduction to convolutional neural networks. Natl. Key Lab Nov. Softw. Technol. Nanjing Univ. China 2017, 5, 495. [Google Scholar]
- Pandas. Dataframe. Available online: https://pandas.pydata.org/docs/reference/api/pandas.DataFrame.html (accessed on 2 February 2024).
- Permutation Importance vs. Random Forest Feature Importance (MDI). Available online: https://scikit-learn.org/stable/auto_examples/inspection/plot_permutation_importance.html#sphx-glr-auto-examples-inspection-plot-permutation-importance-py (accessed on 26 March 2024).
- Ramamoorthi, V. Exploring AI-Driven Cloud-Edge Orchestration for IoT Applications. Int. J. Sci. Res. Comput. Sci. Eng. Inf. Technol. 2023, 9, 385–393. [Google Scholar] [CrossRef]
- Adele, G.; Borah, A.; Paranjothi, A.; Khan, M.S.; Poulkov, V.K. A Comprehensive Systematic Review of Blockchain-based Intrusion Detection Systems. In Proceedings of the 2024 IEEE World AI IoT Congress (AIIoT), Melbourne, Australia, 24–26 July 2024; pp. 605–611. [Google Scholar]
- El-Hajj, M. Enhancing Communication Networks in the New Era with Artificial Intelligence: Techniques, Applications, and Future Directions. Network 2025, 5, 1. [Google Scholar] [CrossRef]
- Paulsen, S.; Uhl, T.; Nowicki, K. Influence of the jitter buffer on the quality of service VoIP. In Proceedings of the 2011 3rd International Congress on Ultra Modern Telecommunications and Control Systems and Workshops (ICUMT), Budapest, Hungary, 5–7 October 2011; pp. 1–5. [Google Scholar]
- Sharma, H. Behavioral Analytics and Zero Trust. Int. J. Comput. Eng. Technol. 2021, 12, 63–84. [Google Scholar]
- Quattrociocchi, W.; Caldarelli, G.; Scala, A.A. Self-healing networks: Redundancy and structure. PLoS ONE 2014, 9, e87986. [Google Scholar] [CrossRef]




| Class Types | Total Count (Before SMOTE) | Class Instance (Before SMOTE) | Total Count (After SMOTE) | Class Instance (After SMOTE) |
|---|---|---|---|---|
| Normal | 132,884 | 132,884 | 4000 | 4000 |
| DOS | 9971 | 12,339 | 1000 | 4000 |
| MiTM | 1672 | 1000 | ||
| Ransomware | 528 | 1000 | ||
| Buffer_Overflow | 68 | 1000 |
| Model | Accuracy | Precision | Recall | F1-Score |
|---|---|---|---|---|
| Logistic Regression | 98.37% | 0.984 | 0.983 | 0.983 |
| K-Nearest Neighbor | 98.87% | 0.988 | 0.988 | 0.988 |
| Random Forest | 99.85% | 0.998 | 0.998 | 0.998 |
| CNN | 75.25% | 0.752 | 0.752 | 0.752 |
| Features | Full Form | Interpretation | Reason for ‘Normal’ Prediction |
|---|---|---|---|
| scputimes_ idle | CPU Idle Time | It indicates high idle time where resources are not being excessively consumed by malicious processes or attack-related activities. | Positive contribution indicates that the system is not stressed and can handle additional tasks smoothly. No indication of failure or abnormal behavior. |
| scputimes_ user | CPU Time in User Mode | Suggests that the system’s CPU is being used by typical user-level applications or processes. | Positive contribution reflects standard user activity, without being overloaded by the malicious or abnormal processes. |
| stats_soft_ interrupts | CPU Software Interrupts Count | In a normal scenario, software interrupts are expected to be at a reasonable level, as they reflect routine system activities. | Positive contribution indicates that the system is processing normal, expected software interrupts without any significant anomaly or malicious activity. |
| scputimes_ iowait | CPU Time Waiting for I/O Operations | I/O wait time is typical, reflecting normal operations waiting for data. | Positive contribution suggests expected I/O wait time, indicating typical system conditions without anomalies. |
| scputimes_ system | CPU Time in System Mode | Represents system CPU time, a normal indicator of workload. Higher values suggest expected system usage. | Positive contribution aligns with normal system activity and suggests that CPU is actively managing core tasks, typical in a normal state handling routine processing, resource management, and device I/O. |
| scpustats_ interrupts | CPU Hardware Interrupts Count | The number of interrupts suggests normal system activity with adequate handling of processes. | Positive contribution indicates the system is operating under expected conditions, with no significant interruptions or failures. |
| scpustats_ ctx_ switches | CPU Context Switches Count | High number of context switches indicates normal multitasking or process handling. | Positive contribution indicates regular system activity and resource allocation, reinforcing a stable system state. |
| Features | Full Form | Interpretation | Reason for ‘Attack’ Prediction |
|---|---|---|---|
| scputimes_ idle | CPU Idle Time | The idle CPU time typ-ically suggests benign behavior, but its impact is not enough to over-ride the attack predic-tion. | The idle CPU time alone is not sus-picious, but the combination with high scpustats_interrupts (sug-gesting system disruption) and scputimes_user (indicating us-er-level activity) points to a possible attack. |
| scputimes_ user | CPU Time in User Mode | High CPU time spent on user processes suggests active user behavior but is not dominant enough to change the classification. | scputimes_user suggests active user processes, which, along with scputimes_iowait (I/O wait times, indicating delays) and svmem_slab (high memory usage), points to abnormal system behavior typical of attacks. |
| svmem_ slab | Kernel Slab Memory Usage | High memory usage by kernel objects can signal system stress, possibly due to attack activity. | High svmem_slab indicates memory manipulation, which, combined with high scpustats_interrupts (potential overload), suggests that the system is under attack, trying to overwhelm the resources. |
| scputimes_ iowait | CPU Time Waiting for I/O Operations | High I/O wait time suggests delays, potentially from attack-related activities. | Elevated scputimes_iowait indicates delayed I/O operations, possibly due to attack-induced resource contention. Combined with high scpustats_interrupts (system disruptions), this signals a denial-of-service or resource exhaustion attack. |
| scputimes_ system | CPU Time in System Mode | High CPU time for system tasks could signal attack-related resource manipulation. | scputimes_system represents background system tasks, and in combination with abnormal interrupts and elevated system-level resource consumption, suggests a coordinated attack manipulating system resources. |
| scpustats_ interrupts | CPU Hardware Interrupts Count | High interrupt counts can indicate heavy traffic or attack-induced interruptions. | High interrupt counts, combined with increased svmem_slab (high memory usage) and CPU processes like scputimes_user, point to network or system disruptions, often associated with DDoS or other attack strategies. |
| scpustats_ soft_ interrupts | CPU Software Interrupts Count | High number of software interrupts suggest network activity or potential attack. | High scpustats_soft_interrupts with high number of hardware interrupts (scpustats_interrupts) and high system process usage (scputimes_system) suggest an ongoing attack, such as DDoS or resource manipulation. |
| Features | Full Form | Interpretation | Reason for ‘Normal’ Prediction |
|---|---|---|---|
| IMEI | International Mobile Equipment Identity | A valid IMEI typically suggests legitimate device activity. No signs of spoofed or unauthorized device access. | Combined with normal packet sizes and disk usage, it reinforces legitimate network behavior. |
| dMaxPktSz | Maximum Packet Size in Flow | Network packet sizes are within the standard limits (74.00). | Along with low total packets and stable CPU usage, it confirms an absence of data tampering, data exfiltration, and packet flooding. |
| sdiskusage_ percent | Percentage of Disk Space Used | Normal disk usage, with no indications of disk exhaustion or malicious activities like disk space manipulation or attacks. | The disk usage at 49% is moderate, indicating no signs of resource exhaustion, which is consistent with normal system operation. |
| TotPkts | Total Packets Transmitted | Regular packet flow and no signs of a Distributed Denial-of-Service (DDoS) or heavy packet flooding attack. | With only nine packets transmitted, this indicates minimal network traffic, reinforcing the normal classification. |
| scputimes_ idle | CPU Idle Time | High idle time (354297.00) suggests that the system may be underutilized or have background processes like cryptojacking. | The features such as low packet traffic (TotPkts = 9) and moderate disk usage (e.g., sdiskusage_percent = 49%) dominate the normal classification. |
| scputimes_ user | CPU Time in User Mode | CPU time spent on user-level processes can signal abnormal activities or background attacks. | While the user CPU time is slightly higher (5411.00), it does not overwhelm the system, and the overall network behavior remains consistent with normal operations, with no abnormal spikes in traffic or disk usage. |
| scputimes_ system | CPU Time in System Mode | Increased system CPU time could point to resource manipulation during an attack. | The increase in system-level tasks is moderate (3648.00), and combined with stable traffic and disk usage, it does not indicate a full-fledged attack, supporting the normal classification. |
| scpustats_ interrupts | CPU Hardware Interrupts Count | A high number of interrupts (14139582.00) might indicate network stress or DDoS activity. | Although a high number of interrupts suggests some system load, the low packet transmission (nine total packets) confirms no DDoS activity or overwhelming network traffic, supporting a normal prediction. |
| scpustats_ softinterrupts | CPU Software Interrupts Count | A high number of software interrupts could indicate attack-induced disruptions like DDoS. | Despite the number of software interrupts being high (Value = 11200929.00), the network’s low packet count (TotPkts = 9) and stable disk usage suggest that the system is not under attack, thus maintaining the normal prediction. |
| Packet_ num | Total Number of Packets in Flow | Elevated packet count might suggest malicious activity like cryptojacking. | The 669 packets could indicate some background activity, but the system does not show signs of attack. The normal disk usage and low packet size (dMaxPktSz = 74) reinforce normal network behavior. |
| svmem_ slab | Kernel Slab Memory Usage | High kernel slab memory usage (53817344.00) could indicate memory leaks or excessive resource consumption, triggering significant memory anomalies like buffer overflows. | Despite the higher memory usage, the overall system behavior remains normal due to low traffic volume (TotPkts = 9) and moderate disk usage (sdiskusage_percent = 49%). |
| scpustats_ ctx_ switches | CPU Context Switches Count | High context switching (14724535.00) may indicate excessive task switching due to an attack. | Even with high context switching, other features like normal packet flow and moderate disk usage override the potential attack indicators, leading to the final normal prediction. |
| svmem_ active | Active RAM Usage | High RAM usage could indicate background malicious activities consuming system resources. | Though active RAM usage is high (Value = 406380544.00), the system shows low traffic (TotPkts = 9) and moderate disk usage (sdiskusage_percent = 49%), confirming that the behavior is typical for a regular system not under attack. |
| scputimes_ softirq | CPU Time Spent Handling Software Interrupts | Increased soft IRQ processing may point to a DDoS or other overload-based attack. | While the soft IRQ time is slightly higher (Value = 44.00), the system’s low packet count and normal disk usage (sdiskusage_percent = 49%) maintain a normal classification despite the slight indication of an attack. |
| DTime | Flow Duration (Seconds) | Extended flow duration could suggest slow exfiltration or DoS activities. | Even though the flow duration is higher (Value = 21.92), the low traffic (TotPkts = 9) and moderate system resource usage confirm that there is no attack, supporting the normal classification. |
| SrcLoad | Source Device Load | High source device load (Value = 10397.00) indicates the signs of excessive processing or stress typically associated with attack scenarios. | Although the source device load is high, the low packet transmission and normal disk usage reinforce the overall network stability, leading to the normal prediction. |
| svmem_ cached | Cached Memory Usage | High cached memory usage could indicate hidden attacks like cache poisoning or excessive resource hoarding. | The system remains stable with low packet flow (TotPkts = 9) and moderate disk usage (sdiskusage_percent = 49%), confirming that the system is not under attack. |
| sMaxPktSz | Maximum Packet Size Sent | Standard packet size suggests typical network traffic without evasion tactics. | The normal packet size (Value = 1360.00) aligns with expected network behavior and does not indicate any attack-related manipulation, confirming the normal classification. |
| scputimes_ iowait | CPU Time Waiting for I/O Operations | Increased I/O wait time could be indicative of delays due to attacks like DoS. | A low I/O wait time (Value = 102.00) suggests that disk operations are not experiencing delays, reinforcing that the system is not under excessive load from attack-driven I/O processes. |
| svmem_ buffers | Buffered Memory Usage | High buffered memory usage (Value = 90906624.00) might suggest resource exhaustion or buffer overflow attacks. | Despite higher buffered memory usage, the system’s low packet transmission (TotPkts = 9) and moderate disk usage (sdiskusage_percent = 49%) confirm no attack, reinforcing the normal classification. |
| Feature | Full Form | Interpretation | Reason for ‘Attack’ Prediction |
|---|---|---|---|
| IMEI | International Mobile Equipment Identity | A valid IMEI typically suggests legitimate device activity, reinforcing the normal prediction. | Despite the benign suggestion from the IMEI, other features like high CPU interrupts (350803317), high memory usage (2488467701), and high packet number (26406) dominate, pushing the prediction towards attack. |
| DstBytes | Destination Bytes | A moderate number of destination bytes suggests typical network behavior. | While DstBytes = 307.63 contributes slightly to the benign prediction, a high number of CPU interrupts (350803317) and high memory usage (2488467701) override this, resulting in an attack classification. |
| dMaxPktSz | Maximum Packet Size in Flow | Packet size within standard limits suggests no data exfiltration or packet flooding, contributing to a benign classification. | Despite dMaxPktSz = 75 indicating normal packet size, other features like a high number of CPU interrupts (350803317) and high system memory usage (2488467701) contribute more heavily, leading to an attack prediction. |
| scputimes_ idle | CPU Idle Time | High idle time suggests that the system may be underutilized, with potential background processes like cryptojacking. | scputimes_idle = 3529326 indicates idle CPU time, but a high number of CPU interrupts (350803317) and context switches (623247420) and high memory usage (2488467701) suggest attack-related activity, leading to an attack classification. |
| scputimes_ user | CPU Time in User Mode | Increased CPU time in user mode could indicate background attack activities, such as cryptojacking. | scputimes_user = 64479 suggests background activities but combined with a high number of CPU interrupts (350803317) and high memory usage (2488467701), this leads to an attack classification. |
| scpustats_ soft_ interrupts | CPU Software Interrupts Count | High number of software interrupts could indicate attack-related disruptions such as DDoS. | scpustats_soft_interrupts = 383735835 suggests attack-related disruptions, reinforcing the attack classification along with a high number of CPU interrupts and high memory usage. |
| scputimes_ system | CPU Time in System Mode | High CPU usage for system-level tasks might indicate resource manipulation, often seen in attack scenarios. | scputimes_system = 46528 shows moderate CPU usage, but a high number of CPU interrupts (350803317) and memory anomalies push the final prediction towards attack. |
| scpustats_ ctx_ switches | CPU Context Switches Count | High context switch counts suggest system instability and resource contention, often linked to attack scenarios. | scpustats_ctx_switches = 623247420 shows abnormal context switching, contributing to the attack prediction when combined with a high number of interrupts and high memory usage. |
| scpustats_ interrupts | CPU Hardware Interrupts Count | A high number of hardware interrupts indicate network stress or DDoS activity, strongly contributing to the attack classification. | scpustats_interrupts = 350803317 indicates a high number of interrupts, which, when combined with other orange features like memory usage (2488467701), strongly signal an attack. |
| svmem_ slab | Kernel Slab Memory Usage | High kernel slab memory usage could indicate potential memory manipulation during attacks. | svmem_slab = 286044229 indicates high kernel slab memory usage, contributing to attack prediction when combined with other high resource usage features. |
| svmem_ cached | Cached Memory Usage | Cached memory represents data temporarily stored for quick access. A decrease in cached memory can indicate abnormal system activity. | svmem_cached = 3163190361 shows that the cached memory is relatively normal, but paired with high memory usage in other areas (svmem_active = 2488467701) and a high number of CPU interrupts (350803317), this indicates a system under heavy stress, possibly from an attack such as DDoS or data exfiltration. |
| SrcLoad | Source Device Load | High source load indicates that the source device is under heavy resource usage, often tied to attack scenarios. | SrcLoad = 14947.36 indicates that the source device is under heavy load. Combined with a high number of CPU interrupts (350803317) and high memory usage (2488467701), this contributes to the classification of the situation as an attack. |
| Packet_ num | Total Number of Packets in Flow | Elevated packet count might suggest background malicious activities like cryptojacking. | Packet_num = 26406 suggests higher packet flow, while a high number of CPU interrupts (350803317) and memory anomalies (2488467701) cause the final prediction to be an attack. |
| SrcBytes | Source Bytes | The number of bytes sent from the source device. An increase suggests high traffic, which could indicate a potential attack. | SrcBytes = 2306.71 suggests a moderate amount of traffic; however, it is overshadowed by other factors like a high number of CPU interrupts (350803317) and memory anomalies (2488467701), suggesting an attack. |
| scputimes_ iowait | CPU Time Waiting for I/O Operations | High I/O wait time can suggest system delays or bottlenecks, often indicative of attack-related activities. | scputimes_iowait = 1347 shows a moderate I/O wait time, but when combined with a high number of CPU interrupts (350803317) and high system memory usage (2488467701), it reinforces the attack prediction. |
| svmem_ active | Active RAM Usage | High active memory usage indicates excessive resource consumption, likely due to malicious activity. | svmem_active = 2488467701 shows high memory usage, signaling a potential attack, reinforced by other features like a high number of CPU interrupts (350803317). |
| sMaxPktSz | Maximum Packet Size Sent | The maximum size of network packets. Large packets might indicate a denial-of-service attack or abnormal network activity. | sMaxPktSz = 1386 indicates large packet sizes, to overwhelm network resources. Combined with a high CPU number of interrupts (350803317) and high memory usage (2488467701), this points to network stress and a potential data flooding attack, reinforcing the classification of an attack. |
| scputimes_ softirq | CPU Time Spent Handling Software Interrupts | High soft IRQ processing could be a sign of a DDoS or other attack-related disruptions. | scputimes_softirq = 730 suggests an elevated level of CPU time spent handling software interrupts. When combined with a high number of CPU interrupts (350803317), high memory usage (2488467701), and network load (16832.97), it strongly suggests that the system is under attack, pushing the final prediction towards attack. |
| network_ load | Network Load | High network load suggests unusual traffic patterns, commonly seen in attacks. | network_load = 16832.97 indicates high network traffic, reinforcing the attack classification when combined with other abnormal features. |
| sdiskusage_ used | Percentage of Disk Space Used | High disk usage may indicate resource exhaustion, often used in attack strategies. | sdiskusage_used = 51847172511 shows abnormal disk usage, which, combined with a high number of CPU interrupts (350803317), points to an attack. |
| Features | Full Form | Value | Reason for Attack Prediction |
|---|---|---|---|
| SrcBytes | Source Bytes | 2306.7 | High number, possibly indicating abnormal data sent from the source, suggesting a DoS attack or data exfiltration attempt. |
| DstBytes | Destination Bytes | 307.63 | Relatively high value could indicate excessive data received by the destination, which is often linked to malicious activity like data stealing or flooding. |
| SrcLoad | Source Load | 14947.4 | High load on the source system, likely a result of malicious processes running, contributing to the attack classification. |
| DstLoad | Destination Load | 1886.1 | High load on the destination system, indicating abnormal resource usage typical of an attack scenario. |
| SrcJitter | Source Jitter | 229.99 | High jitter suggesting instability in the network, which is common during a network flooding attack. |
| DstJitter | Destination Jitter | 298.94 | High jitter, indicative of network instability due to an attack, like a DDoS or data breach. |
| Feature | Full Form | Value 1 | Value 2 | Value 3 | Reason for Normal Prediction |
|---|---|---|---|---|---|
| SrcBytes | Source Bytes | 1674.0 | 1664.0 | 1675.0 | Reduced value of SrcBytes indicates normal data sent from the source, reducing the likelihood of data exfiltration or DoS attack. |
| DstBytes | Destination Bytes | 272.0 | 272.0 | 272.0 | Lower DstBytes suggest that the data received by the destination are within the expected ranges, reflecting normal network behavior. |
| SrcLoad | Source Load | - | - | - | Unchanged, but its impact is less significant due to other feature changes. |
| DstLoad | Destination Load | - | - | - | Similar to SrcLoad, unchanged, but now less relevant as other features have been adjusted. |
| SrcJitter | Source Jitter | 253.2 | 253.2 | 253.2 | Lower jitters indicate stable network conditions, a key indicator of normal traffic. |
| DstJitter | Destination Jitter | 337.6 | 337.6 | 337.7 | Reduced jitters suggest stable network performance, removing the erratic behavior typical of attacks. |
| Usage Scenario | XAI Insights (SHAP, LIME, DiCE) | Security Risk Identified | Mitigation Strategy | Security Enhancements from XAI Insights |
|---|---|---|---|---|
| Immersive Communication | SHAP and LIME show high CPU I/O wait and memory usage. DiCE shows abnormal byte transfer and jitter values. | System overload, data exfiltration, latency spikes, and delayed data access. | AI-driven workload balancing, anomaly detection systems, and blockchain logging for data integrity [37,38]. | SHAP and LIME insights support dynamic load balancing in real-time applications, reducing the risk of service disruption and improving system resilience. Meanwhile, DiCE identify suspicious byte patterns, which informs the integration of anomaly detection and blockchain-based logging—enhancing secure data transmission and threat response mechanisms. |
| High-Reliability Low-Latency Communication (HRLLC) | SHAP show high user CPU time and low idle time. LIME identify large packet sizes. DiCE detects packet anomalies. | DDoS, cryptojacking, malware, and latency disruption. | Behavioral-based detection, packet rate limiting, and secure boot with integrity checks [39,40,41]. | SHAP identify signs of cryptojacking, prompting secure boot mechanisms to block unauthorized mining activities. LIME and DiCE detect abnormal packet sizes and flooding attempts, enabling proactive rate-limiting and behavioral firewalls to maintain system availability under high load conditions. |
| Massive Machine-Type Communication (mMTC) | LIME and SHAP detect spikes in memory usage (svmem_active, svmem_slab) and packet numbers. DiCE detects traffic anomalies. | Cryptojacking, DDoS botnets, network congestion, and incorrect data. | Memory profiling tools, smart traffic filtering, and task scheduling on MEC [37,39,40]. | LIME’ detection of memory spikes facilitates memory leak identification and profiling. SHAP’ analysis of slab usage supports enhanced memory management, while DiCE’ detection of traffic anomalies enables intelligent traffic filtering—together ensuring the stability and efficiency of IoT systems. |
| Ubiquitous Connectivity | SHAP show I/O waits and memory inefficiencies. LIME indicates excessive context switches and interrupts. DiCE detect jitter. | Resource exhaustion, botnet attacks, and unstable connectivity. | Dynamic resource allocation, optimized routing, and jitter buffers [37,39,40]. | SHAP’ identification of I/O delays prompts dynamic resource reallocation to prevent system slowdowns. LIME detect kernel-level stress, leading to targeted system tuning, while DiCE’ jitter detection enables optimized routing and jitter buffering—collectively ensuring stable and reliable connectivity in 6G-enabled IoT environments. |
| AI and Communication | SHAP and LIME show high CPU/memory use and large destination byte sizes. DiCE highlight packet count and jitter anomalies. | Cryptojacking, DDoS, and degraded AI inference. | AI-based anomaly detection, blockchain logging, and adaptive model offloading/routing [37,38]. | SHAP and LIME insights facilitate dynamic load distribution for AI models, preventing system overloads. DiCE’ detection of jitter and traffic spikes drives the implementation of blockchain-backed logging and adaptive routing, ensuring AI service reliability even in unstable network conditions. |
| Integrated Sensing and Communication (ISAC) | SHAP identifies high disk and active memory usage. LIME and DiCE show large packet volumes and jitter irregularities. | DDoS, data exfiltration, ransomware, and flooding attacks. | Zero-trust access control, predictive analytics for attack detection, and backup and isolation mechanisms [41,42]. | SHAP’ identification of high disk and memory usage triggers backup and isolation to prevent ransomware damage. LIME’ and DiCE’ insights into heavy traffic and jitter patterns enable predictive anomaly detection, while zero-trust access control blocks further unauthorized activity. |
Disclaimer/Publisher’s Note: The statements, opinions and data contained in all publications are solely those of the individual author(s) and contributor(s) and not of MDPI and/or the editor(s). MDPI and/or the editor(s) disclaim responsibility for any injury to people or property resulting from any ideas, methods, instructions or products referred to in the content. |
© 2025 by the authors. Licensee MDPI, Basel, Switzerland. This article is an open access article distributed under the terms and conditions of the Creative Commons Attribution (CC BY) license (https://creativecommons.org/licenses/by/4.0/).
Share and Cite
Kaur, N.; Gupta, L. Explainable AI Assisted IoMT Security in Future 6G Networks. Future Internet 2025, 17, 226. https://doi.org/10.3390/fi17050226
Kaur N, Gupta L. Explainable AI Assisted IoMT Security in Future 6G Networks. Future Internet. 2025; 17(5):226. https://doi.org/10.3390/fi17050226
Chicago/Turabian StyleKaur, Navneet, and Lav Gupta. 2025. "Explainable AI Assisted IoMT Security in Future 6G Networks" Future Internet 17, no. 5: 226. https://doi.org/10.3390/fi17050226
APA StyleKaur, N., & Gupta, L. (2025). Explainable AI Assisted IoMT Security in Future 6G Networks. Future Internet, 17(5), 226. https://doi.org/10.3390/fi17050226


