Article

Research on Advancing Radio Wave Source Localization Technology Through UAV Path Optimization

Department of Electronic Engineering, Institute of Science Tokyo, 2-12-1 Ookayama, Meguro-ku, Tokyo 152-8550, Japan
*
Authors to whom correspondence should be addressed.
Future Internet 2025, 17(5), 224; https://doi.org/10.3390/fi17050224
Submission received: 19 March 2025 / Revised: 4 May 2025 / Accepted: 5 May 2025 / Published: 16 May 2025

Abstract

:
With an increasing number of illegal radio stations, connected cars, and IoT devices, high-accuracy radio source localization techniques are in demand. Traditional methods such as GPS positioning and triangulation suffer from accuracy degradation in NLOS (non-line-of-sight) environments due to obstructions. In contrast, the fingerprinting method builds a database of pre-collected radio information and estimates the source location via pattern matching, maintaining relatively high accuracy in NLOS environments. This study aims to improve the accuracy of fingerprinting-based localization by optimizing UAV flight paths. Previous research mainly relied on RSSI-based localization, but we introduce an AOA model considering AOA (angle of arrival) and EOA (elevation of arrival), as well as a HYBRID model that integrates multiple radio features with weighting. Using Wireless Insite, we conducted ray-tracing simulations based on the Institute of Science Tokyo’s Ookayama campus and optimized UAV flight paths with PSO (Particle Swarm Optimization). Results show that the HYBRID model achieved the highest accuracy, limiting the maximum error to 20 m. Sequential estimation improved accuracy for high-error sources, particularly when RSSI was used first, followed by AOA or HYBRID. Future work includes estimating unknown frequency sources, refining sequential estimation, and implementing cooperative localization.

1. Introduction

1.1. Significance and Motivation

In recent years, the widespread adoption of 4G and the full-scale deployment of 5G mobile communication systems have significantly accelerated the use of mobile and IoT (Internet of Things) devices [1]. As a result, wireless communication technologies supporting next-generation mobility—such as autonomous vehicles and connected cars—as well as smart homes and industrial IoT, have become essential infrastructure. To meet this societal demand, the use of radio waves has expanded rapidly. On the other hand, the increased usage of radio waves has led to the rise of unauthorized transmissions and inappropriate frequency usage that violate Japan’s Radio Act. These illegal radio sources pose a serious risk of communication disruptions, particularly in urban environments. Although recent years have shown a slight decrease in the number of incidents [2], only a quarter of illegal stations are successfully detected and addressed. Therefore, the development of a highly accurate and efficient radio source localization system is urgently needed.

1.2. Purpose and Objectives

This study aims to evaluate how different types of radio signal features—received signal strength indicator (RSSI), angle of arrival (AOA), elevation of arrival (EOA), and their integrated use as a hybrid method—contribute to localization accuracy. Through comparative analysis, we seek to clarify the effectiveness of each signal type.
The specific objectives of this study are as follows:
  • To improve localization accuracy beyond prior work by incorporating a hybrid approach that integrates RSSI, AOA, and EOA with appropriate weighting.
  • To construct a high-efficiency and high-accuracy localization system by leveraging UAV mobility for LoS (line-of-sight) acquisition and path optimization.
  • To assess the impact of factors such as UAV orbit radius and sequential estimation on localization performance.

2. Literature Review

This section provides an overview of recent research related to radio wave source localization, particularly focusing on fingerprinting-based methods, the application of UAVs, and trajectory optimization techniques. Emphasis is placed on studies published in the last five years to highlight the current state of the art. The goal is to clarify the positioning of this study in relation to existing works and to identify research gaps that motivate our proposed approach.

2.1. Fingerprinting-Based Localization

Fingerprinting-based localization has gained significant attention in recent years due to its robustness in environments where traditional geometric methods, such as multilateration and triangulation, often fail—particularly in non-line-of-sight (NLoS) conditions common in urban or indoor settings. This method operates in two phases: the offline phase, where signal features such as received signal strength indicator (RSSI), angle of arrival (AOA), or elevation of arrival (EOA) are collected at known reference locations to construct a database, and the online phase, where incoming measurements are matched against the database using statistical methods to estimate the target position. Recent studies have demonstrated the effectiveness of fingerprinting-based localization. For example, Tan and Zhao [3] proposed a method utilizing multipath signal features in urban NLoS environments, improving robustness by applying machine learning to the fingerprinting process. Gu et al. [4] conducted a comprehensive survey of Wi-Fi-based indoor fingerprinting systems and compared various algorithms under different conditions. Murata et al. [5] examined outdoor localization in NLoS environments using UAVs and found that aerial sensing helped improve coverage and accuracy. Despite these advantages, fingerprinting remains limited by the effort required to build and maintain the signal database, and its sensitivity to environmental dynamics. To address these challenges, recent research has explored the use of UAVs as mobile sensors to enhance spatial coverage and ease database construction [6]. This study builds on these trends by proposing a hybrid fingerprinting model that integrates RSSI, AOA, and EOA, and by optimizing UAV flight paths to further enhance estimation performance.

2.2. UAV-Assisted Methods

Unmanned aerial vehicles (UAVs) have emerged as powerful tools for enhancing radio source localization due to their high mobility, flexible deployment, and ability to secure line-of-sight (LoS) conditions. Unlike fixed sensors, UAVs can dynamically adjust their positions, making them particularly suitable for dynamic or obstructed environments such as urban canyons and NLoS scenarios.Recent research has explored various UAV-assisted approaches to improve localization accuracy and efficiency. Murata et al. [5] investigated multi-source localization using UAVs in NLoS environments, demonstrating that UAVs can mitigate the impact of signal shadowing by adjusting their altitude and observation angle. Zhou et al. [6] proposed a robust cooperative localization method using multiple UAVs based on AOA, focusing on optimal sensor placement to maximize estimation performance. Azari et al. [7] discussed machine learning-assisted handover and positioning strategies for cellular-connected drones, contributing to adaptive resource control in mobile sensing environments. These studies collectively show that UAVs can not only improve spatial coverage but also enhance the quality of signal information collected for localization. However, most existing works either use UAVs in a static hovering mode or treat flight trajectories as predefined. As UAVs are subject to constraints such as battery life and flight safety, there is a growing need for methods that combine localization with UAV path planning. In this study, we utilize UAVs not only as sensing agents but also as optimization targets. Our method incorporates trajectory design tailored to the propagation environment and integrates signal features such as RSSI, AOA, and EOA into a fingerprint-based framework.

2.3. UAV Trajectory Optimization

While UAVs offer significant advantages in flexibility and mobility, their potential can only be fully realized when their flight paths are optimally designed. Most conventional UAV-assisted localization studies assume fixed or circular flight paths, which may not be suitable for real-time or environment-aware applications. Trajectory optimization plays a vital role in improving localization accuracy while minimizing flight time and energy consumption. Kamei [8] demonstrated that optimizing the UAV’s trajectory using RSSI-based feedback significantly improves the accuracy of radio source localization. Zhou et al. [6] proposed a cooperative multi-UAV placement algorithm for AOA-based localization, implicitly addressing spatial trajectory decisions. Fujita et al. [9] further explored cost-efficient trajectory design using TSP-based optimization under limited observation constraints. These studies highlight the growing importance of incorporating trajectory planning into the localization framework. However, most existing approaches treat signal features and flight paths as separate elements. In contrast, our study jointly considers them by integrating RSSI, AOA, and EOA into a unified optimization framework where UAV flight paths are dynamically designed to reduce estimation error.

2.4. Positioning of This Study

Based on the studies reviewed in Section 2.1, Section 2.2 and Section 2.3, we identify several gaps in the current literature. First, although fingerprinting-based methods have shown strong performance under NLoS conditions, most prior works have relied on a single type of signal feature—typically RSSI or AOA—limiting robustness and adaptability. Second, while UAVs have been successfully employed to improve spatial sensing, their trajectories are often predefined or optimized separately from the signal processing pipeline. This study aims to address these gaps by proposing a hybrid fingerprinting method that integrates RSSI, AOA, and EOA features to enhance localization accuracy. In addition, UAV flight paths are optimized based on the hybrid model to dynamically adapt to the environment and measurement conditions. The proposed framework builds upon previous efforts by Tanaka [10] and Kamei [8] and extends them with both algorithmic innovation and practical simulation evaluation using ray-tracing data and real-world terrain modeling. By combining multidimensional signal features with environment-aware UAV trajectory optimization, this study offers a comprehensive solution to the challenges identified in prior work.

3. Materials and Methods

3.1. Overall Flowchart

Figure 1 illustrates the flow of the proposed method.
Initially, in the learning phase of the location fingerprinting method, a radio wave propagation simulation is conducted in an urban environment. Since the radio wave propagation simulation only provides sparse data due to its computational cost constraints, regression-based radio wave propagation modeling is employed to supplement continuous data. This approach enables the utilization of optimization techniques for continuous functions, such as particle swarm optimization and genetic algorithms, in subsequent steps.
Next, in the estimation phase, pattern matching between the location fingerprint database and the received signal from the target is performed. Based on the matching results, the positioning error is calculated and evaluated. Subsequently, an optimization algorithm is employed to iteratively update the UAV flight trajectory and conduct evaluations. The trajectory with the optimal evaluation value is determined as the optimal flight path. The above procedures are executed sequentially.

3.2. Ray Tracing Model

To estimate locations using the fingerprinting-based approach, it is essential to build a reference database that captures location-dependent signal characteristics. In this study, we utilized a ray-tracing simulation to generate such a database, taking into account physical phenomena such as reflection, diffraction, and transmission of radio waves. The simulation was executed using the Wireless Insite platform, which allows for detailed modeling of propagation in complex environments. Figure 2 illustrates the terrain model adopted in the simulation, while Figure 3 presents the configuration of transmitter positions and candidate UAV observation points. Recent extensions of the 3GPP/ITU channel model have enabled 3D ray-based simulation in dense urban environments, as proposed by Thomas et al. [11]. Additionally, Zhang et al. [12] analyzed angular spreads in street-level propagation, which supports our use of directional metrics such as AOA and EOA.
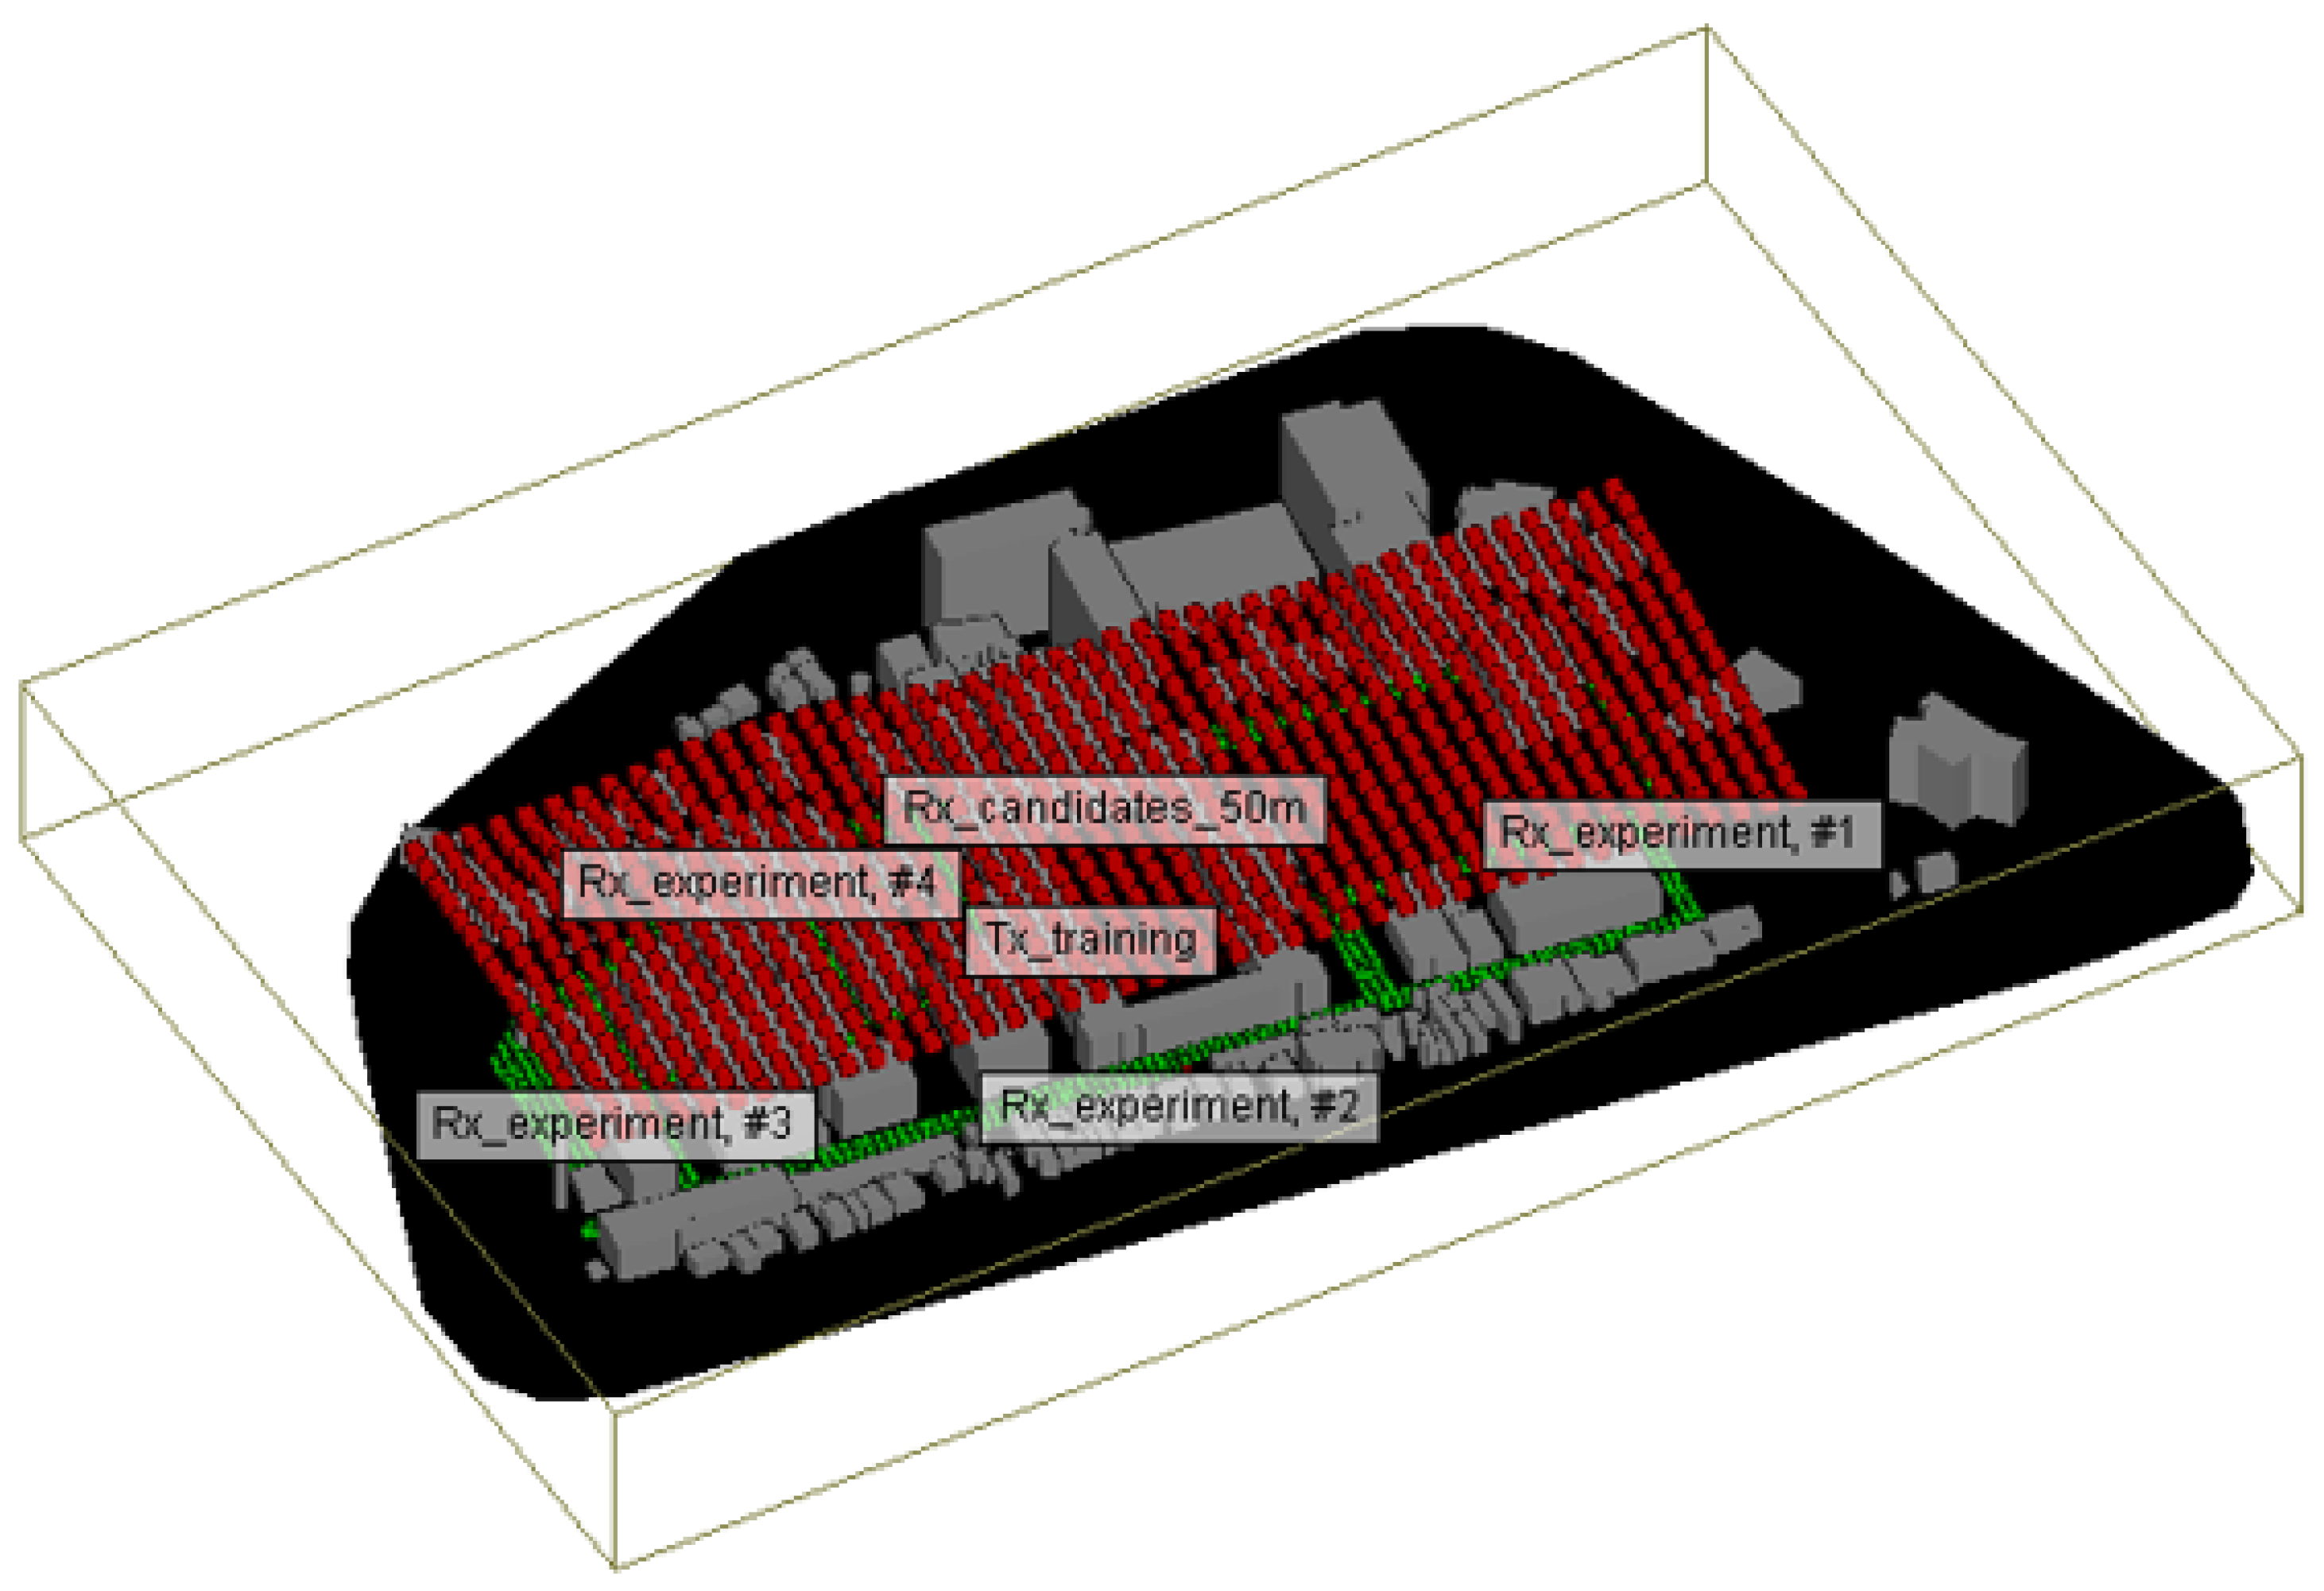
In this study, a simulated terrain model reproducing the Ōokayama Campus of the Institute of Science Tokyo was employed. The transmitters in the learning phase and the targets in the estimation phase were placed at a height of 2 m, assuming that an illegal radio wave source is located on the road. The UAV sensor candidate points were arranged in a grid pattern at altitudes of 50, 75, 100, 125, and 150 m. The actual positions of the transmitter antennas and candidate receiver antennas are illustrated in Figure 4.
Additionally, the parameters for the ray-tracing simulation are presented in Table 1. The antenna is assumed to be the same for both transmitters and receivers, with vertical polarization ensuring ideal polarization matching.

3.3. Radio Propagation Modeling

The database obtained from the ray-tracing simulation is discrete, whereas the actual target and UAV sensor position information is continuous. Therefore, radio propagation modeling is employed to interpolate continuous data [8,10]. Figure 4 shows the spatial distribution of candidate UAV positions used as sampling points in this modeling process. The model parameters are recursively estimated based on the data obtained from the ray-tracing simulation. Holis [14] examined the modeling of propagation loss in typical clustered propagation environments by considering LoS probability models defined by ITU-R. Meanwhile, Zhange, Thomas [11,12] focused on modeling the arrival angles between the base station (BS) and the user equipment (UE). Based on these computational models and ray-tracing simulation data, numerical simulations were conducted to estimate the positioning error.

3.4. Location Fingerprinting Method

This section builds upon prior work by Kamei [8], who investigated RSSI-based localization using UAVs and extended the methodology to incorporate not only RSSI but also AOA (angle of arrival), EOA (elevation of arrival), and their fusion (hybrid) to improve accuracy in outdoor environments. The location fingerprinting method is a statistical localization technique that uses location-dependent signal features as fingerprints and estimates the position via pattern matching. It consists of two phases: the learning phase and the estimation phase. In the learning phase, a location fingerprint database is constructed by observing the propagation characteristics at known transmitter positions. In the estimation phase, the received signal at an unknown target location is compared to the database to estimate the position. In this study, multiple radio features are used as fingerprints. For each transmitter located at position u k , the RSSI, AOA, and EOA values observed by the n-th sensor are denoted as P n ( u k ) , θ n ( u k ) , and ϕ n ( u k ) , respectively. Each type of fingerprint vector is defined as follows:
F k RSSI ( u k ) = [ P 1 ( u k ) , , P N ( u k ) ]
F k AOA ( u k ) = [ θ 1 ( u k ) , , θ N ( u k ) ]
F k EOA ( u k ) = [ ϕ 1 ( u k ) , , ϕ N ( u k ) ]
To further improve accuracy, we define a hybrid fingerprint that concatenates all available features:
F k HYB ( u k ) = [ P 1 ( u k ) , , P N ( u k ) , θ 1 ( u k ) , , θ N ( u k ) , ϕ 1 ( u k ) , , ϕ N ( u k ) ]
In the estimation phase, the observed signal at the n-th sensor from the target is denoted by P n target , θ n target , and ϕ n target , and the corresponding hybrid fingerprint is as follows:
F target = [ p 1 target , , p N target , θ 1 target , , θ N target , ϕ 1 target , , ϕ N target ]
The estimated position u ^ is obtained by minimizing the Euclidean distance between the target fingerprint and each database fingerprint:
u ^ = arg min u k F k HYB ( u k ) F target
Alternatively, a maximum likelihood approach can be applied by modeling the distribution of each feature. For example, assuming normal distributions,
u ^ = arg max u k n = 1 N log N ( p n target ; μ n , k P , σ n , k P ) · N ( θ n target ; μ n , k θ , σ n , k θ ) · N ( ϕ n target ; μ n , k ϕ , σ n , k ϕ )
Here, μ n , k and σ n , k denote the mean and standard deviation of each feature extracted from the fingerprint database.
Several surveys have outlined the effectiveness of fingerprint-based methods. Gu et al. [4] reviewed RSSI-based indoor techniques, while Ladd et al. [15] discussed wireless network positioning systems. Azari et al. [7] proposed a UAV-assisted fingerprinting system that dynamically adjusts sensing positions via machine learning.

3.5. LoS Probability

This section builds on the LoS classification method described by Kamei [8] and Tanaka [10], which estimates line-of-sight (LoS) conditions in discrete spatial domains for UAV-based localization. To apply the propagation model described in Section 3.3, it is essential to classify each location fingerprint into line-of-sight (LoS) or non-line-of-sight (NLoS) conditions. However, since continuous fingerprints are used in this study, a probabilistic method is required to infer LoS/NLoS status from surrounding discrete points. Let c k be a binary variable indicating the LoS status of the k-th neighbor (1 if LoS, 0 otherwise). For a given particle at position u i , the probability of LoS is defined as follows:
p LoS ( u i ) = k w k c k k w k
where w k = 1 / d i , k is the inverse distance weight between the particle and its k-th neighboring point. This weighting scheme ensures that closer points contribute more to the LoS probability.
As illustrated in Figure 5,This approach allows a smooth interpolation of LoS likelihood across continuous space, enabling probabilistic classification of LoS/NLoS and effective application of the propagation model in Section 3.3. Compared to binary thresholding, this method improves stability in environments with uncertain boundary conditions.

3.6. Solution to the Optimization Problem

This section discusses the methodology for solving the UAV flight path optimization problem described above. Since the objective function of this problem exhibits significant variations in shape due to terrain and multipath effects, optimization using gradient information is challenging. Moreover, due to the enormous computational cost associated with radio wave propagation simulations, heuristic methods, which provide good approximate solutions without guaranteeing optimality, are more suitable.A strategy that refines heuristic solutions to further approach optimal solutions is known as a metaheuristic. In metaheuristics, the solution space is explored by iteratively performing the following two operations: (1) generating new solutions using past search history and (2) evaluating the generated solutions and feeding back the necessary information for subsequent searches. In this study, we focus on two metaheuristic methods: particle swarm optimization (PSO) and genetic algorithms (GAs). By utilizing these methods in simulations, an optimized UAV flight trajectory that enables high-accuracy localization can be determined.

3.7. Particle Swarm Optimization (PSO)

Particle swarm optimization (PSO) is a method proposed by J. Kennedy and R. Eberhart in 1995 [16]. Multiple particles are placed in the search space, and these particles explore the optimal solution by moving in parallel while sharing information with each other. PSO can be implemented as a relatively simple algorithm with few control parameters, and it has gained attention due to its high parallel computing capability and potential for various modifications [17]. The basic PSO algorithm is described below. Let u be the parameter that determines the UAV flight path P, as defined in Equation (9)
min u F ( P ( u ) ) , u = ( u 1 , , u M ) Γ
where Γ represents the three-dimensional space in which the UAV sensor positions can exist, and each component of u is normalized such that 0 < u < 1 . The positions and velocities of the particles are updated using the following equations:
u i ( t + 1 ) = u i ( t ) + v i ( t + 1 )
v i ( t + 1 ) = w v i ( t ) + c 1 u i pbest ( t ) u i ( t ) + c 2 u i gbest ( t ) u i ( t )
where t is the current iteration number, u i pbest ( t ) represents the personal best, and u i gbest ( t ) represents the global best. The personal best is the particle position that has yielded the best value for a given particle up to the current iteration, while the global best is the best value among all particles’ personal bests. That is, the updated velocity v i ( t + 1 ) is obtained by summing the current velocity v i ( t ) , the velocity toward the personal best direction u i pbest ( t ) u i ( t ) , and the velocity toward the global best direction u i gbest ( t ) u i ( t ) , each weighted by w, c 1 , and c 2 , respectively. The updated position u i ( t + 1 ) is then computed by adding the updated velocity v i ( t + 1 ) to the current position u i ( t ) . This process is repeated until the objective function F ( P ( u ) ) falls below a predefined threshold or the maximum number of iterations t MAX is reached. In this study, for comparison of localization accuracy, no threshold is set, and the process is repeated for t MAX iterations. The PSO parameters used in this study are shown in Table 2.

3.8. UAV Orbit

In this study, a circular orbit for the UAV is assumed. As demonstrated by [8], flying the UAV along a circular trajectory defined by a specified radius and candidate points improves estimation accuracy compared to random placement, where the UAV moves to randomly assigned coordinates. Although more advanced trajectory models exist, such as the traveling salesman problem (TSP) optimization model, this study adopts a circular orbit. It is well known that in TSP optimization problems, computational costs increase exponentially as the number of candidate points increases [9]. In practical estimation system operations, illegal radio stations may move during the simulation time, making it preferable to reduce computational time for analysis. Therefore, a circular trajectory was selected. The configured trajectory is illustrated in Figure 6. The number of sampling points on the trajectory is set to eight to mitigate accuracy degradation by averaging values even if one of the points is in an NLoS condition.

3.9. Objective Function

One of the Rx candidate points is designated as the receiver (rx). For all 144 transmitters, the estimated coordinates are computed through pattern matching with the location fingerprint database. The UAV trajectory is determined to minimize the 90th percentile value of the cumulative distribution function (CDF) across all 144 transmitters.

3.10. Estimation Method for Source Coordinates Using RSSI

Based on the previously described method in Section 3.3, a normal distribution N ( μ , σ ) is created using the μ and σ values obtained from regression curves, which are optimized for ray-tracing simulations under LOS and NLOS conditions. The distribution of the training (tng) data used for estimation with RSSI is shown in Figure 7. Additionally, Figure 8 presents a comparison where the target (tgt) data are overlaid on the training data, confirming that there is minimal difference between the target data and the training data.

3.11. AOA Model

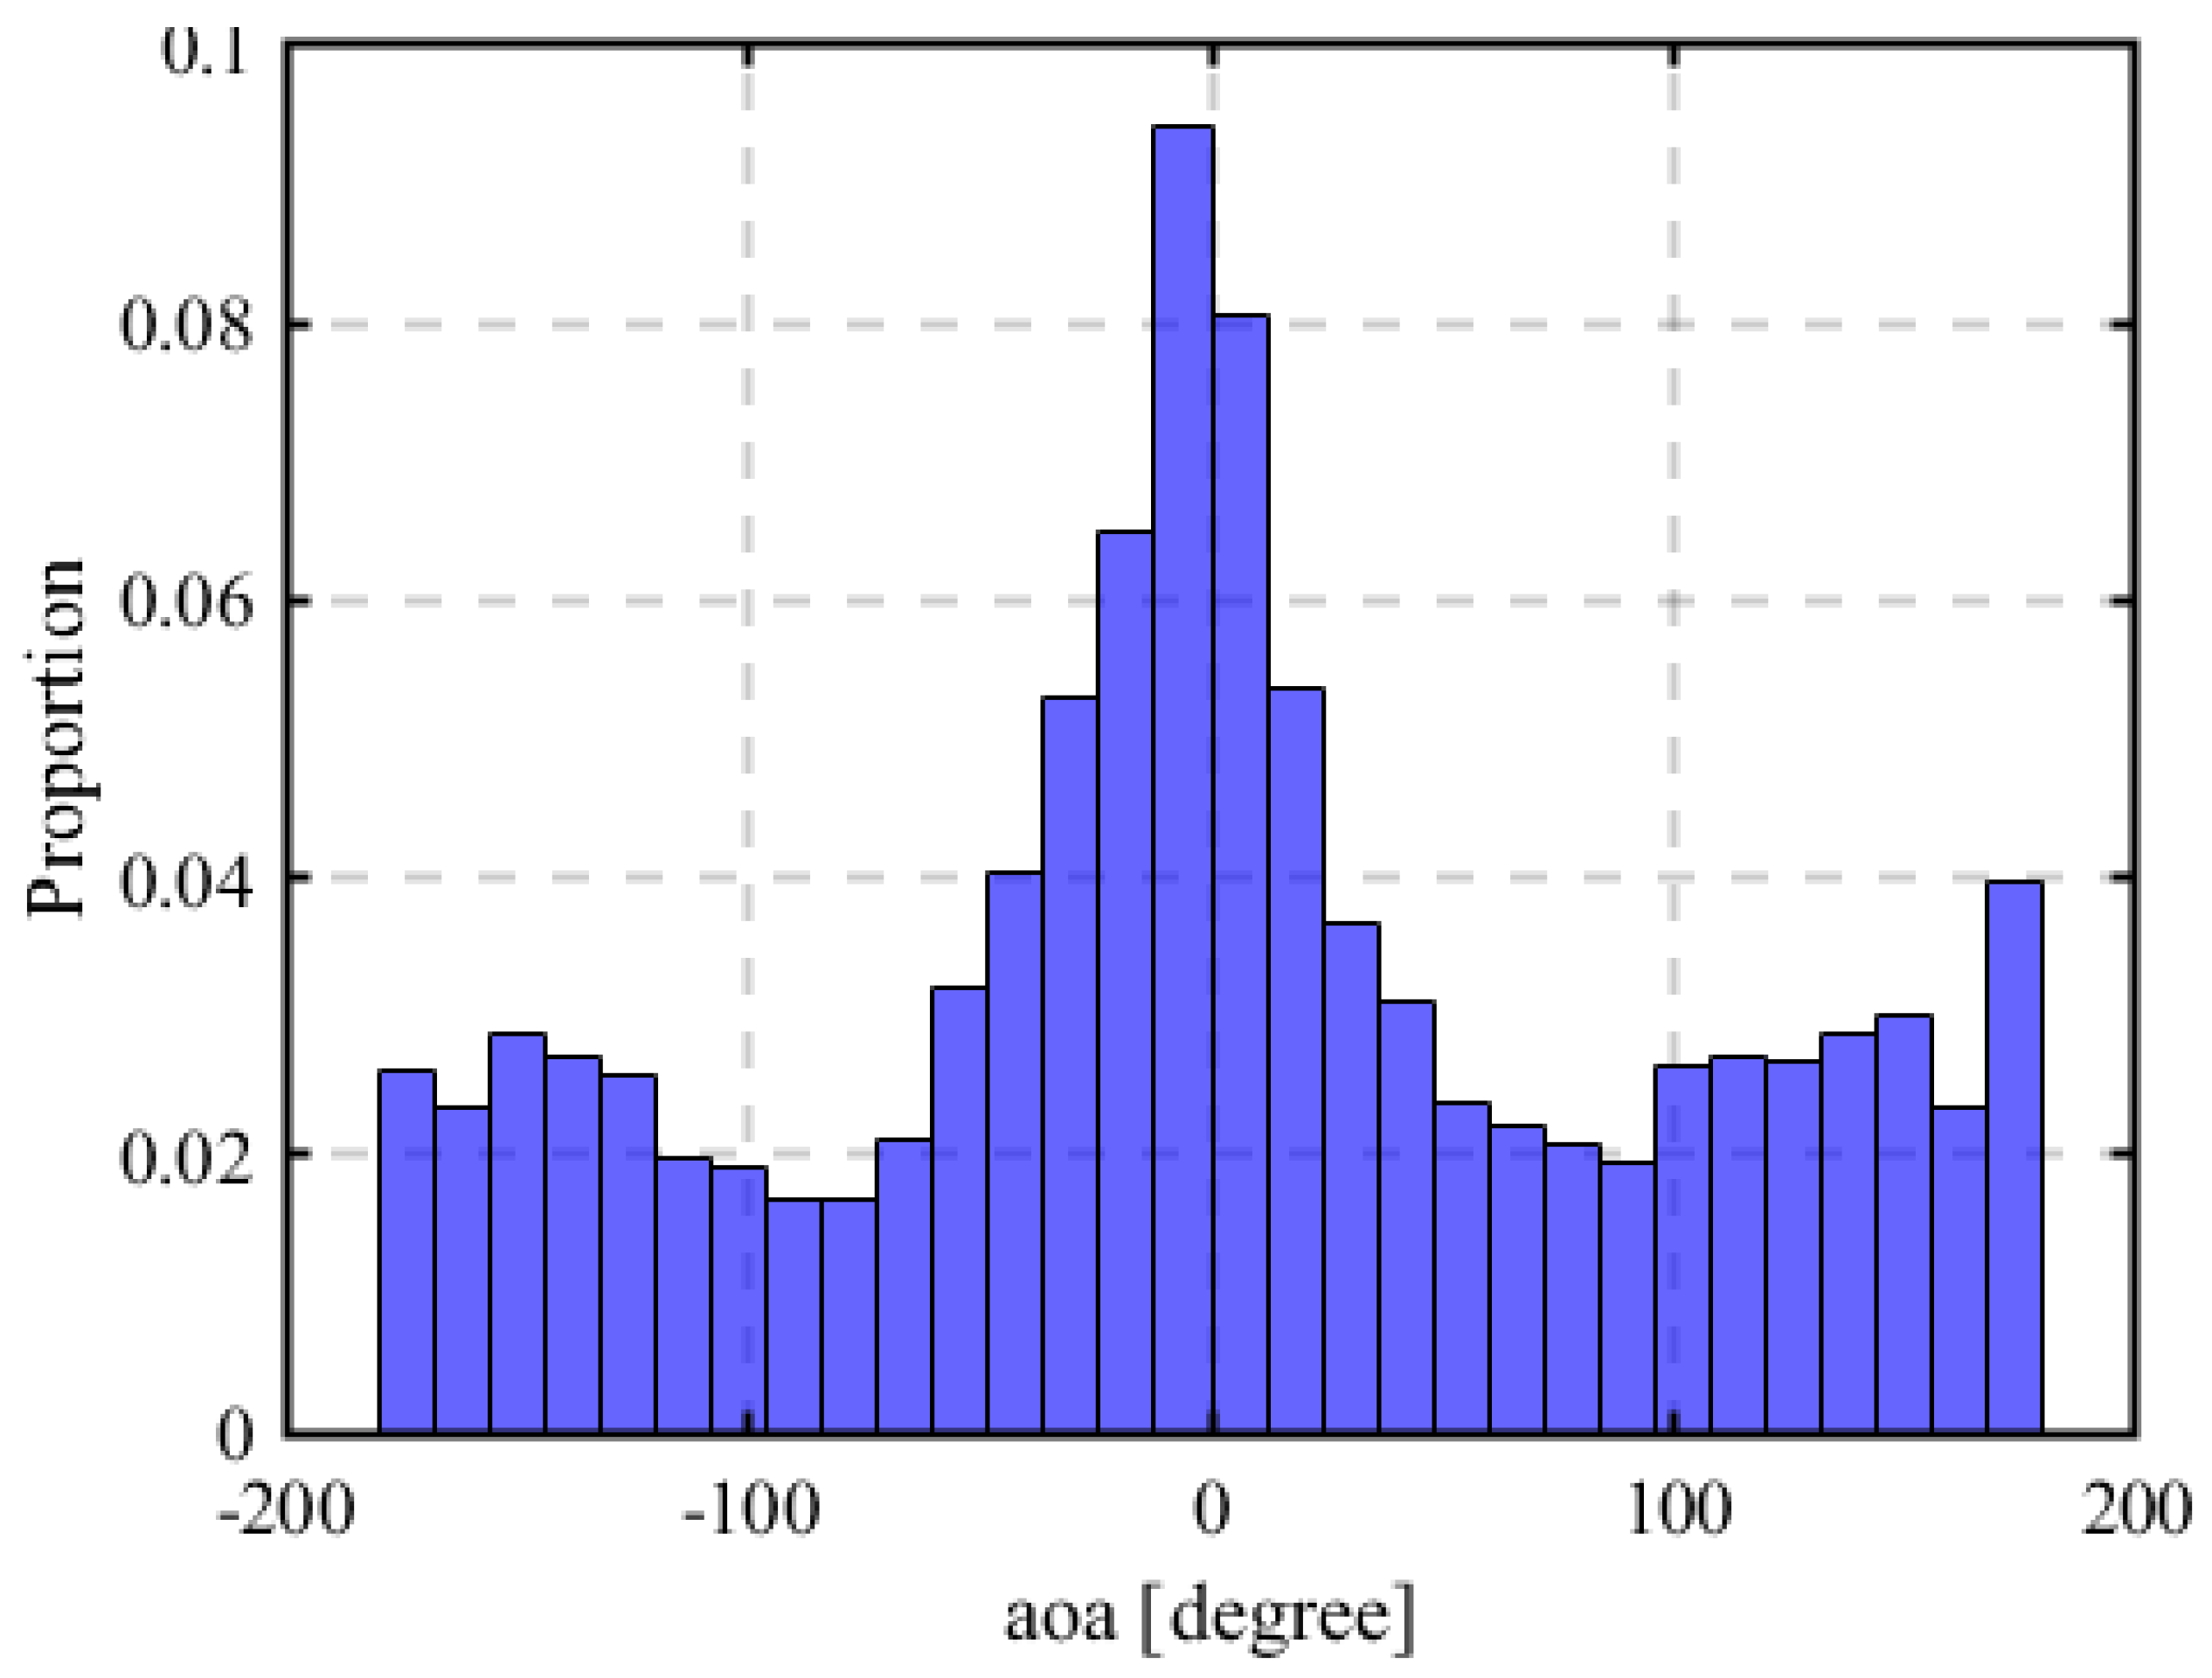
Similar to RSSI, we construct a normal distribution N ( μ , σ ) using the μ and σ values obtained from the regression curve in Section 3.3, which is suitable for ray-tracing simulations under LOS and NLOS conditions as shown in Figure 9. Using this distribution, we determine where the received signals from the target match within the distribution.
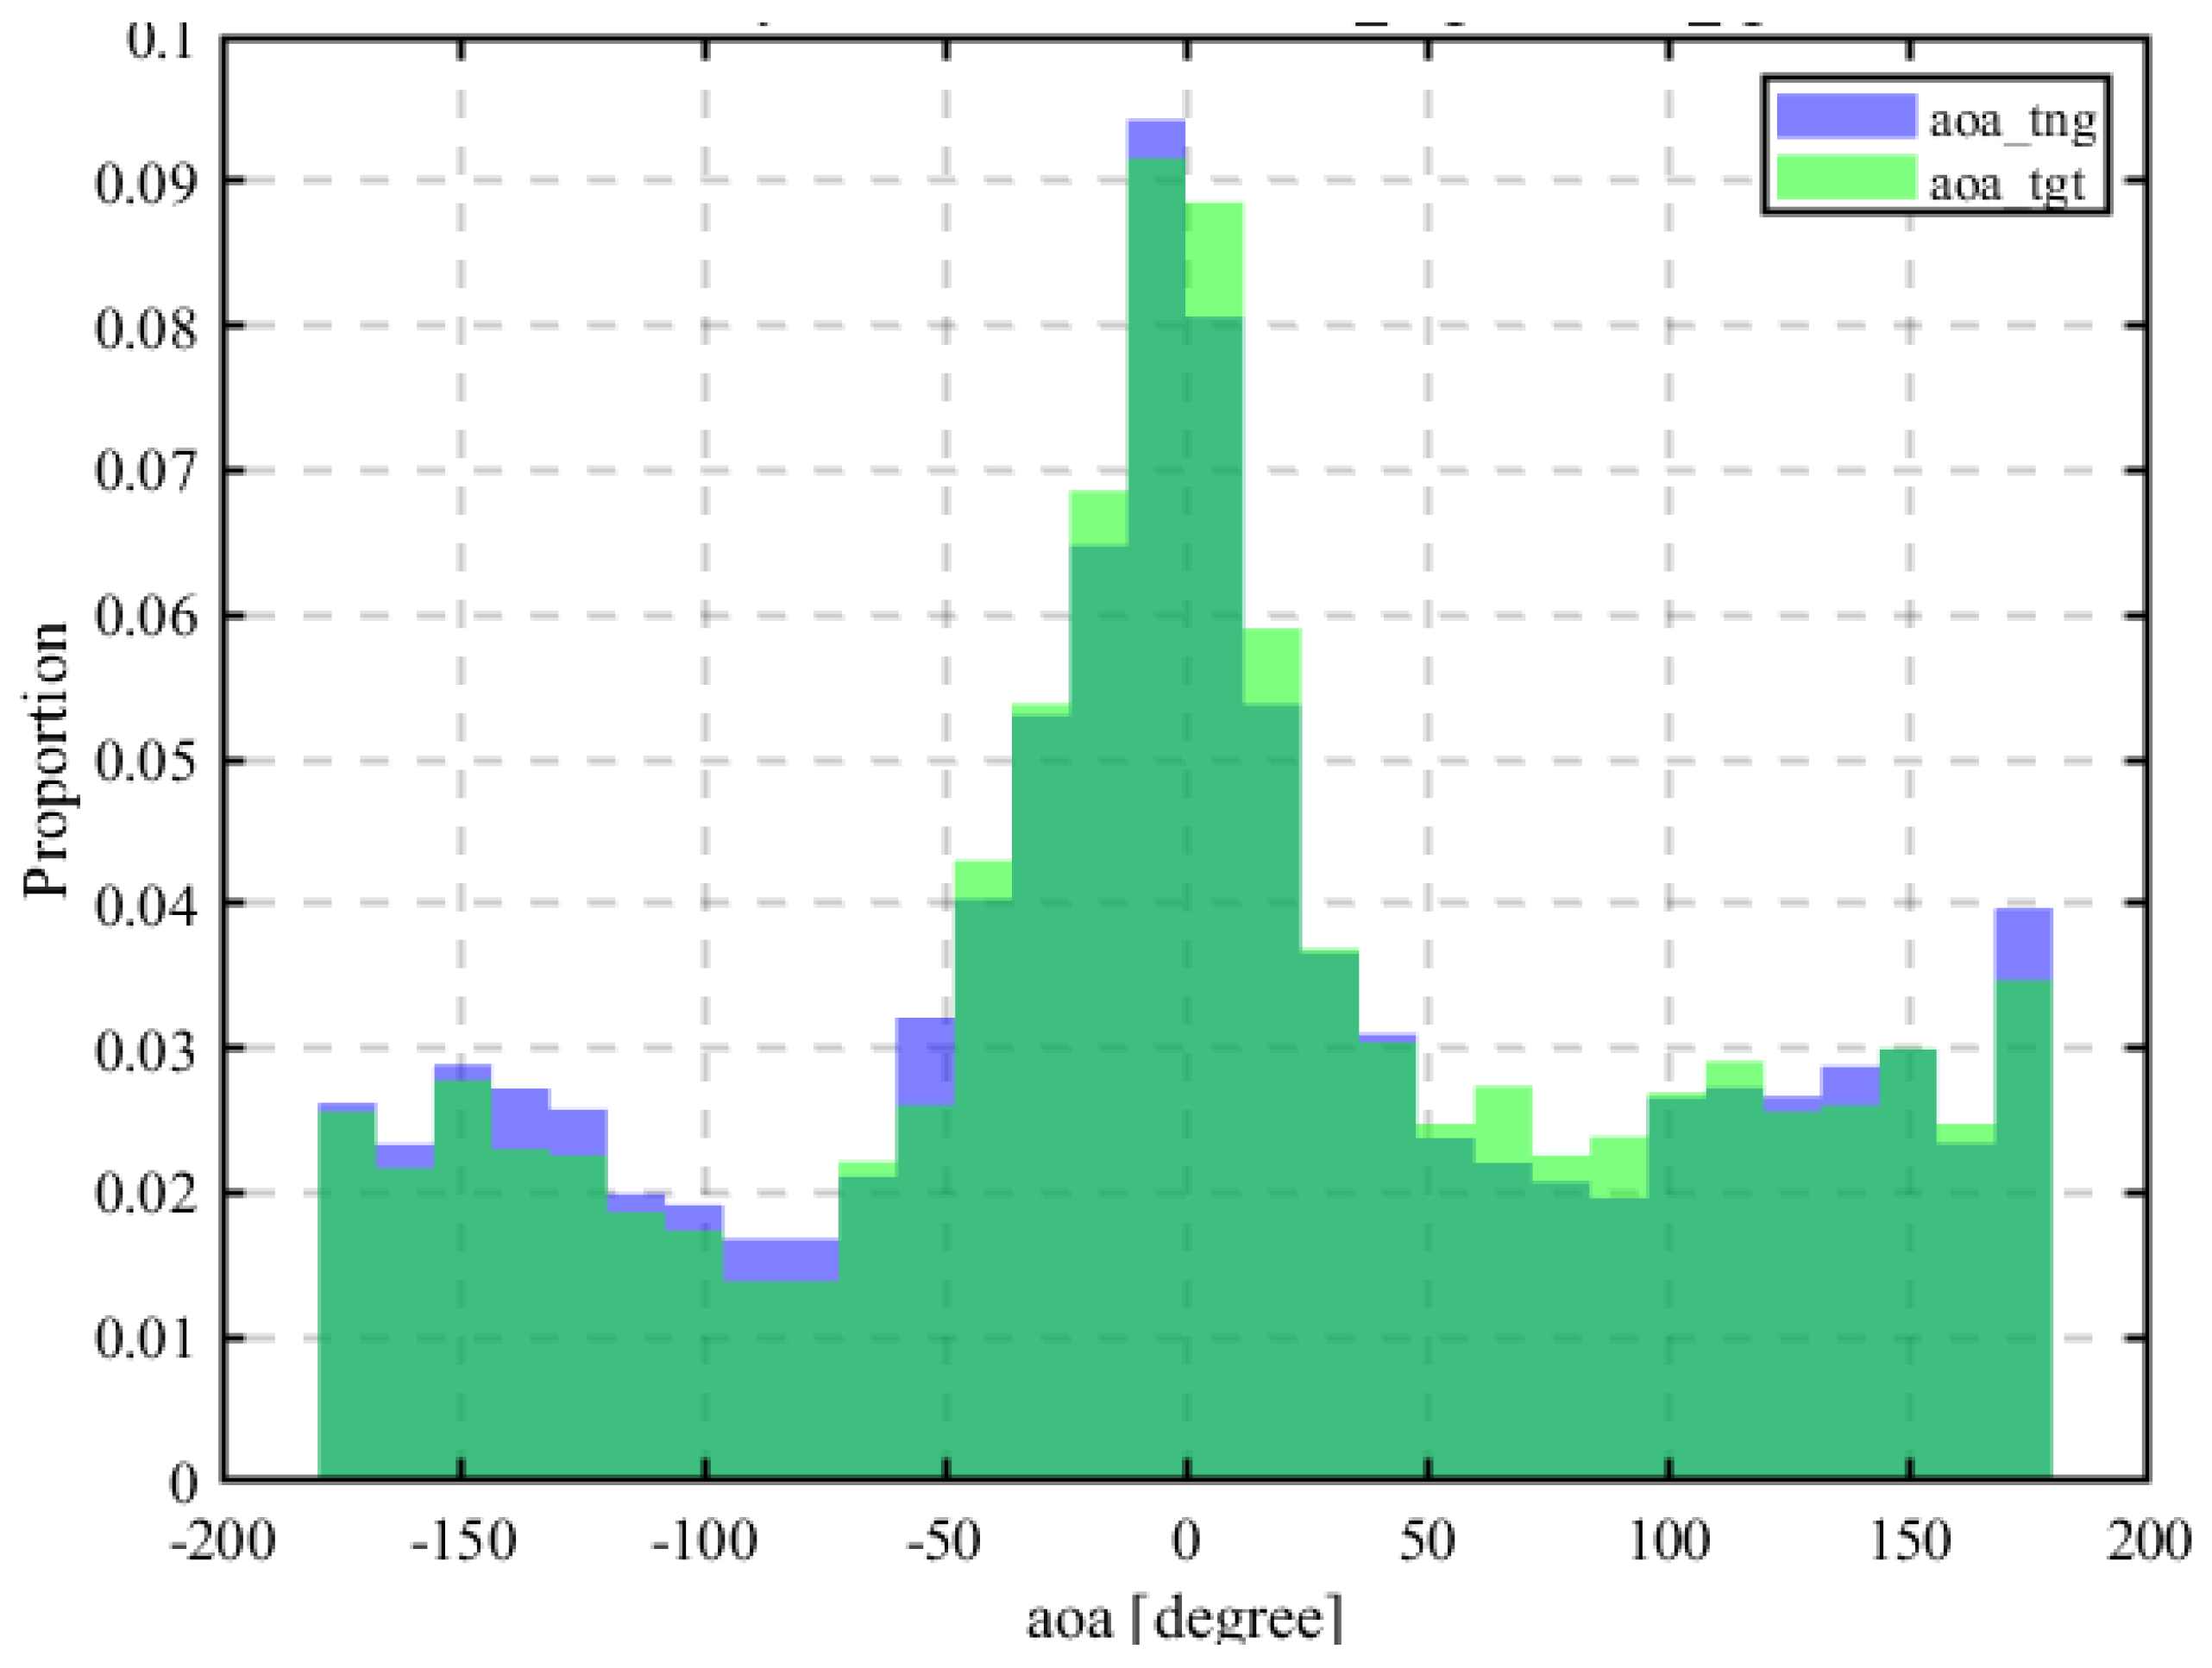
As shown in Figure 10, the target data do not significantly deviate from the training data, similar to the case of RSSI.

3.12. Estimation Using Elevation of Arrival (EOA)

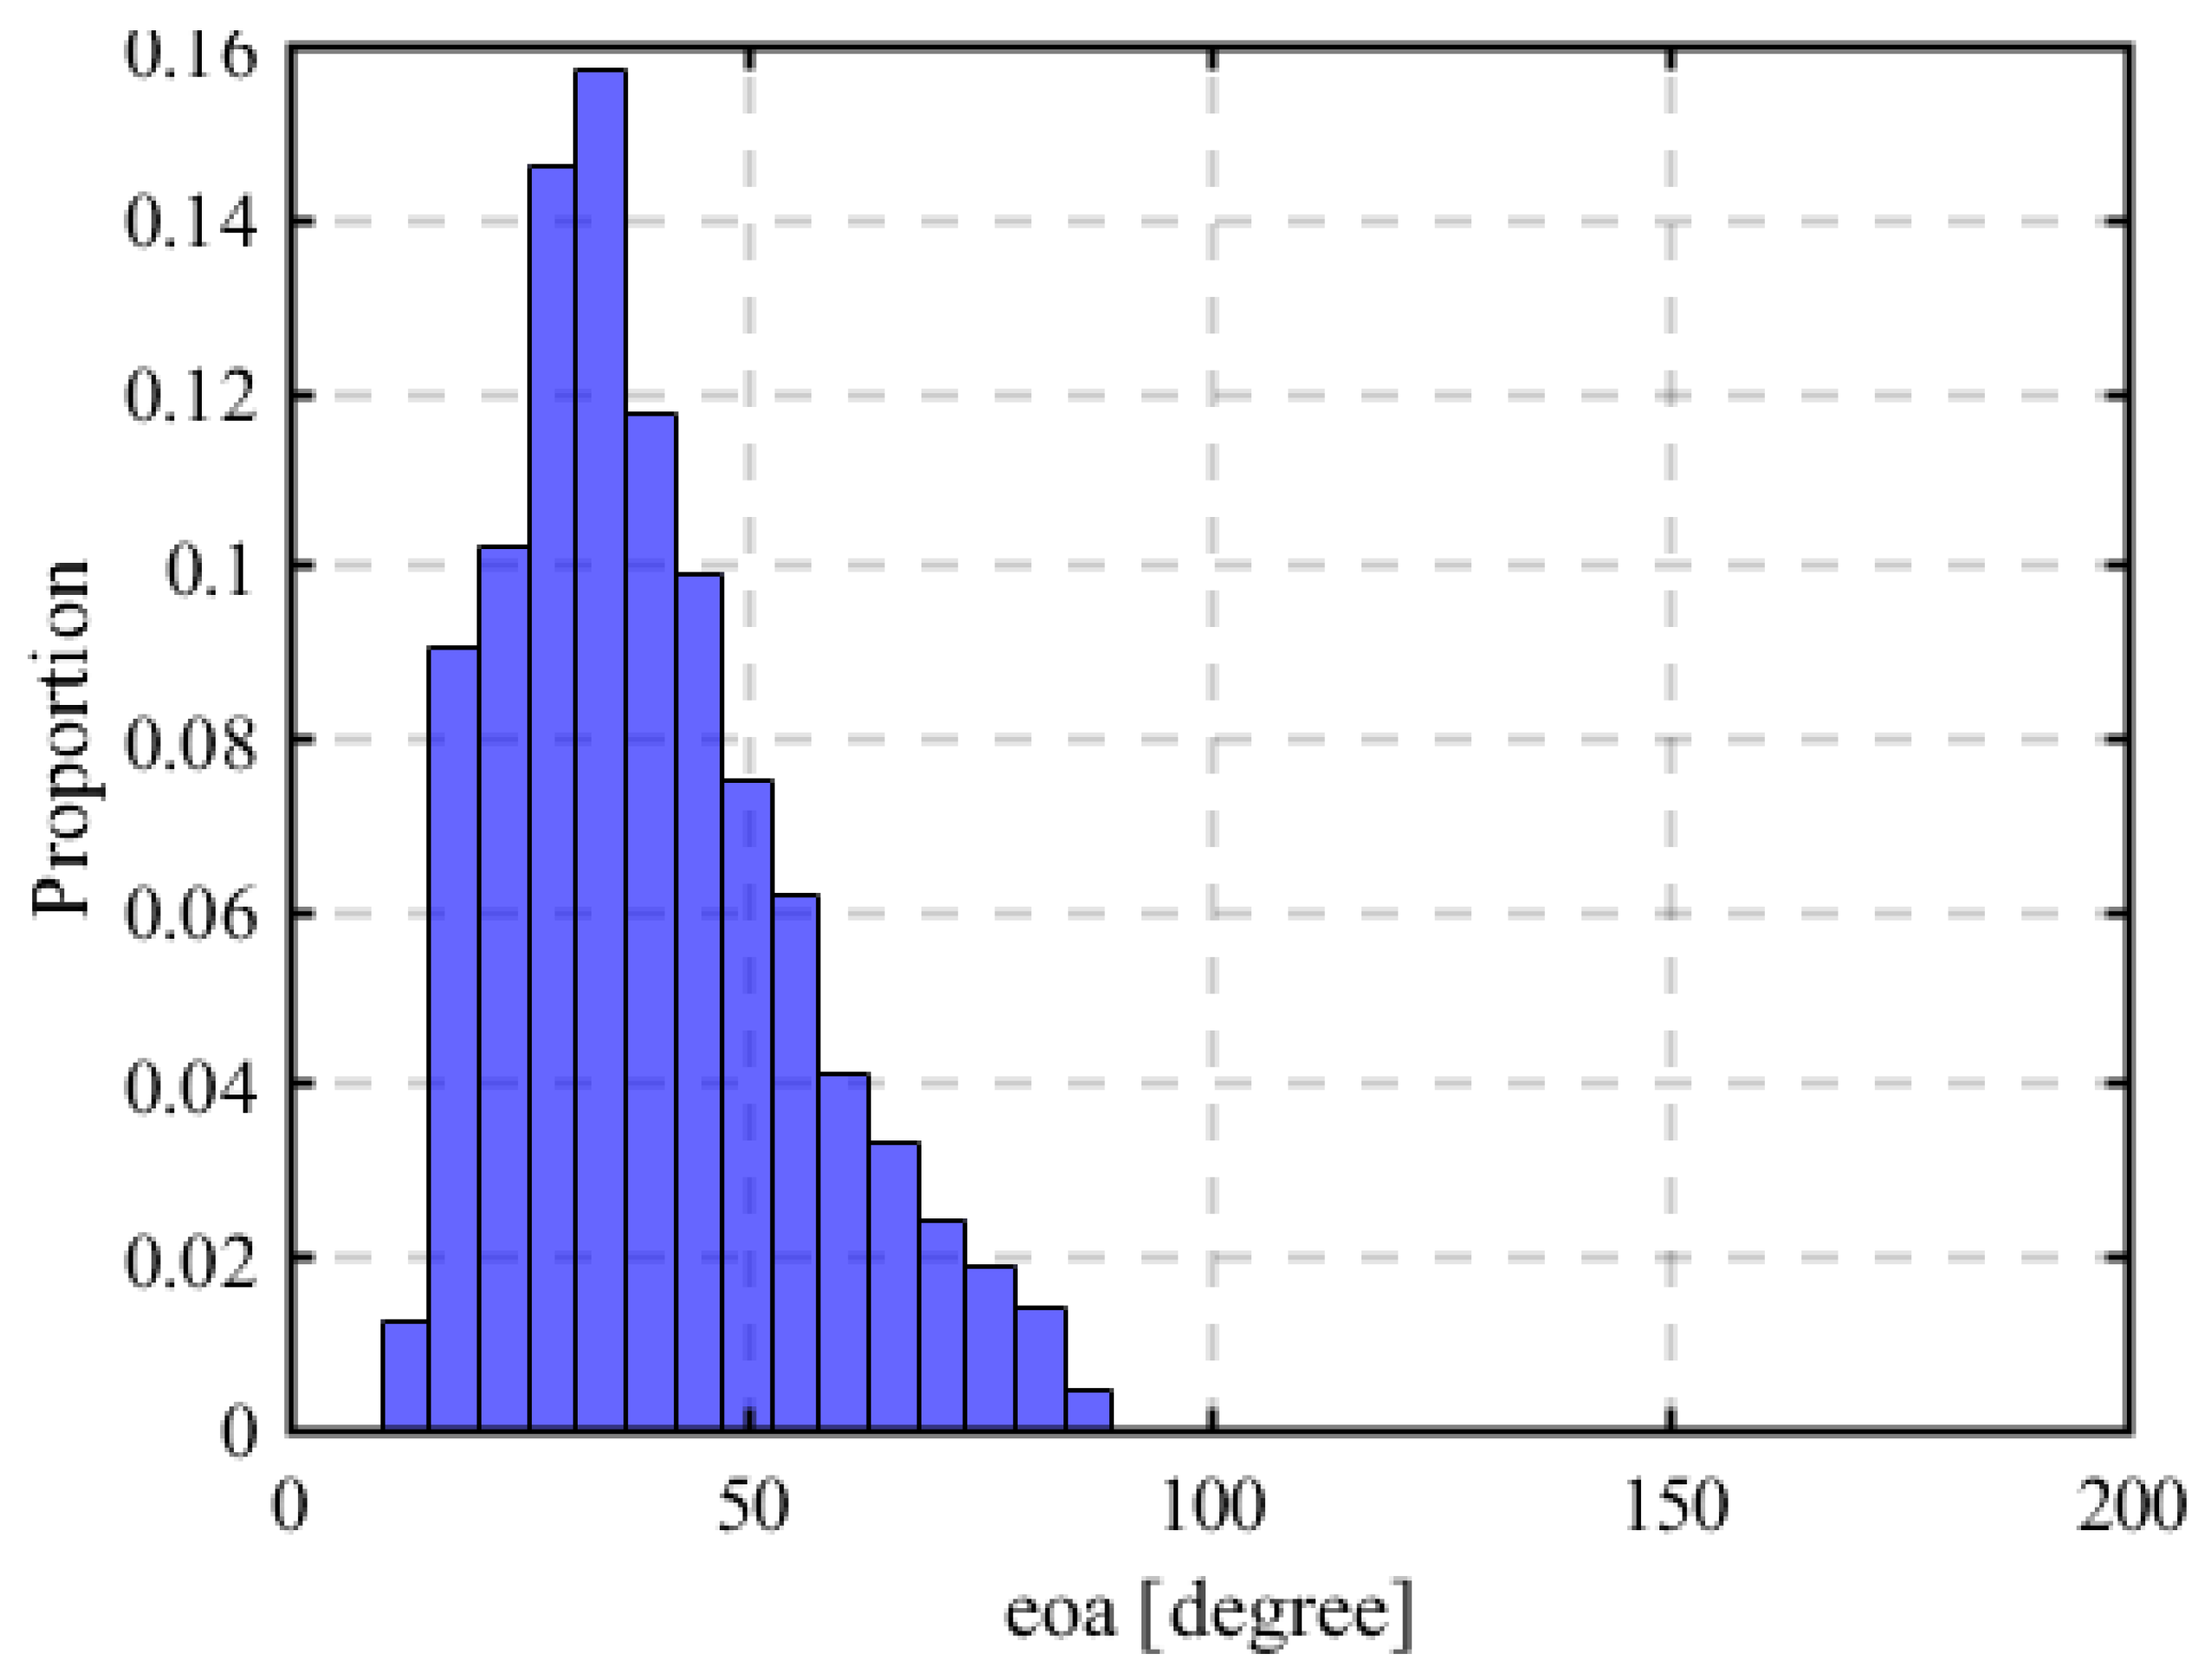
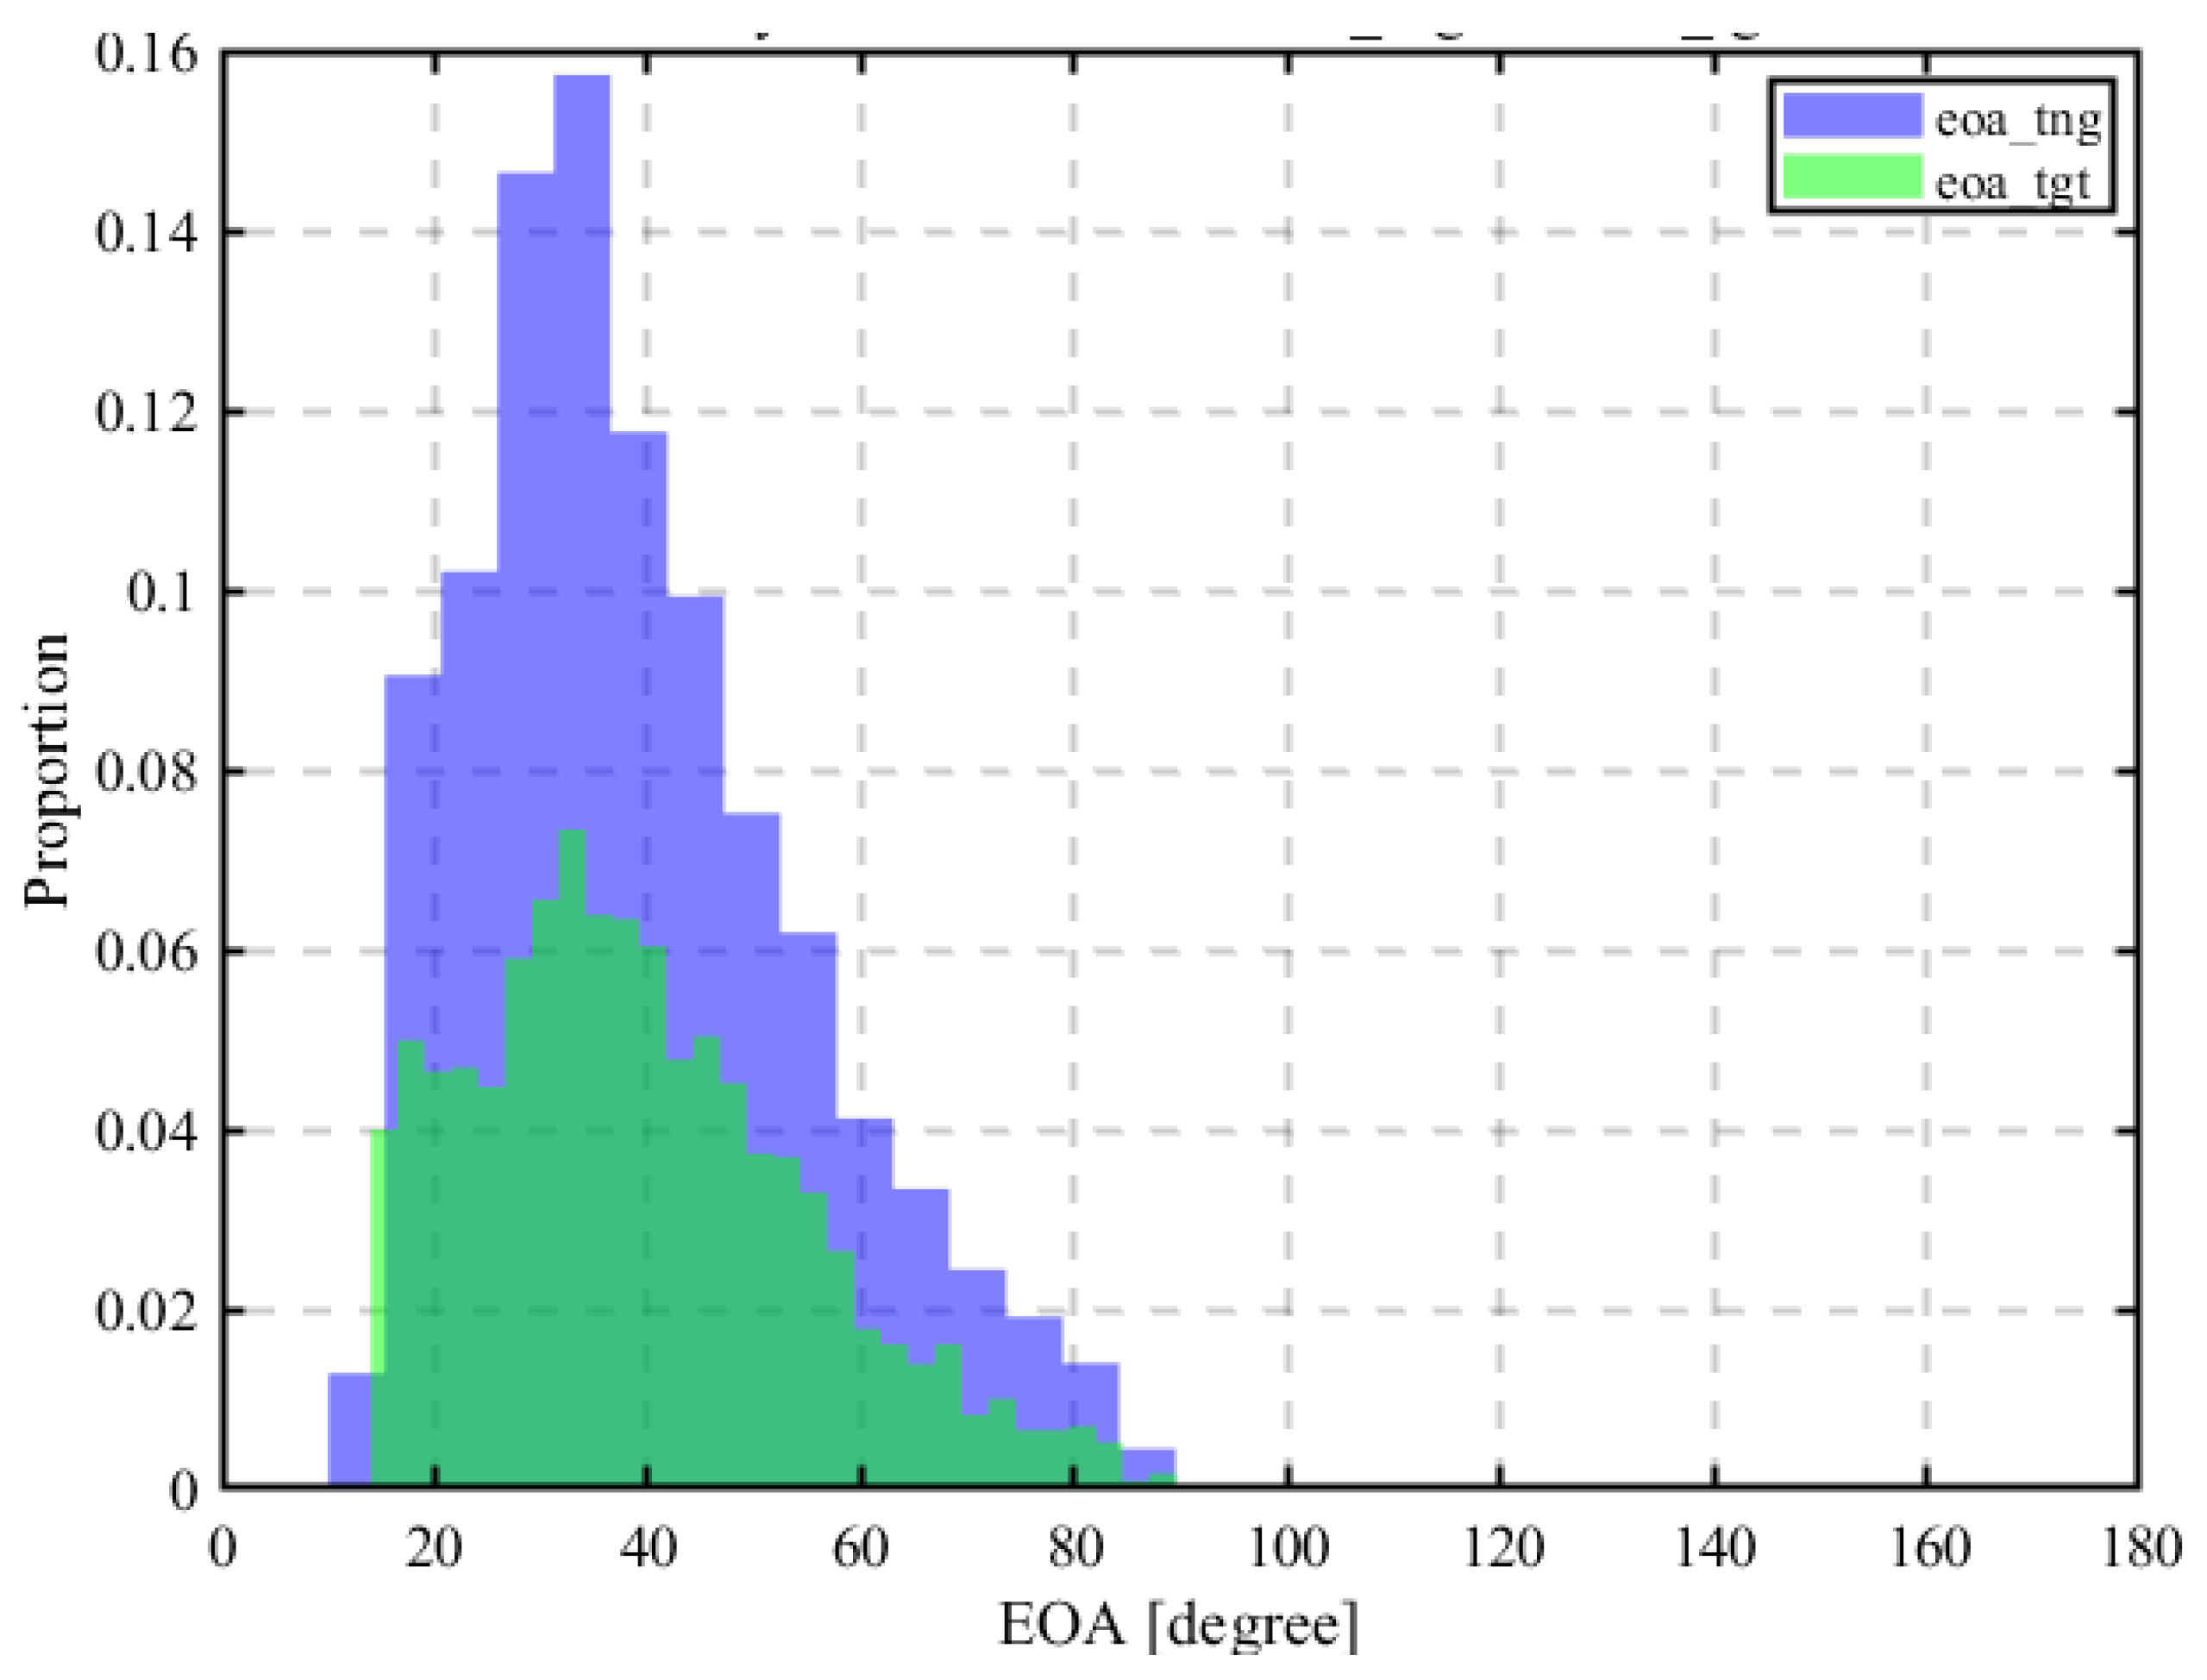
For estimation using AOA, the elevation angle (EOA: elevation of angle) is utilized in addition to the azimuth angle. Figure 11 shows the training data for EOA, while Figure 12 presents the target data. Compared to RSSI and AOA, Figure 13 reveals that the target data do not significantly overlap with the training data. Possible reasons for this include the fact that the normal distribution model used for RSSI and AOA is not suitable for EOA, or that the target data distribution differs from the training data due to multipath effects. Additionally, in the ray-tracing simulation, the altitude was set up to 150 m, which may have made the elevation angle more susceptible to multipath effects.
When estimating with AOA, weights are assigned to AOA and EOA. In this study, AOA and EOA are weighted equally at 0.5 each. In the HYBRID model described later, the weighting coefficients for AOA and EOA are determined using linear interpolation. Therefore, for simplification, the estimation using AOA assigns equal weights of 0.5 to both RSSI and AOA.

3.13. HYBRID Model

The HYBRID model integrates the estimation process by assigning weights to RSSI, AOA, and EOA. First, the probability density function (PDF) values are computed using the mean and standard deviation of the training data for RSSI, AOA, and EOA. Using Equations (12)–(14), the data are converted into dimensionless values. In these equations, R X represents the received data at the candidate Rx position, and F P denotes the fingerprint database.
prob rssi = 1 2 π σ exp rssi tgt μ r s s i 2 2 σ r s s i 2
Here,
μ r s s i = rssi tng
σ r s s i = mean FP rx Training œ rssi
Similarly, the probabilities for AOA and EOA are defined as follows:
prob aoa = 1 2 π σ exp aoa tgt μ a o a 2 2 σ a o a 2
prob eoa = 1 2 π σ exp eoa tgt μ e o a 2 2 σ e o a 2
where
μ a o a = aoa tng , μ e o a = eoa tng
σ a o a = mean FP rx Training œ aoa
σ e o a = mean FP rx Training œ eoa
For AOA and EOA, weight coefficients are determined through normalization using the standard deviation of the training data via linear interpolation. For RSSI, its weight coefficient is computed by subtracting the sum of AOA and EOA weights from a total weight value of 3. Using these weights, the probability is calculated as in Equation (15). By performing pattern matching to find the location with the highest probability, the source location is estimated.
prob hybrid = w rssi · prob rssi + w aoa · prob aoa + w eoa · prob eoa

3.14. Computation and Evaluation of Estimation Error

The root-mean-square error (RMSE) between the estimated coordinates and the actual radio source coordinates is computed as the distance error (DE). Given that p i and p i , target represent the estimated coordinates and the target coordinates, respectively, the distance error is computed using the norm as shown in Equation (16).
D E = 1 N i = 1 N p ^ t a r g e t p t r a i n i n g 2 2
The distance error (DE) is computed for all 144 transmission sources. In this study, the computed DE is evaluated based on the mean value and the 90th percentile value of the cumulative distribution function (CDF) as key indicators of localization accuracy.The mean DE provides an overall estimate of the system’s accuracy, whereas the CDF 90% value assesses how frequently large errors (outliers) occur in localization results.

3.15. Sequential Estimation Model

In the previous models, the UAV’s trajectory is optimized to minimize the 90th percentile value of estimation error across all transmission sources. This essentially represents global learning.As will be discussed later in the results, estimation errors tend to be significantly degraded in highly obstructed environments, such as the southern area of the Ookayama campus. To address this, as illustrated in Figure 14, sequential learning is introduced to retrain areas that are prone to NLOS conditions. By iteratively updating the estimation model with NLOS-affected sources, this approach aims to enhance estimation accuracy in obstructed regions.

4. Results

4.1. Circular Trajectory Placement with a Radius of 100 m

Here, we analyze the localization results for different types of radio signal information with a radius of 100 m. The primary reason for setting the radius to 100 m is that it comprehensively covers the Ōokayama campus. Additionally, as will be discussed later in Section 4.2, the results of localization with different radii indicate that 100 m is a reasonable choice for comparing different types of radio signal information. The results show that when the radius is set to 100 m, the localization accuracy of RSSI, AOA, and HYBRID is relatively unaffected by the radius. The following Section 4.1.1, Section 4.1.2 and Section 4.1.3 discuss the localization results and the trends in estimation errors for each type of radio signal information.

4.1.1. Using Only RSSI

The results of source localization using only RSSI are shown in Figure 15, Figure 16 and Figure 17.
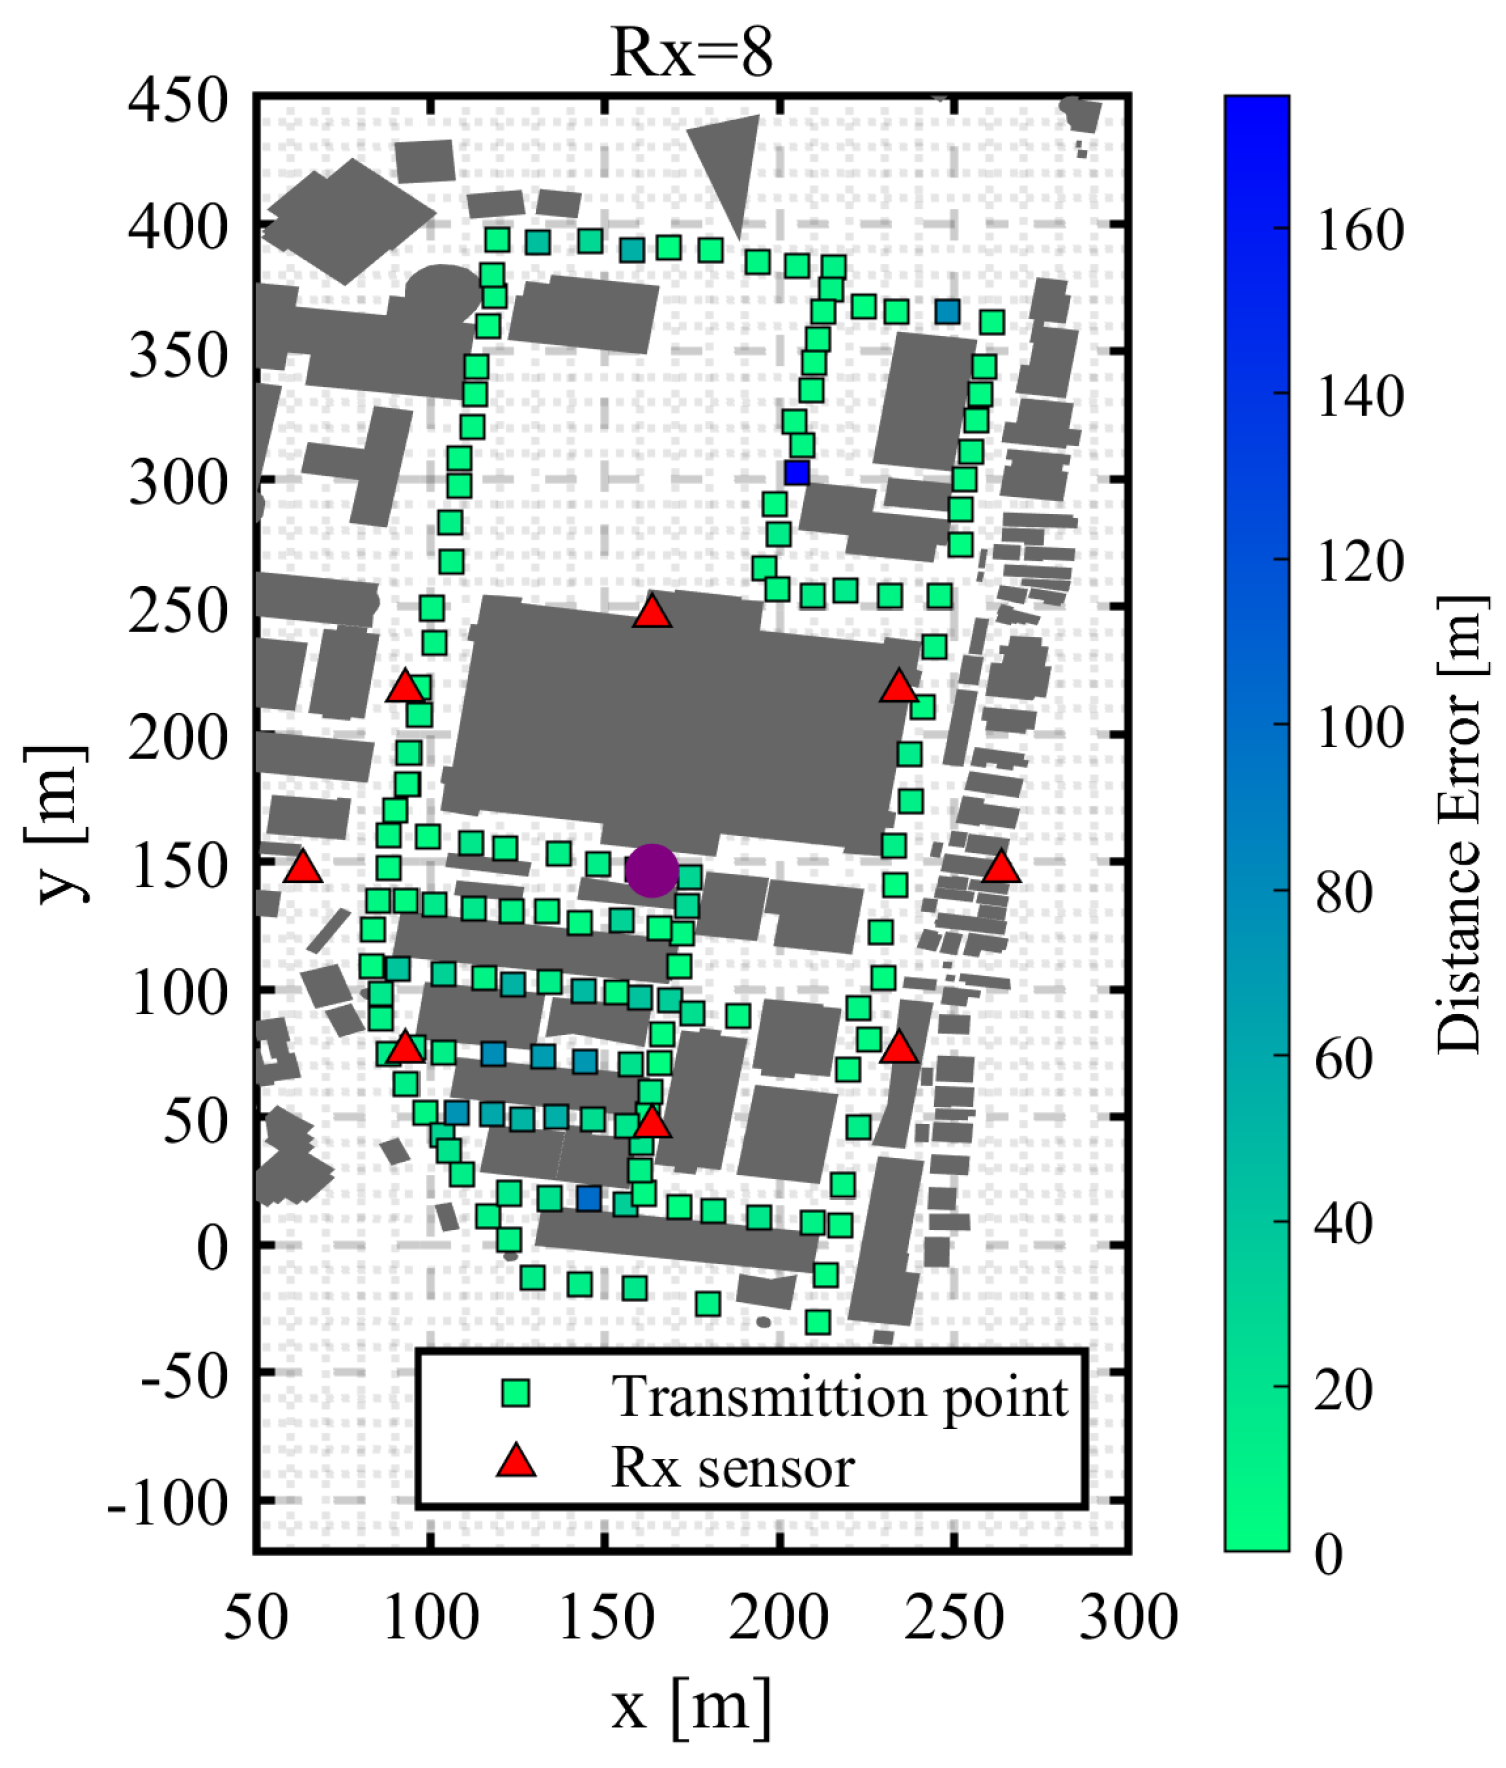
As shown in Figure 16, the spatial distribution of localization errors reveals multiple regions with significantly large estimation errors, especially in the southern part of the campus. This is likely caused by the presence of non-line-of-sight (NLoS) conditions due to buildings and other obstructions, which reduce the reliability of signal strength as a spatial feature. RSSI is known to be sensitive to multipath fading and shadowing, making it less effective in complex outdoor environments. Figure 17 shows that the cumulative distribution of errors converges slowly, with many sources exceeding 40 m of error. This indicates the presence of numerous outliers.
These findings are consistent with prior research by Tanaka [10], who also reported decreased accuracy of RSSI-based fingerprinting under similar conditions. This result highlights the need to incorporate angular information such as AOA or EOA to improve robustness in such environments.

4.1.2. Using Only AOA

The results of source localization using only AOA are shown in Figure 18, Figure 19 and Figure 20.
As shown in Figure 19, the spatial distribution of errors using AOA reveals relatively moderate errors in most areas, though certain locations still exhibit large errors exceeding 30 m. This is likely due to the degradation of angular accuracy in environments with signal reflection or diffraction, where the estimated angle may not correspond directly to the true direction. Figure 20 shows that 90% of the sources are localized within 20 m. While this is a considerable improvement over RSSI-only estimation, a small number of significant outliers remain. This suggests that while angular information provides better directionality, it may still be affected by multipath propagation and shadowing in complex environments.
These findings are in line with previous studies such as Zhou et al. [6], where AOA-based localization with UAVs was shown to benefit from careful UAV placement and collaborative sensing strategies.

4.1.3. Hybrid

The results of source localization using a hybrid approach that integrates RSSI, AOA, and EOA are shown in Figure 21, Figure 22 and Figure 23.
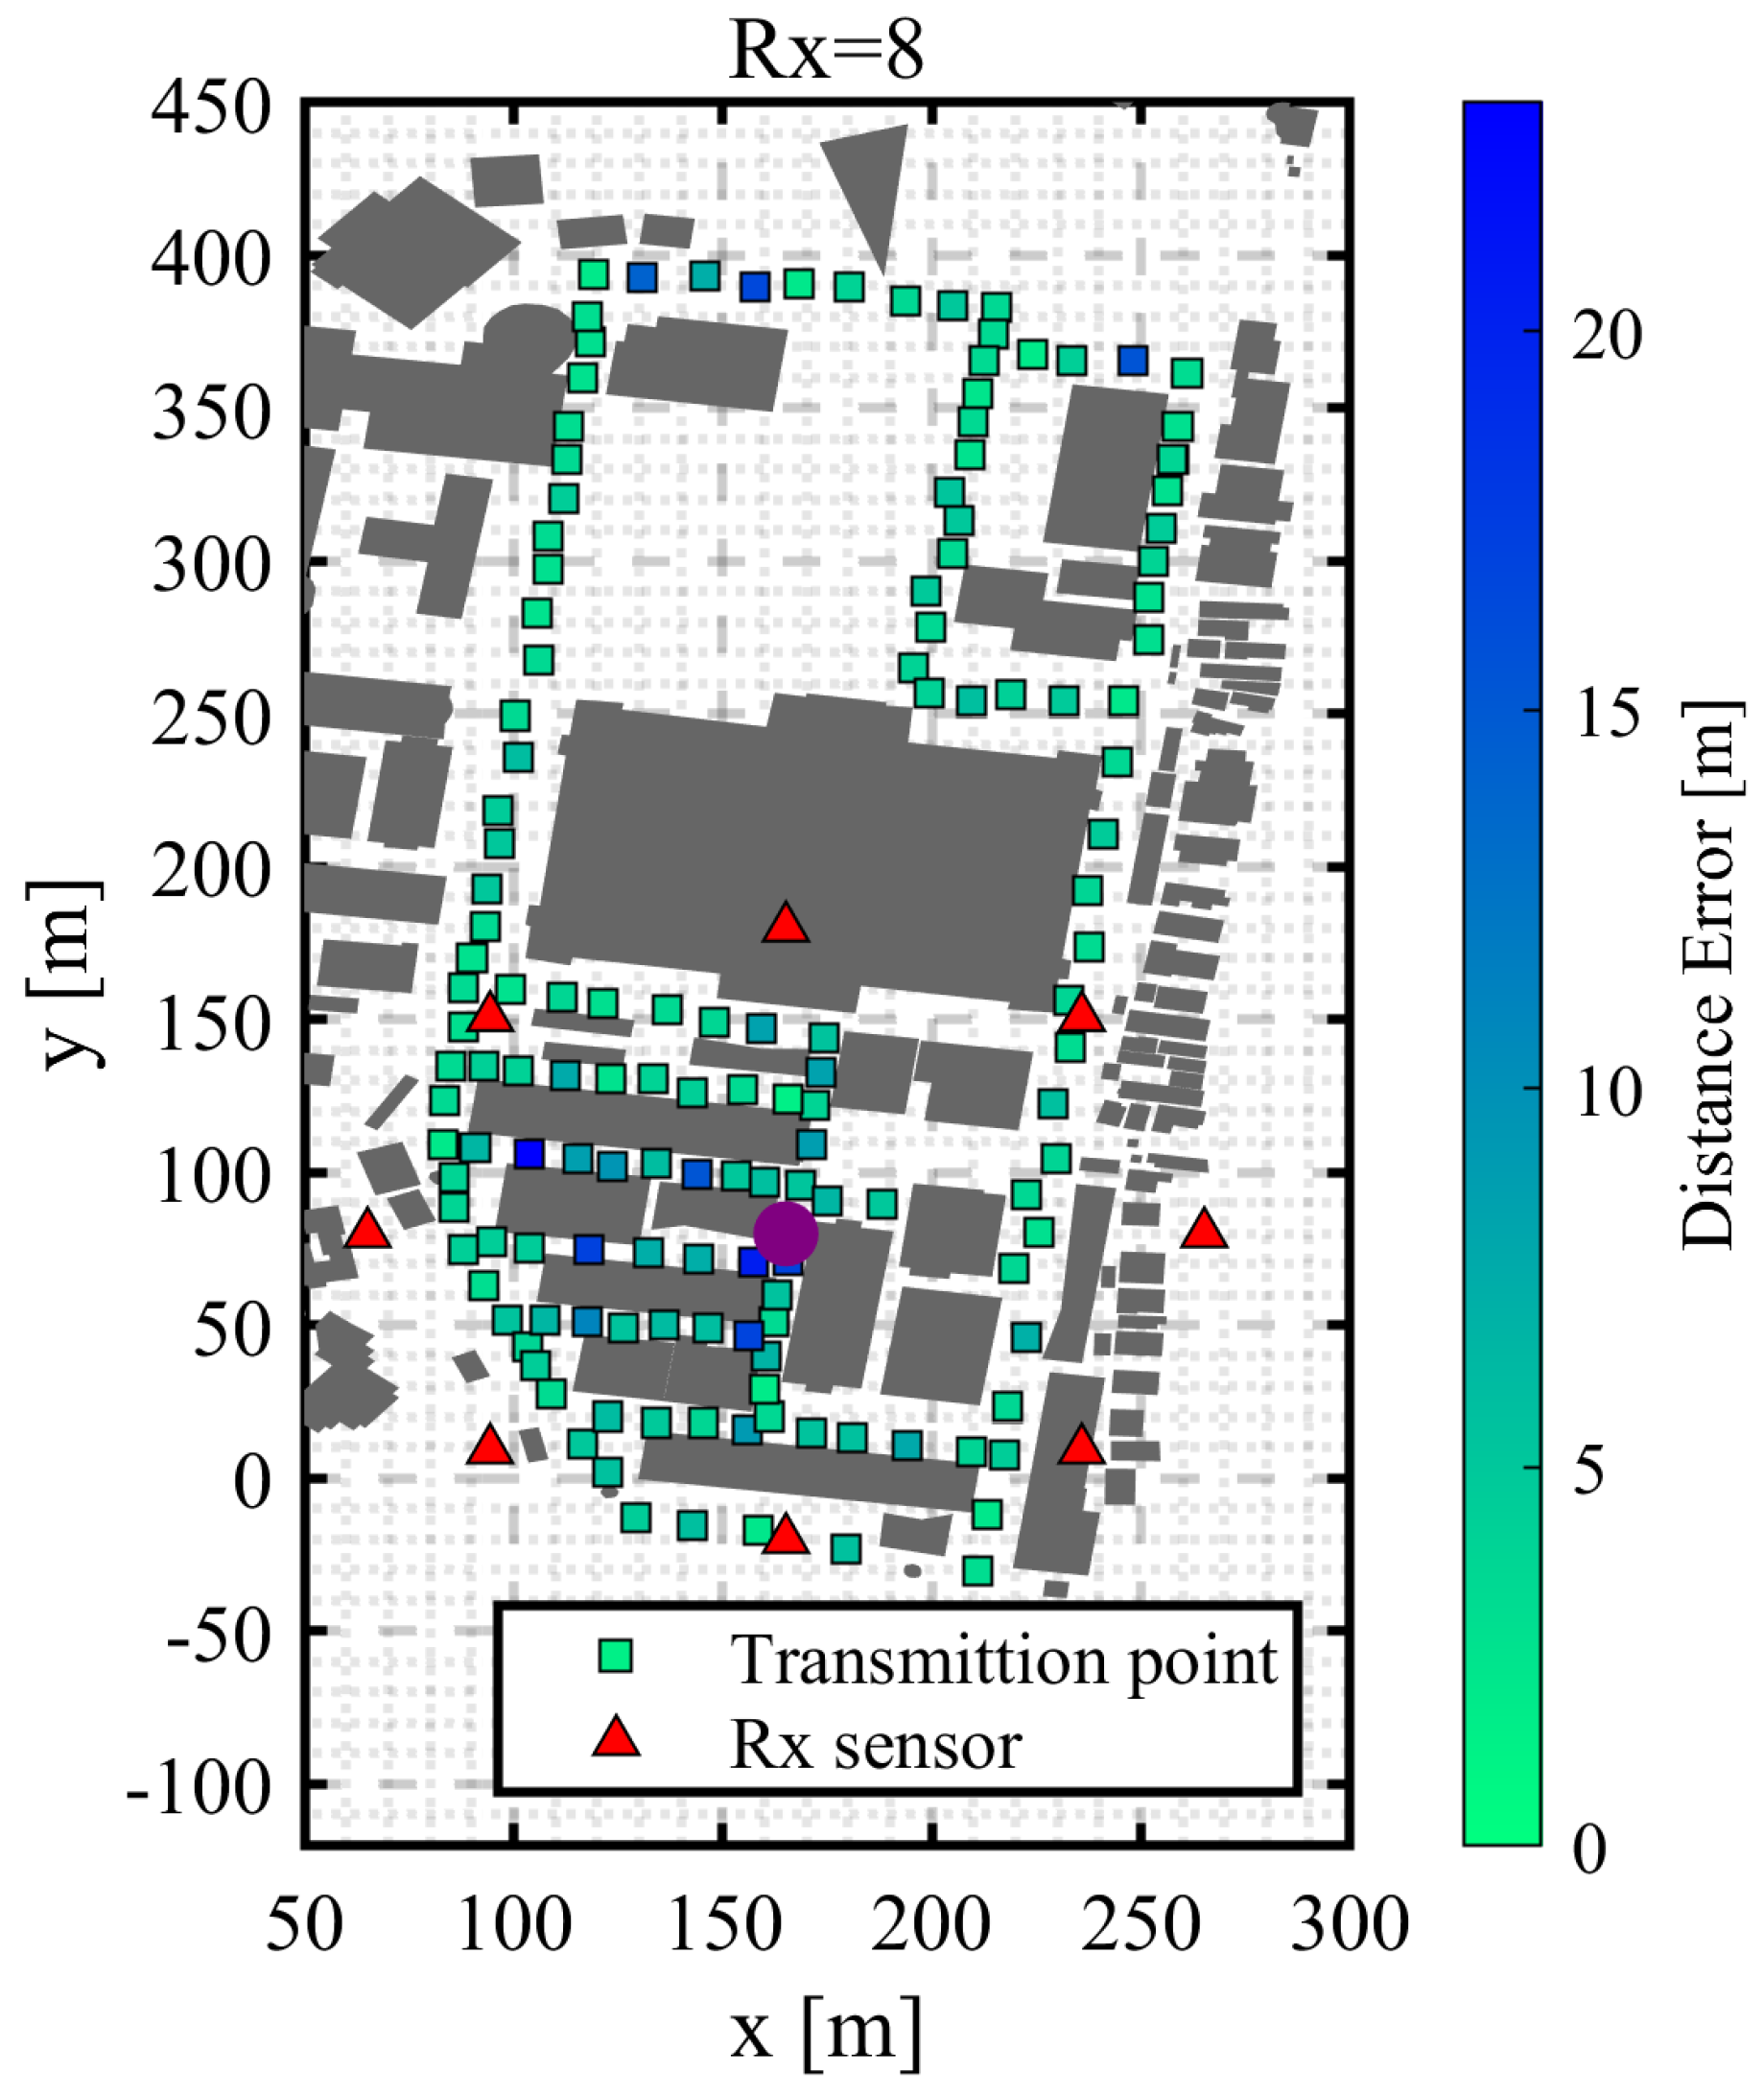
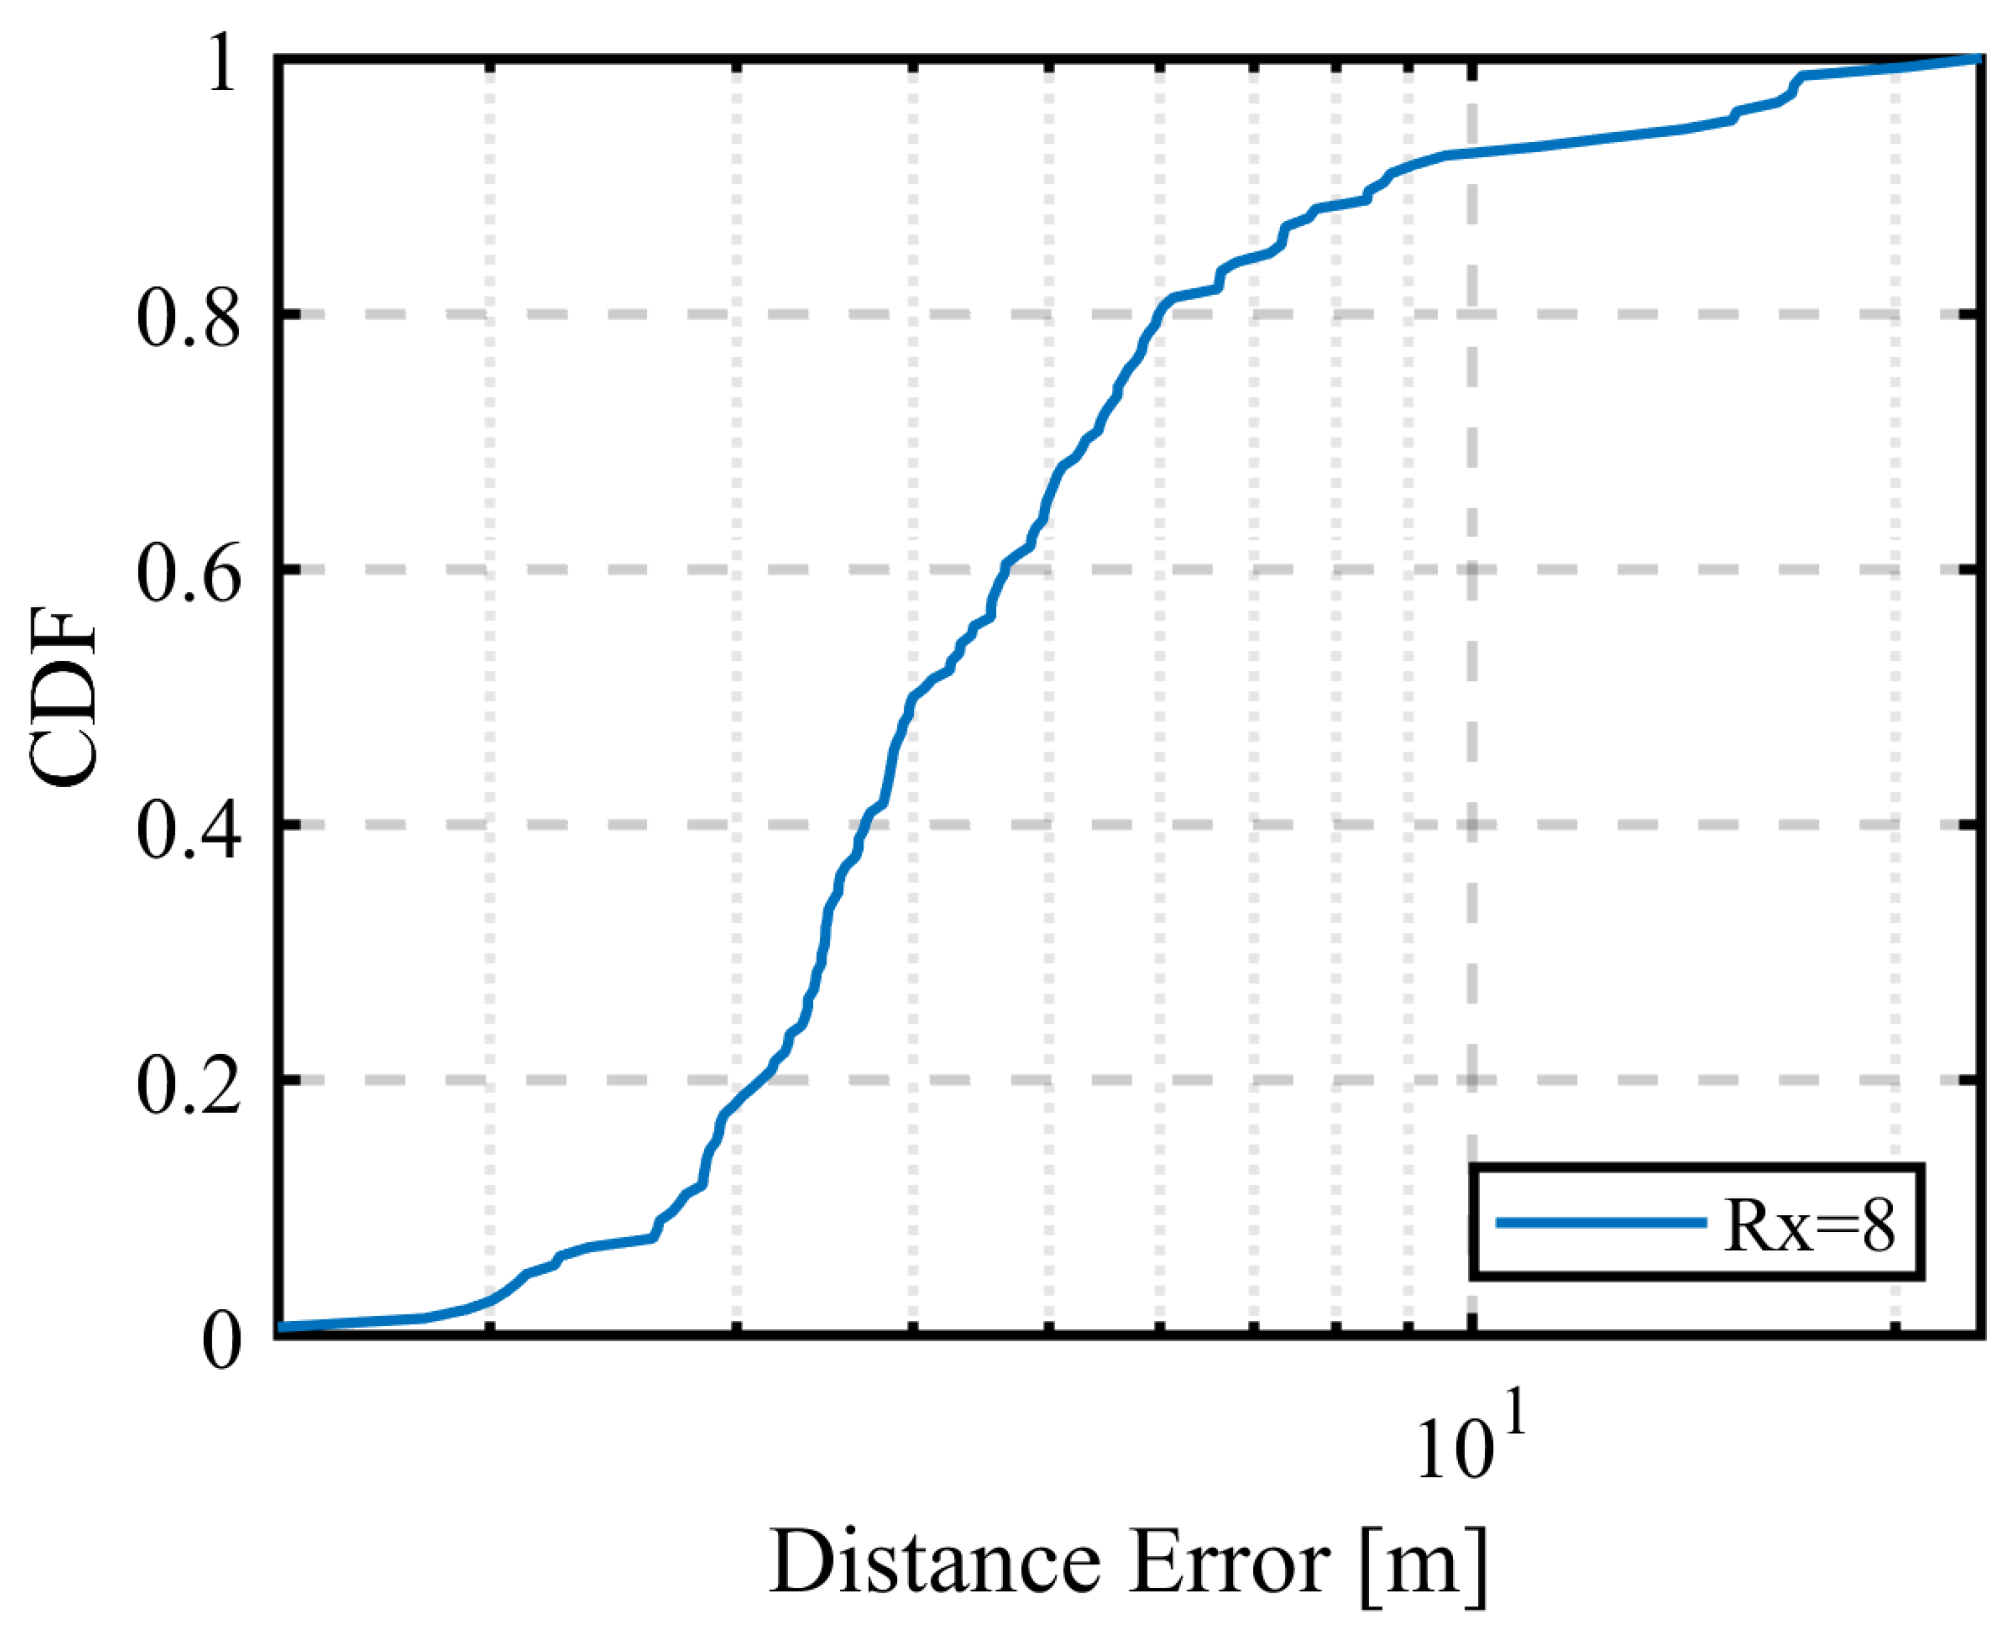
As shown in Figure 22, the localization errors using the HYBRID method are uniformly small across the entire area and significantly lower than those observed with RSSI or AOA alone. This indicates that combining distance- and direction-based features enhances localization stability even in NLoS environments. Figure 23 confirms that 90% of the sources were localized within approximately 8.7 m, with a steep CDF slope and minimal outliers.
This result suggests that the hybrid integration of RSSI, AOA, and EOA reduces uncertainty and compensates for the weaknesses of individual signal features. These findings extend the previous works by Tanaka [10], who demonstrated the benefit of combining RSSI and AOA, and Kamei [8], who improved RSSI-based localization accuracy through UAV trajectory optimization. The present study combines these two directions and further improves robustness by including EOA and jointly optimizing signal feature selection and UAV path design.

4.1.4. Comparison of RSSI, AOA, and HYBRID Results

The localization errors categorized by different radio signal information are shown in Figure 24 and Table 3.
Table 3 summarizes the localization performance for each type of radio signal information in terms of mean error and the 90% cumulative distribution function (CDF90) value. Among the three methods, the HYBRID model achieved the highest accuracy, with an average error of 5.3 m and a CDF90 value of 8.7 m. The CDF also exhibits a steep slope with minimal outliers, indicating faster convergence and greater estimation stability.
In contrast, the RSSI model showed the poorest performance, with a mean error of 16.4 m and 90% of sources within 41.9 m. Large outliers are frequently observed, which reflects the sensitivity of RSSI to multipath fading and shadowing in NLoS environments. These results are consistent with findings by Tan and Zhao [3], who showed that RSSI-based fingerprinting suffers from high variability and performs poorly in urban scenarios unless enhanced with additional signal features. Similarly, Murata et al. [5] emphasized the advantage of using UAV-based sensing and feature integration in environments where signal propagation is highly complex. The AOA model performed moderately, localizing 90% of sources within 14.8 m. While its average performance is better than RSSI, it is still affected by angular ambiguity, especially in areas with significant reflection or diffraction.
Overall, the HYBRID approach effectively compensates for the limitations of individual features—RSSI’s vulnerability to shadowing and AOA’s susceptibility to reflection—by combining distance- and direction-based indicators. This aligns with prior work by Tanaka [10], who proposed combining RSSI and AOA, and Kamei [8], who improved localization performance by optimizing UAV trajectories for RSSI measurements. The present study builds upon these directions by including EOA and optimizing both feature integration and UAV path design, leading to improved robustness and accuracy.

4.2. Circular Trajectory Placement with Varying Radius

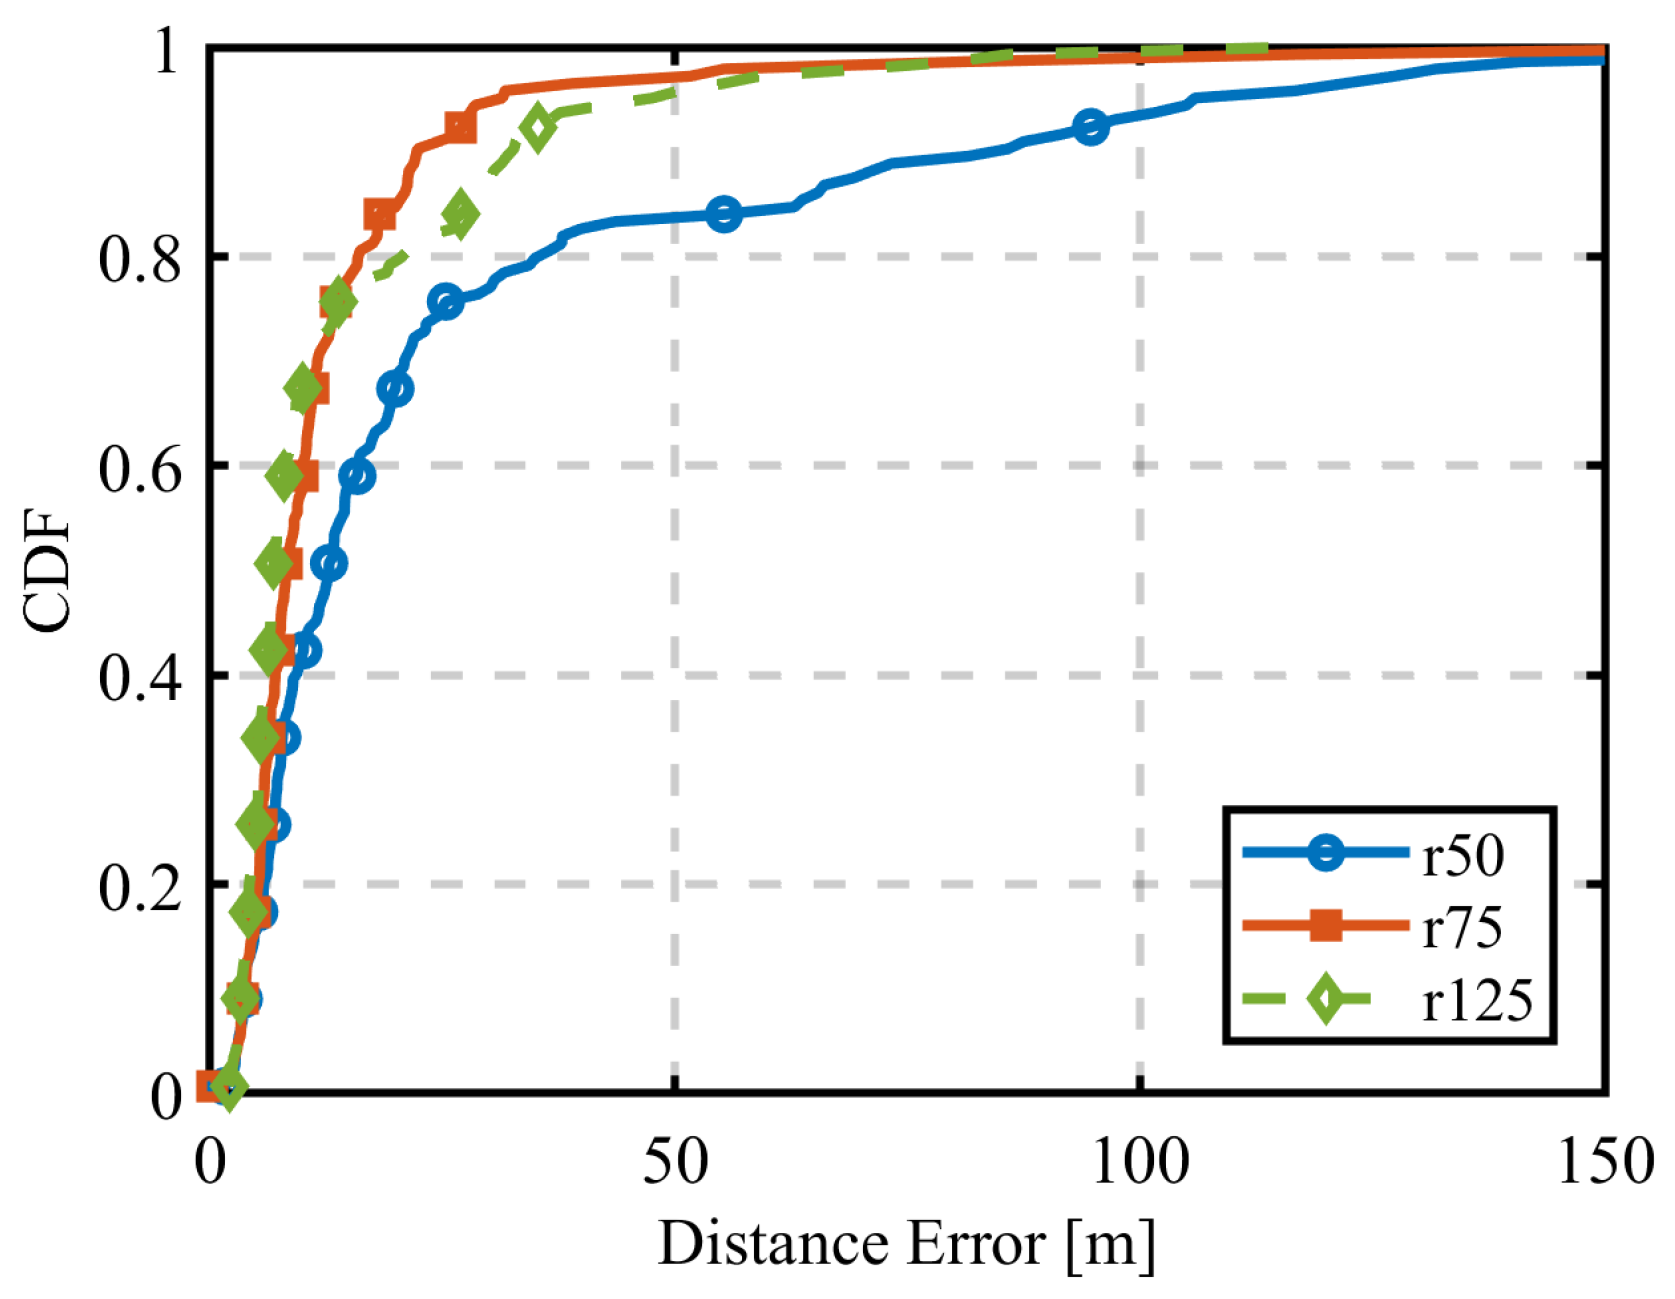
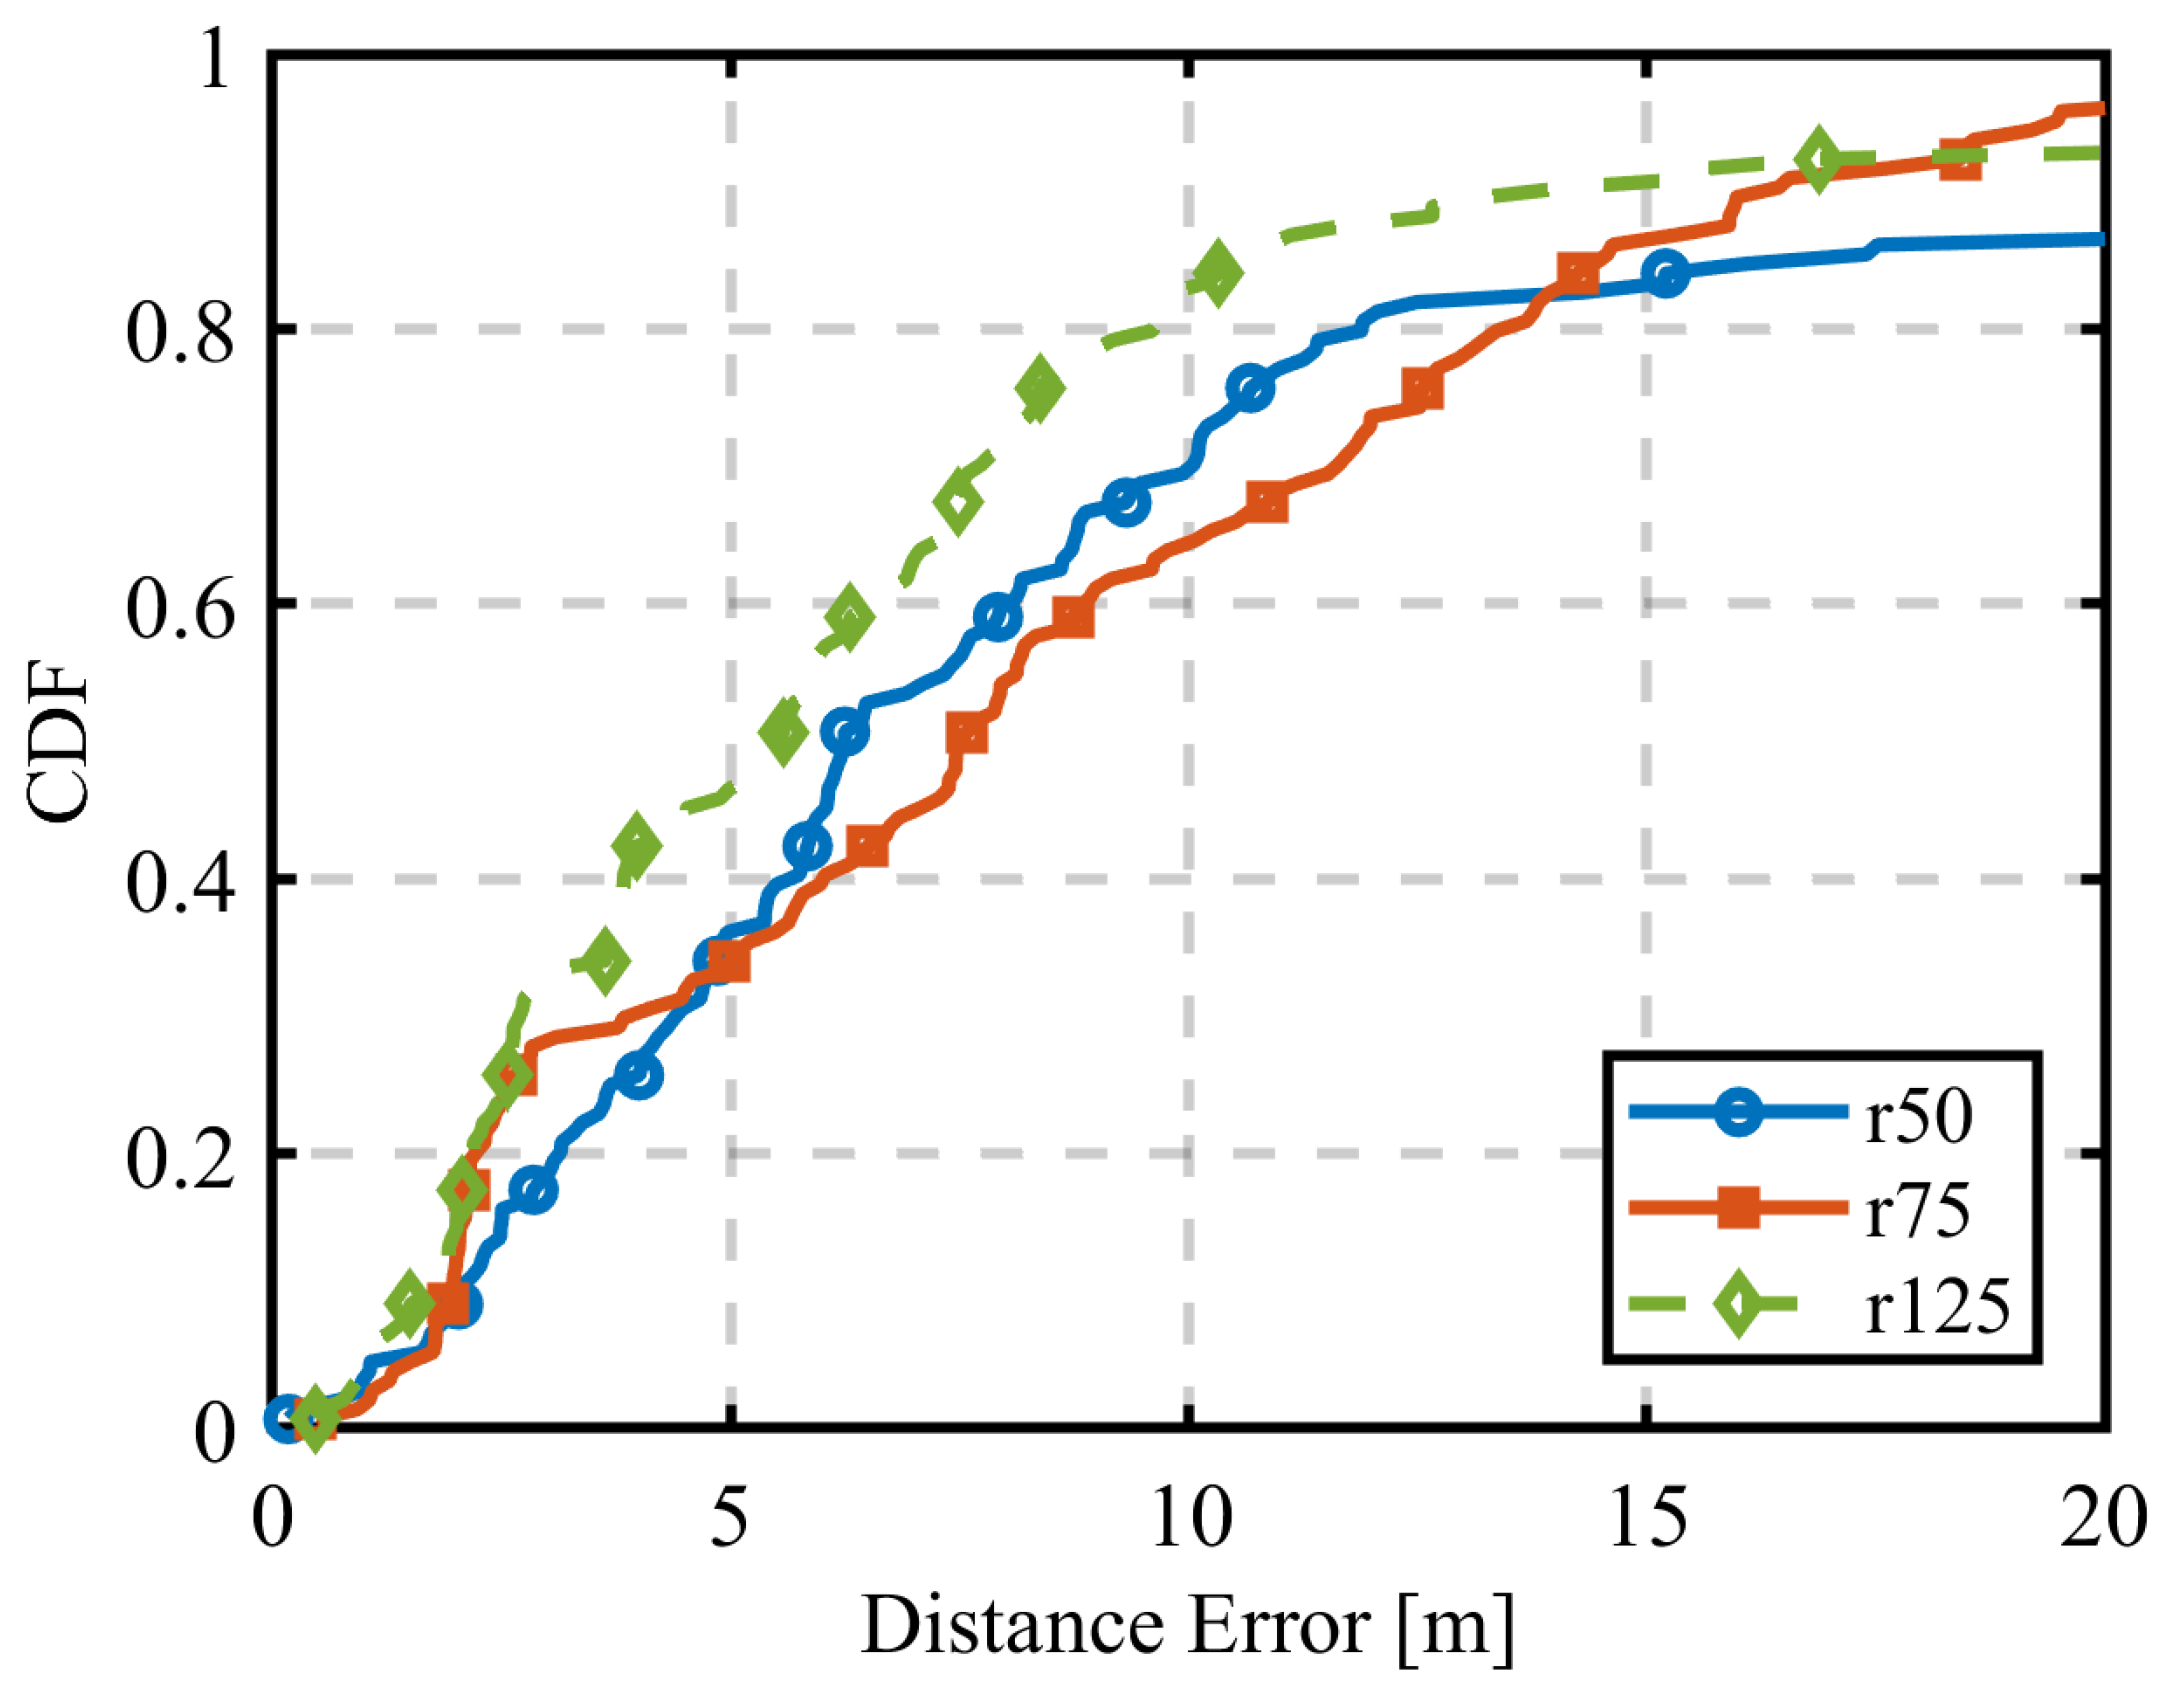
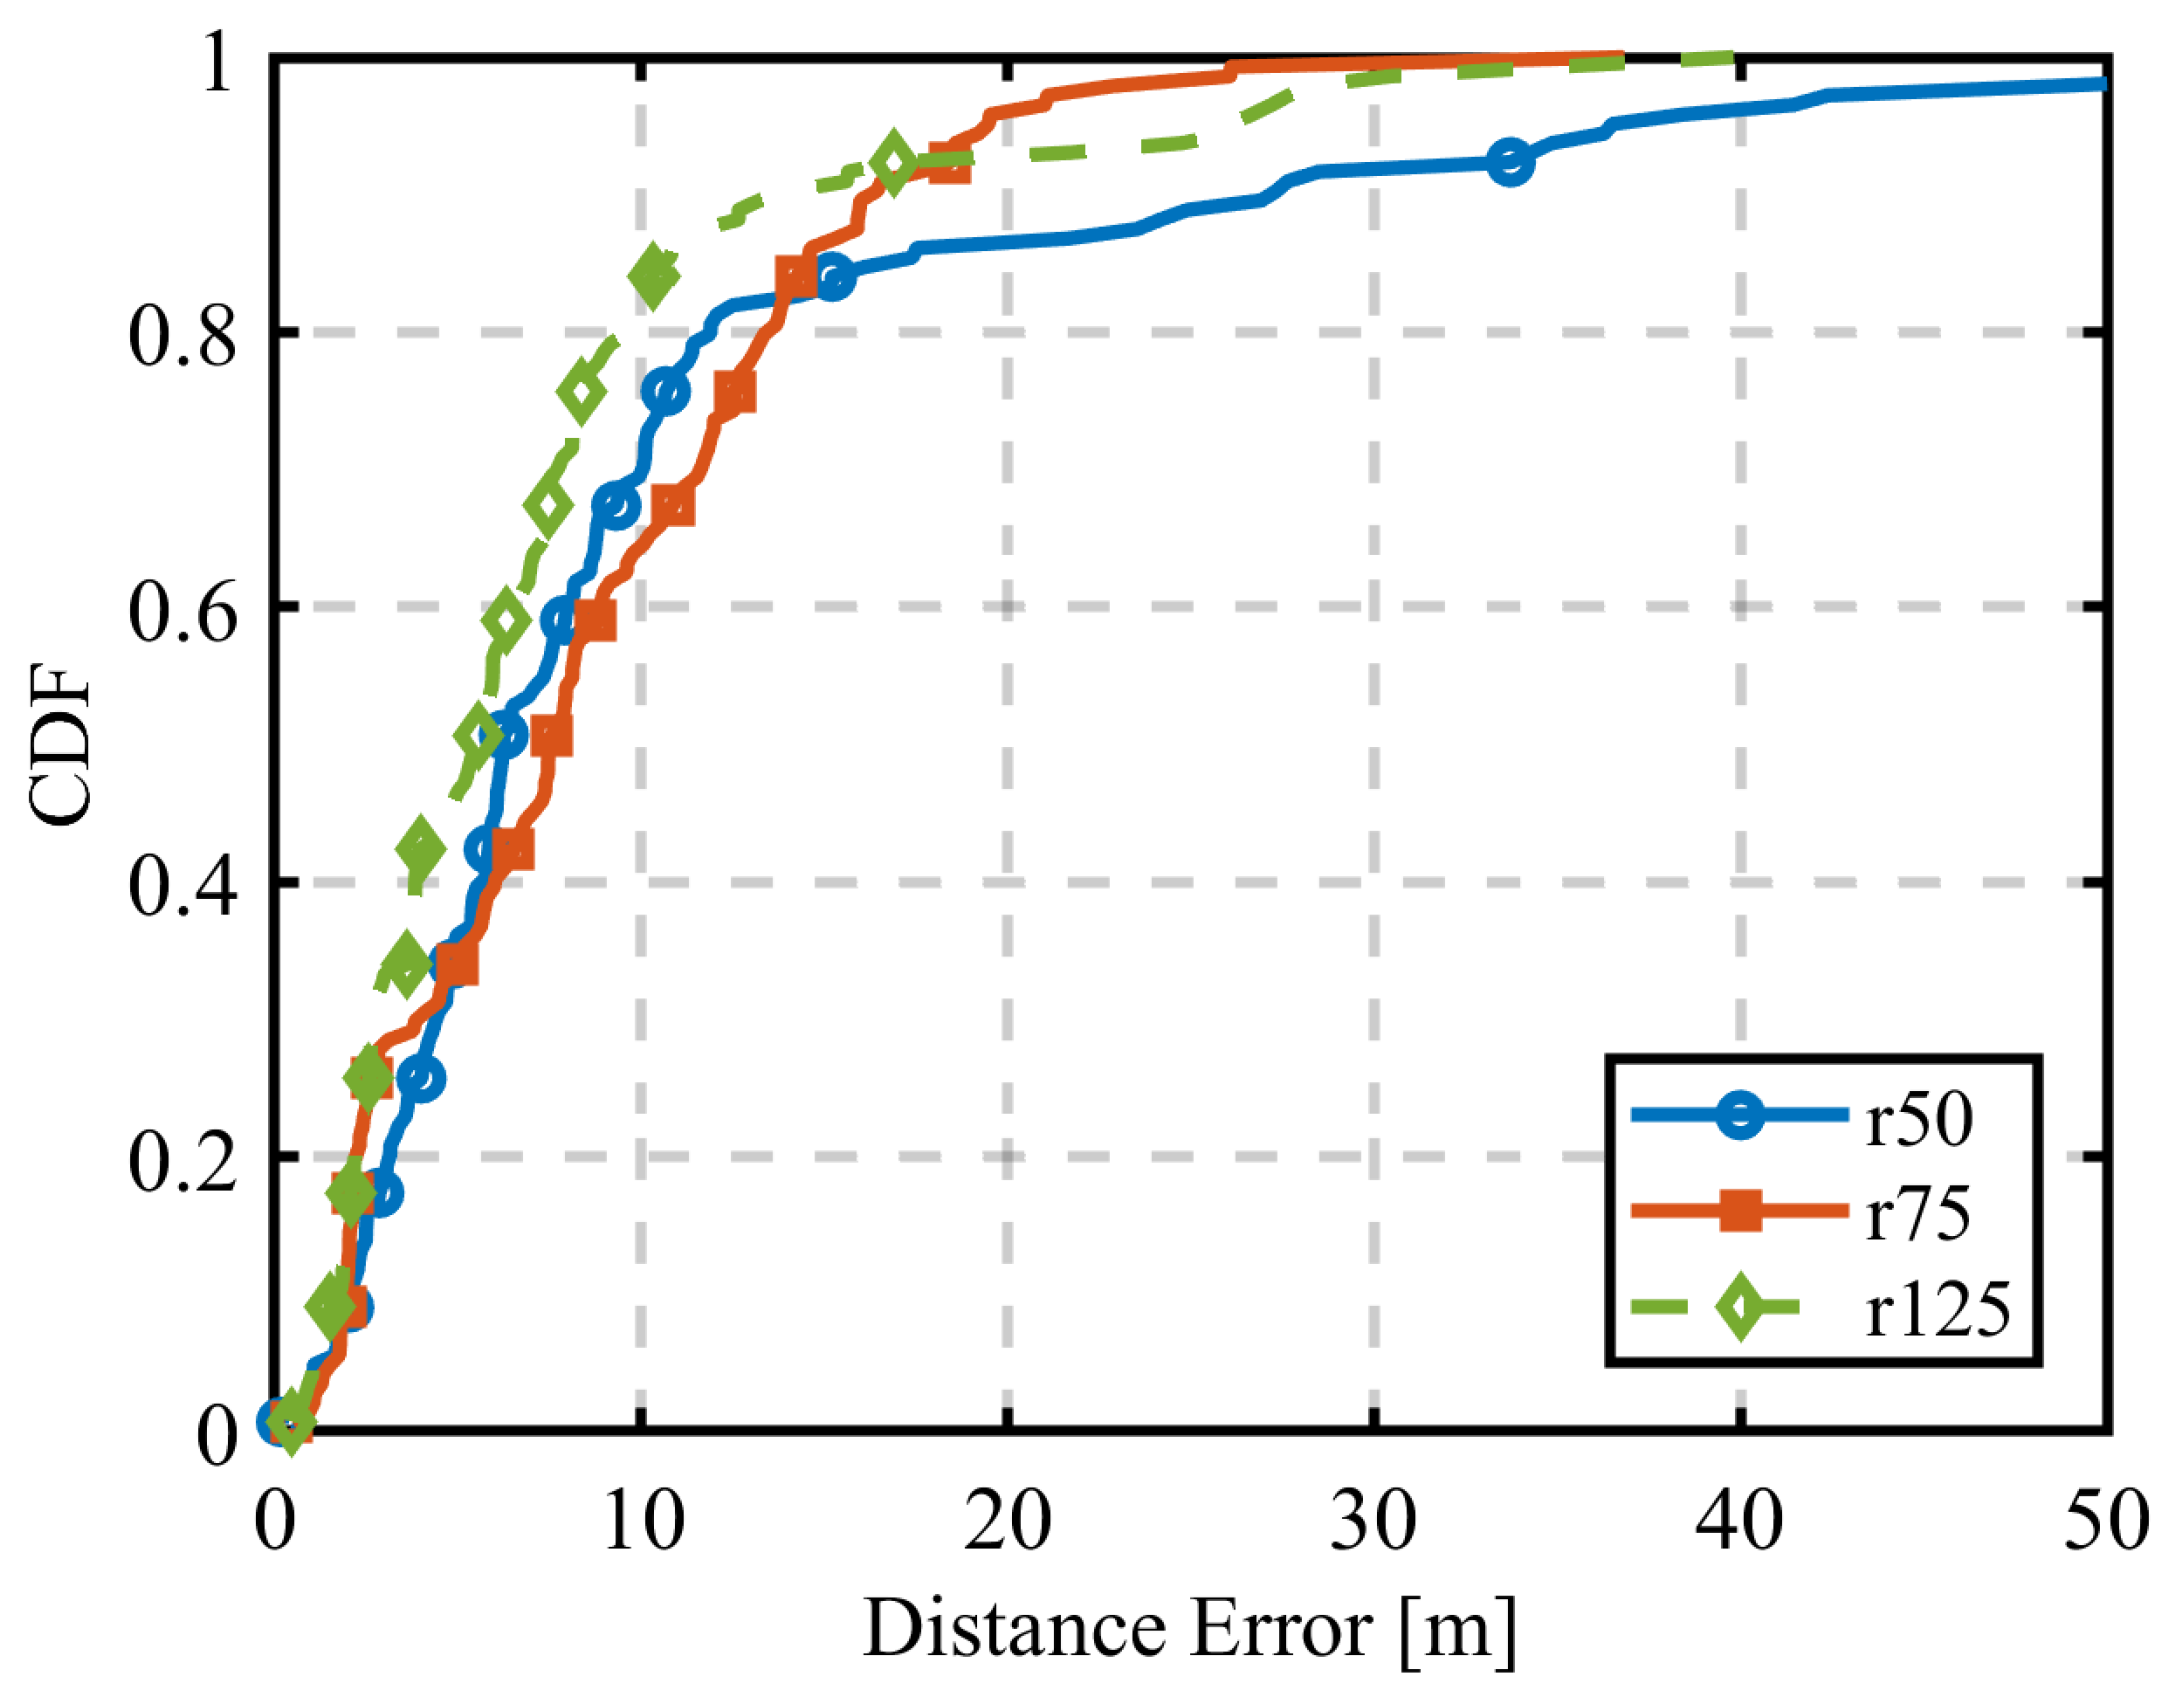
In the previous section, the radius was set to approximately 100 m, which comprehensively encompassed the campus. In this section, the radius was varied to investigate the dependence of localization errors on trajectory radius using RSSI and AOA. Simulations were conducted for five different trajectory radii: 50 m, 75 m, 100 m, 125 m, and 150 m. The results are shown in Figure 25, Figure 26 and Figure 27.
As shown in Figure 25, an increasing trajectory radius in RSSI-based localization generally led to improved accuracy. However, at 150 m, the localization accuracy deteriorated, indicating that simply increasing the radius does not necessarily yield better results; instead, an optimal trajectory radius must be determined. One possible reason is that in RSSI-based localization, reducing the radius decreases the Tx–Rx distance, leading to weaker signal attenuation. As a result, noise has a greater impact, degrading localization performance. This observation is consistent with findings by Chuku and Nasipuri [18], who emphasized the need for radius-aware weighting in RSSI-based positioning to address spatial ambiguity.
On the other hand, Figure 26 shows that AOA-based localization exhibited low sensitivity to trajectory radius. This suggests that increasing the radius does not significantly contribute to reducing angular estimation errors. This may be attributed to the relatively consistent angular spread maintained across the circular trajectory, though very large radii could reduce angular resolution in some NLoS scenarios.
In addition, our results indicate that the HYBRID method maintains high accuracy across all radii tested, showing robustness against both distance-related and direction-related disturbances. This robustness supports findings by Murata et al. [5], who highlighted the effectiveness of multi-feature UAV sensing in complex environments. Similarly, Nanos et al. [19] reported that GNSS-based systems benefit from optimized observation geometry, aligning with the concept of optimal radius in UAV path design.

4.3. Sequential Estimation

4.3.1. Results for the First Estimation Using RSSI

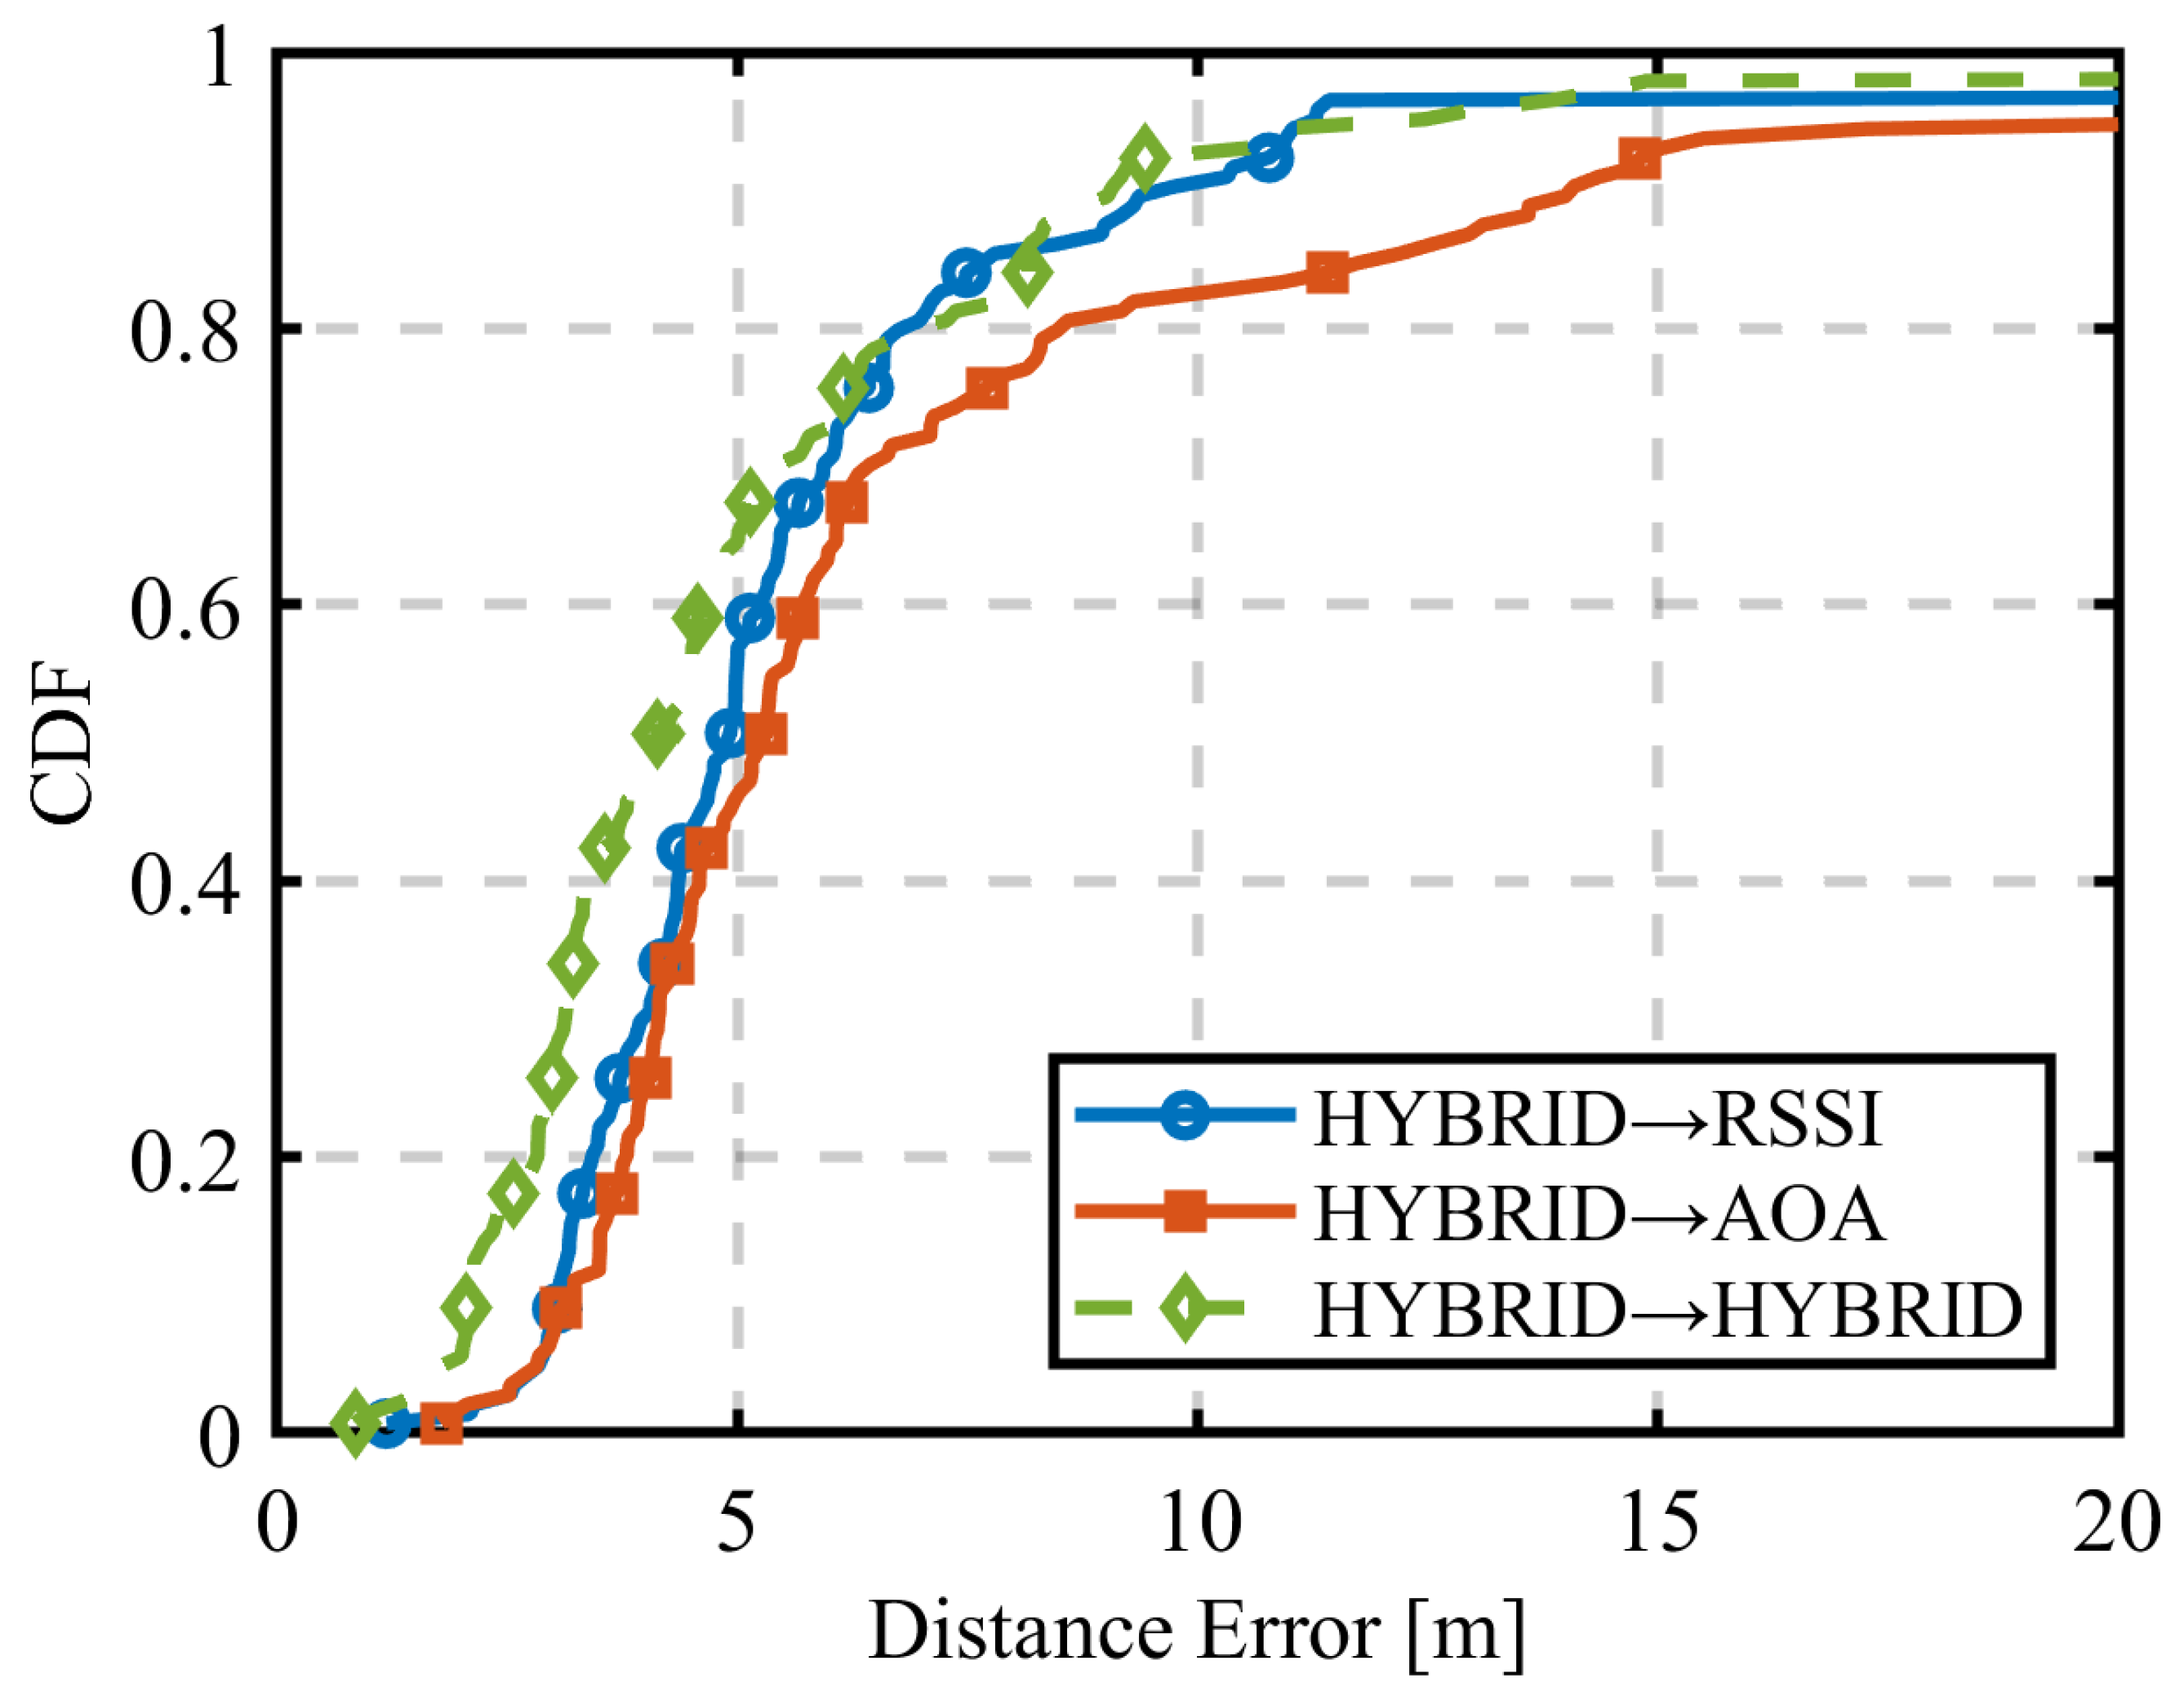
The cumulative distribution function (CDF) summarizing the results of the second estimation using RSSI, AOA, and HYBRID after the first estimation with RSSI is shown in Figure 28. The figure indicates that using AOA or HYBRID for the second estimation leads to faster CDF convergence and higher localization accuracy compared to using RSSI for both estimations. Similar to the first estimation, using RSSI for the second estimation results in a larger number of significant outliers with high localization errors. This suggests that the second estimation was not sufficient to correct these large errors.
This improvement is particularly noticeable in the reduction of outliers and in the steeper slope of the CDF. These results support the idea that incorporating directional information in the second step—either through AOA or HYBRID—helps to compensate for the limitations of RSSI, which is highly sensitive to multipath and noise. This observation aligns with findings from Le et al. [20], who showed that the fusion of multiple features, including RSSI and AOA, enhances localization robustness under NLoS conditions. Similarly, Dhital et al. [21] demonstrated that sequential Bayesian estimation methods, such as particle filters, can effectively suppress outliers by continuously refining the estimate. Our results are consistent with this finding, especially when comparing the RSSI→HYBRID combination with RSSI→RSSI, which leaves more sources with large localization errors. When HYBRID is applied with a strong weighting toward RSSI, the RSSI→HYBRID approach improves accuracy compared to RSSI→RSSI. However, it still includes some sources with large localization errors, indicating that the second estimation is not always sufficient to correct poor initial estimates. This limitation is also noted by Yu et al. [22], who emphasized the need for high-quality initial estimations in sequential localization using Gaussian processes.

4.3.2. Results for the First Estimation Using AOA

The results of the first estimation using AOA are shown in Figure 29. Among the three scenarios, the best localization accuracy was achieved with AOA → HYBRID. In all three scenarios, there was no significant difference in the median localization error. This indicates that for nearly half of the sources, the choice of sequential estimation method had little impact on localization accuracy.
However, the HYBRID approach resulted in a greater number of sources with high localization accuracy. This suggests that the inclusion of RSSI in the HYBRID approach allowed for the incorporation of distance-related features, which slightly enhanced localization performance. The benefit is particularly evident when the original AOA estimation does not fully capture positional nuances. Interestingly, around the CDF 90% region, there was no substantial difference between AOA → RSSI and AOA → HYBRID. This implies that adding RSSI in the second step has limited impact on correcting large localization errors, likely due to its high sensitivity to noise. This observation aligns with Nanos et al. [19], who reported that adding distance-based metrics does not always yield further improvements when directional estimation is already stable.
Furthermore, RSSI as a secondary update was effective in removing prominent outliers in several cases. Chuku and Nasipuri [18] discussed similar effects in their indoor positioning study, noting that appropriate weighting of RSSI and direction can suppress extreme deviations even under multipath conditions. Figure 29 illustrates that while the hybrid approach has potential in refining moderate errors, its impact on large-error sources appears limited when AOA is already used initially.

4.3.3. Results for the First Estimation Using HYBRID

The results of the first estimation using HYBRID are shown in Figure 30. Among the three scenarios, the highest localization accuracy was achieved with HYBRID → HYBRID. In terms of the median localization error (CDF 50%), HYBRID → HYBRID exhibited the highest accuracy. However, around the CDF90 region, there was no significant difference between HYBRID → HYBRID and HYBRID → RSSI. This suggests that while using HYBRID for the second estimation improves the overall accuracy for a large number of sources, it does not substantially reduce large localization errors. In other words, sequential estimation may have limited corrective power when the initial estimate is already comprehensive and well-optimized.
This limitation is discussed by Yu et al. [22], who noted that in Gaussian process-based sequential estimation, highly accurate priors can lead to limited improvement in subsequent updates. Similarly, Qiu et al. [23] proposed a real-time hybrid localization system that dynamically reweights signal features based on environmental changes. They argue that static weighting strategies may fail to correct for extreme cases, especially when error sources are systematic rather than random. Our results suggest that integrating adaptive mechanisms into hybrid models—such as dynamically adjusting feature weights or selecting alternative observation paths—may be a fruitful direction for future research.
As summarized in Figure 28, Figure 29 and Figure 30, using HYBRID in the second stage consistently led to improved localization accuracy across different initial modalities. This improvement is attributed to the complementary nature of the features: RSSI provides coarse distance information, AOA provides angular directionality, and EOA incorporates elevation variation. By integrating these in the HYBRID model, it is possible to suppress large errors and achieve faster convergence in the cumulative distribution. These results indicate that performing a coarse initial localization followed by refined estimation using HYBRID is effective even in challenging environments with non-line-of-sight propagation. This suggests that the hybrid model’s ability to leverage multiple signal dimensions allows it to recover from poor initial estimates and achieve robust performance.

5. Conclusions

This study proposed a hybrid fingerprinting-based localization method that integrates RSSI, AOA, and EOA features, combined with UAV trajectory optimization to enhance localization accuracy. Evaluation using ray tracing data in a realistic outdoor environment demonstrated the effectiveness of the HYBRID model over RSSI-only and AOA-only methods, particularly under NLoS conditions (Section 4.1.4). Additionally, the HYBRID approach showed robustness to changes in UAV trajectory geometry (Section 4.2). Sequential estimation was found to significantly improve accuracy when the initial modality was weak (e.g., RSSI; Section 4.3.1), but offered limited benefits when starting from a stronger estimate (e.g., AOA or HYBRID; Section 4.3.2 and Section 4.3.3).
In summary, this study revealed several key insights. First, the integration of RSSI, AOA, and EOA features in the HYBRID model consistently improved localization accuracy, especially under multipath and NLoS conditions. Second, UAV trajectory radius significantly affected RSSI-based localization, while AOA and HYBRID models showed resilience to geometric variations. Third, sequential estimation proved highly effective when the initial estimate was poor (e.g., with RSSI), but had limited benefit when starting from robust estimates (e.g., AOA or HYBRID). These findings were obtained through simulation-based evaluation using ray-tracing data within a specific urban area (Tokyo Tech’s Ookayama campus) and assuming a stationary transmitter. While the results may not generalize directly to all environments or mobile-source scenarios, they provide meaningful implications for designing robust localization strategies in realistic settings. The proposed framework has the potential to contribute to future applications, such as illegal radio monitoring or emergency transmitter localization, where rapid and accurate estimation is critical.

Author Contributions

Writing—original draft, T.T.; Writing—review & editing, G.K.T.; Supervision, G.K.T. All authors have read and agreed to the published version of the manuscript.

Funding

This research received no external funding.

Data Availability Statement

The original contributions presented in this study are included in the article. Further inquiries can be directed to the corresponding authors.

Conflicts of Interest

The authors declare no conflicts of interest.

References

  1. Ministry of Internal Affairs and Communications, Japan. Latest Trends in Radio Policy. Available online: https://www.soumu.go.jp/main_content/000932571.pdf (accessed on 17 March 2025).
  2. Ministry of Internal Affairs and Communications, Japan. Overview of Illegal Radio Station Countermeasures. Available online: https://www.tele.soumu.go.jp/j/adm/monitoring/summary/ad_pro/index.htm (accessed on 17 March 2025).
  3. Tan, J.; Zhao, H. UAV Localization with Multipath Fingerprints and Machine Learning in Urban NLOS Scenario. In Proceedings of the 2020 IEEE 6th International Conference on Computer and Communications (ICCC), Chengdu, China, 11–14 December 2020; pp. 1551–1557. [Google Scholar] [CrossRef]
  4. He, S.; Chan, S.-H.G. Wi-Fi Fingerprint-Based Indoor Positioning: Recent Advances and Comparisons. IEEE Commun. Surv. Tutor. 2015, 18, 466–490. [Google Scholar] [CrossRef]
  5. Murata, S.; Matsuda, T.; Hiraguri, T. Multiple-wave source localization using UAVs in NLOS environments. IEICE Commun. Express ComEX 2020, 13, 375–378. [Google Scholar] [CrossRef]
  6. Zhou, L.; Ning, X.; You, M.Y.; Zhang, R.; Shi, Q. Robust Multi-UAV Placement Optimization for AOA-Based Cooperative Localization. IEEE Trans. Intell. Veh. 2024; 1–15, Early Access. [Google Scholar] [CrossRef]
  7. Azari, A.; Ghavimi, F.; Ozger, M.; Jantti, R.; Cavdar, C. Machine Learning assisted Handover and Resource Management for Cellular-Connected Drones. In Proceedings of the 2020 IEEE 91st Vehicular Technology Conference (VTC2020-Spring), Antwerp, Belgium, 25–28 May 2020. [Google Scholar]
  8. Kamei, T. Investigation on Outdoor Positioning Using Fingerprinting Method and UAV Flight Path Optimization. Master’s Thesis, Tokyo Institute of Technology, Tokyo, Japan, 2022. [Google Scholar]
  9. Fujita, N.; Chauvet, N.; Röhm, A.; Horisaki, R.; Li, A.; Hasegawa, M. Efficient Pairing in Unknown Environments: Minimal Observations and TSP-Based Optimization. IEEE Access 2022, 10, 57630–57640. [Google Scholar] [CrossRef]
  10. Tanaka, S. Study on Sensor Placement for Outdoor Radio Source Localization Using UAVs. Master’s Thesis, Tokyo Institute of Technology, Tokyo, Japan, 2020. [Google Scholar]
  11. Thomas, T.; Vook, F.; Mellios, E.; Hilton, G.S.; Nix, A.R.; Visotsky, E. 3D Extension of the 3GPP/ITU Channel Model. In Proceedings of the IEEE Vehicular Technology Conference (VTC Spring), Dresden, Germany, 2–5 June 2013; pp. 1–5. [Google Scholar] [CrossRef]
  12. Zhang, R.; Lu, X.; Zhao, J.; Cai, L.; Wang, J. Measurement and Modeling of Angular Spreads of 3D Urban Street Channels. IEEE Trans. Veh. Technol. 2017, 66, 3555–3570. [Google Scholar] [CrossRef]
  13. Tran, G.K.; Kamei, T.; Tanaka, S. Route Optimization of Unmanned Aerial Vehicle Sensors for Localization of Wireless Emitters in Outdoor Environments. Network 2023, 3, 326–342. [Google Scholar] [CrossRef]
  14. Holis, J.; Pechac, P. Elevation Dependent Shadowing Model for Mobile Communications via High Altitude Platforms in Built-up Areas. IEEE Trans. Antennas Propag. 2008, 56, 1078–1084. [Google Scholar] [CrossRef]
  15. Gu, Y.; Lo, A.; Niemegeers, I. A Survey of Indoor Positioning Systems for Wireless Personal Networks. IEEE Commun. Surv. Tutor. 2009, 11, 13–32. [Google Scholar] [CrossRef]
  16. Kennedy, J.; Eberhart, R. Particle Swarm Optimization. In Proceedings of the IEEE International Conference on Neural Networks, Perth, Australia, 27 November–1 December 1995; Volume 4, pp. 1942–1948. [Google Scholar]
  17. Shimizu, Y. Introduction to Optimization Engineering: A Smart Decision-Making Workbench; Corona Publishing Co.: San Antonio, TX, USA, 2010. [Google Scholar]
  18. Chuku, N.; Nasipuri, A. RSSI-Based Localization Schemes for Wireless Sensor Networks Using Outlier Detection. J. Sens. Actuator Netw. 2021, 10, 10. Available online: https://www.mdpi.com/2224-2708/10/1/10 (accessed on 17 March 2025). [CrossRef]
  19. Nanos, N.; Isik, O.K.; Verdeguer Moreno, R.; Petrunin, I.; Tsourdos, A. UAV Path Planning Optimization based on GNSS Quality and Mission Requirements. In AIAA Scitech 2021 Forum; ARC: Kent, UK, 2021. [Google Scholar] [CrossRef]
  20. Le, A.T.; Tran, L.C.; Huang, X.; Ritz, C.; Dutkiewicz, E.; Phung, S.L.; Bouzerdoum, A.; Franklin, D. Unbalanced Hybrid AOA/RSSI Localization for Simplified Wireless Sensor Networks. Sensors 2020, 20, 3838. [Google Scholar] [CrossRef] [PubMed]
  21. Dhital, A.; Closas, P.; Fernández-Prades, C. Bayesian Filtering for Indoor Localization and Tracking in Wireless Sensor Networks. EURASIP J. Wirel. Commun. Netw. 2012, 2012, 21. [Google Scholar] [CrossRef]
  22. Yu, J.; Feng, Z.; Wang, J.; Zhang, P. Sequential Localization of Wireless Transmitters with UAVs Using Gaussian Processes. In Proceedings of the 2021 IEEE Global Communications Conference (GLOBECOM), Madrid, Spain, 7–11 December 2021; pp. 1–6. [Google Scholar] [CrossRef]
  23. Qiu, M.; Liu, B. Multi-Sensor Adaptive Weighted Data Fusion Based on Biased Estimation. Sensors 2024, 24, 3275. [Google Scholar] [CrossRef] [PubMed]
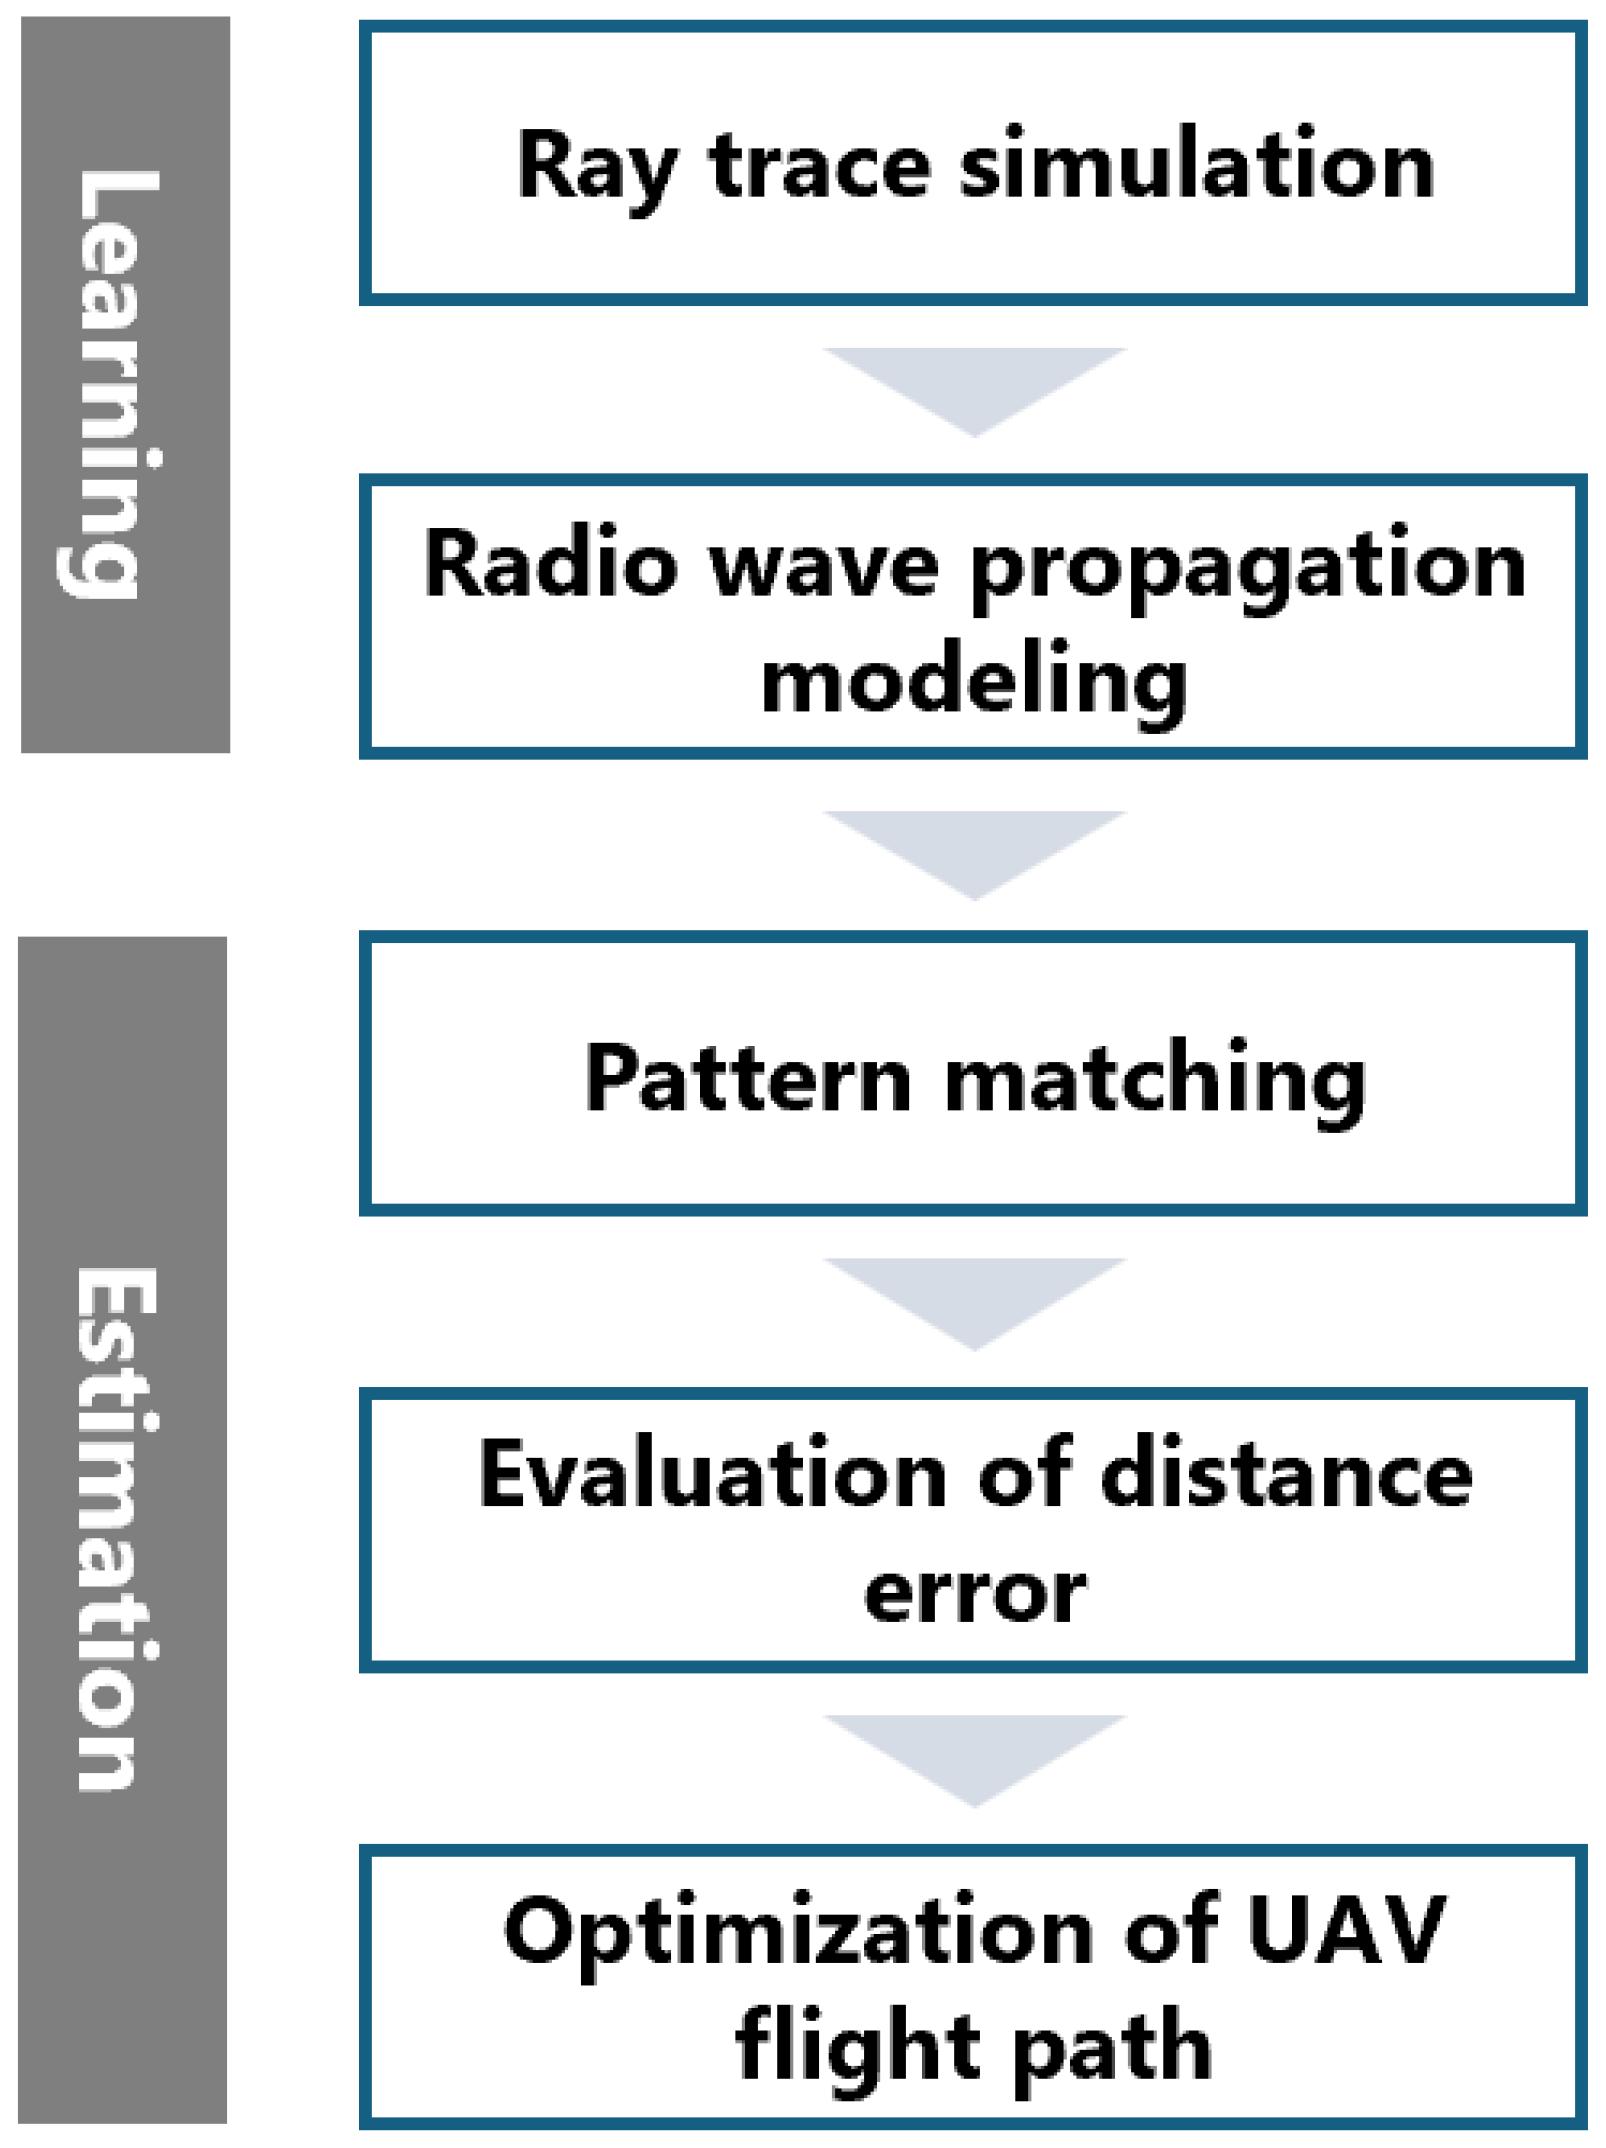
Figure 1. Flowchart of the proposed method.
Futureinternet 17 00224 g001
Figure 2. Simulation terrain model representing the Ōokayama Campus of the Institute of Science Tokyo. This environment includes multiple buildings and open roads to emulate realistic urban propagation [13].
Futureinternet 17 00224 g002
Figure 3. Layout This layout shows the positions of transmitters and candidate sensor points. Transmitters were placed at a height of 2 m, simulating the emission of illegal radio waves from ground level. UAV sensor points were distributed in a grid at various altitudes (50, 75, 100, 125, 150 m). The left blue region indicates the training area, the central "Target" area includes 144 target positions, and the right blue dots represent 983 UAV candidate positions for flight. This figure is based on previously published work [13], reproduced with proper citation.
Futureinternet 17 00224 g003
Figure 4. Candidate The figure illustrates receiver antenna positions at an altitude of 50 m and transmitter placement. Each dot represents a UAV measurement point. The red points indicate candidate receiver (Rx) antenna positions at 50 m altitude, while the green points represent transmitter (Tx) locations on the ground. The horizontal coverage ensures diversity in observation geometry, which is crucial for directional accuracy.
Futureinternet 17 00224 g004
Figure 5. Visualization of the LoS probability calculation process. The central dot represents a particle located at position u i . Eight neighboring discrete points surrounding the particle are evaluated, with each point classified as either LoS ( c k = 1 ) or NLoS ( c k = 0 ). The weight w i , k , calculated as the inverse of the distance d i , k between the particle and the k-th neighboring point, is used to compute the weighted average of LoS probabilities.
Futureinternet 17 00224 g005
Figure 6. In this study, a circular orbit with a radius of 100 m is primarily assumed for the UAV, as shown in Figure 6. This choice follows previous work by Kamei [8], demonstrating improved accuracy over random trajectories. Although this radius is fixed in the baseline setup, we later investigate the impact of varying the orbit radius on localization accuracy in Section 4.2.
Futureinternet 17 00224 g006
Figure 7. Distribution of RSSI values used in the training phase. These data form the basis of the location fingerprint database for RSSI-based localization.
Futureinternet 17 00224 g007
Figure 8. Overlay comparison between RSSI values from the training phase and those observed from the target during estimation. This confirms their distributional similarity.
Futureinternet 17 00224 g008
Figure 9. Distribution of AOA (angle of arrival) values used in the training phase. This dataset is used to estimate directionality in the fingerprinting method.
Futureinternet 17 00224 g009
Figure 10. Overlay comparison between AOA training and target data. This illustrates their consistency, validating the modeling approach for AOA-based localization.
Futureinternet 17 00224 g010
Figure 11. Elevation of arrival (EOA) distribution obtained during the training phase. This angle represents the vertical direction of signal arrival.
Futureinternet 17 00224 g011
Figure 12. Elevation angle (EOA) observed at the target position. Used to analyze deviations from training data in 3D localization environments.
Futureinternet 17 00224 g012
Figure 13. Comparison of EOA distributions between the training and target data. Larger discrepancies than RSSI and AOA suggest potential modeling limitations under multipath conditions.
Futureinternet 17 00224 g013
Figure 14. Overview of the sequential estimation process. (1) Global estimation is first performed using all 144 transmitters (Tx) to identify regions with high estimation error. (2) Transmission sources located in high-error areas, typically those affected by NLoS conditions (e.g., the southern part of the campus), are extracted. (3) Local estimation is then carried out by re-learning the NLoS-prone region, focusing on the extracted sources to improve overall accuracy. This iterative process enables region-specific refinement of the localization model.
Futureinternet 17 00224 g014
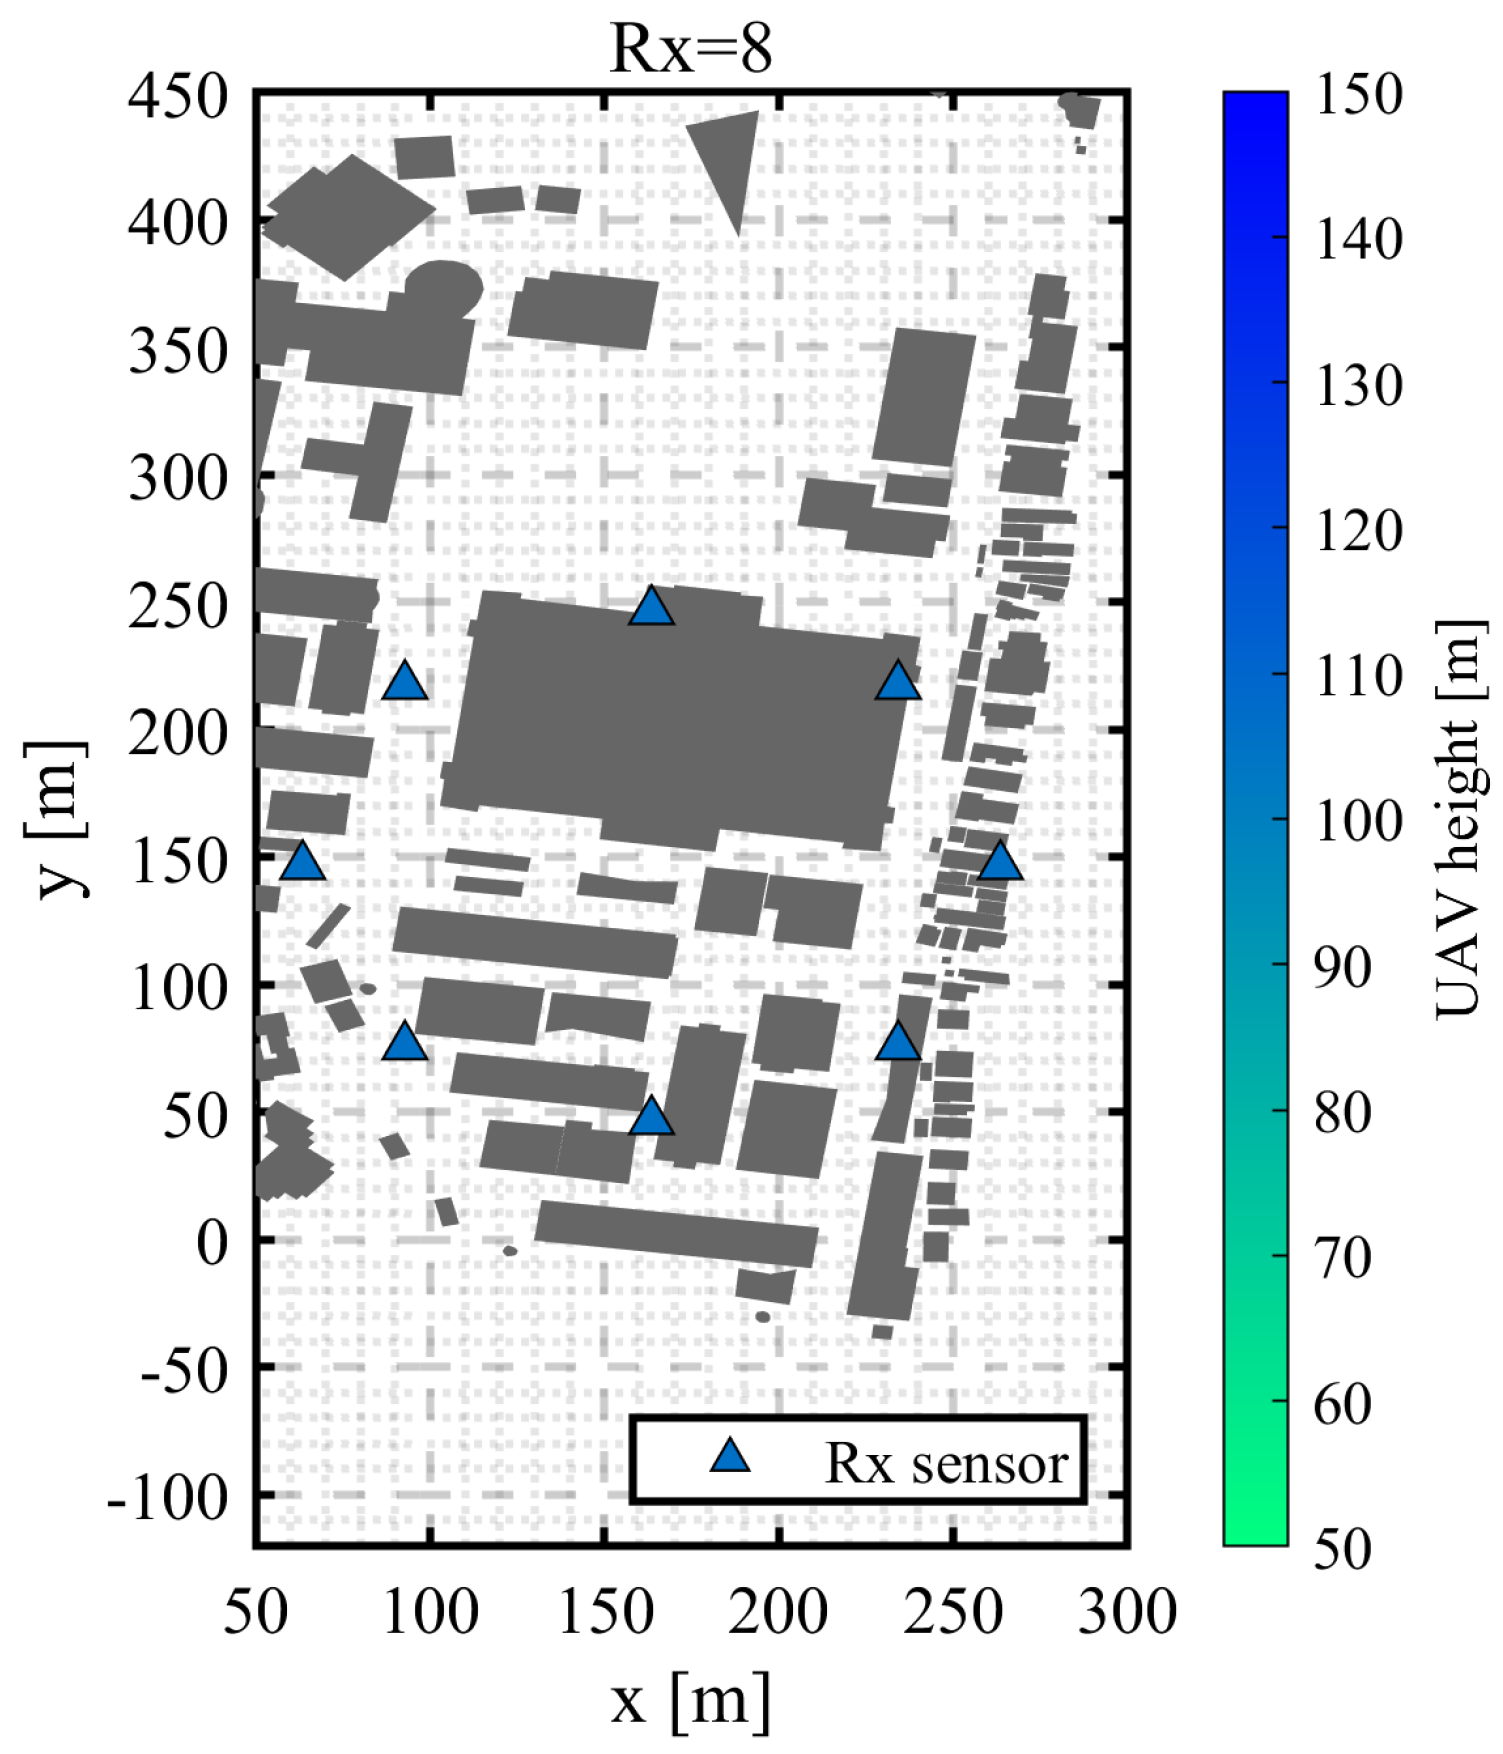
Figure 15. Optimized UAV placements for RSSI-based localization. The figure includes both the horizontal positions and corresponding altitudes of UAVs, selected to minimize the 90th percentile of localization error across all targets.
Futureinternet 17 00224 g015
Figure 16. Heatmap of localization errors (in meters) when using RSSI as the sole feature. Warmer colors indicate higher localization errors.
Futureinternet 17 00224 g016
Figure 17. Cumulative distribution function (CDF) of localization errors using RSSI-only localization. The plot highlights the large error tail characteristic of RSSI-based estimation.
Futureinternet 17 00224 g017
Figure 18. Optimized UAV placements for AOA-based localization. UAV positions and altitudes were selected to maximize angular estimation effectiveness.
Futureinternet 17 00224 g018
Figure 19. Heatmap of localization errors using AOA as the sole feature. AOA yields improved accuracy over RSSI, particularly in line-of-sight regions.
Futureinternet 17 00224 g019
Figure 20. CDF of localization errors with AOA-based localization. Compared to RSSI, error convergence is faster with fewer large outliers.
Futureinternet 17 00224 g020
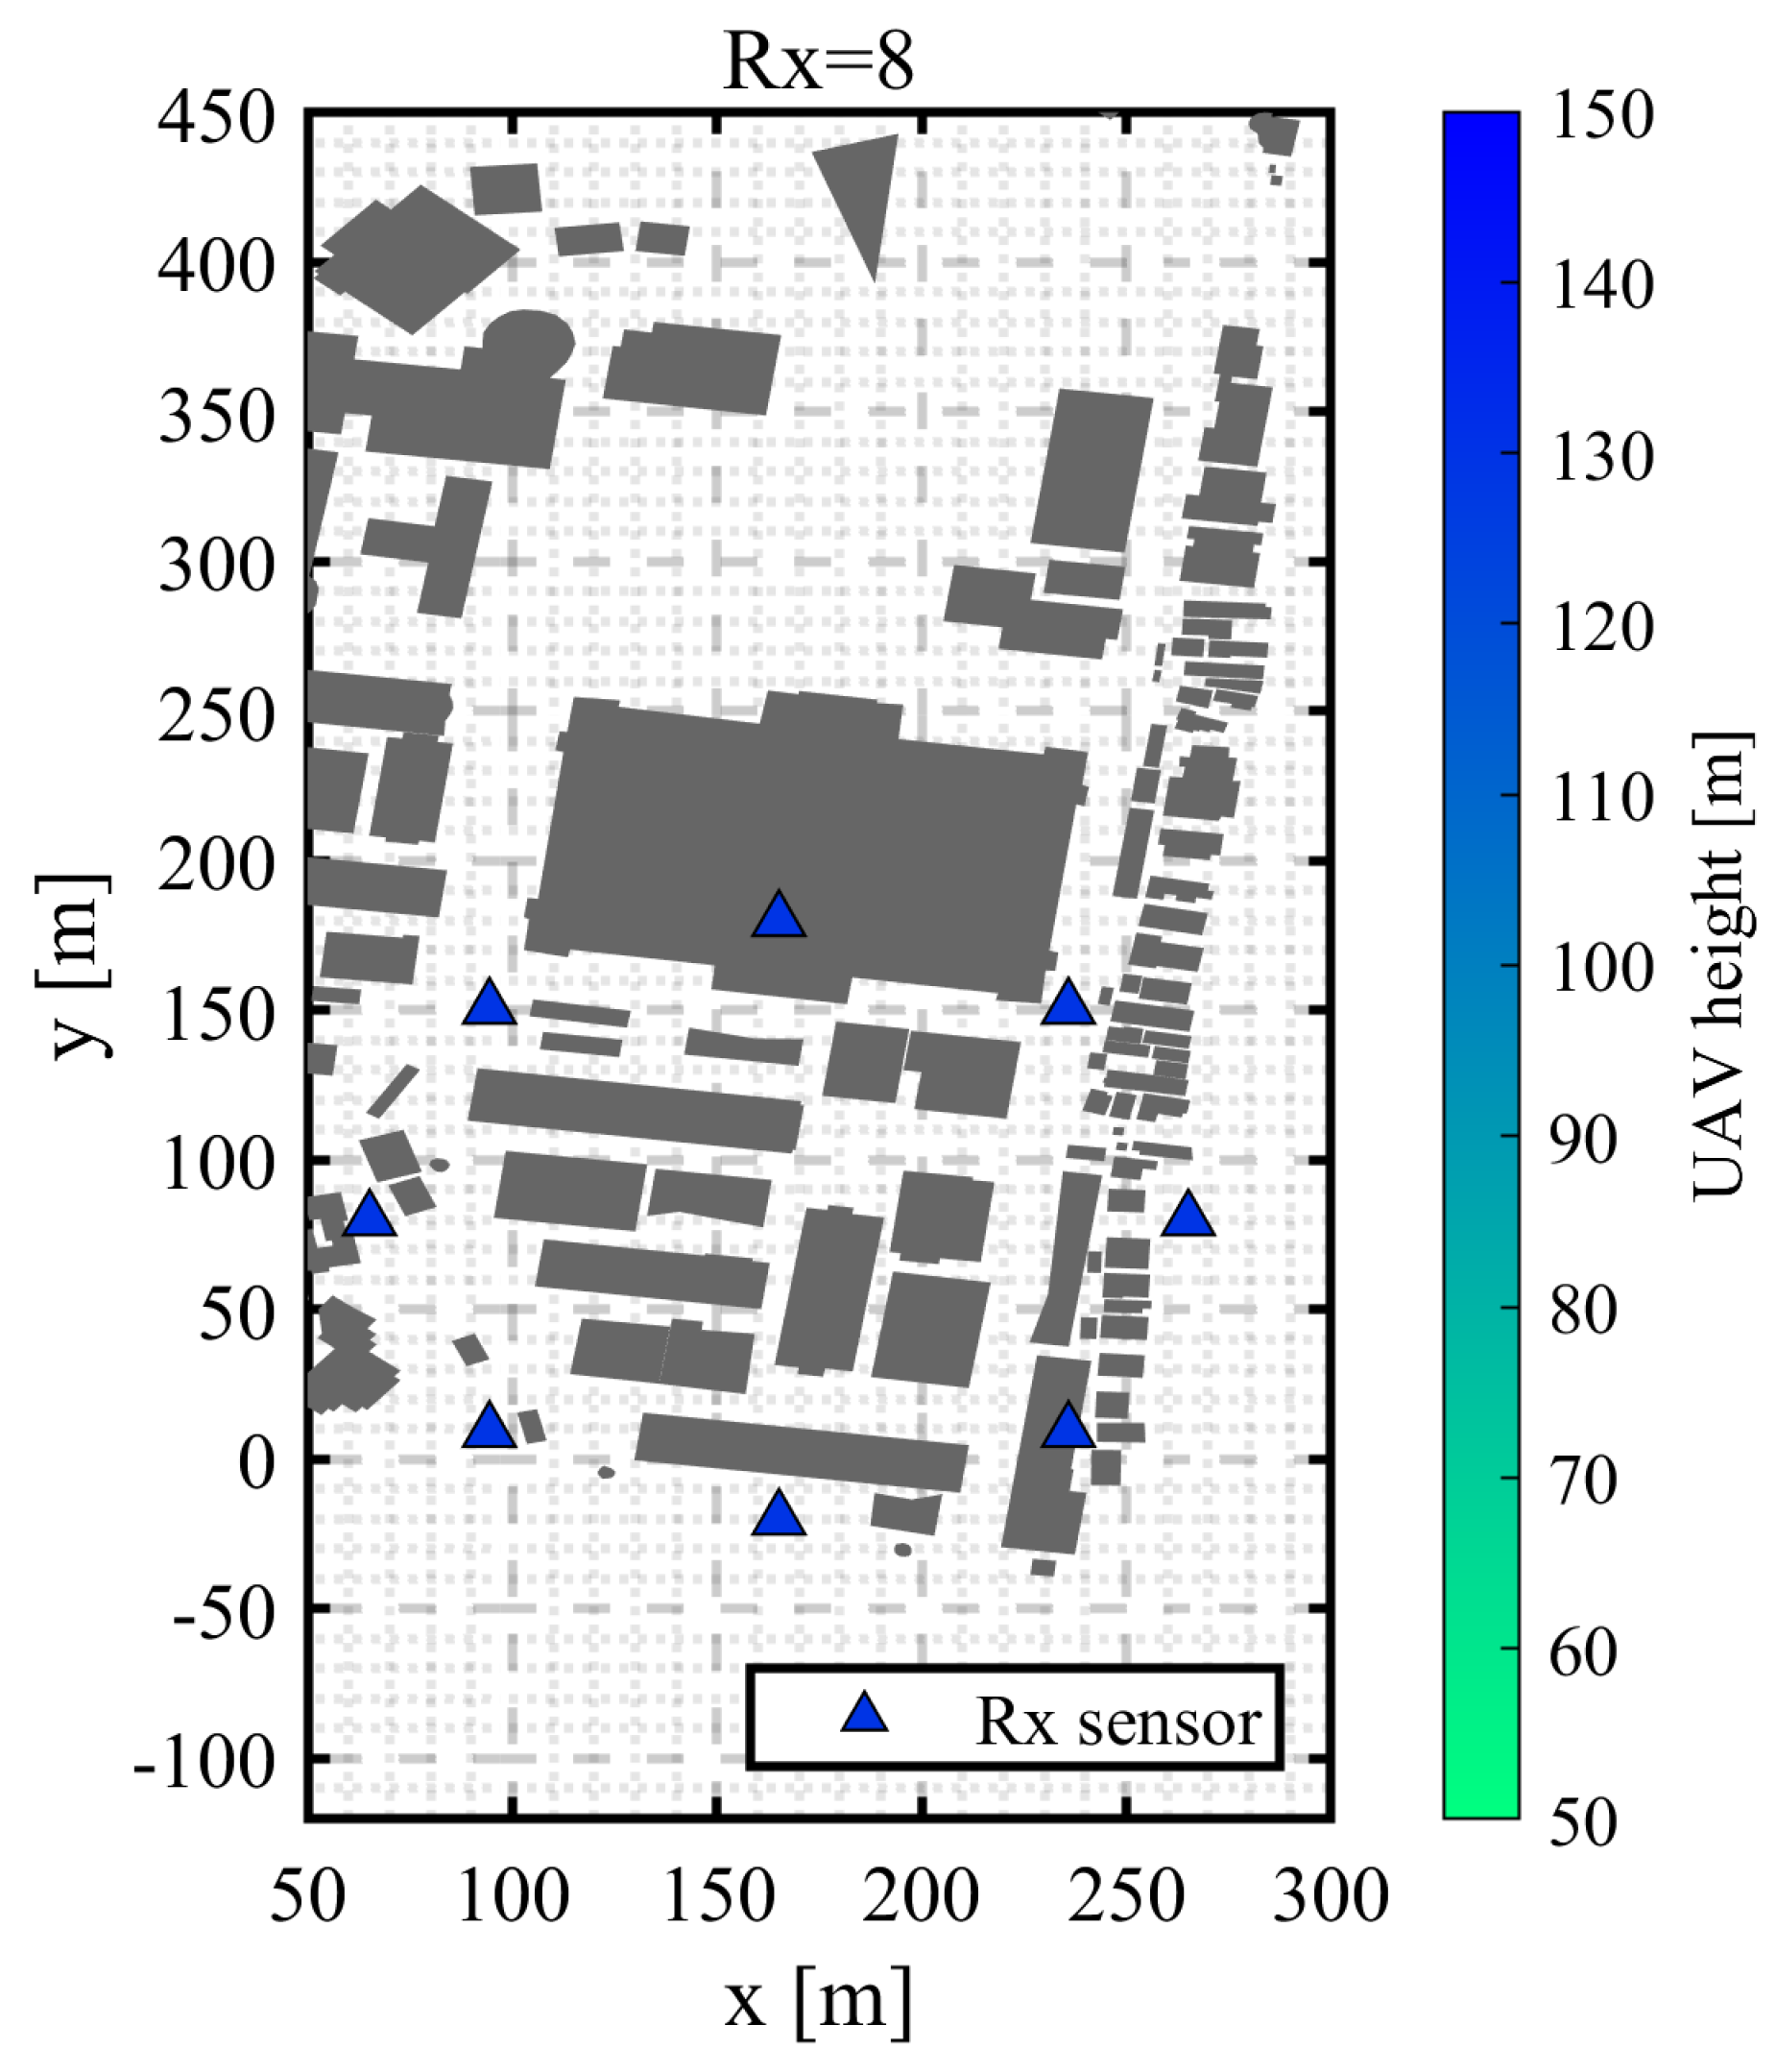
Figure 21. Optimized UAV placements for HYBRID localization integrating RSSI, AOA, and EOA features. Placement reflects weighting of multidimensional signal characteristics.
Futureinternet 17 00224 g021
Figure 22. Heatmap of localization errors using the HYBRID model. Most sources are localized within 10 m, demonstrating superior robustness.
Futureinternet 17 00224 g022
Figure 23. CDF of localization errors using HYBRID localization. The curve exhibits the fastest convergence among all models.
Futureinternet 17 00224 g023
Figure 24. Comparison of CDFs for RSSI, AOA, and HYBRID localization models. The HYBRID model outperforms the others in both mean and 90th percentile error.
Futureinternet 17 00224 g024
Figure 25. Variation in RSSI-based localization errors with different UAV orbit radii. Optimal performance is observed near 100 m, while performance deteriorates at 150 m.
Futureinternet 17 00224 g025
Figure 26. Variation in AOA-based localization errors with different UAV orbit radii. AOA shows robustness to radius variation, indicating lower sensitivity to distance.
Futureinternet 17 00224 g026
Figure 27. Variation in HYBRID localization errors with different UAV orbit radii. Overall, the hybrid approach remains stable across a range of orbit sizes.
Futureinternet 17 00224 g027
Figure 28. CDF comparison of second-stage sequential estimations after initial RSSI-based localization. Using AOA or HYBRID in the second stage significantly reduces large errors.
Futureinternet 17 00224 g028
Figure 29. CDF comparison of sequential estimation outcomes starting with AOA. The AOA→HYBRID combination yields the best overall performance.
Futureinternet 17 00224 g029
Figure 30. CDF comparison of sequential estimation outcomes starting with HYBRID. While HYBRID→HYBRID performs best overall, marginal improvement is observed in outlier suppression compared to HYBRID→RSSI.
Futureinternet 17 00224 g030
Table 1. Ray-Tracing Parameters [8].
ItemValue
Model3D (Ray launching)
Frequency [GHz]2.487
Bandwidth [MHz]5.00
Number of Reflections6
Number of Diffractions1
Number of Transmissions0
RxAntenna Type: Isotropic
Height [m]: 50/75/100/125/150
Antenna Gain [dBi]: 2.0
TxAntenna Type: Isotropic
Transmission Power [dBm]: 27
Table 2. PSO Parameters used in this study.
ParametersValues
Initial position u i ( 0 ) , Initial velocity v i ( 0 ) U ( 0 , 1 )
w0.5
c 1 , c 2 U ( 0 , 0.14 )
Number of particles100
t MAX 10
Table 3. Mean localization errors and CDF 90% values.
Radio Signal InformationMean Error [m]CDF 90% Value [m]
RSSI16.441.9
AOA7.514.8
HYBRID5.38.7
Disclaimer/Publisher’s Note: The statements, opinions and data contained in all publications are solely those of the individual author(s) and contributor(s) and not of MDPI and/or the editor(s). MDPI and/or the editor(s) disclaim responsibility for any injury to people or property resulting from any ideas, methods, instructions or products referred to in the content.