

A Portable Non-Motorized Smart IoT Weather Station Platform for Urban Thermal Comfort Studies

 ,
,  , ,
, , 
Abstract
1. Introduction
- Portability: It is a battery-operated mobile device measuring 50 cm × 11 cm × 20 cm and weighing about 750 g.
- Cost-efficient: The proposed weather station costs about £80 per edge device, compared to the commercially available Davis Vantage Pro 2, which is priced at £995.
- Scalability: Theoretically, unlimited edge devices can be added to the system.
- Real-time remote monitoring: All edge devices can be monitored through the webpage.
- Automatic location tagging: Integration of the Global Positioning System (GPS) allows automatic location tagging.
- Higher sampling time: The edge device provides a reading every 6 s.
- GT integration allows for MRT calculation: MRT is one of the main variables for thermal comfort studies.
2. Proposed Weather Station Platform
2.1. Sensor Selection
2.2. Microcontroller Unit (MCU)
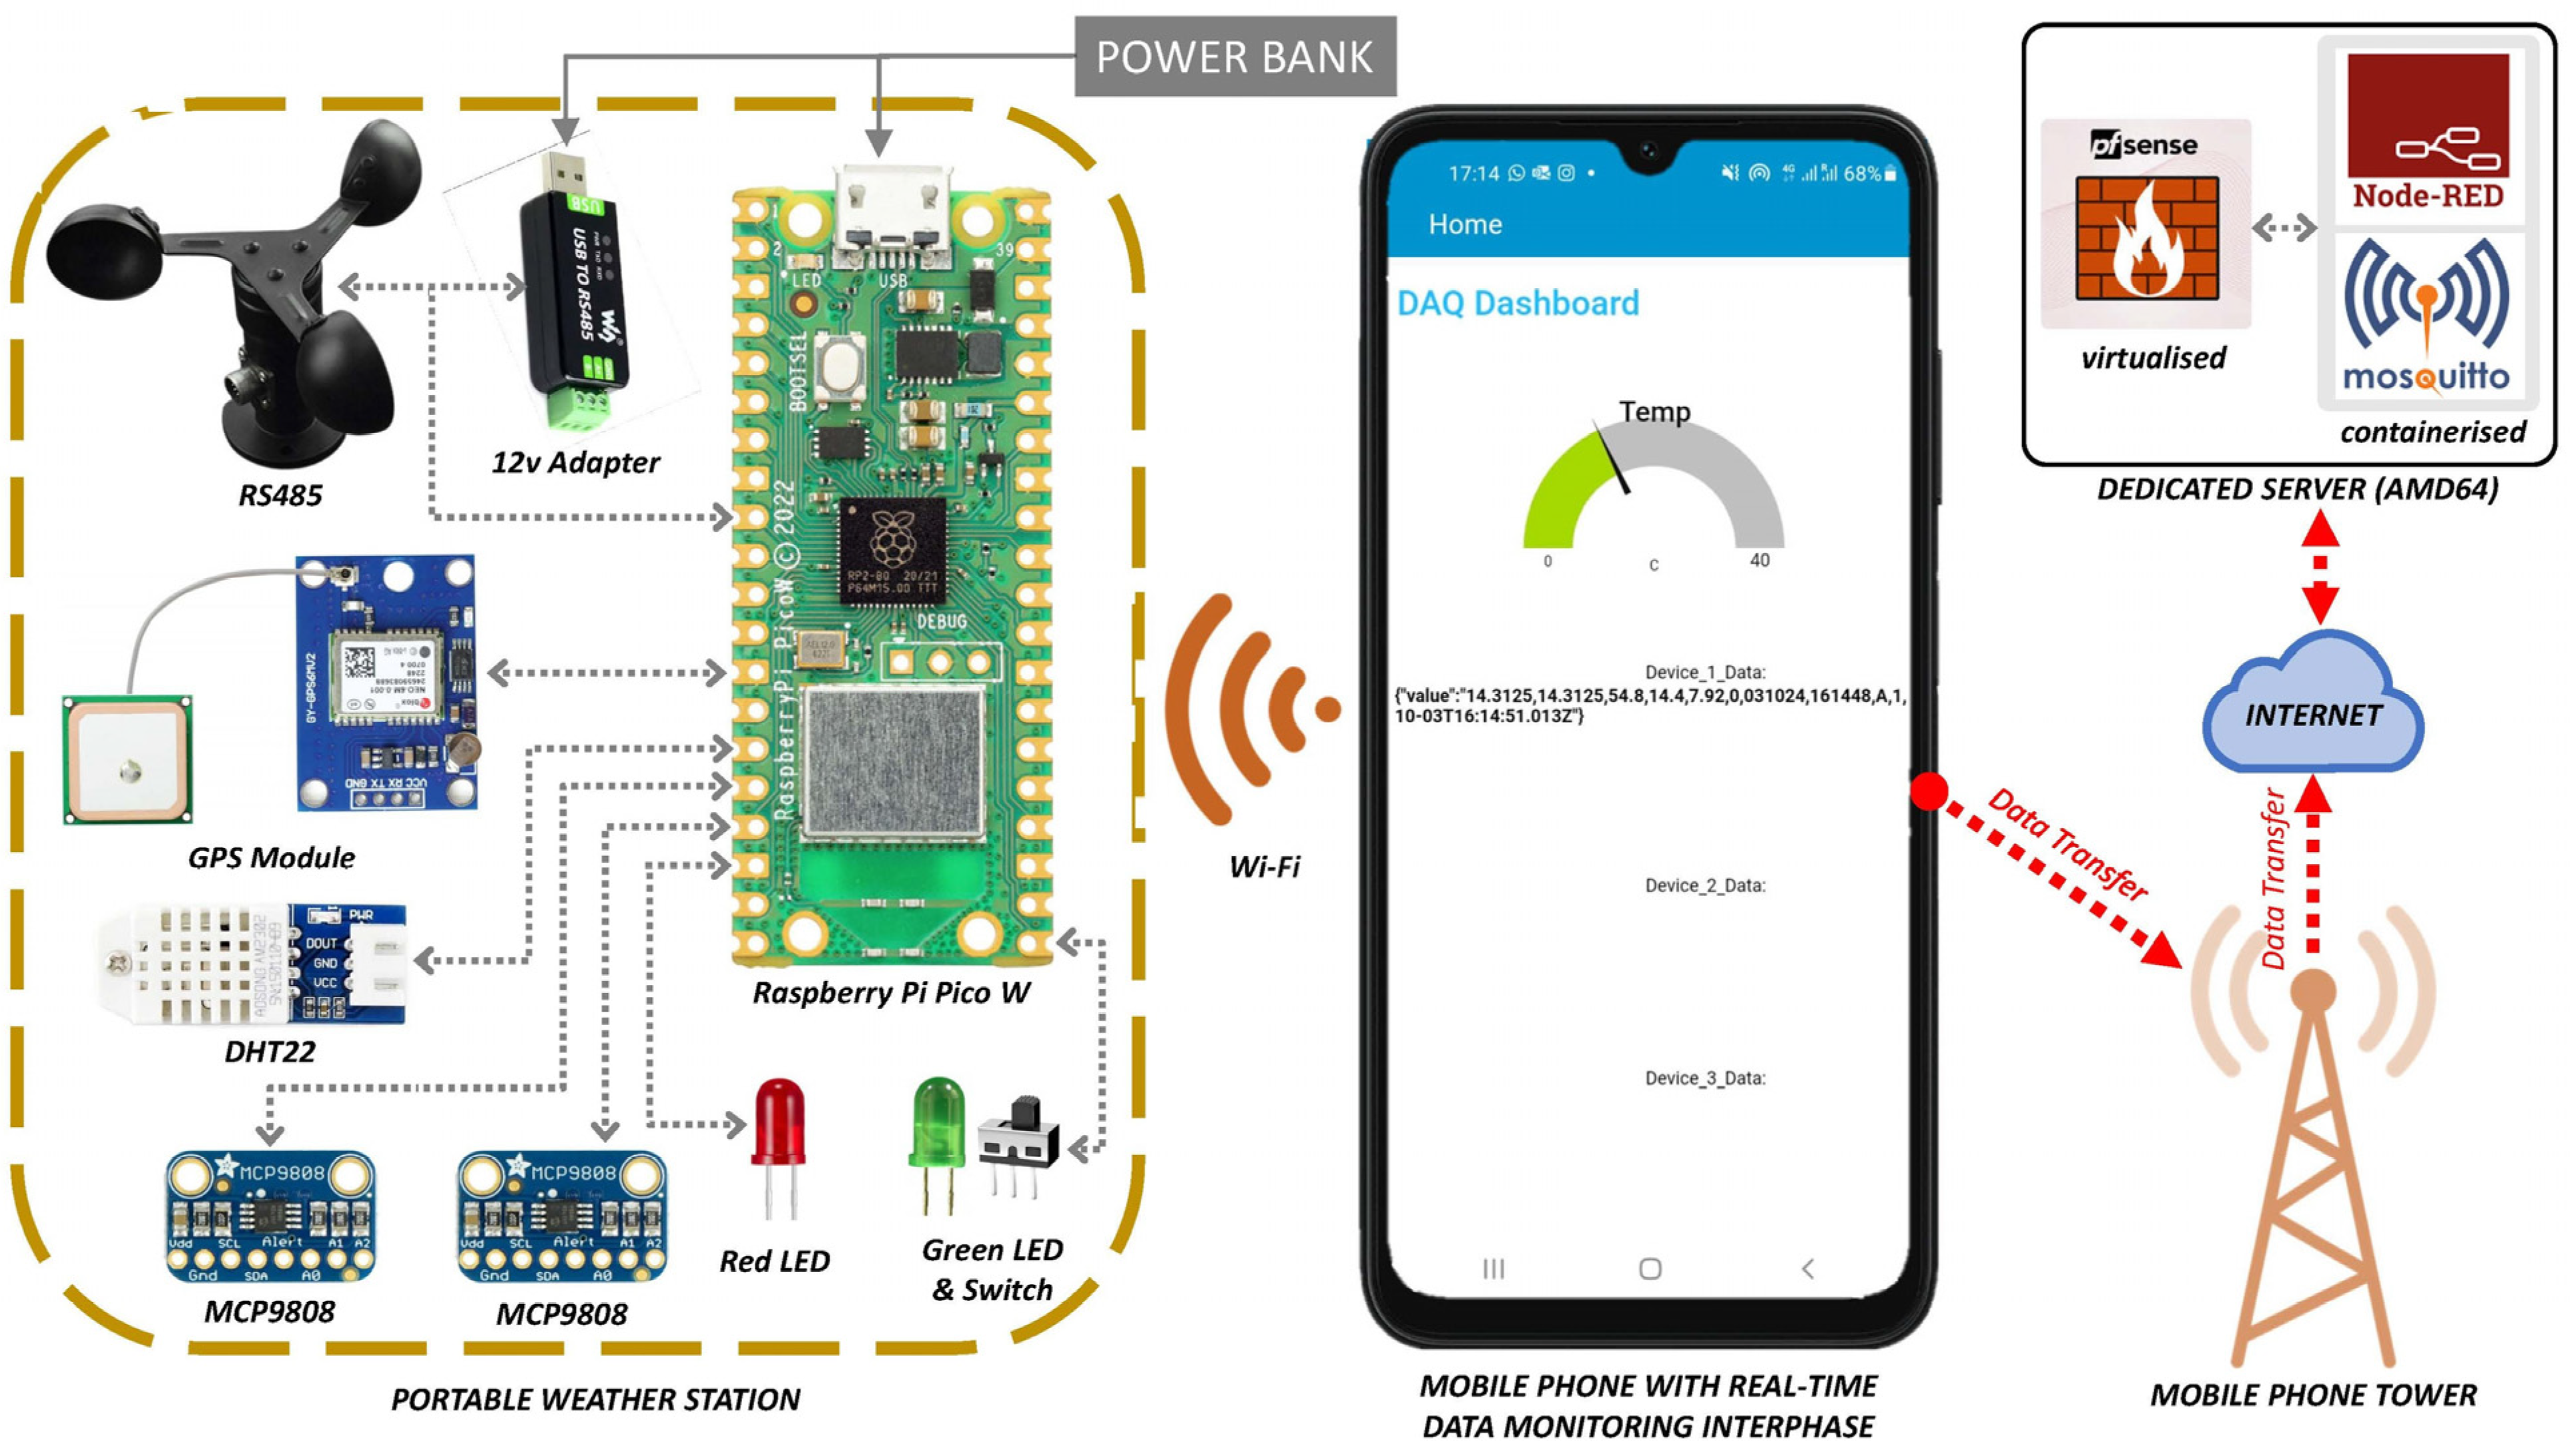
2.3. Design Architecture
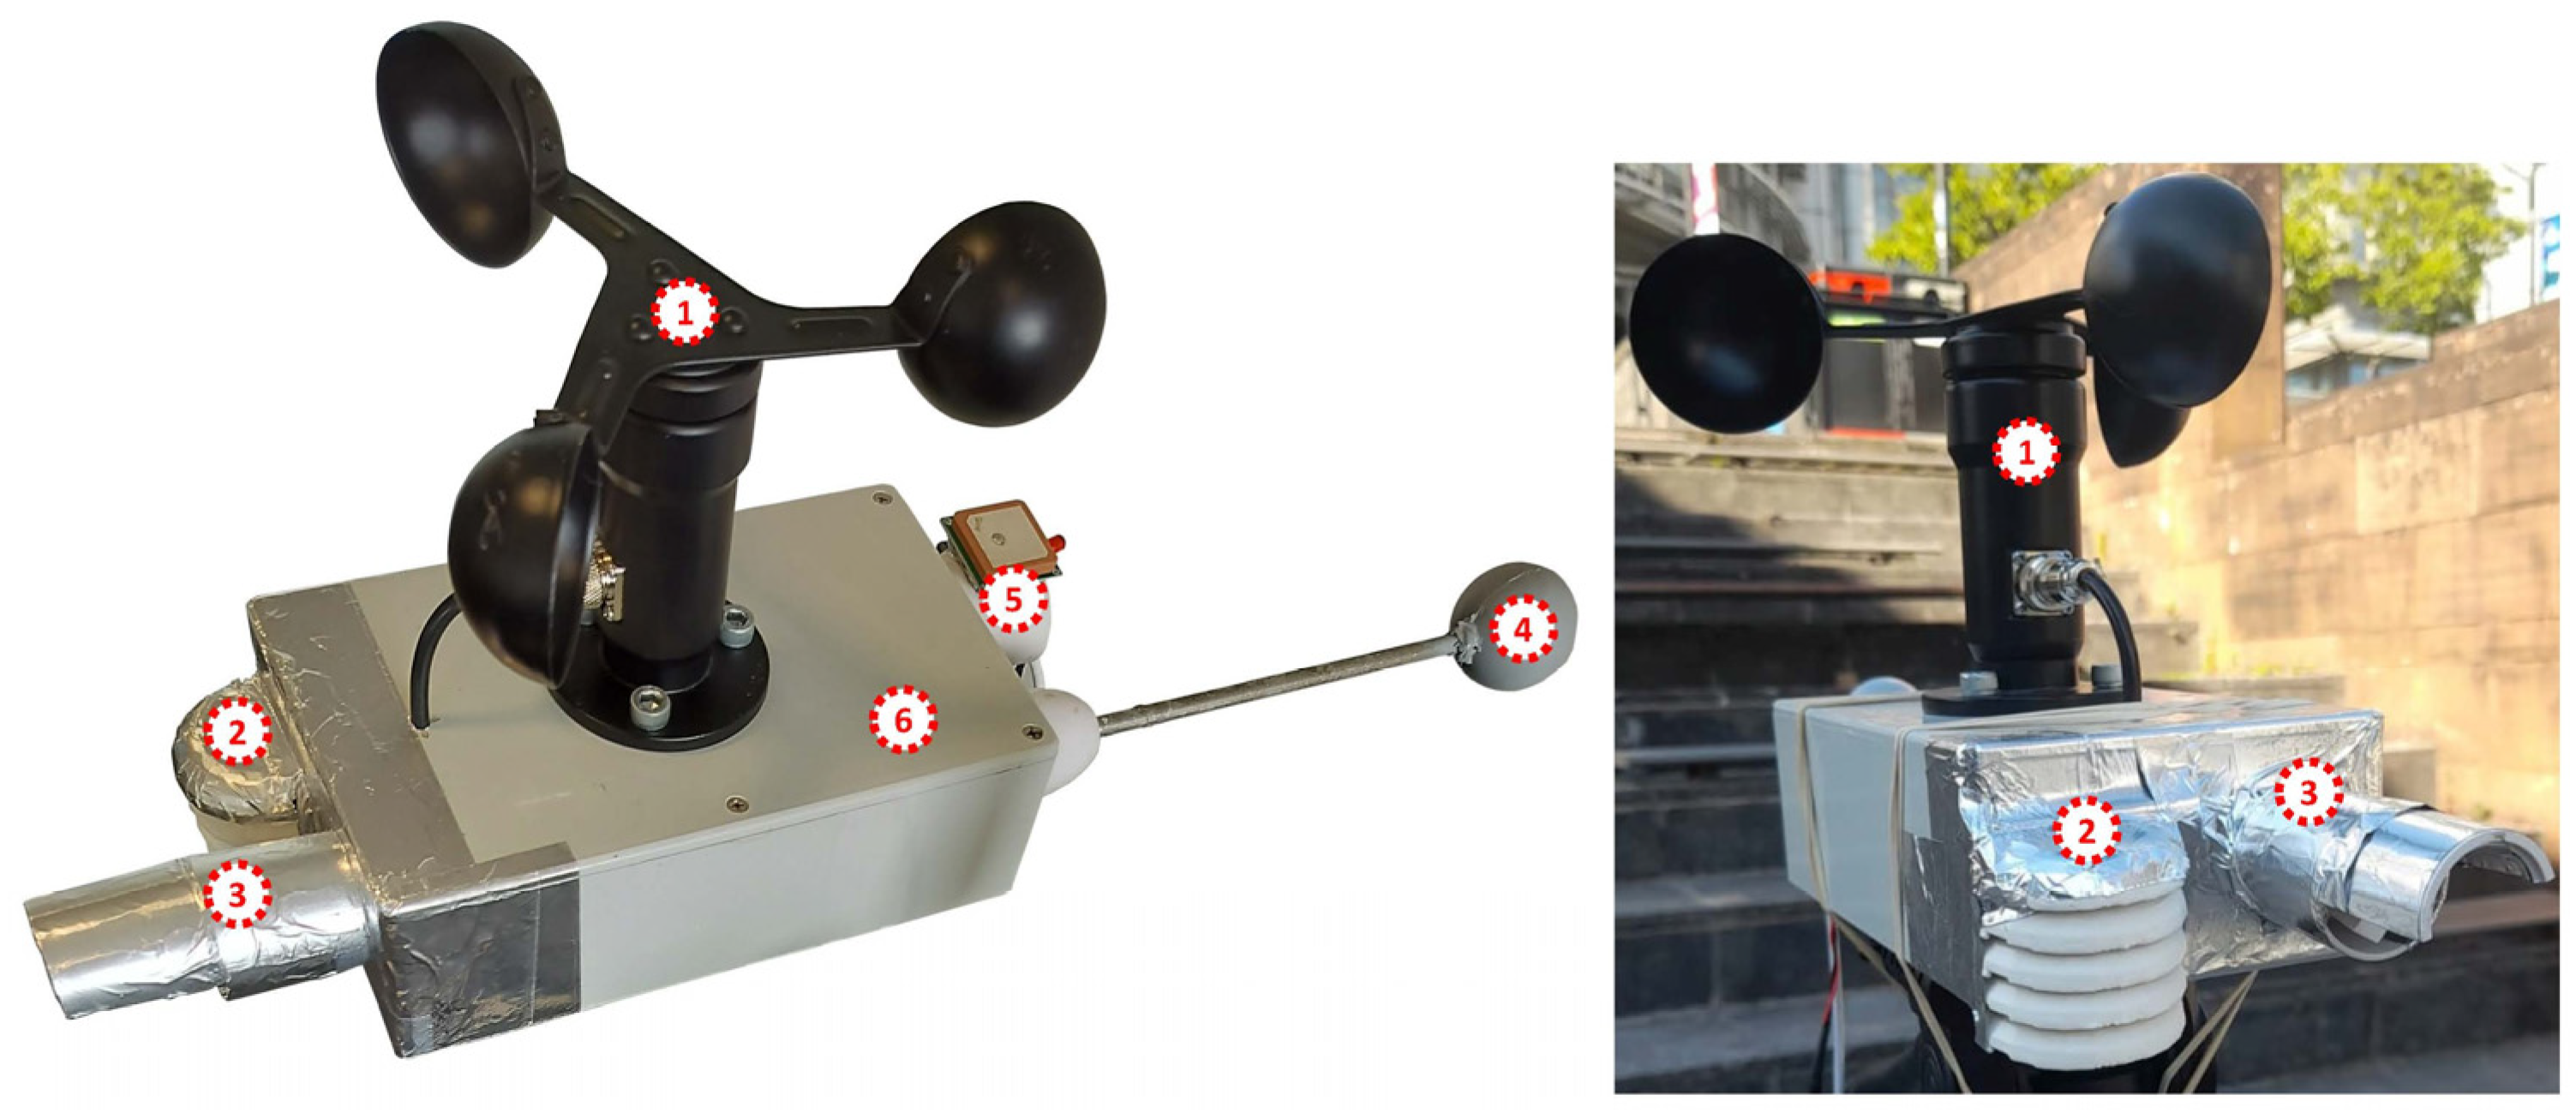
2.4. Housing and Shielding Design for the Edge Device
3. Validating the Edge Device
4. Efficiency and Performance of the Proposed Weather Station Platform
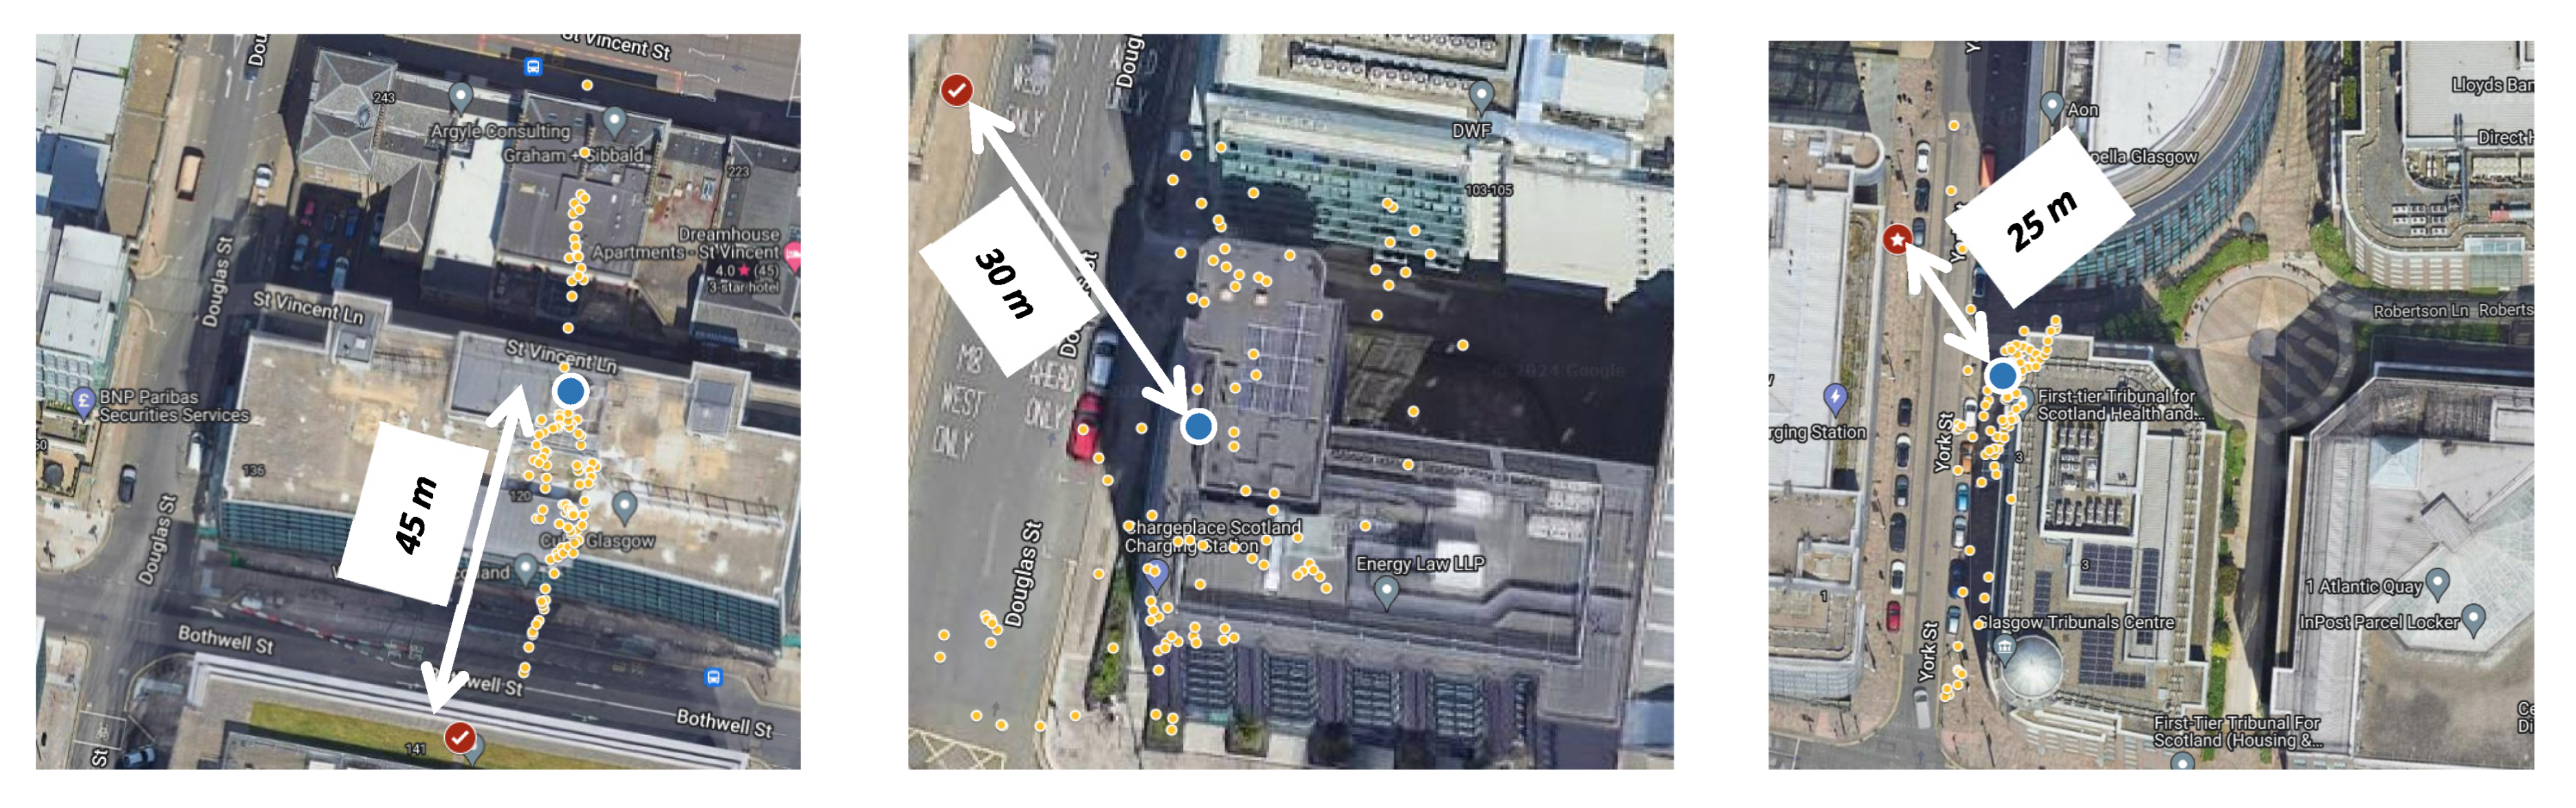
4.1. Test 1: GPS Module—Accuracy and Precision
4.2. Test 2: Data Consistency
4.3. Test 3: Latency/Timestamp Accuracy
4.4. Test 4: Data Sampling Rate
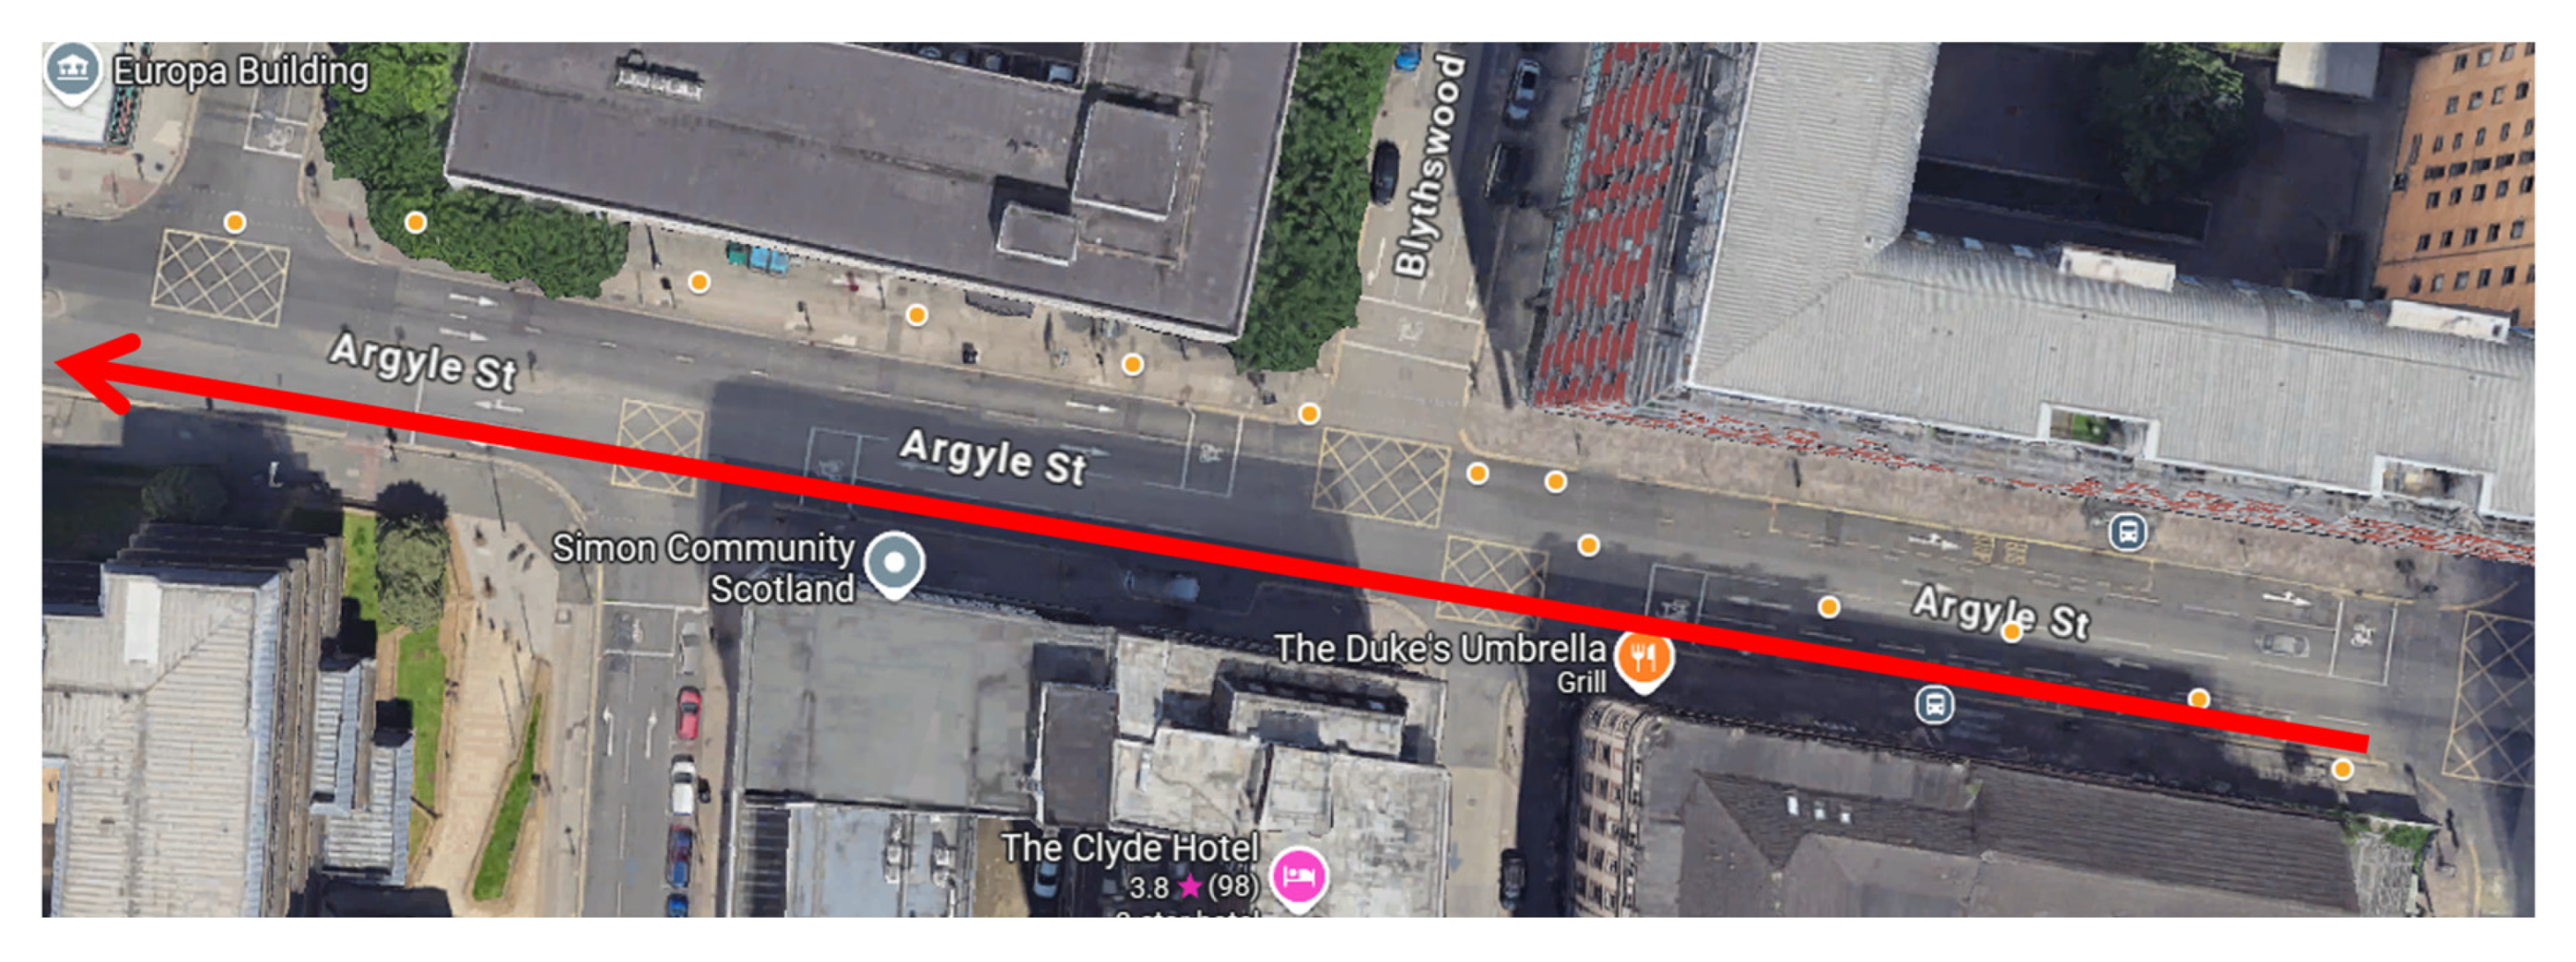
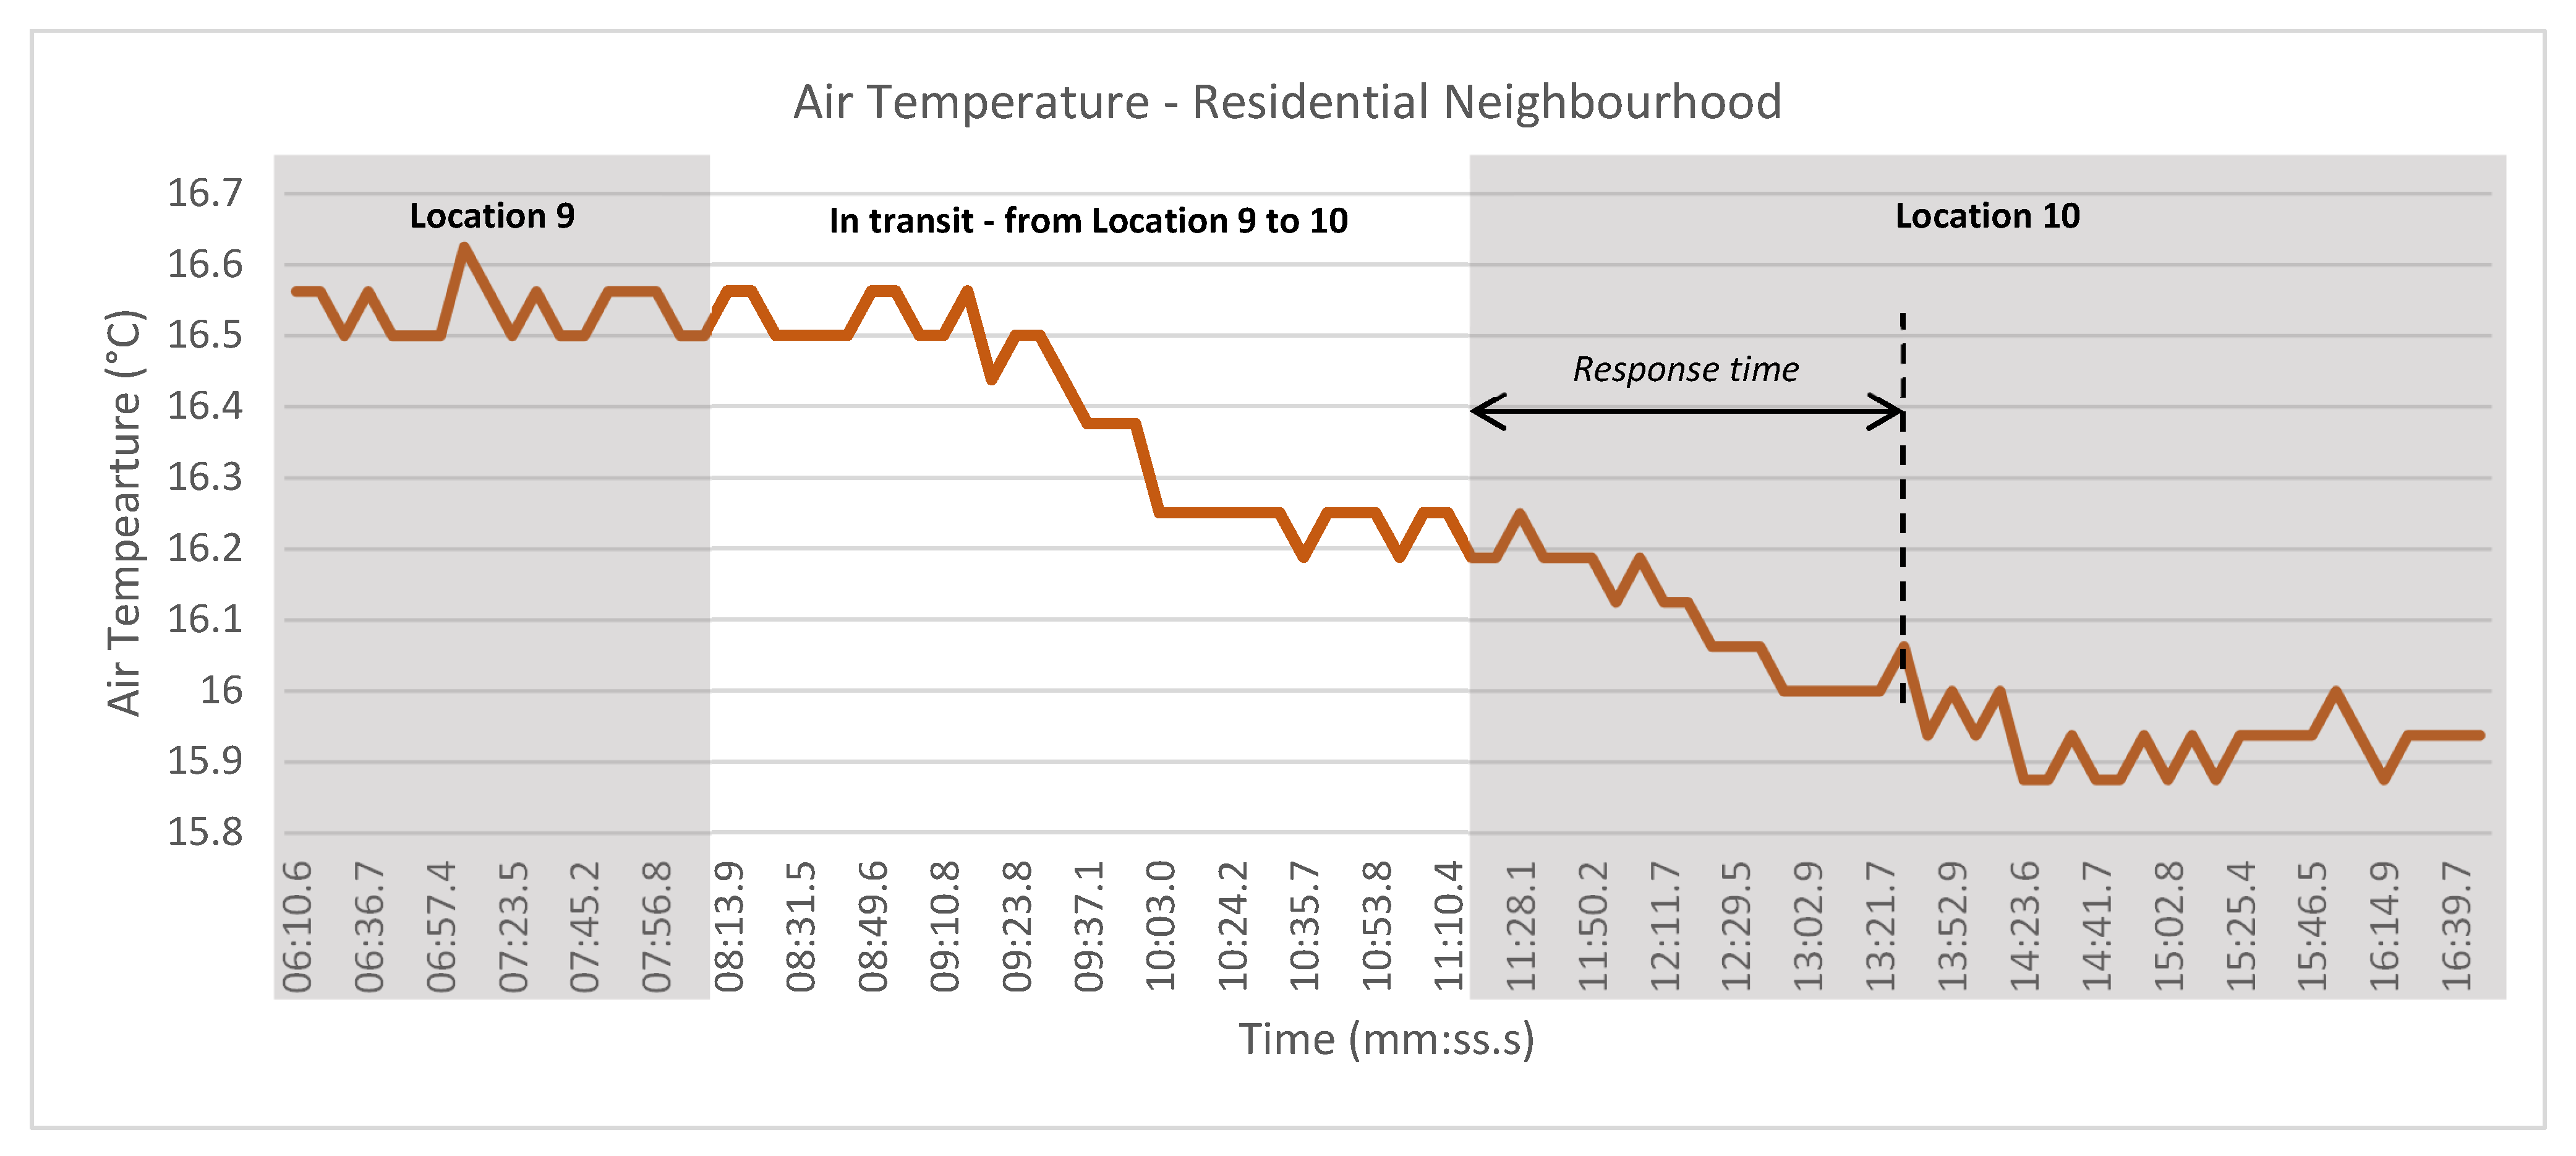
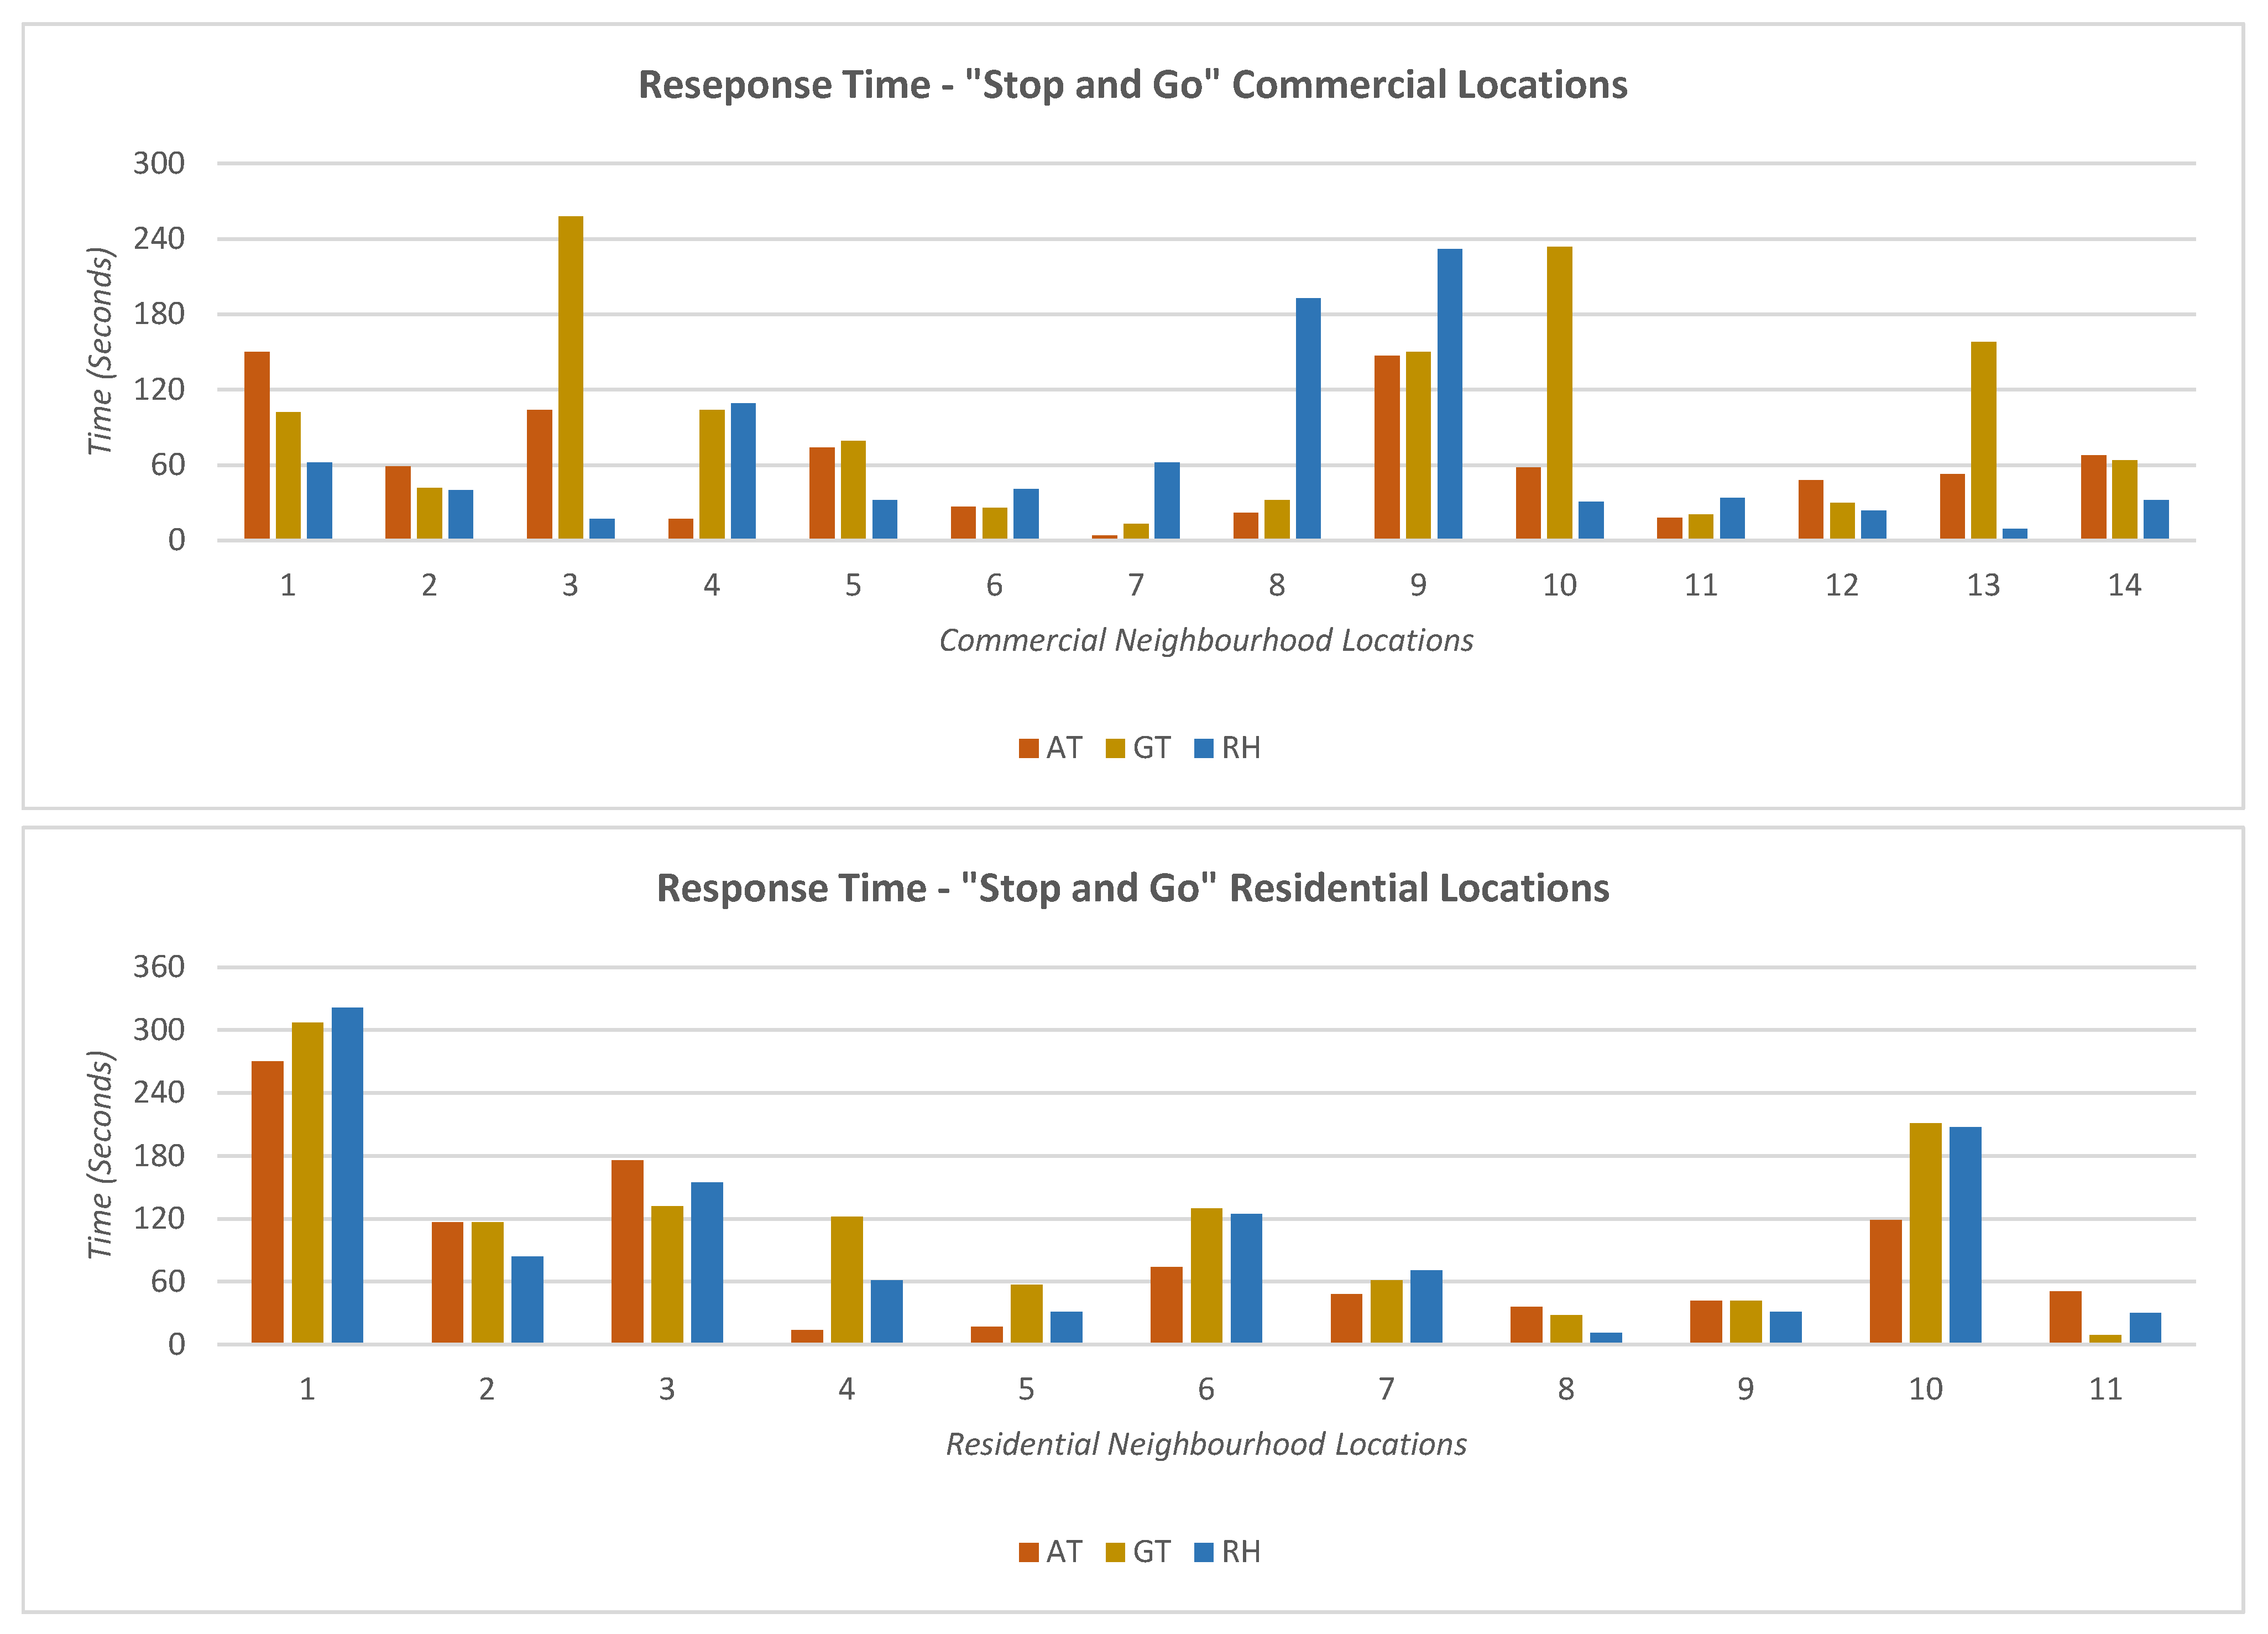
4.5. Test 5: Response Time
5. Discussion and Conclusions
Author Contributions
Funding
Data Availability Statement
Conflicts of Interest
References
- 68% of the World Population Projected to Live in Urban Areas by 2050, Says UN. Available online: https://www.un.org/development/desa/en/news/population/2018-revision-of-world-urbanization-prospects.html#:~:text=News-,68%25%20of%20the%20world%20population%20projected%20to%20live%20in,areas%20by%202050%2C%20says%20UN&text=Today%2C%2055%25%20of%20the%20world’s,increase%20to%2068%25%20by%202050 (accessed on 21 June 2024).
- IMD Business School for Management and Leadership Courses. Available online: https://www.imd.org/smart-city-observatory/home/ (accessed on 21 June 2024).
- Ahvenniemi, H.; Huovila, A.; Pinto-Seppä, I.; Airaksinen, M. What are the differences between sustainable and smart cities? Cities 2017, 60, 234–245. [Google Scholar] [CrossRef]
- Syed, A.S.; Sierra-Sosa, D.; Kumar, A.; Elmaghraby, A. IoT in Smart Cities: A Survey of Technologies, Practices and Challenges. Smart Cities 2021, 4, 475. [Google Scholar] [CrossRef]
- Hosseinzadeh, S.; Ashawa, M.; Owoh, N.; Larijani, H.; Curtis, K. Explainable Machine Learning for LoRaWAN Link Budget Analysis and Modeling. Sensors 2024, 24, 860. [Google Scholar] [CrossRef]
- Sanchez-Gomez, R.J.; Sanchez-Iborra, A. Transmission Technologies Comparison for IoT Communications in Smart-Cities. In Proceedings of the GLOBECOM 2017—2017 IEEE Global Communications Conference, Singapore, 4–8 December 2017; pp. 1–6. [Google Scholar]
- Smart Cities: Digital Solutions for a More Livable Future. Available online: https://www.mckinsey.com/capabilities/operations/our-insights/smart-cities-digital-solutions-for-a-more-livable-future (accessed on 21 June 2024).
- Oke, T.R.; Mills, G.; Christen, A.; Voogt, J.A. Urban Climates; Cambridge University Press: Cambridge, UK, 2017. [Google Scholar]
- Urban Heat Islands. Available online: https://www.rmets.org/metmatters/urban-heat-islands (accessed on 13 June 2024).
- Heatwave. Available online: https://wmo.int/topics/heatwave#:~:text=In%202022%2C%20a%20heatwave%20in,the%20country’s%20worst%20on%20record.&text=Devastating%20heatwaves%20in%20India%20and,likely%20due%20to%20climate%20change.&text=In%202022%2C%20heatwaves%20across%20the,record%20of%2038.7%C2%B0C (accessed on 14 June 2024).
- Ballester, J.; Quijal-Zamorano, M.; Méndez Turrubiates, R.F.; Pegenaute, F.; Herrmann, F.R.; Robine, J.M.; Basagaña, X.; Tonne, C.; Antó, J.M.; Achebak, H. Heat-related mortality in Europe during the summer of 2022. Nat. Med. 2023, 29, 1857. [Google Scholar] [CrossRef]
- Monsefi Parapari, D.; Taslim, S.; Shafaghat, A. Urban Design Guidelines to Mitigate Urban Heat Island (UHI) Effects in Hot-Dry Cities. J. Teknol. 2015, 74, 119–124. [Google Scholar]
- Lambert-Habib, M.L.; Hidalgo, J.; Fedele, C.; Lemonsu, A.; Bernard, C. How is climatic adaptation taken into account by legal tools? Introduction of water and vegetation by French town planning documents. Urban Clim. 2013, 4, 16–34. [Google Scholar] [CrossRef]
- Lyu, F.; Wang, S.; Han, S.Y.; Catlett, C.; Wang, S. An integrated cyberGIS and machine learning framework for fine-scale prediction of Urban Heat Island using satellite remote sensing and urban sensor network data. Urban Inform. 2022, 1, 6. [Google Scholar] [CrossRef]
- Kim, Y.; Jang, S.; Kim, K.B. Impact of urban microclimate on walking volume by street type and heat-vulnerable age groups: Seoul’s IoT sensor big data. Urban Clim. 2023, 51, 101658. [Google Scholar] [CrossRef]
- Jang, S.; Bae, J.; Kim, Y. Street-level urban heat island mitigation: Assessing the cooling effect of green infrastructure using urban IoT sensor big data. Sustain. Cities Soc. 2024, 100, 105007. [Google Scholar] [CrossRef]
- Middel, A.; AlKhaled, S.; Schneider, F.A.; Hagen, B.; Coseo, P. 50 Grades of Shade. Bull. Am. Meteorol. Soc. 2021, 102, E1805–E1820. [Google Scholar] [CrossRef]
- Kousis, I.; Manni, M.; Pisello, A.L. Environmental mobile monitoring of urban microclimates: A review. Renew. Sustain. Energy Rev. 2022, 169, 112847. [Google Scholar] [CrossRef]
- Roy Choudhury, A.K.; Majumdar, P.K.; Datta, C. 1—Factors affecting comfort: Human physiology and the role of clothing. In Improving Comfort in Clothing; Song, G., Ed.; Woodhead Publishing: Sawston, UK, 2011; pp. 3–60. [Google Scholar]
- Alchapar, N.L.; Correa, E.N. The use of reflective materials as a strategy for urban cooling in an arid “OASIS” city. Sustain. Cities Soc. 2016, 27, 1. [Google Scholar] [CrossRef]
- Ruiz, M.A.; Correa, E.N. Adaptive model for outdoor thermal comfort assessment in an Oasis city of arid climate. Build. Environ. 2014, 85, 40. [Google Scholar] [CrossRef]
- Kim, Y.J.; Brown, R.D. A multilevel approach for assessing the effects of microclimatic urban design on pedestrian thermal comfort: The High Line in New York. Build. Environ. 2021, 205, 108244. [Google Scholar] [CrossRef]
- Silva, T.; Reis, C.; Braz, D.; Vasconcelos, J.; Lopes, A. Climate walking and linear mixed model statistics for the seasonal outdoor thermophysiological comfort assessment in Lisbon. Urban Clim. 2024, 55, 101933. [Google Scholar] [CrossRef]
- Middel, A.; Krayenhoff, E.S. Micrometeorological determinants of pedestrian thermal exposure during record-breaking heat in Tempe, Arizona: Introducing the MaRTy observational platform. Sci. Total Environ. 2019, 687, 137. [Google Scholar] [CrossRef]
- Liu, S.; Nazarian, N.; Hart, M.A.; Niu, J.; Xie, Y.; De Dear, R. Dynamic thermal pleasure in outdoor environments—Temporal alliesthesia. Sci. Total Environ. 2021, 771, 144910. [Google Scholar] [CrossRef]
- Johansson, E.; Thorsson, S.; Emmanuel, R.; Krüger, E. Instruments and methods in outdoor thermal comfort studies—The need for standardization. Urban Clim. 2014, 10, 346. [Google Scholar] [CrossRef]
- Chen, Y.; Wang, Y.; Zhou, D.; Gu, Z.; Meng, X. Summer urban heat island mitigation strategy development for high-anthropogenic-heat-emission blocks. Sustain. Cities Soc. 2022, 87, 104197. [Google Scholar] [CrossRef]
- Shi, F.; Chen, Y.; Yue, W.; Wang, Y. High-Rise Residential District Morphology Optimization for Enhancing the Green Space Cooling Effect. Buildings 2024, 14, 183. [Google Scholar] [CrossRef]
- Brozovsky, J.; Corio, S.; Gaitani, N.; Gustavsen, A. Evaluation of sustainable strategies and design solutions at high-latitude urban settlements to enhance outdoor thermal comfort. Energy Build. 2021, 244, 111037. [Google Scholar] [CrossRef]
- Pan, W. What type of mixed-use and open? A critical environmental analysis of three neighborhood types in China and insights for sustainable urban planning. Landsc. Urban Plan. 2021, 216, 104221. [Google Scholar] [CrossRef]
- Fu, J.; Wang, Y.; Zhou, D.; Cao, S. Impact of Urban Park Design on Microclimate in Cold Regions using newly developped prediction method. Sustain. Cities Soc. 2022, 80, 103781. [Google Scholar] [CrossRef]
- Qi, L.; Liu, R.; Cui, Y.; Zhou, M.; Bonenberg, W.; Song, Z. Study of the Landscape Pattern of Shuiyu Village in Beijing, China: A Comprehensive Analysis of Adaptation to Local Microclimate. Sustainability 2022, 14, 375. [Google Scholar] [CrossRef]
- Hao, T.; Chang, H.; Liang, S.; Jones, P.; Chan, P.W.; Li, L.; Huang, J. Heat and park attendance: Evidence from “small data” and “big data” in Hong Kong. Build. Environ. 2023, 234, 110123. [Google Scholar] [CrossRef]
- Yang, F.; Qian, F.; Zhao, W. Towards a Climate-Responsive Vertical Pedestrian System: An Empirical Study on an Elevated Walkway in Shanghai China. Sustainability 2016, 8, 744. [Google Scholar] [CrossRef]
- Elnabawi, M.H.; Hamza, N.; Dudek, S. Thermal perception of outdoor urban spaces in the hot arid region of Cairo, Egypt. Sustain. Cities Soc. 2016, 22, 136. [Google Scholar] [CrossRef]
- Jin, H.; Cui, P.; Wong, N.H.; Ignatius, M. Assessing the Effects of Urban Morphology Parameters on Microclimate in Singapore to Control the Urban Heat Island Effect. Sustainability 2018, 10, 206. [Google Scholar] [CrossRef]
- Pan, W.; Du, J. Towards sustainable urban redevelopment: Urban design informed by morphological patterns and ecologies of informal settlements. Urban Ecol. 2020, 377, 377–411. [Google Scholar]
- He, B.; Ding, L.; Prasad, D. Relationships among local-scale urban morphology, urban ventilation, urban heat island and outdoor thermal comfort under sea breeze influence. Sustain. Cities Soc. 2020, 60, 102289. [Google Scholar] [CrossRef]
- Detommaso, M.; Costanzo, V.; Nocera, F. Application of weather data morphing for calibration of urban ENVI-met microclimate models. Results and critical issues. Urban Clim. 2021, 38, 100895. [Google Scholar] [CrossRef]
- Wei, D.; Yang, L.; Bao, Z.; Lu, Y.; Yang, H. Variations in outdoor thermal comfort in an urban park in the hot-summer and cold-winter region of China. Sustain. Cities Soc. 2022, 77, 103535. [Google Scholar] [CrossRef]
- Chen, L.; Mak, C.M.; Hang, J.; Dai, Y. Influence of elevated walkways on outdoor thermal comfort in hot-humid climates based on on-site measurement and CFD modeling. Sustain. Cities Soc. 2023, 100, 105048. [Google Scholar] [CrossRef]
- Li, J.; Wang, J.; Niu, J. Elderly residents’ uses of fragmented outdoor spaces in public housing estates in Hong Kong—Decoding causality and heat-risk exposure. Build. Environ. 2023, 245, 110912. [Google Scholar] [CrossRef]
- Parison, S.; Chaumont, M.; Kounkou-Arnaud, R.; Long, F.; Bernik, A.; Da Silva, M.; Hendel, M. The effects of greening a parking lot as a heat mitigation strategy on outdoor thermal stress using fixed and mobile measurements: Case-study project “tertiary forest”. Sustain. Cities Soc. 2023, 98, 104818. [Google Scholar] [CrossRef]
- ISO 7726; Ergonomics of the Thermal Environment—Instruments for Measuring Physical Quantities. International Organization for Standardization: Geneva, Switzerland, 1998.
- Shooshtarian, S.; Lam, C.K.C.; Kenawy, I. Outdoor thermal comfort assessment: A review on thermal comfort research in Australia. Build. Environ. 2020, 177, 106917. [Google Scholar] [CrossRef]
- Stewart, I.D.; Mills, G. The Urban Heat Island; Elsevier Science: Amsterdam, The Netherlands, 2021. [Google Scholar]
- Nouman, A.S.; Chokhachian, A.; Santucci, D.; Auer, T. Prototyping of Environmental Kit for Georeferenced Transient Outdoor Comfort Assessment. ISPRS Int. J. Geo-Inf. 2019, 8, 76. [Google Scholar] [CrossRef]
- Light, R.A. Mosquitto: Server and client implementation of the MQTT protocol. J. Open Source Softw. 2017, 2, 265. [Google Scholar] [CrossRef]
- Node-RED. Available online: https://nodered.org (accessed on 1 May 2025).
- pfSense Plus Software. Available online: https://www.netgate.com/pfsense-plus-software?_gl=1*4uj2uy*_gcl_au*OTk4NjQ1NzAuMTc0NjA1Nzc3MA..*_ga*MjExMjYyNzU4NC4xNzQ2MDU3Nzcx*_ga_TM99KBGXCB*MTc0NjA1Nzc3MC4xLjEuMTc0NjA1NzgyMi44LjAuNzY0NDg3Mjg2#cloud (accessed on 1 May 2025).
- About Let’s Encrypt. Available online: https://letsencrypt.org/about/ (accessed on 1 May 2025).
- Certbot. Available online: https://certbot.eff.org/pages/about (accessed on 1 May 2025).
- Sun, H.; Lv, Z.; Li, J.; Xu, Z.; Sheng, Z.; Ma, Z. Prediction of Cancellation Probability of Online Car-Hailing Orders Based on Multi-source Heterogeneous Data Fusion; Wang, L., Segal, M., Chen, J., Qiu, T., Eds.; Wireless Algorithms, Systems; Springer Nature: Cham, Switzerland, 2022; pp. 168–180. [Google Scholar]
- Kulkarni, K.K.; Schneider, F.A.; Gowda, T.; Jayasuriya, S.; Middel, A. MaRTiny—A Low-Cost Biometeorological Sensing Device with Embedded Computer Vision for Urban Climate Research. Front. Environ. Sci. 2022, 10, 866240. [Google Scholar] [CrossRef]


| Variable | Selected Sensor | Cost | Measuring Range | Accuracy and Precision | ||
|---|---|---|---|---|---|---|
| Selected Sensor | Required (ISO 7726:1998) | Selected Sensor | Required (ISO 7726:1998) | |||
| AT, GT | MCP9808 (I2C) | £3.96 | −40 °C to +125 °C | −40 °C to +120 °C | ±0.25 | ±0.5 °C |
| RH | DHT22 | £4.72 | AT: −40 °C to +80 °C RH: 0~99.9% | 0.5 kPa to 6.0 kPa | AT: ±0.5 °C RH: ±2% (25 °C) | ±0.15 kPa RH: ±4.73% (25 °C) |
| WS | RS485 (SKU: SEN0483) | £35.57 | 0 to 32.4 m/s -Starting 0.2 to 0.4 m/s | 0.05 m/s to 20 m/s | ±0.3 m/s | ±(0.05 + 0.05 Va) m/s ±0.3 m/s (Va = 5 m/s) |
| Weather Variables (Unit) | MAE | RMSE |
|---|---|---|
| Air Temperature (°C) | 0.10 | 0.33 |
| Relative Humidity (%) | 1.72 | 2.34 |
| Wind speed (km/h)—hourly average | 0.21 | 0.25 |
| Wind speed (km/h)—10 min average | 0.11 | 0.25 |
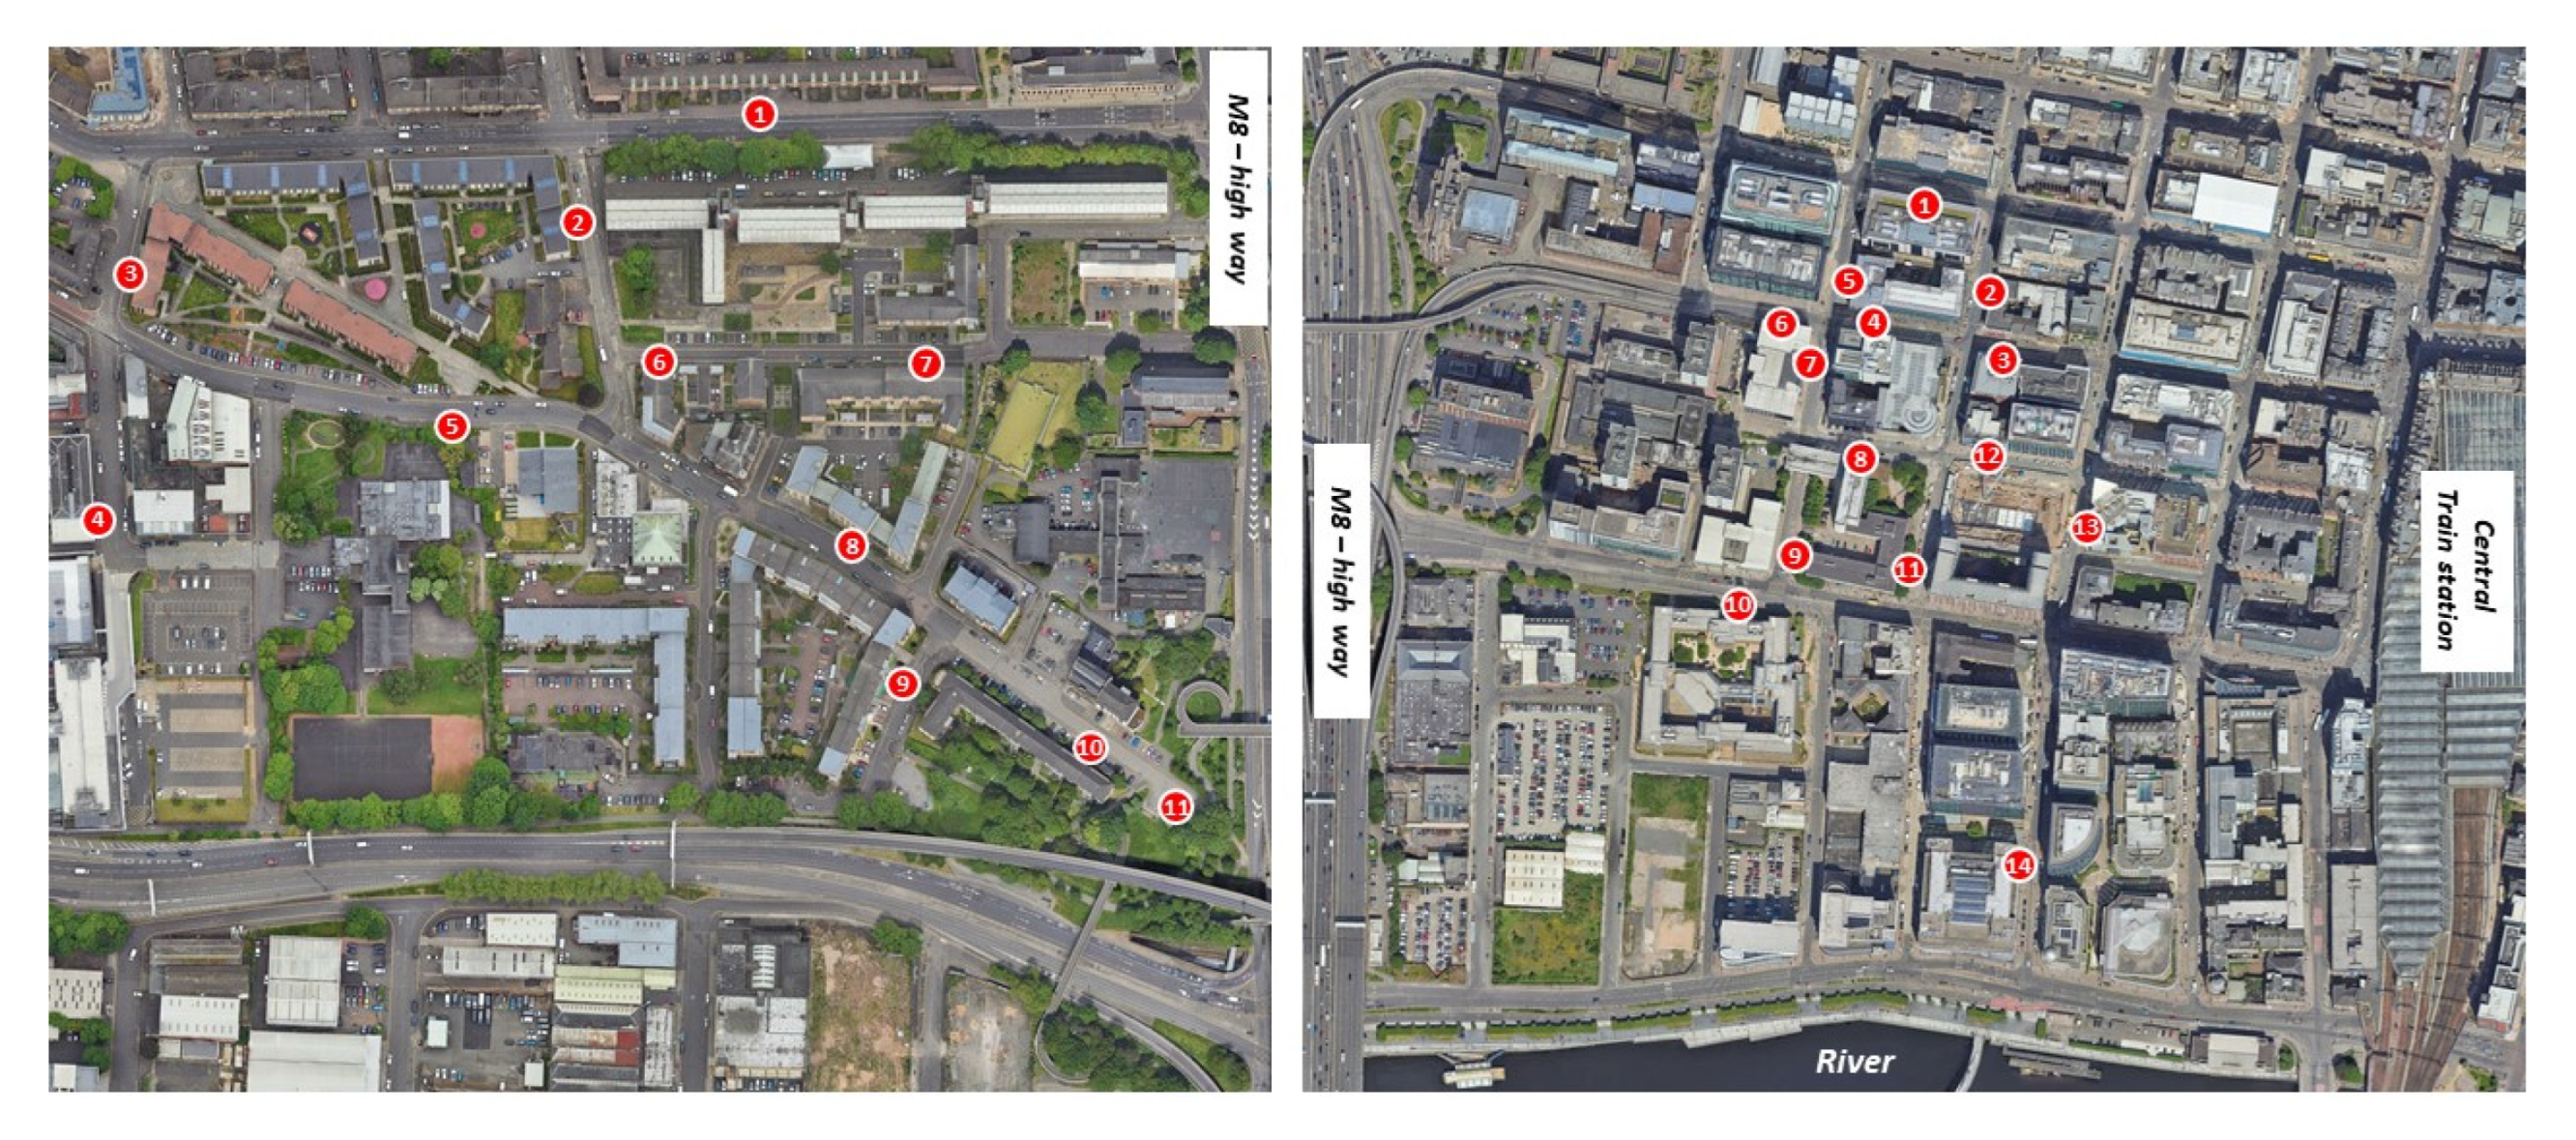
| Route A—Parts | Description |
|---|---|
| Part 1 | Residential and Warehouse |
| Part 2 | Riverside with greens |
| Part 3 | Glasgow Green Park |
| Part 4 | Riverside adjacent to the city centre |
| Part 5 | Glasgow City Centre |
| Scenarios | ‘On the Move’ | ‘Stop and Go’ | |||||||
|---|---|---|---|---|---|---|---|---|---|
| Part 1 | Part 2 | Part 3 | Part 4 | Part 5 | GCU to M8 | M8 to GCU | Residential | Commercial | |
| Mean | 1.3 | 1.0 | 1.5 | 2.9 | 2.9 | 1.9 | 2.8 | 2.5–2.9 | 2.5–2.7 |
| Min | 0.1 | 0.6 | 0.4 | 0.4 | 0.6 | 0.3 | 0.4 | 0.3–0.7 | 0.3–0.8 |
| Max | 4.6 | 2.4 | 4.1 | 6.5 | 4.6 | 5.5 | 6.9 | 4.3–8.7 | 4.0–7.8 |
| Std | 1.1 | 0.4 | 1.0 | 1.0 | 0.9 | 1.1 | 0.8 | 0.8–1.3 | 0.8–1.1 |
Disclaimer/Publisher’s Note: The statements, opinions and data contained in all publications are solely those of the individual author(s) and contributor(s) and not of MDPI and/or the editor(s). MDPI and/or the editor(s) disclaim responsibility for any injury to people or property resulting from any ideas, methods, instructions or products referred to in the content. |
© 2025 by the authors. Licensee MDPI, Basel, Switzerland. This article is an open access article distributed under the terms and conditions of the Creative Commons Attribution (CC BY) license (https://creativecommons.org/licenses/by/4.0/).
Share and Cite
Sethupatu Bala, R.; Hosseinzadeh, S.; Sadeghineko, F.; Thomson, C.S.; Emmanuel, R. A Portable Non-Motorized Smart IoT Weather Station Platform for Urban Thermal Comfort Studies. Future Internet 2025, 17, 222. https://doi.org/10.3390/fi17050222
Sethupatu Bala R, Hosseinzadeh S, Sadeghineko F, Thomson CS, Emmanuel R. A Portable Non-Motorized Smart IoT Weather Station Platform for Urban Thermal Comfort Studies. Future Internet. 2025; 17(5):222. https://doi.org/10.3390/fi17050222
Chicago/Turabian StyleSethupatu Bala, Raju, Salaheddin Hosseinzadeh, Farhad Sadeghineko, Craig Scott Thomson, and Rohinton Emmanuel. 2025. "A Portable Non-Motorized Smart IoT Weather Station Platform for Urban Thermal Comfort Studies" Future Internet 17, no. 5: 222. https://doi.org/10.3390/fi17050222
APA StyleSethupatu Bala, R., Hosseinzadeh, S., Sadeghineko, F., Thomson, C. S., & Emmanuel, R. (2025). A Portable Non-Motorized Smart IoT Weather Station Platform for Urban Thermal Comfort Studies. Future Internet, 17(5), 222. https://doi.org/10.3390/fi17050222