In this section, an overview of the experimental results is provided, focusing on how well the models performed in both binary and multiclass classification scenarios. Different classifiers are evaluated to measure their accuracy in identifying encrypted traffic. The binary classification results were highly accurate, successfully distinguishing between doh and non-doh traffic. In the more challenging multiclass scenario, the models still performed well, accurately differentiating between multiple types of encrypted traffic, including various DoH clients’ behaviors. Feature selection was crucial to this improvement, as it focused on the most relevant data, significantly improving the models’ accuracy. The steps and techniques used in the experiments are discussed in detail in the following sections, exploring how performance was measured and how the proposed method influenced the results across both scenarios.
4.1. Performance Evaluation Metrics
In this study, four key performance metrics are used—accuracy, precision, recall, F1 score, and the confusion matrix—to evaluate the effectiveness of the proposed method. These metrics collectively provide a comprehensive understanding of the model’s classification performance across various aspects, including overall accuracy, the handling of positive instances, and the balance between precision and recall.
Accuracy, as the most general metric, measures the overall correctness of a model. It is calculated by dividing the total number of correct predictions (both True Positives
TP and True Negatives
TN) by the total number of samples [
34]. This metric is especially useful when the dataset is balanced, as it provides an overall measure of performance Equation (7).
Precision, on the other hand, focuses on the model’s ability to correctly predict positive instances via Equation (8). It calculates how many of the predicted positive instances are actually correct, making it a crucial metric when False Positives (
FP) need to be minimized [
35].
Recall (also known as sensitivity) evaluates how well the model captures all
TP instances via Equation (9). It measures the proportion of actual positive instances that are correctly identified, making it important when missing positive instances is costly [
36]
The F1 score balances both precision and recall by calculating their harmonic means, providing a single metric that is particularly useful when dealing with imbalanced datasets Equation (10). The F1 score helps balance the trade-offs between precision and recall [
37]:
The confusion matrix is an essential tool for evaluating the performance of an ML classification model. It shows a breakdown of the predictions of the model versus the actual results, allowing you to see how well your model is performing and where it may fail. The matrix itself is a table where the rows and columns indicate different categories [
38]. Each cell in the table shows the number of predictions for a particular category from the predicted categories versus the actual categories.
The Chi-square test was applied to demonstrate the significant impact of ACO-based feature selection on model performance compared to the same model without feature selection. For instance, when the Random Forest algorithm was used with ACO-selected features, it achieved the highest accuracy, significantly outperforming the model without feature selection. The p-values for the two classification scenarios were 0.0012 and 0.0007, respectively.
In addition to evaluating classification performances on the hold-out test set, 5-fold cross-validation (5-Fold CV) was employed to further validate the consistency and robustness of the results. This method involves dividing the training data into five subsets, ensuring that each model is trained and tested across varied data partitions.
4.2. Feature Analysis and Discussion
Feature Feature selection is a critical step in handling large datasets, as it reduces dimensionality, enhances model performance, and mitigates overfitting caused by irrelevant or redundant features. An excessive number of features can introduce noise, increase computational complexity, and degrade model performance, particularly in large-scale data processing. Effective feature selection not only improves processing efficiency and reduces storage requirements but also ensures the inclusion of relevant features, thereby enhancing both model accuracy and interpretability.
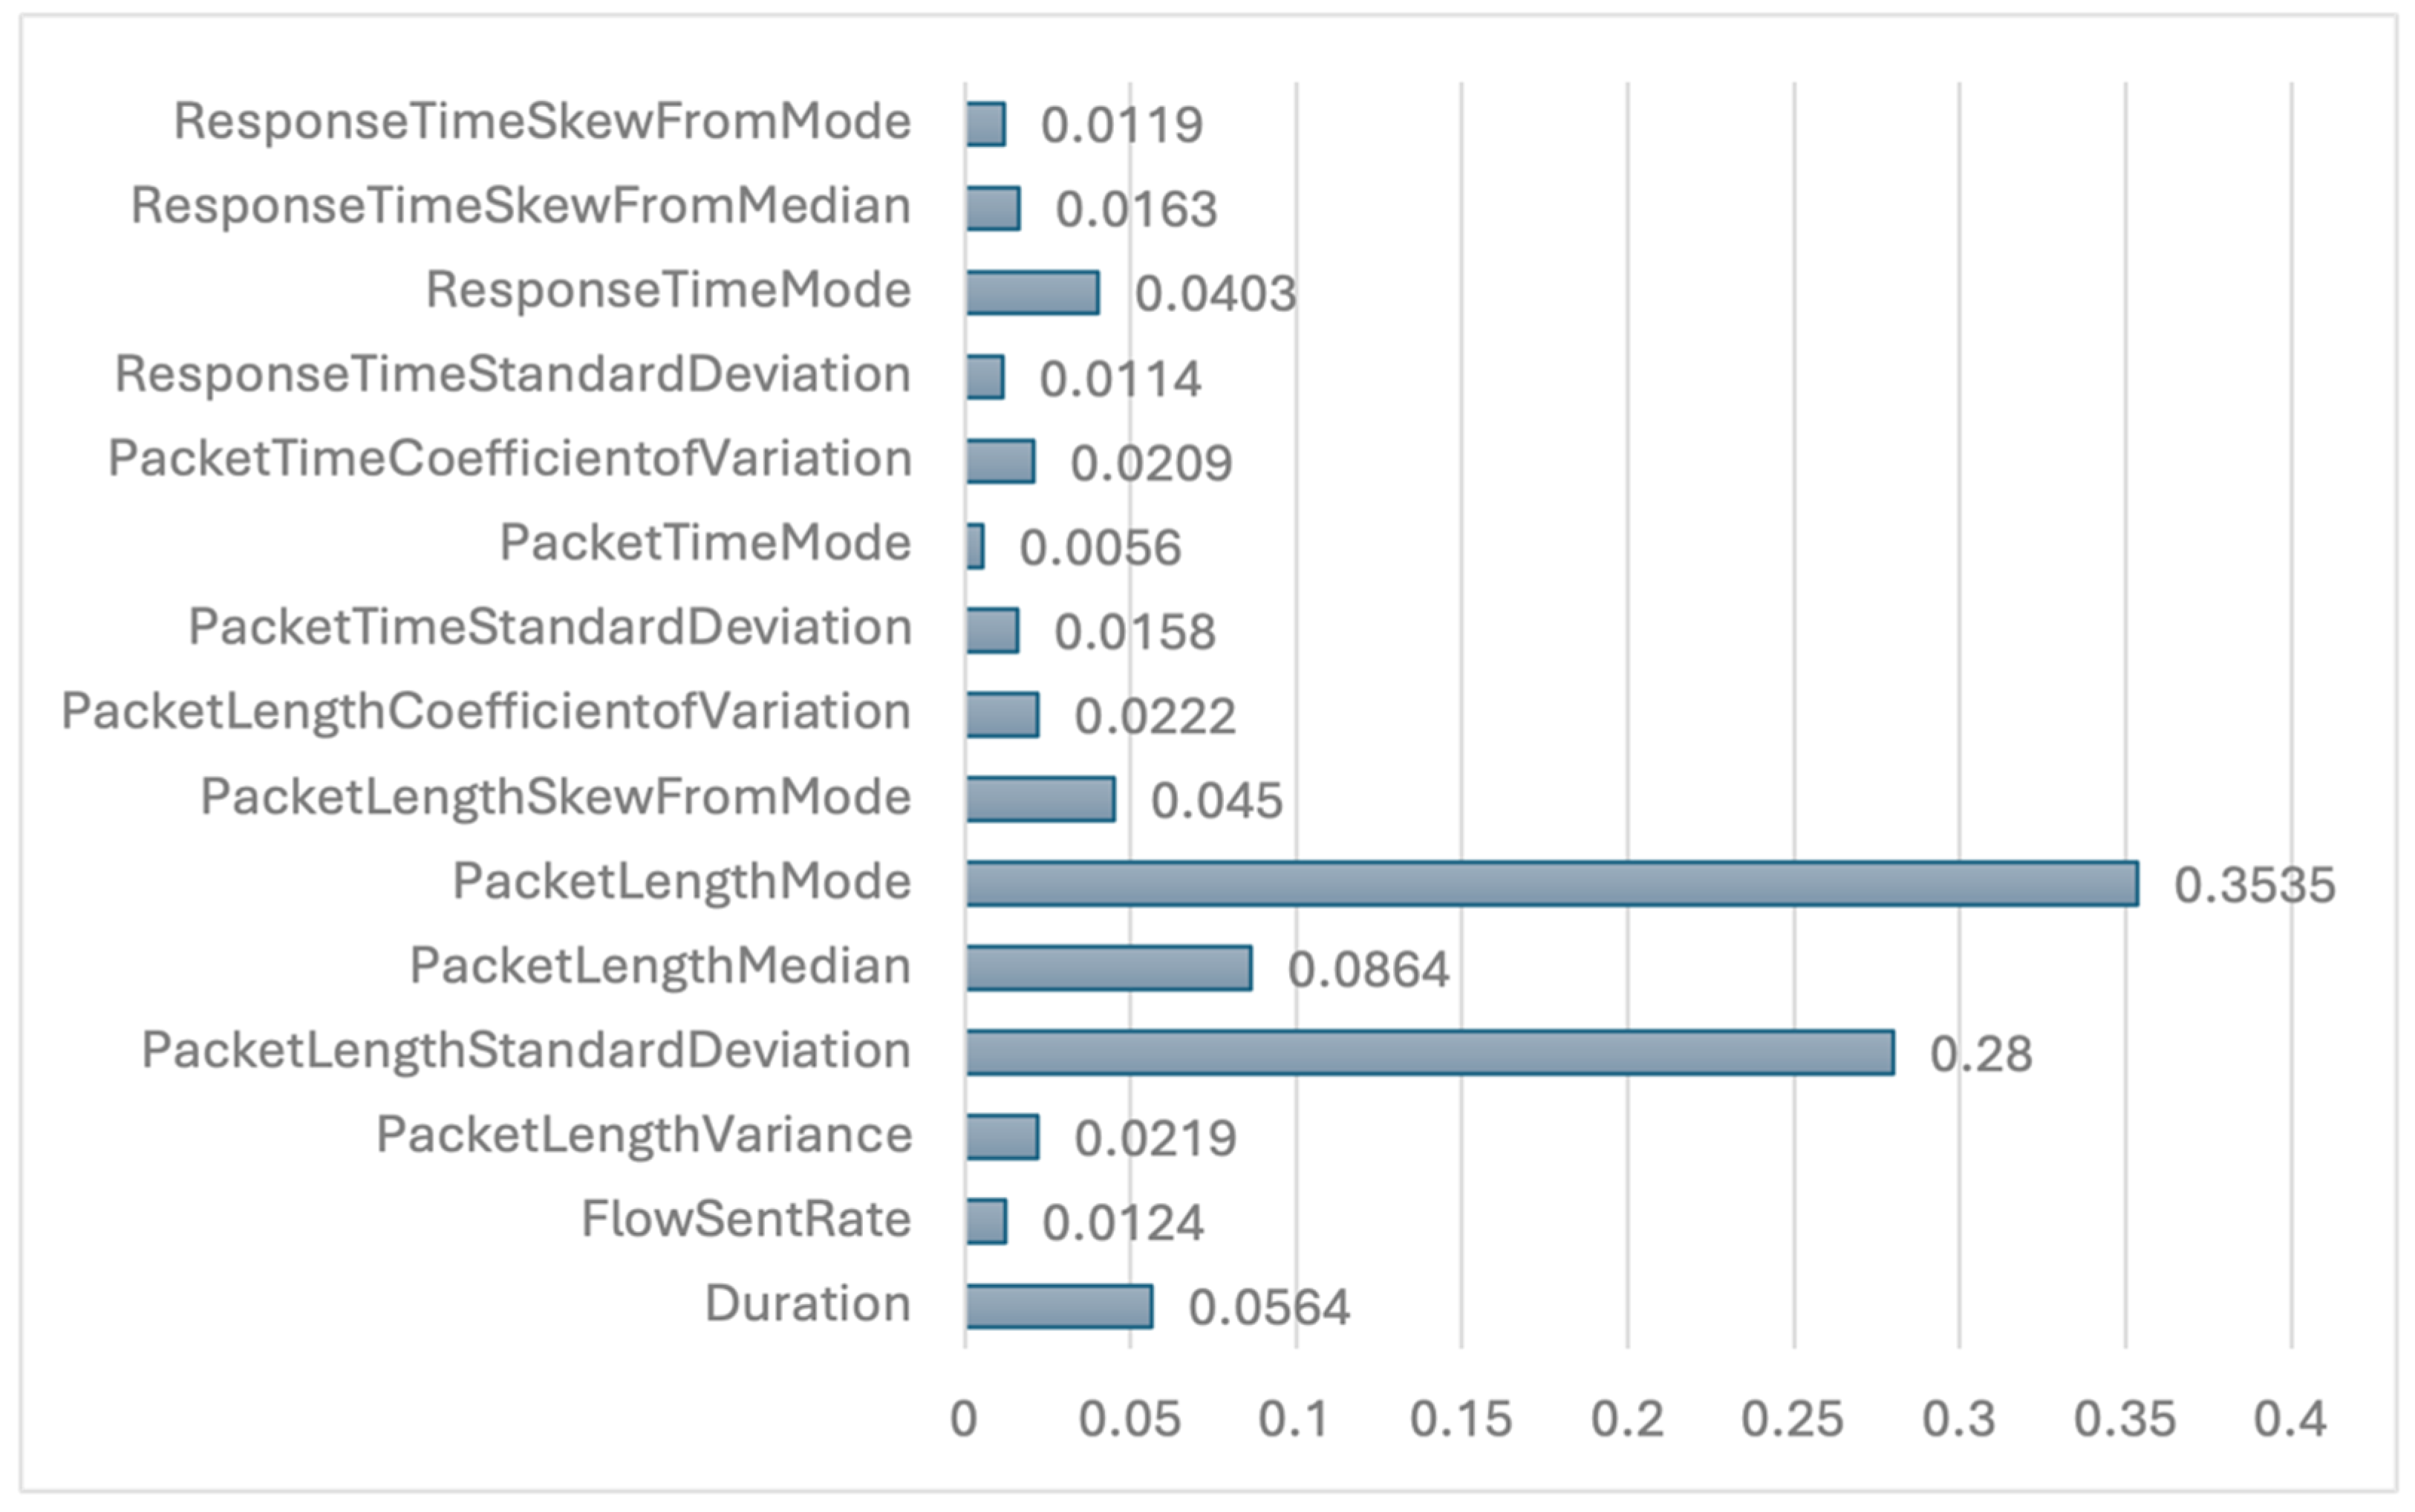
The proposed method reduces the total number of dataset features to 15 for both classification scenarios, ensuring optimal performance. The selected features for each scenario, along with their corresponding importance values, are presented in
Figure 7 and
Figure 8, providing insights into their contributions to model predictions. Among these features,
PacketLengthMode is identified as the most influential in both scenarios. In contrast,
PacketLengthCoefficientofVariation in the binary classification scenario and
PacketTimeMode in the multiclass classification scenario exhibit the lowest feature importance, indicating their minimal impact on model performance. Furthermore,
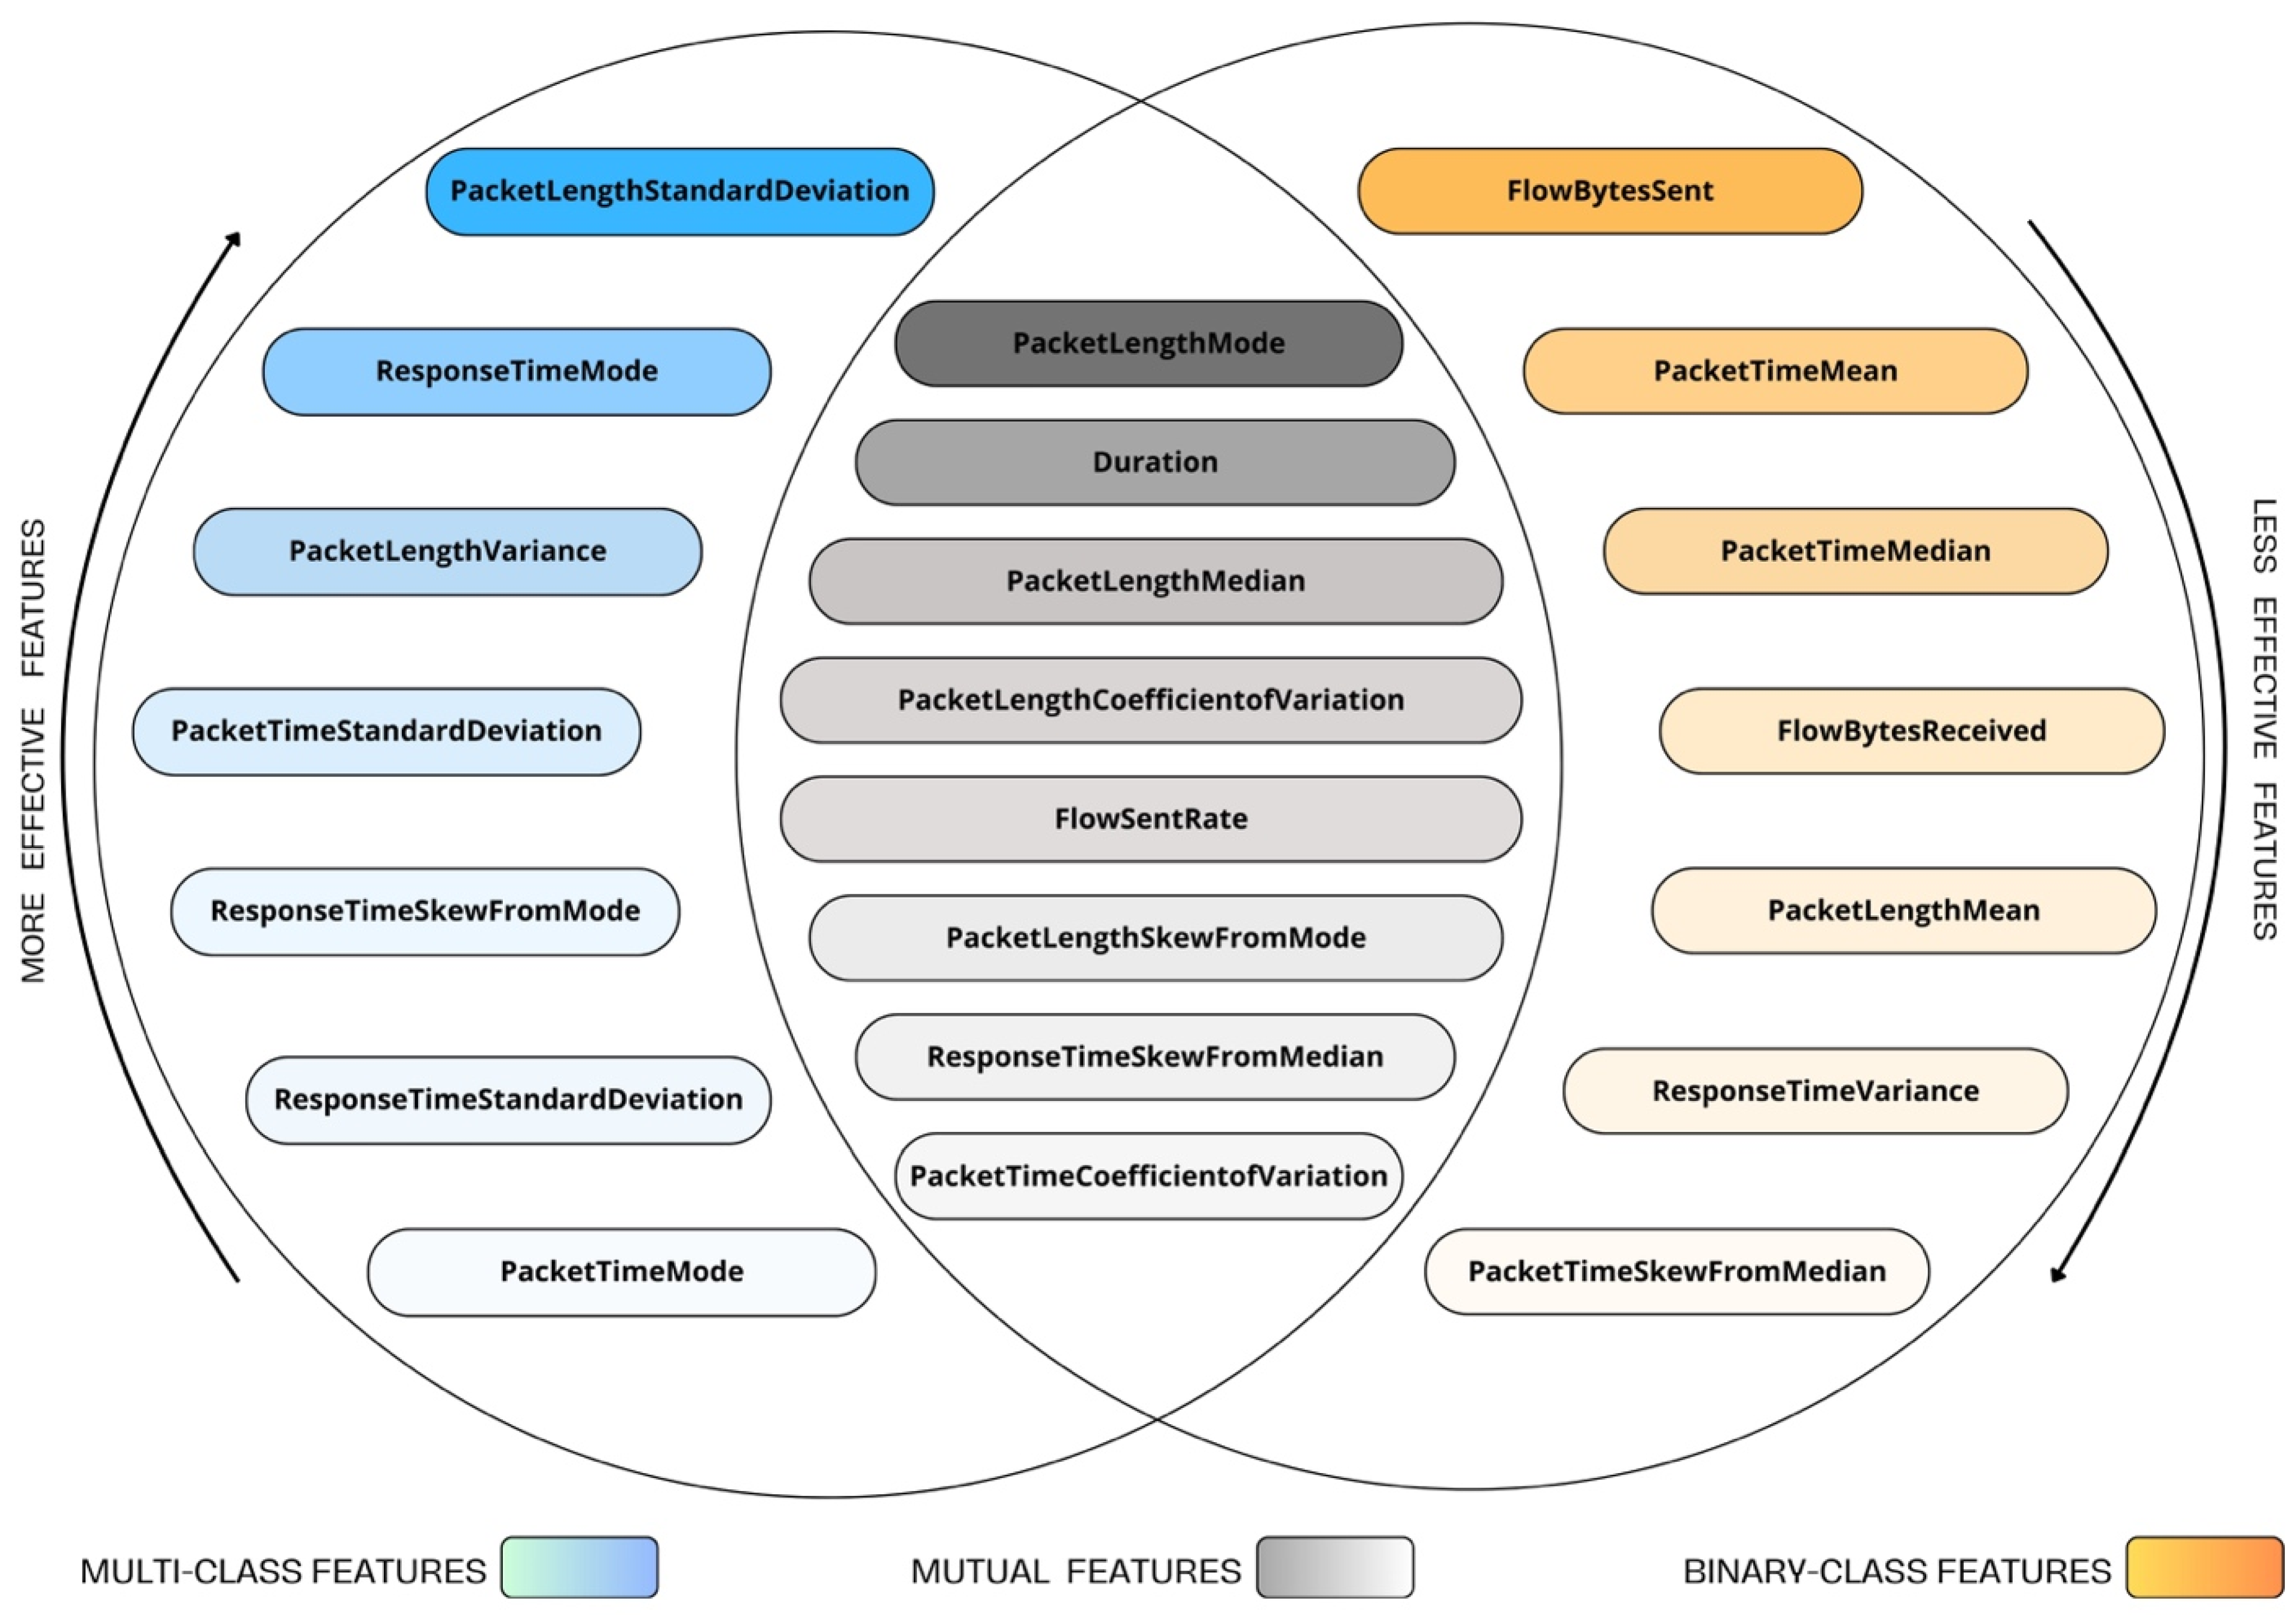
Figure 9 highlights the mutual features selected in both classification tasks, emphasizing the common attributes that contribute to consistent model behavior across scenarios.
4.3. Classification Performance and Analysis
This section presents the evaluation results of the classification performances. The analysis compares the performance of all used classifiers across both binary and multiclass scenarios using previously mentioned metrics, with and without feature selection. The following tables present the performance results of four classifiers evaluated on all dataset characteristics using the previously defined comparison metrics.
Table 4 and
Table 5 report the results for binary and multiclass classification, respectively, without feature selection. In contrast,
Table 6 and
Table 7 report the outcomes after applying ACO for feature selection in both binary and multiclass classification scenarios. The results indicate that the features selected by the proposed method enhance the classification performance across all evaluated algorithms.
To further assess the generalizability of the proposed models and ensure robustness beyond a single train-test split, a 5-fold CV was applied in addition to the hold-out test set evaluation. This method evaluates model performance across multiple, diverse subsets of the data, providing a more comprehensive view of its stability. As expected, a slight decrease in performance metrics was observed during cross-validation. This modest drop is anticipated and considered a positive indication that the models are not overfitted to a particular split and are capable of generalizing well to various dataset samples.
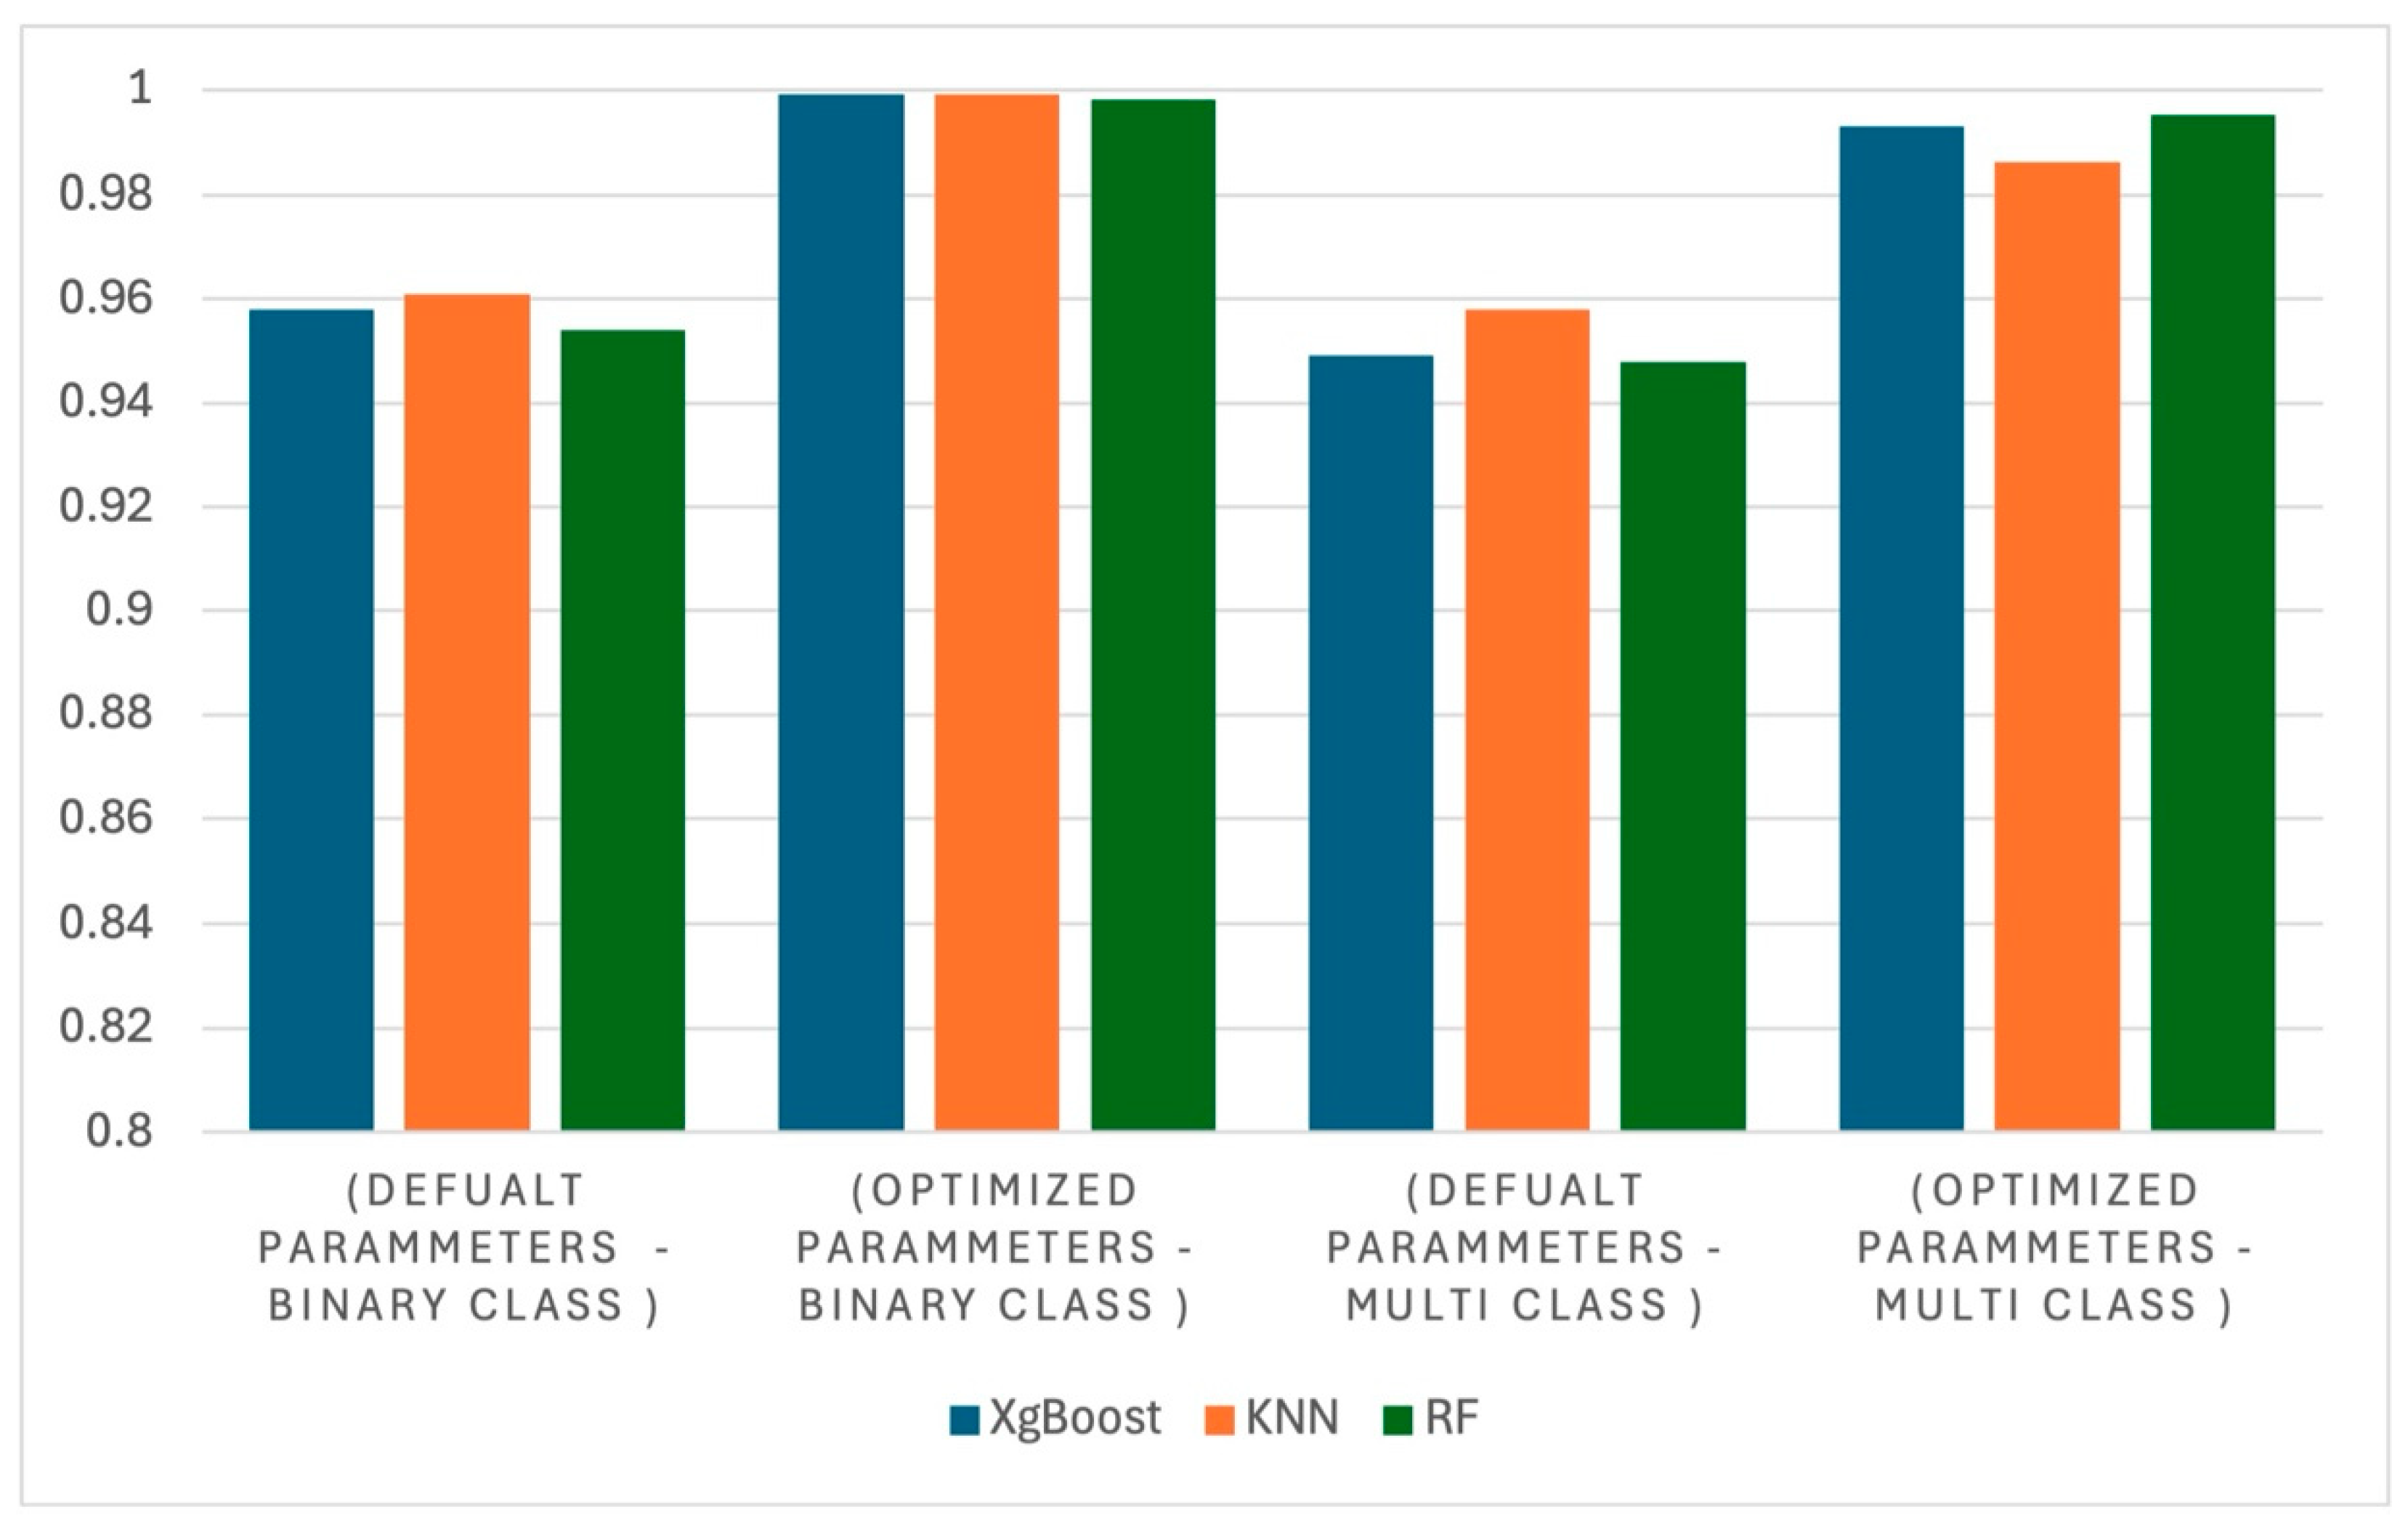
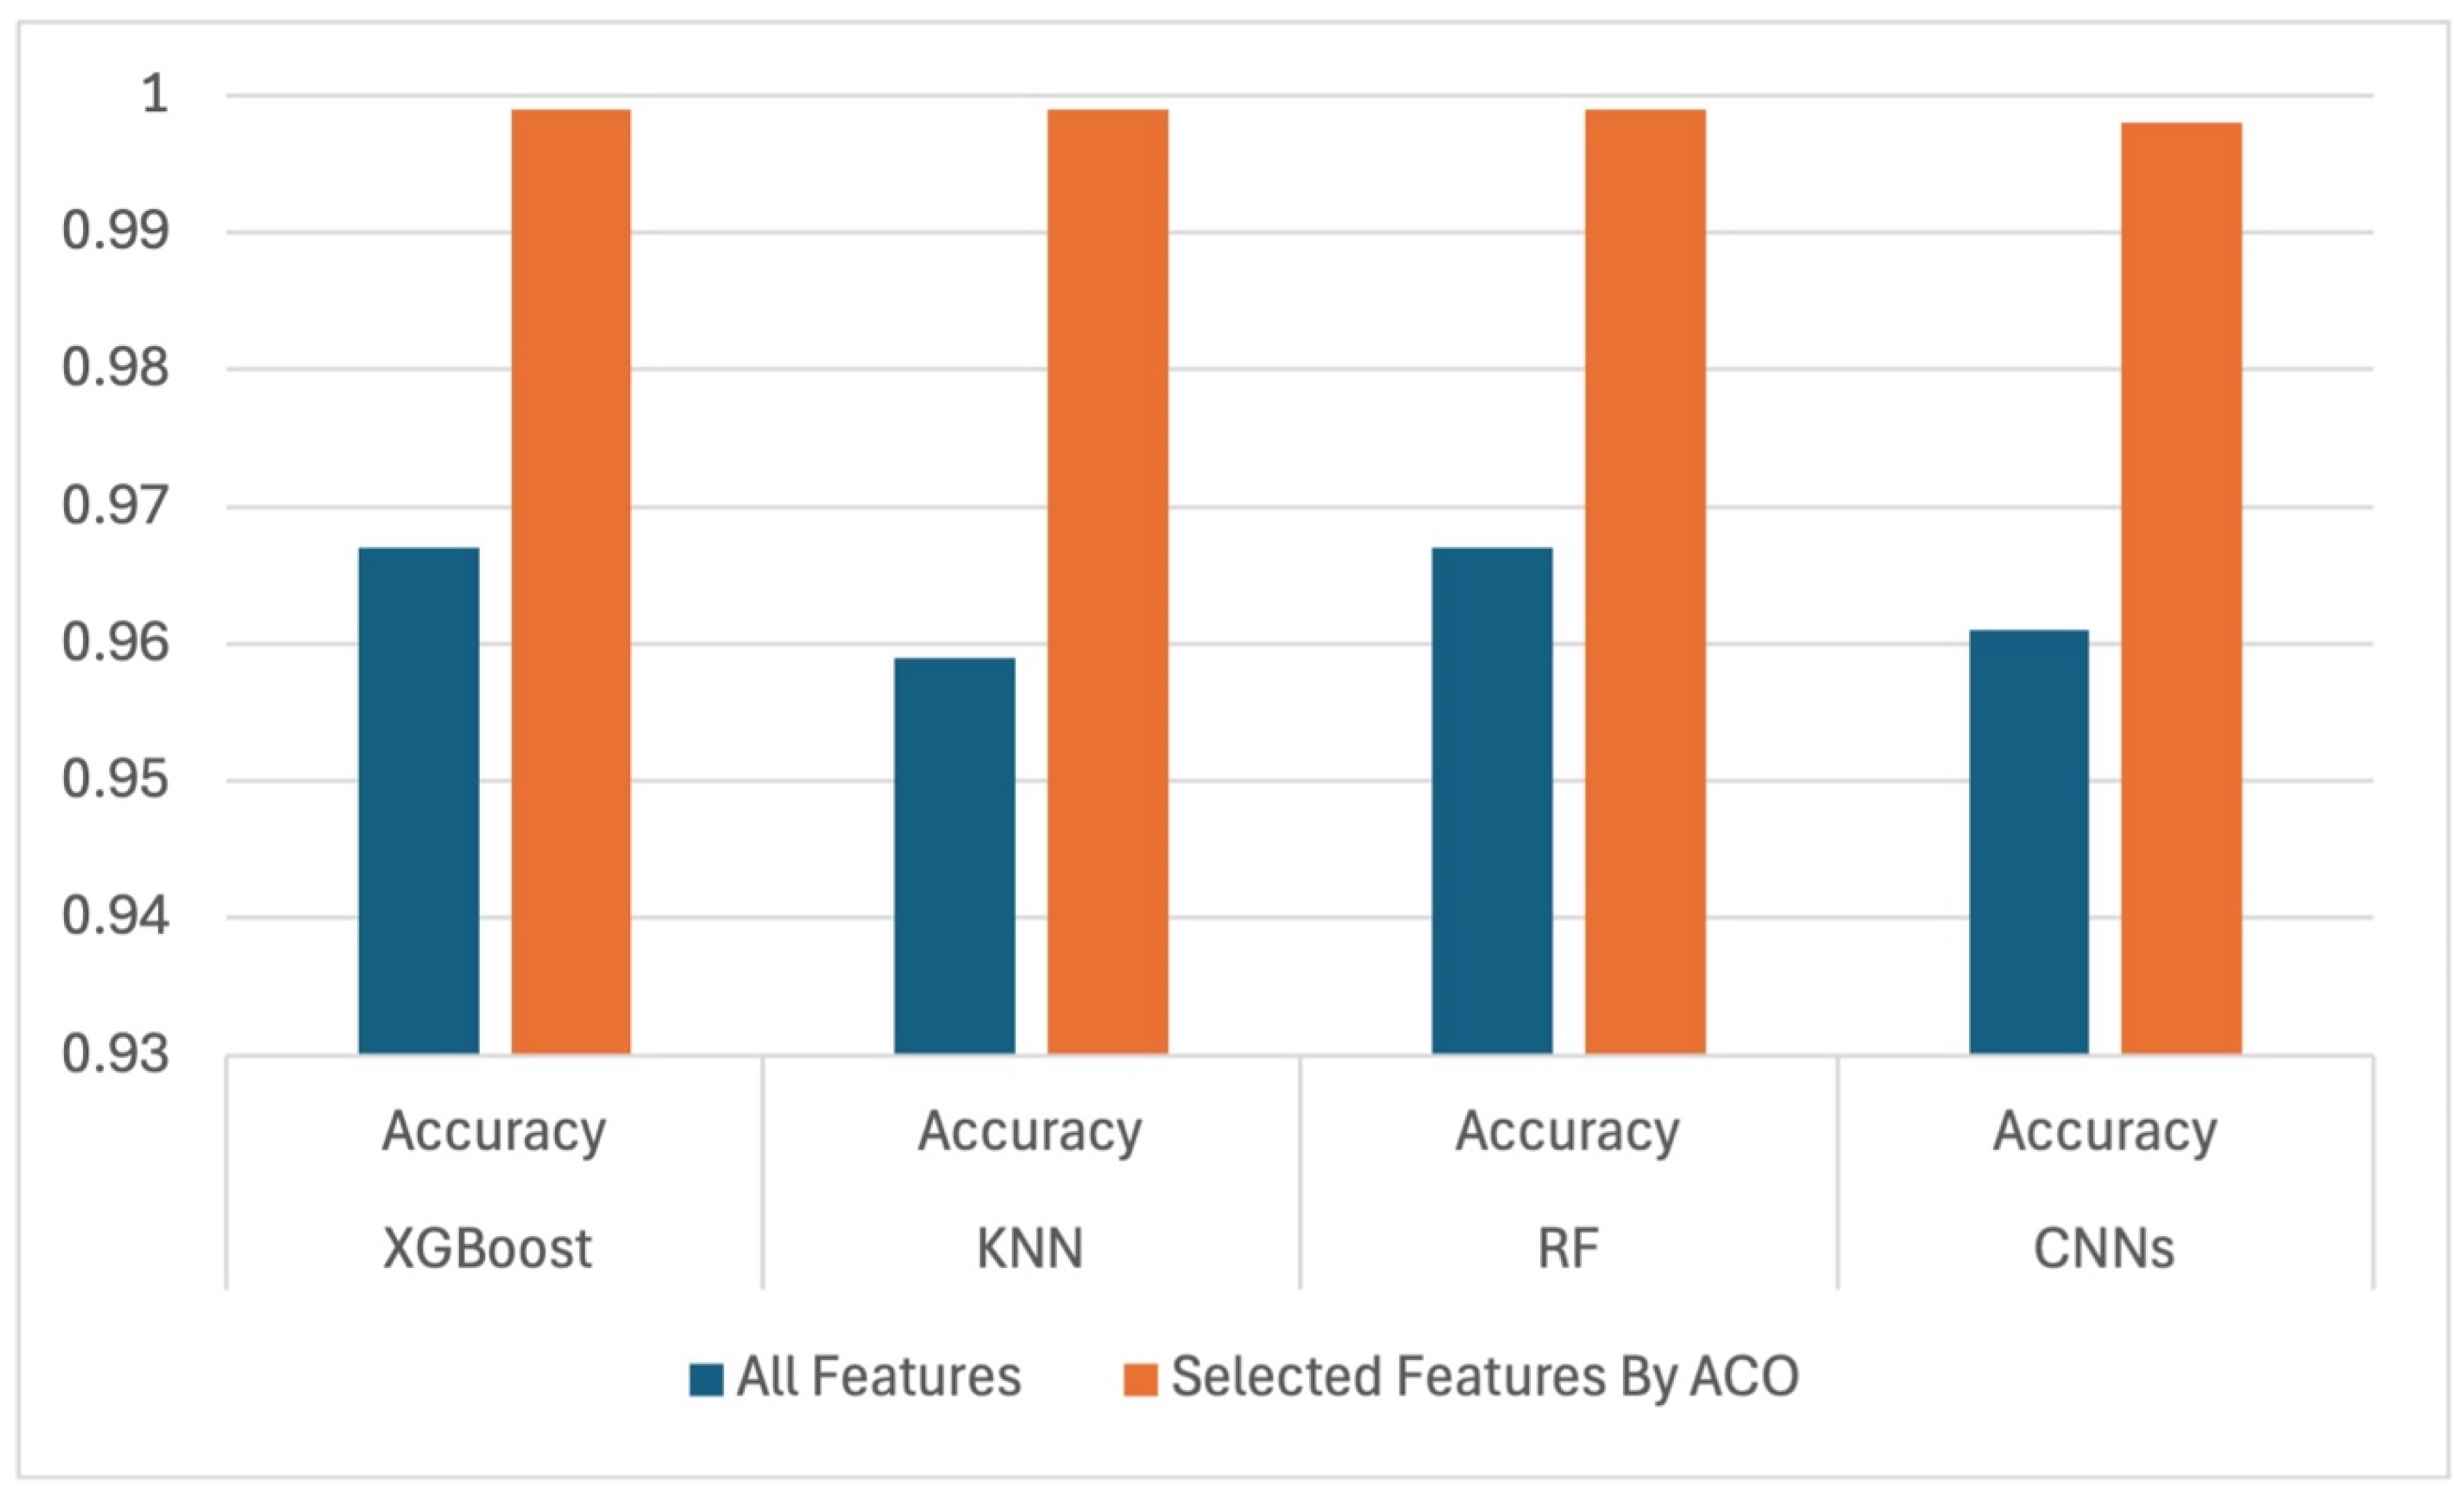
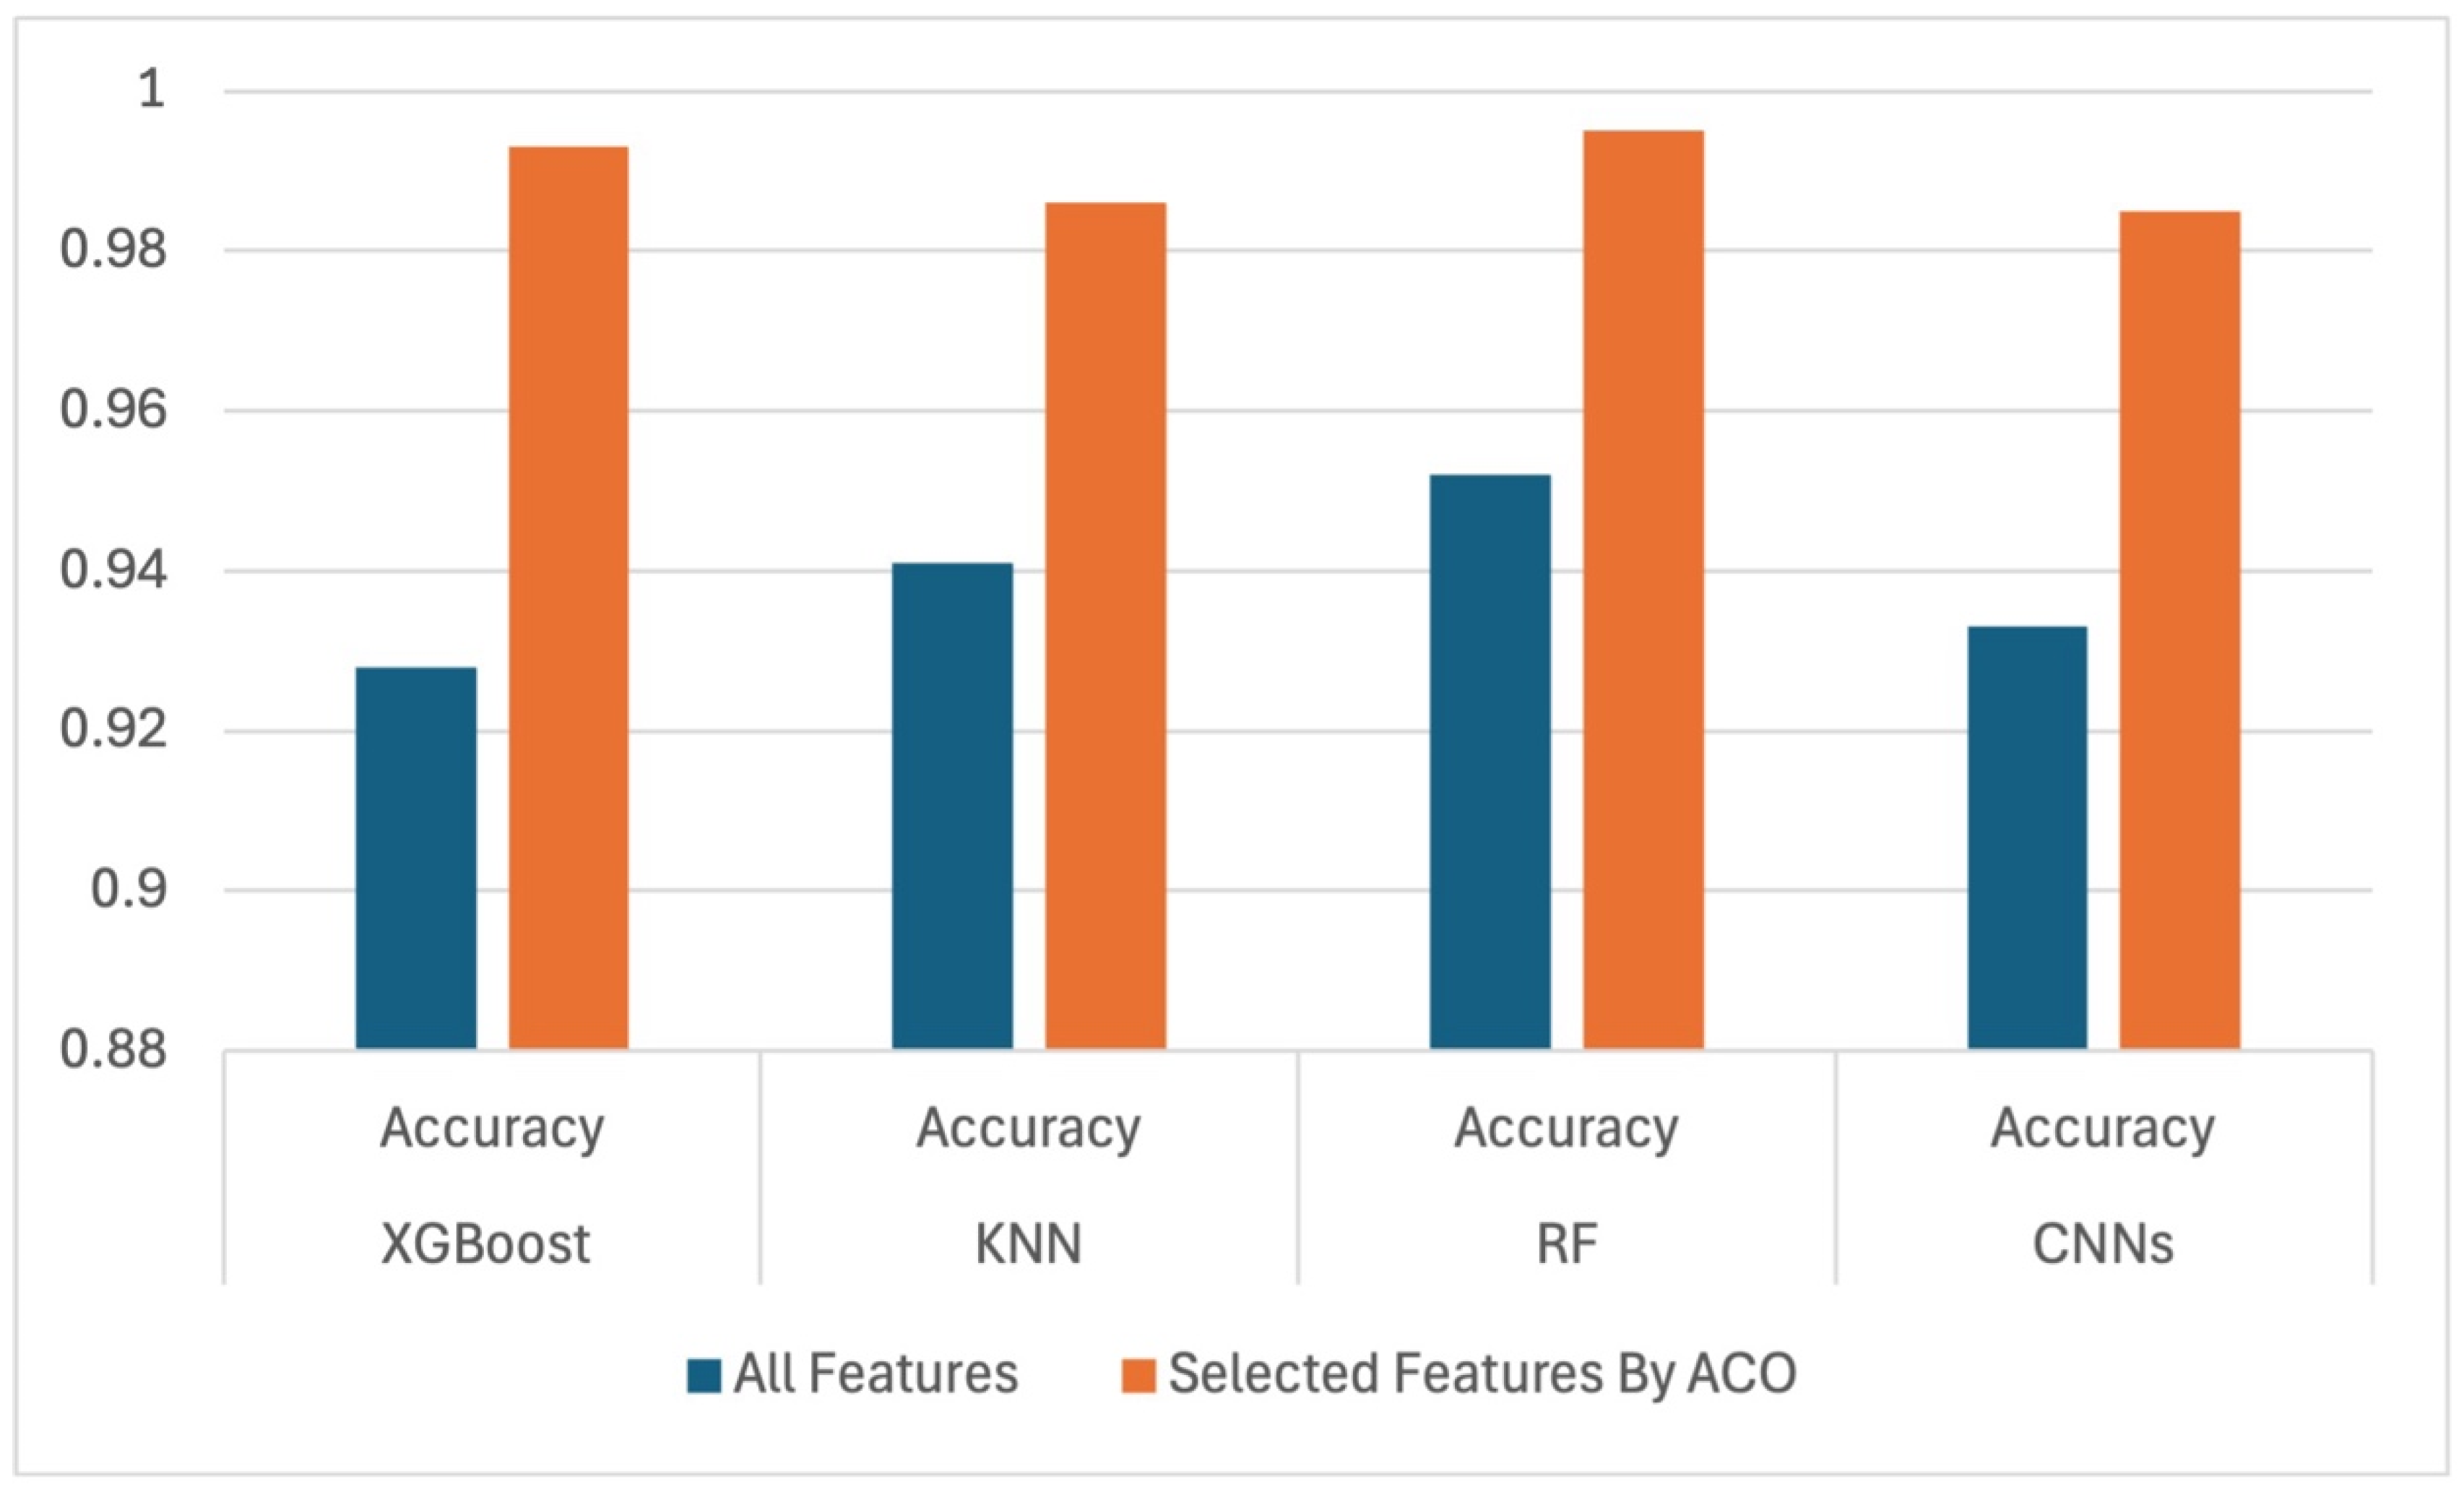
Figure 10 and
Figure 11 show a comparative chart and provide detailed visual representations of performance accuracies with all features against selected features for all classifiers in both classification tasks.
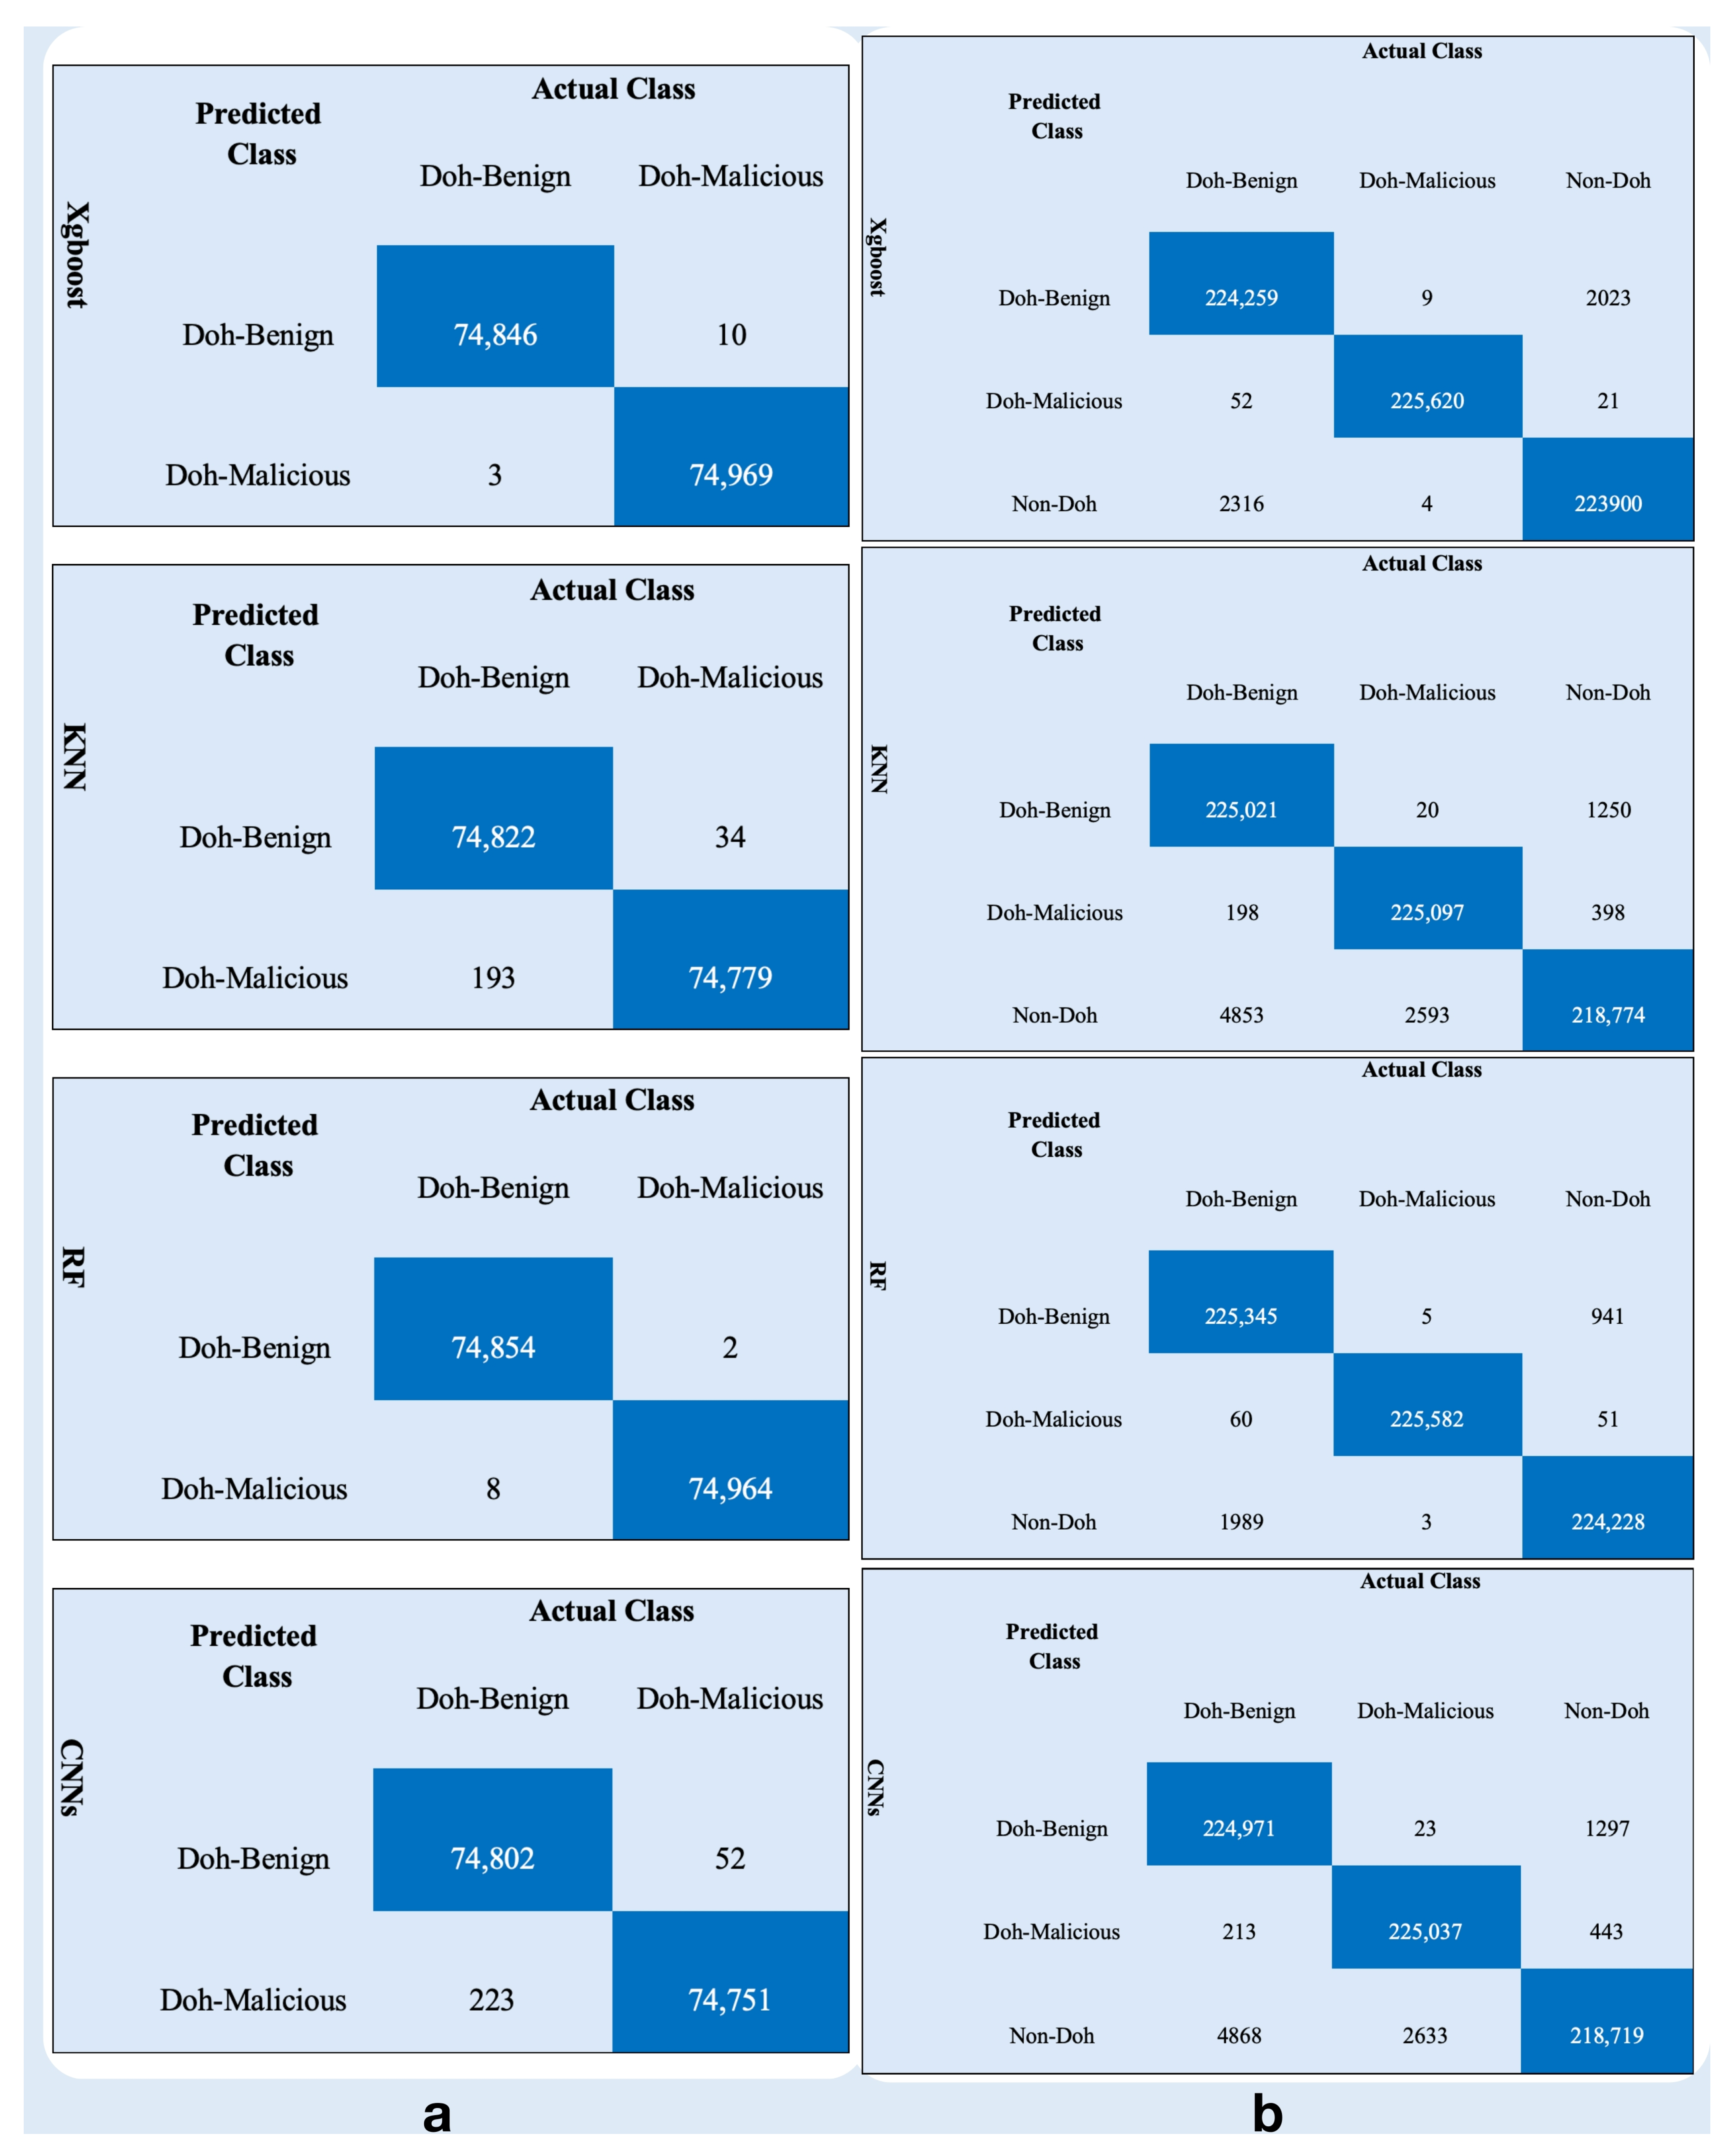
To demonstrate the feasibility of the proposed method, confusion matrixes for all used classifiers are presented for binary and multiclass classification in
Figure 12a,b, respectively. Providing insight into the feasibility of each classifier and how it performs accurately and correctly identifies TP, TN, FP, and FN through the features selected for it by the proposed method. The classes in binary classification are (Doh-benign, Doh-malicious) while the tuples in multiclass classification are (Doh-benign, Doh-malicious and Non-Doh).
Related to binary class, XGBoost demonstrated superior discriminative capability, achieving 74,846 TN for Doh-benign and 74,969 TP for Doh-malicious, with minimal misclassifications (10 FP and 3 FN]). RF exhibited comparable robustness, yielding 74,854 TN and 74,964 TP, though slightly higher (FN 8) relative to XGBoost. In contrast, KNN showed reduced precision, misclassifying 34 benign instances as malicious FP and 193 malicious instances as benign FN, resulting in lower TP 74,779 and TN 74,822. CNNs, despite their computational complexity, underperformed significantly, with 52 FP and 223 FN, reflecting challenges in generalizing to minority-class detection (74,751 TP and 74,802 TN). These results underscore the efficacy of ensemble methods (XGBoost, RF) for imbalanced DoH traffic classification while highlighting potential limitations of distance-based (KNN) and deep learning models (CNNs) in scenarios requiring high specificity for security-critical Doh-malicious detection. The elevated FN rates in CNNs, which are 0.3% of malicious cases, further emphasize the risks of relying on unoptimized architectures for cybersecurity applications, where false negatives pose critical operational threats.
According to multiclass, XGBoost achieved robust discriminative performance, with high TP for all classes: 224,259 (Doh-benign), 225,620 (Doh-malicious), and 223,900 (Non-Doh). Its errors were minimal, primarily misclassifying 2023 Doh-benign instances as Non-Doh and 2316 Non-Doh samples as Doh-benign, while maintaining near-perfect precision for Doh-malicious (52 misclassified as benign, 21 as Non-Doh). RF outperformed all models in Doh-malicious detection 225,582 TP, with exceptionally low cross-class errors (e.g., only 3 Non-Doh misclassified as malicious) and strong Non-Doh recognition 224,228 TP. In contrast, KNN exhibited pronounced instability, particularly in distinguishing Non-Doh traffic: 4853 Non-Doh samples were misclassified as Doh-benign, and 2593 as Doh-malicious, while its Doh-malicious TP 225,097 lagged behind ensemble methods. CNNs mirrored KNN’s limitations, with severe Non-Doh misclassifications (4868 Doh-benign and 2633 Doh-malicious) and elevated Doh-malicious errors (443 misclassified as Non-Doh), underscoring challenges in hierarchical feature learning for minority classes.
Notably, Doh-benign and Non-Doh confusion dominated error patterns across models, suggesting overlapping feature representations in non-malicious traffic. However, Doh-malicious detection remained highly reliable for XGBoost and RF (FN < 0.1%), critical for security applications where false negatives carry severe risks. The stark underperformance of KNN and CNNs, particularly in Non-Doh specificity, highlights the limitations of distance-based and deep learning models in multiclass scenarios with imbalanced or semantically ambiguous categories. These results advocate for ensemble methods (XGBoost, RF) in operational environments requiring high precision across heterogeneous network traffic while cautioning against deploying less interpretable models (CNNs) without targeted architectural optimization.
To further validate the effectiveness of the proposed approach, approximately 1000 records of live network traffic were collected and structured to match exactly the feature set and format of the CIRA-CIC-DoHBrw-2020 dataset. After undergoing the same preprocessing steps, the data were utilized to train the classifiers using the previously optimized feature subsets. The classification results, in both binary and multiclass scenarios, demonstrate that all models maintained performance levels comparable to those achieved on the original dataset, with only slight variations observed. These findings confirm the robustness and generalizability of the selected features and classification models across different classification tasks. A detailed comparison of the results is presented in
Table 8.
4.4. Computational Time and Complexity Reduction
In addition to improving classification performance, it is essential to evaluate the computational efficiency of the proposed feature selection method, particularly in terms of execution time and complexity. The execution time required by each classifier to process all features of the dataset was measured and compared with the time taken to classify the dataset using only the features selected by the proposed methods for both binary classification (
Table 9) and multiclass classification (
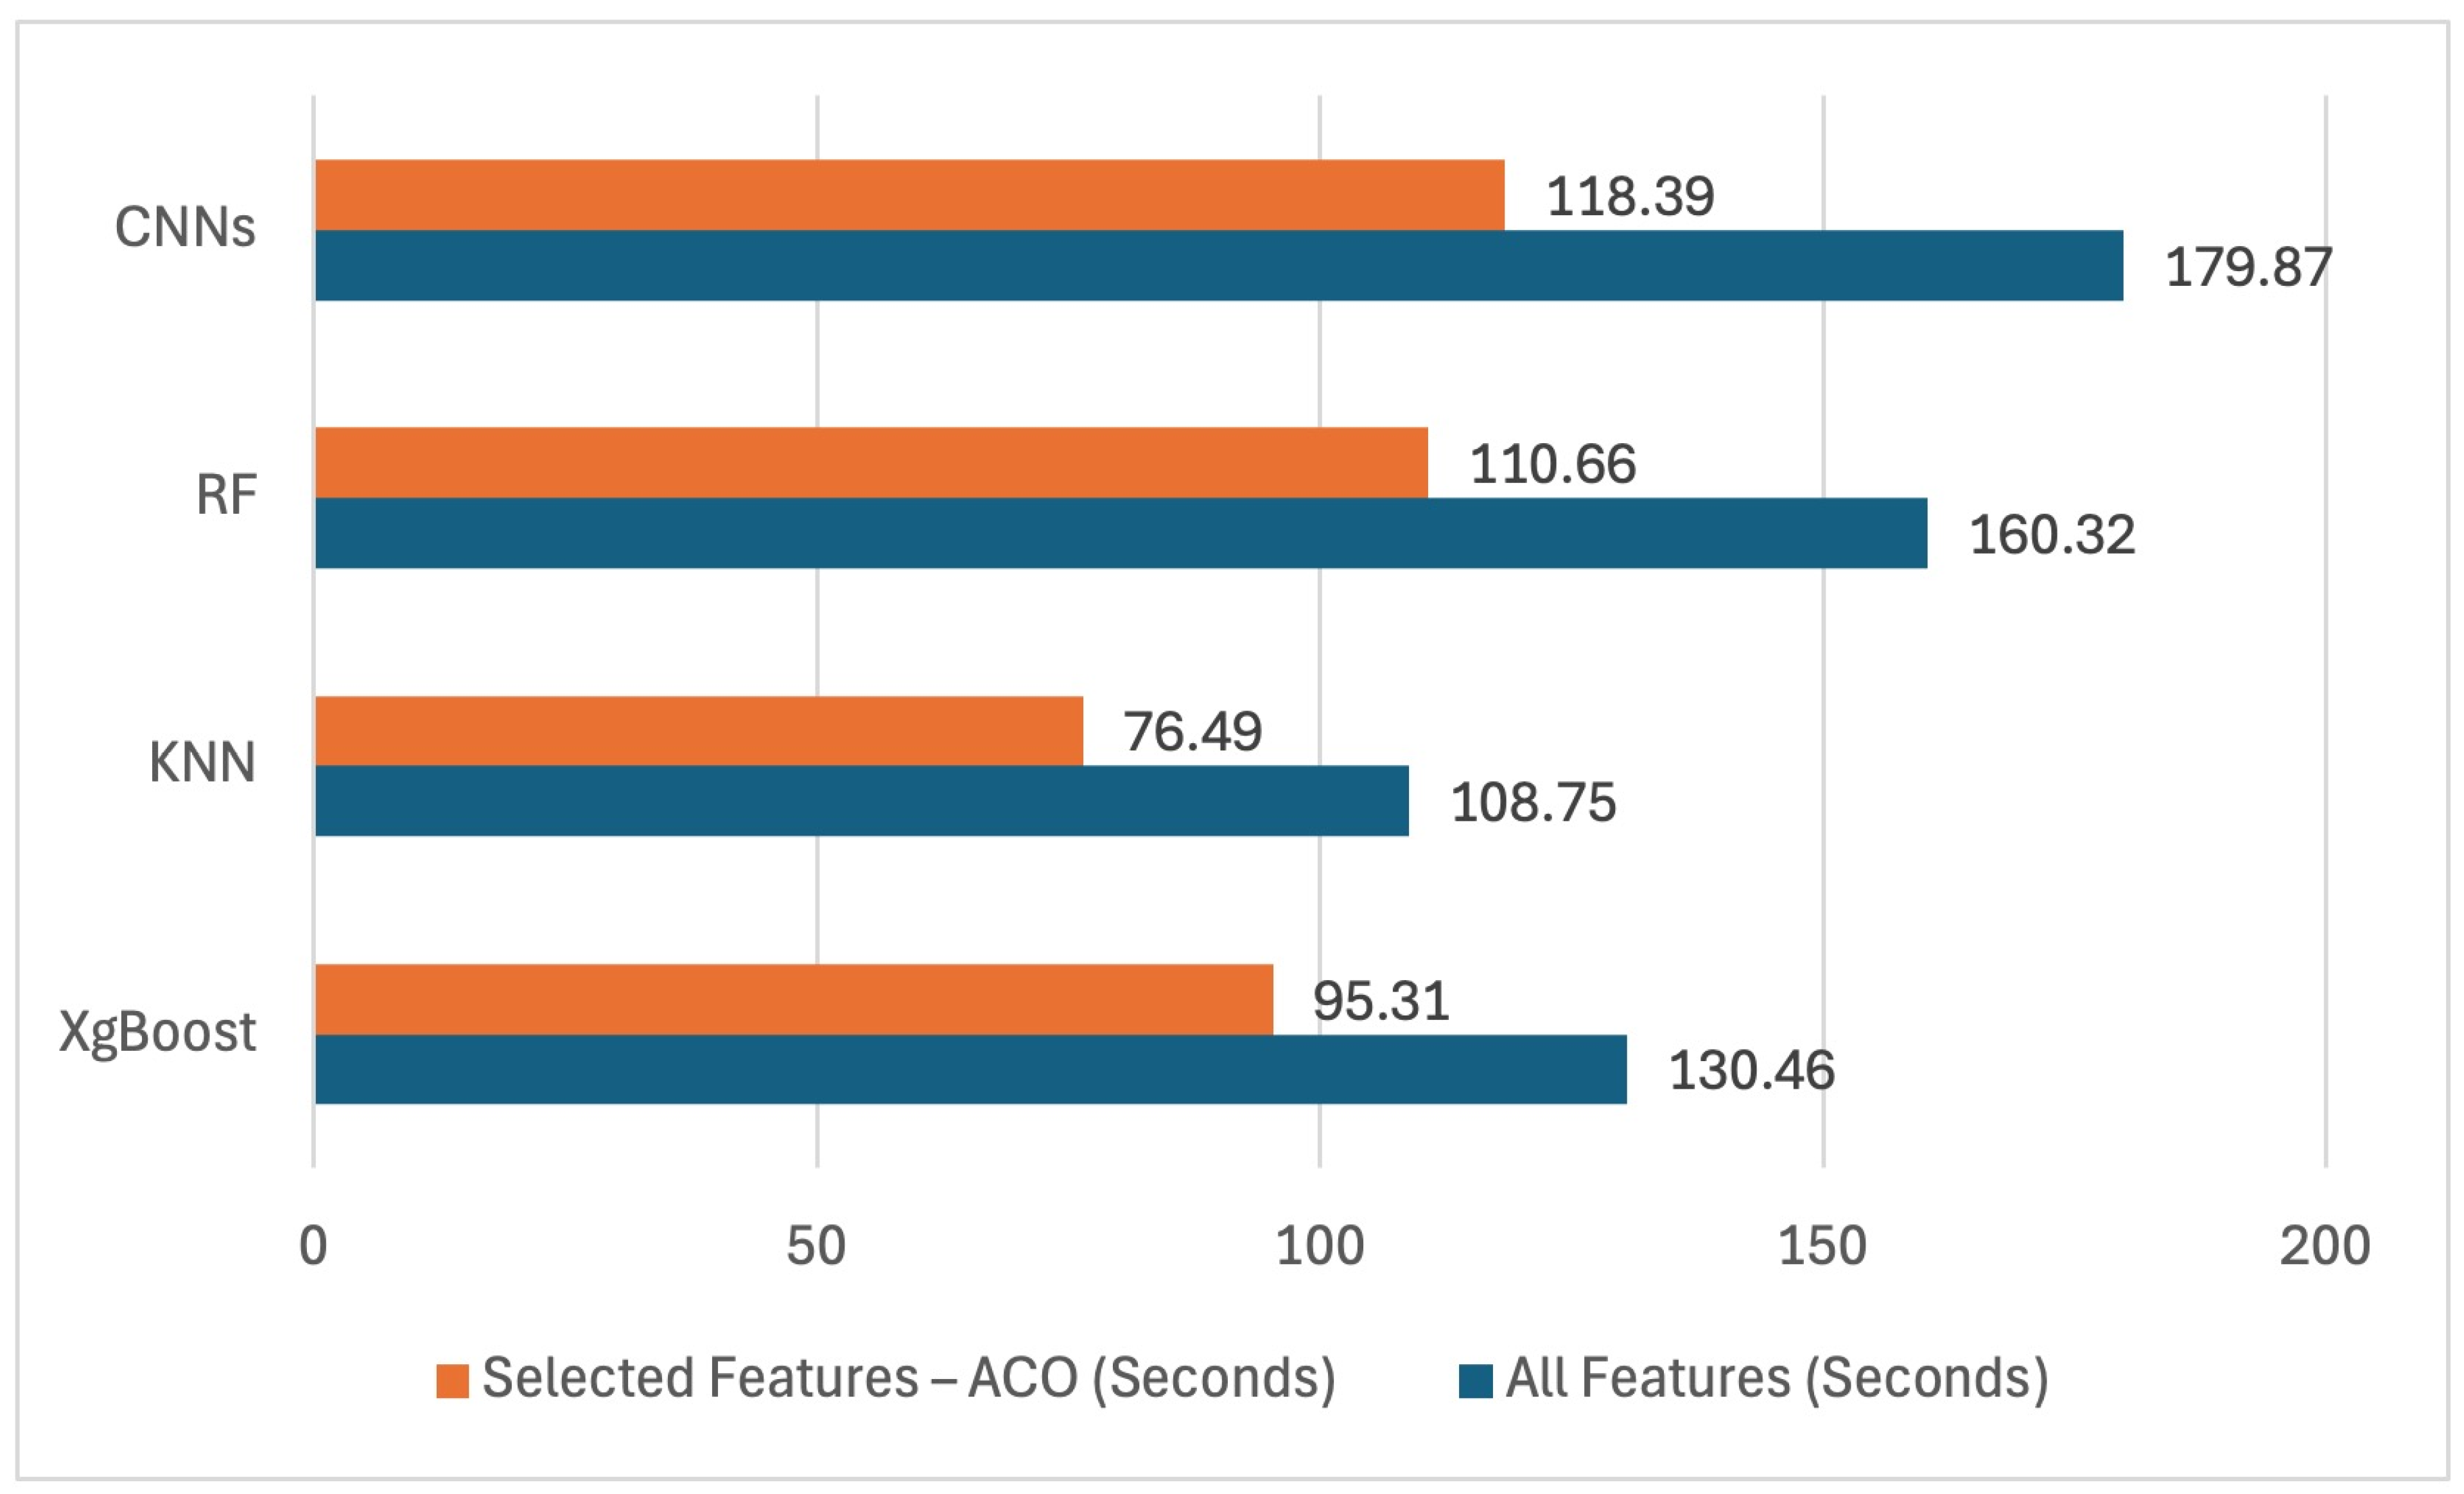
Table 10). This comparison provides a comprehensive assessment of the computational complexity involved in the decision-making process across different scenarios. By analyzing the classification times and calculating the reduction rate (as defined in Equation (11)) for both full and reduced feature sets, the results demonstrate that the proposed method significantly reduces execution time and overall computational complexity for all classifiers, as illustrated in
Figure 13 and
Figure 14.
The proposed method significantly contributed to reducing the less important features, which in turn contributed to reducing the computational complexity of the classifiers used in binary and multiclass classification.
Table 11 summarizes the effect of selecting the most important features for reducing the computational complexity before and after feature selection for KNN, XGBoost, RF, and
CNNs.
As practical challenges, Deploying machine learning-based solutions within IDSs in real-world environments introduces critical challenges, particularly concerning scalability and latency. As traffic volumes grow, IDSs must maintain efficient processing without compromising real-time detection capabilities. In the specific context of DoH, these challenges become even more pronounced due to the encryption, decryption, and high variability of traffic patterns. Furthermore, preprocessing overhead significantly affects latency, as features often differ in format and require various data preprocessing before classification. This added computational cost can delay real-time decision making and impact overall system responsiveness. Therefore, optimizing both the preprocessing pipeline and the learning model is essential to ensure scalable, low latency deployment in large scale DoH production environments.
4.5. State of the Art Comparison
In this section, the proposed method is compared with other methods in which metaheuristic optimization algorithms, such as the GA, PSO, ABC, and LOEO, have been deployed for the purpose of selecting effective features in the IDS field in general and DoH detection in particular. Since studies that used the CIRA-CIC-DoHBrw-2020 dataset based on metaheuristic optimization algorithms were not sufficient, other studies that relied on other benchmark datasets in the IDS field, such as UNSW-NB15 [
39] and ISCXIDS2012 [
40], were included in the comparison. Studies that focused exclusively on one scenario (binary class or multiclass) with respect to feature selection and classification performance accuracy are reported as not applied (N/A) in
Table 12. For example, ref. [
20] employed the PSO algorithm and achieved an accuracy of 97.2% for an exclusively binary scenario, selecting all the statistical features in the CIRA-CIC-DoHBrw-2020 dataset. Similarly, ref. [
23] focused exclusively on the multiclass scenario with a high classification accuracy rate of 98.9 using 25 features from the total features of the ISCXIDS2012 dataset via ABC optimization, leaving the binary scenario. Notably, including all or most of the dataset features used leads to an increase in computational complexity or a decrease in convergence efficiency for the metaheuristic optimization algorithm. In contrast, studies such as studies [
21,
22], which rely on selecting the minimum number of features with 12 features as a maximum for different benchmark datasets and apply optimization algorithms such as the GA and LOEO, which exclusively focus on multiclass scenarios, obtain relatively lower classification accuracies ranging between 94.5 and 97.6, respectively. Notably, the proposed method in this study selected a moderate number of features (15 features per scenario) from the CIRA-CIC-DoHBrw-2020 dataset via ACO, which achieved a balance between dimensionality and relevance and reported the highest performance accuracy compared with other methods for both binary and multiclass scenarios, which reached 99.99 and 99.55, respectively. This calls attention to the possibility of improving feature selection to achieve superior classification performance in various scenarios while maintaining the simplicity of the model.


