2. Materials and Methods
2.1. Framework of the Online Refractive Error Screening System
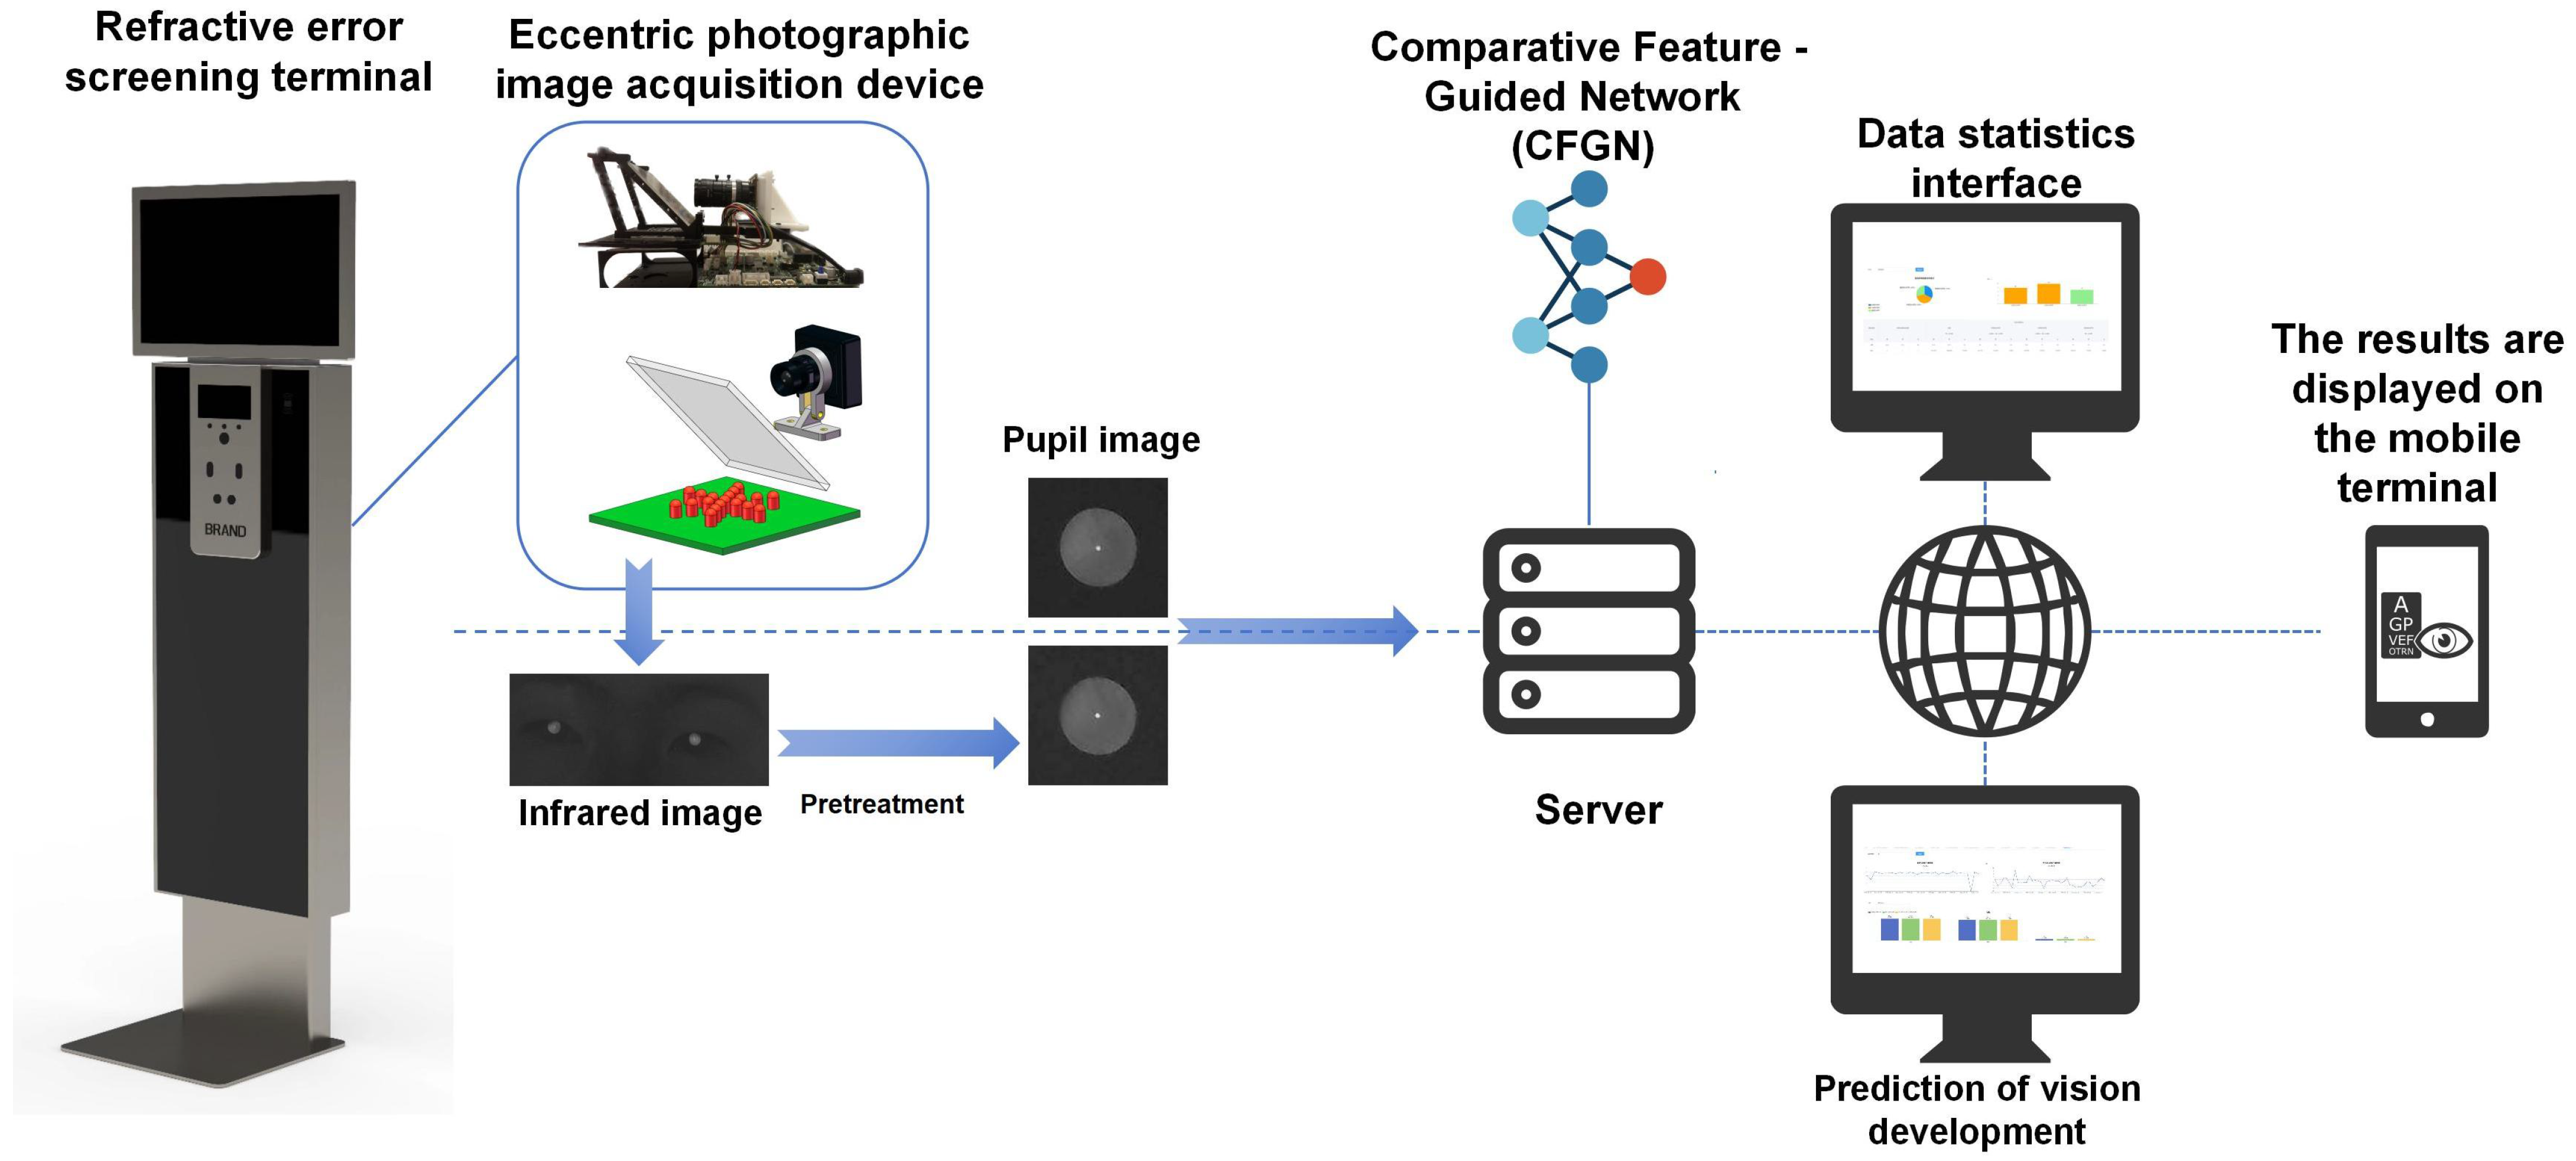
Figure 3 shows the overall framework of the proposed online refractive error screening system. It is divided into three main stages as follows:
First, after logging into the personal profile via facial recognition technology, eccentric photorefraction infrared images of the individuals being screened are collected by the refractive error screening terminal. The collected images are then transmitted to a data server via the cloud or stored locally to provide more data usage options. For instance, some data can be manually labeled and used for local model training with CFGN, but this requires a large amount of data. In the framework we propose, it is best to use cloud computing services to perform refractive error calculations on the uploaded image data to reduce the burden of file storage and computational resource usage. At the same time, the model-eye pretrained model deployed on the cloud can increase screening accuracy in small-sample scenarios. Fine-tuning the pretrained model with a small amount of locally collected data reduces data requirements, and uploading data from different regions simultaneously can improve data diversity and enhance model generalization. Finally, the screening results are transmitted to the individual or the parent’s computer or mobile phone to view the results.
Overall, doctors, schools, and healthcare institutions can access the vision screening platform through devices such as computers, mobile phones, and laptops. The platform is divided into a screening interface and a statistical analysis interface. In the screening interface, experts can choose between training or prediction options. In the training option, experts can train their personalized prediction model with data they have collected, and they can choose whether or not to use the model-eye pretrained model and transfer learning methods. In the prediction option, experts can upload their personal data to use existing models for refractive error screening tasks.
Doctors and schools can access the statistical analysis interface to understand the vision status of local children and adolescents and take timely countermeasures. Parents and students can access their vision health records through a personal vision health app, which connects to the electronic health record database. This allows them to check screening results, track vision status and trends, and receive early intervention and treatment if necessary.
2.2. Proposed Methodology
As shown in
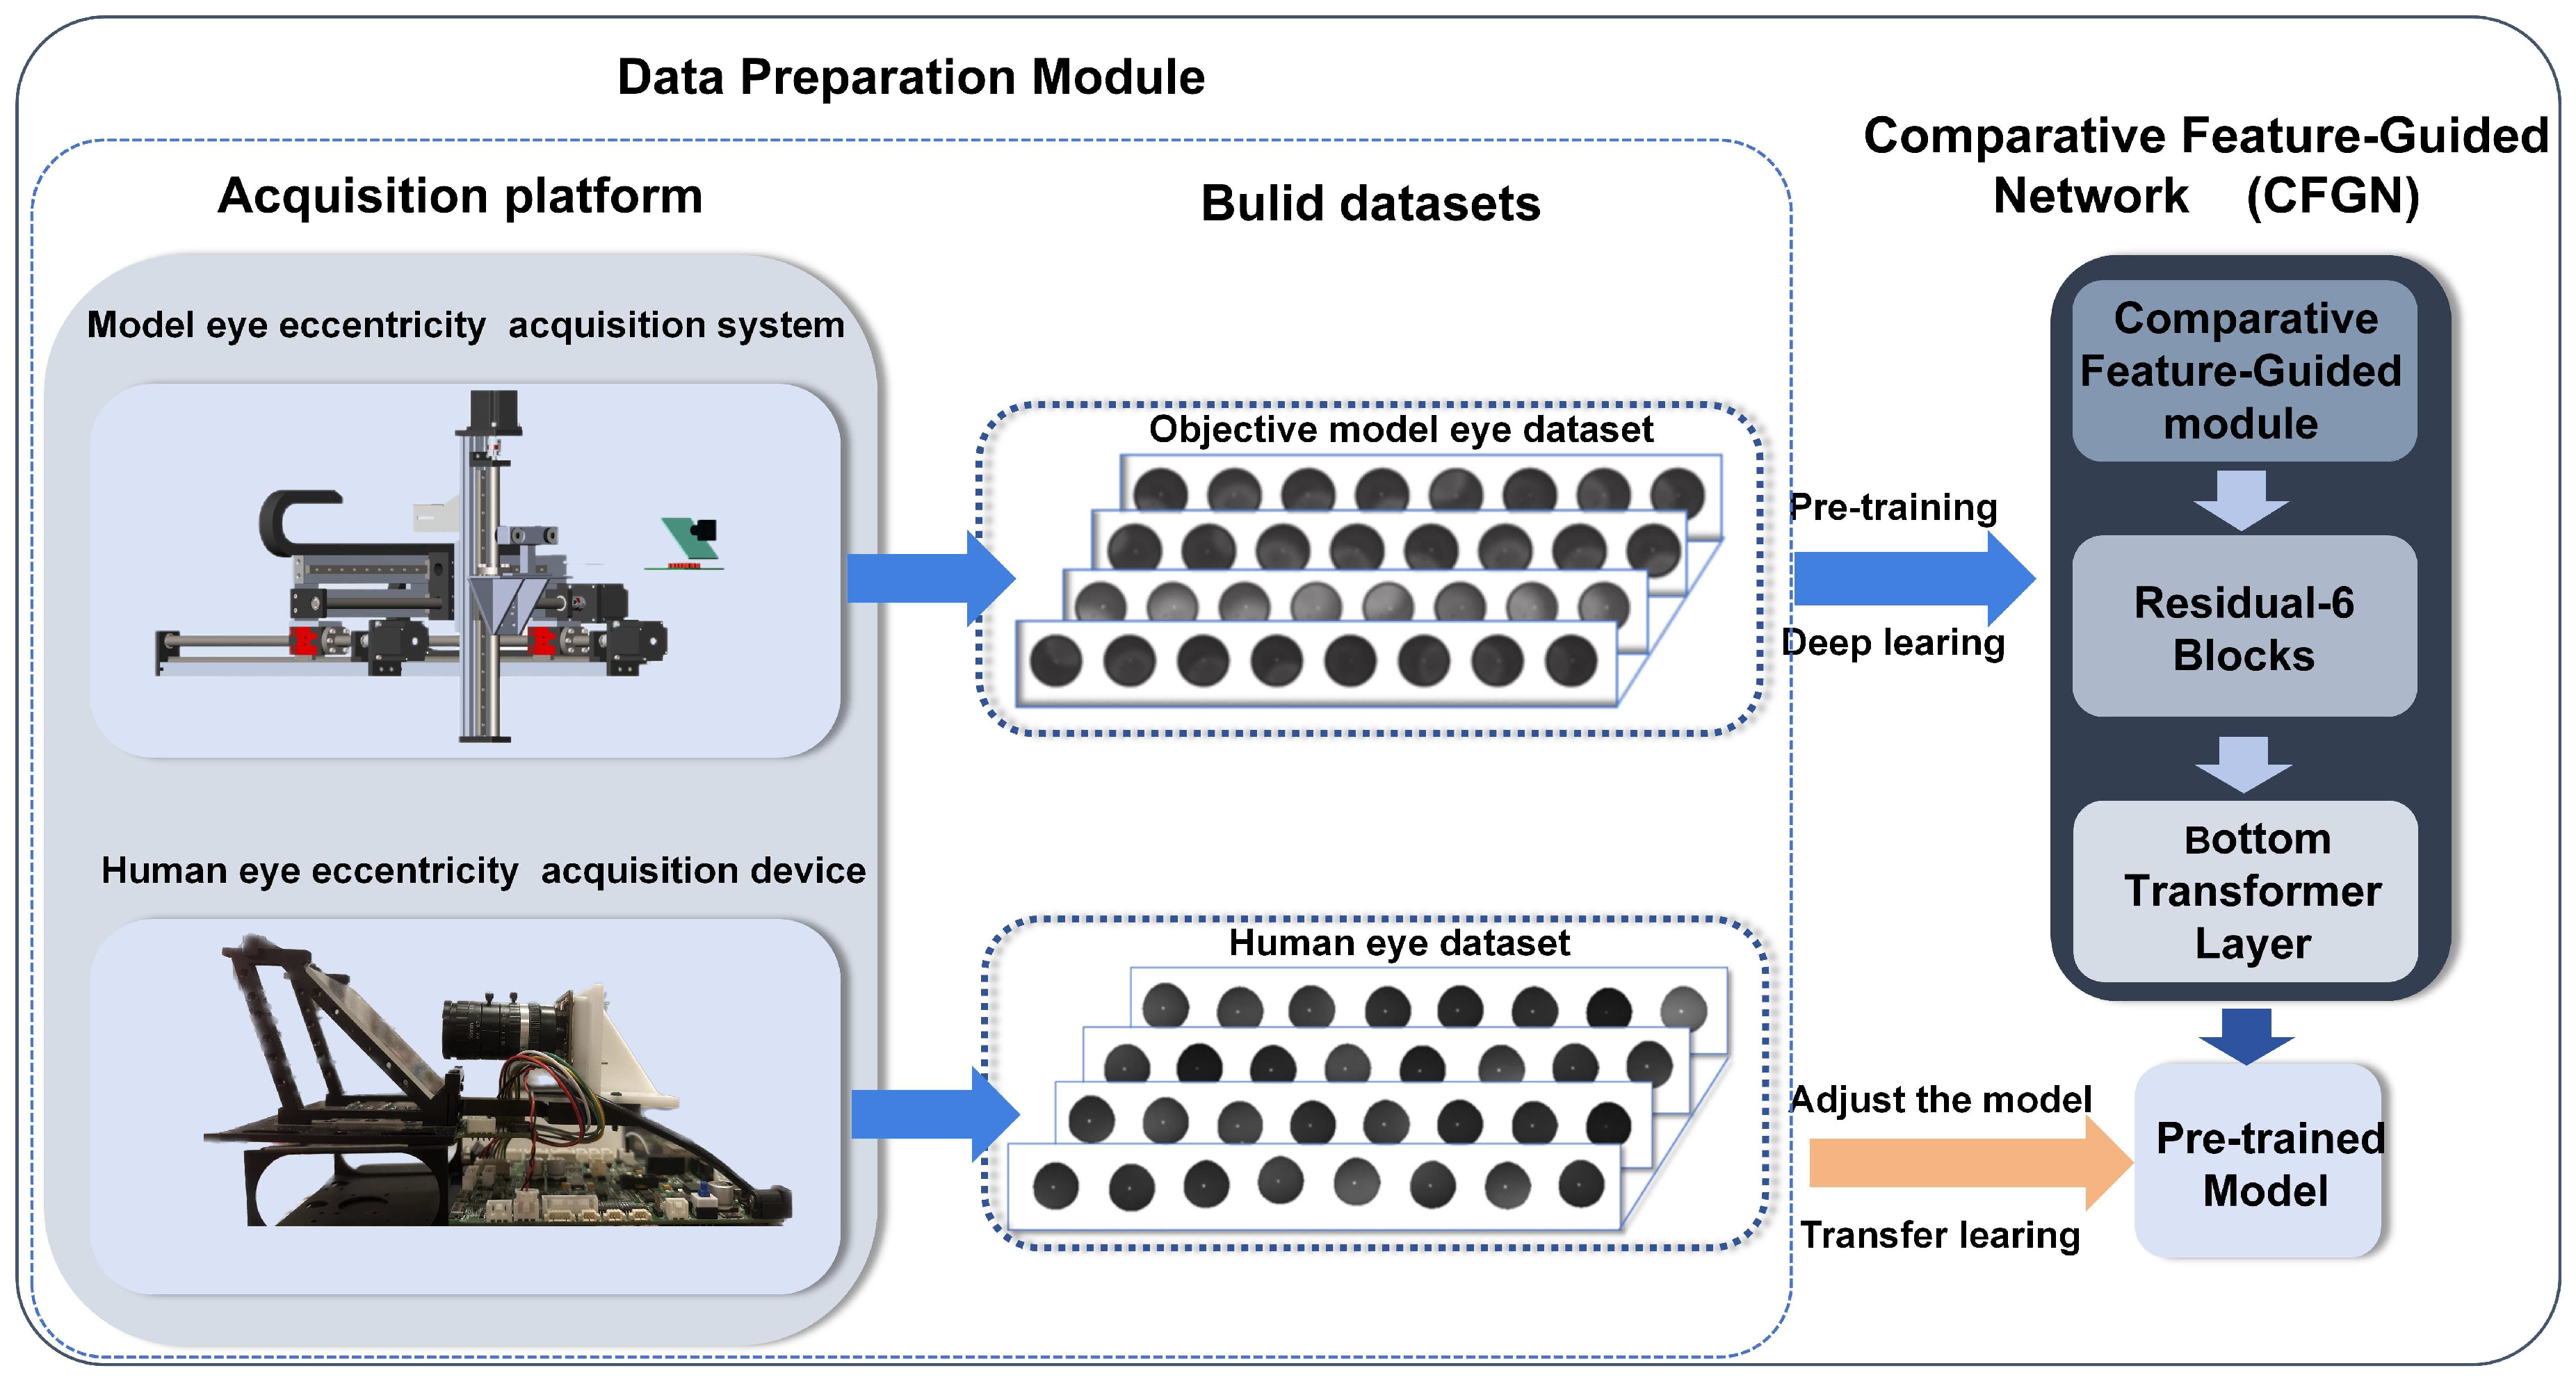
Figure 4, the proposed method in this paper consists of two core modules: the data acquisition module and the CFGN network for refractive error screening.
In the data acquisition module, we efficiently acquired a large number of high-quality eccentric infrared images of model eyes using an in-house developed automated acquisition system, and based on these data, we constructed a model-eye pretrained model. The design of this module not only solves the complex and time-consuming data annotation problem inherent in traditional methods but also provides rich annotated data support for subsequent model training. At the same time, some real-eye data were also collected.
The CFGN network, as the core screening module, aims to extract similar features between model eyes and real eyes under the same refractive error conditions. Through multi-channel feature extraction and fusion mechanisms, the Comparative Feature-Guided Module, CFGN, effectively captures the common features between the two types of data, thereby enhancing the accuracy of refractive error screening.
The following sections will provide a detailed introduction to the implementation of the data acquisition module and the design details of the CFGN network architecture.
2.3. Data Acquisition Module
2.3.1. Image Acquisition Device
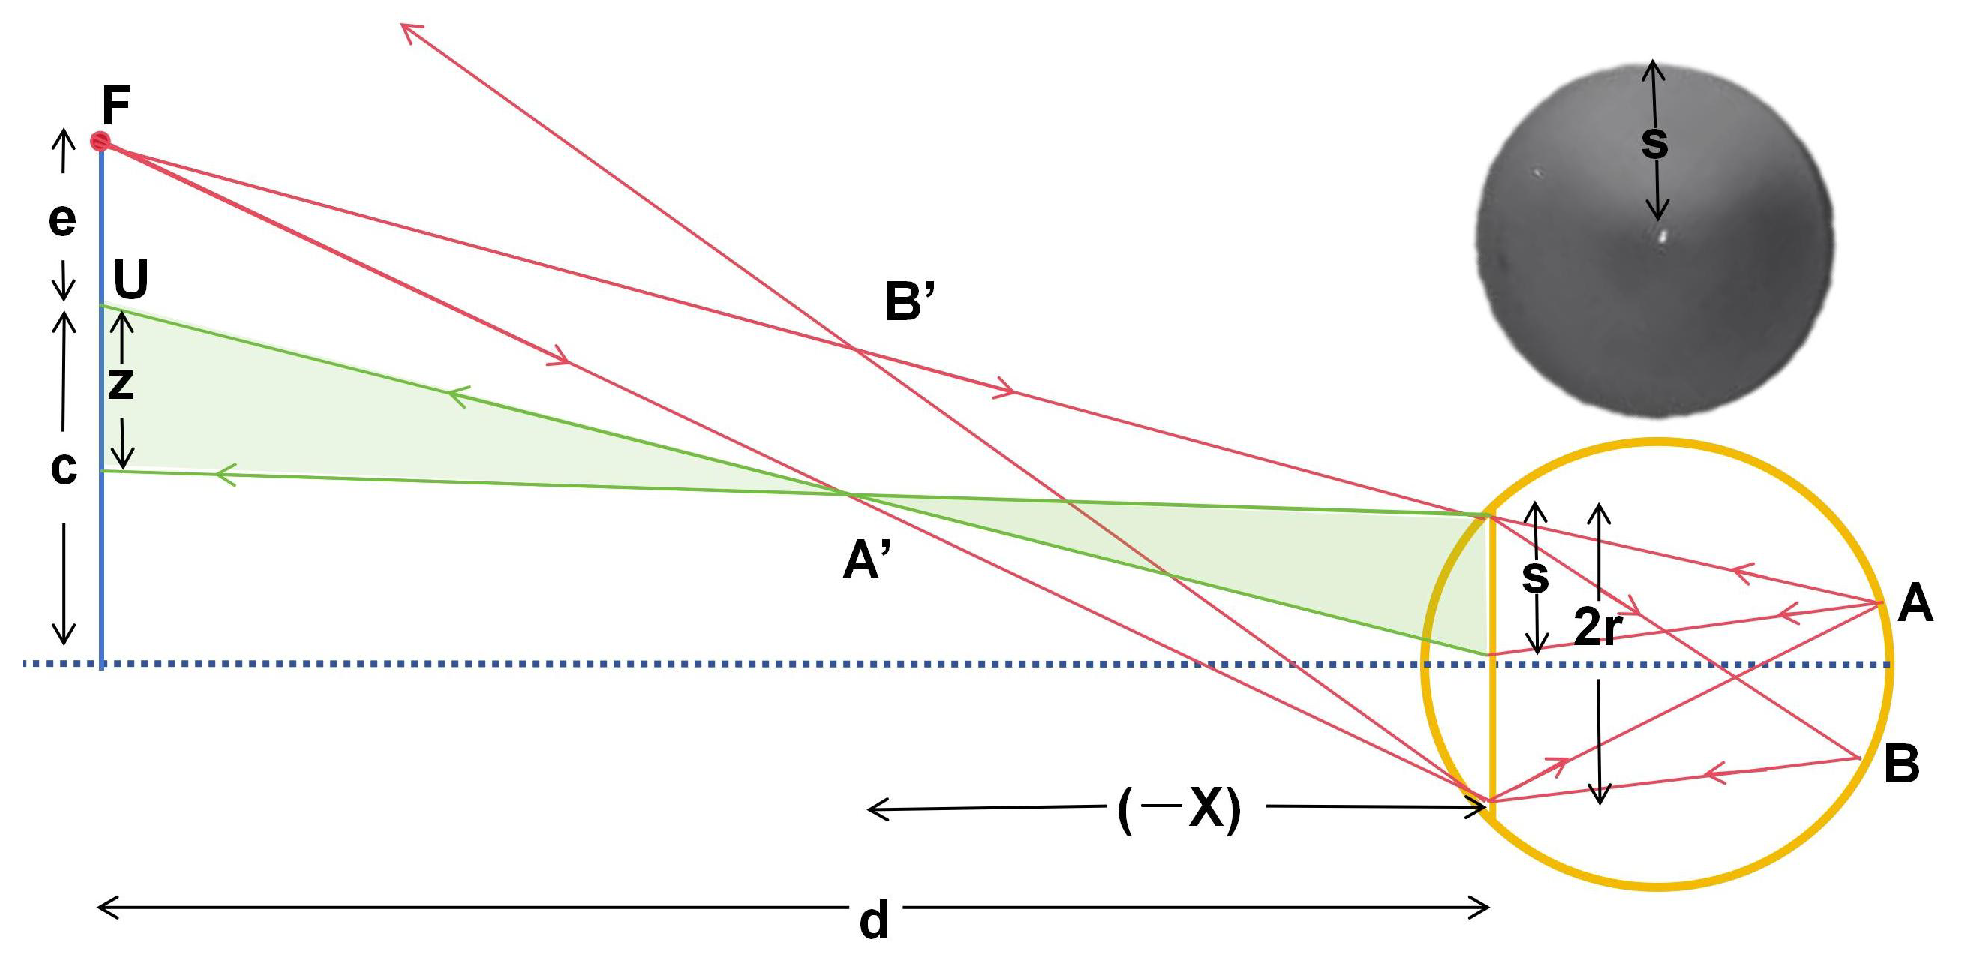
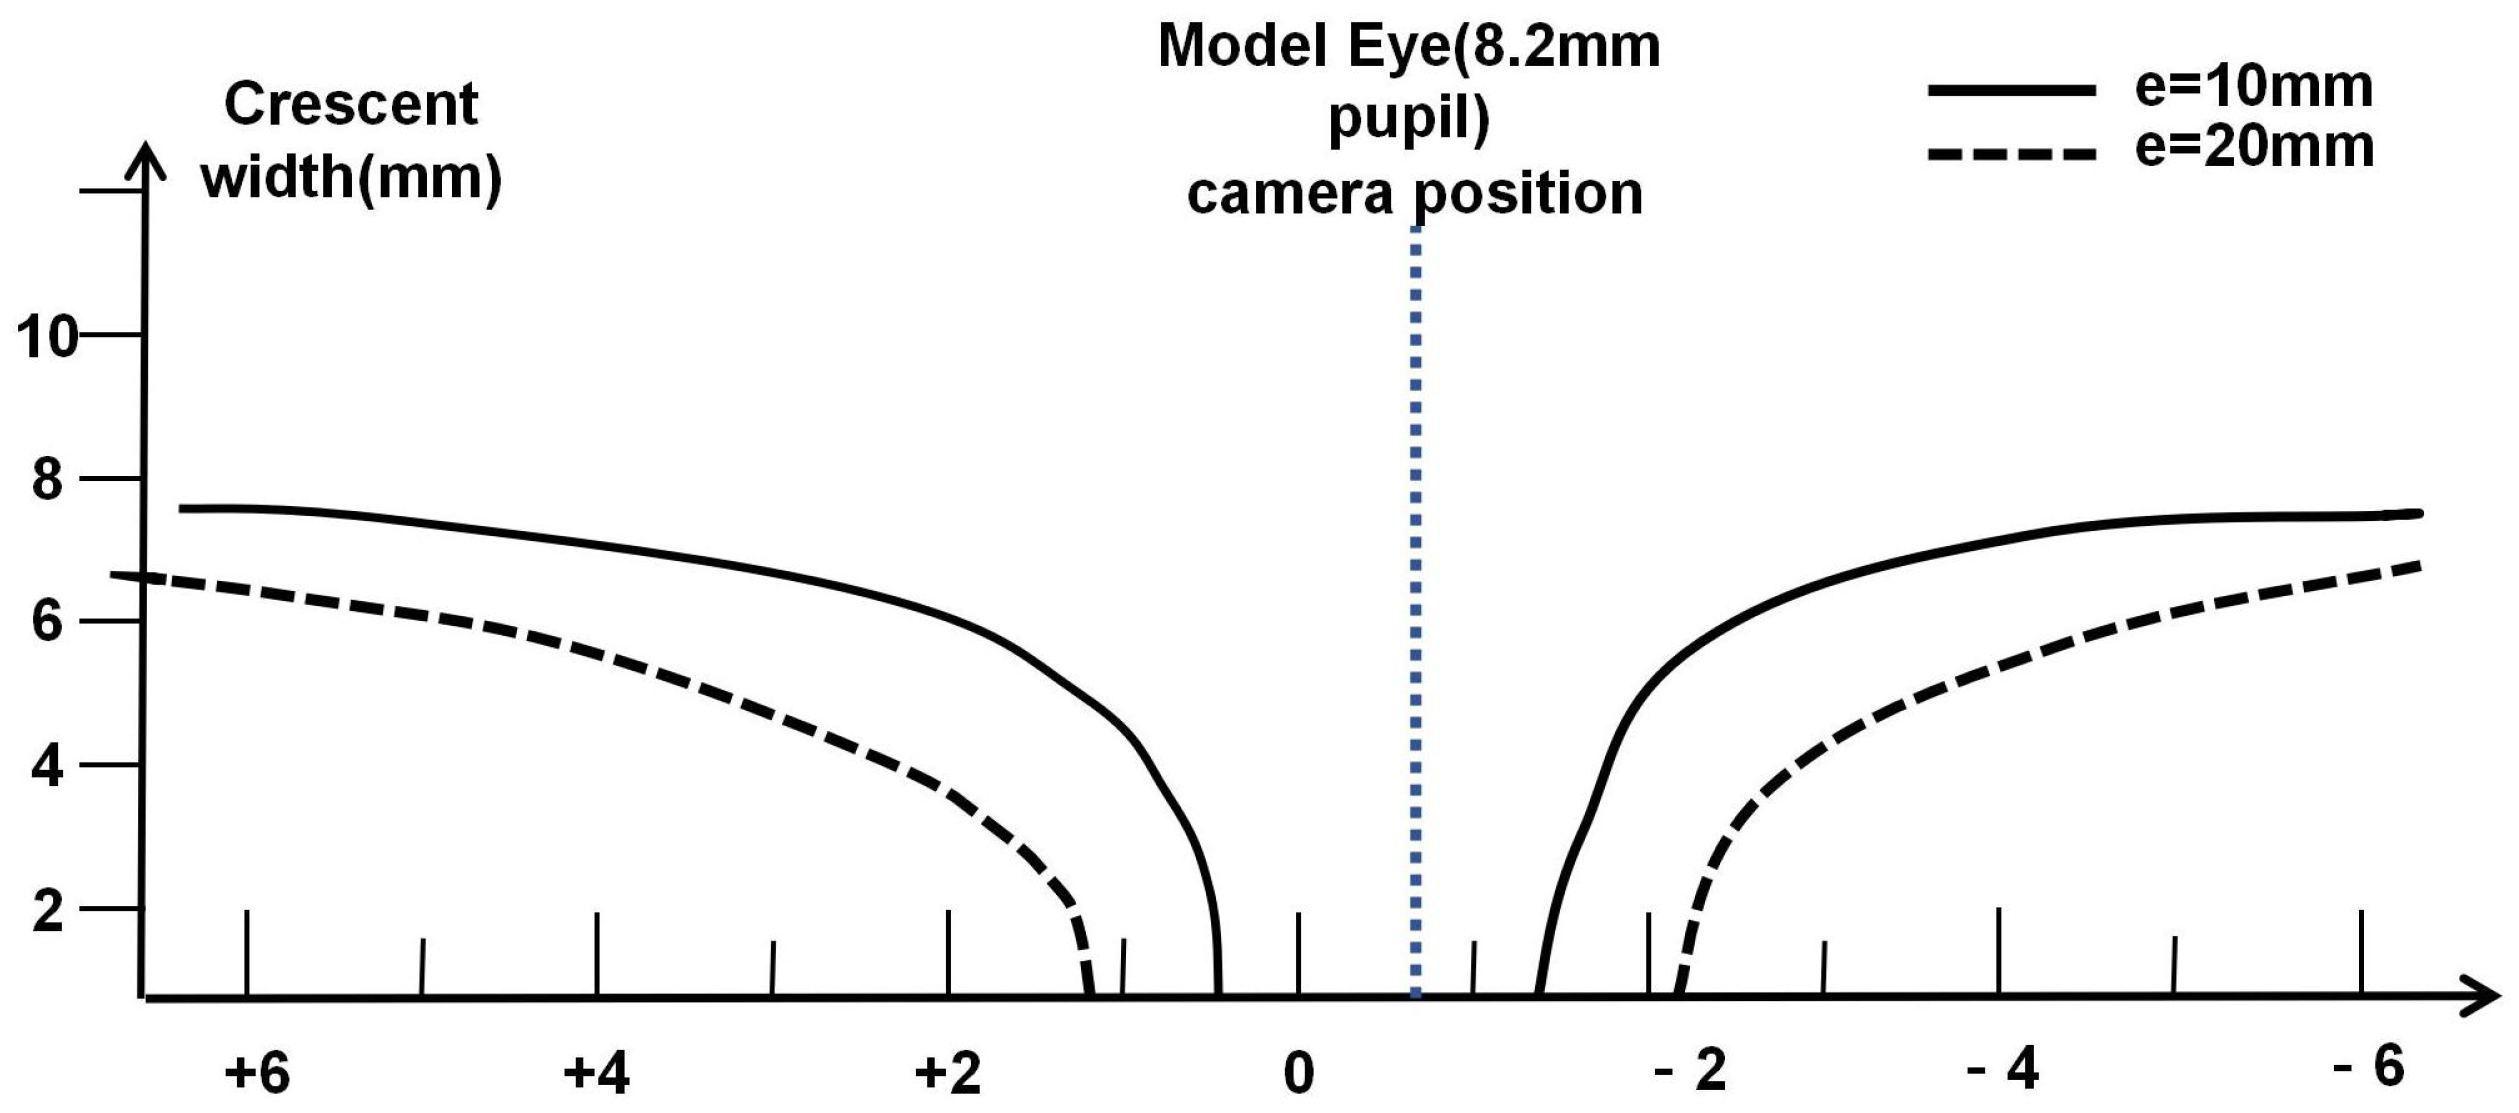
Figure 5 shows the theoretical data for the crescent-shaped bright area generated by the model eye under infrared illumination at two eccentric positions. Adjusting the eccentricity of the light source can modify the range of refractive error that this steep change region covers [
10].
The original eccentric photorefraction method used white light as the light source, leading to significant image errors. The infrared eccentric photorefraction method improves on traditional photorefraction instruments by using infrared LEDs as the light source. To obtain better pupil responses under light stimulation, this method employs an array of multiple infrared LEDs. As shown in
Figure 6, simultaneous illumination from multiple LEDs increases light intensity. Since near-infrared light causes minimal eye stimulation, subjects typically do not perceive the measurement process, making infrared light more suitable for eccentric photorefraction.
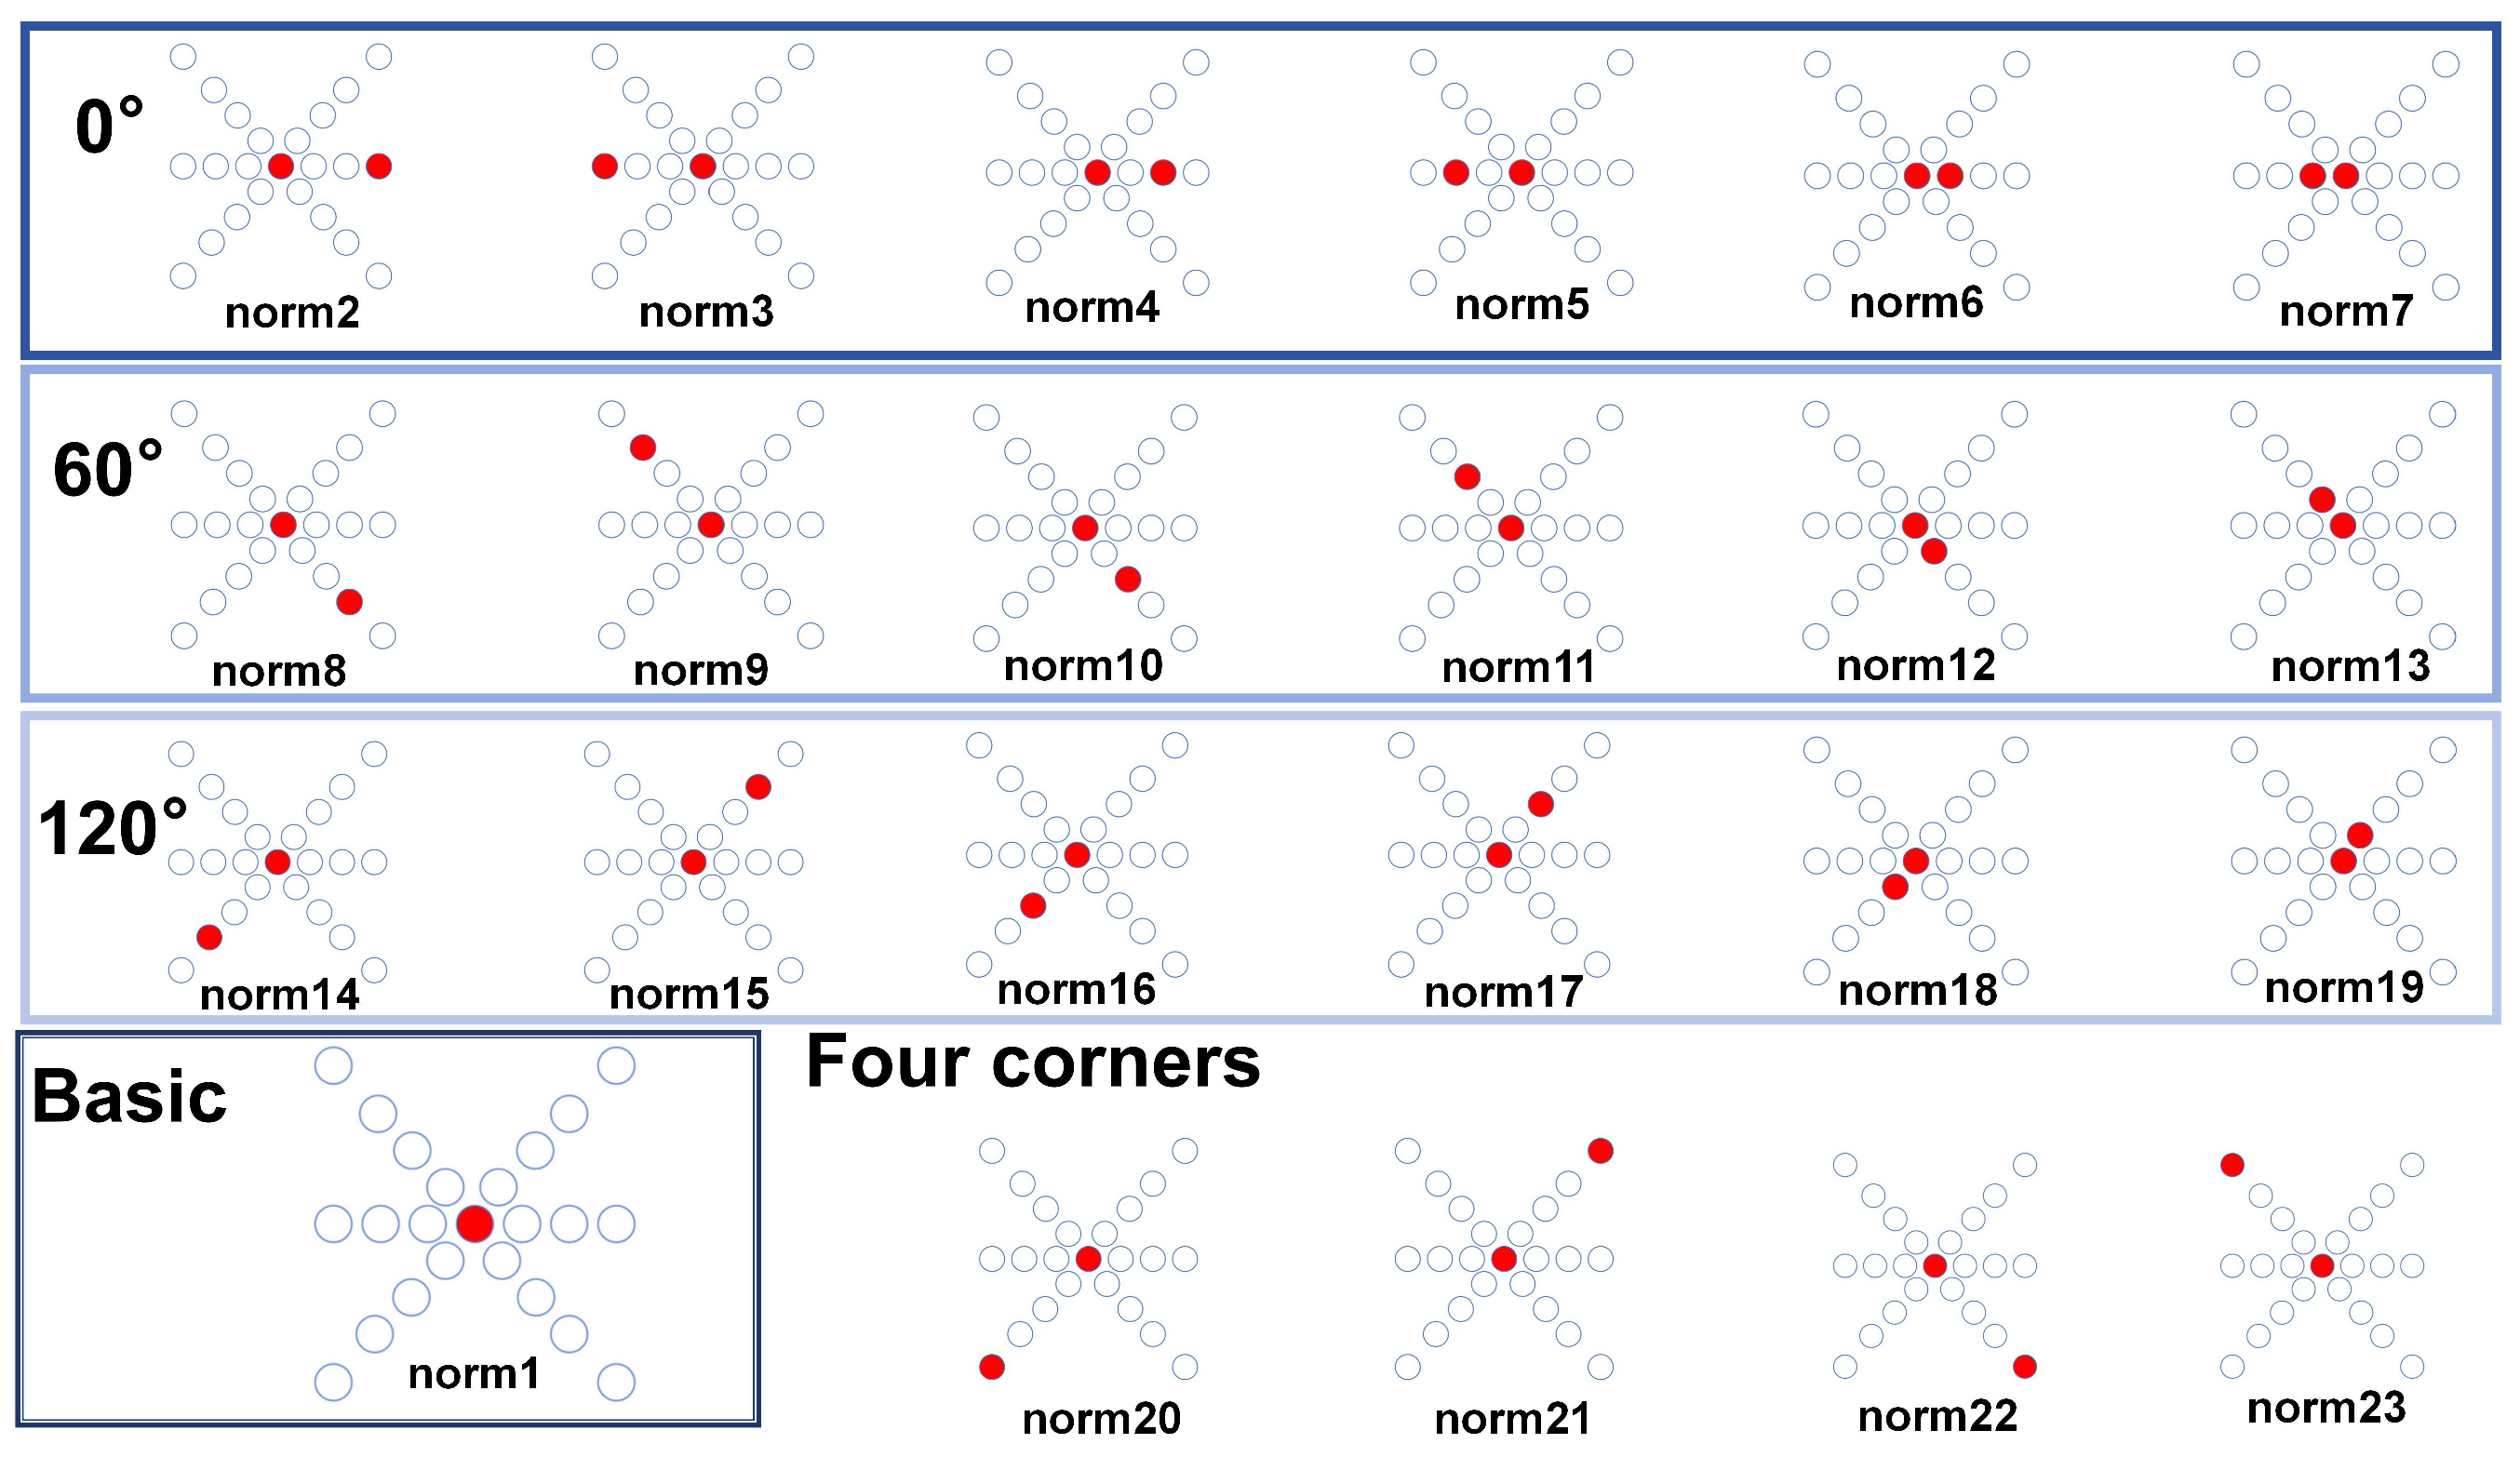
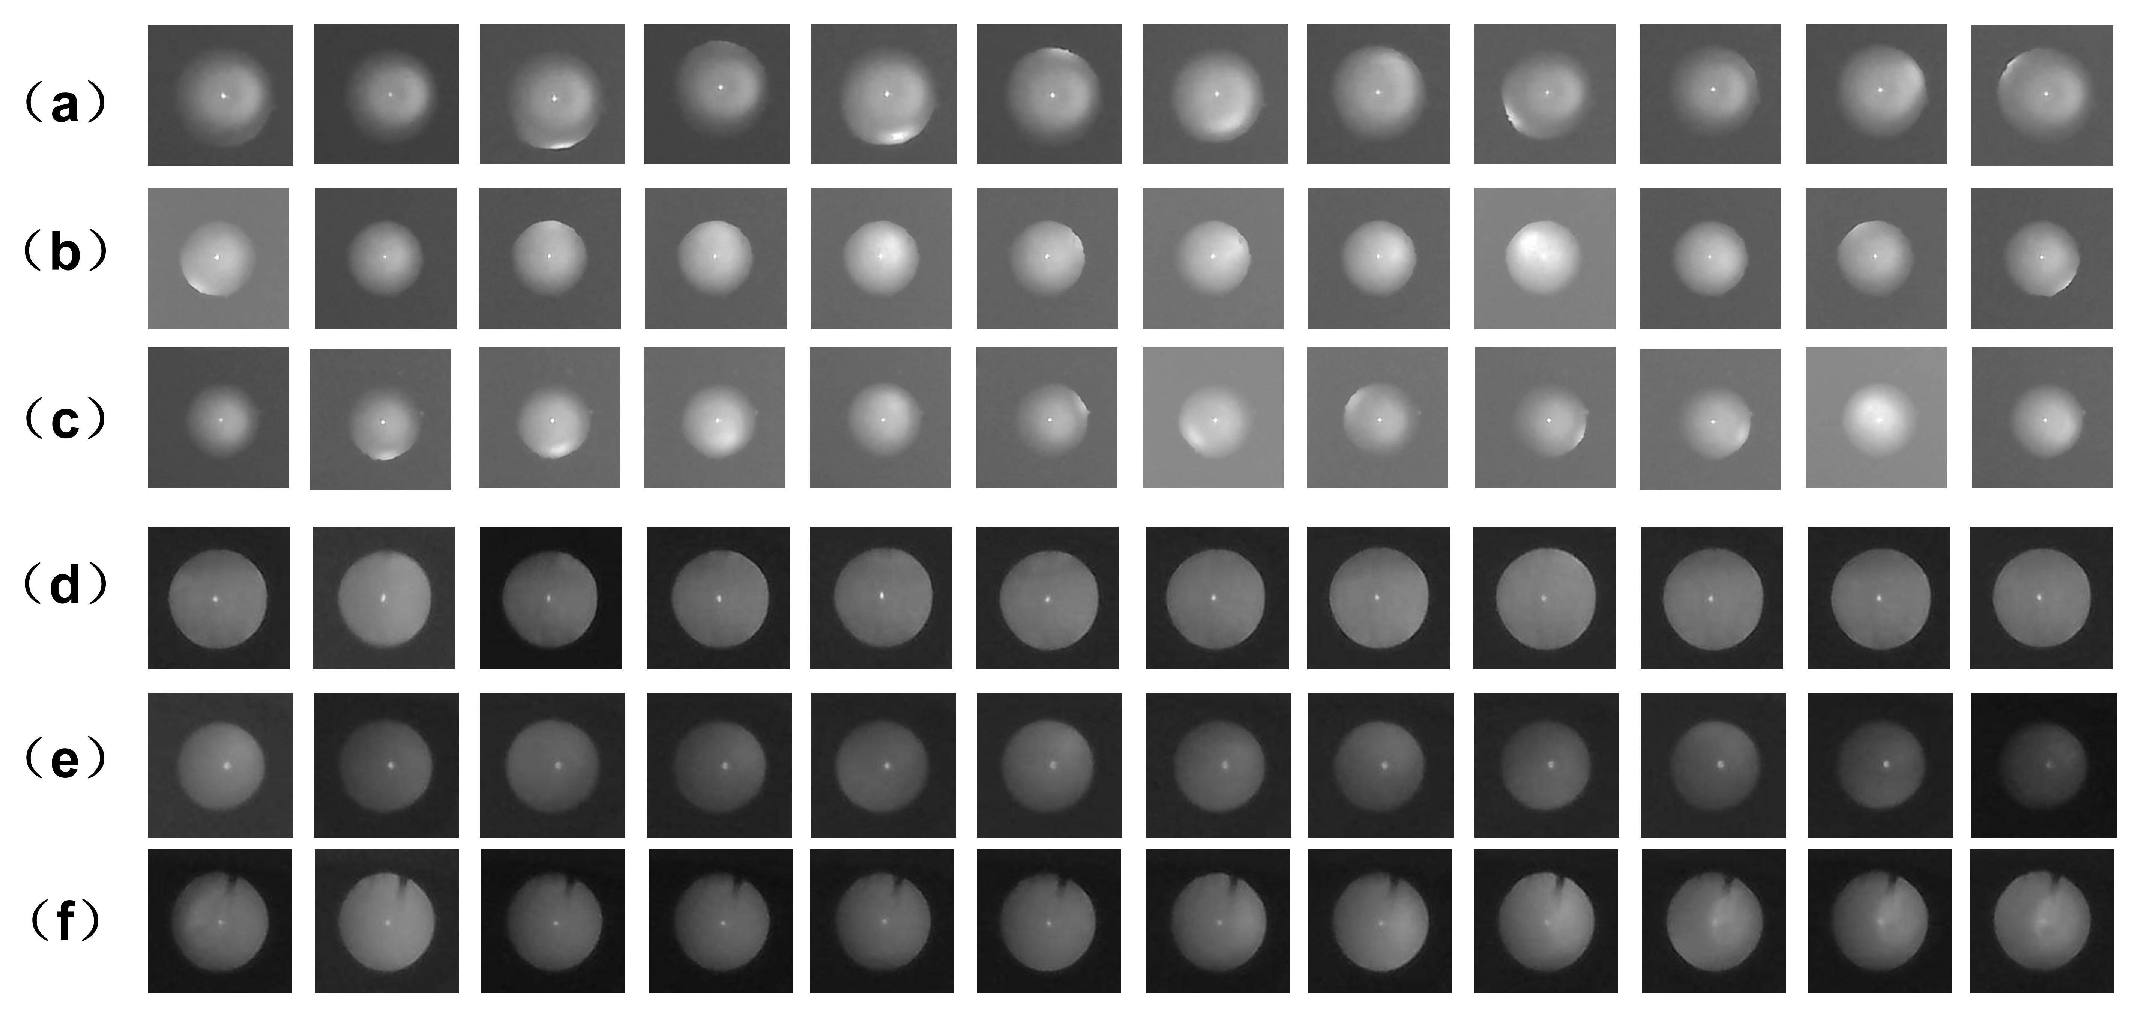
As shown in
Figure 5, different eccentric light sources have varying measurement ranges and sensitive regions. Therefore, we capture infrared images of a model eye from 1 to 23 eccentric light source positions (a total of 22 eccentric light modes) to obtain the same-ring light source position characteristics and different-ring light source temporal characteristics of the model eyes.
In
Figure 7, the basic mode image serves as a reference image, containing pupil information without eccentric light illumination. To ensure sufficient information while reducing training costs, we selected six grayscale images captured under five different lighting modes and basic modes to form a dataset with six channels of information.
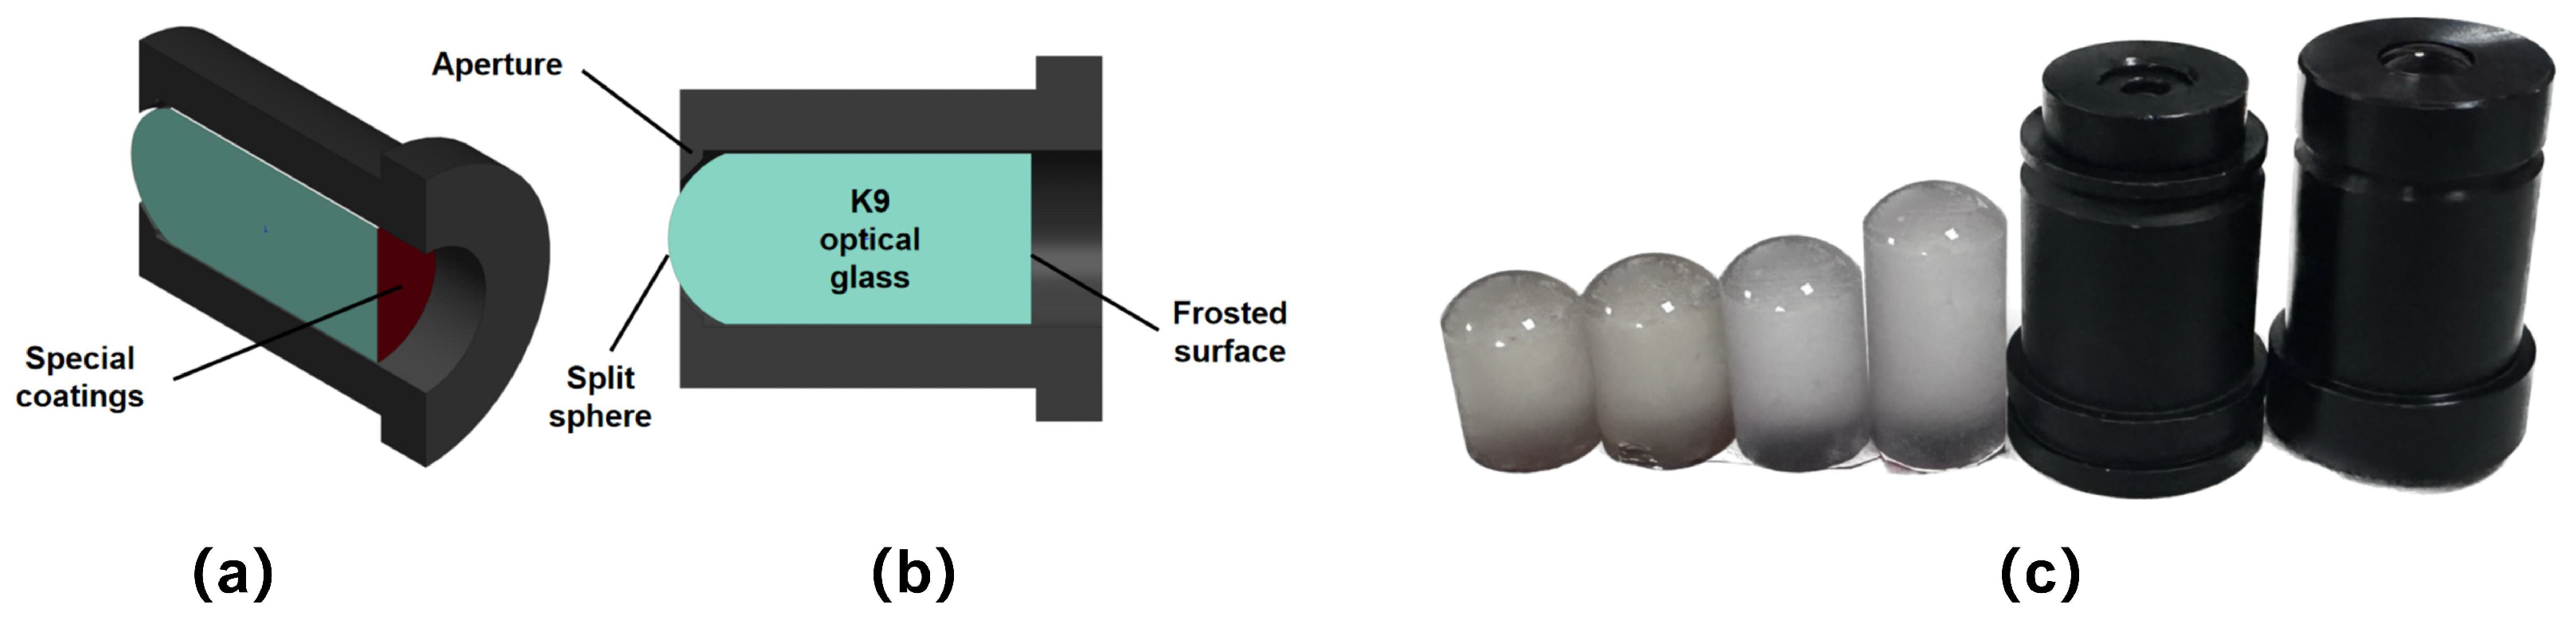
2.3.2. Objective Model Eye
Eccentric photorefraction utilizes the optical characteristics of the human eye to measure refractive errors. As shown in
Figure 8, the objective model eye is made of high-quality optical glass, with a polished spherical surface of an 8 mm radius of curvature (simulating the human cornea) on the front and a frosted flat surface (simulating the human retina) on the back. The frosted surface is coated with special materials to simulate the human eye’s macula. Therefore, the eccentric infrared images captured with this objective model eye exhibit similar pupil light intensity distribution characteristics to real human eyes.
We created model eyes with diopters of 0 D, ±1 D, ±1.5 D, ±2 D, ±2.5 D, ±3 D, ±3.5 D, ±4 D, −4.5 D, ±5 D, and ±6 D, totaling 20 diopters, which were calibrated using an automatic refractometer. Pupils of different diameters can be simulated by varying the aperture diameter.
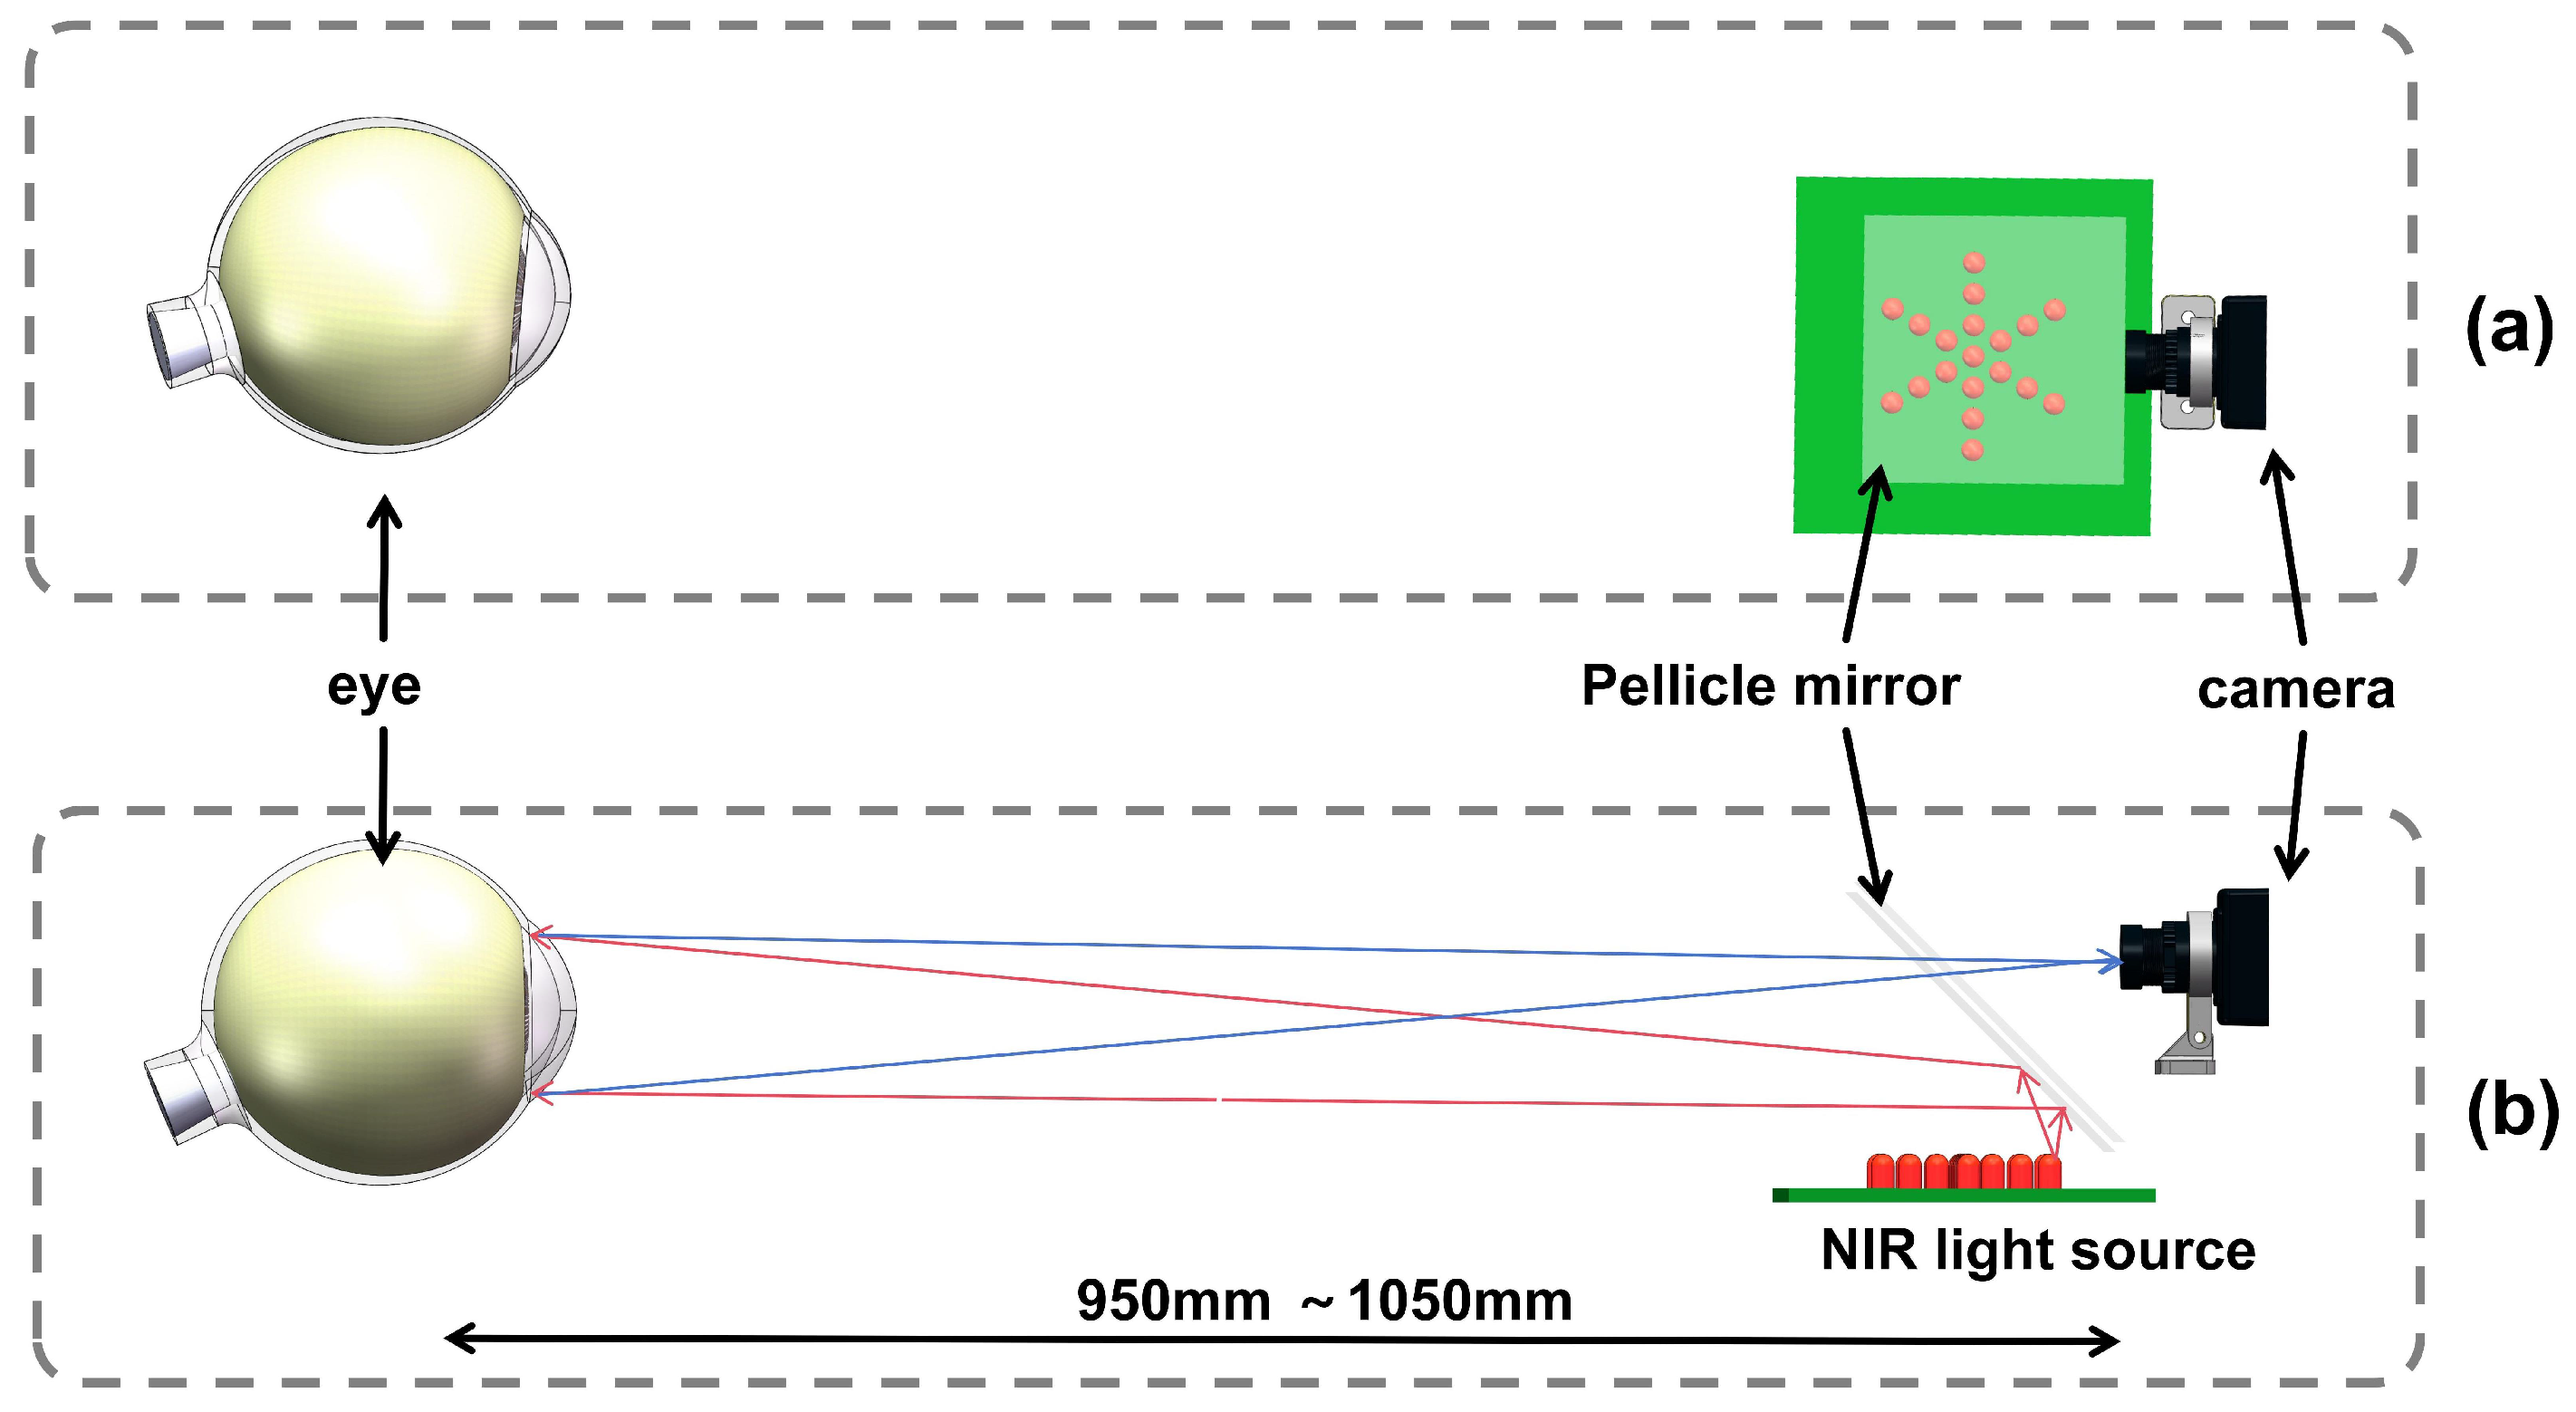
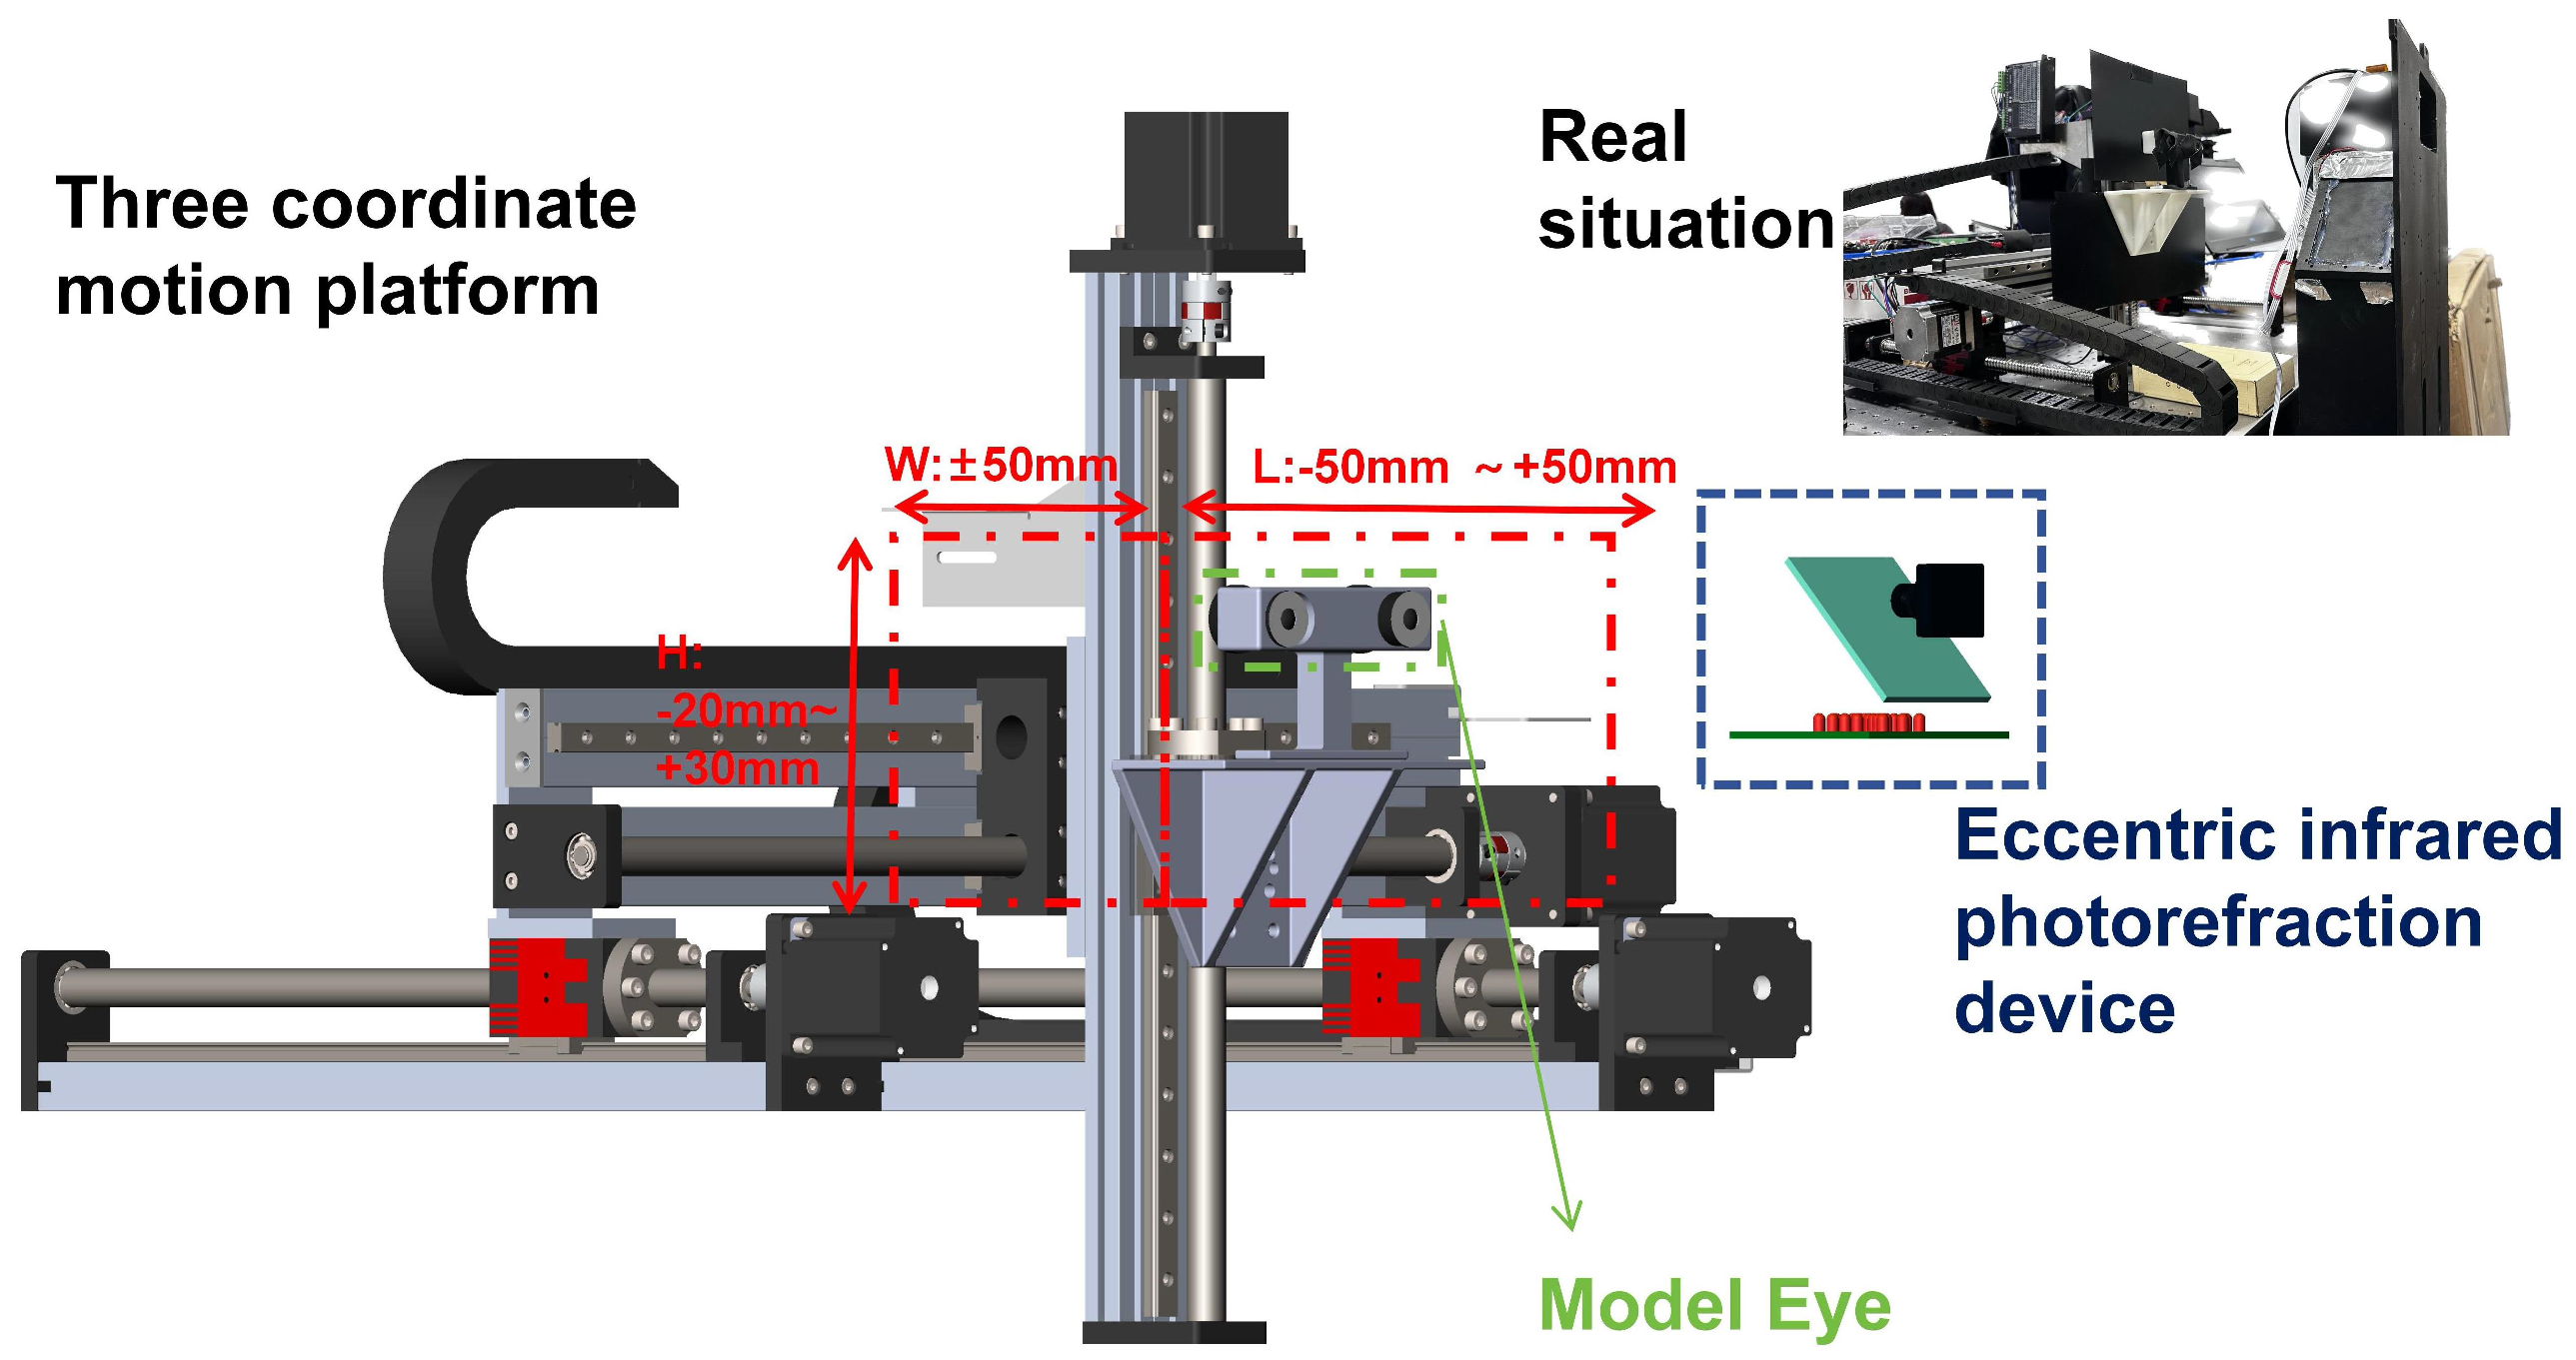
2.3.3. Model-Eye Eccentricity Infrared Image Acquisition System
During eccentric photorefraction, it is difficult for human eyes to maintain an exact position relative to the camera aperture. According to Equation (
1), the relative position distance affects the accuracy of refractive error measurement. Therefore, we designed a 3D coordinate motion platform to mount the model eye and move it within a 3D space relative to the camera, covering the ranges of y: [950 mm, 1050 mm], x: [−50 mm, 50 mm], and z: [−20 mm, 30 mm].
Figure 9 illustrates this process in detail.
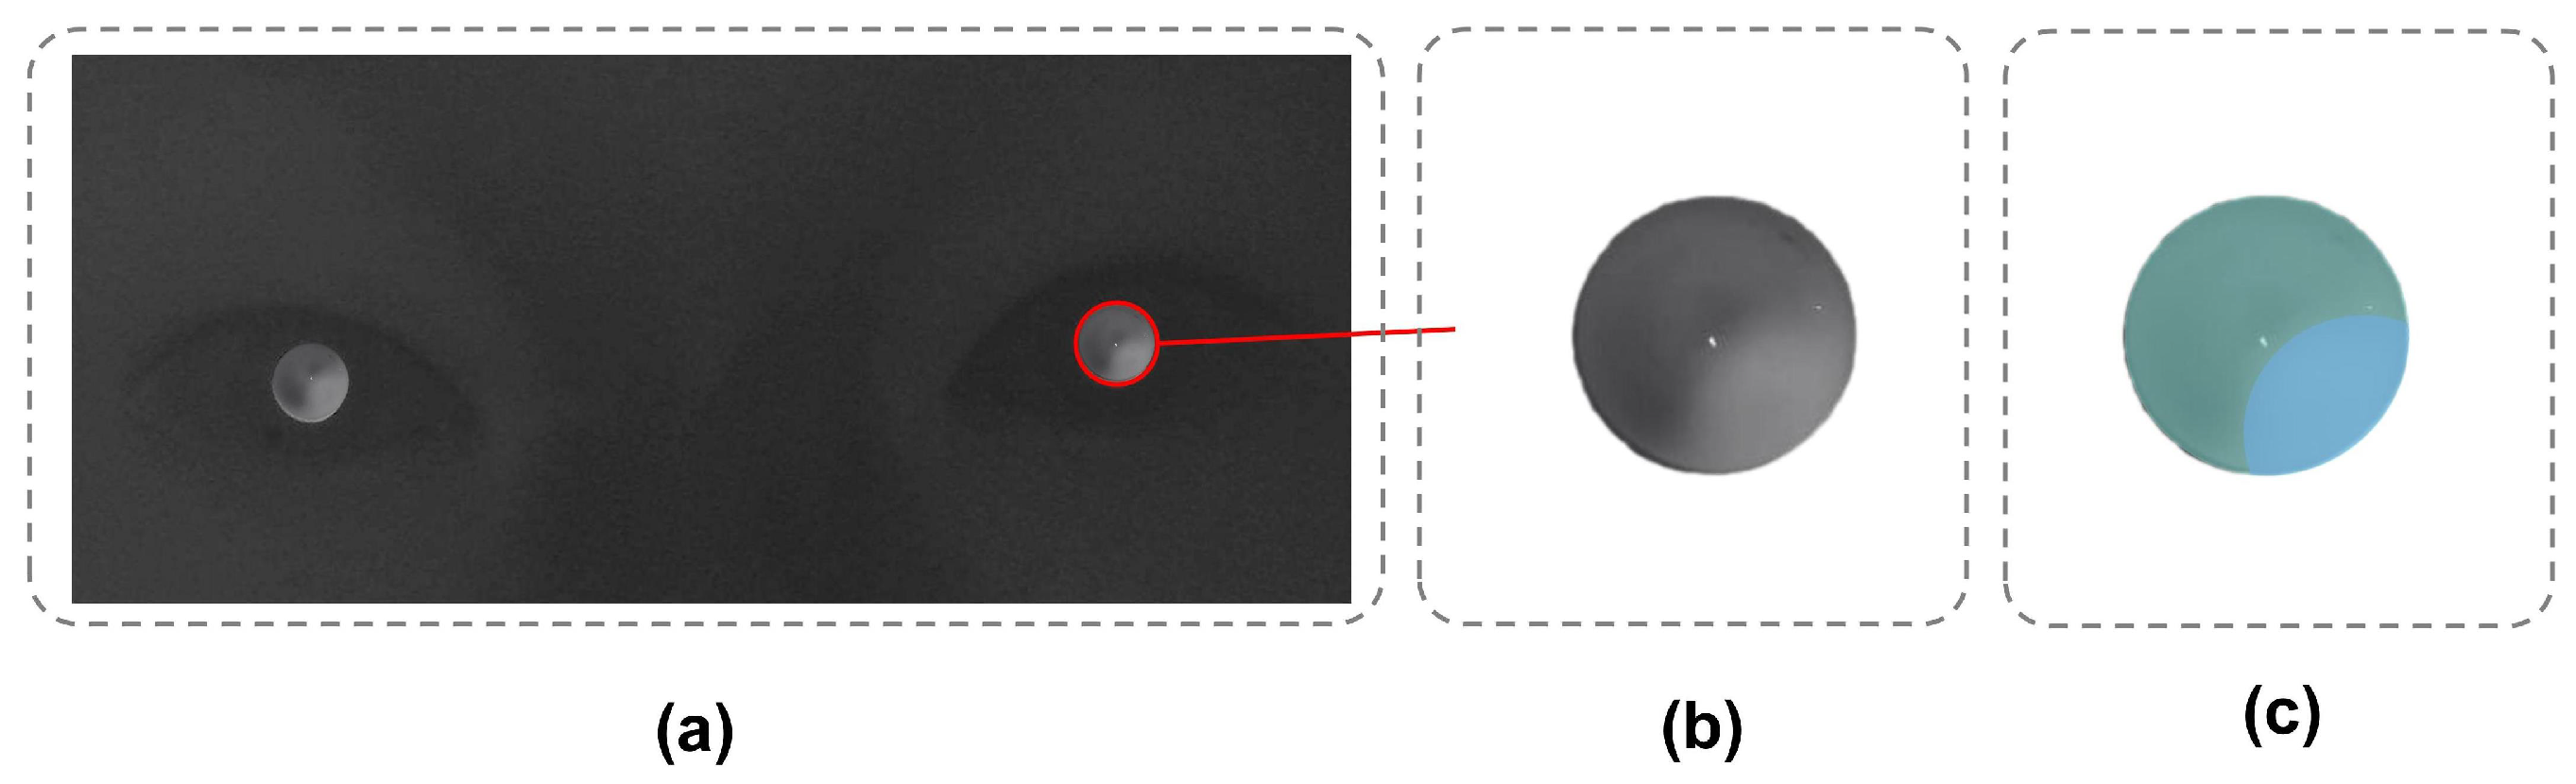
As shown in
Figure 10, there is a significant difference between the eccentric infrared images of real eyes and model eyes. They share similar light intensity distributions under eccentric light illumination, but the model eyes are more distinct.
This implies that we need to design a method that preserves the prominent bright-region features in the model-eye images while avoiding the noise that may be indistinguishable between model- and real-eye images. This noise affects the model’s performance when tested on real data after being trained on simulated data. To mitigate this impact, this study fine-tunes the model-eye pretrained model using real-human-eye data. This transfer learning approach transfers the features learned from the model-eye domain to the real-human-eye domain, thereby improving the performance of the target task.
2.4. Comparative Feature-Guided Network
Based on the core principles of eccentric photorefraction and the unique features of the eccentric photorefraction pupil images collected, a specialized CFGN architecture is proposed for refractive error screening tasks in this study. The network is designed to efficiently and stably extract key features related to refractive error calculation from both model-eye images and real-eye images using deep learning techniques.
Figure 11 illustrates the overall framework of the CFGN, which consists of five main components: the input, the Comparative Feature-Guided module (CFG module), the Residual-6 Blocks, the Bottom Transformer Layer, and the diopter estimation output. To better extract relevant features and enhance the accuracy of diopter estimation, the CFG module is designed based on the attention mechanism of the Transformer. The Residual-6 Blocks and the Bottom Transformer Layer form the multi-channel spatial information fusion mechanism, which not only effectively reduces computational complexity but also achieves independent extraction and optimized fusion of multi-channel features. First, a 6-channel eccentric infrared pupil image is fed into the CFG module to extract unique features from the grayscale map of each channel. These features are then passed to the Residual-6 Blocks to extract deeper features. Finally, the Bottom Transformer Layer establishes the connection between the information of each channel. Finally, the diopter estimation result is output through the MLP-head layer.
2.4.1. Comparative Difference in Eccentric Photorefraction Images
As discussed in
Section 1.2.1, real human eyes with different diopters produce crescent-shaped bright areas of different widths under the same eccentricity of infrared light, or real human eyes with the same diopters produce crescent-shaped bright areas of different widths under different eccentricities of infrared light. The refraction and reflection of light at the interfaces of the cornea, lens, and retina generally follow Snell’s law, a linear optical process. These interfaces are linear media and do not involve nonlinear materials or phenomena. The path and phase changes of light can be considered linear. The reflection paths of light in the pupil vary under different eccentricities, but as long as the propagation and reflection of light within the eye are based on linear optical principles, the entire process remains linear. Eccentric photorefraction measures the refractive state of the eye by examining the changes in reflected light. The relationship between the input light and the output signal can be described by a linear equation, making the entire optical system linear. Therefore, the light intensity distribution of the pupil under different lighting modes is the result of the superimposition of reflected light from different eccentric infrared light sources. The light intensity is calculated using Equations (
2) and (
3),
is the angle of incidence,
is the angle of refraction, and
I is the light intensity.
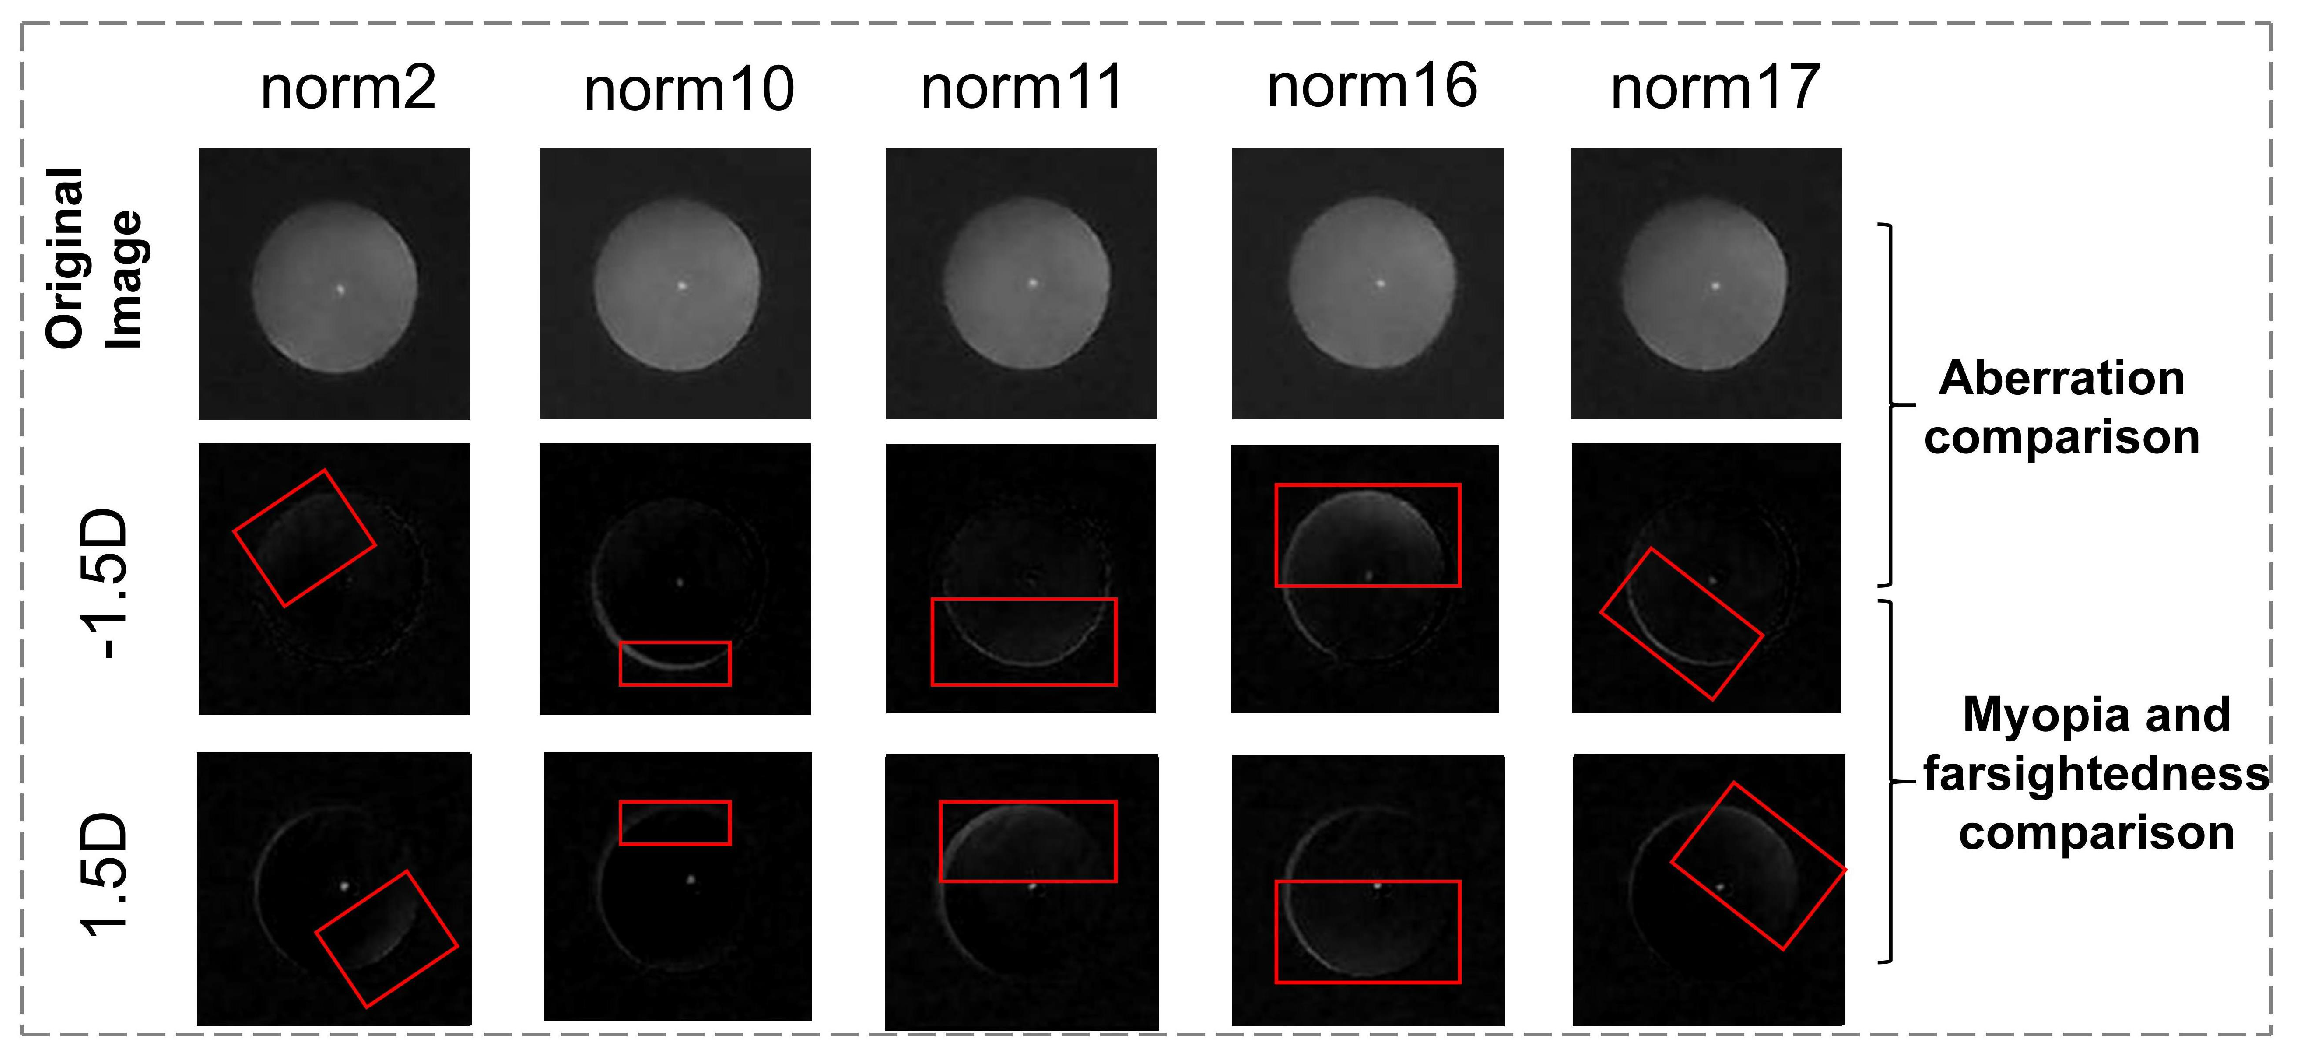
We take the lighting mode 1 image as the reference image (i.e., when the eccentricity of the infrared light is 0), where the light does not cause significant changes in the pupil image’s light intensity distribution due to refractive errors. Since the eccentric photorefraction image acquisition system is linear, we subtract the reference image from the other lighting mode images to enhance the image features under other lighting modes (when the eccentricity of the infrared light is not 0). As shown in
Figure 12, the contrast-enhanced pupil images under eccentric light illumination show significantly enhanced variation features compared to the original images. The crescent bright spots are opposite in position for myopia and hyperopia, and the background noise is reduced, with most feature-irrelevant pixels reduced to zero.
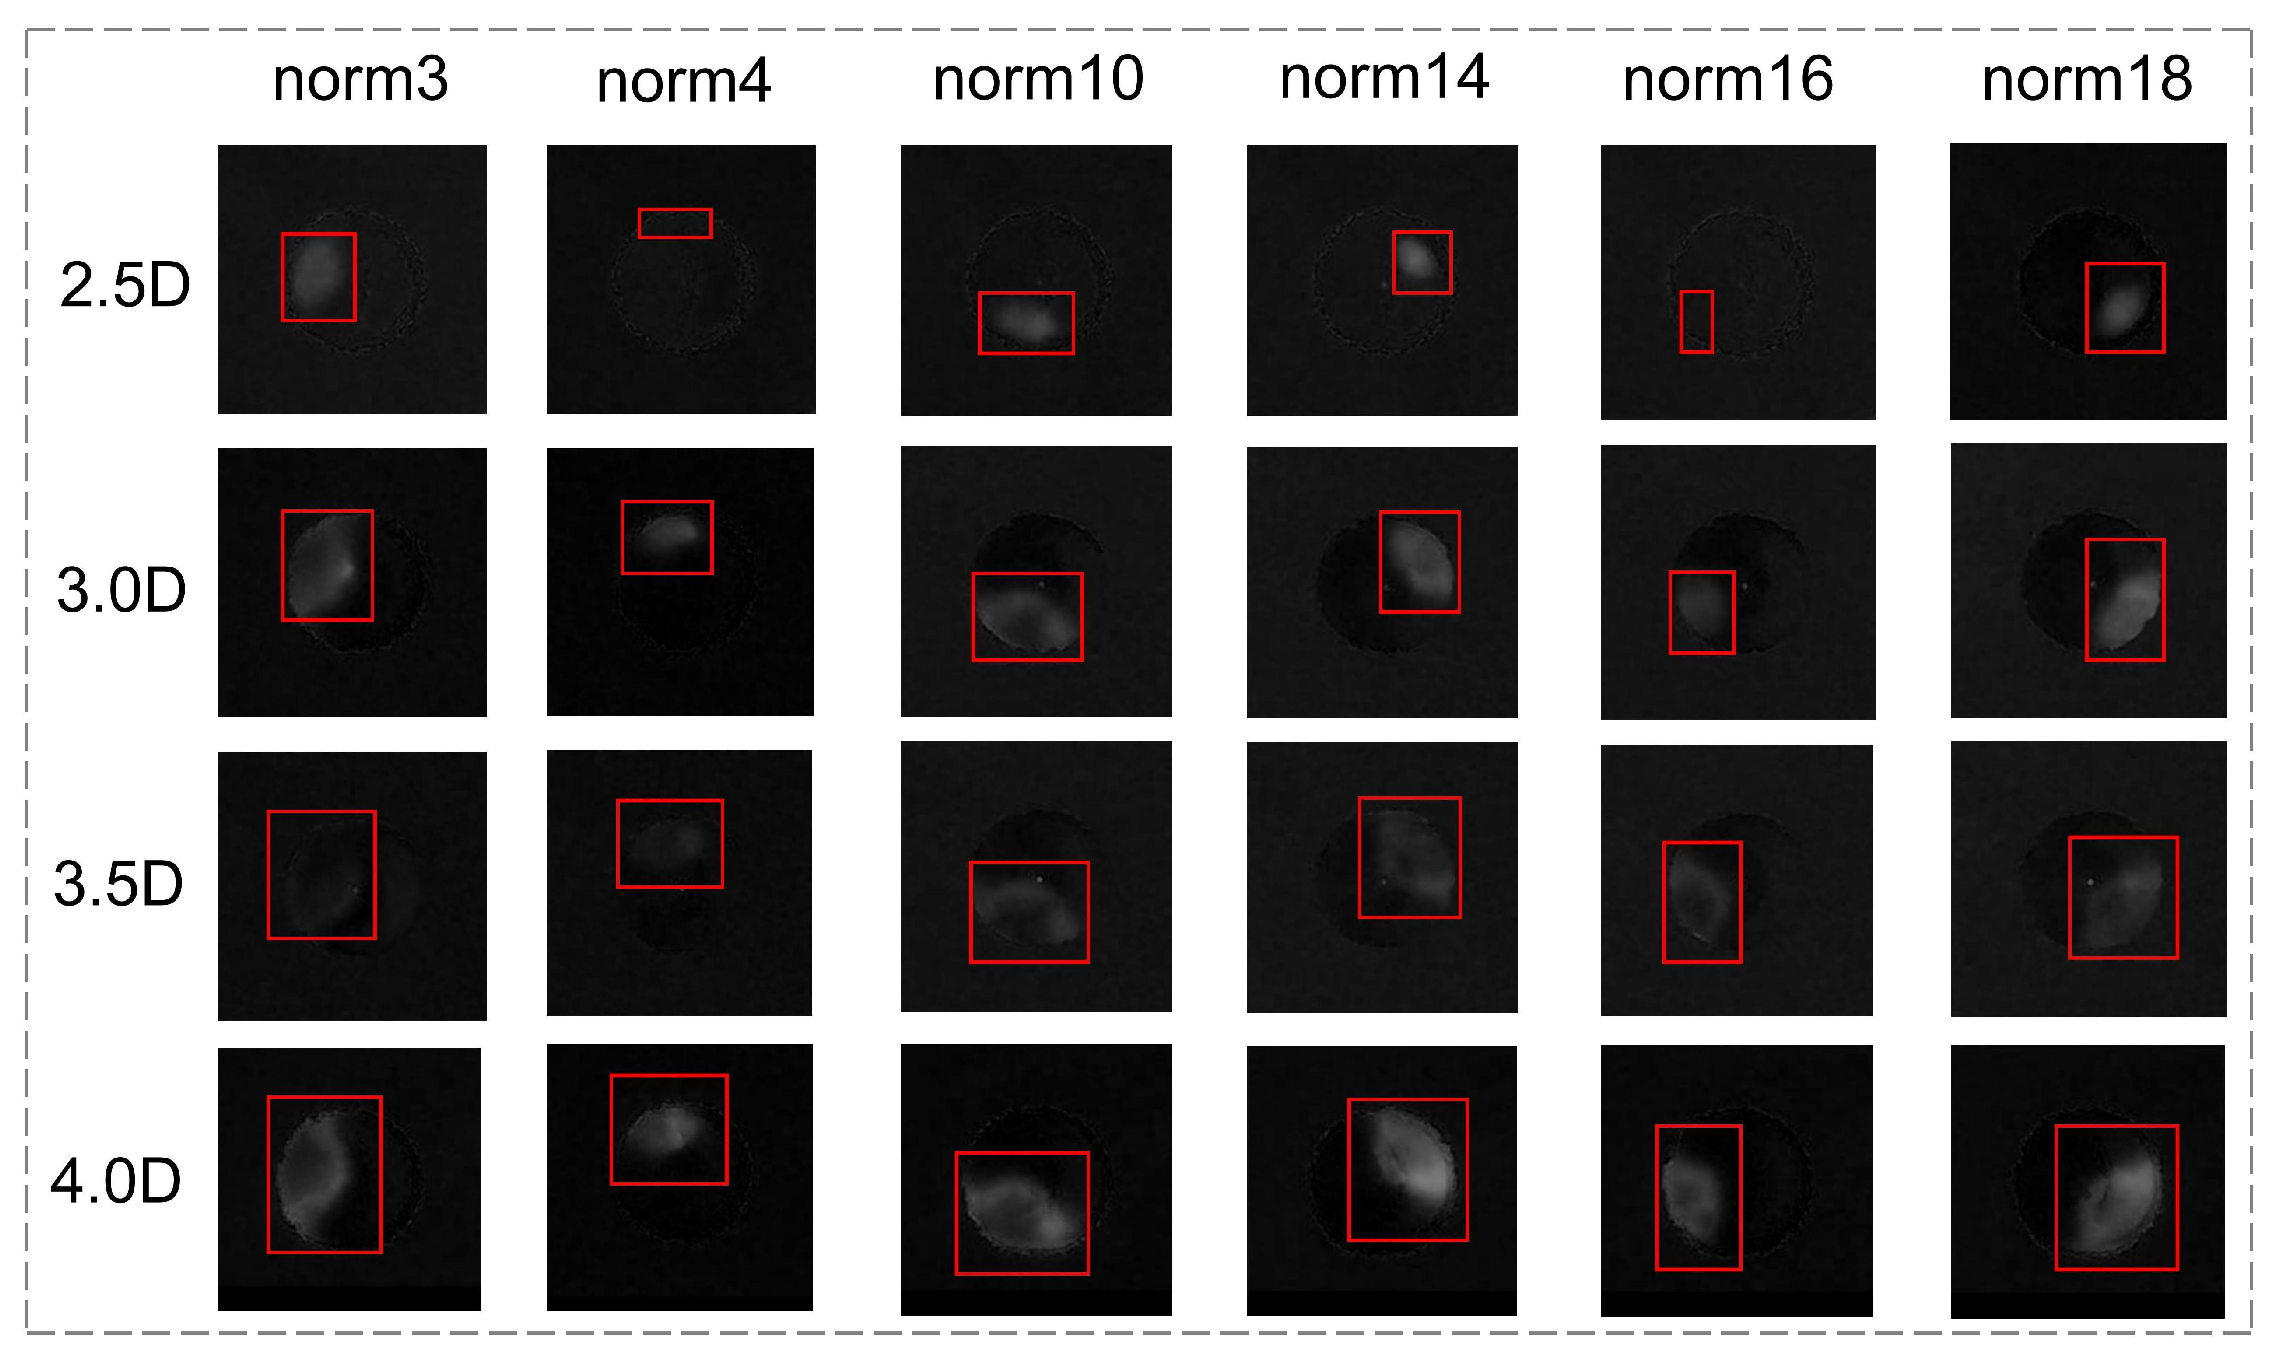
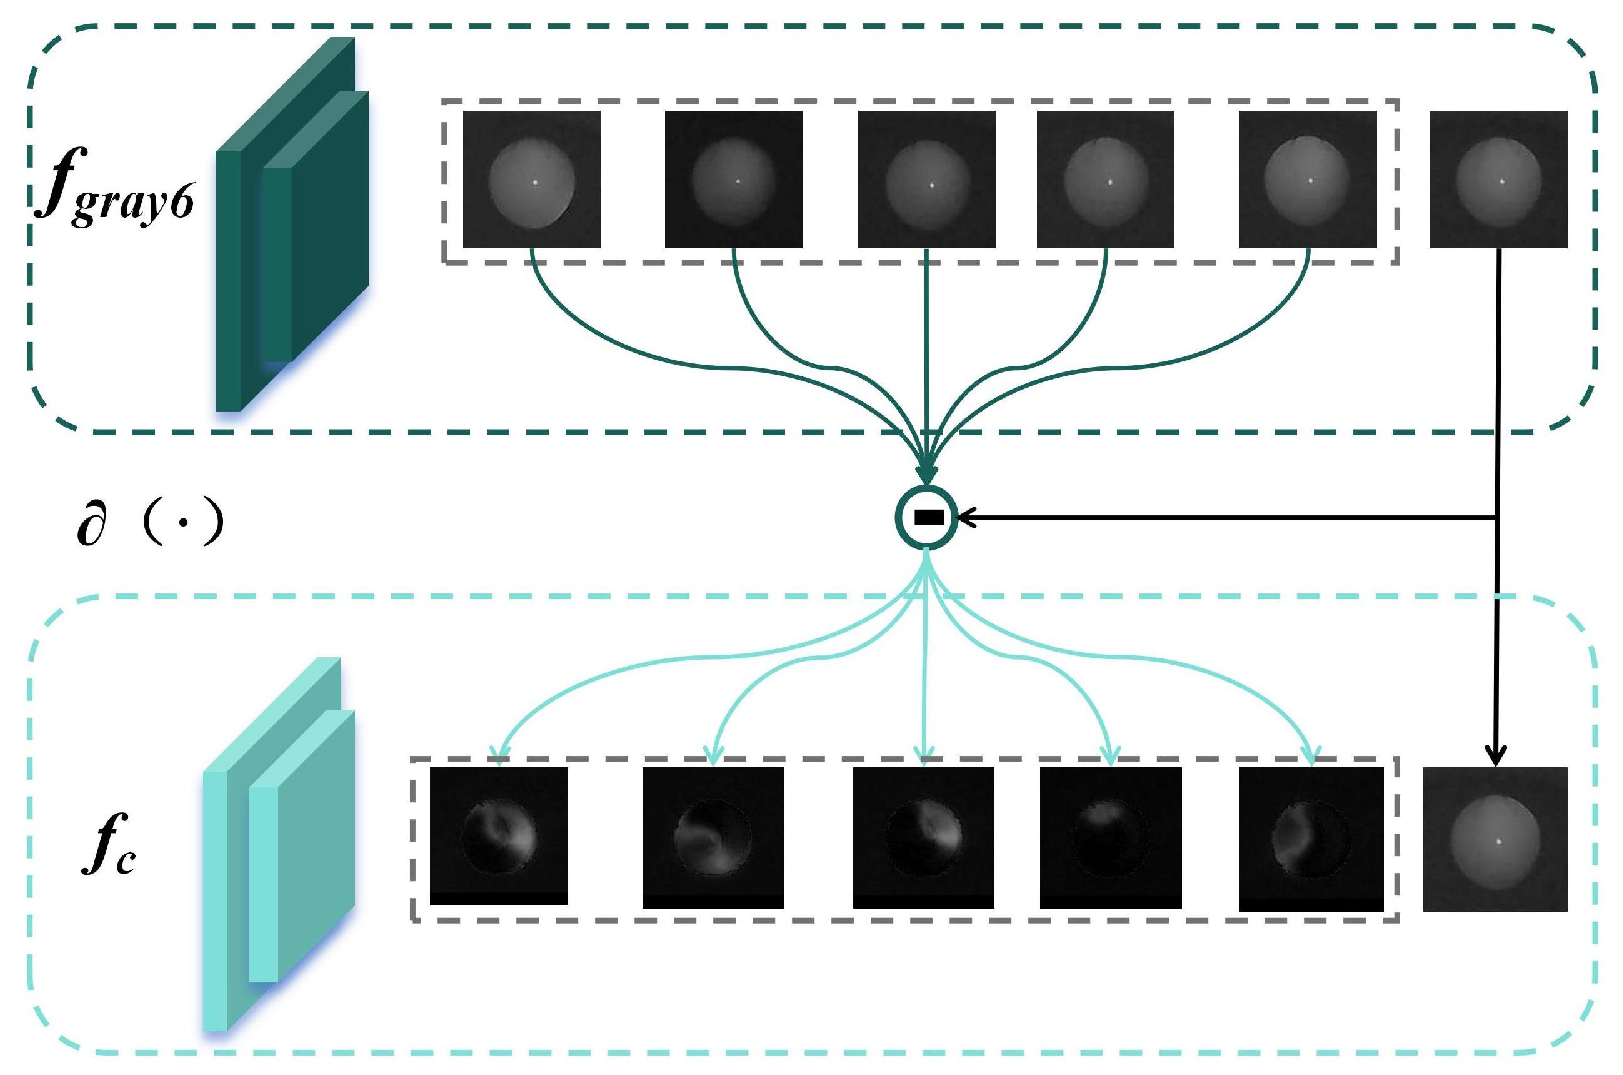
Applying the same comparative processing to the model eyes, as shown in
Figure 13, the changes in the bright area in different diopters are more regular and standardized, serving as a standard feature. Subsequently, we process the feature maps based on this phenomenon.
2.4.2. Comparative Feature-Guided Module
The core of the Transformer lies in its self-attention mechanism [
30], which captures dependencies between all positions in the input sequence. Unlike traditional CNNs, Transformer models do not rely on local convolution operations but use a global self-attention mechanism. This allows them to capture long-range dependencies across the entire image. This global perspective enables Transformers to better extract features from the entire image rather than just local regions. The ViT (Vision Transformer)’s [
31] multi-head attention simultaneously extracts image features in different subspaces, allowing the model to focus on different aspects of the image and enhancing its understanding of image content [
32]. Recently, applying Transformers to image classification [
31], object detection [
33], semantic segmentation [
34], multimodal fusion [
35], and other tasks have yielded promising results. Additionally, Transformers have elevated deep learning to a new level, demonstrating strong feature extraction and alignment capabilities [
36].
Lengyel et al. [
37] and Chen et al. [
38] utilized edge information from images to improve domain adaptation. Inspired by these insights, we apply the theory of contrast differences in eccentric photorefraction images to compare the images and extract information about their variations. This information is then used as input for a ViT to construct a feature extraction network, aiming to identify the complex spatial dependencies in the distribution of bright and dark regions within the eccentric photorefraction images.
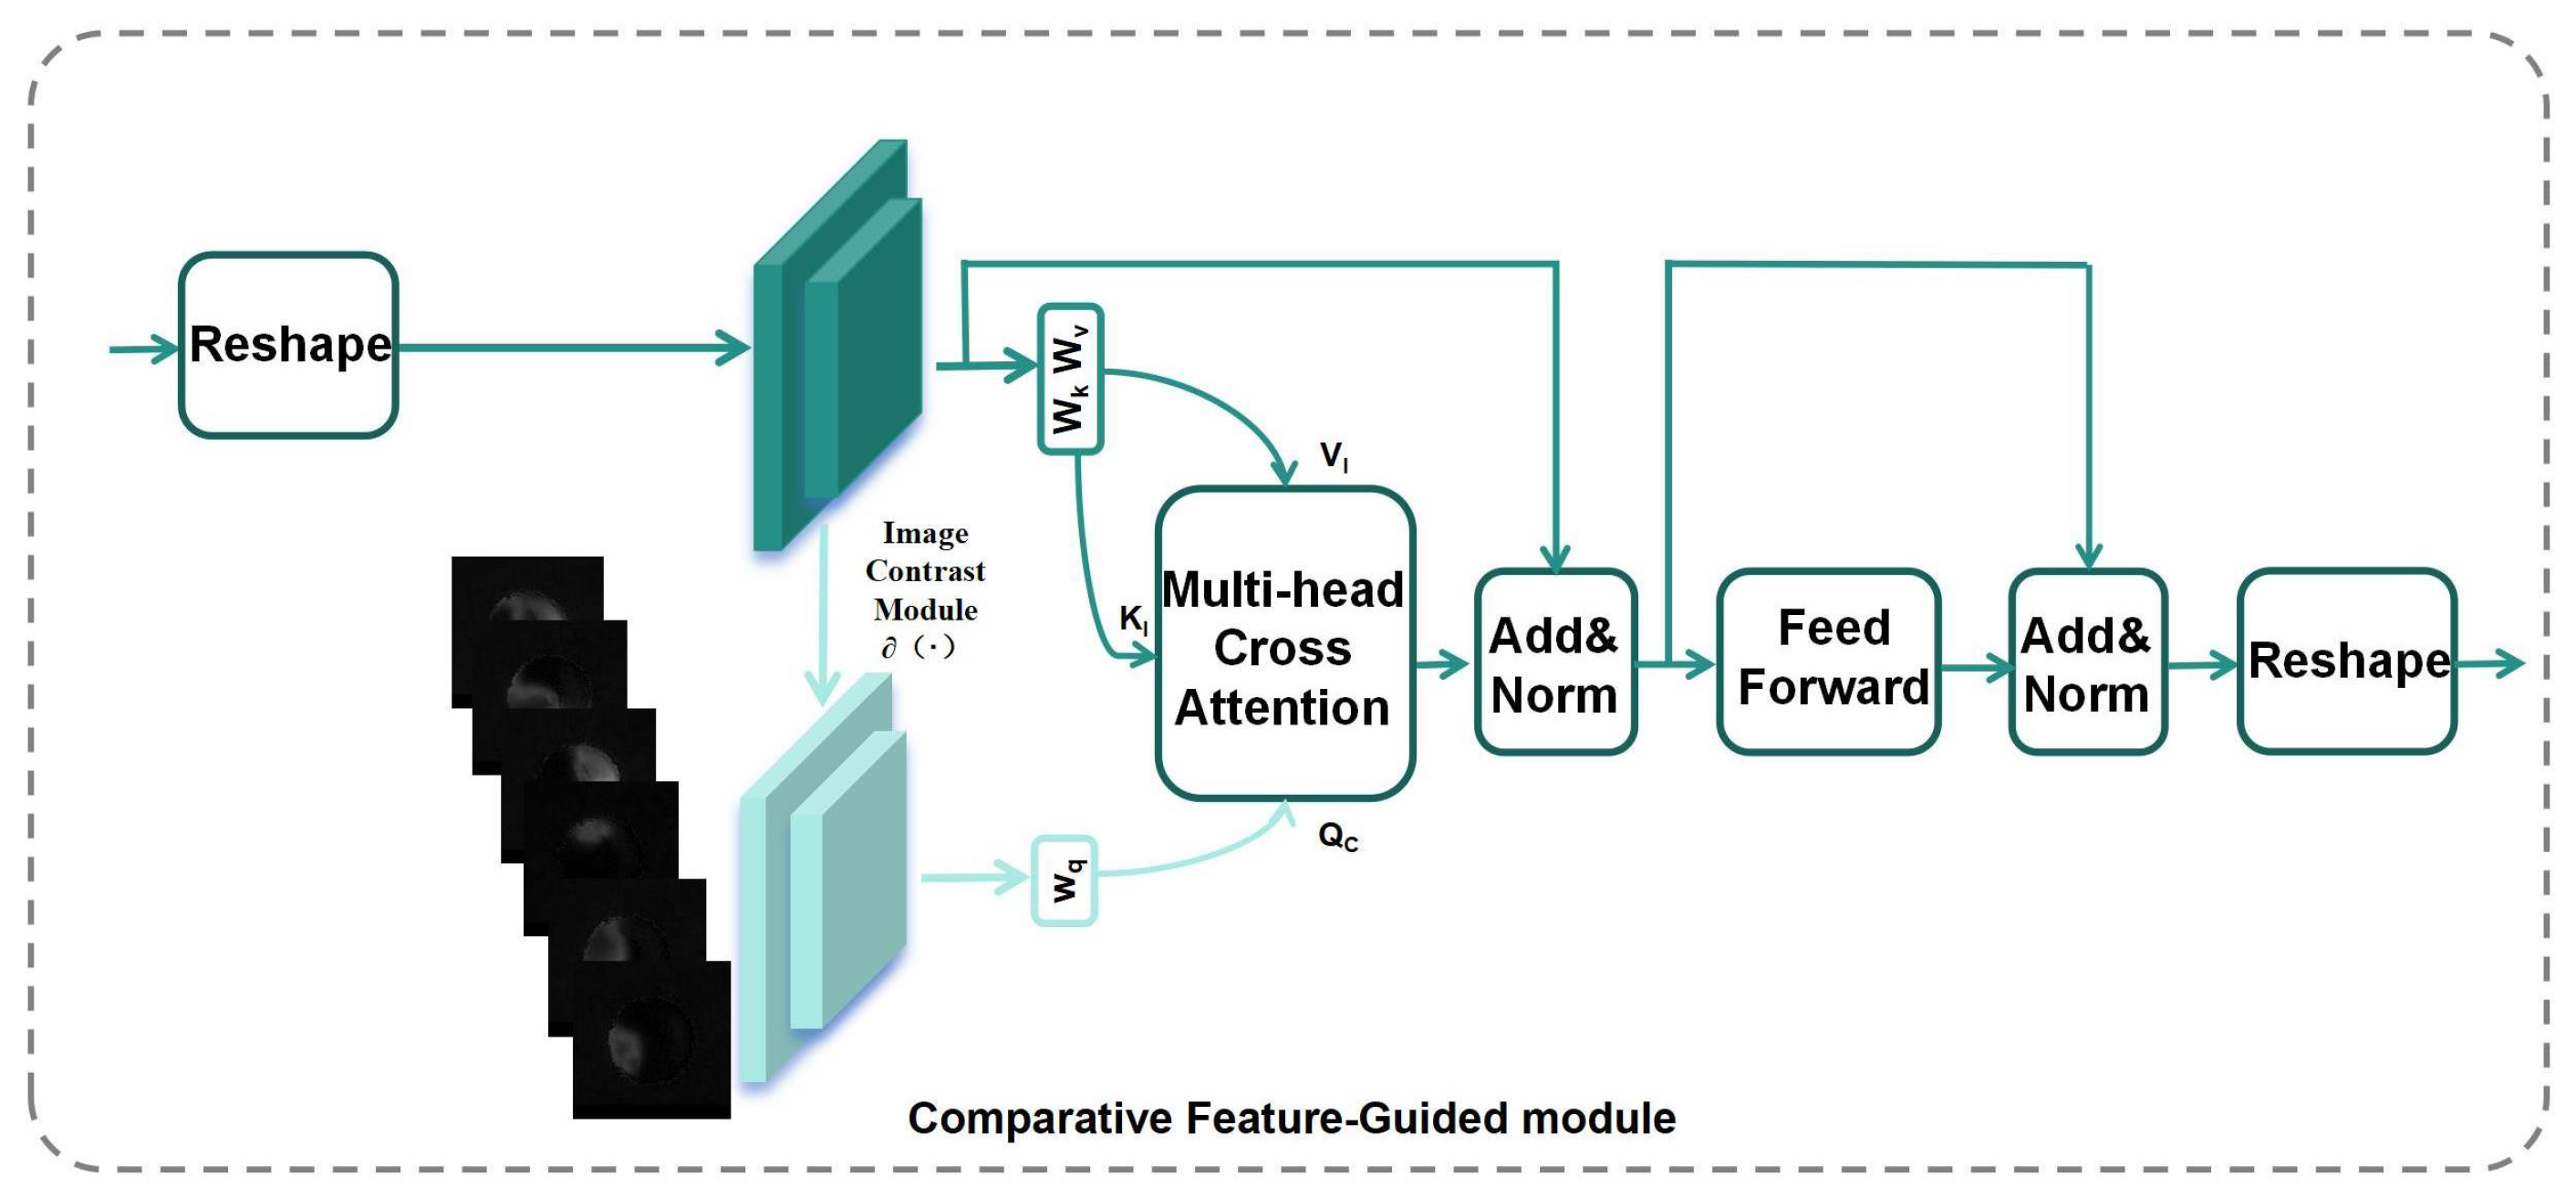
Figure 14 illustrates the structure of the CFG module. The network takes the 6-channel grayscale image
as input.
first passes through two 3 × 3 convolutional blocks with a stride of 2 and groups of 6 for initial feature extraction to obtain the feature
, where the convolutional layer performs convolution on each channel of the 6-channel image separately. The Reshape module segments the image into single-pixel-level patches before feeding them into the improved Transformer layer. At the output end, the feature map is restored to its original shape.
It then enters the image contrast module
(as show in
Figure 15, the base channel remains unchanged) to obtain the feature
, where
, and both
and
are flattened 2D patches. Additionally,
,
, and
are learnable linear projection matrices.
In Equation (
4),
d denotes the dimensionality of
,
, and
. The values
and
are guided and aligned through the cross-attention mechanism and a Transformer layer. By normalizing the attention weights using the softmax function, the model can adaptively focus on regions of the image that are relevant to refractive errors.
2.4.3. Multi-Channel Spatial Information Fusion Mechanism
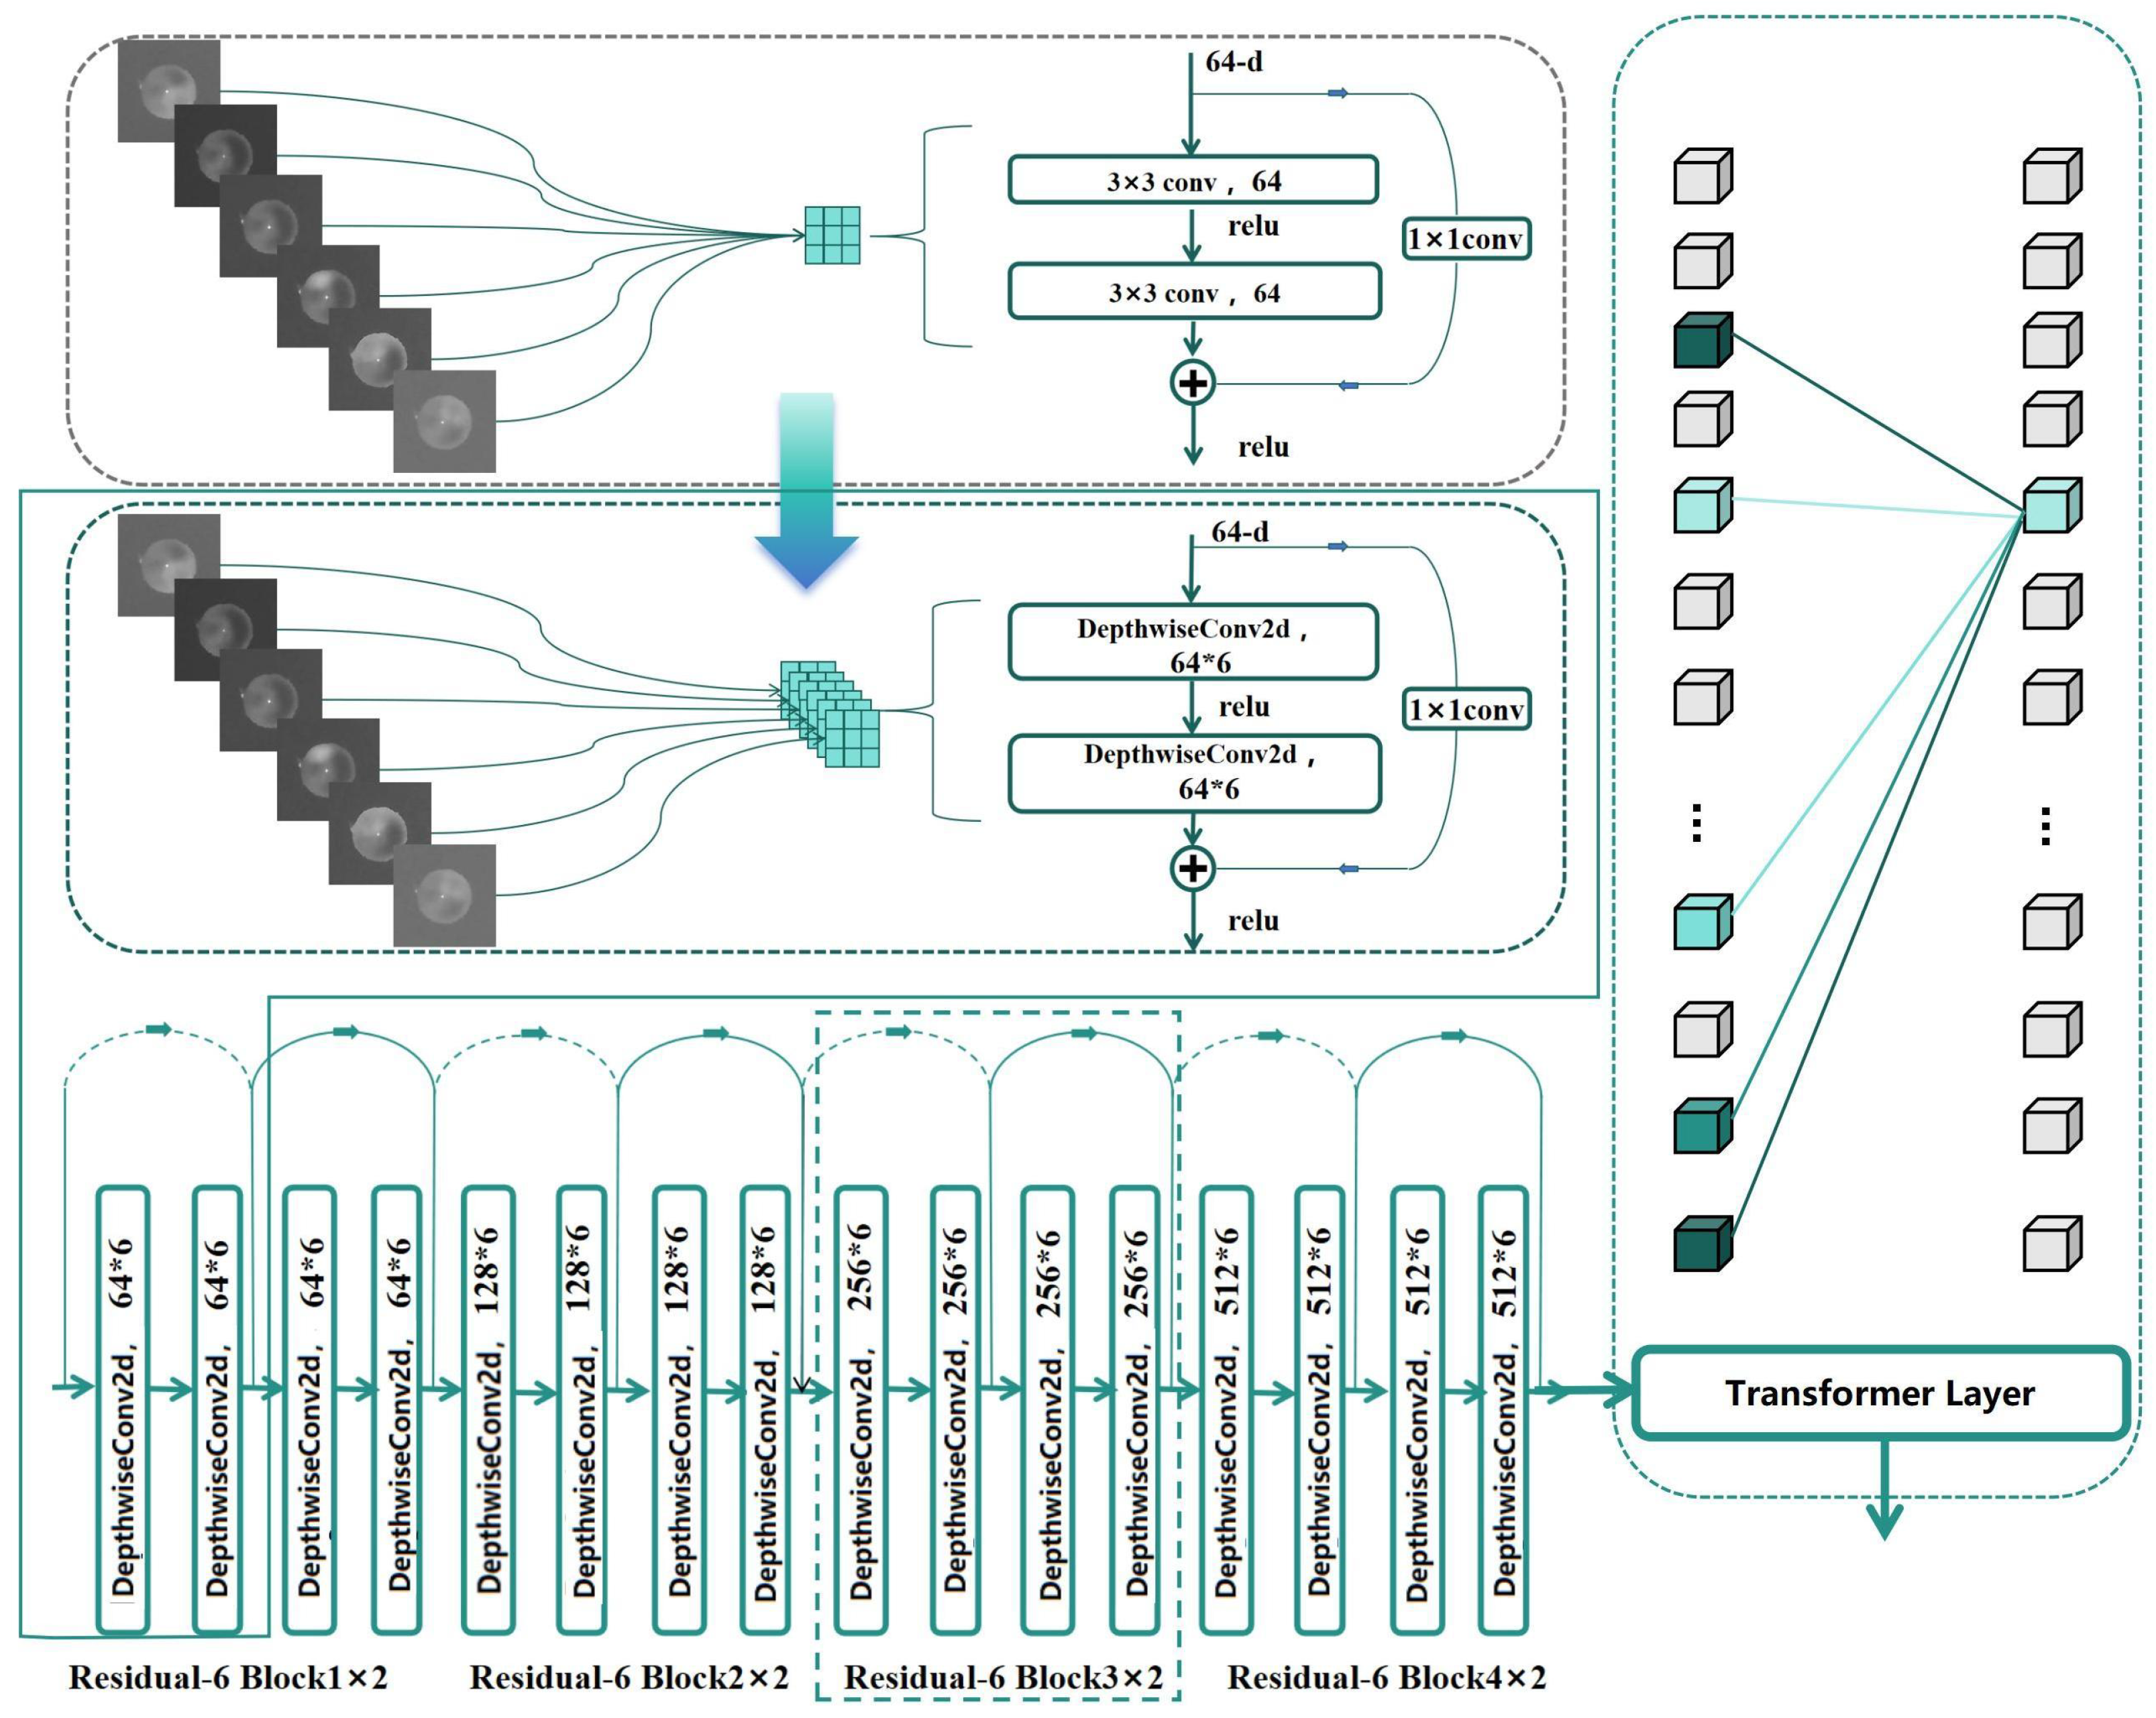
Due to the spatial differences between the 6-channel feature maps, it is necessary to independently process the features of each channel. Traditional methods typically use 3D convolution with a 3 × 3 × 6 kernel to achieve this, but this approach introduces significant computational overhead and weight expansion, which not only increases computational complexity but may also lead to higher data requirements and affect network convergence. The core difference between DepthwiseConv2d [
39] and traditional convolution lies in the way they handle cross-channel information interaction and computational efficiency. DepthwiseConv2d completely decouples the inter-channel dependencies by assigning each input channel an independent filter, ensuring that the number of filters strictly matches the number of input channels. This design entirely eliminates cross-channel computation, making the number of parameters dependent only on the input channels and kernel size. However, the drawback is that the output channels cannot directly integrate multi-channel features. As shown in
Figure 16, to address this issue, this study innovatively adopts the grouped convolution strategy of DepthwiseConv2d for feature extraction. Specifically, in the depthwise separable convolution layer, we use a 3 × 3 2D convolution layer with group = 6, implementing independent calculation of 6-channel features through grouped convolution. Based on this strategy, we improved the residual structure of ResNet [
8] by replacing the original convolution kernels with DepthwiseConv2d, establishing the Residual-6 block.
DepthwiseConv2d decomposes the standard convolution into depthwise convolution and pointwise convolution, significantly reducing the number of parameters and computational cost. The formula is as follows:
where
represents the convolution kernel of the
i-th channel, and
represents the input feature of the
i-th channel.
During the feature extraction process, we first use the Residual-6 block to extract features for each channel and then introduce the self-attention mechanism of the Transformer layer to adaptively fuse the 6-channel features. This strategy, combining grouped convolution and attention mechanisms, not only effectively reduces computational complexity but also enables independent extraction and optimized fusion of spatial features from each channel, significantly improving the recognition performance of the ResNet [
8] architecture in handling 6-channel feature tasks. Through the self-attention mechanism of the Transformer layers, the model can adaptively fuse multi-channel features, enhancing its ability to recognize refractive errors.
3. Experiment and Results
In this section, we validated the effectiveness of the proposed method through comparative experiments and ablation studies. First, we conducted a comprehensive comparison between our method and previously published approaches, and the experimental results thoroughly demonstrate the significant advantages of our method in terms of performance. Next, through systematic ablation experiments, we further analyzed the contribution of each module to the model’s performance, thereby validating the rationality of the model design. Additionally, to explore the impact of the pretraining strategy on refractive error screening tasks, we conducted large-scale transfer learning comparative experiments. These experiments validated the effectiveness and superiority of our method from multiple perspectives.
3.1. Datasets
We collected data from both model eyes and real human eyes, as shown in
Figure 10.
3.1.1. Human-Eye Dataset
We used data collection equipment to capture eccentric infrared pupil images in Jinzhou and Tacheng, two locations 3900 km apart. In Jinzhou, we used our acquisition device to collect 6413 eccentric infrared pupil images and measured their refractive errors using an automatic refractometer to serve as the image labels. These data were used as the full-range dataset, Dataset1, with 5149 image sets as the training set and 1264 image sets as the test set. Among the 6413 image sets collected, the number of images with high-diopter hyperopia (≥+2 D) is very low, as shown in
Table 1.
Twenty types of real-human-eye eccentric infrared pupil images corresponding to the model eyes’ refractive errors were selected, excluding images with incomplete pupils or severe eyelash occlusion. All images with refractive errors (≥+2 D) were included in the test set, referred to as Dataset2, with 403 image sets assigned to the training set and 177 image sets to the test set.
Typically, the precision unit of optometry measurements is 0.25 D, but due to the limited precision of the model eyes we created, we only made model-eye datasets with 0.5 D precision units. To ensure consistency between the model eyes and real eyes in the experiments, we divided the dataset into Dataset1, containing all real-eye data with 0.25 D precision unit, and Dataset2, which was selected to match the precision of the model eyes.
In Tacheng, a total of 7087 images were collected, with 5702 images used as the training set and 1382 images as the test set, forming Dataset3. Additionally, the images were filtered with a precision of 0.5 D, and all images with refractive errors (≥+2 D) were assigned to the test set, resulting in Dataset4, which consisted of 860 images for training and 237 images for testing.
3.1.2. Objective Model-Eye Dataset
A system for acquiring eccentric infrared images of model eyes was used to collect images of 20 different diopters, ranging from [−6.0 D to + 6.0 D] in 0.5 D intervals. For each diopter, 3300 sets of images were captured, with varying pupil sizes and positions relative to the camera. The dataset was divided into training and testing sets at a ratio of 4:1.
3.2. Pupil Segmentation and Extraction in Images
We used the SURF (Speeded Up Robust Features) [
40] algorithm to detect key points in the images, extract and filter the coordinates and response values of the key points, and then sort the key points by their x-coordinates. The key points were divided into left and right groups, and the weighted center of each group was calculated based on the response values. The final result was the central region of the left and right pupils (which closely matches the position of the pupil reflection point). A 128 × 128 pixel area centered on this point was cropped as the image data. To avoid data leakage from the training set to the test set, only the left eye portion of all images was cropped.
3.3. Implementation and Evaluation Metrics
When training the model using the model-eye dataset, we resized the images to 128 × 128 pixels, used the Adam optimizer [
41] with a learning rate of 0.001, and employed
as the loss function. We adopted a step-wise learning strategy, reducing the learning rate to 0.005 at 120 epochs and to 0.0001 at 240 epochs. In addition, we used image augmentation techniques such as translation. The batch size was set to 32, and the network was initialized using the He initialization method [
42]. We trained the model for 300 epochs to ensure convergence and saved the model as the model-eye pretrained model. Subsequently, we loaded the base pretrained model and fine-tuned it using the real-human-eye datasets (Dataset1 and Dataset2) with the same parameter settings as the base model. All models were trained for 300 epochs to ensure convergence. All models were implemented using the Pytorch framework [
43] and trained on a single GTX 4090 GPU.
Table 2 describes the specific parameters.
The refractive error measurement within the ±1 D range is sufficient to meet the requirements of routine refractive error screening. Therefore, this paper uses the accuracy metric (the error range is within ±1 D) as a quantitative indicator to compare the performance of different models. The accuracy metric (the error range is within ±0.5 D) is introduced to verify that the proposed method still performs better even when evaluated at higher precision levels. Additionally, is used to evaluate the performance of each regression model. For each experiment, both comparative and ablation experiments are repeated four times, and the highest accuracy is selected as the experimental result.
is expressed as
where
is the true value (target value),
is the predicted value,
n is the total number of samples, and
is the samples within the error range.
is expressed as
3.4. Comparative Experiment
In this section, we compare the proposed CFGN model with several commonly used deep learning models, including VGG-16 [
44], Densenet-121 [
45], AlexNet [
46], ResNet-18 [
8], ResNet-50 [
8], ResNeXt-50 [
47], Se-ResNet-50 [
48], ViT [
31], Swin Transformer [
49], REDNet [
16], and ResNet-50-6. Notably, ResNet-50-6 is a six-channel input model based on ResNet-50 designed to verify the performance improvement of multi-channel images in refractive error prediction tasks. It is important to note that conventional deep learning regression models are trained using a single eccentric infrared pupil image, whereas CFGN and ResNet50-6 are trained using six-channel eccentric infrared pupil images.
As shown in
Table 3 and
Table 4, the experimental results show that on Dataset1 and Dataset3 (full-range dataset), models such as VGG-16, Densenet-121, AlexNet, ResNet-18, ResNet-50, ResNeXt-50, Se-ResNet-50, Vit, REDNet [
16], and Swin Transformer have similar performance, but their
accuracy does not exceed 90%. This indicates that existing network architectures still have room for optimization in refractive error screening tasks. In contrast, Both CFGN and ResNet50-6 achieved higher
and
on both datasets compared to conventional models, fully validating the effectiveness of multi-channel image inputs. Notably, CFGN achieved the best performance across all evaluation metrics, demonstrating its exceptional capabilities.
On Dataset2 and Dataset4 (0.5 D precision datasets), the performance of models such as VGG-16, Densenet-121, AlexNet, ResNet-18, ResNet-50, ResNeXt-50, REDNet, and Se-ResNet-50 was similar. However, the Vit, based on the Transformer architecture, failed to fully converge due to the limited sample size, resulting in suboptimal performance. In the comparative experiment data, only CFGN achieved an ACC1 accuracy of over 80% on the datasets from both regions, maintaining a leading advantage across all metrics. This further confirms that CFGN can effectively extract feature information from eccentric infrared pupil images even under small-sample conditions, enabling it to better perform refractive error screening tasks.
In summary, the CFGN we designed demonstrates outstanding performance in refractive error screening tasks, significantly outperforming mainstream models such as VGG-16, Densenet-121, AlexNet, ResNet-18, ResNet-50, ResNeXt-50, Se-ResNet-50, Vit, REDNet, and Swin Transformer. Specifically, on the small-sample datasets, Dataset2 and Dataset4, CFGN achieved a 5% to 9% improvement in accuracy compared to conventional models, while on the full-range datasets, Dataset1 and Dataset3, it achieved a 3% to 5% performance boost in accuracy. This result fully validates the robustness of CFGN across different data scales, highlighting its practical value in refractive error screening tasks.
3.5. Transfer Learning Experiment
In this section, we employed transfer learning by loading the weights of pretrained models and fine-tuning them with real-human-eye data. For common deep learning models such as ResNet-18, ResNet-50, Vit, and Swin Transformer, we used models pretrained on ImageNet1k, removed the classifier part, and fine-tuned them layer by layer. As shown in the table, the training results with transfer learning outperformed those obtained by training directly on eccentric infrared pupil images. Additionally, Vit successfully converged on Dataset2, validating the effectiveness of transfer learning. However, for models with six-channel image inputs, such as CFGN and ResNet-50-6, pretrained models are not available. Therefore, we trained refractive error screening pretrained models on CFGN and ResNet-50-6 using a large amount of objective model-eye data for six-channel eccentric infrared pupil images and fine-tuned them on the real-human-eye datasets, Dataset1 and Dataset2. The CFGN-pre and ResNet-50-6-pre in
Table 5 and
Table 6 represent the training results after applying transfer learning.
Experimental results show that on Dataset1 and Dataset3, CFGN-pre achieved the highest accuracy and the lowest . On Dataset2, compared to the original CFGN, CFGN-pre significantly improved , reaching 84.2%. In Dataset2 and Dataset4, the test sets contain only a small amount of high-diopter hyperopia data (+2 D to +6 D), and there are no high-diopter hyperopia data in the training sets. This indicates that introducing the model-eye pretrained model alleviated the problem of insufficient high-diopter hyperopia data. Furthermore, when fine-tuning the pretrained model on Dataset2, ResNet-50-6 achieved an increase of 0.5% to 0.6% in and . For the CFGN model, increased by 1.1%, while improved by 2.3%. These results demonstrate that the CFGN model is more effective than ResNet-50 in extracting common features between model eyes and real human eyes.
Additionally, in the training of CFGN using Dataset1, the performance improvement from introducing the model-eye pretrained model was smaller than when introducing the model-eye pretrained model in the training of Dataset2, possibly due to the difference in the precision unit within ±1 D between the model eyes with 0.5 D precision and Dataset1, affecting the training results.
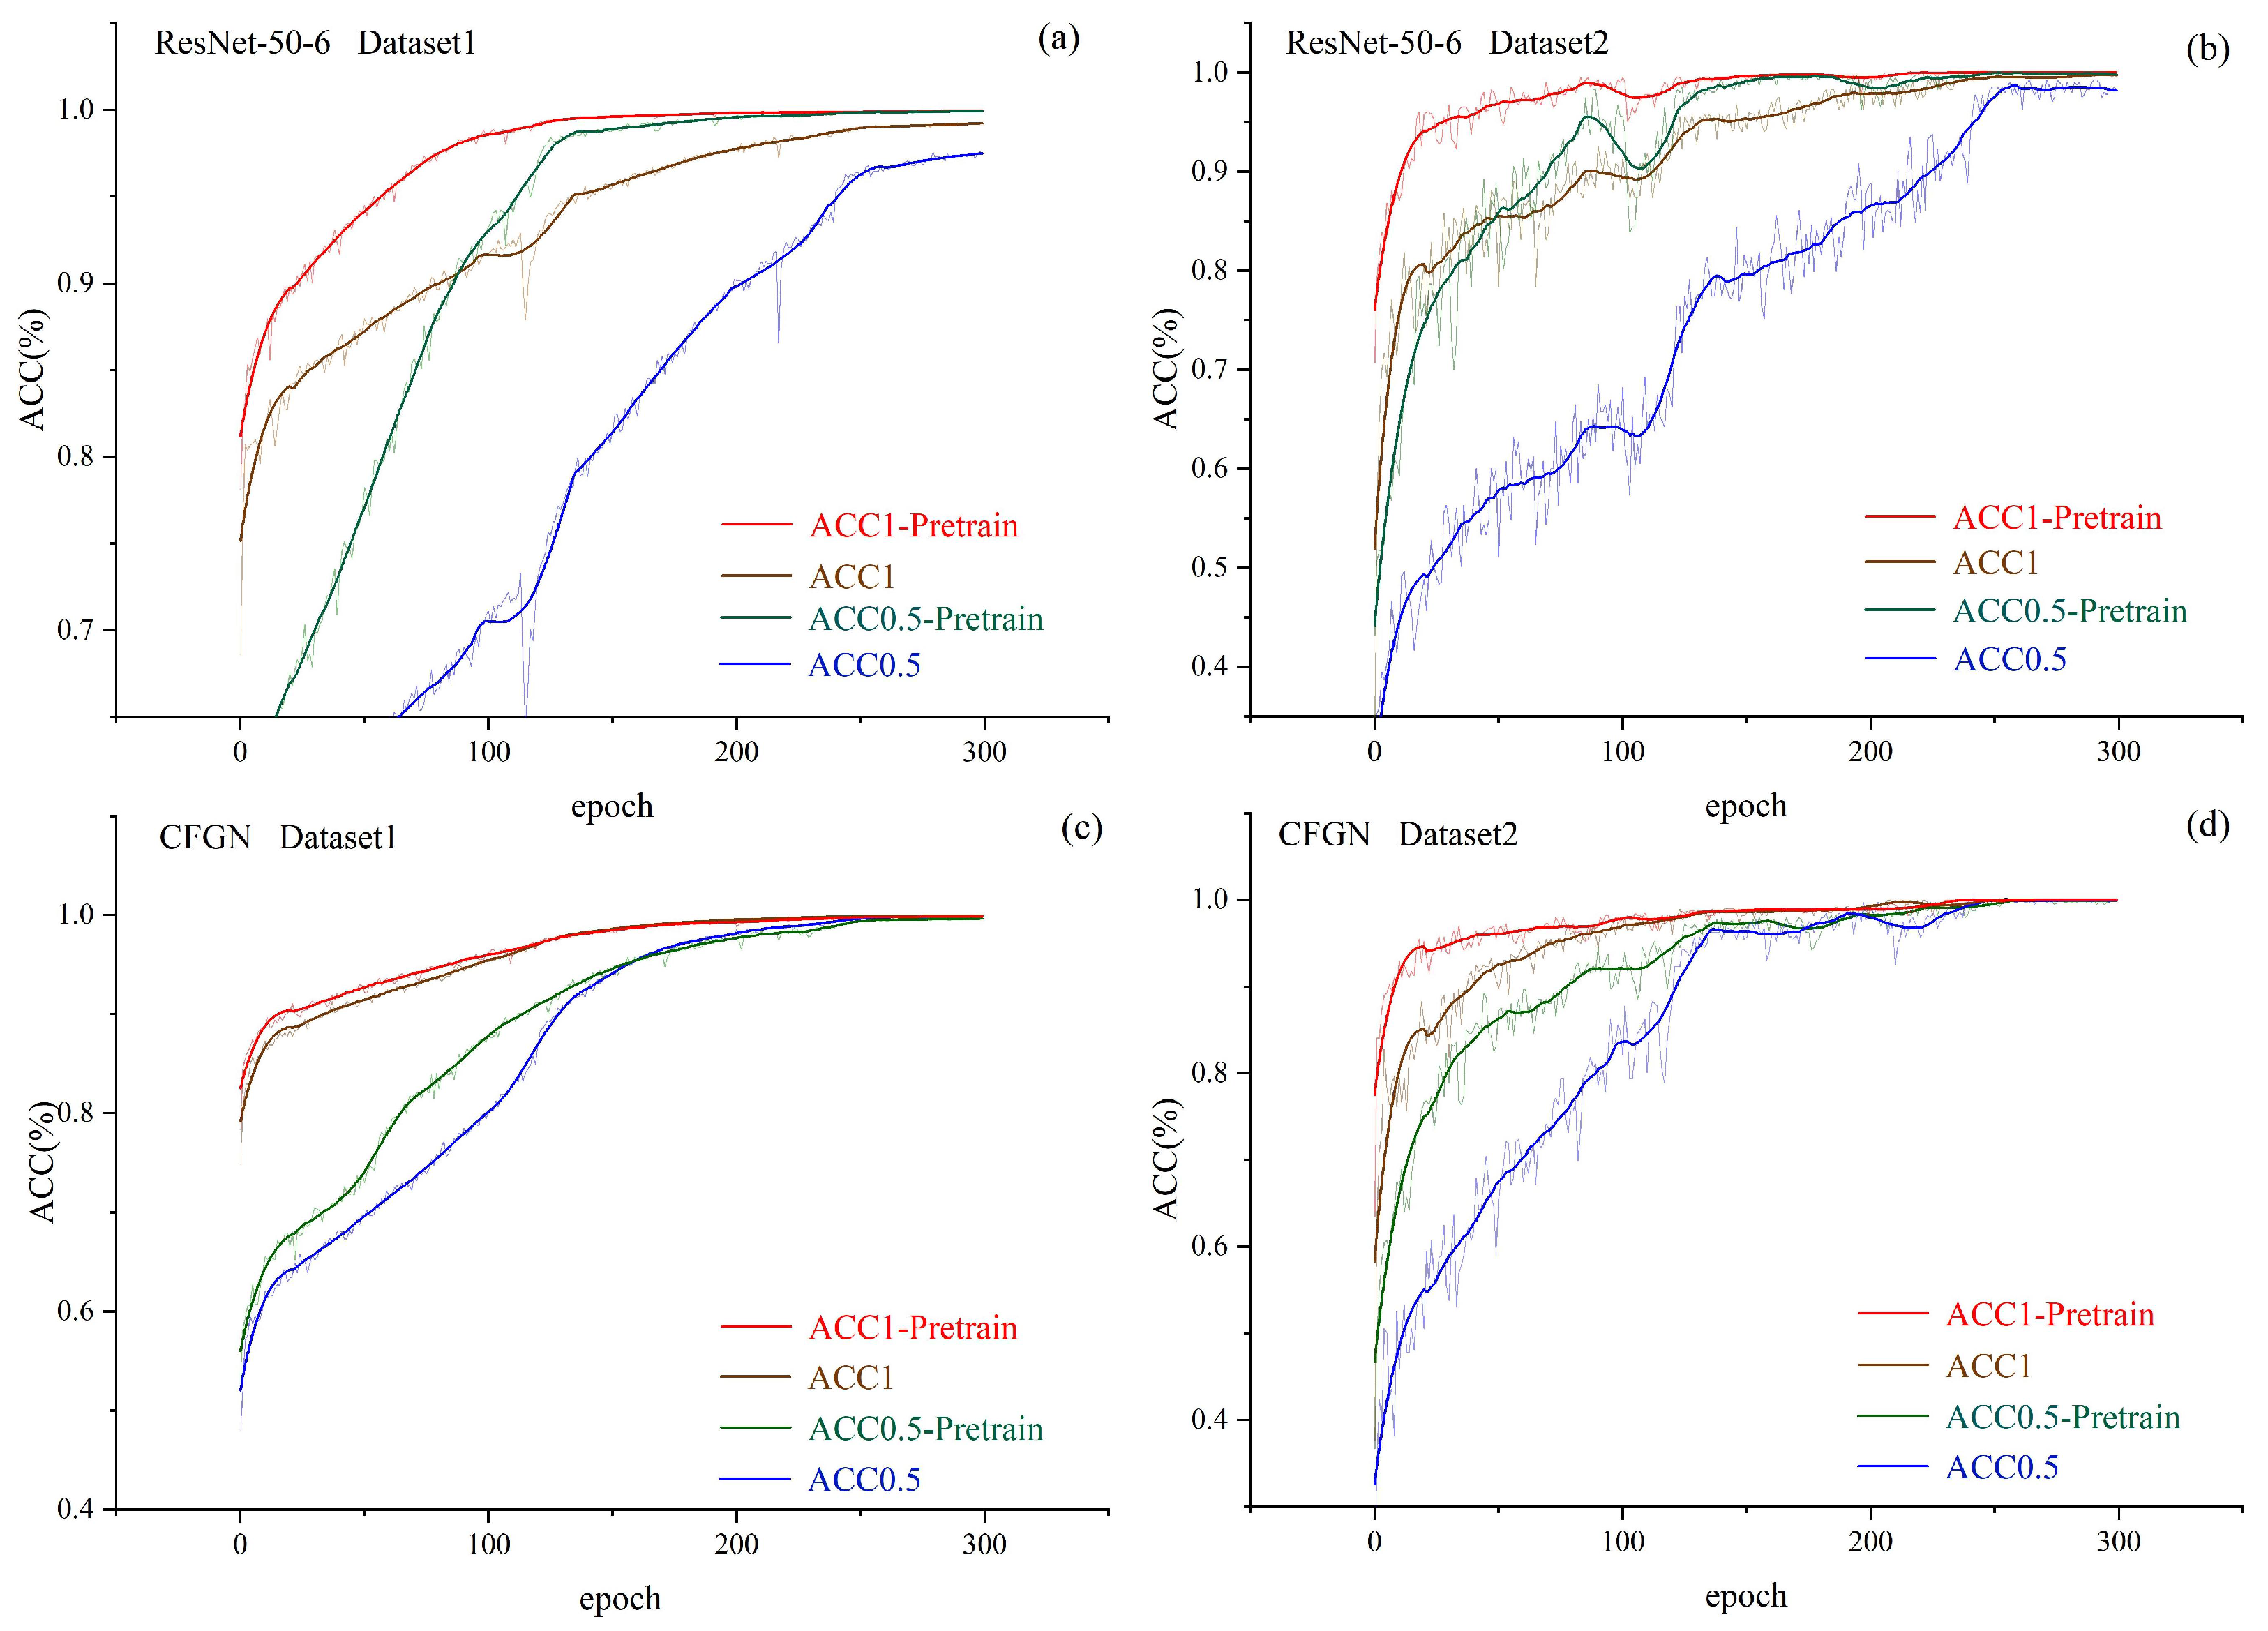
Observing the entire training process, as shown in
Figure 17a, when training ResNet-50-6 using Dataset1, both
and
reach convergence within 120 epochs with a pretrained model, whereas without pretraining, 240 epochs are required for convergence. In other cases, the pretrained model also accelerates the convergence speed of the model. Pretraining significantly accelerates model convergence by optimizing parameter initialization and facilitating knowledge transfer. The parameters learned from large-scale data are closer to the potential optimal solution of the target task, avoiding the blind search of random initialization. Additionally, low-level general features (such as the contrast feature of the crescent area in eccentric photorefraction images) can be directly reused, allowing downstream tasks to require only fine-tuning of higher-level structures. Moreover, the implicit regularization effect of pretraining reduces the risk of overfitting, while improved gradient stability and data efficiency—especially in low-sample scenarios—further shorten training cycles. This also means reducing the computation time required for training the network in the cloud, thereby accelerating the deployment of region-specific algorithms.
In summary, this section validates that both the ImageNet1k pretrained model and the model-eye pretrained model developed in this study can effectively improve the performance of refractive error screening tasks. Among them, the self-built model-eye pretrained model, being more closely aligned with the target task domain, demonstrates stronger transfer learning capabilities in refractive error screening tasks.
3.6. Ablation Experiment
We conducted ablation experiments on the CFGN network itself using Dataset1 to demonstrate the effectiveness of the CFG module and the Bottom Transformer Layer. In our study, the baseline network consists of a simple model composed of two 3 × 3 convolutional layers with a stride of 2, eight Residual-6 Blocks, a pooling layer, and a fully connected layer. We gradually added different modules to the baseline to verify their effectiveness. The evaluation method for this section is consistent with the previous experiments.
Table 7 presents the results of model optimization. The baseline model achieved an
of 67.4% and an
of 90.1%. After adding the CFG module,
improved to 68.8%, and
increased to 92.2%. When the bottom Transformer layer was added on top of the CFGN,
further improved to 69.6%, and
increased to 92.5%. These results demonstrate the effectiveness of both the CFG module and the Transformer layer in improving model performance.
4. Discussion
Nowadays, the issue of early-onset myopia has become increasingly severe, especially with the widespread adoption of the internet and electronic devices. The age at which children and adolescents first interact with electronic devices continues to decline. Moreover, the prevalence of paperless learning and electronic whiteboards in education has significantly increased their screen time on smartphones and tablets, leading to a continuous rise in myopia incidence among younger populations. However, the preventive screening of vision health in adolescents remains difficult to implement on a regular basis due to high labor costs and a lack of professional equipment. Traditional refractive measurement techniques can no longer meet the demands of modern society. To address this, this study proposes an innovative solution that integrates eccentric photorefraction and deep learning, aiming to establish an efficient, accurate, and cost-effective online vision screening system.
Previous studies have faced limitations due to insufficient data scale and imbalanced distribution. Chun et al. [
13] utilized only a dataset of 305 images, with only 12 samples having ≥+5.0 D and all from a single source; Linde et al. [
13] expanded their dataset across two regions but were still limited to 512 images. This study collected data from two regions 3900 km apart, each with over 6000 samples, ensuring adequate model convergence and validating the generalizability of the proposed solution. In addition, model-eye data were used to alleviate the lack of high-diopter hyperopia data. Existing studies primarily focus on refractive status classification: Chun et al. [
13] defined a seven-level classification standard, Fu et al. [
14] developed SURE-CNN using
D as a threshold for binary classification alerts, and Linde et al. [
17] set
D as the classification boundary. While such methods can identify myopia risks, they suffer from rigid thresholds that limit screening sensitivity and prevent precise refractive measurement. This study innovatively replaces classification models with a regression model and introduces an error range evaluation system, significantly improving the clinical applicability of screening results.
In terms of model training strategies, previous studies commonly employed transfer learning based on ImageNet pretrained parameters. However, natural images differ significantly from eccentric photorefraction images in feature characteristics. This study constructed a model-eye system, leveraging the similar optical properties of real human eyes and model eyes under eccentric infrared illumination to generate highly clinically relevant simulated data, thereby enhancing data diversity. Transfer experiments demonstrated that the pretrained model based on model eyes outperformed the ImageNet pretrained model, requiring less training data while achieving greater performance improvements. Although generative adversarial networks (GANs) could serve as an alternative for data synthesis, their application in medical image generation relies on large-scale training data, making them unsuitable for this study’s specific scenario. In the future, as experts upload accurately labeled real-human-eye data from different regions and ethnicities to the system (with user consent), we will establish a universal pretrained real-human-eye model, which will have better generalization performance than the model-eye pretrained model. All relevant studies currently adopt a transfer learning approach based on pretraining followed by fine-tuning; we will explore the use of advanced transfer learning methods, such as domain adaptation, to better complete refractive error screening tasks.
From a technical implementation perspective, existing methods have not fully explored the potential of eccentric photorefraction image features. While Yang et al. [
15] utilized a 24-near-infrared-LED multi-axial illumination system to collect 1216 eye images for training a regression model, their approach required manual extraction of reflected light intensity features and image stitching, resulting in complex feature engineering and limited generalization. Xu et al. [
16] proposed REDNet, which predicts refractive error using six-direction eccentric light source images, but its fixed eccentricity imaging scheme restricts the sensitive measurement range. This study innovatively employs a multi-eccentricity-angle, multi-channel spatial information dataset that better aligns with clinical refractive measurement principles. Notably, existing models generally suffer from the “black-box” problem. To address this, this study developed the Contrast Feature Guidance Module (CFG module), which integrates ophthalmic prior knowledge and enhances interpretability by leveraging feature space comparisons, ensuring transparency in clinical diagnostics.
Due to differences in datasets and research objectives, direct horizontal comparisons are limited. However, this study achieved a breakthrough mean absolute error (MAE) of 0.168 D on the largest-scale dataset, surpassing REDNet’s 0.174 D [
16] and SURE-CNN’s 0.653 D [
14]. By replicating the REDNet six-image input architecture and conducting comparative experiments on Dataset1 and Dataset3, CFGN outperformed REDNet in key metrics: ACC1 (92.5, 92.0) vs. REDNet’s ACC1 (88.9, 88.6) and MAE (0.230 D, 0.123 D) vs. REDNet’s MAE (0.250 D, 0.198 D). At the same time, we compared the vision screening scheme based on eccentric photorefraction used in this study with schemes that utilize fundus images for vision screening. Our MAE was also lower than Varadarajan’s 0.56 D and Zou’s [
9] 0.63 D.
Experiments conducted in two different regions validated the feasibility of this online refractive error screening solution, which is centered on the CFGN network and supplemented by a pretrained model based on model eyes. This innovative approach provides a new technical pathway for routine vision screening in various regions. The solution not only significantly improves screening efficiency but also greatly reduces screening costs, making it particularly suitable for areas with limited medical resources and professional technical personnel. By conducting routine refractive error screening, continuous refractive error data can be obtained, enabling the ongoing monitoring of vision changes and laying a solid data foundation for establishing predictive models for refractive error changes.
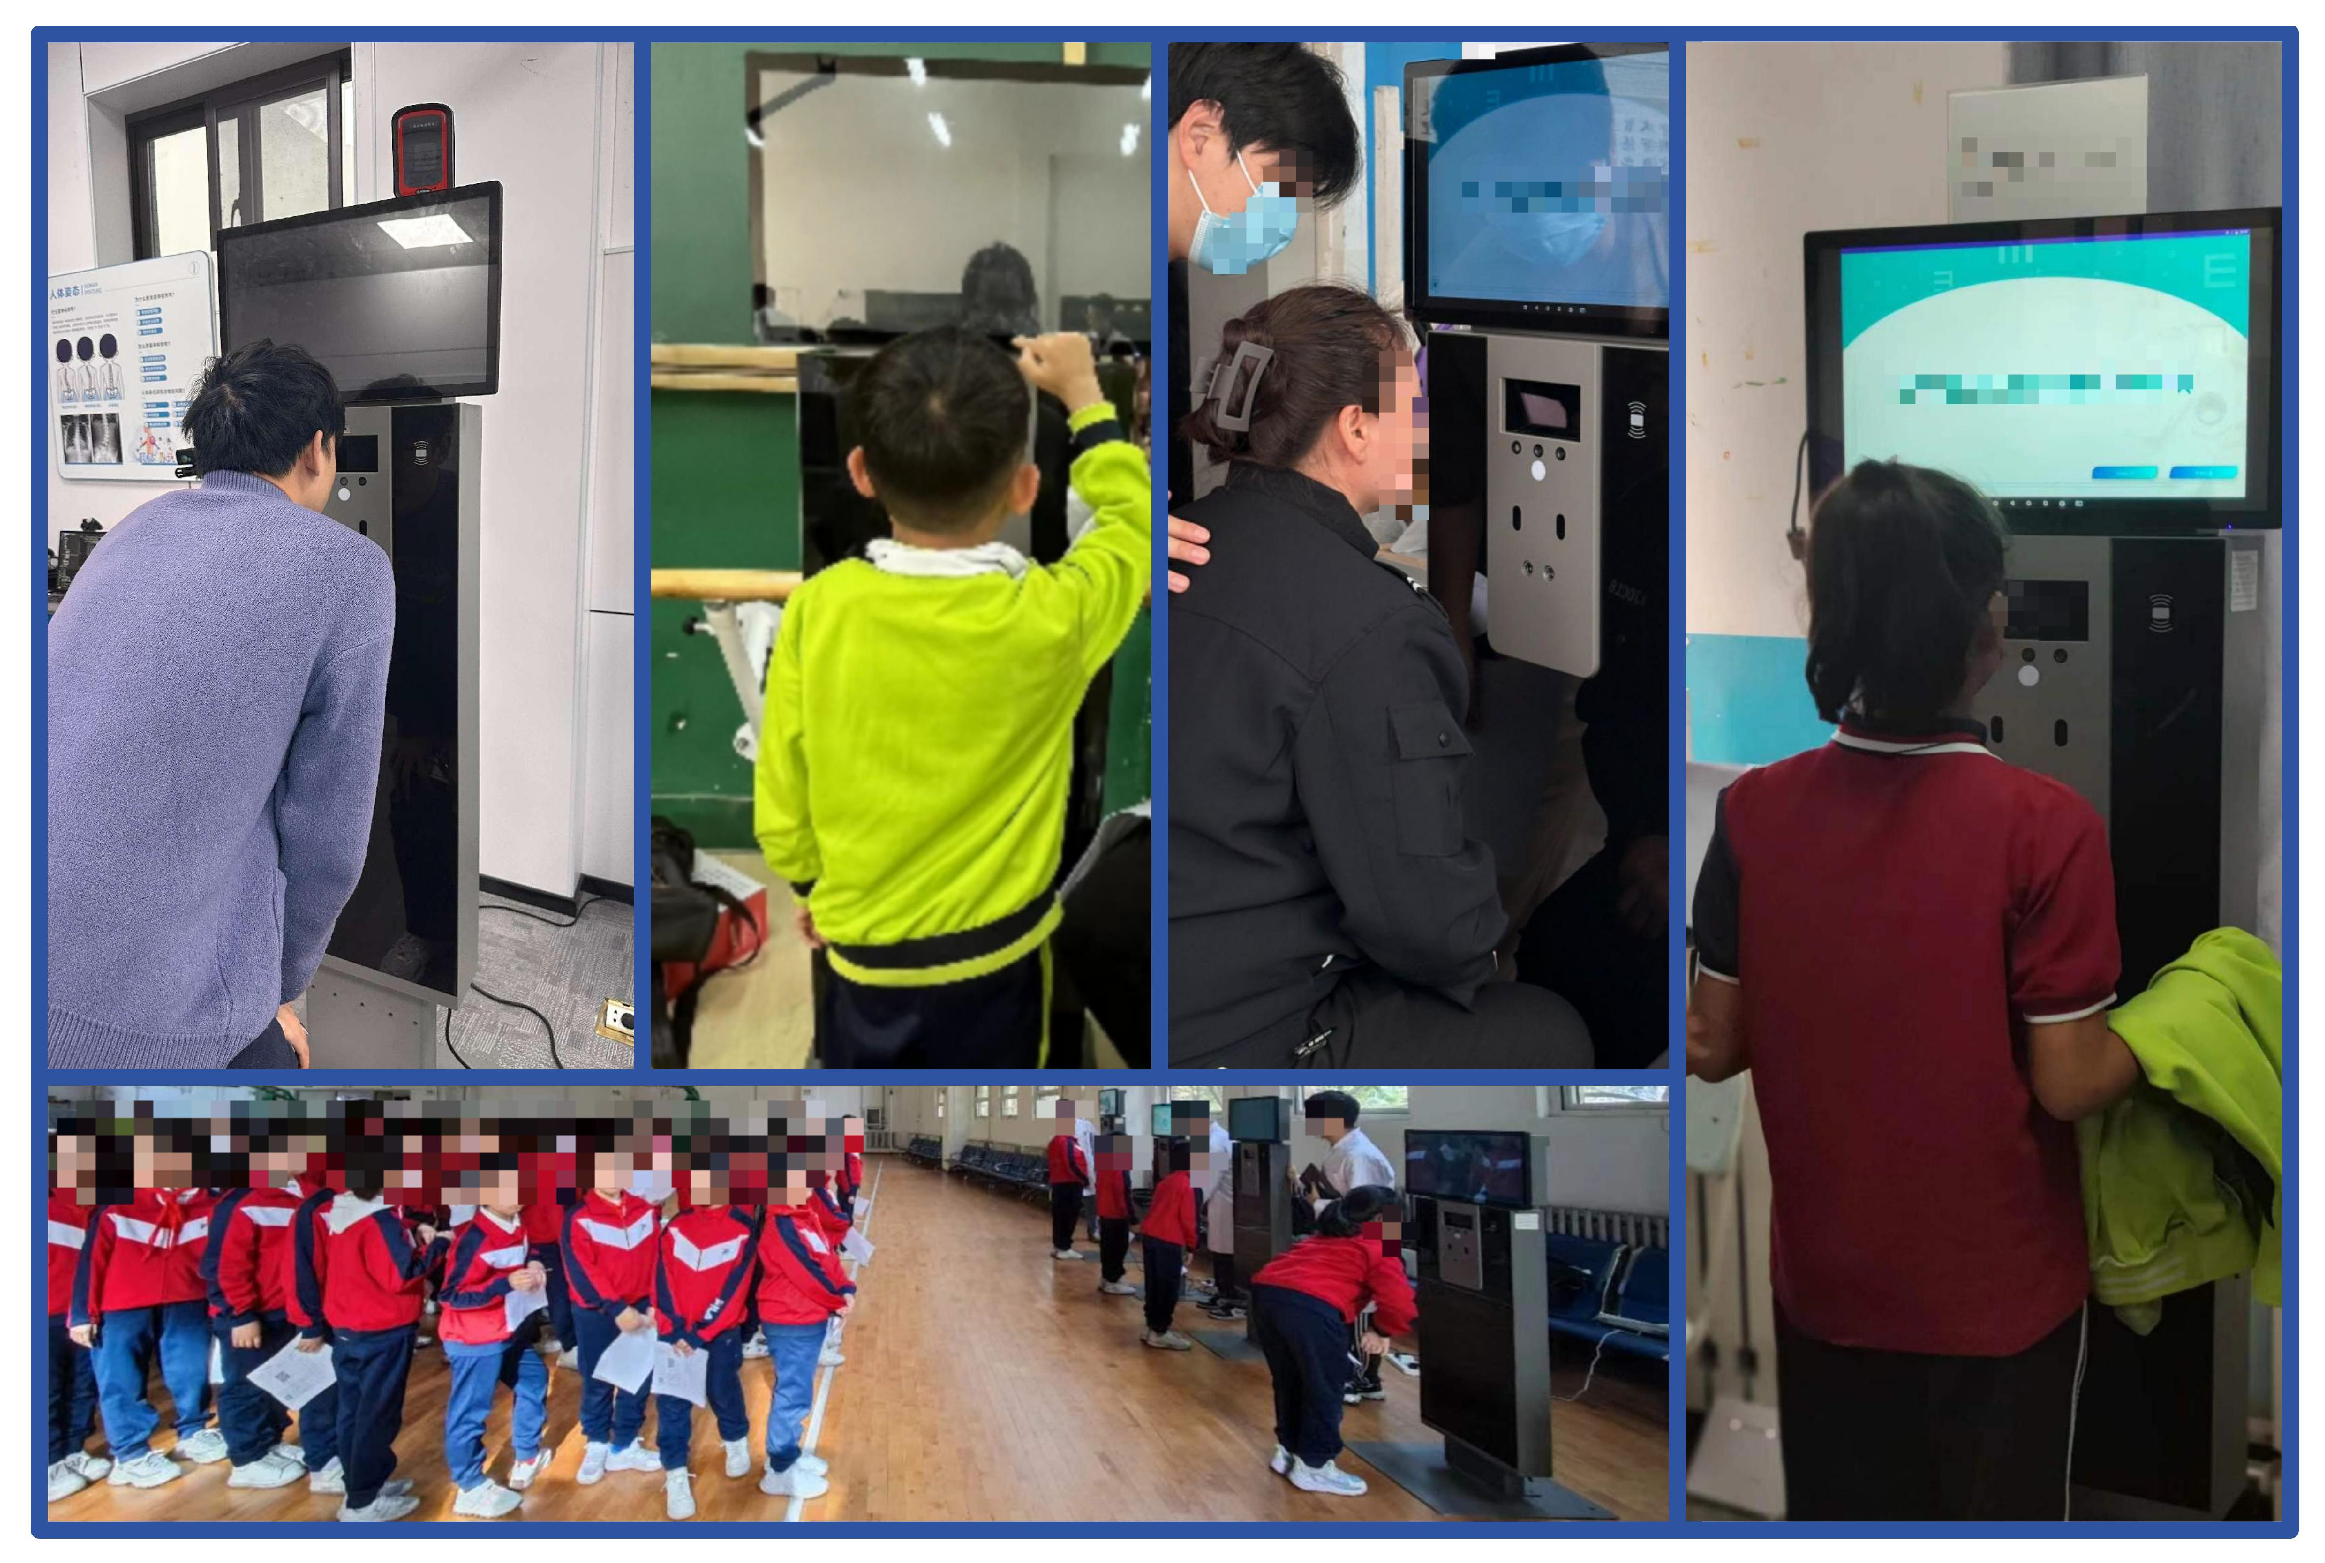
As shown in
Figure 18, the vision screening terminal based on eccentric photorefraction principles can be easily deployed in schools, communities, and other public places, providing self-service screening for adolescents and children. This system has been preliminarily validated in regions such as Jinzhou, Tacheng, and Changzhi.
In summary, AI-based screening technology has established a comprehensive vision data monitoring system, providing a scientific basis for vision health management. This, in turn, assists schools, healthcare centers, and other institutions in building a collaborative vision prevention and control network, realizing a closed-loop management system for screening, monitoring, and intervention. This innovative approach has broad application prospects in the field of vision protection and holds significant social and strategic value in advancing the establishment of a youth vision health management system. Based on the continuous refractive error data obtained from this online system, we will further conduct research on personalized refractive error progression prediction.


