Article

Comparative Feature-Guided Regression Network with a Model-Eye Pretrained Model for Online Refractive Error Screening

1
School of Biomedical Engineering (Suzhou), Division of Life Sciences and Medicine, University of Science and Technology of China, Hefei 230026, China
2
Suzhou Institute of Biomedical Engineering and Technology, Chinese Academy of Science, Suzhou 215163, China
3
Jinan Guoke Medical Technology Development Co., Ltd., Jinan 250000, China
*
Authors to whom correspondence should be addressed.
Future Internet 2025, 17(4), 160; https://doi.org/10.3390/fi17040160
Submission received: 26 February 2025 / Revised: 25 March 2025 / Accepted: 29 March 2025 / Published: 3 April 2025

Abstract

:
With the development of the internet, the incidence of myopia is showing a trend towards younger ages, making routine vision screening increasingly essential. This paper designs an online refractive error screening solution centered on the CFGN (Comparative Feature-Guided Network), a refractive error screening network based on the eccentric photorefraction method. Additionally, a training strategy incorporating an objective model-eye pretraining model is introduced to enhance screening accuracy. Specifically, we obtain six-channel infrared eccentric photorefraction pupil images to enrich image information and design a comparative feature-guided module and a multi-channel information fusion module based on the characteristics of each channel image to enhance network performance. Experimental results show that CFGN achieves an accuracy exceeding 92% within a ±1.00 D refractive error range across datasets from two regions, with mean absolute errors (MAEs) of 0.168 D and 0.108 D, outperforming traditional models and meeting vision screening requirements. The pretrained model helps achieve better performance with small samples. The vision screening scheme proposed in this study is more efficient and accurate than existing networks, and the cost-effectiveness of the pretrained model with transfer learning provides a technical foundation for subsequent rapid online screening and routine tracking via networking.

1. Introduction

1.1. Background

Refractive error occurs when the eye cannot properly focus light onto the retina, leading to blurred or distorted vision. It includes conditions such as myopia, hyperopia, and astigmatism, which can impact daily life [1]. If not corrected promptly, these errors can worsen, further degrading vision. The issue of myopia becoming prevalent at a younger age is becoming increasingly severe, especially with the widespread use of the internet and electronic devices. Children and adolescents are now starting to use electronic devices and the internet at younger ages, leading to prolonged screen time on devices like smartphones and tablets. This not only impacts their vision health but also contributes to the growing incidence of myopia among increasingly younger children [2]. Large-scale refractive error screening can help detect issues like myopia, hyperopia, and astigmatism early in adolescence, allowing timely intervention to slow vision decline. However, traditional refractive error screening techniques have issues such as complex instrument operation, high labor costs, and low cooperation from children. Additionally, in underdeveloped regions, especially in many township health centers, the lack of basic medical equipment and trained professionals makes it difficult to conduct regular vision screening. Within the realm of adolescent health protection, there is a pressing demand for more efficient and effective screening and diagnostic tools [3].
Artificial intelligence (AI) technology has been successfully applied in the healthcare field [4,5]. Ishaani et al. [6] presented a novel approach that combines deep learning and fair AI technologies for screening autism spectrum disorder (ASD) in both children and adults. This method significantly improves diagnostic accuracy and emphasizes the importance of reducing AI biases. Youssef et al. [6] demonstrated the potential of TinyML for real-time detection of respiratory diseases, such as asthma, on low-power devices. This offers a portable diagnostic tool for remote and resource-limited areas. Researchers have also proposed deep learning-based methods for refractive error measurement. Varadarajan et al. [7] first proposed using deep learning for refractive error detection in 2018. They employed a hybrid structure combining ResNet [8] and soft attention for regression tasks, achieving an MAE of 0.56 D. Zou et al. [9] utilized a deep learning system based on a fusion model (FMDLS) to train on 11,973 retinal fundus images, successfully identifying spherical, cylindrical, and axial refractive errors, demonstrating good consistency with cycloplegic refraction. This suggests that deep learning can be applied to make novel predictions based on medical imaging. Exploring how to use AI techniques to efficiently and cost-effectively complete refractive error screening tasks holds great research potential. However, the lack of accurately labeled medical imaging data has hindered the development of deep learning-based refractive error detection methods.
The eccentric photorefraction method is a fast and effective screening tool that can be used to detect significant refractive errors. As Figure 1 shows, when the refractive error of the eye exceeds a critical value, a halo appears at the pupil edge. This characteristic is used for refractive error measurement. However, the lack of labeled datasets for real human eyes in eccentric photorefraction remains a major bottleneck.
To address these challenges, this paper proposes an online vision screening solution based on the eccentric photorefraction method. The method uses a transfer learning approach, fine-tuning a pretrained model-eye model deployed on a server using a small amount of local data, thereby alleviating the issue of data scarcity. Data obtained from the screening equipment are transmitted via the cloud to the server, where the refractive error screening results are quickly generated by the deep learning-based algorithm. Compared to traditional refractive error screening methods, where trained nurses or technicians conduct visual acuity tests in schools, the method used in this study is more popular because it optimizes the refractive error screening process using online deployment and deep learning, making it more efficient and convenient. It can help economically underdeveloped areas conduct regular vision screening. The introduction of AI algorithms improves the extraction of features necessary for calculating refractive error, thus enhancing screening accuracy.
The key contributions of this study are as follows:
(1) This study innovatively proposes a deep learning network model based on the principles of eccentric photorefraction—CFGN (Comparative Feature-Guided Network). By combining multi-channel information fusion and a comparative feature-guided module, the model achieves optimal refractive error screening accuracy.
(2) This study fully utilizes the optical characteristics of the objective eye model, which closely resemble those of real human eyes. An automated collection system is used to build a pretrained model for large-scale eccentric photorefraction infrared images of model eyes. Using the transfer learning method with fine-tuned pretrained models helps address the issue of data scarcity.
(3) The refractive error screening technology proposed in this study can be easily integrated into an online refractive error screening system. This innovative approach is especially suitable for areas with limited medical resources and professionals, with broad application prospects and significant social value.
The remainder of this paper is organized as follows. The Introduction and related work of our approach are presented in Section 1. Section 2 presents the online refractive error screening system and explains the research methods and content. Our dataset and experimental details are presented in Section 3, and some quantitative and qualitative experimental results were obtained to evaluate the effectiveness of our method. Subsequently, the effectiveness of this study as a whole and the shortcomings and research potential for improvement are discussed in Section 4. Finally, the Conclusions are stated in Section 5.

1.2. Related Works

1.2.1. Eccentric Photorefraction

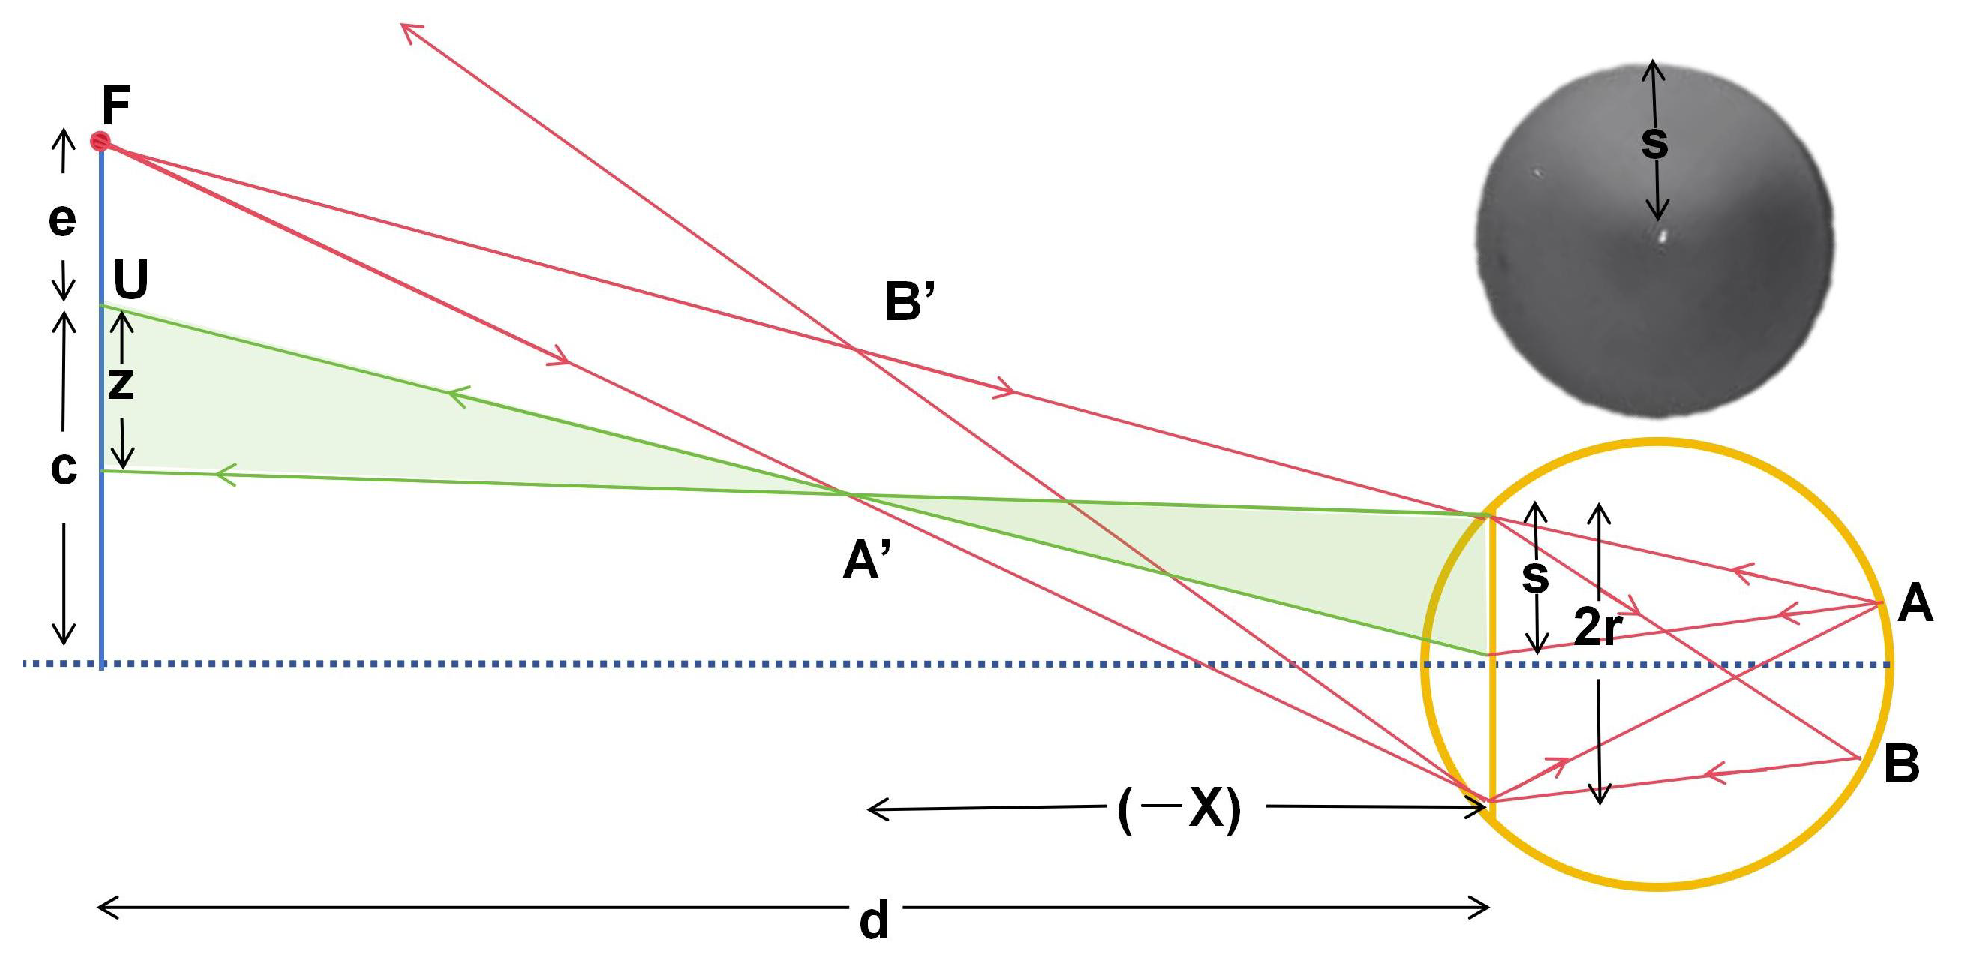
Figure 2 illustrates the principle of eccentric photorefraction for a myopic eye relative to the camera focus. This geometric relationship leads to Equation (1), which expresses refractive error, where the crescent width s, pupil diameter 2 r , eccentric distance of the flash source e, distance from the camera to the subject d, and the eye’s focusing distance x all contribute to the calculation of diopter A = 1 x , = A 1 d .
As shown in Equation (1) and Figure 2, as the defocus distance of the eye relative to the camera increases, the crescent width also increases. For hyperopia, the crescent appears on the opposite side of the light source; for myopia, it appears on the same side.
s = 2 r e d
Unlike traditional eye exams, which require subjective verbal responses, eccentric photorefraction is a noninvasive method that objectively measures the refractive error of both eyes simultaneously [11] without the need for eye drops or other invasive techniques. Agarwala et al. [12] explored the feasibility of using a microcomputer to implement a low-cost eccentric photorefraction method and showed the potential of this method in the field of vision screening.
The accuracy of refractive error measurement using eccentric photorefraction depends heavily on detecting changes in pupil brightness. This accuracy is influenced by two main factors: the precision of pupil localization and the accuracy of the brightness gradient curve extraction. Due to individual differences in pupils, low contrast in the bright and dark regions, and interference from eyelashes, eyelids, and Purkinje images, it is challenging to distinguish between different refractive states. Most existing methods use a two-stage process, where the pupil is first localized and segmented, and pixel values are extracted based on the brightness gradient along the segmented image. These data are then used to draw the grayscale change curve. After calculating the first and second derivatives of the gray value curve, the position of the abrupt change in the gray value of the pupil along the direction of brightness change is identified. The actual height of the dark area in the pupil is then obtained by conversion and substituted into Equation (1) to calculate the refractive errors of the human eye. In a single-stage related study, these data are used to train neural networks.
Chun et al. [13] developed an automated deep learning-based system that predicts refractive error ranges using eccentric photorefraction images captured by smartphones, assisting in early amblyopia screening. They categorized refractive errors into seven classes, achieving an overall accuracy of 81.6%. Fu et al. [14] proposed a refractive error detection framework that combines pretrained CNN features with active learning, reducing reliance on handcrafted features and large-scale annotations. Their method achieved an accuracy of 81.98% in a binary classification task and an MAE of 0.653 in a regression task. Yang et al. [15] introduced pupil images under different levels of eccentric LED illumination into a deep neural network, avoiding the complexity of traditional slope calculations. Their model achieved a mean squared error of ±0.9 D in predicting refractive errors, demonstrating feasibility even with a small dataset.
To improve the efficiency and accuracy of refractive error detection, Xu et al. [16] proposed a deep learning model, REDNet, which integrates CNNs and RNNs to predict refractive errors from multi-directional eccentric photorefraction images. Their model achieved an accuracy of 89.50% and an MAE of 0.174 D on their self-constructed dataset. Linde et al. [17] extracted infrared and color images of the pupil crescent from eccentric photorefraction images and trained different convolutional neural networks to predict refractive errors. The best-performing model achieved an overall spherical refractive error prediction accuracy of 75%. Although the model’s performance was not outstanding, their approach demonstrated good feasibility in estimating refractive errors using red-reflection images.
The datasets used in these studies typically contained only 300 to 500 samples or involved repeated data collection from a small group of individuals. Consequently, the lack of a labeled real-human-eye refractive error dataset has become a major obstacle to the advancement of these methods. The distribution of refractive error images is uneven, with particularly scarce data for high-diopter hyperopia. Manual collection of eccentric photorefraction pupil images requires significant labor costs and raises personal biometric security concerns. Moreover, due to individual variations in pupil characteristics and unclear bright-region boundaries, even professional ophthalmologists find it complex and time-consuming to directly calculate refractive errors from eccentric photorefraction images. Additionally, no publicly available datasets of eccentric infrared pupil images exist for research. Therefore, we developed a method to simulate eccentric photorefraction pupil images for various refractive errors using model-eye images, as detailed in Section 2.3.
Furthermore, due to the large intra-class variation and small inter-class differences in this type of data, the small bright crescent area in the images is difficult for deep neural networks to recognize. Theoretically, refractive error prediction relies on the ratio of global to local features, where even a few pixel changes can lead to significant prediction deviations. However, current studies have not specifically addressed distinguishing these fine-grained features. Therefore, research on AI algorithms for refractive error measurement remains insufficient. There is significant potential for exploring adaptive and accurate neural network architectures for refractive error measurement based on eccentric photorefraction images.

1.2.2. Simulated Data

With the advent of big data, large volumes of accurately labeled data have driven significant advances in deep learning across various computer vision tasks [18]. In the field of medical imaging, it is necessary for specialized doctors to annotate the data, making it very difficult to obtain relevant data [19,20]. Model-eye datasets offer a solution, reducing human involvement and preventing data collection issues. As a result, simulated data has the potential to train powerful neural networks while significantly lowering overall costs. Building an eccentric photorefraction pupil dataset that includes a range of refractive powers requires extensive manual collection and meticulous work.
To address data scarcity, simulated data have gained widespread attention, with some researchers using virtual data to train neural networks to solve real-world problems [21]. For instance, Nair et al. [22] used computer graphics rendering to automatically generate large annotated eye datasets for training eye-tracking neural networks. Liu et al. [23] used a rigid transformation AVN intersection synthesis method to create a dataset of retinal images, achieving excellent results on real-world data.
Despite the promise of simulated data, a major challenge lies in the “reality gap” or mismatch between simulated data generated in simulated environments (e.g., model-eye images) and real-world data (e.g., real-eye images). This mismatch, known as the sim2real problem [24], stems from domain gaps or shifts in data distribution that violate the independent and identically distributed (i.i.d.) assumptions underlying most machine learning. To bridge the gap between simulated and real-world data, transfer learning and image translation techniques have been employed [25].

1.2.3. Transfer Learning

In deep learning, transfer learning leverages a model trained on a related but different dataset or task to achieve better performance on the target dataset and task [26]. The emergence of ImageNet-21K pretrained models has significantly benefited various models, involving numerous datasets and tasks [27]. ImageNet is also an excellent choice for medical imaging, although pretraining on medical data holds enormous potential [28]. Combining synthetic data with transfer learning is an emerging research direction. Customizing synthetic pretraining data for specific downstream tasks can optimize performance [29]. In predicting real eye refractive errors, particularly in transitioning from model-eye data to real-eye data, transfer learning proves to be a valuable approach.

2. Materials and Methods

2.1. Framework of the Online Refractive Error Screening System

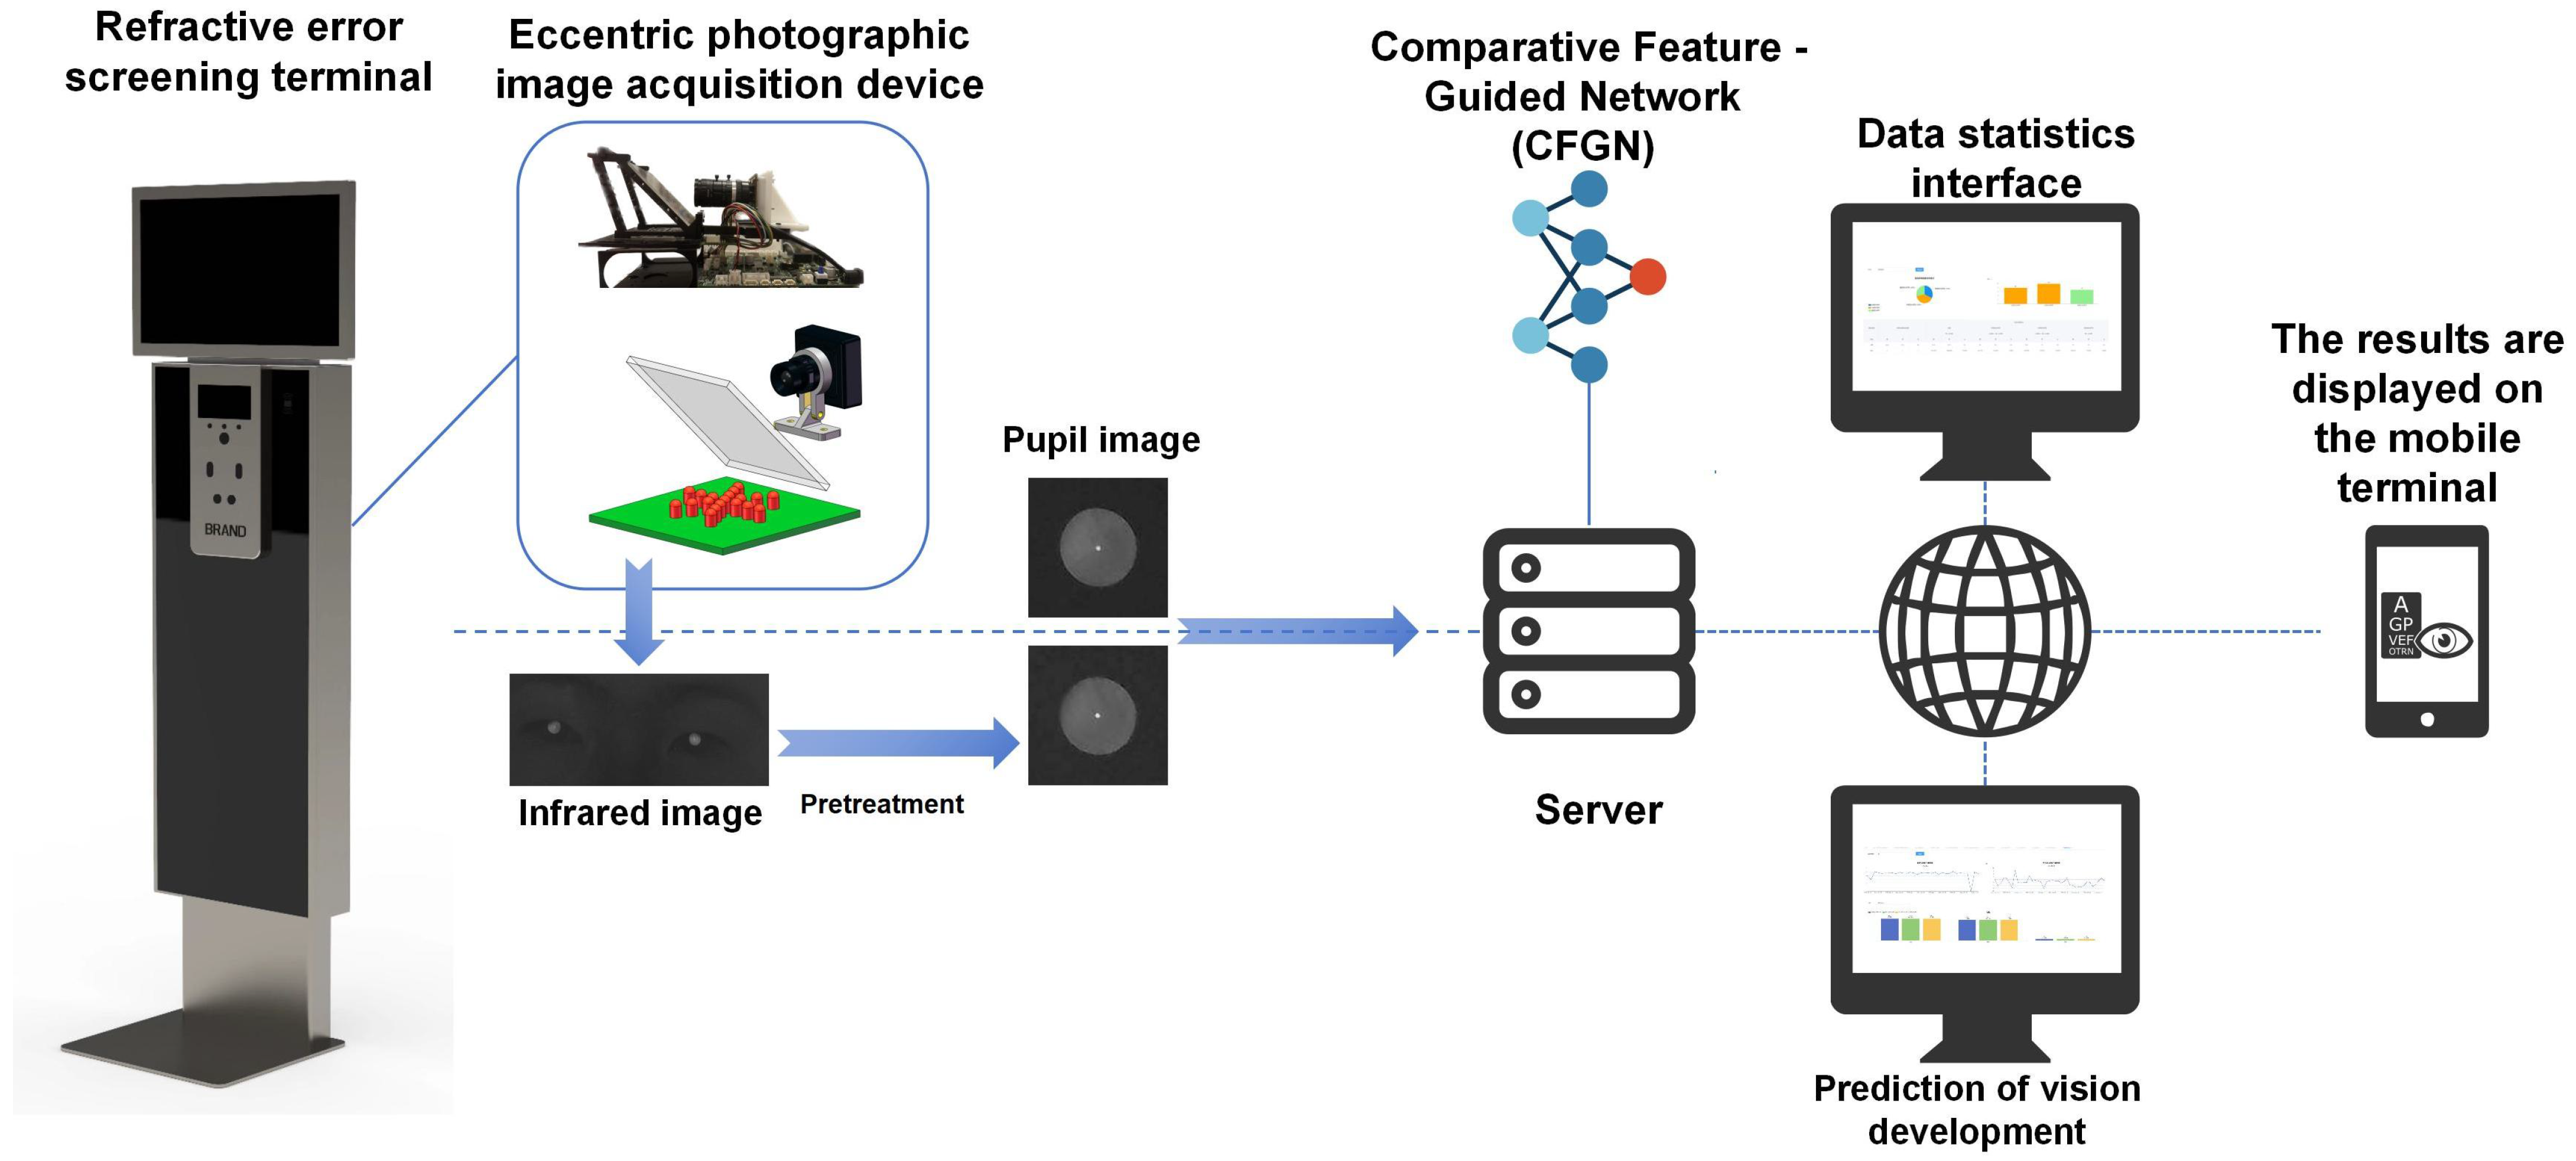
Figure 3 shows the overall framework of the proposed online refractive error screening system. It is divided into three main stages as follows:
First, after logging into the personal profile via facial recognition technology, eccentric photorefraction infrared images of the individuals being screened are collected by the refractive error screening terminal. The collected images are then transmitted to a data server via the cloud or stored locally to provide more data usage options. For instance, some data can be manually labeled and used for local model training with CFGN, but this requires a large amount of data. In the framework we propose, it is best to use cloud computing services to perform refractive error calculations on the uploaded image data to reduce the burden of file storage and computational resource usage. At the same time, the model-eye pretrained model deployed on the cloud can increase screening accuracy in small-sample scenarios. Fine-tuning the pretrained model with a small amount of locally collected data reduces data requirements, and uploading data from different regions simultaneously can improve data diversity and enhance model generalization. Finally, the screening results are transmitted to the individual or the parent’s computer or mobile phone to view the results.
Overall, doctors, schools, and healthcare institutions can access the vision screening platform through devices such as computers, mobile phones, and laptops. The platform is divided into a screening interface and a statistical analysis interface. In the screening interface, experts can choose between training or prediction options. In the training option, experts can train their personalized prediction model with data they have collected, and they can choose whether or not to use the model-eye pretrained model and transfer learning methods. In the prediction option, experts can upload their personal data to use existing models for refractive error screening tasks.
Doctors and schools can access the statistical analysis interface to understand the vision status of local children and adolescents and take timely countermeasures. Parents and students can access their vision health records through a personal vision health app, which connects to the electronic health record database. This allows them to check screening results, track vision status and trends, and receive early intervention and treatment if necessary.

2.2. Proposed Methodology

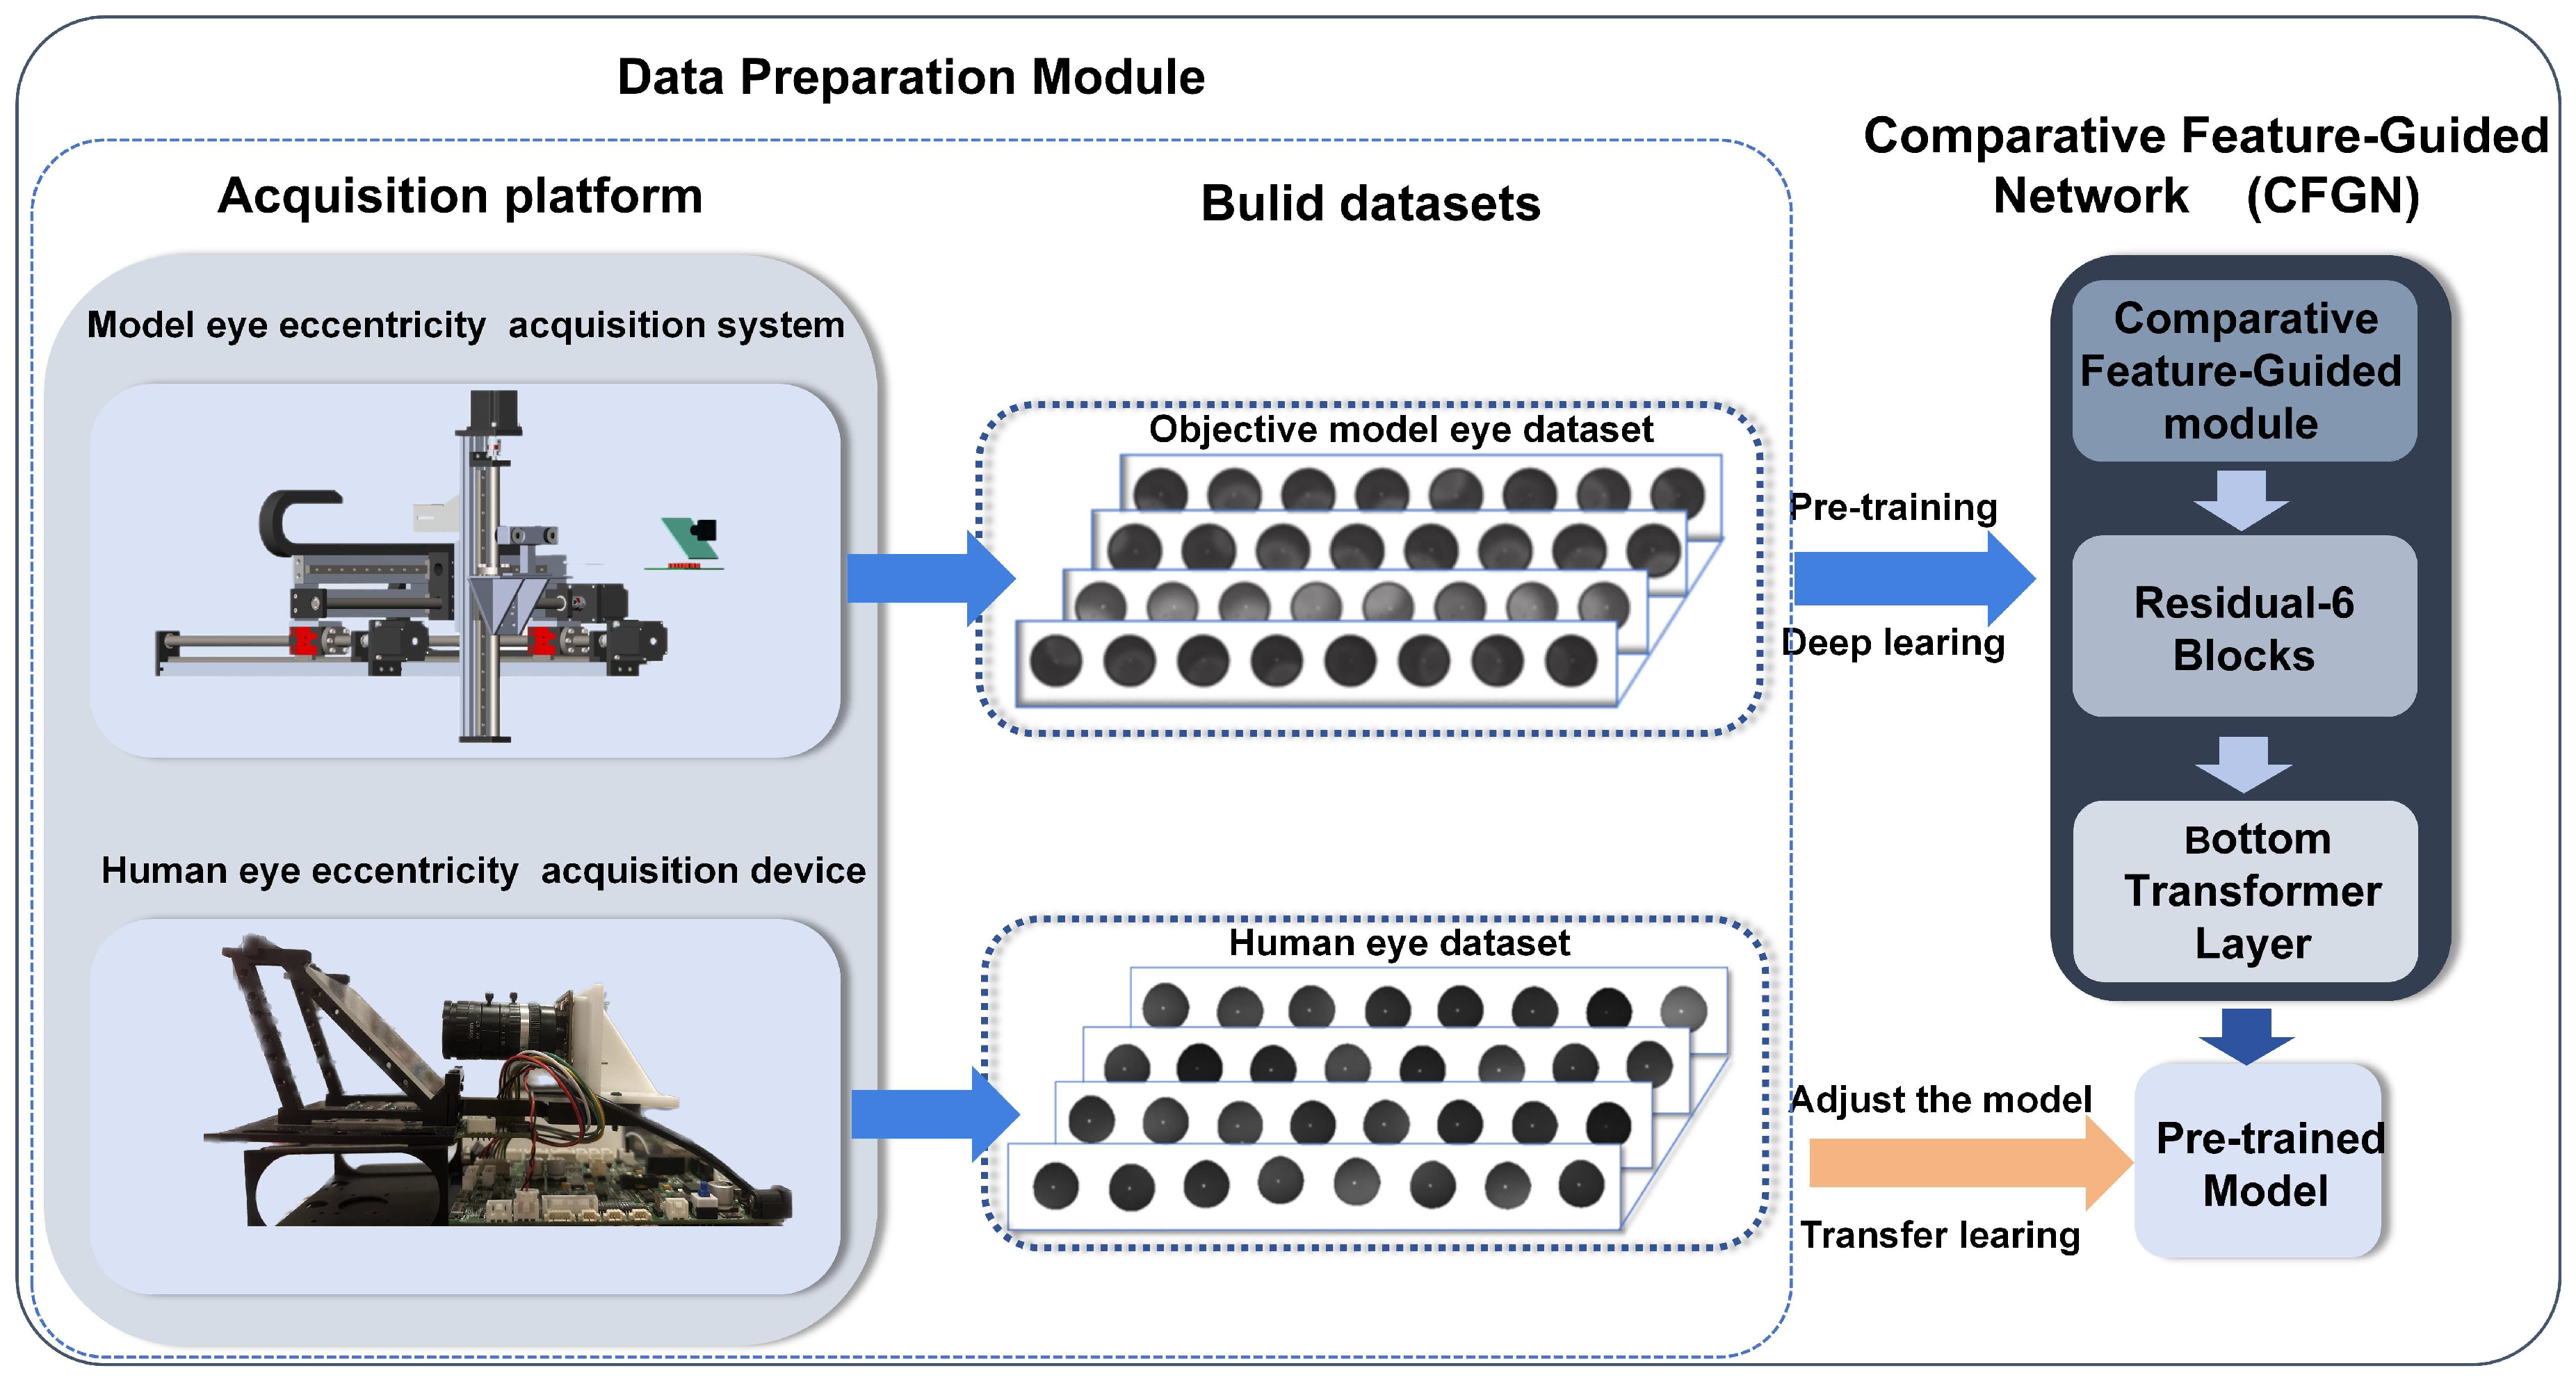
As shown in Figure 4, the proposed method in this paper consists of two core modules: the data acquisition module and the CFGN network for refractive error screening.
In the data acquisition module, we efficiently acquired a large number of high-quality eccentric infrared images of model eyes using an in-house developed automated acquisition system, and based on these data, we constructed a model-eye pretrained model. The design of this module not only solves the complex and time-consuming data annotation problem inherent in traditional methods but also provides rich annotated data support for subsequent model training. At the same time, some real-eye data were also collected.
The CFGN network, as the core screening module, aims to extract similar features between model eyes and real eyes under the same refractive error conditions. Through multi-channel feature extraction and fusion mechanisms, the Comparative Feature-Guided Module, CFGN, effectively captures the common features between the two types of data, thereby enhancing the accuracy of refractive error screening.
The following sections will provide a detailed introduction to the implementation of the data acquisition module and the design details of the CFGN network architecture.

2.3. Data Acquisition Module

2.3.1. Image Acquisition Device

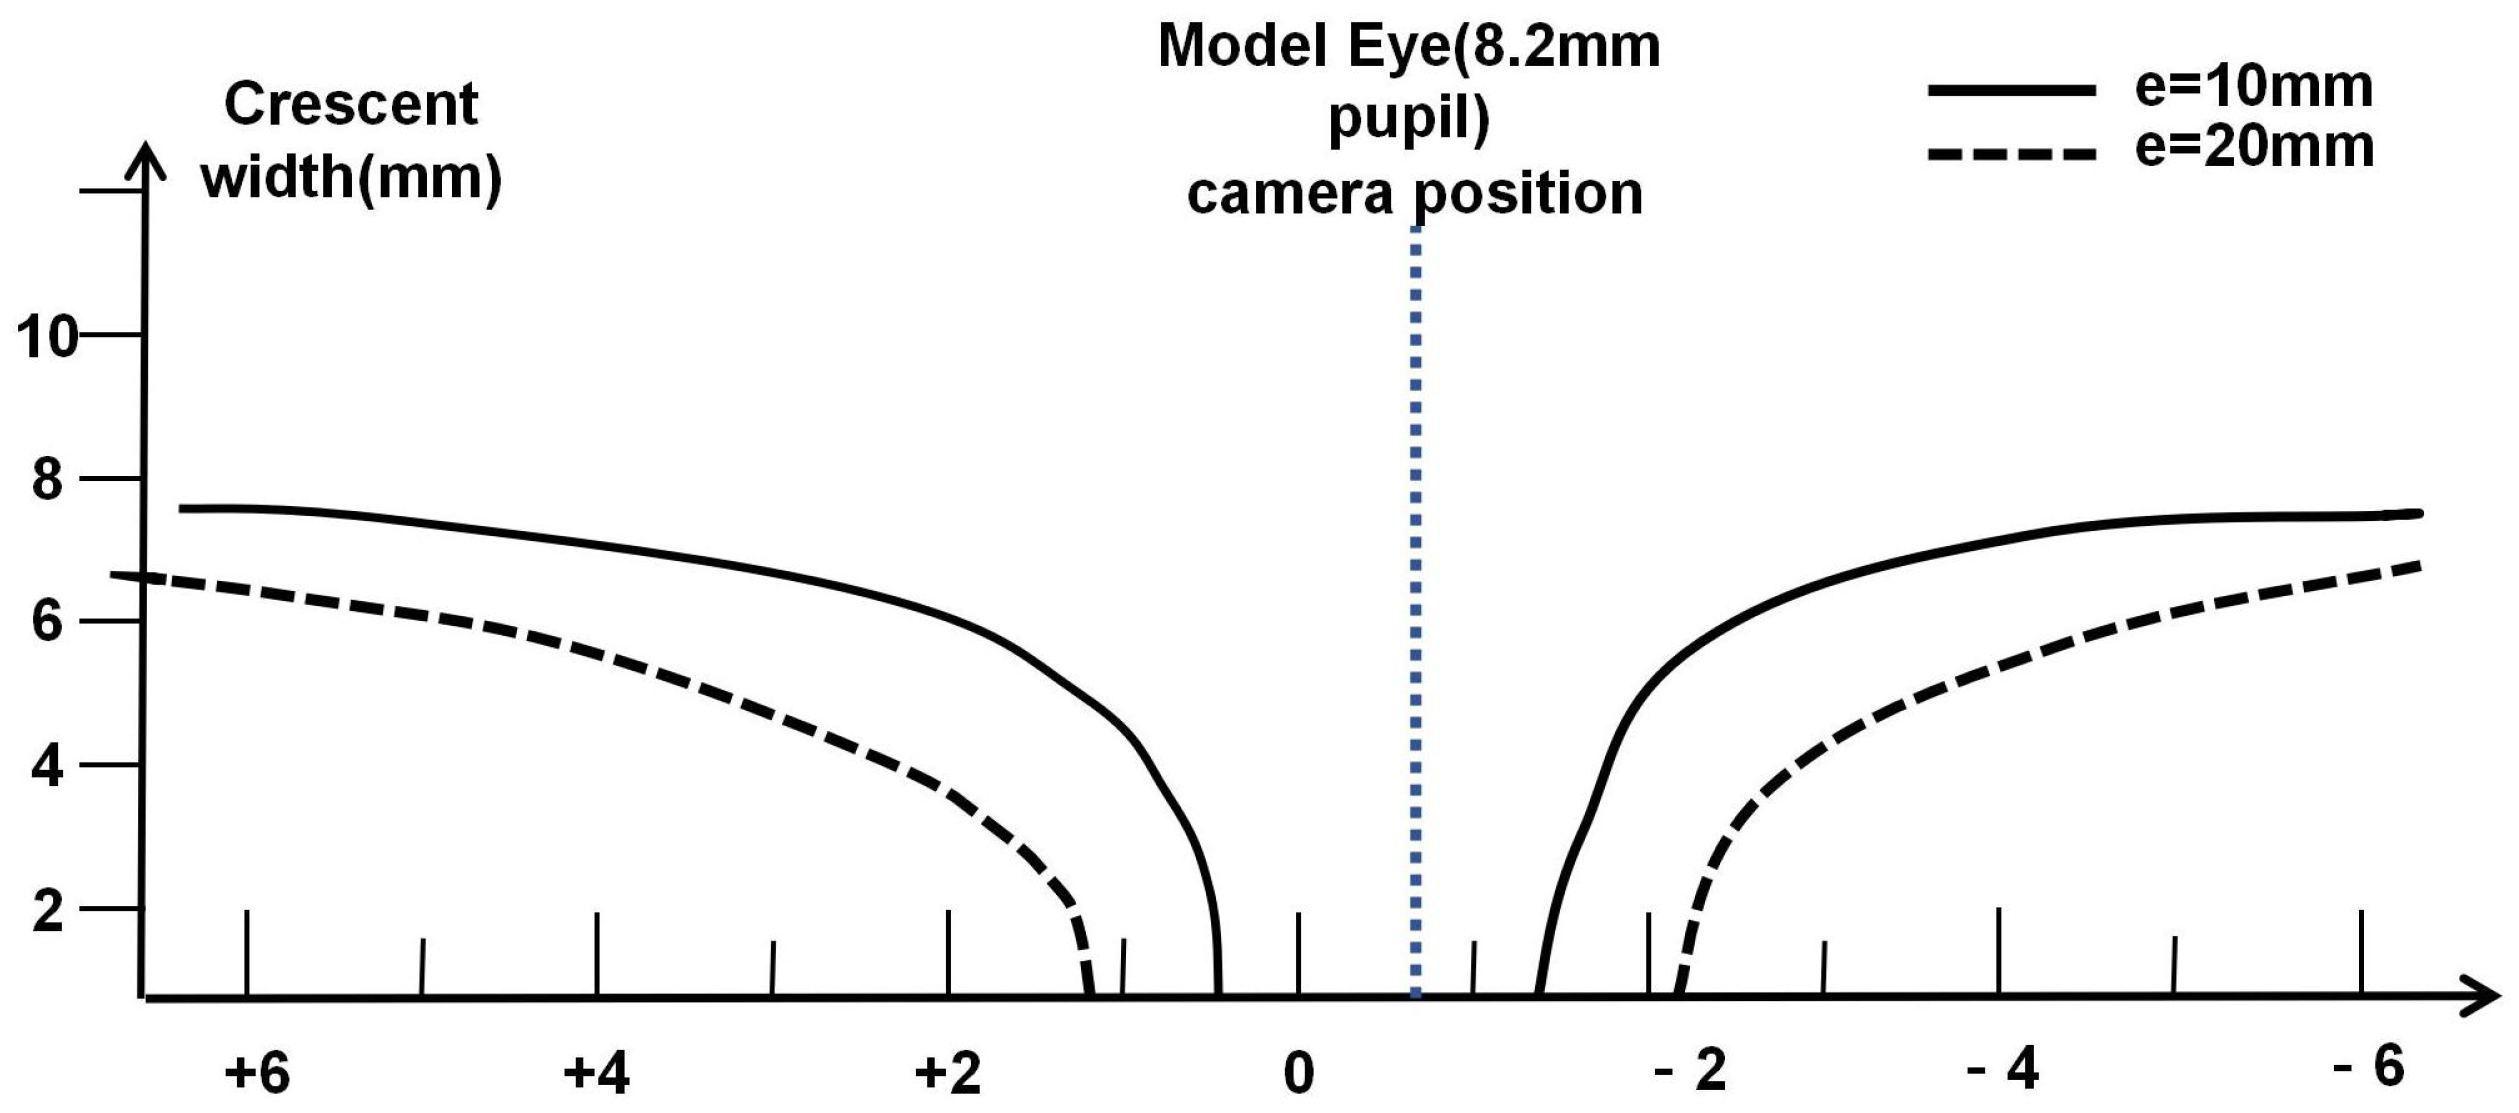
Figure 5 shows the theoretical data for the crescent-shaped bright area generated by the model eye under infrared illumination at two eccentric positions. Adjusting the eccentricity of the light source can modify the range of refractive error that this steep change region covers [10].
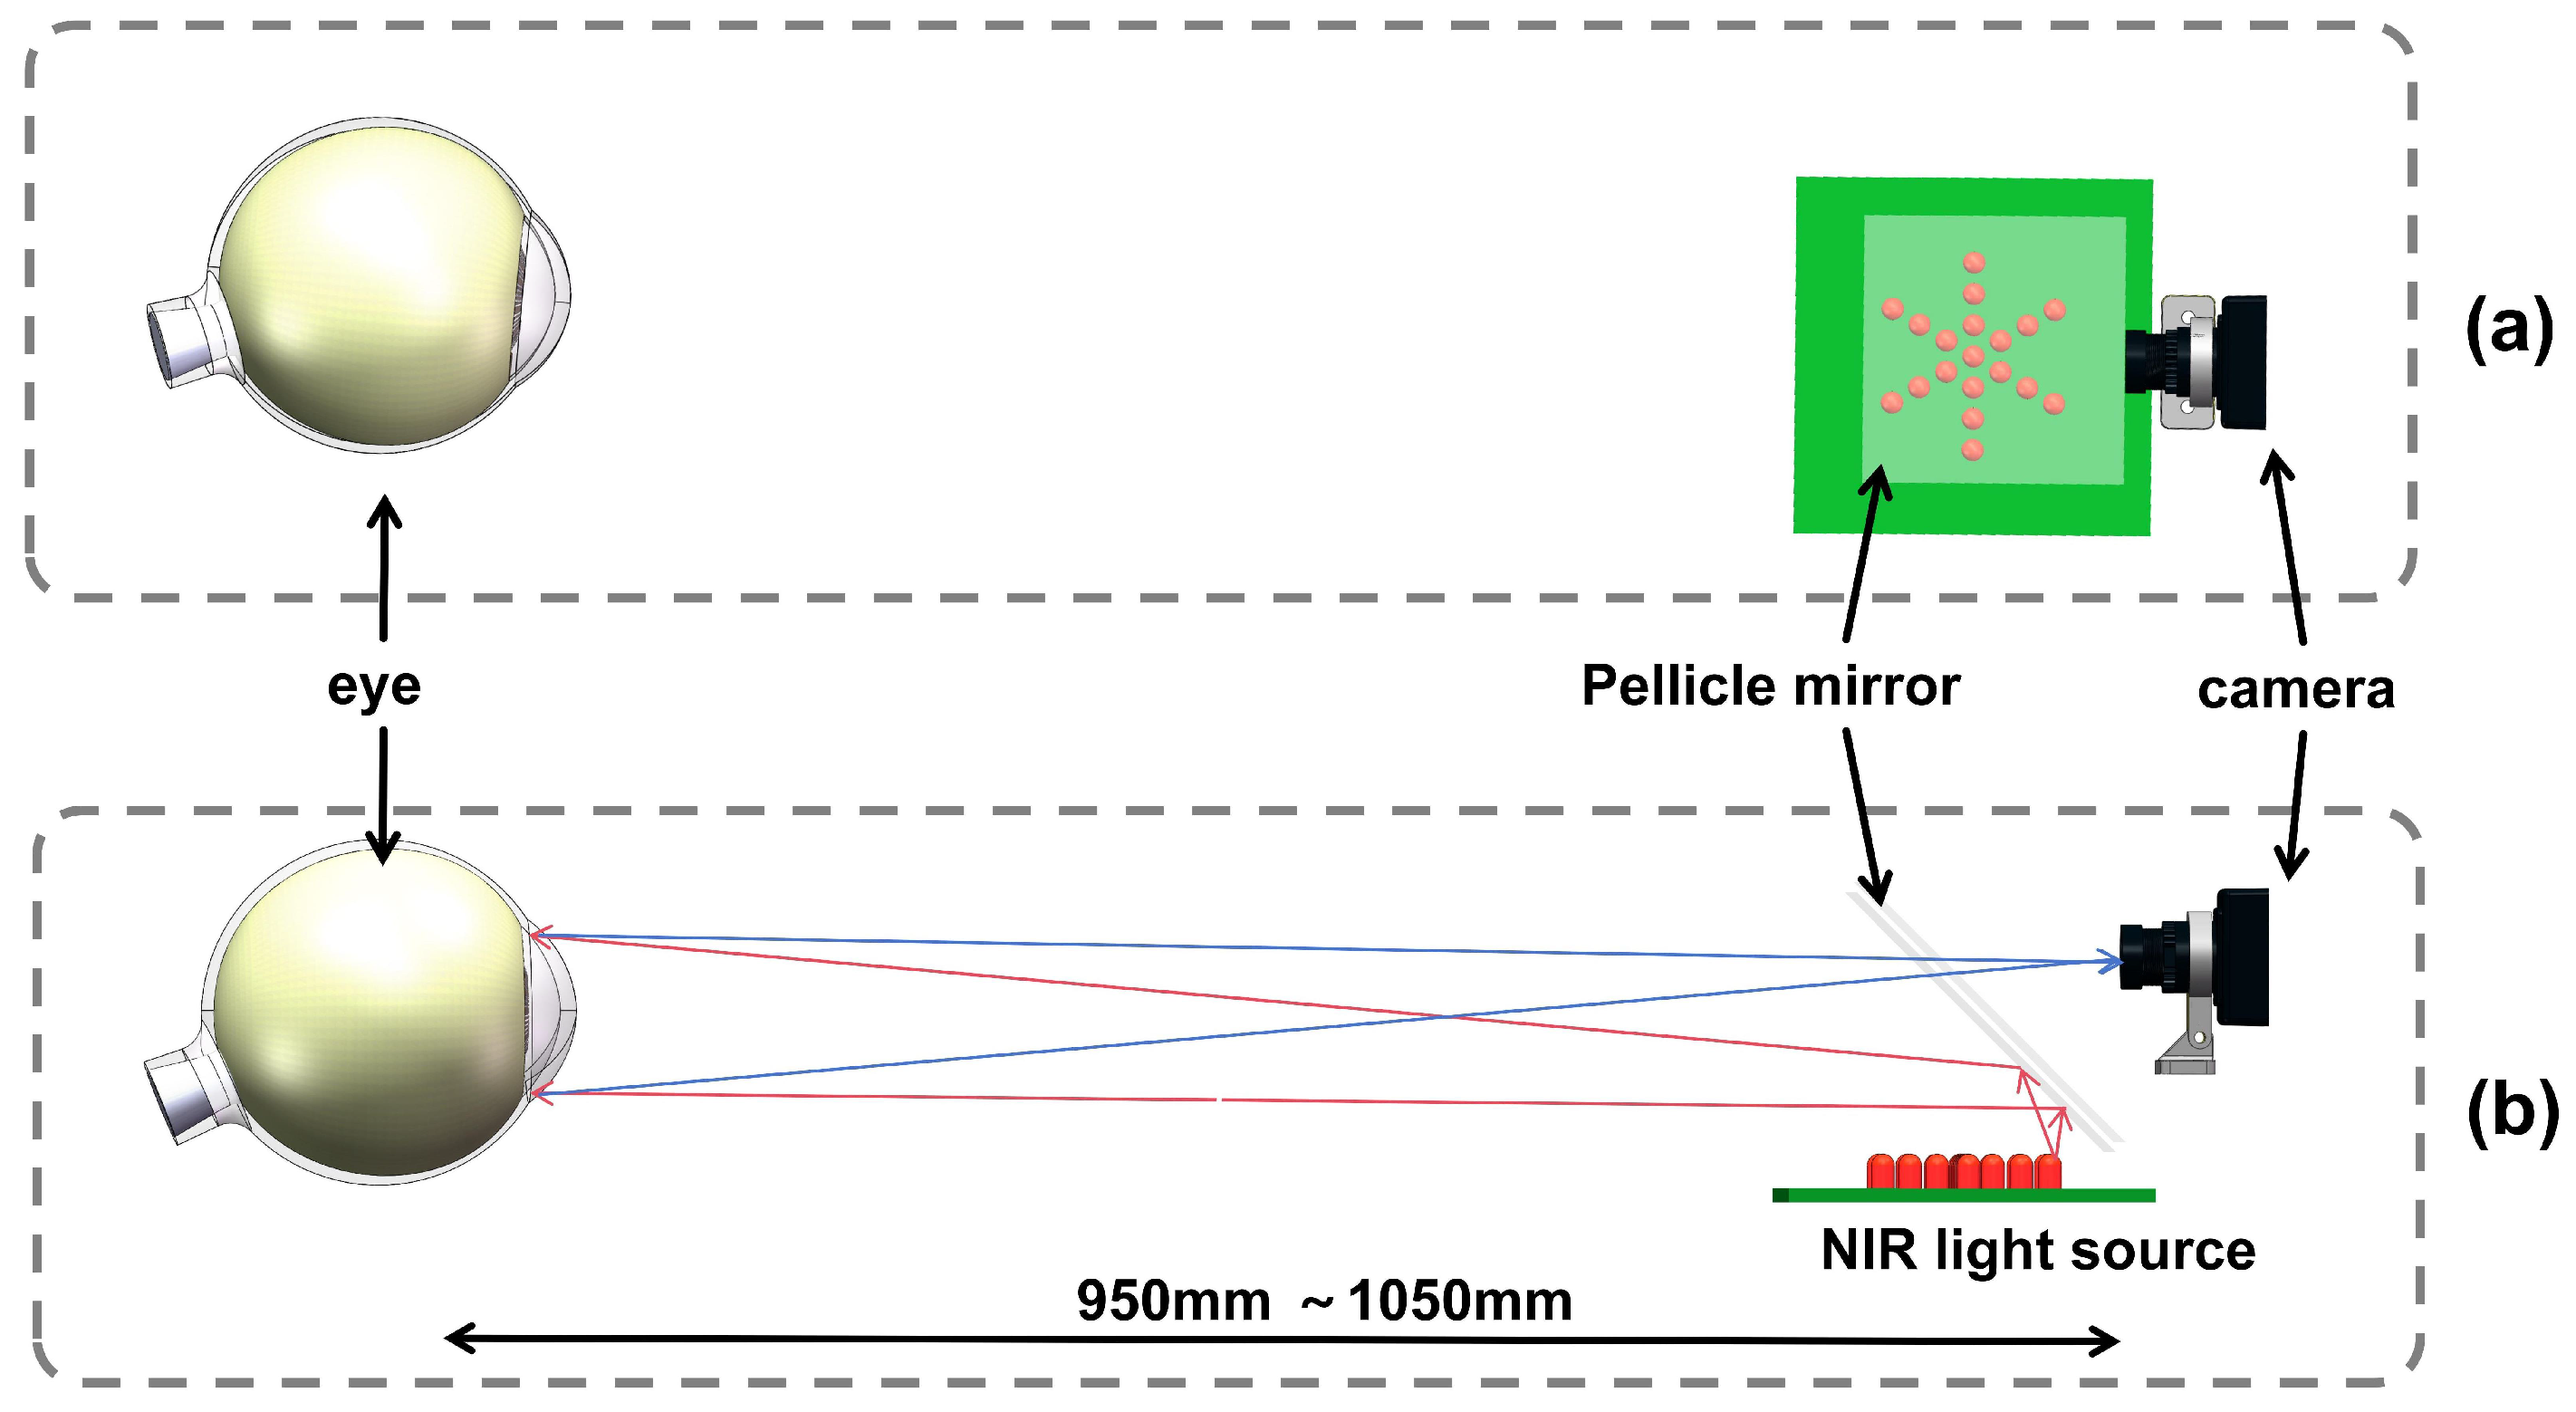
The original eccentric photorefraction method used white light as the light source, leading to significant image errors. The infrared eccentric photorefraction method improves on traditional photorefraction instruments by using infrared LEDs as the light source. To obtain better pupil responses under light stimulation, this method employs an array of multiple infrared LEDs. As shown in Figure 6, simultaneous illumination from multiple LEDs increases light intensity. Since near-infrared light causes minimal eye stimulation, subjects typically do not perceive the measurement process, making infrared light more suitable for eccentric photorefraction.
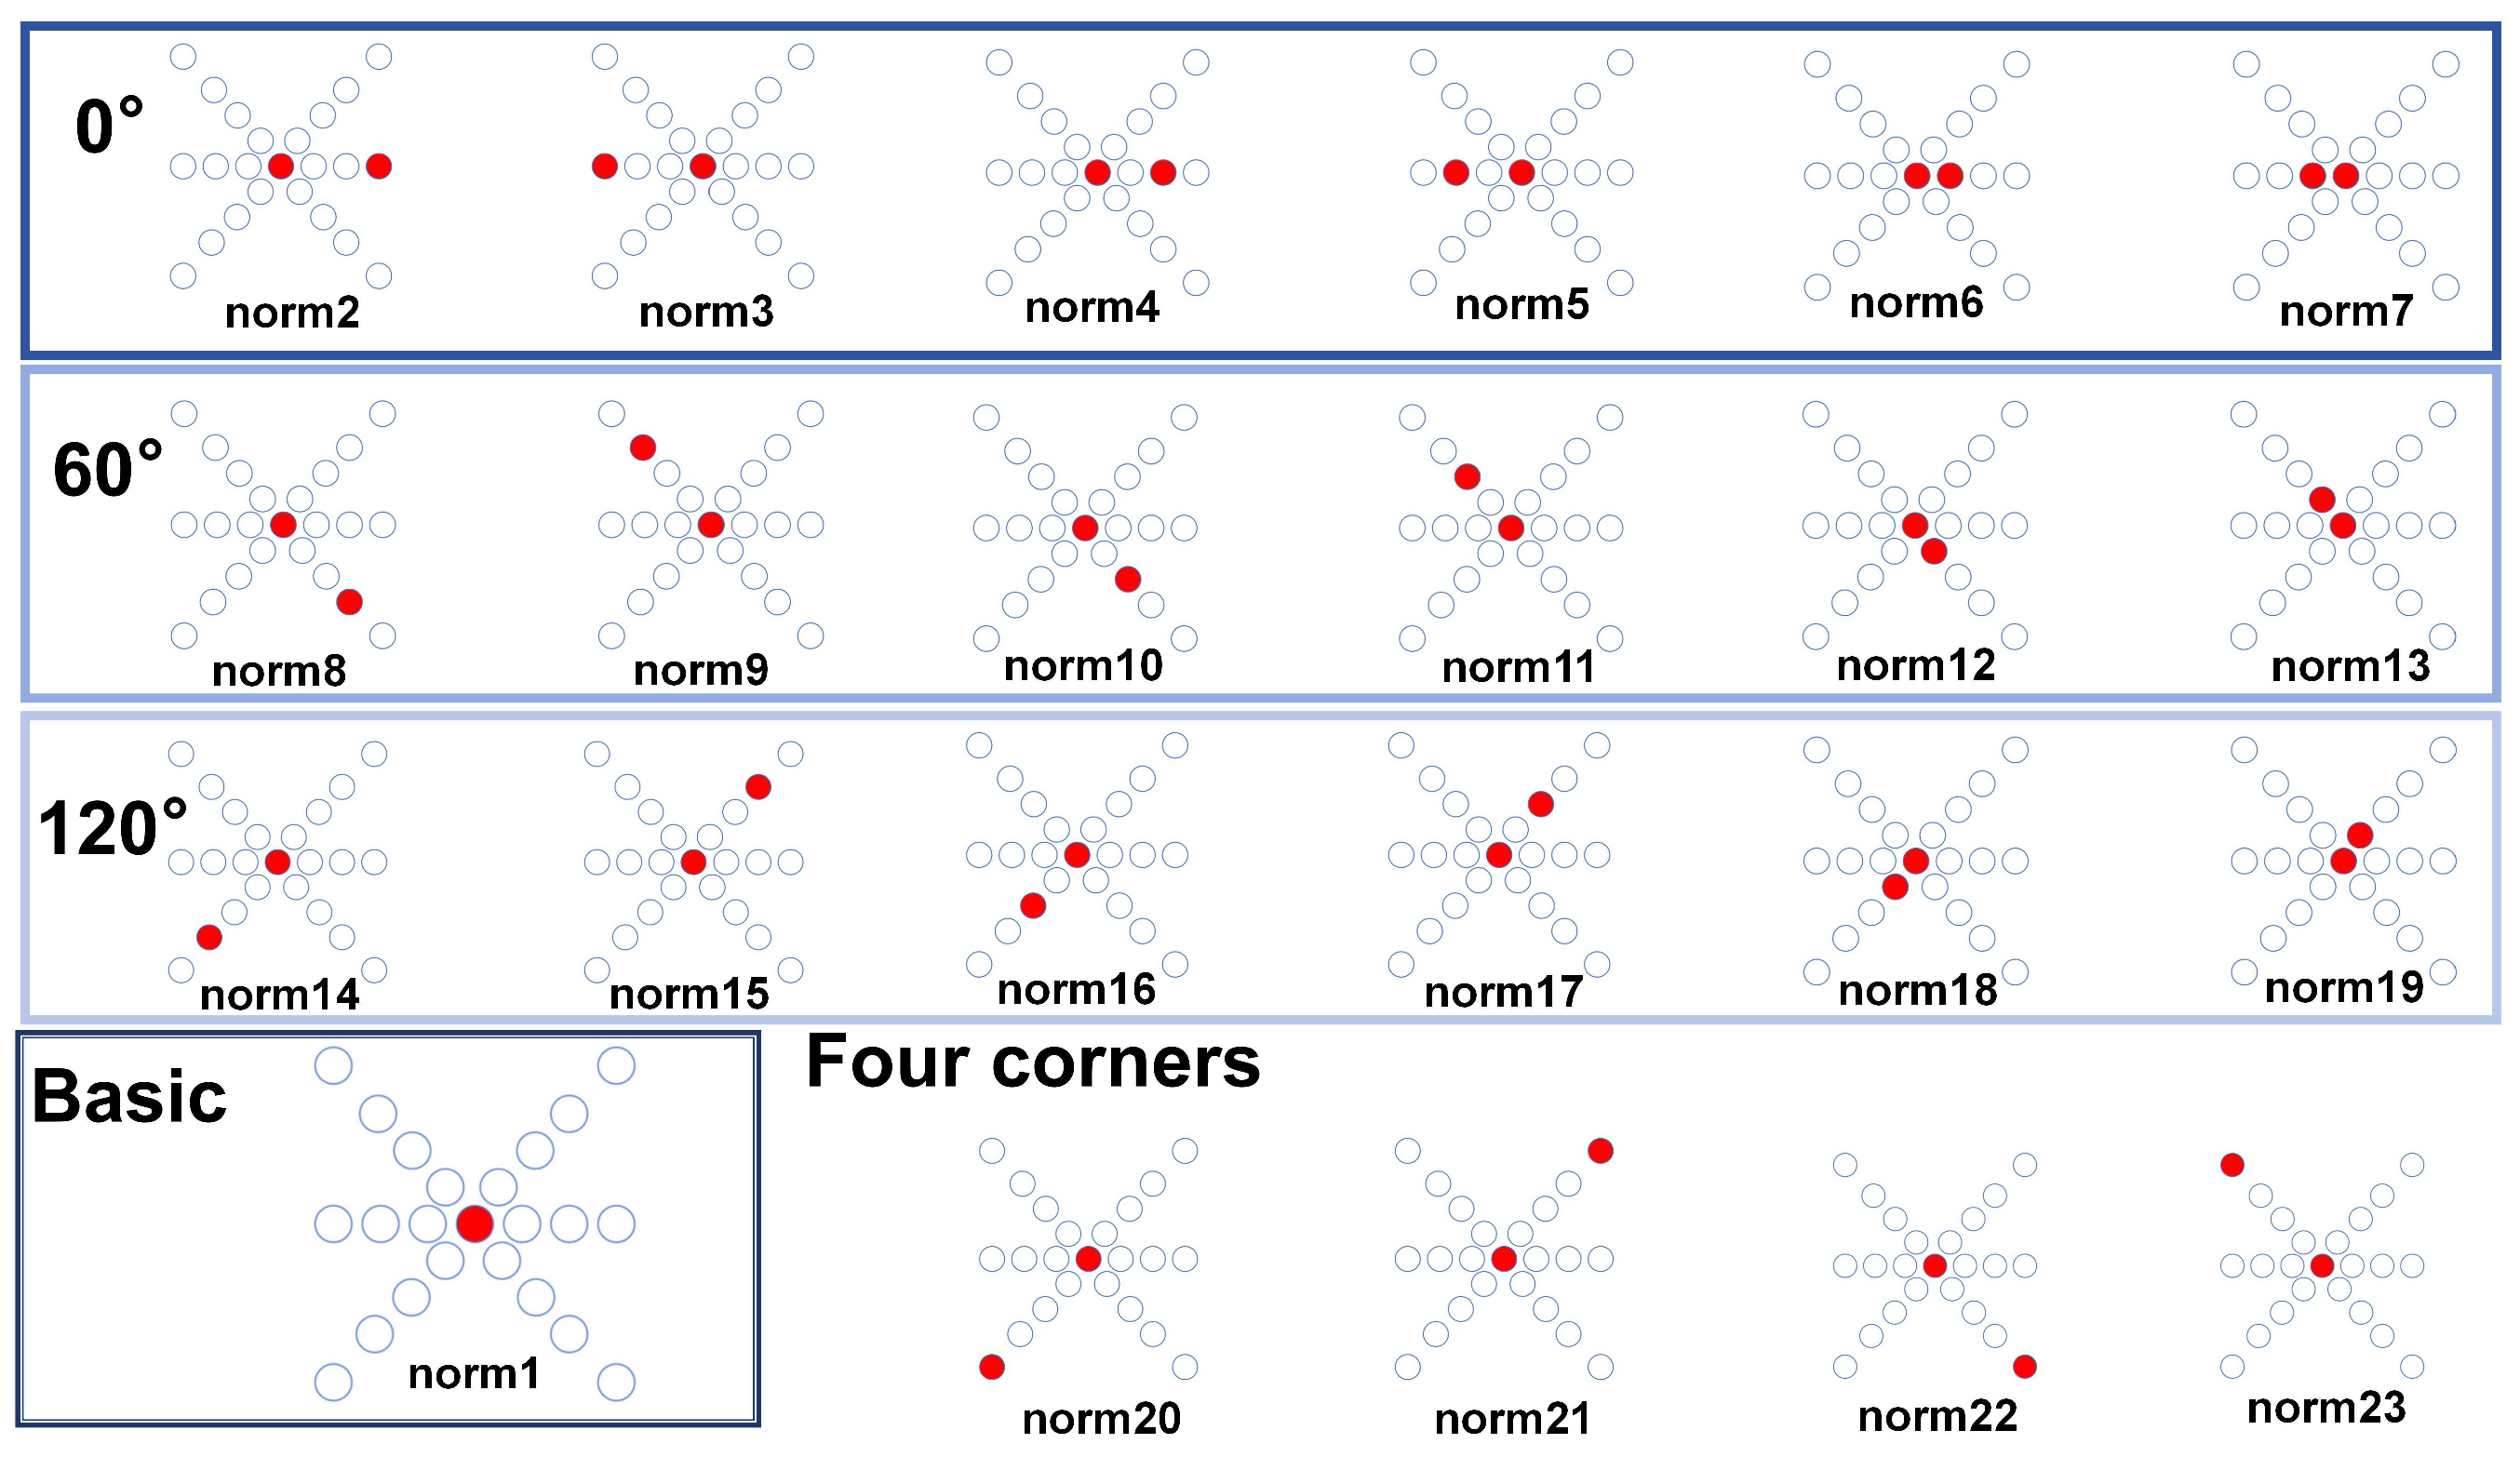
As shown in Figure 5, different eccentric light sources have varying measurement ranges and sensitive regions. Therefore, we capture infrared images of a model eye from 1 to 23 eccentric light source positions (a total of 22 eccentric light modes) to obtain the same-ring light source position characteristics and different-ring light source temporal characteristics of the model eyes.
In Figure 7, the basic mode image serves as a reference image, containing pupil information without eccentric light illumination. To ensure sufficient information while reducing training costs, we selected six grayscale images captured under five different lighting modes and basic modes to form a dataset with six channels of information.

2.3.2. Objective Model Eye

Eccentric photorefraction utilizes the optical characteristics of the human eye to measure refractive errors. As shown in Figure 8, the objective model eye is made of high-quality optical glass, with a polished spherical surface of an 8 mm radius of curvature (simulating the human cornea) on the front and a frosted flat surface (simulating the human retina) on the back. The frosted surface is coated with special materials to simulate the human eye’s macula. Therefore, the eccentric infrared images captured with this objective model eye exhibit similar pupil light intensity distribution characteristics to real human eyes.
We created model eyes with diopters of 0 D, ±1 D, ±1.5 D, ±2 D, ±2.5 D, ±3 D, ±3.5 D, ±4 D, −4.5 D, ±5 D, and ±6 D, totaling 20 diopters, which were calibrated using an automatic refractometer. Pupils of different diameters can be simulated by varying the aperture diameter.

2.3.3. Model-Eye Eccentricity Infrared Image Acquisition System

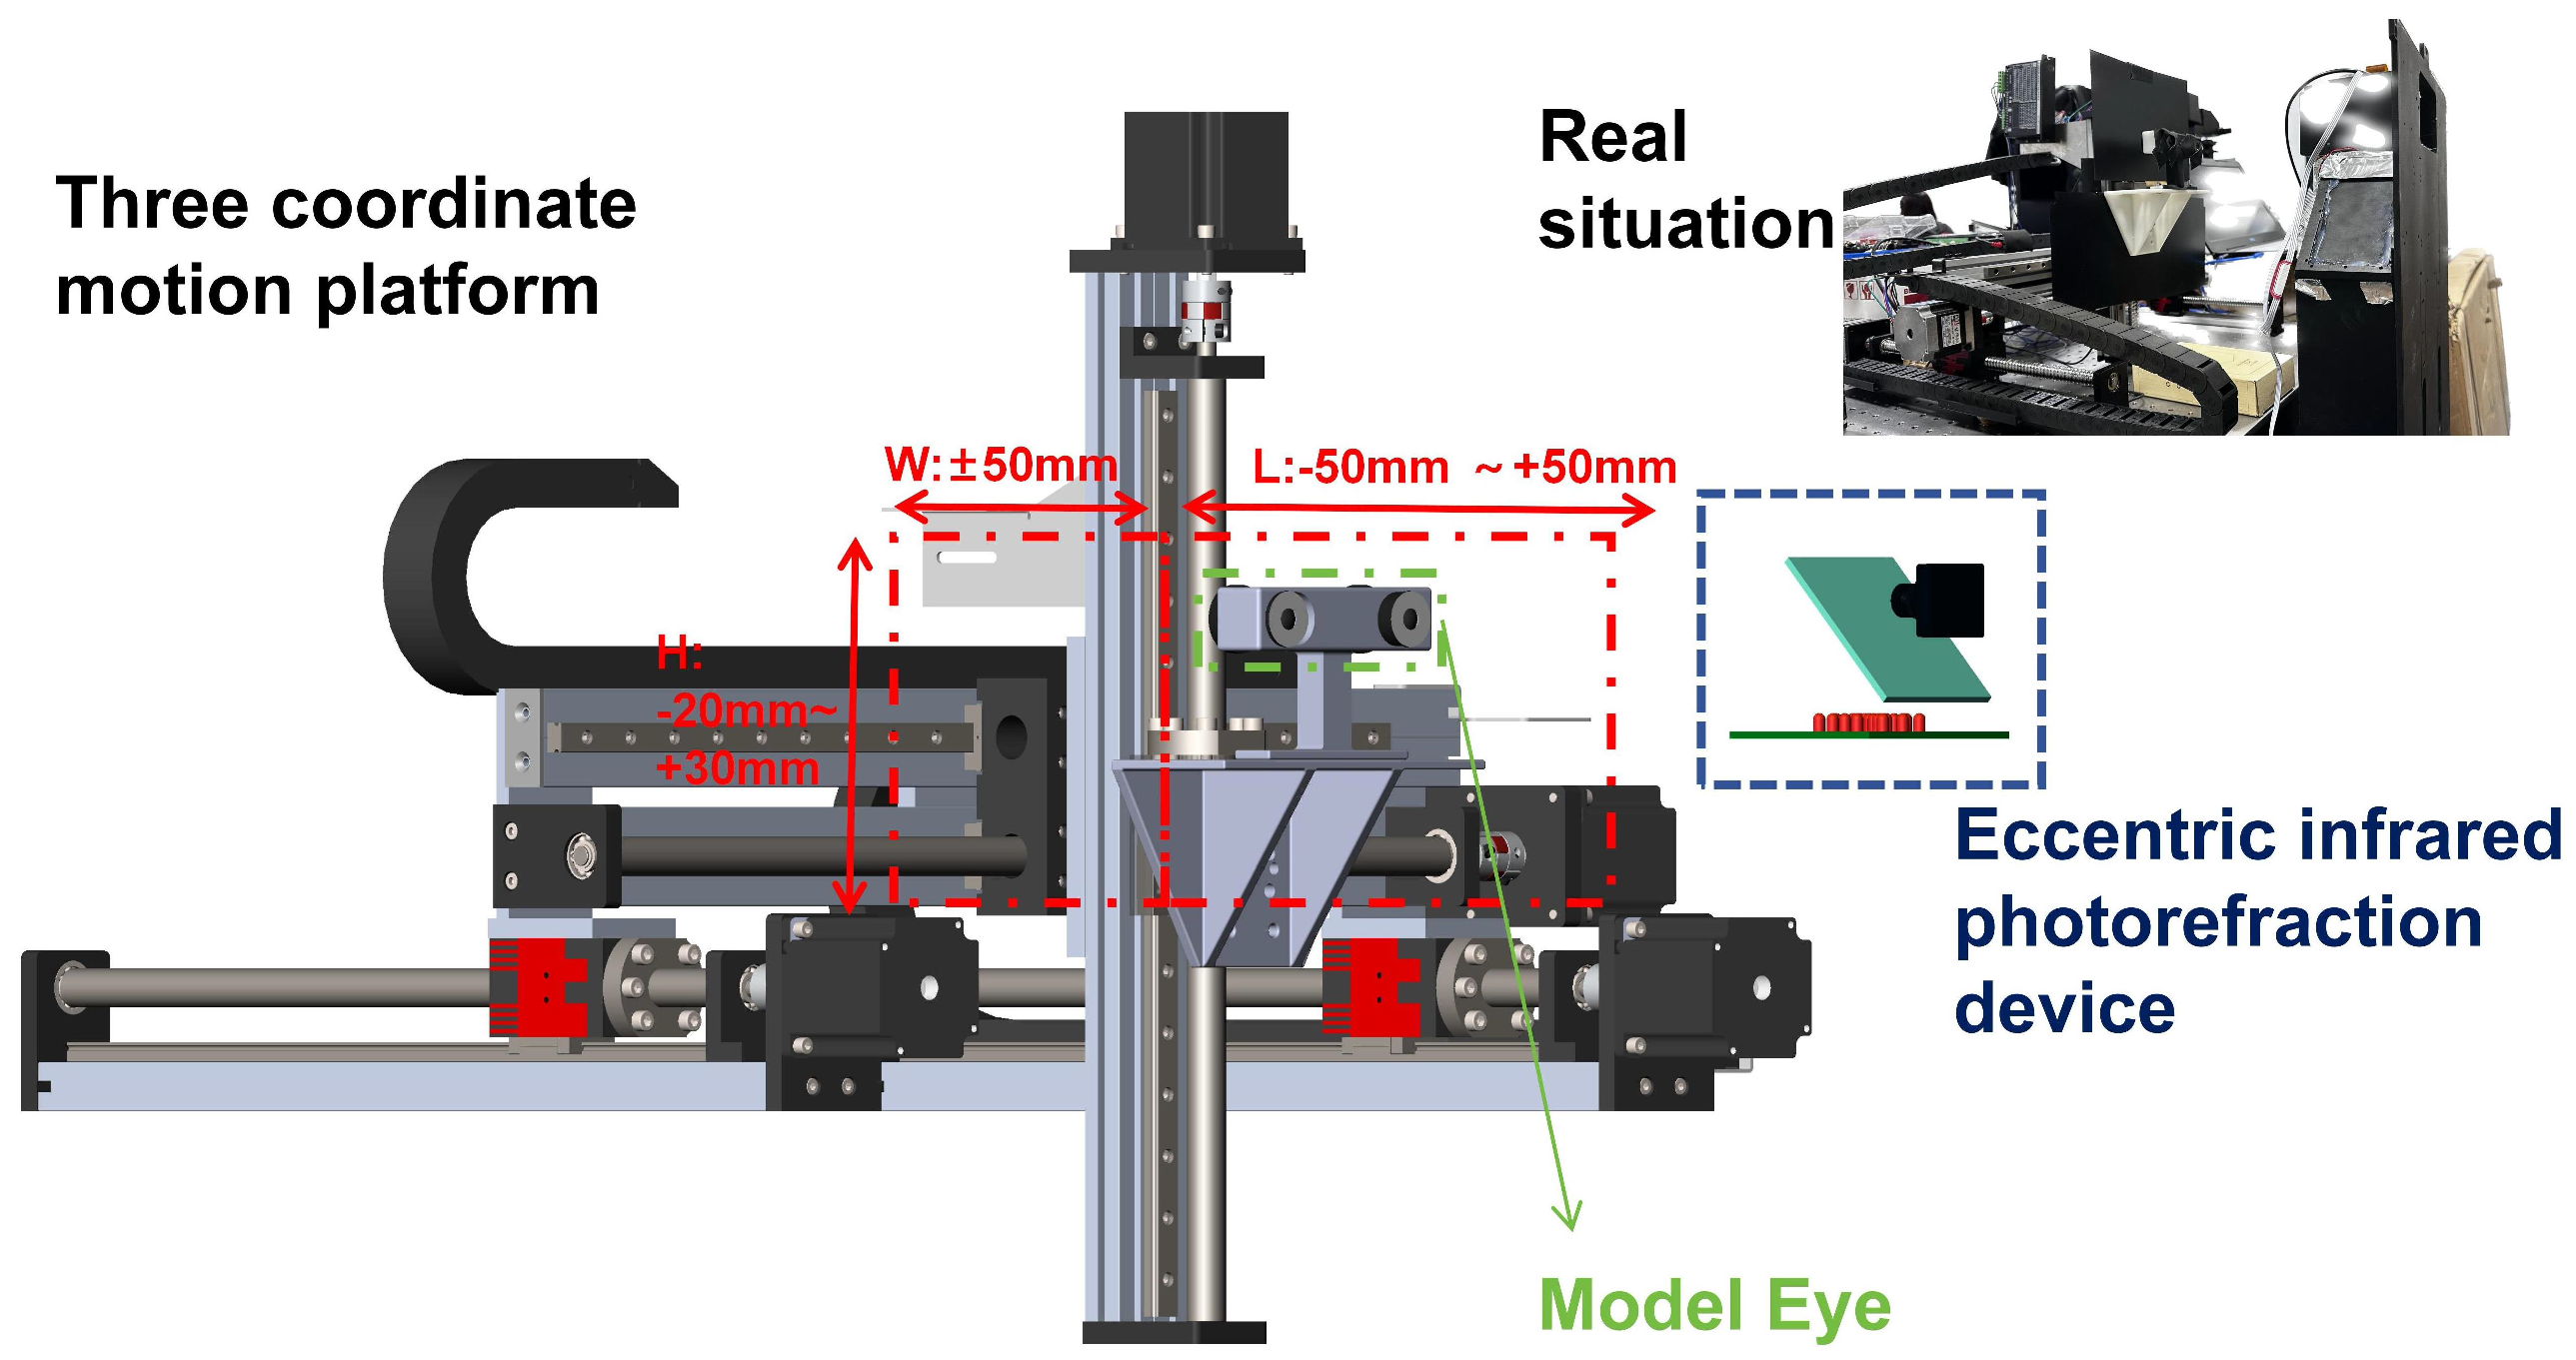
During eccentric photorefraction, it is difficult for human eyes to maintain an exact position relative to the camera aperture. According to Equation (1), the relative position distance affects the accuracy of refractive error measurement. Therefore, we designed a 3D coordinate motion platform to mount the model eye and move it within a 3D space relative to the camera, covering the ranges of y: [950 mm, 1050 mm], x: [−50 mm, 50 mm], and z: [−20 mm, 30 mm]. Figure 9 illustrates this process in detail.
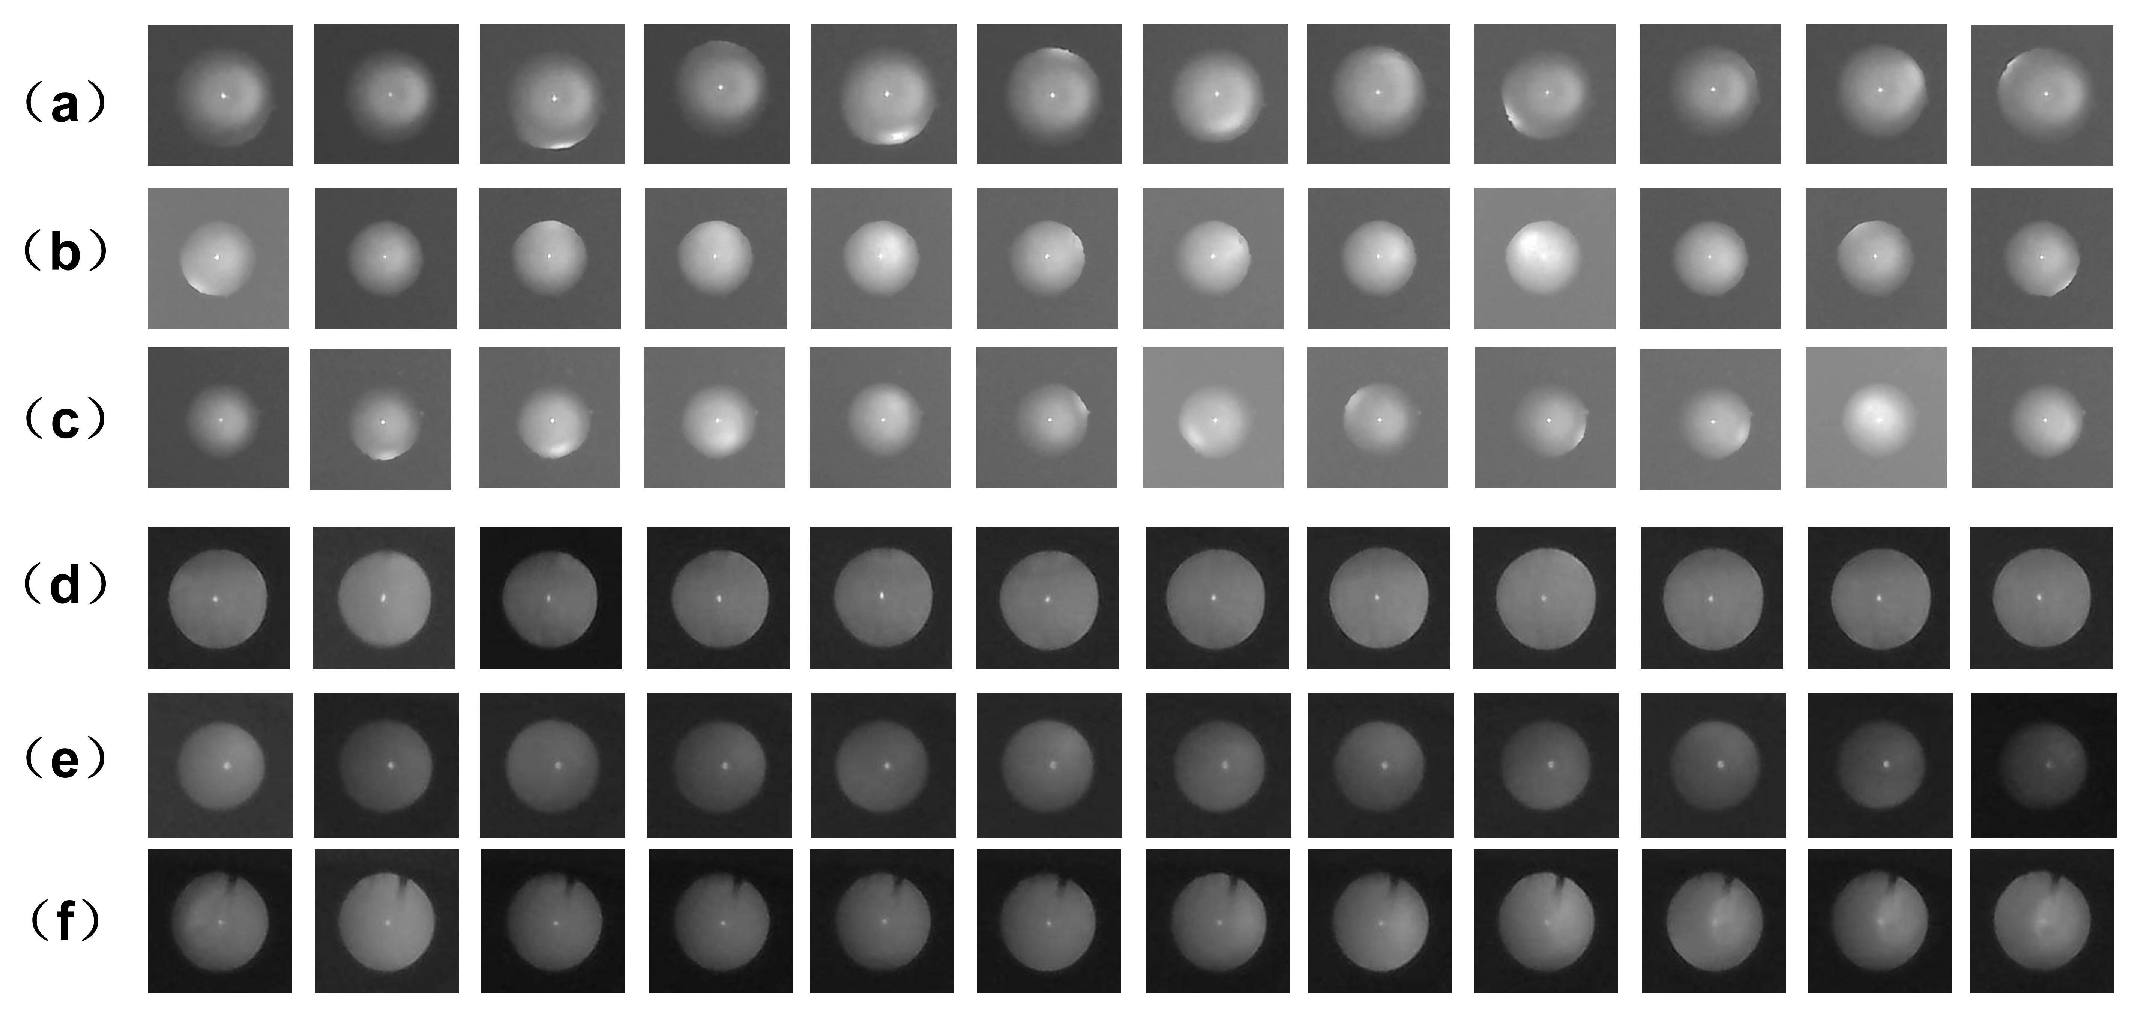
As shown in Figure 10, there is a significant difference between the eccentric infrared images of real eyes and model eyes. They share similar light intensity distributions under eccentric light illumination, but the model eyes are more distinct.
This implies that we need to design a method that preserves the prominent bright-region features in the model-eye images while avoiding the noise that may be indistinguishable between model- and real-eye images. This noise affects the model’s performance when tested on real data after being trained on simulated data. To mitigate this impact, this study fine-tunes the model-eye pretrained model using real-human-eye data. This transfer learning approach transfers the features learned from the model-eye domain to the real-human-eye domain, thereby improving the performance of the target task.

2.4. Comparative Feature-Guided Network

Based on the core principles of eccentric photorefraction and the unique features of the eccentric photorefraction pupil images collected, a specialized CFGN architecture is proposed for refractive error screening tasks in this study. The network is designed to efficiently and stably extract key features related to refractive error calculation from both model-eye images and real-eye images using deep learning techniques.
Figure 11 illustrates the overall framework of the CFGN, which consists of five main components: the input, the Comparative Feature-Guided module (CFG module), the Residual-6 Blocks, the Bottom Transformer Layer, and the diopter estimation output. To better extract relevant features and enhance the accuracy of diopter estimation, the CFG module is designed based on the attention mechanism of the Transformer. The Residual-6 Blocks and the Bottom Transformer Layer form the multi-channel spatial information fusion mechanism, which not only effectively reduces computational complexity but also achieves independent extraction and optimized fusion of multi-channel features. First, a 6-channel eccentric infrared pupil image is fed into the CFG module to extract unique features from the grayscale map of each channel. These features are then passed to the Residual-6 Blocks to extract deeper features. Finally, the Bottom Transformer Layer establishes the connection between the information of each channel. Finally, the diopter estimation result is output through the MLP-head layer.

2.4.1. Comparative Difference in Eccentric Photorefraction Images

As discussed in Section 1.2.1, real human eyes with different diopters produce crescent-shaped bright areas of different widths under the same eccentricity of infrared light, or real human eyes with the same diopters produce crescent-shaped bright areas of different widths under different eccentricities of infrared light. The refraction and reflection of light at the interfaces of the cornea, lens, and retina generally follow Snell’s law, a linear optical process. These interfaces are linear media and do not involve nonlinear materials or phenomena. The path and phase changes of light can be considered linear. The reflection paths of light in the pupil vary under different eccentricities, but as long as the propagation and reflection of light within the eye are based on linear optical principles, the entire process remains linear. Eccentric photorefraction measures the refractive state of the eye by examining the changes in reflected light. The relationship between the input light and the output signal can be described by a linear equation, making the entire optical system linear. Therefore, the light intensity distribution of the pupil under different lighting modes is the result of the superimposition of reflected light from different eccentric infrared light sources. The light intensity is calculated using Equations (2) and (3), θ i is the angle of incidence, θ t is the angle of refraction, and I is the light intensity.
I r = I 0 × 1 2 sin ( θ i θ t ) sin ( θ i + θ t ) 2 + tan ( θ i θ t ) tan ( θ i + θ t ) 2 × cos ( θ i )
I t o t a l = I r , 1 + I r , 2 + I r , 3 + + I r , n
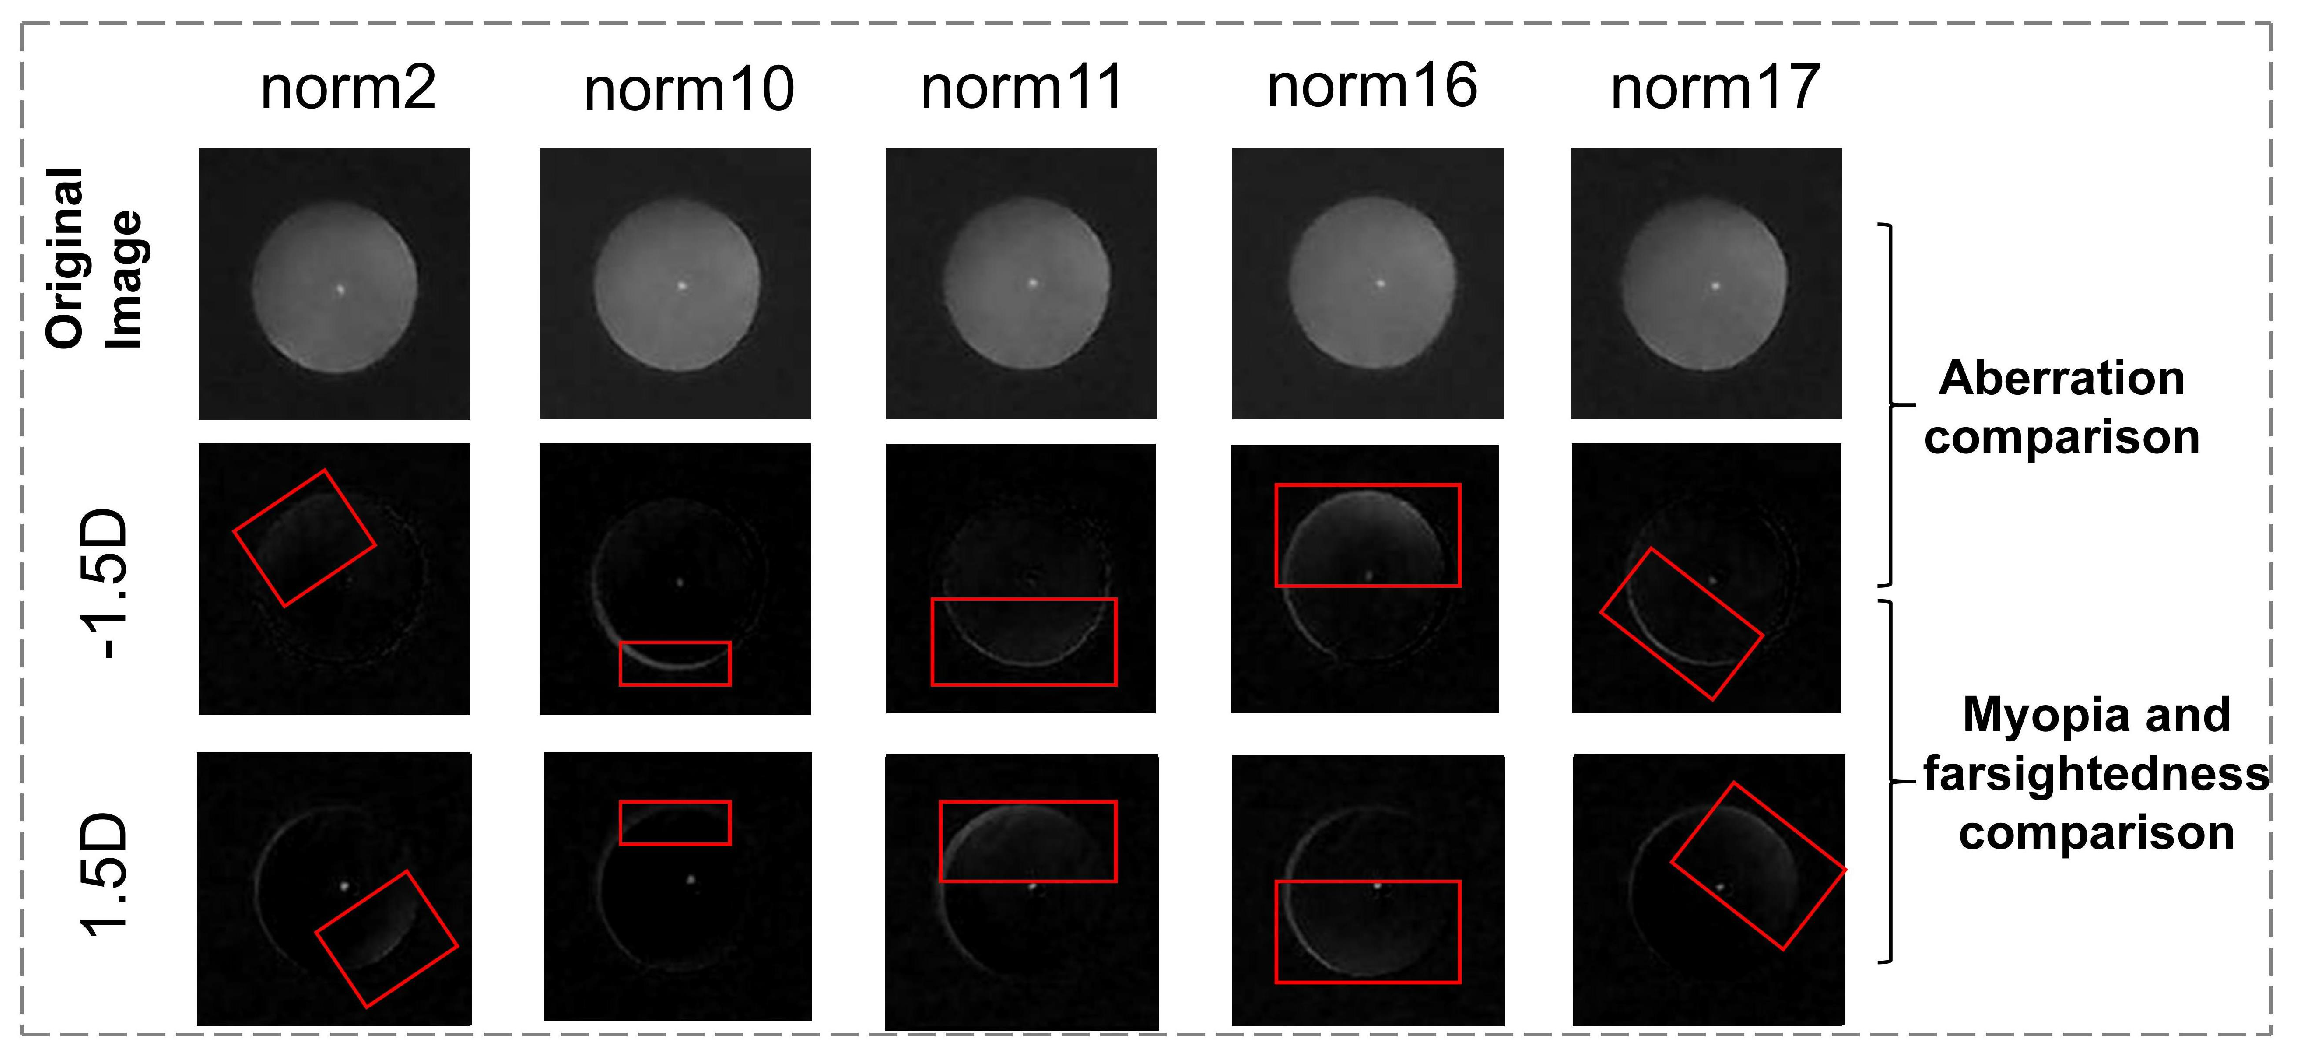
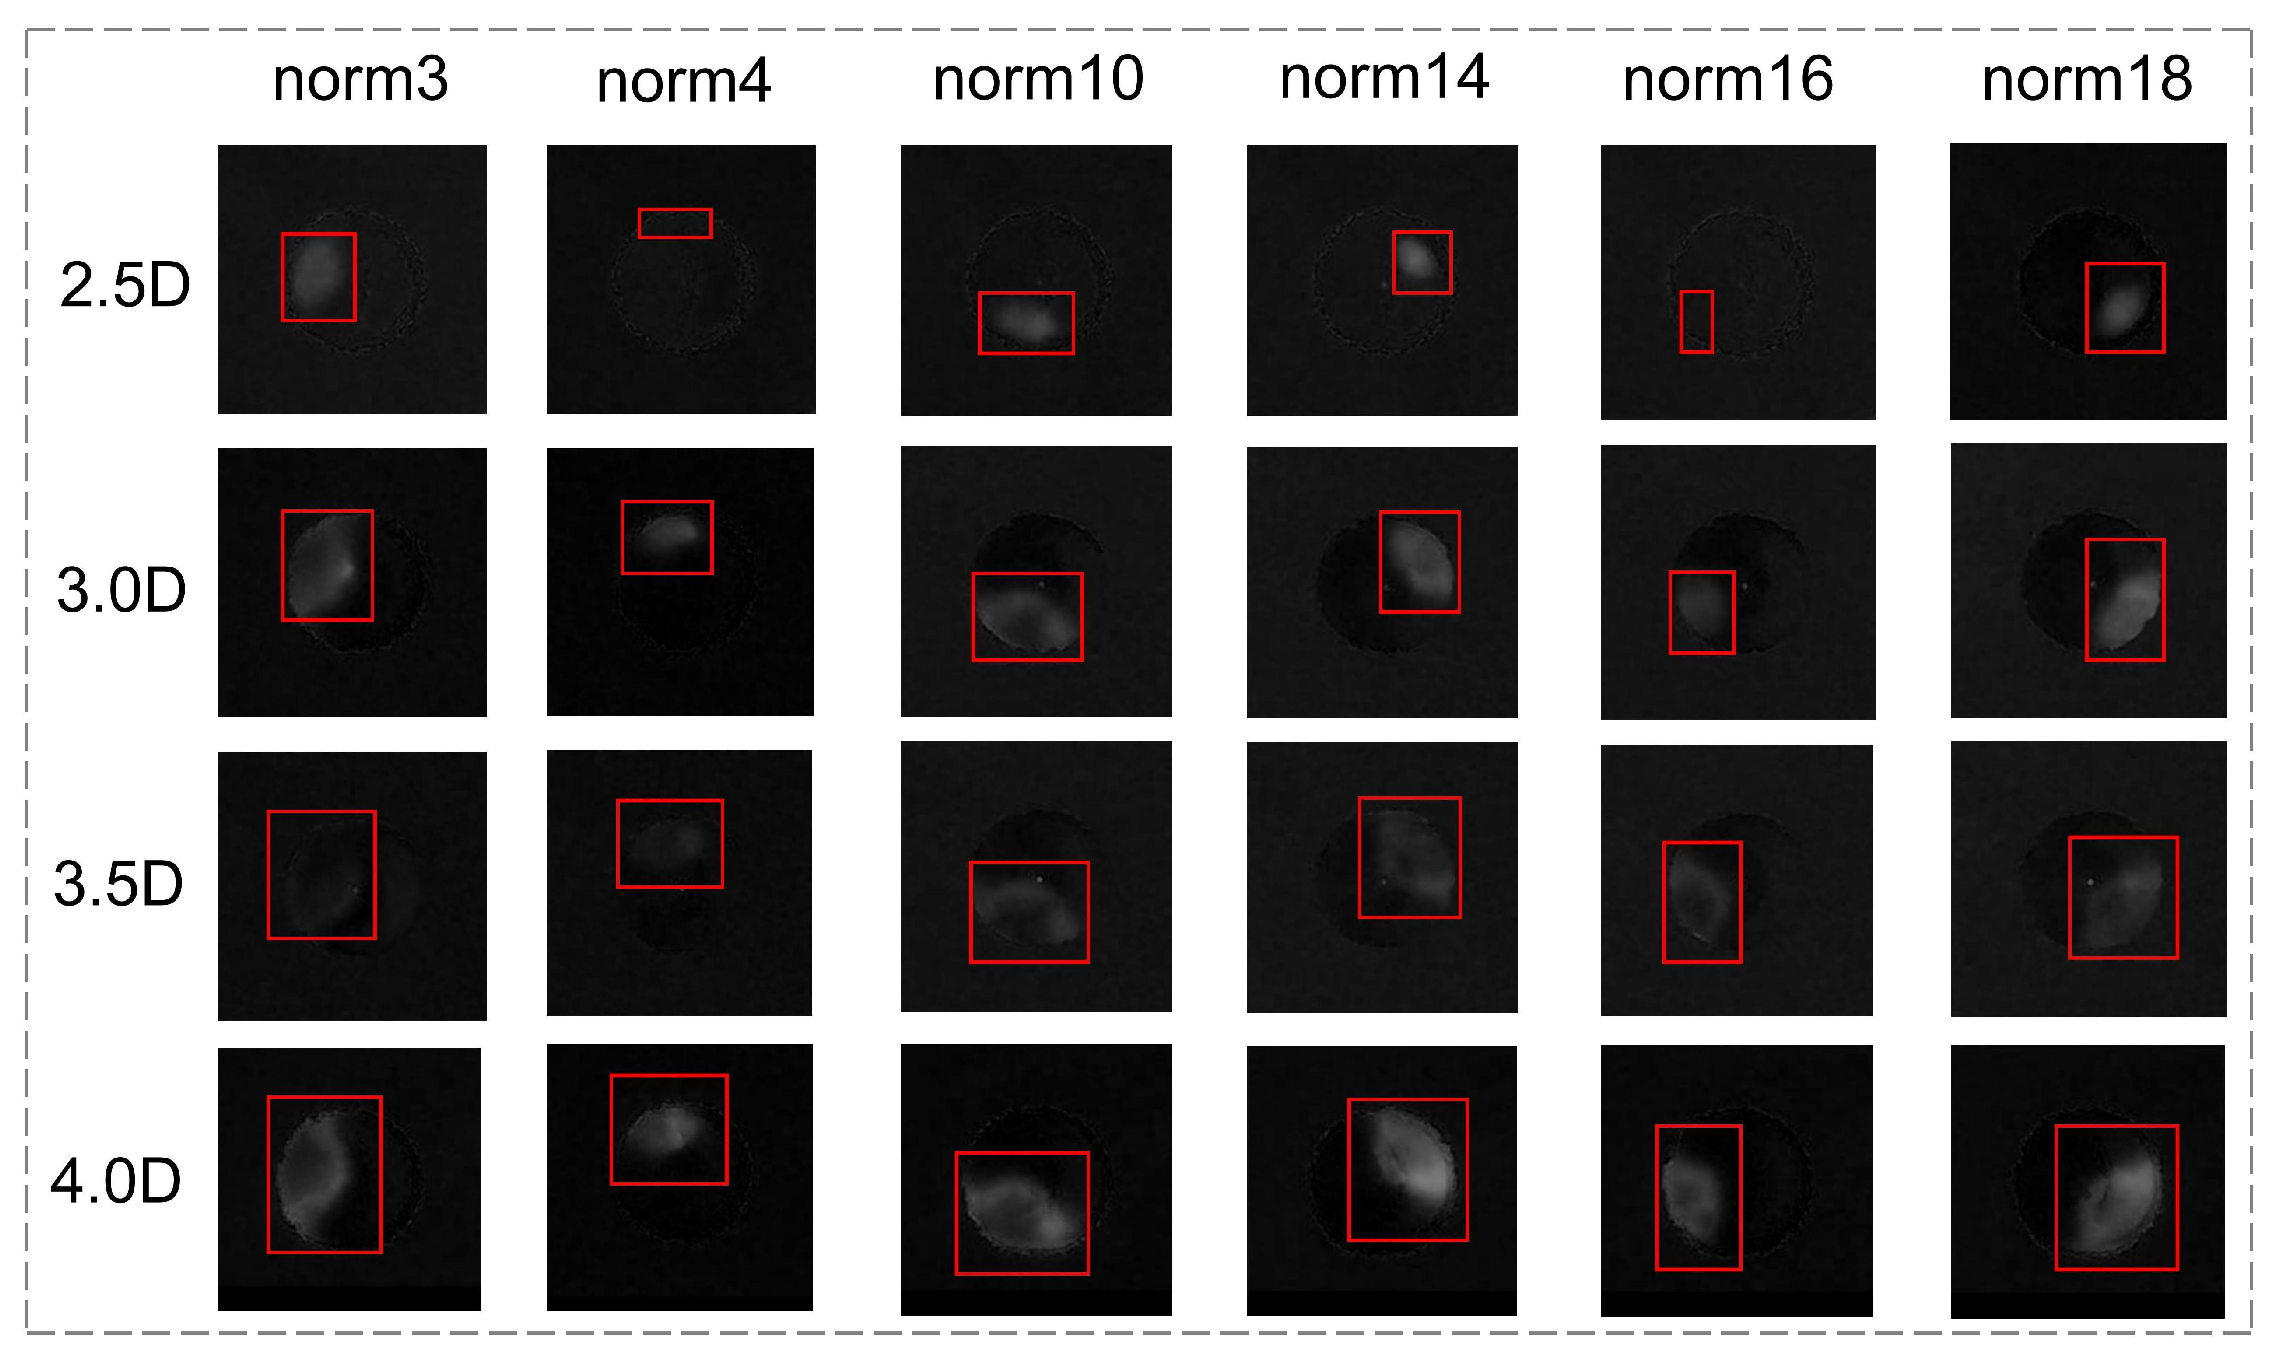
We take the lighting mode 1 image as the reference image (i.e., when the eccentricity of the infrared light is 0), where the light does not cause significant changes in the pupil image’s light intensity distribution due to refractive errors. Since the eccentric photorefraction image acquisition system is linear, we subtract the reference image from the other lighting mode images to enhance the image features under other lighting modes (when the eccentricity of the infrared light is not 0). As shown in Figure 12, the contrast-enhanced pupil images under eccentric light illumination show significantly enhanced variation features compared to the original images. The crescent bright spots are opposite in position for myopia and hyperopia, and the background noise is reduced, with most feature-irrelevant pixels reduced to zero.
Applying the same comparative processing to the model eyes, as shown in Figure 13, the changes in the bright area in different diopters are more regular and standardized, serving as a standard feature. Subsequently, we process the feature maps based on this phenomenon.

2.4.2. Comparative Feature-Guided Module

The core of the Transformer lies in its self-attention mechanism [30], which captures dependencies between all positions in the input sequence. Unlike traditional CNNs, Transformer models do not rely on local convolution operations but use a global self-attention mechanism. This allows them to capture long-range dependencies across the entire image. This global perspective enables Transformers to better extract features from the entire image rather than just local regions. The ViT (Vision Transformer)’s [31] multi-head attention simultaneously extracts image features in different subspaces, allowing the model to focus on different aspects of the image and enhancing its understanding of image content [32]. Recently, applying Transformers to image classification [31], object detection [33], semantic segmentation [34], multimodal fusion [35], and other tasks have yielded promising results. Additionally, Transformers have elevated deep learning to a new level, demonstrating strong feature extraction and alignment capabilities [36].
Lengyel et al. [37] and Chen et al. [38] utilized edge information from images to improve domain adaptation. Inspired by these insights, we apply the theory of contrast differences in eccentric photorefraction images to compare the images and extract information about their variations. This information is then used as input for a ViT to construct a feature extraction network, aiming to identify the complex spatial dependencies in the distribution of bright and dark regions within the eccentric photorefraction images.
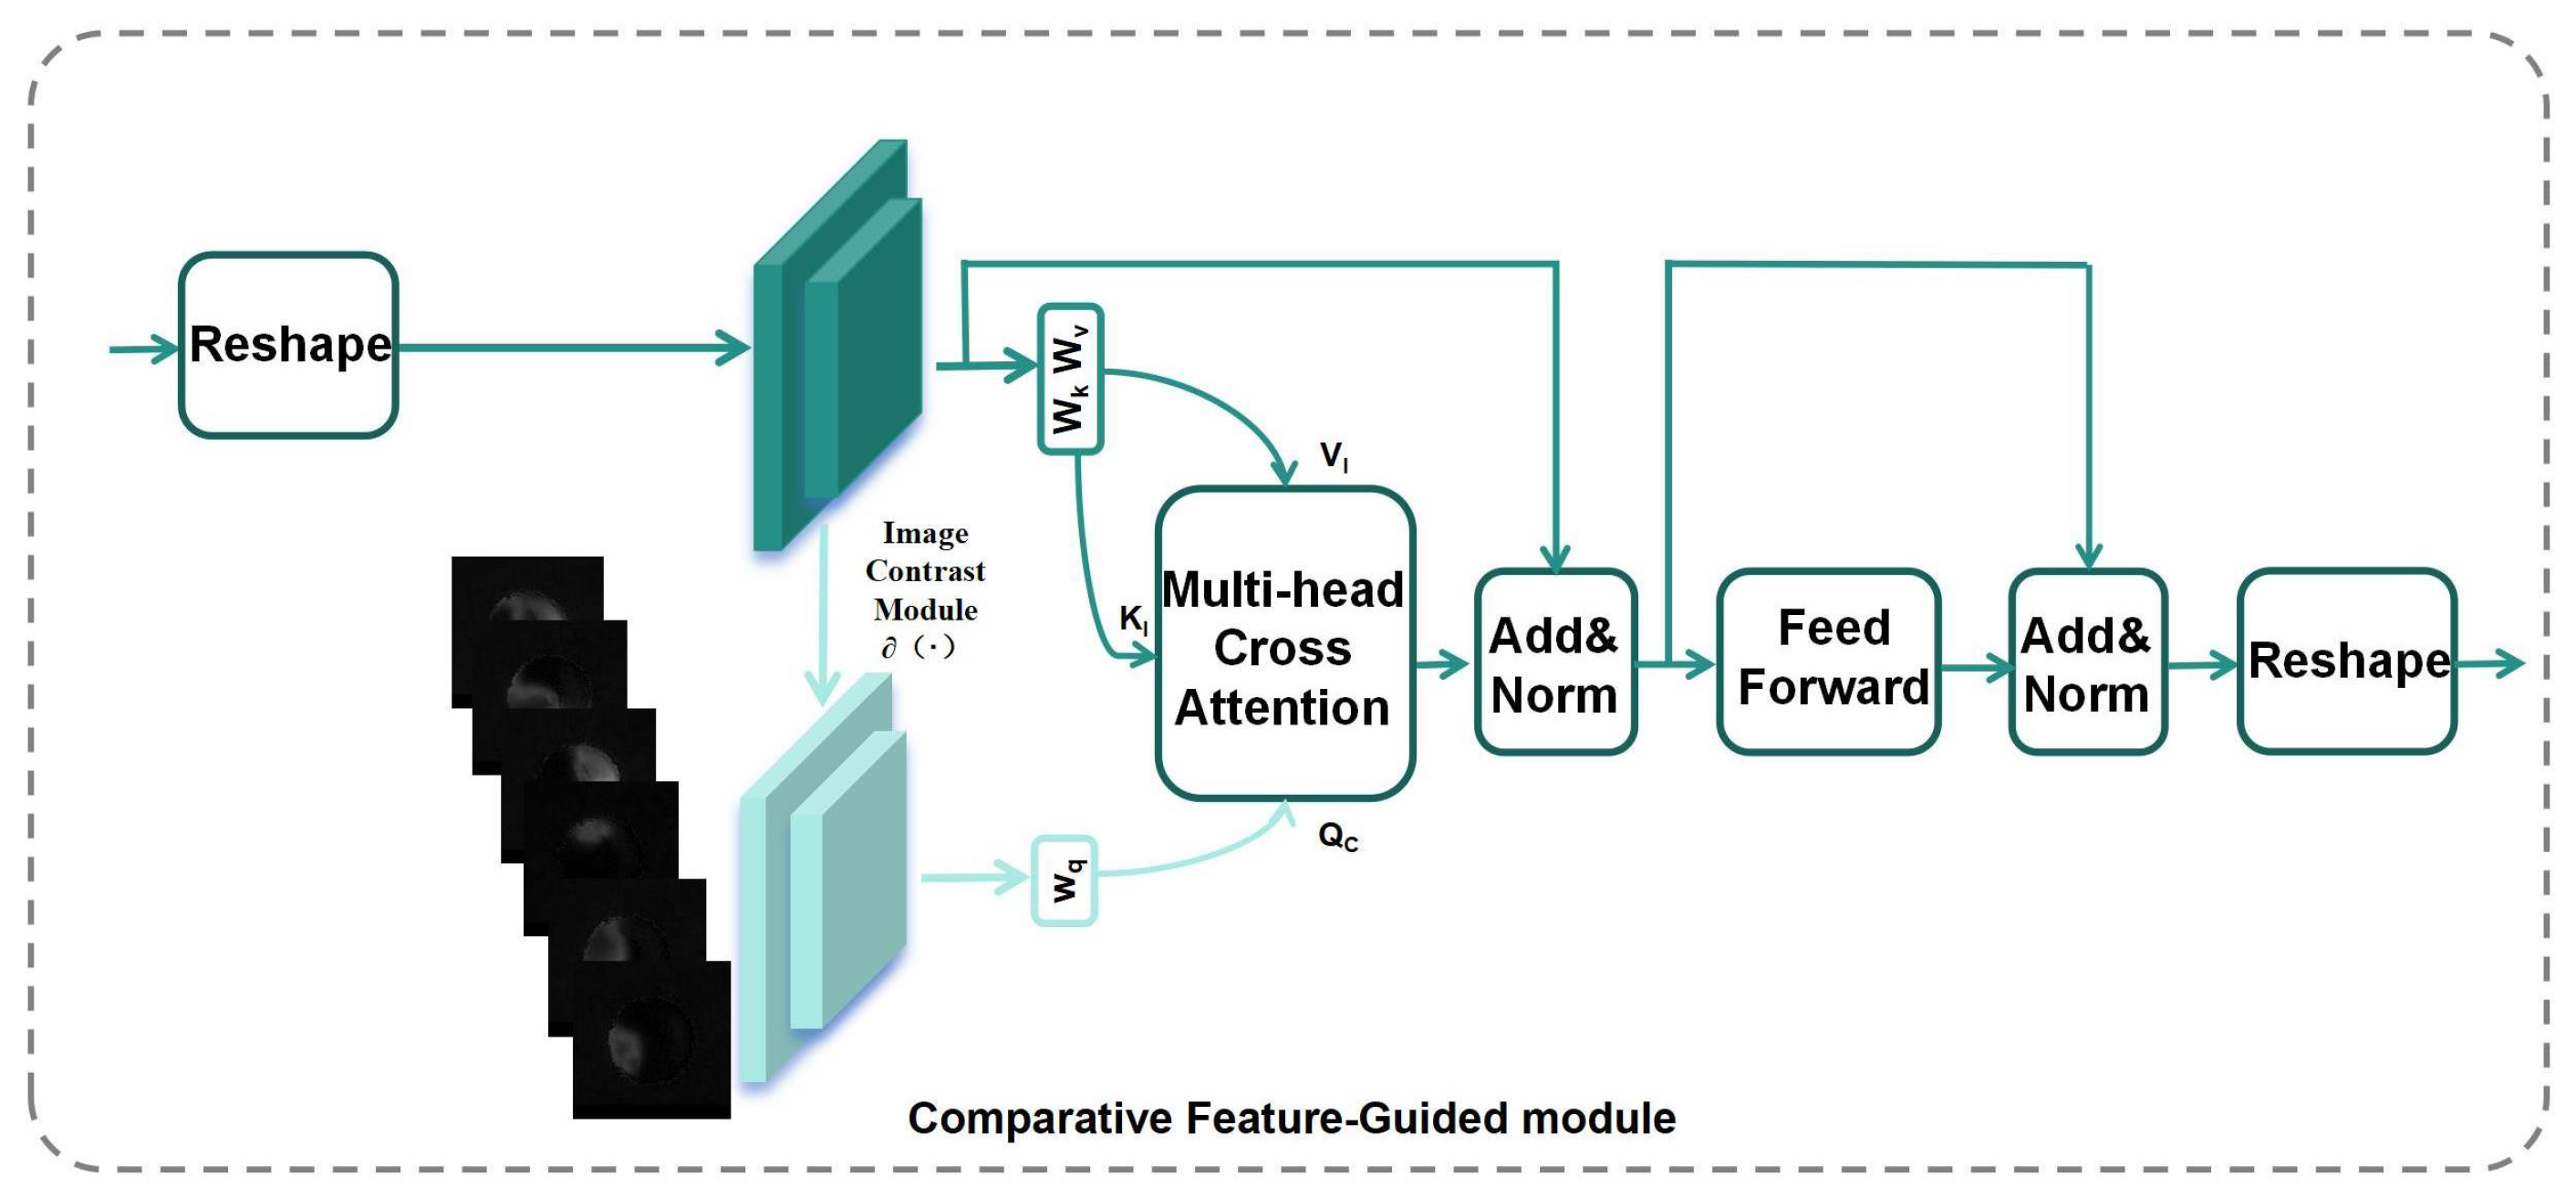
Figure 14 illustrates the structure of the CFG module. The network takes the 6-channel grayscale image I g r a y 6 as input. I g r a y 6 first passes through two 3 × 3 convolutional blocks with a stride of 2 and groups of 6 for initial feature extraction to obtain the feature f g r a y 6 , where the convolutional layer performs convolution on each channel of the 6-channel image separately. The Reshape module segments the image into single-pixel-level patches before feeding them into the improved Transformer layer. At the output end, the feature map is restored to its original shape.
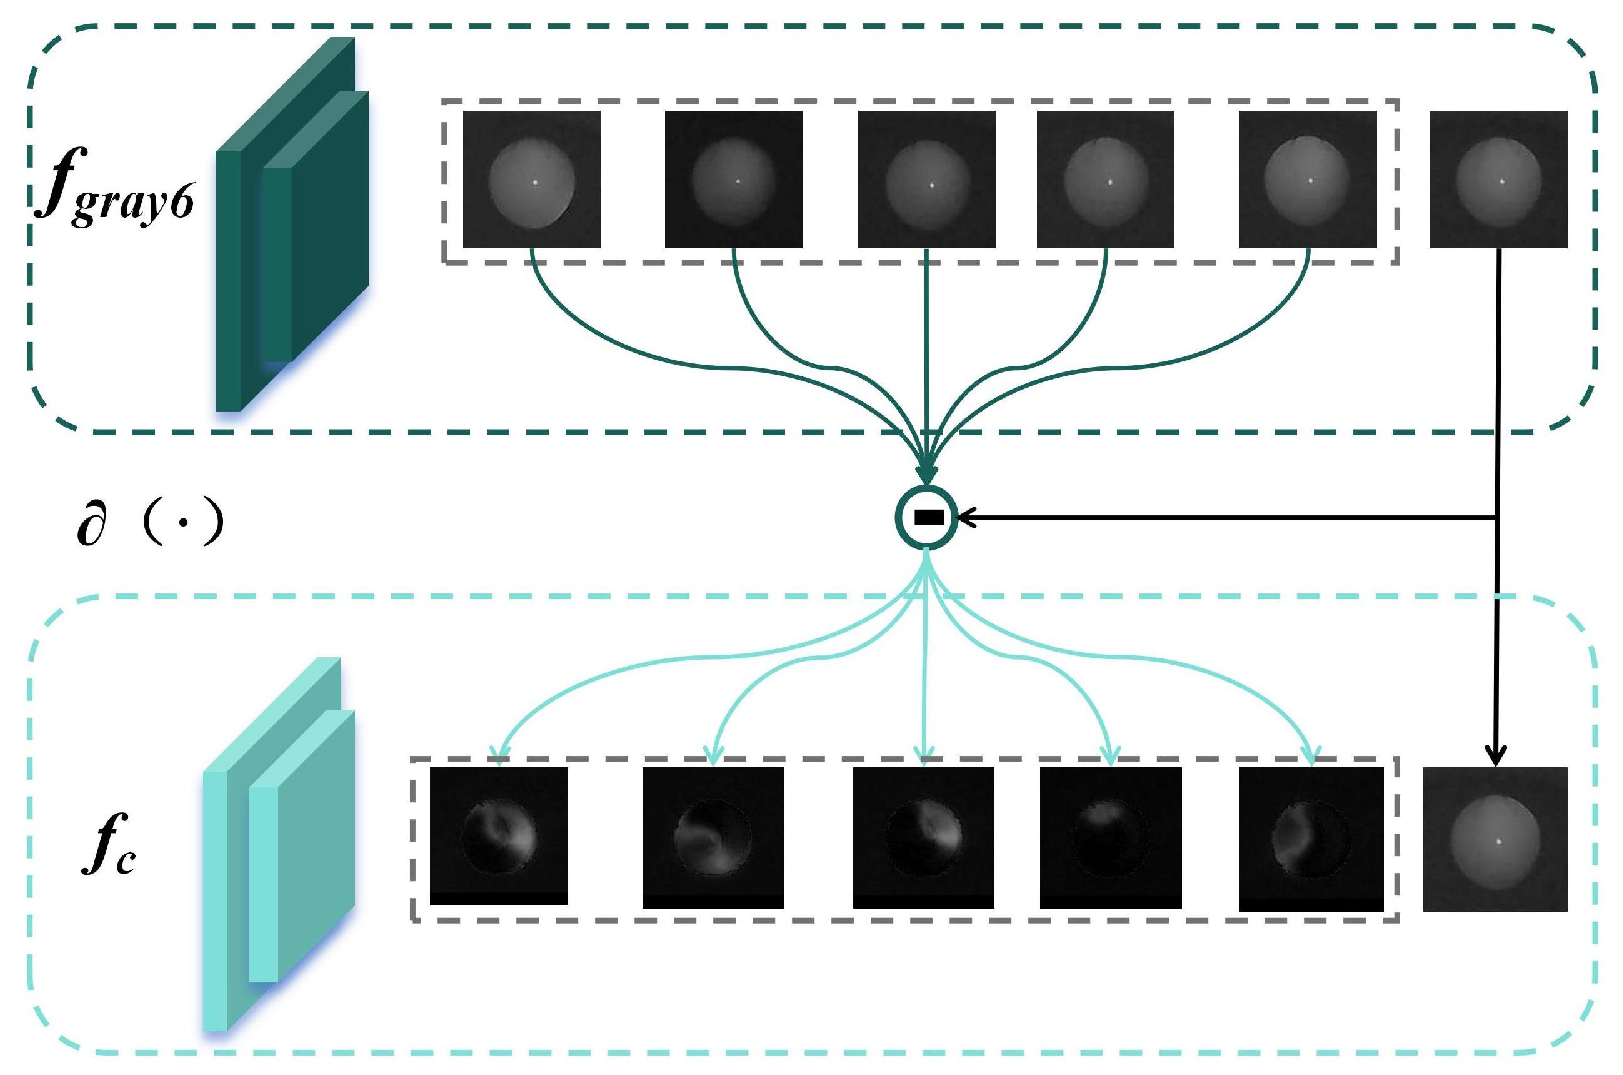
It then enters the image contrast module ε ( · ) (as show in Figure 15, the base channel remains unchanged) to obtain the feature f c , where f c = F ( f g r a y 6 ) , and both f g r a y 6 and f c are flattened 2D patches. Additionally, Q C = W q f c , K I = W k f g r a y 6 , and V I = W v f g r a y 6 are learnable linear projection matrices.
A t t ( Q C , K I , V I ) = s o f t m a x Q C K I T d V I
In Equation (4), d denotes the dimensionality of Q C , K I , and V I . The values f g r a y 6 and f c are guided and aligned through the cross-attention mechanism and a Transformer layer. By normalizing the attention weights using the softmax function, the model can adaptively focus on regions of the image that are relevant to refractive errors.

2.4.3. Multi-Channel Spatial Information Fusion Mechanism

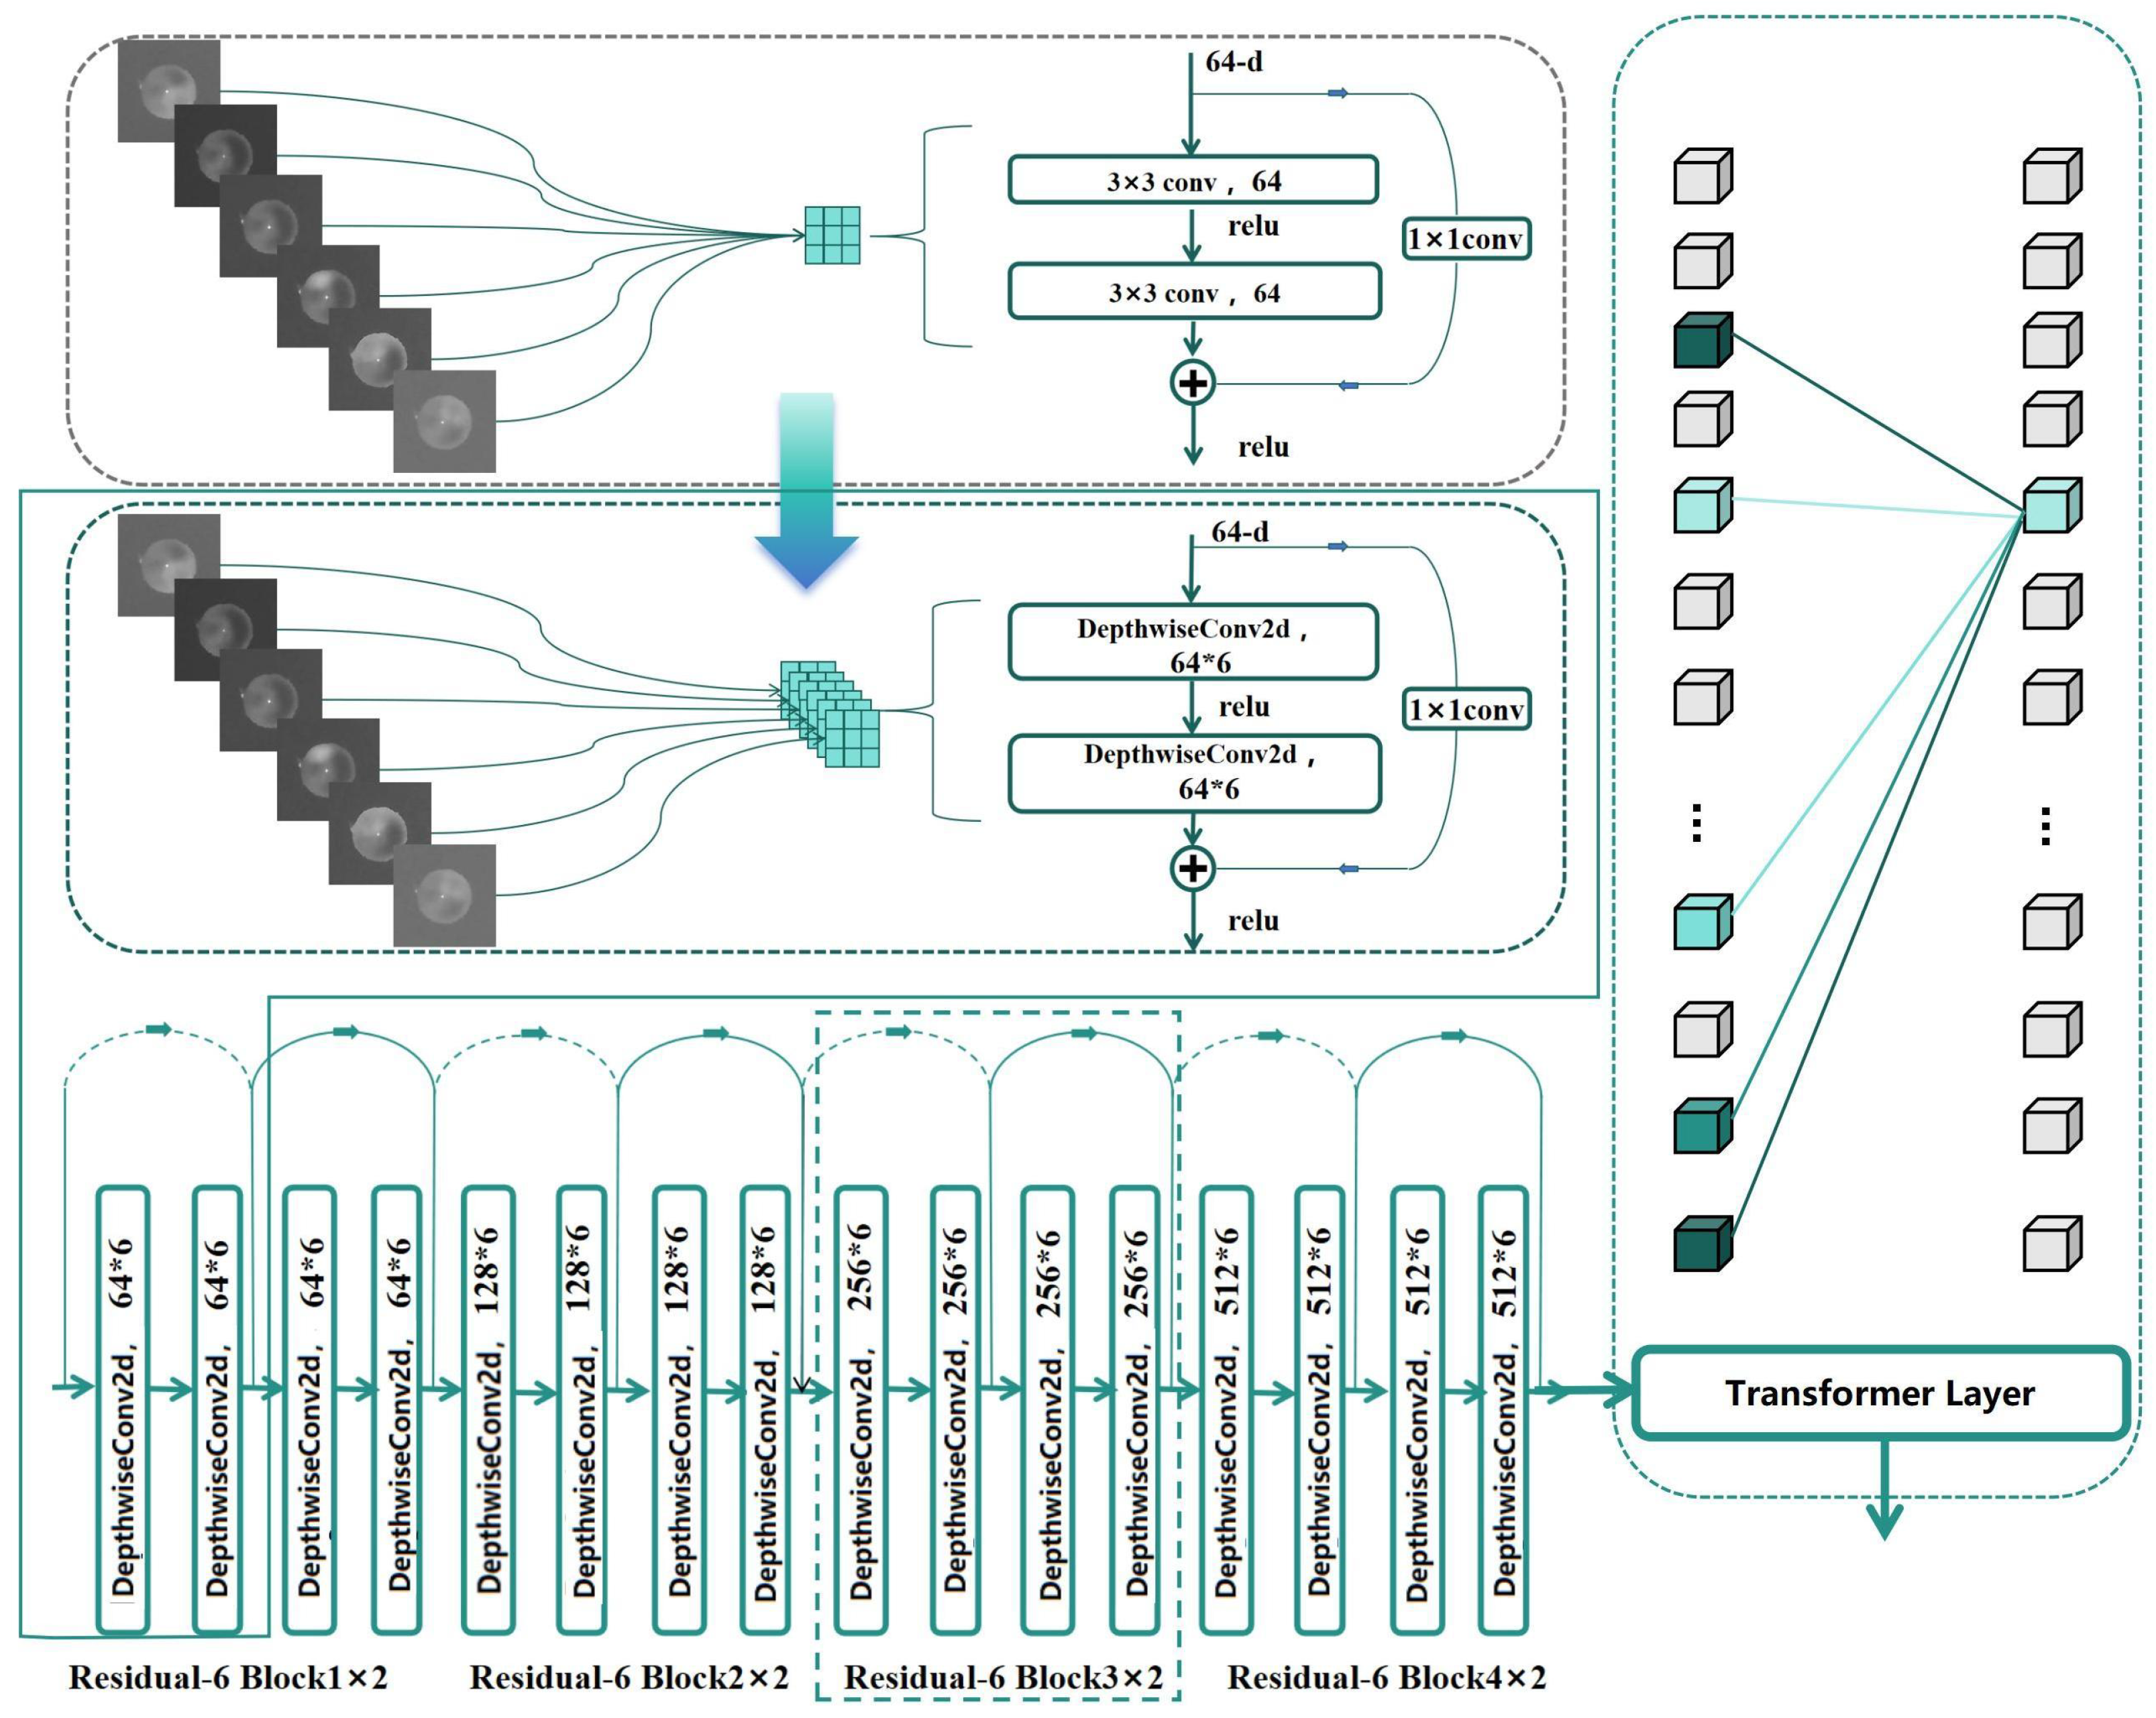
Due to the spatial differences between the 6-channel feature maps, it is necessary to independently process the features of each channel. Traditional methods typically use 3D convolution with a 3 × 3 × 6 kernel to achieve this, but this approach introduces significant computational overhead and weight expansion, which not only increases computational complexity but may also lead to higher data requirements and affect network convergence. The core difference between DepthwiseConv2d [39] and traditional convolution lies in the way they handle cross-channel information interaction and computational efficiency. DepthwiseConv2d completely decouples the inter-channel dependencies by assigning each input channel an independent filter, ensuring that the number of filters strictly matches the number of input channels. This design entirely eliminates cross-channel computation, making the number of parameters dependent only on the input channels and kernel size. However, the drawback is that the output channels cannot directly integrate multi-channel features. As shown in Figure 16, to address this issue, this study innovatively adopts the grouped convolution strategy of DepthwiseConv2d for feature extraction. Specifically, in the depthwise separable convolution layer, we use a 3 × 3 2D convolution layer with group = 6, implementing independent calculation of 6-channel features through grouped convolution. Based on this strategy, we improved the residual structure of ResNet [8] by replacing the original convolution kernels with DepthwiseConv2d, establishing the Residual-6 block.
DepthwiseConv2d decomposes the standard convolution into depthwise convolution and pointwise convolution, significantly reducing the number of parameters and computational cost. The formula is as follows:
D e p t h w i s e C o n v ( x ) = i = 1 C W i x i
where W i represents the convolution kernel of the i-th channel, and x i represents the input feature of the i-th channel.
During the feature extraction process, we first use the Residual-6 block to extract features for each channel and then introduce the self-attention mechanism of the Transformer layer to adaptively fuse the 6-channel features. This strategy, combining grouped convolution and attention mechanisms, not only effectively reduces computational complexity but also enables independent extraction and optimized fusion of spatial features from each channel, significantly improving the recognition performance of the ResNet [8] architecture in handling 6-channel feature tasks. Through the self-attention mechanism of the Transformer layers, the model can adaptively fuse multi-channel features, enhancing its ability to recognize refractive errors.

3. Experiment and Results

In this section, we validated the effectiveness of the proposed method through comparative experiments and ablation studies. First, we conducted a comprehensive comparison between our method and previously published approaches, and the experimental results thoroughly demonstrate the significant advantages of our method in terms of performance. Next, through systematic ablation experiments, we further analyzed the contribution of each module to the model’s performance, thereby validating the rationality of the model design. Additionally, to explore the impact of the pretraining strategy on refractive error screening tasks, we conducted large-scale transfer learning comparative experiments. These experiments validated the effectiveness and superiority of our method from multiple perspectives.

3.1. Datasets

We collected data from both model eyes and real human eyes, as shown in Figure 10.

3.1.1. Human-Eye Dataset

We used data collection equipment to capture eccentric infrared pupil images in Jinzhou and Tacheng, two locations 3900 km apart. In Jinzhou, we used our acquisition device to collect 6413 eccentric infrared pupil images and measured their refractive errors using an automatic refractometer to serve as the image labels. These data were used as the full-range dataset, Dataset1, with 5149 image sets as the training set and 1264 image sets as the test set. Among the 6413 image sets collected, the number of images with high-diopter hyperopia (≥+2 D) is very low, as shown in Table 1.
Twenty types of real-human-eye eccentric infrared pupil images corresponding to the model eyes’ refractive errors were selected, excluding images with incomplete pupils or severe eyelash occlusion. All images with refractive errors (≥+2 D) were included in the test set, referred to as Dataset2, with 403 image sets assigned to the training set and 177 image sets to the test set.
Typically, the precision unit of optometry measurements is 0.25 D, but due to the limited precision of the model eyes we created, we only made model-eye datasets with 0.5 D precision units. To ensure consistency between the model eyes and real eyes in the experiments, we divided the dataset into Dataset1, containing all real-eye data with 0.25 D precision unit, and Dataset2, which was selected to match the precision of the model eyes.
In Tacheng, a total of 7087 images were collected, with 5702 images used as the training set and 1382 images as the test set, forming Dataset3. Additionally, the images were filtered with a precision of 0.5 D, and all images with refractive errors (≥+2 D) were assigned to the test set, resulting in Dataset4, which consisted of 860 images for training and 237 images for testing.

3.1.2. Objective Model-Eye Dataset

A system for acquiring eccentric infrared images of model eyes was used to collect images of 20 different diopters, ranging from [−6.0 D to + 6.0 D] in 0.5 D intervals. For each diopter, 3300 sets of images were captured, with varying pupil sizes and positions relative to the camera. The dataset was divided into training and testing sets at a ratio of 4:1.

3.2. Pupil Segmentation and Extraction in Images

We used the SURF (Speeded Up Robust Features) [40] algorithm to detect key points in the images, extract and filter the coordinates and response values of the key points, and then sort the key points by their x-coordinates. The key points were divided into left and right groups, and the weighted center of each group was calculated based on the response values. The final result was the central region of the left and right pupils (which closely matches the position of the pupil reflection point). A 128 × 128 pixel area centered on this point was cropped as the image data. To avoid data leakage from the training set to the test set, only the left eye portion of all images was cropped.

3.3. Implementation and Evaluation Metrics

When training the model using the model-eye dataset, we resized the images to 128 × 128 pixels, used the Adam optimizer [41] with a learning rate of 0.001, and employed M A E as the loss function. We adopted a step-wise learning strategy, reducing the learning rate to 0.005 at 120 epochs and to 0.0001 at 240 epochs. In addition, we used image augmentation techniques such as translation. The batch size was set to 32, and the network was initialized using the He initialization method [42]. We trained the model for 300 epochs to ensure convergence and saved the model as the model-eye pretrained model. Subsequently, we loaded the base pretrained model and fine-tuned it using the real-human-eye datasets (Dataset1 and Dataset2) with the same parameter settings as the base model. All models were trained for 300 epochs to ensure convergence. All models were implemented using the Pytorch framework [43] and trained on a single GTX 4090 GPU. Table 2 describes the specific parameters.
The refractive error measurement within the ±1 D range is sufficient to meet the requirements of routine refractive error screening. Therefore, this paper uses the accuracy metric A C C 1 (the error range is within ±1 D) as a quantitative indicator to compare the performance of different models. The accuracy metric A C C 0.5 (the error range is within ±0.5 D) is introduced to verify that the proposed method still performs better even when evaluated at higher precision levels. Additionally, M A E is used to evaluate the performance of each regression model. For each experiment, both comparative and ablation experiments are repeated four times, and the highest accuracy is selected as the experimental result.
M A E is expressed as
M A E = 1 n i = 1 n | y i y ^ i |
where y i is the true value (target value), y ^ n i is the predicted value, n is the total number of samples, and n i is the samples within the error range.
A C C 1 is expressed as
A C C 1 = n i n , | y n i y ^ n i |   1
A C C 0.5 is expressed as
A C C 0.5 = n i n , | y n i y ^ n i |   0.5

3.4. Comparative Experiment

In this section, we compare the proposed CFGN model with several commonly used deep learning models, including VGG-16 [44], Densenet-121 [45], AlexNet [46], ResNet-18 [8], ResNet-50 [8], ResNeXt-50 [47], Se-ResNet-50 [48], ViT [31], Swin Transformer [49], REDNet [16], and ResNet-50-6. Notably, ResNet-50-6 is a six-channel input model based on ResNet-50 designed to verify the performance improvement of multi-channel images in refractive error prediction tasks. It is important to note that conventional deep learning regression models are trained using a single eccentric infrared pupil image, whereas CFGN and ResNet50-6 are trained using six-channel eccentric infrared pupil images.
As shown in Table 3 and Table 4, the experimental results show that on Dataset1 and Dataset3 (full-range dataset), models such as VGG-16, Densenet-121, AlexNet, ResNet-18, ResNet-50, ResNeXt-50, Se-ResNet-50, Vit, REDNet [16], and Swin Transformer have similar performance, but their A C C 1 accuracy does not exceed 90%. This indicates that existing network architectures still have room for optimization in refractive error screening tasks. In contrast, Both CFGN and ResNet50-6 achieved higher A C C 1 and A C C 0.5 on both datasets compared to conventional models, fully validating the effectiveness of multi-channel image inputs. Notably, CFGN achieved the best performance across all evaluation metrics, demonstrating its exceptional capabilities.
On Dataset2 and Dataset4 (0.5 D precision datasets), the performance of models such as VGG-16, Densenet-121, AlexNet, ResNet-18, ResNet-50, ResNeXt-50, REDNet, and Se-ResNet-50 was similar. However, the Vit, based on the Transformer architecture, failed to fully converge due to the limited sample size, resulting in suboptimal performance. In the comparative experiment data, only CFGN achieved an ACC1 accuracy of over 80% on the datasets from both regions, maintaining a leading advantage across all metrics. This further confirms that CFGN can effectively extract feature information from eccentric infrared pupil images even under small-sample conditions, enabling it to better perform refractive error screening tasks.
In summary, the CFGN we designed demonstrates outstanding performance in refractive error screening tasks, significantly outperforming mainstream models such as VGG-16, Densenet-121, AlexNet, ResNet-18, ResNet-50, ResNeXt-50, Se-ResNet-50, Vit, REDNet, and Swin Transformer. Specifically, on the small-sample datasets, Dataset2 and Dataset4, CFGN achieved a 5% to 9% improvement in A C C 1 accuracy compared to conventional models, while on the full-range datasets, Dataset1 and Dataset3, it achieved a 3% to 5% performance boost in A C C 1 accuracy. This result fully validates the robustness of CFGN across different data scales, highlighting its practical value in refractive error screening tasks.

3.5. Transfer Learning Experiment

In this section, we employed transfer learning by loading the weights of pretrained models and fine-tuning them with real-human-eye data. For common deep learning models such as ResNet-18, ResNet-50, Vit, and Swin Transformer, we used models pretrained on ImageNet1k, removed the classifier part, and fine-tuned them layer by layer. As shown in the table, the training results with transfer learning outperformed those obtained by training directly on eccentric infrared pupil images. Additionally, Vit successfully converged on Dataset2, validating the effectiveness of transfer learning. However, for models with six-channel image inputs, such as CFGN and ResNet-50-6, pretrained models are not available. Therefore, we trained refractive error screening pretrained models on CFGN and ResNet-50-6 using a large amount of objective model-eye data for six-channel eccentric infrared pupil images and fine-tuned them on the real-human-eye datasets, Dataset1 and Dataset2. The CFGN-pre and ResNet-50-6-pre in Table 5 and Table 6 represent the training results after applying transfer learning.
Experimental results show that on Dataset1 and Dataset3, CFGN-pre achieved the highest A C C 1 accuracy and the lowest M A E . On Dataset2, compared to the original CFGN, CFGN-pre significantly improved A C C 1 , reaching 84.2%. In Dataset2 and Dataset4, the test sets contain only a small amount of high-diopter hyperopia data (+2 D to +6 D), and there are no high-diopter hyperopia data in the training sets. This indicates that introducing the model-eye pretrained model alleviated the problem of insufficient high-diopter hyperopia data. Furthermore, when fine-tuning the pretrained model on Dataset2, ResNet-50-6 achieved an increase of 0.5% to 0.6% in A C C 0.5 and A C C 1 . For the CFGN model, A C C 0.5 increased by 1.1%, while A C C 1 improved by 2.3%. These results demonstrate that the CFGN model is more effective than ResNet-50 in extracting common features between model eyes and real human eyes.
Additionally, in the training of CFGN using Dataset1, the performance improvement from introducing the model-eye pretrained model was smaller than when introducing the model-eye pretrained model in the training of Dataset2, possibly due to the difference in the precision unit within ±1 D between the model eyes with 0.5 D precision and Dataset1, affecting the training results.
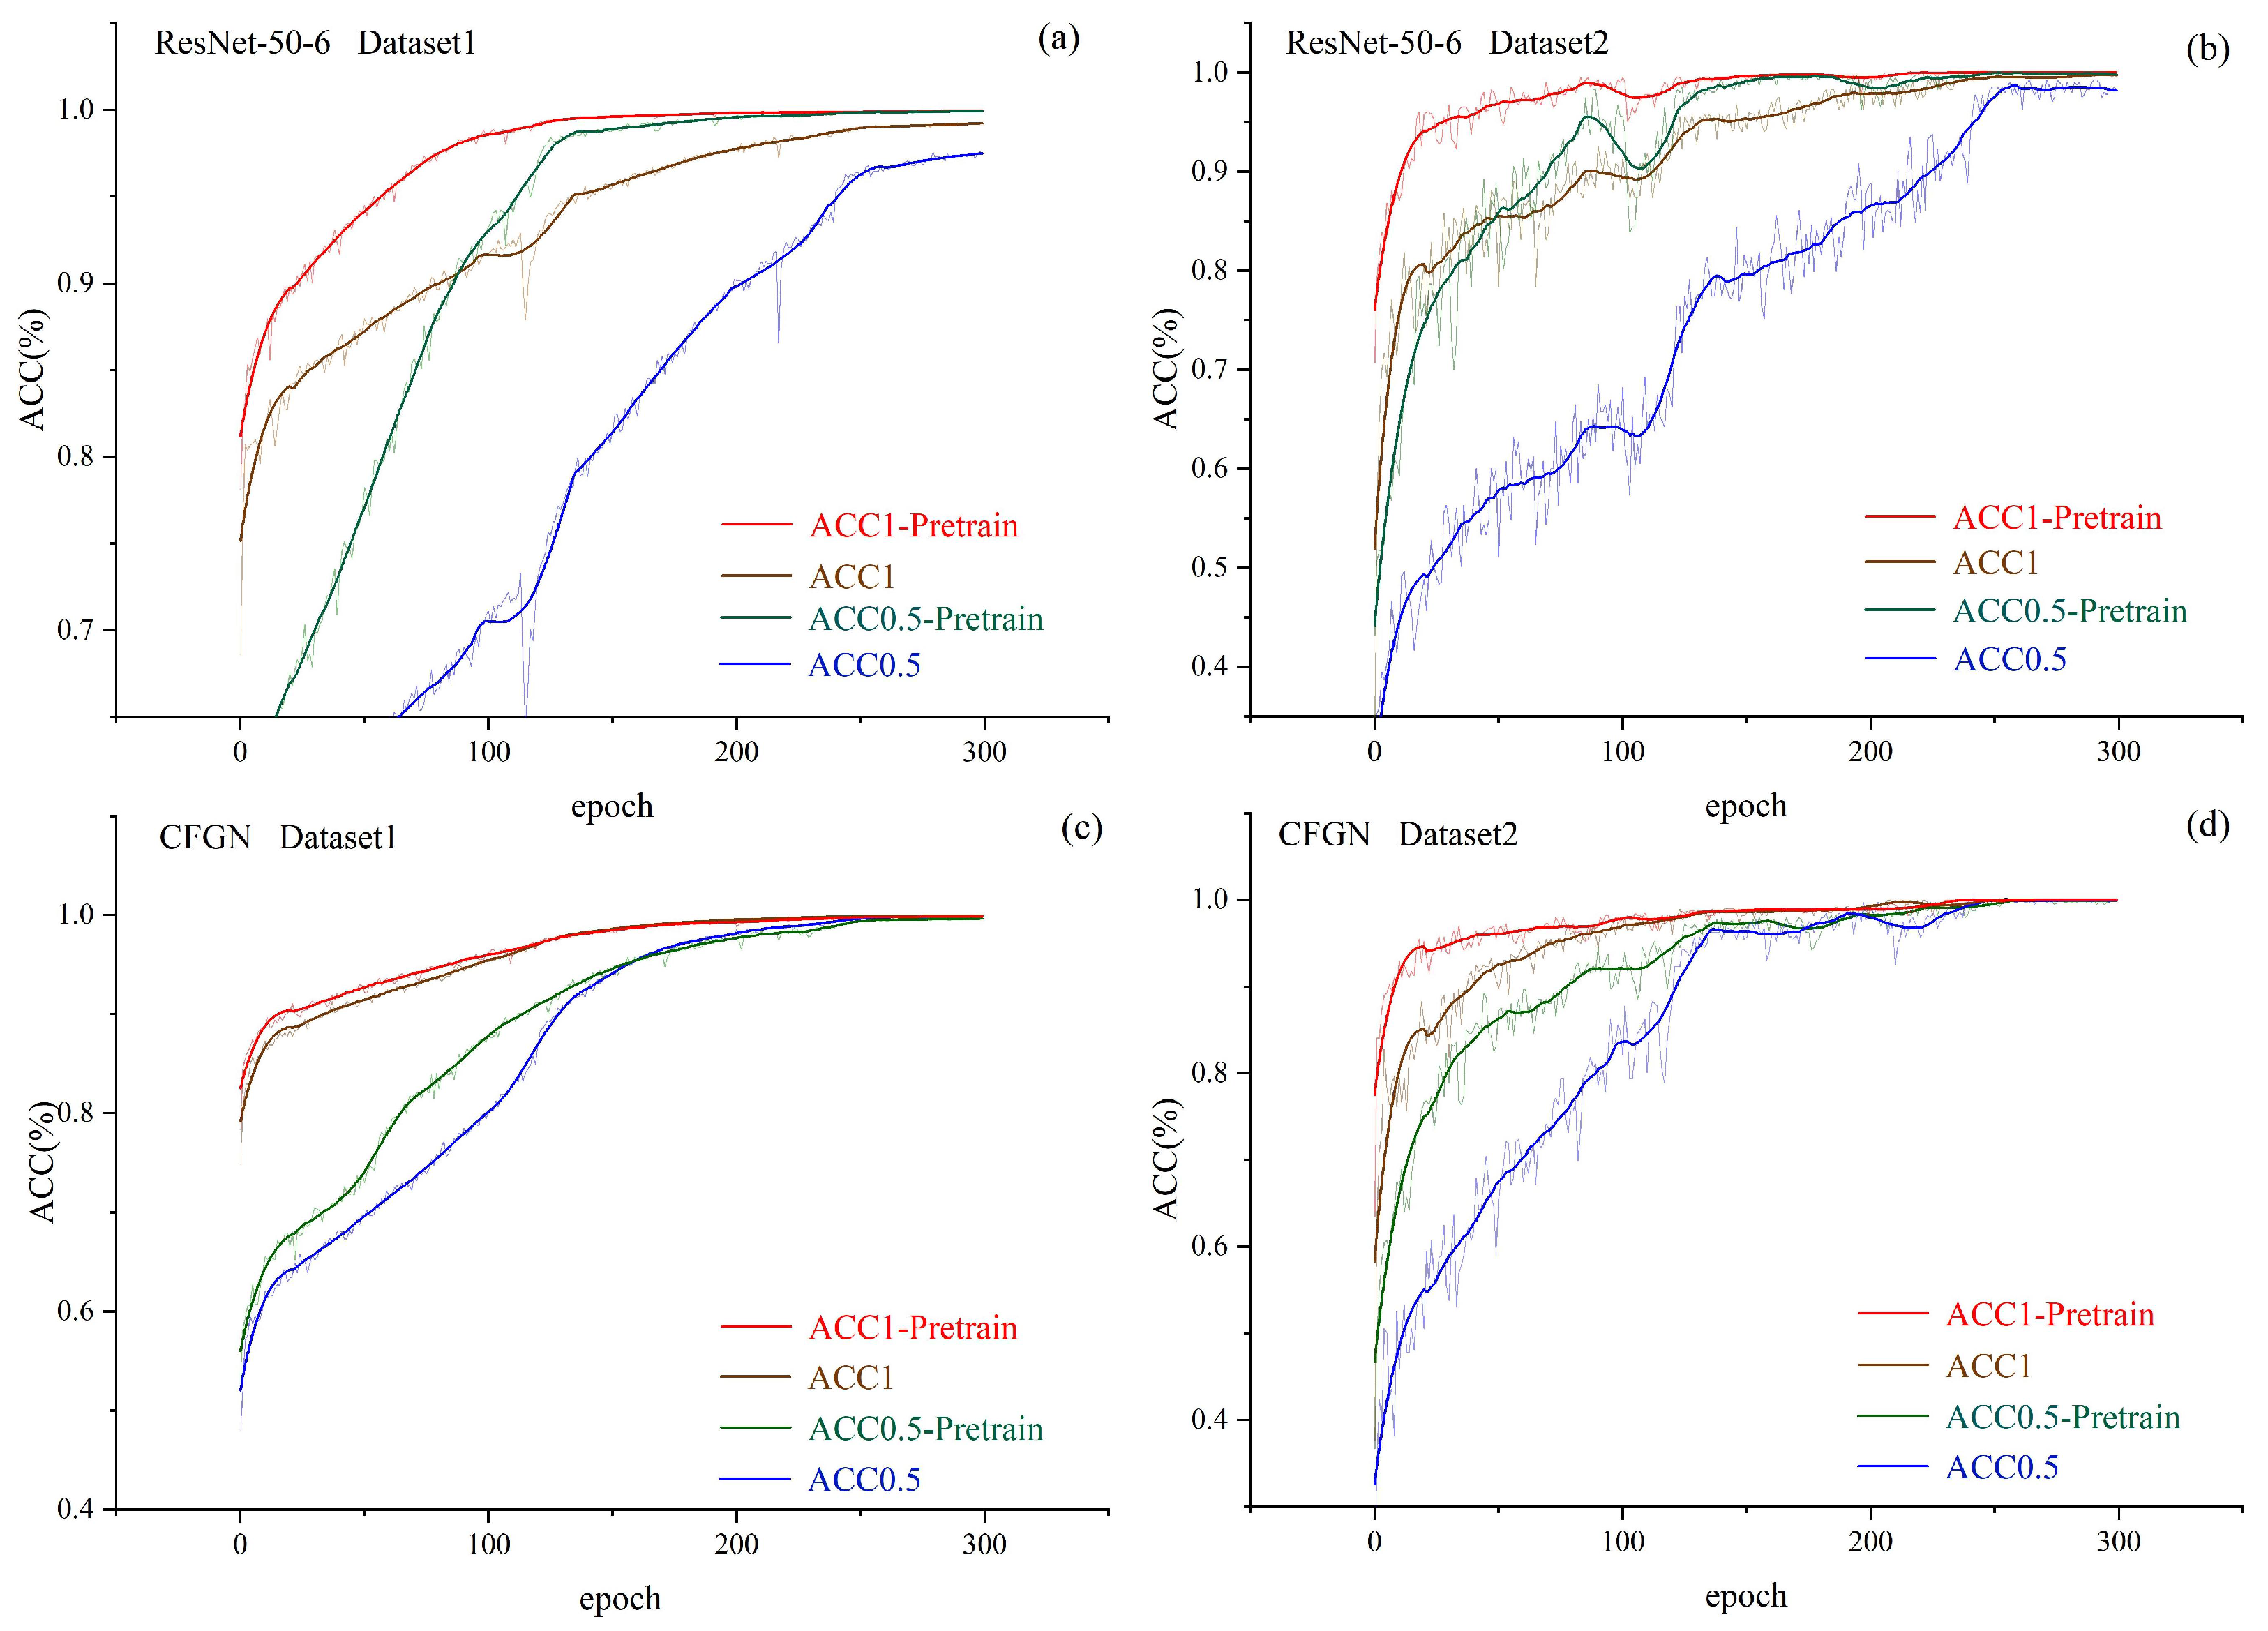
Observing the entire training process, as shown in Figure 17a, when training ResNet-50-6 using Dataset1, both A C C 1 and A C C 0.5 reach convergence within 120 epochs with a pretrained model, whereas without pretraining, 240 epochs are required for convergence. In other cases, the pretrained model also accelerates the convergence speed of the model. Pretraining significantly accelerates model convergence by optimizing parameter initialization and facilitating knowledge transfer. The parameters learned from large-scale data are closer to the potential optimal solution of the target task, avoiding the blind search of random initialization. Additionally, low-level general features (such as the contrast feature of the crescent area in eccentric photorefraction images) can be directly reused, allowing downstream tasks to require only fine-tuning of higher-level structures. Moreover, the implicit regularization effect of pretraining reduces the risk of overfitting, while improved gradient stability and data efficiency—especially in low-sample scenarios—further shorten training cycles. This also means reducing the computation time required for training the network in the cloud, thereby accelerating the deployment of region-specific algorithms.
In summary, this section validates that both the ImageNet1k pretrained model and the model-eye pretrained model developed in this study can effectively improve the performance of refractive error screening tasks. Among them, the self-built model-eye pretrained model, being more closely aligned with the target task domain, demonstrates stronger transfer learning capabilities in refractive error screening tasks.

3.6. Ablation Experiment

We conducted ablation experiments on the CFGN network itself using Dataset1 to demonstrate the effectiveness of the CFG module and the Bottom Transformer Layer. In our study, the baseline network consists of a simple model composed of two 3 × 3 convolutional layers with a stride of 2, eight Residual-6 Blocks, a pooling layer, and a fully connected layer. We gradually added different modules to the baseline to verify their effectiveness. The evaluation method for this section is consistent with the previous experiments.
Table 7 presents the results of model optimization. The baseline model achieved an A C C 0.5 of 67.4% and an A C C 1 of 90.1%. After adding the CFG module, A C C 0.5 improved to 68.8%, and A C C 1 increased to 92.2%. When the bottom Transformer layer was added on top of the CFGN, A C C 0.5 further improved to 69.6%, and A C C 1 increased to 92.5%. These results demonstrate the effectiveness of both the CFG module and the Transformer layer in improving model performance.

4. Discussion

Nowadays, the issue of early-onset myopia has become increasingly severe, especially with the widespread adoption of the internet and electronic devices. The age at which children and adolescents first interact with electronic devices continues to decline. Moreover, the prevalence of paperless learning and electronic whiteboards in education has significantly increased their screen time on smartphones and tablets, leading to a continuous rise in myopia incidence among younger populations. However, the preventive screening of vision health in adolescents remains difficult to implement on a regular basis due to high labor costs and a lack of professional equipment. Traditional refractive measurement techniques can no longer meet the demands of modern society. To address this, this study proposes an innovative solution that integrates eccentric photorefraction and deep learning, aiming to establish an efficient, accurate, and cost-effective online vision screening system.
Previous studies have faced limitations due to insufficient data scale and imbalanced distribution. Chun et al. [13] utilized only a dataset of 305 images, with only 12 samples having ≥+5.0 D and all from a single source; Linde et al. [13] expanded their dataset across two regions but were still limited to 512 images. This study collected data from two regions 3900 km apart, each with over 6000 samples, ensuring adequate model convergence and validating the generalizability of the proposed solution. In addition, model-eye data were used to alleviate the lack of high-diopter hyperopia data. Existing studies primarily focus on refractive status classification: Chun et al. [13] defined a seven-level classification standard, Fu et al. [14] developed SURE-CNN using 2.5 D as a threshold for binary classification alerts, and Linde et al. [17] set 2 D as the classification boundary. While such methods can identify myopia risks, they suffer from rigid thresholds that limit screening sensitivity and prevent precise refractive measurement. This study innovatively replaces classification models with a regression model and introduces an error range evaluation system, significantly improving the clinical applicability of screening results.
In terms of model training strategies, previous studies commonly employed transfer learning based on ImageNet pretrained parameters. However, natural images differ significantly from eccentric photorefraction images in feature characteristics. This study constructed a model-eye system, leveraging the similar optical properties of real human eyes and model eyes under eccentric infrared illumination to generate highly clinically relevant simulated data, thereby enhancing data diversity. Transfer experiments demonstrated that the pretrained model based on model eyes outperformed the ImageNet pretrained model, requiring less training data while achieving greater performance improvements. Although generative adversarial networks (GANs) could serve as an alternative for data synthesis, their application in medical image generation relies on large-scale training data, making them unsuitable for this study’s specific scenario. In the future, as experts upload accurately labeled real-human-eye data from different regions and ethnicities to the system (with user consent), we will establish a universal pretrained real-human-eye model, which will have better generalization performance than the model-eye pretrained model. All relevant studies currently adopt a transfer learning approach based on pretraining followed by fine-tuning; we will explore the use of advanced transfer learning methods, such as domain adaptation, to better complete refractive error screening tasks.
From a technical implementation perspective, existing methods have not fully explored the potential of eccentric photorefraction image features. While Yang et al. [15] utilized a 24-near-infrared-LED multi-axial illumination system to collect 1216 eye images for training a regression model, their approach required manual extraction of reflected light intensity features and image stitching, resulting in complex feature engineering and limited generalization. Xu et al. [16] proposed REDNet, which predicts refractive error using six-direction eccentric light source images, but its fixed eccentricity imaging scheme restricts the sensitive measurement range. This study innovatively employs a multi-eccentricity-angle, multi-channel spatial information dataset that better aligns with clinical refractive measurement principles. Notably, existing models generally suffer from the “black-box” problem. To address this, this study developed the Contrast Feature Guidance Module (CFG module), which integrates ophthalmic prior knowledge and enhances interpretability by leveraging feature space comparisons, ensuring transparency in clinical diagnostics.
Due to differences in datasets and research objectives, direct horizontal comparisons are limited. However, this study achieved a breakthrough mean absolute error (MAE) of 0.168 D on the largest-scale dataset, surpassing REDNet’s 0.174 D [16] and SURE-CNN’s 0.653 D [14]. By replicating the REDNet six-image input architecture and conducting comparative experiments on Dataset1 and Dataset3, CFGN outperformed REDNet in key metrics: ACC1 (92.5, 92.0) vs. REDNet’s ACC1 (88.9, 88.6) and MAE (0.230 D, 0.123 D) vs. REDNet’s MAE (0.250 D, 0.198 D). At the same time, we compared the vision screening scheme based on eccentric photorefraction used in this study with schemes that utilize fundus images for vision screening. Our MAE was also lower than Varadarajan’s 0.56 D and Zou’s [9] 0.63 D.
Experiments conducted in two different regions validated the feasibility of this online refractive error screening solution, which is centered on the CFGN network and supplemented by a pretrained model based on model eyes. This innovative approach provides a new technical pathway for routine vision screening in various regions. The solution not only significantly improves screening efficiency but also greatly reduces screening costs, making it particularly suitable for areas with limited medical resources and professional technical personnel. By conducting routine refractive error screening, continuous refractive error data can be obtained, enabling the ongoing monitoring of vision changes and laying a solid data foundation for establishing predictive models for refractive error changes.
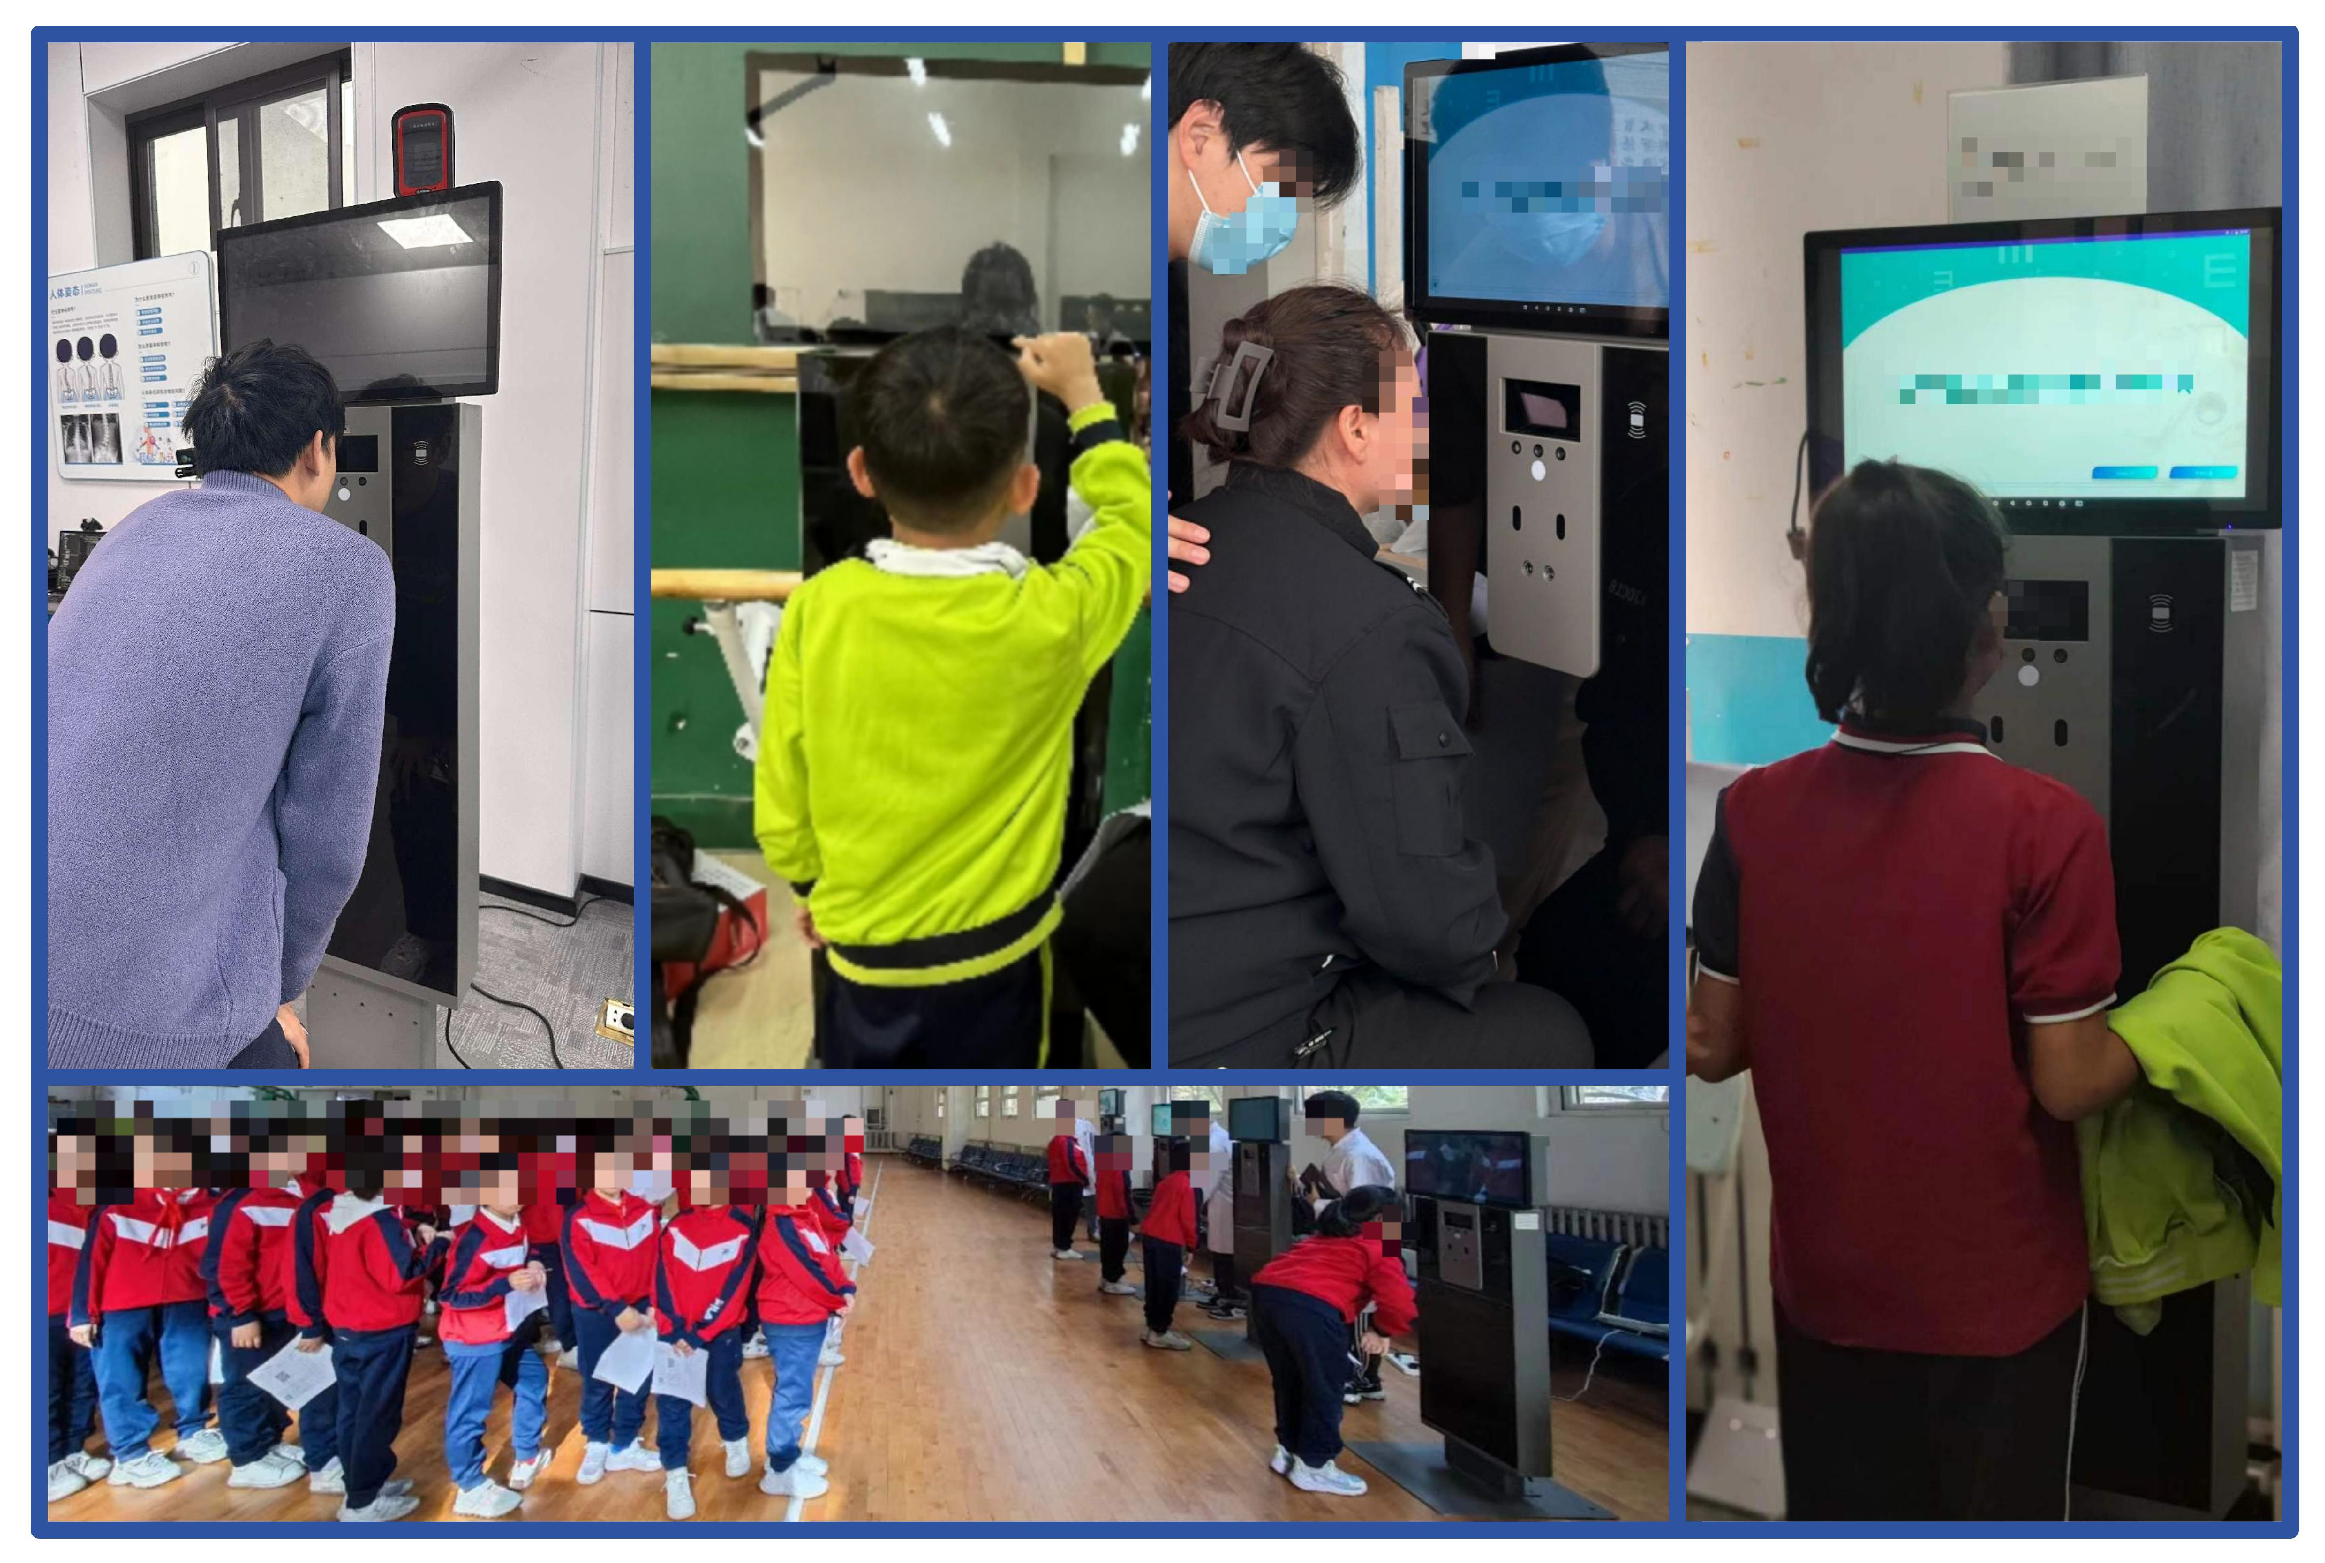
As shown in Figure 18, the vision screening terminal based on eccentric photorefraction principles can be easily deployed in schools, communities, and other public places, providing self-service screening for adolescents and children. This system has been preliminarily validated in regions such as Jinzhou, Tacheng, and Changzhi.
In summary, AI-based screening technology has established a comprehensive vision data monitoring system, providing a scientific basis for vision health management. This, in turn, assists schools, healthcare centers, and other institutions in building a collaborative vision prevention and control network, realizing a closed-loop management system for screening, monitoring, and intervention. This innovative approach has broad application prospects in the field of vision protection and holds significant social and strategic value in advancing the establishment of a youth vision health management system. Based on the continuous refractive error data obtained from this online system, we will further conduct research on personalized refractive error progression prediction.

5. Conclusions

This study proposes an online refractive error screening solution centered on CFGN. Through multi-channel information fusion and a CFG module, CFGN significantly enhances the accuracy of refractive error screening. Extensive comparative experiments, transfer learning experiments, and ablation experiments were conducted on our self-built training sets. The experimental results show that fine-tuning the pretrained model with real-human-eye data further improves the model’s accuracy in refractive error screening tasks, particularly in small-sample scenarios, where the improvement is especially noticeable. Compared to traditional networks such as ResNet-50 and Vit, CFGN demonstrated outstanding performance in refractive error screening, achieving an accuracy ( A C C 1 ) of 92.7%. In addition, this study validated the feasibility of the transfer learning-based approach and pretrained refractive error screening task using datasets from two different regions. This technology provides a standardized solution for online vision screening using data from different regions.

Author Contributions

Conceptualization: J.W.; methodology: J.W. and T.Z. (Tianyou Zheng); formal analysis and investigation: J.W. and T.Z. (Tianli Zheng); writing—original draft preparation: J.W. and T.Z. (Tianyou Zheng); writing—review and editing: T.Z. (Tianyou Zheng), W.F. and Y.Z.; visualization: J.W.; funding acquisition: W.F. and Y.Z.; resources: W.F., Y.Z. and T.Z. (Tianli Zheng); supervision: W.F. All authors reviewed the results and approved the final version of the manuscript.

Funding

This work was supported by the Youth Innovation Promotion Association of the Chinese Academy of Sciences (Y202072) and in part by the Natural Science Foundation of Shandong Province (ZR2021QE205).This research was funded by Suzhou Basic Scientific Research Project, grant number SSD2024013.

Data Availability Statement

The data will be made available by the authors on request.

Acknowledgments

Thanks to Shangshang Ding and Zhe Zhou for their technical support.

Conflicts of Interest

Yang Zhang was employed by the company Jinan Guoke Medical Technology Development Co., Ltd. The authors declare no conflicts of interest.

Abbreviations

The following abbreviations are used in this manuscript:
CFGNComparative Feature-Guided Network
MAEMean absolute error
ViTVision Transformer
CFG moduleComparative Feature-Guided module
GANsGenerative Adversarial Networks

References

  1. Biswas, S.; El Kareh, A.; Qureshi, M.; Lee, D.M.X.; Sun, C.H.; Lam, J.S.; Saw, S.M.; Najjar, R.P. The influence of the environment and lifestyle on myopia. J. Physiol. Anthropol. 2024, 43, 7. [Google Scholar] [CrossRef] [PubMed]
  2. Zong, Z.; Zhang, Y.; Qiao, J.; Tian, Y.; Xu, S. The association between screen time exposure and myopia in children and adolescents: A meta-analysis. BMC Public Health 2024, 24, 1625. [Google Scholar] [CrossRef]
  3. Demirci, G.; Arslan, B.; Özsücü, M.; Eliaçik, M.; Gulkilik, G. Comparison of photorefraction, autorefractometry and retinoscopy in children. Int. Ophthalmol. 2014, 34, 739–746. [Google Scholar] [CrossRef] [PubMed]
  4. Reali, G.; Femminella, M. Artificial Intelligence to Reshape the Healthcare Ecosystem. Future Internet 2024, 16, 343. [Google Scholar] [CrossRef]
  5. Gao, X.; He, P.; Zhou, Y.; Qin, X. Artificial Intelligence Applications in Smart Healthcare: A Survey. Future Internet 2024, 16, 308. [Google Scholar] [CrossRef]
  6. Priyadarshini, I. Autism screening in toddlers and adults using deep learning and fair AI techniques. Future Internet 2023, 15, 292. [Google Scholar] [CrossRef]
  7. Varadarajan, A.V.; Poplin, R.; Blumer, K.; Angermueller, C.; Ledsam, J.; Chopra, R.; Keane, P.A.; Corrado, G.S.; Peng, L.; Webster, D.R. Deep learning for predicting refractive error from retinal fundus images. Investig. Ophthalmol. Vis. Sci. 2018, 59, 2861–2868. [Google Scholar] [CrossRef]
  8. He, K.; Zhang, X.; Ren, S.; Sun, J. Deep residual learning for image recognition. In Proceedings of the IEEE Conference on Computer Vision and Pattern Recognition, Las Vegas, NV, USA, 27–30 June 2016; pp. 770–778. [Google Scholar] [CrossRef]
  9. Zou, H.; Shi, S.; Yang, X.; Ma, J.; Fan, Q.; Chen, X.; Wang, Y.; Zhang, M.; Song, J.; Jiang, Y.; et al. Identification of ocular refraction based on deep learning algorithm as a novel retinoscopy method. BioMed. Eng. OnLine 2022, 21, 87. [Google Scholar]
  10. Bobier, W.R.; Braddick, O.J. Eccentric photorefraction: Optical analysis and empirical measures. Optom. Vis. Sci. 1985, 62, 614–620. [Google Scholar] [CrossRef]
  11. Colicchia, G.; Wiesner, H.; Zollman, D. Photorefraction of the Eye. Phys. Teach. 2015, 53, 103–105. [Google Scholar] [CrossRef]
  12. Agarwala, R.; Leube, A.; Wahl, S. Utilizing minicomputer technology for low-cost photorefraction: A feasibility study. Biomed. Opt. Express 2020, 11, 6108–6121. [Google Scholar] [CrossRef] [PubMed]
  13. Chun, J.; Kim, Y.; Shin, K.Y.; Han, S.H.; Oh, S.Y.; Chung, T.Y.; Park, K.A.; Lim, D.H. Deep learning-based prediction of refractive error using photorefraction images captured by a smartphone: Model development and validation study. JMIR Med. Inform. 2020, 8, e16225. [Google Scholar] [CrossRef] [PubMed]
  14. Fu, E.; Yang, Z.; Leong, H.; Ngai, G.; Do, C.W.; Chan, L. Exploiting Active Learning in Novel Refractive Error Detection with Smartphones. In Proceedings of the 28th ACM international Conference on Multimedia, Seattle, WA, USA, 12–16 October 2020; pp. 2775–2783. [Google Scholar] [CrossRef]
  15. Yang, C.C.; Su, J.J.; Li, J.E.; Zhu, Z.Y.; Tseng, J.S.; Cheng, C.M.; Tien, C.H. Accessing refractive errors via eccentric infrared photorefraction based on deep learning. In Proceedings of the SPIE Future Sensing Technologies, Tokyo, Japan, 13–14 November 2019; Volume 11197, pp. 101–103. [Google Scholar] [CrossRef]
  16. Xu, D.; Ding, S.; Zheng, T.; Zhu, X.; Gu, Z.; Ye, B.; Fu, W. Deep learning for predicting refractive error from multiple photorefraction images. BioMed. Eng. OnLine 2022, 21, 55. [Google Scholar] [CrossRef]
  17. Linde, G.; Chalakkal, R.; Zhou, L.; Huang, J.L.; O’Keeffe, B.; Shah, D.; Davidson, S.; Hong, S.C. Automatic refractive error estimation using deep learning-based analysis of red reflex images. Diagnostics 2023, 13, 2810. [Google Scholar] [CrossRef]
  18. Deng, J.; Dong, W.; Socher, R.; Li, L.J.; Li, K.; Fei-Fei, L. Imagenet: A large-scale hierarchical image database. In Proceedings of the IEEE Conference on Computer Vision and Pattern Recognition, Miami, FL, USA, 20–25 June 2009; IEEE: New York, NY, USA, 2009; pp. 248–255. [Google Scholar] [CrossRef]
  19. Chang, K.; Gidwani, M.; Patel, J.B.; Li, M.D.; Kalpathy-Cramer, J. Data Curation Challenges for Artificial Intelligence. In Auto-Segmentation for Radiation Oncology; CRC Press: Boca Raton, FL, USA, 2021; pp. 201–216. [Google Scholar]
  20. Razzak, M.I.; Naz, S.; Zaib, A. Deep learning for medical image processing: Overview, challenges and the future. In Classification in BioApps: Automation of Decision Making; Springer: Cham, Switzerland, 2018; pp. 323–350. [Google Scholar]
  21. Shrivastava, A.; Pfister, T.; Tuzel, O.; Susskind, J.; Wang, W.; Webb, R. Learning from simulated and unsupervised images through adversarial training. In Proceedings of the IEEE Conference on Computer Vision and Pattern Recognition, Honolulu, HI, USA, 21–26 July 2017; pp. 2107–2116. [Google Scholar] [CrossRef]
  22. Nair, N.; Kothari, R.; Chaudhary, A.K.; Yang, Z.; Diaz, G.J.; Pelz, J.B.; Bailey, R.J. RIT-Eyes: Rendering of near-eye images for eye-tracking applications. In Proceedings of the ACM Symposium on Applied Perception 2020, Virtual Event, 12–13 September 2020; pp. 1–9. [Google Scholar] [CrossRef]
  23. Liu, J.; Liu, H.; Fu, H.; Ye, Y.; Chen, K.; Lu, Y.; Mao, J.; Xu, R.X.; Sun, M. Edge-Guided Contrastive Adaptation Network for Arteriovenous Nicking Classification Using Synthetic Data. IEEE Trans. Med. Imaging 2023, 43, 1237–1246. [Google Scholar] [CrossRef]
  24. Kaspar, M.; Osorio, J.D.M.; Bock, J. Sim2real transfer for reinforcement learning without dynamics randomization. In Proceedings of the 2020 IEEE/RSJ International Conference on Intelligent Robots and Systems (IROS), Las Vegas, NV, USA, 24 October 2020–24 January 2021; IEEE: New York, NY, USA, 2020; pp. 4383–4388. [Google Scholar] [CrossRef]
  25. Zhu, J.Y.; Park, T.; Isola, P.; Efros, A.A. Unpaired image-to-image translation using cycle-consistent adversarial networks. In Proceedings of the IEEE International Conference on Computer Vision, Honolulu, HI, USA, 21–26 July 2017; pp. 2223–2232. [Google Scholar] [CrossRef]
  26. Pan, S.J.; Yang, Q. A survey on transfer learning. IEEE Trans. Knowl. Data 2009, 22, 1345–1359. [Google Scholar] [CrossRef]
  27. Ridnik, T.; Ben-Baruch, E.; Noy, A.; Zelnik-Manor, L. Imagenet-21k pretraining for the masses. arXiv 2021, arXiv:2104.10972. [Google Scholar] [CrossRef]
  28. Wen, Y.; Chen, L.; Deng, Y.; Zhou, C. Rethinking pre-training on medical imaging. J. Vis. Commun. Image Represent. 2021, 78, 103145. [Google Scholar] [CrossRef]
  29. Mishra, S.; Panda, R.; Phoo, C.P.; Chen, C.F.R.; Karlinsky, L.; Saenko, K.; Saligrama, V.; Feris, R.S. Task2Sim: Towards Effective Pre-Training and Transfer From Synthetic Data. In Proceedings of the IEEE/CVF Conference on Computer Vision and Pattern Recognition, New Orleans, LA, USA, 18–24 June 2022; pp. 9194–9204. [Google Scholar] [CrossRef]
  30. Vaswani, A. Attention is all you need. arXiv 2017, arXiv:1706.03762. [Google Scholar] [CrossRef]
  31. Dosovitskiy, A. An image is worth 16x16 words: Transformers for image recognition at scale. arXiv 2020, arXiv:2010.11929. [Google Scholar]
  32. Han, K.; Wang, Y.; Chen, H.; Chen, X.; Guo, J.; Liu, Z.; Tang, Y.; Xiao, A.; Xu, C.; Xu, Y.; et al. A survey on vision transformer. IEEE Trans. Pattern Anal. Mach. Intell. 2022, 45, 87–110. [Google Scholar] [CrossRef] [PubMed]
  33. Carion, N.; Massa, F.; Synnaeve, G.; Usunier, N.; Kirillov, A.; Zagoruyko, S. End-to-end object detection with transformers. In Proceedings of the European Conference on Computer Vision, Glasgow, UK, 23–28 August 2020; Springer: Cham, Switzerland, 2020; pp. 213–229. [Google Scholar] [CrossRef]
  34. Chen, J.; Lu, Y.; Yu, Q.; Luo, X.; Adeli, E.; Wang, Y.; Lu, L.; Yuille, A.; Zhou, Y. Transunet: Transformers Make Strong Encoders for Medical Image Segmentation; Technical Report; Johns Hopkins University: Baltimore, MD, USA, 2021. [Google Scholar]
  35. Hu, R.; Singh, A. Unit: Multimodal multitask learning with a unified transformer. In Proceedings of the IEEE/CVF International Conference on Computer Vision, Montreal, QC, Canada, 10–17 October 2021; pp. 1439–1449. [Google Scholar] [CrossRef]
  36. Wright, D.; Augenstein, I. Transformer based multi-source domain adaptation. arXiv 2020, arXiv:2009.07806. [Google Scholar]
  37. Lengyel, A.; Garg, S.; Milford, M.; van Gemert, J.C. Zero-shot day-night domain adaptation with a physics prior. In Proceedings of the IEEE/CVF International Conference on Computer Vision, Montreal, QC, Canada, 10–17 October 2021; pp. 4399–4409. [Google Scholar] [CrossRef]
  38. Chen, H.; Wu, C.; Xu, Y.; Du, B. Unsupervised Domain Adaptation for Semantic Segmentation via Low-Level Edge Information Transfer; Technical Report; Wuhan University: Wuhan, China, 2021. [Google Scholar]
  39. Chollet, F. Xception: Deep learning with depthwise separable convolutions. In Proceedings of the IEEE Conference on Computer Vision and Pattern Recognition, Honolulu, HI, USA, 21–26 July 2017; pp. 1251–1258. [Google Scholar]
  40. Bay, H.; Tuytelaars, T.; Van Gool, L. Surf: Speeded up robust features. In Proceedings of the Computer Vision—ECCV 2006: 9th European Conference on Computer Vision, Graz, Austria, 7–13 May 2006; Proceedings, Part I 9. Springer: Cham, Switzerland, 2006; pp. 404–417. [Google Scholar]
  41. Kingma, D.P.; Ba, J. Adam: A method for stochastic optimization. arXiv 2014, arXiv:1412.6980. [Google Scholar]
  42. He, K.; Zhang, X.; Ren, S.; Sun, J. Delving deep into rectifiers: Surpassing human-level performance on imagenet classification. In Proceedings of the IEEE/CVF International Conference on Computer Vision, Santiago, Chile, 7–13 December 2015; pp. 1026–1034. [Google Scholar] [CrossRef]
  43. Paszke, A.; Gross, S.; Massa, F.; Lerer, A.; Bradbury, J.; Chanan, G.; Killeen, T.; Lin, Z.; Gimelshein, N.; Antiga, L.; et al. PyTorch: An Imperative Style, High-Performance Deep Learning Library. In Proceedings of the NeurIPS, Vancouver, BC, Canada, 8–14 December 2019; pp. 8026–8037. [Google Scholar]
  44. Karen, S. Very deep convolutional networks for large-scale image recognition. arXiv 2014, arXiv:1409.1556. [Google Scholar]
  45. Huang, G.; Liu, Z.; Van Der Maaten, L.; Weinberger, K.Q. Densely connected convolutional networks. In Proceedings of the IEEE Conference on Computer Vision and Pattern Recognition, Honolulu, HI, USA, 21–26 July 2017; pp. 4700–4708. [Google Scholar] [CrossRef]
  46. Krizhevsky, A.; Sutskever, I.; Hinton, G.E. Imagenet classification with deep convolutional neural networks. NeurIPS 2012, 25, 323–350. [Google Scholar] [CrossRef]
  47. Xie, S.; Girshick, R.; Dollár, P.; Tu, Z.; He, K. Aggregated residual transformations for deep neural networks. In Proceedings of the IEEE Conference on Computer Vision and Pattern Recognition, Honolulu, HI, USA, 21–26 July 2017; pp. 1492–1500. [Google Scholar] [CrossRef]
  48. Hu, J.; Shen, L.; Sun, G. Squeeze-and-excitation networks. In Proceedings of the IEEE Conference on Computer Vision and Pattern Recognition, Salt Lake City, UT, USA, 18–23 June 2018; pp. 7132–7141. [Google Scholar] [CrossRef]
  49. Liu, Z.; Lin, Y.; Cao, Y.; Hu, H.; Wei, Y.; Zhang, Z.; Lin, S.; Guo, B. Swin transformer: Hierarchical vision transformer using shifted windows. In Proceedings of the IEEE/CVF International Conference on Computer Vision, Montreal, QC, Canada, 10–17 October 2021; pp. 10012–10022. [Google Scholar]
Figure 1. (a) The raw infrared image acquired. (b) The segmented pupil region. (c) The change in the bright and dark areas of the pupil.
Futureinternet 17 00160 g001
Figure 2. Eccentric photorefraction schematic [10].
Futureinternet 17 00160 g002
Figure 3. Routine online vision screening network system.
Futureinternet 17 00160 g003
Figure 4. Overview of this study. We use the collection platform to establish the model-eye dataset and the real-eye dataset. The CFGN is pretrained using model-eye data, and then the model is tuned using real-human-eye data.
Futureinternet 17 00160 g004
Figure 5. Theoretical and empirical data on a model eye. The width of this crescent-shaped bright area is not a linear function of the diopter. Once a threshold refractive error is reached, the crescent width increases sharply with the diopter and eventually approaches an asymptote. Beyond this threshold of 2D, the crescent area shows little measurable change.
Futureinternet 17 00160 g005
Figure 6. (a) The top view of the device. (b) The front view of the device.
Futureinternet 17 00160 g006
Figure 7. Eccentric light position. The horizontally arranged 0°, 60°, and 120° light groups form three sets of radial eccentricity variation images, which include the changes in the crescent bright area within the pupil under the same angle but different eccentric light sources. The vertically arranged light groups form a set of axial variation images with the same eccentricity, showing the changes in the crescent bright area within the pupil under different angles but with the same eccentricity.
Futureinternet 17 00160 g007
Figure 8. (a,b) Objective model-eye structure diagrams. (c) Objective simulation of the actual-eye diagram.
Futureinternet 17 00160 g008
Figure 9. Schematic diagram of the data acquisition process.
Futureinternet 17 00160 g009
Figure 10. Eccentric infrared images: (a) 2 D model-eye data; (b) 5 D model-eye data; (c) 3 D model-eye data; (d) 2 D real-human-eye data; (e) 5 D real-human-eye data; (f) 3 D real-human-eye data.
Futureinternet 17 00160 g010
Figure 11. Comparative Feature-Guided Network.
Futureinternet 17 00160 g011
Figure 12. Aberration contrast diagram. Irradiated with the same eccentricity of infrared light, the myopic pupil is in opposite positions to the bright areas produced in the hyperopic pupil.
Futureinternet 17 00160 g012
Figure 13. The pattern of aberration. As the diopter of hyperopia increases, the area of bright areas in the eccentric infrared pupil image increases.
Futureinternet 17 00160 g013
Figure 14. Comparative Feature-Guided module.
Futureinternet 17 00160 g014
Figure 15. Image contrast module ( · ) .
Futureinternet 17 00160 g015
Figure 16. Schematic diagram of the Residual-6 Block structure.
Futureinternet 17 00160 g016
Figure 17. (a) The training process of ResNet-50-6 on Dataset1. (b) The training process of ResNet-50-6 on Dataset2. (c) The training process of CFGN on Dataset1. (d) The training process of CFGN on Dataset2.
Futureinternet 17 00160 g017
Figure 18. Practical application scenarios.
Futureinternet 17 00160 g018
Table 1. Number of hyperopic high-diopter images.
Diopter2 D2.5 D3 D3.5 D4 D4.5 D5 D6 D
Jinzhou179143321
Tacheng225460302
Table 2. Development environment parameters.
ParameterParameter Value
System environmentLinux
CPUIntel(R) Xeon(R) Platinum 8336c
GPU (Graphics Processing Unit)NVIDIAGeForce RTX4090
Development languagePython3.10
Table 3. Results of comparative experiments on the Jinzhou dataset.
ModelDataset1Dataset2
ACC0.5 (%)ACC1 (%)MAEACC0.5 (%)ACC1 (%)MAE
DenseNet-121 [45]61.787.80.27452.076.30.385
VGG-16 [44]63.989.20.26550.874.00.343
AlexNet [46]64.689.70.23155.476.80.274
ResNet-18 [8]61.688.60.27455.976.80.390
ResNet-50 [8]63.188.80.25554.875.70.380
ResNeXt-50 [47]61.288.20.26552.074.60.366
Se-ResNet-50 [48]65.188.10.24953.176.80.364
Vit [31]64.988.80.504×××
Swin Transformer [49]64.689.00.50550.374.00.958
REDNet [16]63.188.90.25052.075.70.399
ResNet-50-666.191.10.23657.179.10.321
CFGN69.6 †92.5 †0.230 †61.6 †81.9 †0.285 †
† represents the best experimental result. ‘×’ indicates that the model cannot converge.
Table 4. Results of comparative experiments on the Tacheng dataset.
ModelDataset3Dataset4
ACC0.5 (%)ACC1 (%)MAEACC0.5 (%)ACC1 (%)MAE
DenseNet-121 [45]58.686.40.20049.874.70.395
VGG-16 [44]62.088.20.20149.478.50.346
AlexNet [46]63.588.10.14653.277.60.290
ResNet-18 [8]62.587.40.18354.977.60.425
ResNet-50 [8]60.887.40.24452.375.90.353
ResNeXt-50 [47]60.587.20.22650.675.50.335
Se-ResNet-50 [48]62.187.10.21352.778.10.342
Vit [31]63.088.10.52246.872.60.858
Swin Transformer [49]63.188.20.51752.378.90.820
REDNet [16]64.188.60.19854.977.60.310
ResNet-50-668.591.60.14557.081.90.300
CFGN70.1 †92.0 †0.123 †62.0 †83.5 †0.249 †
† represents the best experimental result.
Table 5. Results of transfer learning experiments on the Jinzhou dataset.
ModelDataset1Dataset2
ACC0.5 (%)ACC1 (%)MAEACC0.5 (%)ACC1 (%)MAE
ResNet-18 [8]61.688.60.27455.976.80.390
ResNet-18-ImageNet1k [8]62.589.30.24257.177.40.333
ResNet-18-pre [8]63.389.40.23659.977.40.259
ResNet-50 [8]63.188.80.25554.875.70.380
ResNet-50-ImageNet1k [8]64.289.20.24356.577.40.354
ResNet-50-pre [8]63.489.60.24958.278.00.334
Vit [31]64.988.80.504×××
Vit-ImageNet1k [31]64.189.70.49553.177.40.819
Vit-pre [31]65.089.20.49757.177.40.807
Swin Transformer [49]64.689.00.50550.374.00.958
Swin Transformer-ImageNet1k [49]64.889.40.48956.575.70.812
Swin Transformer-pre [49]65.689.60.49357.177.40.758
ResNet-50-666.191.10.23657.179.10.321
ResNet-50-6-pre67.991.60.24457.679.70.293
CFGN69.692.50.23061.681.90.285
CFGN-pre69.592.7 †0.168 †62.7 †84.2 †0.270 †
† represents the best experimental result. ‘×’ indicates that the model cannot converge. ‘-ImageNet1k’ represents the use of the ImageNet1k pretrained model. ‘-pre’ represents the use of the model-eye pretrained model.
Table 6. Results of transfer learning experiments on the Tacheng dataset.
ModelDataset3Dataset4
ACC0.5 (%)ACC1 (%)MAEACC0.5 (%)ACC1 (%)MAE
ResNet-18 [8]62.587.40.18354.977.60.425
ResNet-18-ImageNet1k [8]64.587.70.21854.978.50.361
ResNet-18-pre [8]63.088.60.20555.378.90.321
ResNet-50 [8]60.887.40.24452.375.90.353
ResNet-50-ImageNet1k [8]61.787.40.23153.277.60.294
ResNet-50-pre [8]61.788.20.19455.779.70.301
Vit [31]63.088.10.52246.872.60.858
Vit-ImageNet1k [31]63.288.10.51652.778.50.758
Vit-pre [31]64.488.60.50355.379.70.752
Swin Transformer [49]63.188.20.51752.378.90.820
Swin Transformer-ImageNet1k [49]63.688.40.51654.481.00.716
Swin Transformer-pre [49]64.588.50.50458.281.40.702
ResNet-50-668.591.60.14557.081.90.300
ResNet-50-6-pre68.991.80.13261.682.30.265
CFGN70.192.00.12362.083.50.249
CFGN-pre71.6 †92.1 †0.108 †63.7 †84.8 †0.247 †
† represents the best experimental result. ‘-ImageNet1k’ represents the use of the ImageNet1k pretrained model. ‘-pre’ represents the use of the model-eye pretrained model.
Table 7. Result of model optimization.
Dataset1CFG ModuleBottom TransformerACC0.5 (%)ACC1 (%)MAE
baseline××67.490.10.269
×68.892.20.236
×68.892.00.235
69.6 †92.5 †0.230 †
† represents the optimal experimental result.
Disclaimer/Publisher’s Note: The statements, opinions and data contained in all publications are solely those of the individual author(s) and contributor(s) and not of MDPI and/or the editor(s). MDPI and/or the editor(s) disclaim responsibility for any injury to people or property resulting from any ideas, methods, instructions or products referred to in the content.