Abstract
This study examines the integration of the Internet of Vehicles (IoV) and blockchain as tools to optimize traffic management in Roll-on/Roll-off (Ro-Ro) terminals within the Spanish port system. Faced with increasing operational complexity, these technologies present innovative solutions to enhance efficiency, reduce waiting times, and ensure transparency in data management. The methodology follows five main phases: analysis of the current scenario, establishment of a baseline, calculations to evaluate key outcomes, analysis of blockchain implementation, and discussion of results. Key variables include waiting times, vehicular flow, CO2 emissions, and operational costs, comparing manual and automated scenarios. The findings reveal that the combined use of IoV and blockchain can increase vehicular flow by up to 70%, reduce waiting times by 2.56 min, and decrease CO2 emissions by 57.74 kg per hour. Additionally, automation significantly reduces operational costs, yielding average savings of over EUR 500 per hour. This study concludes that adopting these technologies transforms port operations by fostering sustainability, efficiency, and safety. However, challenges remain, including high initial implementation costs and system interoperability issues. This work underscores the need for strategic approaches to overcome these barriers and positions Spanish ports as potential leaders in logistics innovation, aligning with global demands for sustainable, efficient, and transparent port operations.
1. Introduction
The management of Roll-on/Roll-off (Ro-Ro) terminals is becoming increasingly complex. To improve operational efficiency and data security, it is necessary to implement innovative solutions. The integration of technologies such as the Internet of Vehicles (IoV) and blockchain represents a promising approach. The IoV enables real-time communication between vehicles and infrastructure. This optimization improves operations and reduces waiting times. Meanwhile, the blockchain provides an immutable and decentralized record of transactions [1], guaranteeing transparency and security in the exchange of information [2].
The management of Roll-on/Roll-off (Ro-Ro) terminals is becoming increasingly complex due to the rising volume of vehicle traffic in ports, the need for stricter environmental regulations, and the growing demand for digitalization in port logistics [1,2]. These factors require innovative solutions to optimize efficiency and ensure sustainable operations.
Some studies suggest that the IoV can enhance vehicle identity authentication and data management; however, its practical implementation still faces challenges, particularly in integrating security and privacy solutions [3]. In addition, recent studies have explored the optimization of the allocation of storage locations in Ro-Ro automotive terminals, evidencing significant improvements in vessel loading efficiency and a reduction in reliance on storage resources [4]. The combination of these technologies can transform port operations, enabling more efficient and secure management of Ro-Ro terminals.
In the context of port terminals, the combined use of IoV and blockchain enables new management models based on real-time data and smart contracts [5]. For example, smart contracts can automate the collection of port fees based on operating time, or incentivize emissions reductions through automated bonuses. This not only improves transparency between stakeholders, but also reduces the need for manual intervention in administrative processes, increasing the efficiency and reliability of operations.
The joint implementation of IoV and blockchain in this context presents challenges, such as the scalability and interoperability of systems [6]. It is critical to investigate how these technologies can be effectively integrated to maximize their benefits in Ro-Ro terminals.
The application of blockchain in the IoV has proven to be effective in international contexts, improving vehicle identity authentication and real-time data management [7]. In Spanish Ro-Ro terminals, these technologies could automate processes such as the collection of fees according to operating times and the dynamic management of storage spaces, generating a competitive advantage in an increasingly digitized market [7]. In addition, decentralizing data storage using blockchain eliminates the risks associated with a single point of failure, increasing the resilience of the system.
The integration of IoV and blockchain can significantly improve the efficiency, transparency, and security of operations in Ro-Ro terminals. These technologies enable real-time data exchange and automated management processes, enhancing port logistics.
Despite the potential benefits, the adoption of IoV and blockchain in Spanish Ro-Ro terminals faces barriers such as high initial implementation costs, interoperability between systems, and the training needed to integrate these technologies [8]. However, the urgency of maintaining competitiveness in a globalized sector makes it imperative to explore innovative models that combine these technologies. This study proposes an integrated IoV and blockchain model applied to Spanish Ro-Ro terminals, with the aim of optimizing vehicle operations and evaluating their impact in terms of operational efficiency and data security.
2. State of the Art
2.1. Current Technologies in Port Terminals
Port terminals have not been immune to the technological revolution that is presently occurring globally, which is why ports have incorporated advanced technologies that seek to optimize operational management and reduce loading and unloading times. Automation using systems such as AGVs (Automated Guided Vehicles) has significantly improved operational efficiency in Ro-Ro terminals, reducing the need for human labor [9]. In addition, the use of algorithms in endpoint management systems allows for a more precise allocation of resources, improving responsiveness to peak activity [10].
However, in many cases, terminals face challenges related to a lack of technological interoperability and the need to upgrade infrastructures to support new technologies [11].
Blockchain has been successfully implemented in port logistics to improve data integrity and automate administrative processes. For example, the Port of Antwerp has launched pilot projects that leverage blockchain for real-time cargo tracking and customs clearance, demonstrating its potential in Ro-Ro operations. These innovations have transformative implications not only for Roll-on/Roll-off (Ro-Ro) terminals but also for other critical areas such as containerized cargo handling, urban freight systems, and multimodal logistics chains. The IoV facilitates seamless communication between vehicles, infrastructure, and port systems, optimizing traffic management and reducing inefficiencies in port operations. Blockchain, on the other hand, enhances transparency and security in cargo tracking, enabling real-time data sharing across stakeholders. Ref. [12] emphasizes that ports adopting advanced digital technologies, such as IoV, can significantly improve operational performance and reduce bottlenecks caused by limited infrastructure. Globally, leading ports such as Rotterdam and Singapore are leveraging IoV and blockchain to pioneer smart transportation systems that integrate maritime, road, and rail logistics, setting benchmarks for innovation in the industry.
2.2. Use of the Internet of Vehicles (IoV) in Vehicle Logistics
The Internet of Vehicles (IoV) is an extension of the Internet of Things (IoT) that connects vehicles, infrastructure, and devices through smart grids to facilitate real-time communication. In the field of vehicle logistics, this technology has transformed the way operations are managed, enabling a constant flow of data that improves the efficiency, safety, and sustainability of transportation [13]. Its impact is particularly relevant in Ro-Ro terminals, where dynamic vehicular traffic management is critical due to the volume and frequency of operations.
In Ro-Ro terminals, the IoV enables intelligent vehicular traffic management, optimizing internal routes and minimizing waiting times. Through V2X (vehicle-to-everything) technology, vehicles can communicate directly with port infrastructures (V2I) and with other vehicles (V2V), sharing information such as estimated time of arrival, internal route conditions, and dock assignments. This allows operations to be adjusted in real time, improving coordination between vehicles and reducing congestion in key areas [14].
A key aspect of the IoV in this context is its ability to support advanced space and time allocation systems. For example, the use of predictive algorithms integrated with real-time data makes it possible to optimize the parking and loading of vehicles on ships, reducing operational times and maximizing the use of terminal capacity [15]. These improvements also contribute to greater operational sustainability by reducing fuel consumption and greenhouse gas emissions associated with long wait times.
In addition, the IoV makes it easy to implement driver-assistance technologies such as collision warning systems and adaptive cruise control. These technologies not only improve operational safety, but also reduce the risk of damage to vehicles and port infrastructure, a recurring problem in terminals with high traffic density [16].
Despite its benefits, the implementation of the IoV in port terminals faces significant challenges. The lack of advanced technological infrastructure, such as 5G communication networks, limits the ability of IoV systems to handle large volumes of data in real-time. In addition, resistance to change in traditional operational processes and the need for specialized training for operators and drivers also delay their adoption [17]. Interoperability between different IoT systems and technological standardization are critical issues that need to be addressed to ensure widespread adoption in the port sector.
Across Europe, the adoption of IoV and blockchain technologies is reshaping port operations, with many countries investing heavily in digital transformation. Ports such as Rotterdam in the Netherlands, Antwerp in Belgium, and Hamburg in Germany have implemented IoV systems to enhance real-time communication between transport modes and port infrastructure. These initiatives have enabled the efficient coordination of vehicle flows, reduced turnaround times, and minimized environmental impacts. In addition to IoV, blockchain is being used to secure data exchange, streamline customs procedures, and ensure traceability of goods across the supply chain. Ref. [18] highlights that European ports, especially those involved in multimodal logistics, are at the forefront of adopting space-efficient and digitally integrated solutions. For example, the Port of Antwerp’s blockchain pilot projects have demonstrated the potential for secure, real-time cargo documentation, which aligns with the EU’s broader goals for digitalization and sustainability. These advancements place European ports in a leadership position, demonstrating how technology can address challenges such as congestion, inefficiency, and environmental impact.
In the case of Spain, the implementation of IoV in port terminals could position these ports as leaders in logistics innovation in Europa. This would not only improve the competitiveness of Spanish ports, but also reduce operating costs and improve the customer experience by ensuring shorter waiting times and safer and more transparent operations.
2.3. Benefits of Blockchain for Data Management in IoV
Blockchain complements the IoV by offering a decentralized and secure system for real-time operational data management. In port terminals, blockchain can ensure the transparency and integrity of data related to loading times, economic transactions, and vehicular routes [8].
Smart contracts, based on blockchain, make it possible to automate administrative processes such as the collection of fees and the allocation of storage spaces, reducing costs and operational errors [17]. However, the scalability of blockchain solutions and the initial cost of implementation remain significant challenges to their adoption in port environments [19].
The integration of IoV and blockchain into Ro-Ro terminals offers a promising solution to address today’s operational challenges. While IoV provides real-time communication and dynamic vehicular traffic management, blockchain ensures that the data generated is immutable and auditable [13]. This synergy allows for greater transparency and trust between the actors involved, improving coordination and optimizing operation times [20]. However, joint implementation requires overcoming technical and economic barriers to ensure its viability in complex environments such as ports.
The introduction of IoV and blockchain in Ro-Ro terminals will not only impact internal port operations but also have significant implications for the broader supply chain. For these technologies to be effective, logistics providers, shipping companies, and customs authorities must integrate them into their workflows. Without such coordination, the full benefits of automation and real-time data exchange may not be realized, limiting efficiency gains.
2.4. Operations in Ro-Ro Terminals
Roll-on/Roll-off (Ro-Ro) operations, while efficient for transporting vehicles and heavy machinery, face numerous challenges due to logistical complexity and limitations in port infrastructure. These issues not only affect the efficiency of operations but also have broader economic and environmental implications. Below is a detailed analysis of the key operational challenges faced by Ro-Ro terminals.
One of the most pressing issues in Ro-Ro terminals is vehicular congestion, which creates bottlenecks during loading and unloading operations. This congestion often arises from poor traffic management planning within the terminal and insufficient coordination among ships, transporters, and port personnel. The resulting delays significantly increase waiting times and operational costs, as noted by studies on port traffic management [21].
A lack of synchronization between ship schedules and vehicle movements frequently disrupts operations. The limited use of advanced technologies for real-time tracking and management exacerbates this issue. Moreover, poor communication between key stakeholders, including port operators, shipping lines, and transporters, leads to logistical delays and reduced efficiency [22]. This inefficiency undermines the competitive edge of Ro-Ro terminals in global logistics networks.
The high density of vehicles and machinery in Ro-Ro terminals increases the likelihood of accidents, posing risks to personnel and equipment. Contributing factors include insufficient real-time monitoring systems, inadequate staff training, and a lack of clear signage or guidance systems. Studies have shown that improving safety protocols and integrating automation can significantly mitigate these risks [23].
Vehicles often experience prolonged waiting periods for embarkation or disembarkation. This issue is largely attributed to slow, manual processes for inventory and document management, as well as limited terminal capacity. Extended waiting times not only increase costs for transporters and operators but also lead to customer dissatisfaction, as highlighted in recent analyses of Ro-Ro operations [24].
Many Ro-Ro terminals struggle with space limitations for storing and organizing vehicles. The lack of optimized strategies for vehicle placement and infrastructure constraints reduces the operational capacity of the port. Effective use of space has been identified as a critical factor in enhancing the efficiency of Ro-Ro terminals [25].
Inefficient operations lead to increased costs associated with fuel consumption, labor, and maintenance. The continued reliance on manual processes and the limited adoption of automation or IoT technologies are major contributing factors. Addressing these inefficiencies is essential for improving the financial viability of Ro-Ro terminals [26].
Ro-Ro operations are significant contributors to CO2 emissions due to prolonged waiting times with idling engines and the extensive use of machinery. The absence of sustainable strategies for managing operations further exacerbates this issue. Implementing eco-friendly practices and reducing idle times have been identified as key solutions for minimizing the environmental footprint of Ro-Ro terminals [27].
Despite the potential benefits, many Ro-Ro terminals have not yet implemented advanced technologies such as IoT or IoV. High initial investments and a lack of technical expertise often deter adoption. This technological gap places Ro-Ro terminals at a competitive disadvantage compared to more advanced ports [6].
Fluctuations in the volume of vehicles to be transported present significant planning challenges for Ro-Ro terminals. These fluctuations are driven by seasonal factors and changes in customer demand or trade routes. Addressing this variability requires flexible operational strategies and predictive planning models [6,28].
Operational practices in Ro-Ro terminals vary significantly across countries and regions, complicating efforts to standardize processes. The absence of uniform standards limits interoperability and creates inefficiencies in global logistics chains. Addressing this issue would require coordinated international efforts to establish and enforce common standards [29].
2.5. Research Gap and Furure Work
Despite advances in IoV and blockchain implementation, there is a significant gap in research applied specifically to Ro-Ro terminals. Some studies have explored the optimization of storage allocation in Ro-Ro automotive terminals, demonstrating significant improvements in vessel loading efficiency and reduced reliance on storage resources [20,30,31].
While some studies have explored the impact of these technologies on general logistics, few have focused on optimizing operations at Spanish Ro-Ro terminals [32]. This gap limits the adoption of advanced technologies in a sector that faces increasing pressure to improve operational efficiency and sustainability.
Despite the advances in the implementation of the Internet of Vehicles (IoV) and blockchain in vehicle logistics, significant gaps persist in research, both internationally and in the Spanish context. While these technologies have proven effective in general applications, their specific implementation in port terminals, particularly in Ro-Ro terminals, remains limited.
In the international arena, much of the research focuses on the development of IoV and blockchain technologies for vehicle fleets and urban transport networks, leaving aside complex port environments [13]. The available studies usually address land logistics, such as route optimization in intelligent transport systems (ITS), or the use of blockchain for the traceability of goods, but they do not explore in depth how these technologies can be integrated into specific loading and unloading operations at Ro-Ro terminals [33]. Another major gap is the lack of empirical data to support the viability of these technologies in real port environments. Although there are theoretical models and simulations that highlight the potential benefits of IoV and blockchain, few studies have evaluated their impact in terms of operational efficiency, costs, and sustainability in maritime terminals [8]. In addition, interoperability between different IoV and blockchain systems remains a critical challenge, as there are no universal standards that ensure the seamless integration of these technologies into global logistics chains.
In the Spanish context, port terminals represent a strategic pillar for the national economy, with ports such as Valencia, Barcelona, Vigo and Santander leading Ro-Ro traffic in EUR. However, the adoption of advanced technologies such as IoV and blockchain in these ports is still nascent. Most Spanish terminals still rely on partially digitized systems and manual processes for vehicular traffic management, leading to operational inefficiencies and higher costs [32].
In addition, how these technologies can be integrated into the specific operations of Spanish Ro-Ro terminals has not been adequately explored. Although there are projects related to port digitalization and automation, such as the National Ports Plan 4.0, academic research on the application of IoV and blockchain in specific terminals is still scarce. This limits the ability of Spanish ports to take full advantage of the advantages of these technologies in terms of efficiency, sustainability, and global competitiveness [34].
Both internationally and in Spain, one of the biggest challenges is the high initial cost of implementing these technologies, which includes the modernization of port infrastructures, the development of IoT networks, and the integration of blockchain systems. In addition, the lack of collaboration between key players, such as port authorities, technology companies, and logistics operators, makes it difficult to implement integrated solutions [1].
Future research can explore the extended application of blockchain in port logistics, particularly in the automation of administrative processes through smart contracts. Additionally, the integration of IoT and IoV with emerging technologies such as 5G and AI could further optimize real-time communication and decision-making in Ro-Ro terminals. A key challenge for future studies is the interoperability of these systems, which requires the development of standardized protocols for seamless integration across logistics networks. Beyond the port sector, similar technologies could be adapted to improve efficiency in container management, multimodal transport, and urban mobility solutions. Recent studies, such as those by [35,36], have highlighted innovative approaches that could be leveraged for these advancements.
3. Methodology
The methodology developed is structured in the following five main phases (Figure 1):
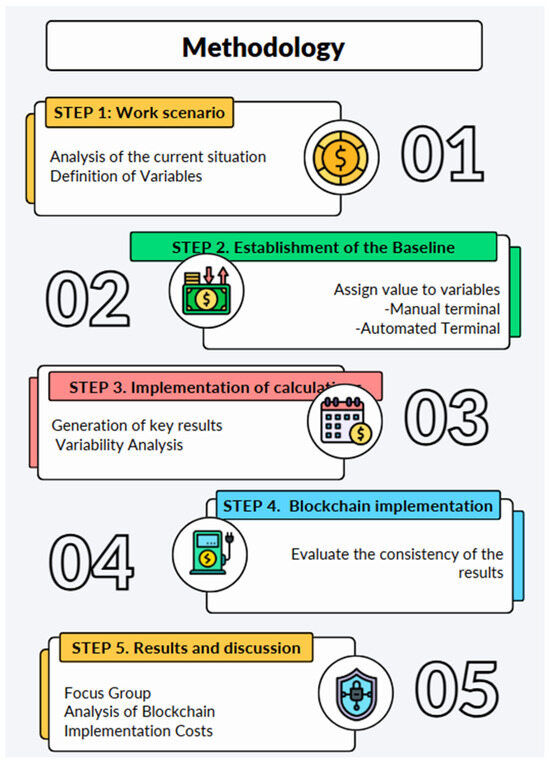
Figure 1.
Methodological scheme. Source: own elaboration.
The methodology follows five main phases: analysis of the current scenario, establishment of the baseline, calculations to evaluate key outcomes, analysis of blockchain implementation, and discussion of results. Each phase is structured to systematically assess the impact of IoV and blockchain on Ro-Ro terminals.
Phase 1: Work Scenario
In this initial stage, the current situation of the Ro-Ro terminals is analyzed, identifying the fundamental variables for the study. Dependent variables include wait time, vehicular flow, CO2 emissions, and operating costs per hour. These variables directly reflect the results of technological impact, such as the use of the Internet of Vehicles (IoV) and automation. On the other hand, independent variables, such as average time per vehicle, number of AGVs or drivers, energy consumption, and traffic volume, represent controllable factors that affect performance. This comprehensive approach makes it possible to evaluate how technological solutions can optimize the efficiency, sustainability, and profitability of terminals.
Phase 2: Establishing the Baseline
Initial values are assigned to key variables in manual and automated scenarios. This includes calculations of average time per operation, vehicular flow, CO2 emissions, costs per hour, and maximum operating capacity. These values will serve as a point of comparison to measure the benefits of the proposed technologies.
Phase 3: Implementation of Calculations
The necessary calculations are made to evaluate the key results: reduction of waiting times, increase in vehicular flow, decrease in CO2 emissions, and economic savings, both total and per vehicle. In addition, the mean and standard deviation of the variables are analyzed to evaluate the consistency of the results.
Phase 4: Blockchain Implementation Analysis
At this stage, a focus group evaluates critical aspects for blockchain implementation, such as software development, infrastructure, integration with existing systems, training, and ongoing operational costs.
Phase 5: Results and Discussion
The results obtained are consolidated, discussing the impacts and benefits of the use of advanced technologies in Ro-Ro terminals. This comprehensive analysis provides a strategic vision for the improvement of port operations, focusing on productivity, sustainability, and profitability.
4. Results and Discussion
Phase 1: Analysis of the current situation
A Ro-Ro terminal is designed to manage vehicles and Ro-Ro units that are loaded and disembarked using their own wheels, thus optimizing cargo handling and reducing operating times compared to other loading systems. The main activities and processes that characterize the operation of these terminals are described below, structured in stages.
The operation of a Ro-Ro (Roll-on/Roll-off) terminal follows a structured flow that allows the efficient loading and unloading of vehicles. This process is made up of three main stages:
- Arrival and parking in waiting areas: vehicles enter the terminal and are directed to designated areas where they await their turn for loading or unloading. At this stage, documentation is checked and traffic is organized.
- Loading/unloading: vehicles are guided to or from the ship, using their own wheels. This occurs through specially designed ramps that connect the dock to the vessel.
- Storage or departure: after disembarking, vehicles are directed to temporary storage areas or directly outside the terminal, depending on their final destination.
The use of technologies such as the Internet of Vehicles (IoV) and automation improves coordination, reduces waiting times, and optimizes vehicular flow at each stage (Figure 2).
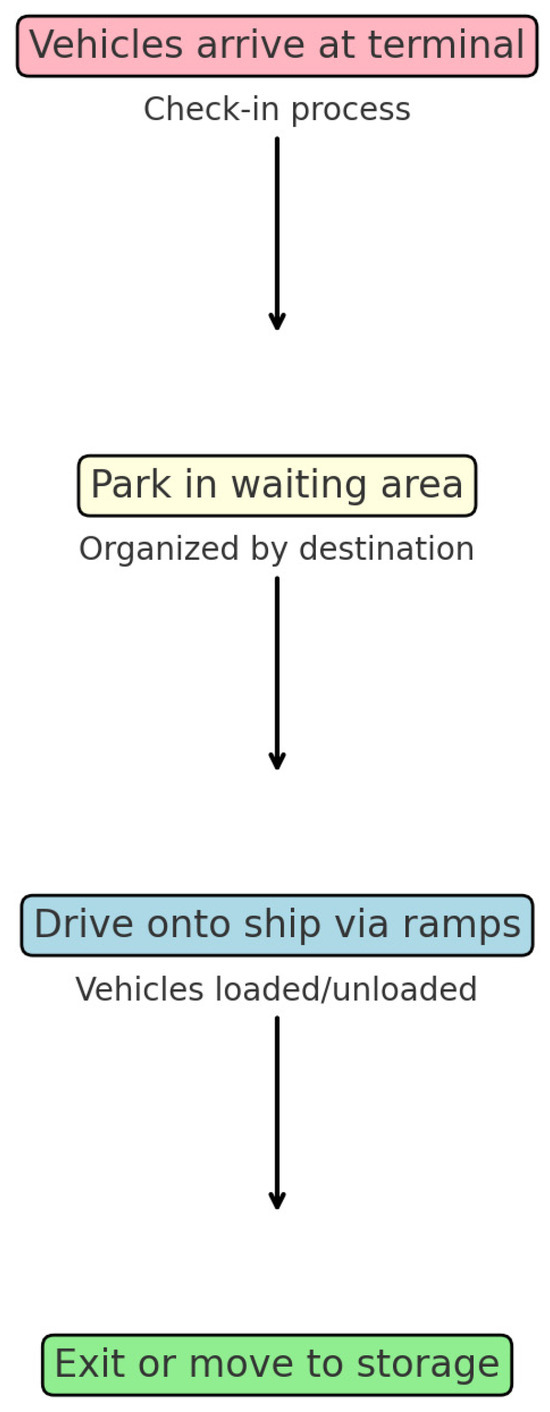
Figure 2.
Flow of operation of a Ro-Ro terminal (Roll-on/Roll-off). Source: own elaboration.
From these data and with the equations, the baseline has been established. The current values for waiting times, vehicular flow, and costs without IoV were defined based on survey responses from Ro-Ro terminals. These data were analyzed to estimate the impact of IoV using real operational insights from the surveyed terminals.
The data used in this study were obtained through direct communication with Ro-Ro terminals, complemented by reliable secondary sources. To ensure the robustness of our analysis, we gathered key operational metrics, including traffic volume, average loading and unloading times, waiting times, and internal traffic flow management. These data were collected via surveys and direct exchanges with terminal operators. However, in cases where complete datasets were not available, we used established reference values from authoritative sources such as the International Maritime Organization (IMO), the European Sea Ports Organization (ESPO), and previous studies on transport logistics.
To further strengthen the validity of our findings, we compared the collected data with industry standards and benchmarks from leading European ports. This methodological approach ensures that our results are both realistic and applicable to real-world terminal operations (Table 1). The calculated savings and efficiency improvements were derived from a comparative assessment of manual versus automated systems, using a combination of empirical data and validated reference figures.
Definition of Variables:

Table 1.
Defining variables.
Table 1.
Defining variables.
| Variable Type | Name | Definition | Units | Impact |
|---|---|---|---|---|
| Dependent Variables | Tespera | Average time a vehicle takes to wait before being processed. | Minutes (min) | Measures the impact of IoV on efficiency. Reduction in times reflects operational improvement. |
| Flow | Number of vehicles processed per hour. | Vehicles per hour (veh/h) | Key productivity indicator. It reflects the efficient use of infrastructure and automation. | |
| CO2 | Carbon dioxide emissions generated during the waiting time. | Kilograms (kg) | Associated with operational sustainability and compliance with environmental regulations. | |
| Cost per hour | Expense associated with operations for one hour. | Euros per hour (EUR/h) | It reflects economic efficiency, including labor, fuel, and maintenance. | |
| Independent Variables | Average Time Per Vehicle | Average time it takes for a vehicle to be processed manually or automatically. | Minutes per vehicle (min/veh) | Monitors process efficiency and compare manual and automated systems. |
| Cost per vehicle | Expense associated with processing a vehicle. | Euros per vehicle (EUR/vehicle) | Allows assessment of the financial impact of automation compared to manual processing. | |
| Energy and labor costs | Expenses related to energy consumption and wages per vehicle processed. | Euros (EUR) | Analyzes the cost of human and energy resources in different technological scenarios. |
The Spanish port system is characterized by a high degree of heterogeneity, particularly in Roll-on/Roll-off (Ro-Ro) terminals. These differences stem from variations in operational models, technological adoption, and infrastructural configurations, making a direct comparison of all terminals impractical. To ensure the validity and relevance of this study, a selection of relatively homogeneous terminals has been analyzed. These terminals share similar operational frameworks and automation levels, providing a meaningful basis for performance assessment (Figure 3).
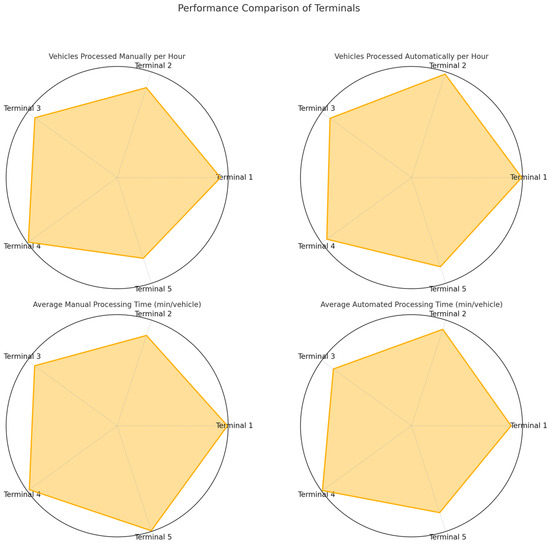
Figure 3.
Comparison between terminals. Source: own elaboration.
To ensure the robustness of the results obtained, the data used in this study come from various sources, including information provided directly by the analyzed terminals, reports from international organizations, and open databases specialized in transport and port logistics. In cases where specific values were not available for all terminals, estimates were made based on verified references, including previous studies on comparable terminals and values established by organizations such as the International Maritime Organization (IMO) and the European Sea Ports Organization (ESPO). This methodological approach allows for a reliable representation of Ro-Ro terminal operations, ensuring that comparisons between manual and automated scenarios are realistic and grounded in validated references and industry standards.
The performance metrics of the selected terminals were visualized through radar charts, which allow for an intuitive comparison of key parameters across terminals. Each chart represents a specific metric:
- Vehicles Processed Manually per Hour: This chart highlights the efficiency of manual operations in terms of vehicle throughput.
- Vehicles Processed Automatically per Hour: This chart focuses on the performance of automated systems, illustrating their capacity for higher throughput under similar conditions.
- Average Manual Processing Time (min/vehicle): This metric reflects the time required to manually process a vehicle, providing insights into the relative speed and efficiency of human-driven operations.
- Average Automated Processing Time (min/vehicle): This chart demonstrates the time efficiency of automated processing, which is critical in optimizing terminal operations.
The radar charts illustrate the relative performance of each terminal for the selected metrics. Terminals that show higher throughput or lower processing times indicate better operational efficiency. By analyzing these metrics, we aim to identify patterns, bottlenecks, and areas for improvement in Ro-Ro terminal operations.
This approach underscores the importance of selecting homogeneous terminals for comparative studies, as operational diversity within the Spanish port system can obscure meaningful insights. By focusing on a subset of terminals with comparable characteristics, this research ensures that the analysis is both robust and actionable, paving the way for targeted recommendations to enhance terminal performance.
Phase 2: Establishing the Baseline
- Calculation of the average time per operation, vehicular flow, and costs for both systems (manual and automated). Units: Minutes per vehicle (min/veh).
Calculation of the reduction in waiting times. This equation measures the reduction in waiting times achieved by implementing IoV and automation. Unit: Minutes (min).
- Calculation of Vehicle Flow:
- ○
- Calculates the number of vehicles processed per hour.
- ○
- Units: Vehicles per hour (veh/h).
- ○
- Cfuel: Fuel consumption per vehicle (litres/vehicle).
- ○
- ECO2: CO2 emissions per litre of fuel (kg/L).
- ○
- Units: Kilograms (kg).
- CO2 Emissions Calculation. Units: Kilograms (kg).
- Hourly Cost Calculation:
- ○
- Clabor: Labor cost per vehicle (EUR).
- ○
- Cenergy: Energy cost per vehicle (EUR).
- ○
- Units: Euros per hour (EUR/h).
- Maximum terminal capacity:
- ○
- Description: Defines the maximum number of vehicles that can be processed under ideal conditions.
- ○
- Units: Vehicles per hour (veh/h).
- Reduction in CO2 emissions: Based on reduced waiting times and fuel consumption per vehicle.
- ○
- CO2,manual: CO2 emissions in manual operations.
- ○
- CO2,automated: CO2 emissions in automated operations.
- ○
- Units: Kilograms (kg).
- Economic savings calculation:
Next, a typical scenario is developed to provide a clear picture of how the study develops.
Scenario A: Optimization of vehicular traffic in waiting areas.
Initial data:
- Tactual: 20 min
- Tcon IoV: 15 min
- Average consumption: 4 L/h
- Emissions per litre: 2.64 kg/L
- Vehicles processed: 300 vehicles/day
- Vehicles processed: 350 vehicles/day
- Reduction in waiting times: ΔTwait = 20−15 = 5 min
- Reduction in emissions: CO2 reduced = 4 × 560 × 2.64 = 0.88 kg CO2
- Economic savings: Savings = 3 × 5 × 300 = EUR 4500/day
- Increase in flow: 16.7%
- Reduced emissions: 0.88 kg CO2/vehicle
Phase 3: Implementing the calculations
Once the work scenario has been determined and the values have been assigned to the variables, the calculations of the formulas are carried out and the following values are obtained (Table 2):
Table 2.
Results of implementing calculation at terminals.
An example of how the calculations of the total economic savings have been made, which correspond to the savings generated by the reduction of waiting times and operating costs, per hour of operation, considering the number of vehicles processed in an hour, is shown below.
Assumptions:
- Terminal operates 16 h per day.
- It operates 250 days a year.
- Average hourly savings: EUR 150 per hour.
- Daily Calculation: EUR 2400 savings per day
- Annual Calculation: EUR 600,000
While some estimations were made in this study, they were neither arbitrary nor generalized. In most cases, the values used to assess waiting time reduction, vehicle flow increase, CO2 emissions reduction, and economic savings were directly obtained from the analyzed terminals. However, in certain instances where specific data were unavailable, estimations were made based on comparisons with similar terminals and established operational standards. The adopted methodology provides a coherent reference framework to evaluate the impact of automation and the Internet of Vehicles (IoV) in Ro-Ro terminals, considering both current scenarios and technology-optimized conditions. The reliability of the values used has been verified by cross-referencing results with expected industry benchmarks, ensuring that the estimates are representative of actual operational conditions.
The below Table 3 shows the calculated mean and standard deviation of the key variables for the five terminals.
Table 3.
Mean and standard deviation.
Regarding the variability analysis, we can say that the results obtained show that the variations in waiting times, vehicular flow, the reduction of CO2 emissions, and the economic savings between terminals are reasonable and reflect the inherent differences in infrastructure and operational capacity. Averages and deviations can influence managers’ decisions in the following manners:
- Reduction in times (min): the variability is low, indicating that the terminals have fairly similar reduction times. This is reasonable, given that waiting times depend on the optimization of vehicular flow, which is uniform in all simulated terminals. Thus, strategically speaking, a low deviation indicates consistency in reduction times. Managers could prioritize the implementation of IoV and scheduling algorithms to maximize this efficiency uniformly, with the impact of decreasing congestion at peak times, especially at terminals with higher traffic volumes.
- Flow increase (%): although the variability for this metric is a little greater, it is still reasonable. This reflects differences in initial (manual) processing capacity and the improvements that automation can provide, which both depend on the infrastructure of each terminal. Strategically, the greater variability in this metric highlights how factors such as initial infrastructure affect flow. Managers should evaluate specific improvements at terminals with a lower increase. The impact would be an increase in capacity without the need for physical expansion.
- CO2 (kg) reduction: dispersion for this metric is moderate, suggesting that emissions vary depending on the volume of manually processed traffic and the initial wait times of each terminal. This is consistent with the variation in vehicular flow. Strategically speaking, the moderate deviation suggests differences in volumes of traffic processed. Implementing IoV at terminals with lower turndown would help achieve consistent environmental targets, resulting in a reduction in the overall carbon footprint of operations.
- Economic savings (EUR): the dispersion in savings is moderate. This reflects reasonable differences in operating costs and in the number of manually processed vehicles at each terminal. It would be strategic for managers to identify terminals with lower savings and evaluate specific causes, such as higher energy costs or lower initial efficiency. In turn, this could justify investments in technology through a measurable return.
Standard deviations do not indicate extreme disparities between terminals. Variances are reasonable and expected due to differences in initial capacity, traffic volume, and efficiency of manual operations. The results are consistent and reflect a balanced analysis based on data collected from Ro-Ro terminals.
An average increase in vehicular flow of close to 70% may seem high, but it depends on several factors specific to the terminals and the initial conditions. The below analysis assesses whether this is reasonable:
Key factors affecting increased flow
- Low initial capacity: If manual operations are inefficient, with high times per vehicle, any significant improvement through automation can generate significant increases in vehicle flow.
- Capacity of automated systems: AGVs (Automated Guided Vehicles) and other automated systems have much higher processing rates compared to manual processes. This can justify high increases if the infrastructure allows operation of these automated systems at their maximum.
- Optimization of internal traffic: The implementation of IoV and scheduling algorithms can reduce bottlenecks and improve the utilization of terminal capacity, which also contributes to the increase in flow.
This result reflects a significant increase due to the improvement in vehicle processing times, which go from 5.91 min to 3.07 min on average. If the initial rates of manual systems are low, this increase is consistent.
The following metrics have also been calculated, the values of which are shown in the following figures:
- Total Cost Per Hour: Manual and automated, adding labor and energy costs.
- Hourly Operating Cost Savings: Difference between the total manual and automated cost.
- Total Cost Per Vehicle: Calculated by dividing the total cost per hour by the number of vehicles processed in each system.
- Percentage Reduction in Operating Costs: Percentage of savings when moving from manual to automated systems.
- Cost Per Vehicle Increased (%): Changes in the average cost per vehicle processed between both systems.
Automation also allows for a more efficient redistribution of human resources. The system requires fewer direct operational staff and prioritizes supervisory roles, which implies a transformation of the profile of required skills. Managers should consider training and capacity-building programs to facilitate this transition (Figure 4 and Figure 5).
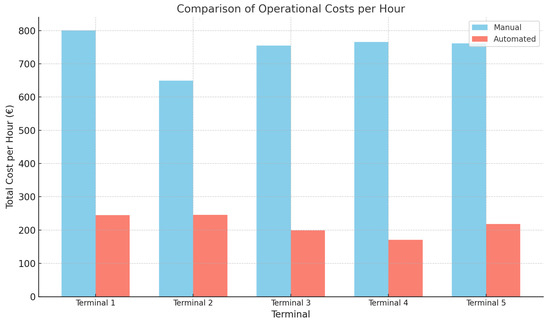
Figure 4.
Comparison of operational costs per hour. Source: own elaboration.
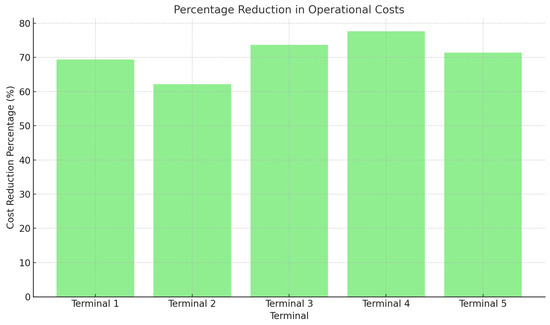
Figure 5.
Percentage reduction in operational costs. Source: own elaboration.
Automation has been shown to result in a substantial reduction in vehicle waiting times. This implies an improvement in operational efficiency, reducing congestion in waiting areas and allowing a more continuous flow. For managers, this result highlights the importance of investing in automated systems to improve the user experience and reduce bottlenecks at peak times (Figure 6).
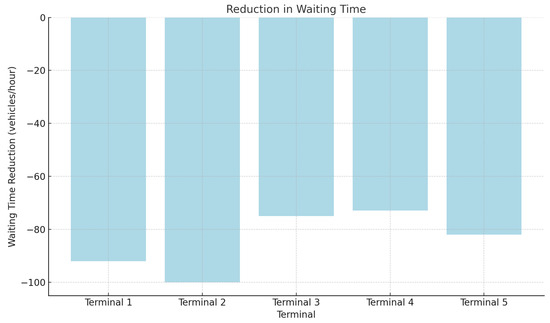
Figure 6.
Reduction in waiting times. Source: own elaboration.
Automated terminals show up to an 80% increase in vehicle processing capacity per hour compared to manual operations. This not only improves the operational capacity of the terminals, but also reduces the costs associated with the need to physically expand the facility. Managers can use this information to plan endpoint growth without compromising service quality (Figure 7 and Figure 8).
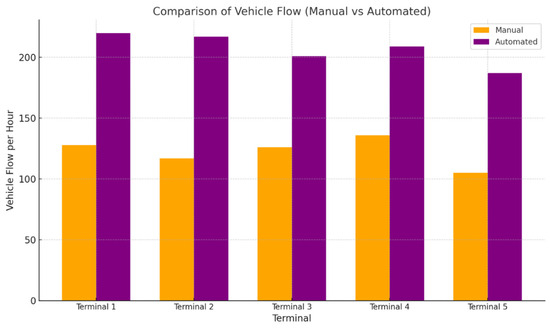
Figure 7.
Comparison of vehicle flow. Source: own elaboration.
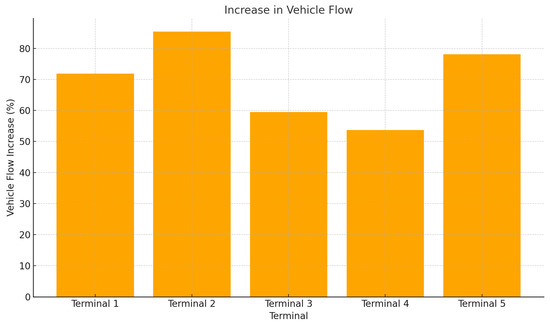
Figure 8.
Increase in vehicle flow. Source: own elaboration.
Data show that automation contributes to a significant decrease in CO2 emissions, up to 25 kg less per hour per terminal. This finding is critical in a global context that demands more sustainable operations. Managers can prioritize automation as a strategy to meet sustainability goals and improve public perception of terminals as environmentally responsible infrastructure (Figure 9 and Figure 10).
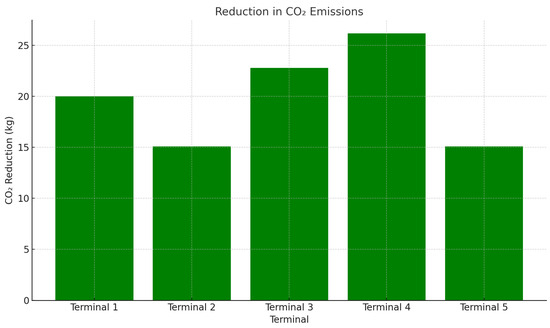
Figure 9.
Reduction in CO2 emissions. Source: own elaboration.
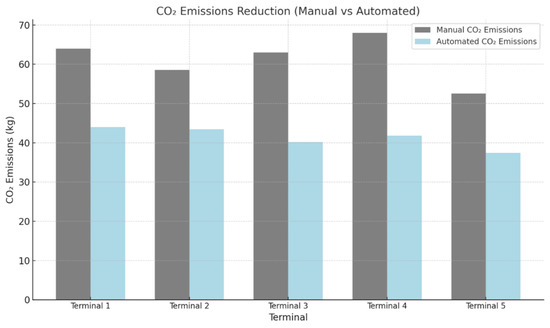
Figure 10.
CO2 reduction emissions: manual vs. automated. Source: own elaboration.
The application of IoV and blockchain directly contributes to sustainability goals at Ro-Ro terminals. By reducing waiting times and optimizing internal routes, emissions associated with fuel consumption are reduced. In addition, electric AGVs offer a cleaner alternative to traditional vehicles, considerably reducing CO2 emissions per operation.
The findings indicate that the implementation of IoV and blockchain in Ro-Ro terminals has led to measurable improvements in operational efficiency. Compared to manual systems, automated processes using these technologies resulted in reduced waiting times, increased vehicle flow, and lower operational costs.
In terms of regulatory compliance, the IoV facilitates the automatic monitoring and recording of emissions, allowing terminals to more easily adhere to international regulations such as those established by the IMO (International Maritime Organization) and the European Union. This level of automation also ensures transparency in the information reported.
From an operational perspective, blockchain-based smart contracts incentivize best practices, such as reducing emissions through automatic bonuses for operators who comply with emission limits. This fosters a culture of sustainability among stakeholders.
Public perception also benefits. Terminals that lead in sustainability enhance their competitiveness and attractiveness as strategic partners in global trade, contributing not only to operational efficiency, but also to more resilient and environmentally friendly transport.
The implementation of automated systems generates significant economic savings, exceeding EUR 500 per hour in many terminals. This includes reducing energy and labor costs. For managers, these savings represent a strong case for return on investment in automated technologies, particularly in contexts of high operational demand (Figure 11, Figure 12 and Figure 13).
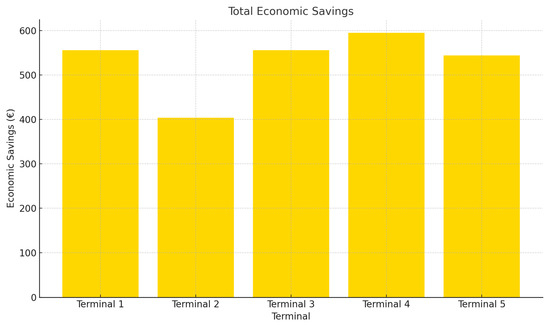
Figure 11.
Total economic savings. Source: own elaboration.
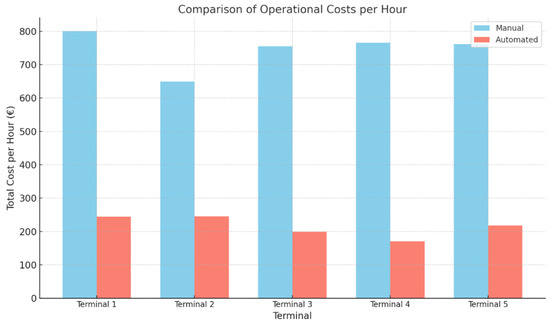
Figure 12.
Comparison of economic costs per hour. Source: own elaboration.
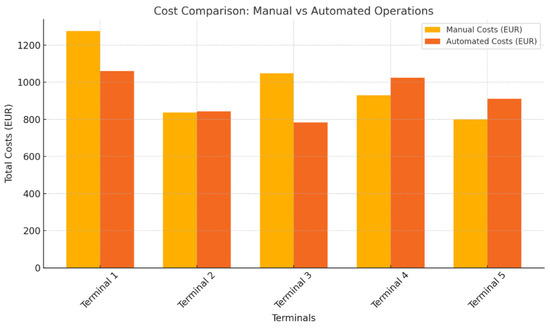
Figure 13.
Cost comparison of economic costs per hour. Source: own elaboration.
These findings highlight the financial and operational benefits of automation in Ro-Ro terminals. Reduced waiting times directly contribute to improved vehicle throughput and lower operational costs, reinforcing the importance of digital transformation in port logistic
Phase 4. Conducting focus groups for blockchain implementation
The implementation of blockchain technology in Roll-on/Roll-off (Ro-Ro) terminals presents unique challenges due to the limited prior experience of personnel and the lack of established cost benchmarks in this specific operational context. To address these gaps, a focus group methodology was employed to gather insights from industry experts, including port operators, technology providers, and logistics professionals. This approach was chosen as it facilitates in-depth discussions and the exchange of knowledge among stakeholders, allowing for the identification of key cost drivers, potential barriers, and implementation strategies specific to Ro-Ro terminals. As highlighted by Merk and Dang, et al. (2018), stakeholder collaboration is critical for understanding the practical and financial implications of adopting advanced technologies in ports. By leveraging the expertise of diverse participants, the focus group provided a comprehensive and context-specific analysis, forming a solid foundation for estimating blockchain implementation costs in this unique operational setting.
The cost of implementing blockchain technology varies significantly depending on the scope of the project, the existing infrastructure, and the specific needs of the Ro-Ro terminals (Figure 14).
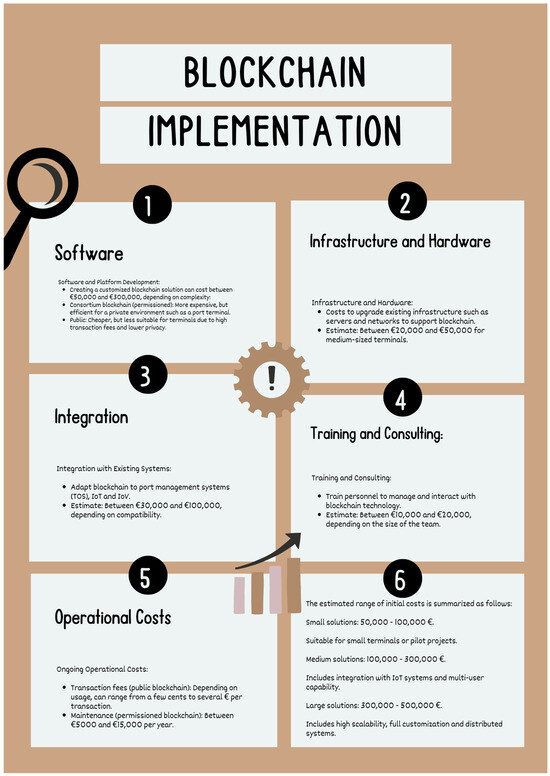
Figure 14.
Focus group: blockchain implementation. Source: own elaboration.
According to the focus group’s determinations, the following values could be expected for a medium-sized terminal:
- Integration with IoV and IoT: EUR 50,000
- Staff training: EUR 15,000
- Infrastructure upgrade: EUR 30,000
- Approximate total cost: EUR 195,000
Compared to these costs, the benefits obtained will mainly represent a reduction in fraud and losses by improving the traceability of vehicles and data, reducing operational risks, as well as operational optimization, since blockchain combined with IoV and IoT can generate significant operational savings, compensating for the initial investment.
The estimated economic savings at the terminals studied, which exceed EUR 500 per hour on average, reflect the financial viability of adopting technologies such as IoV and blockchain. Automation not only allows for a reduction in operating costs, but also increases processing capacity without the need to physically expand the facility. This is particularly relevant in a competitive environment where efficiency and sustainability are key factors in attracting logistics operators and increasing the competitiveness of Spanish ports in the global market.
The results of this study demonstrate that the implementation of IoV and blockchain in Spanish Ro-Ro terminals can generate significant improvements in operational efficiency, sustainability, and cost reduction. When comparing these findings with container terminals in advanced European ports, such as Rotterdam or Hamburg, it is observed that automated systems and dynamic vehicular traffic management have a similar impact on reducing waiting times and optimizing vehicular flow. However, Ro-Ro terminals face specific challenges due to the heterogeneous nature of Ro-Ro cargo, requiring customized solutions that are not always necessary in container terminals. This reinforces the need for additional studies that address the contextual differences and barriers specific to Ro-Ro terminals.
The methodology applied in this study is designed to be replicable for future research in Ro-Ro terminals and similar port environments. By detailing the sources of our data and the validation process used, we provide a transparent framework that can guide other researchers interested in automation and digitalization in port operations.
The inclusion of direct terminal data, combined with secondary sources and industry benchmarks, ensures that the findings presented in this study are grounded in real operational conditions. Future research could expand upon this by conducting longitudinal studies with real-time data from IoV and blockchain-enabled terminals. This would allow for more precise validation of the efficiency gains and economic benefits predicted in this research.
5. Conclusions
The findings of this study highlight the positive impact of automation and the integration of the Internet of Vehicles (IoV) in Ro-Ro terminals, providing significant benefits in operational efficiency, sustainability, and safety. When comparing manual and automated systems, there is a notable improvement in vehicle processing capacity and in the optimization of waiting times, which translates into a more dynamic allocation of resources and greater user satisfaction. In addition, the reduction in operating costs and CO2 emissions reinforces the potential of these technologies to meet environmental regulations and sustainability goals.
On the other hand, the implementation of advanced tools such as IoV-based security monitoring, with connected sensors and cameras, allows real-time tracking of vehicle movement, automatic alerts on possible collisions, and remotely supervision of critical areas of the port. This contributes to a significant reduction in accidents, property damage, and associated costs, increasing operational safety at the terminals. Likewise, the use of predictive technology based on IoV offers the possibility of anticipating problems by analyzing historical and current data, facilitating the prediction of peak hours and the accurate estimation of loading times, thus optimizing the allocation of port resources and avoiding congestion before they occur.
The results of this work support the need to prioritize automation in critical areas to maximize the impact on waiting times and emissions, establish quantified metrics to measure progress in sustainability, and justify investments to stakeholders through clear economic returns. This framework of action not only responds to the current demands of the logistics sector, but also positions Ro-Ro terminals as leaders in innovation, efficiency, and sustainability, ready to face the challenges of an increasingly interconnected and competitive global environment.
This study demonstrates that the implementation of IoV and blockchain in Ro-Ro terminals not only significantly improves operational efficiency, but also contributes to environmental sustainability and cost reduction. Terminals that adopt these technologies can experience increases in vehicular flow of up to 70%, reductions in average waiting times of 2.56 min, and decreases in CO2 emissions of 57.74 kg per hour, results that highlight their transformative potential.
In addition, automation makes it possible to optimize the allocation of human resources, reducing dependence on direct labor and encouraging the transition to supervisory and technology management roles. These changes not only improve efficiency, but also prepare terminals for the future challenges of a more digitalized logistics environment.
However, the joint implementation of IoV and blockchain faces significant barriers, such as high upfront costs and lack of interoperability. This work highlights the need for a strategic approach that combines investments in infrastructure, training, and common standards to ensure the success of these technologies in Ro-Ro terminals.
Finally, this study not only provides a quantitative framework to assess the impact of IoV and blockchain, but also underscores the importance of continuing to investigate their integration in specific operational contexts. The adoption of these technologies is not only a competitive advantage, but a necessary step to respond to the demands for sustainability, efficiency, and transparency in global port logistics.
For port managers, the results of this study offer a practical framework for prioritizing investments in advanced technologies. The focus on critical areas such as reducing waiting times and improving operational safety and sustainability makes it possible to economically justify these initiatives to stakeholders. In addition, the analysis of variability between terminals suggests that improvements should be tailored to the specific needs of each infrastructure, reinforcing the importance of customized strategies.
Beyond the findings presented, this research provides a structured approach for assessing digitalization impacts in port logistics. The methods used for data collection and validation can be applied to similar studies, ensuring comparability across different terminal environments. By explicitly detailing the sources and methodologies used, we aim to contribute not only to academic discourse but also to practical implementations in the maritime sector.
Although the results obtained in this study indicate a positive impact of IoV and automation in Ro-Ro terminals, it is important to acknowledge certain limitations related to data availability and the diversity of operational scenarios across different ports. The application of these models in real environments may be influenced by factors such as the structural particularities of each terminal, traffic conditions, and country-specific regulations. Therefore, future studies could focus on obtaining real-time operational data and validating the proposed models through pilot tests in specific terminals. Additionally, the interoperability of these technologies with existing port management systems and the long-term assessment of economic and environmental benefits represent key areas for further research in this field.
Author Contributions
Conceptualization, J.V.-C., N.G.-C. and A.C.-O.; Methodology, J.V.-C., N.G.-C. and A.C.-O.; Formal analysis, J.V.-C., N.G.-C. and A.C.-O.; Investigation, J.V.-C. and A.C.-O.; Resources, J.V.-C.; Data curation, J.V.-C.; Writing—original draft, J.V.-C.; Writing—review & editing, J.V.-C.; Visualization, J.V.-C.; Supervision, N.G.-C. and A.C.-O. All the authors have contributed on each of the themes. All authors have read and agreed to the published version of the manuscript.
Funding
This research received no external funding.
Data Availability Statement
The data used in this study is not publicly available due to confidentiality agreements with the participating port terminals. Aggregated or anonymized data may be provided upon reasonable request.
Conflicts of Interest
The authors declare no conflicts of interest.
References
- Wang, C.; Cheng, X.; Li, J.; He, Y.; Xiao, K. A survey: Applications of blockchain in the Internet of Vehicles. EURASIP J. Wirel. Commun. Netw. 2021, 2021, 77. [Google Scholar] [CrossRef]
- Jabbar, R.; Kharbeche, M.; Al-Khalifa, K.; Krichen, M.; Barkaoui, K. Blockchain for the internet of vehicles: A decentralized IoT solution for vehicles communication using ethereum. Sensors 2020, 20, 3928. [Google Scholar] [CrossRef] [PubMed]
- Okere, E.E.; Balyan, V. Advances in Blockchain-Based Internet of Vehicles Application: Prospect for Machine Learning Integration. Future Internet 2024, 16, 449. [Google Scholar] [CrossRef]
- Chen, X.; Li, F.; Jia, B.; Wu, J.; Gao, Z.; Liu, R. Optimizing storage location assignment in an automotive Ro-Ro terminal. Transp. Res. Part B Methodol. 2021, 143, 249–281. [Google Scholar] [CrossRef]
- Jabbar, R.; Dhib, E.; Said, A.B.; Krichen, M.; Fetais, N.; Zaidan, E.; Barkaoui, K. Blockchain technology for intelligent transportation systems: A systematic literature review. IEEE Access 2022, 10, 20995–21031. [Google Scholar] [CrossRef]
- Wang, X.; Zhu, H.; Ning, Z.; Guo, L.; Zhang, Y. Blockchain intelligence for internet of vehicles: Challenges and solutions. IEEE Commun. Surv. Tutor. 2023, 25, 2325–2355. [Google Scholar] [CrossRef]
- Xie, N.; Zhang, C.; Yuan, Q.; Kong, J.; Di, X. IoV-BCFL: An intrusion detection method for IoV based on blockchain and federated learning. Ad Hoc Netw. 2024, 163, 103590. [Google Scholar] [CrossRef]
- Reyna, A.; Martín, C.; Chen, J.; Soler, E.; Díaz, M. On blockchain and its integration with IoT. Challenges and opportunities. Future Gener. Comput. Syst. 2018, 88, 173–190. [Google Scholar] [CrossRef]
- Pjevcevic, D.; Nikolic, M.; Vidic, N.; Vukadinovic, K. Data envelopment analysis of AGV fleet sizing at a port container terminal. Int. J. Prod. Res. 2017, 55, 4021–4034. [Google Scholar] [CrossRef]
- Sun, P.Z.; You, J.; Qiu, S.; Wu, E.Q.; Xiong, P.; Song, A.; Zhang, H.; Lu, T. AGV-based vehicle transportation in automated container terminals: A survey. IEEE Trans. Intell. Transp. Syst. 2022, 24, 341–356. [Google Scholar] [CrossRef]
- González-Cancelas, N.; Camarero Orive, A.; Vilarchao, A.R.; Vaca-Cabrero, J. Use of End-to-End Tool for the Analysis of the Digital Governance of Ports. Logistics 2024, 8, 58. [Google Scholar] [CrossRef]
- Heilig, L.; Lalla-Ruiz, E.; Voß, S. Digital transformation in maritime ports: Analysis and a game theoretic framework. Netnomics Econ. Res. Electron. Netw. 2017, 18, 227–254. [Google Scholar] [CrossRef]
- Lu, Y.; Huang, X.; Dai, Y.; Maharjan, S.; Zhang, Y. Blockchain and federated learning for privacy-preserved data sharing in industrial IoT. IEEE Trans. Ind. Inform. 2019, 16, 4177–4186. [Google Scholar] [CrossRef]
- Pjevčević, D.; Vladisavljević, I.; Vukadinović, K.; Teodorović, D. Application of DEA to the analysis of AGV fleet operations in a port container terminal. Procedia-Soc. Behav. Sci. 2011, 20, 816–825. [Google Scholar] [CrossRef]
- Kang, J.; Yu, R.; Huang, X.; Maharjan, S.; Zhang, Y.; Hossain, E. Enabling localized peer-to-peer electricity trading among plug-in hybrid electric vehicles using consortium blockchains. IEEE Trans. Ind. Inform. 2017, 13, 3154–3164. [Google Scholar] [CrossRef]
- Rateb, J. Blockchain pour l’Internet des Véhicules: Une solution IoT Décentralisée pour la Communication et le Paiement des Véhicules en Utilisant Ethereum. Ph.D. Dissertation, HESAM Université, Paris, France, 2021. [Google Scholar]
- Kapassa, E.; Themistocleous, M.; Christodoulou, K.; Iosif, E. Blockchain application in internet of vehicles: Challenges, contributions and current limitations. Future Internet 2021, 13, 313. [Google Scholar]
- Aparicio, A.; Giannopoulos, G.; Cazzola, P.; Christidis, P.; Ciuffo, B.; Lonza, L.; McKinnon, A.; Miola, A.; Nelldal, B.L.; Ntziachristos, L. Scientific Assessment of Strategic Transport Technologies; Publications Office of the European Union: Luxembourg, 2012; Available online: https://publications.jrc.ec.europa.eu/repository/bitstream/JRC68397/jrc68397%20online%20version.pdf (accessed on 27 January 2025).
- Tyagi, A.K.; Tiwari, S.; Naithani, K. Blockchain-Enabled Internet of Things (IoTs) Platforms for Vehicle Sensing and Transportation Monitoring. Digit. Twin Blockchain Smart Cities 2024, 2024, 257–276. [Google Scholar]
- Zhang, D.; Mei, Z.; Chen, F.; Zhao, Y. Research of Berth Scheduling Optimization Model and Algorithm on Automotive RO-RO Terminals. Oper. Res. Manag. Sci. 2022, 31, 9. [Google Scholar]
- Rodrigue, J.-P. The Geography of Transport Systems; Routledge: London, UK, 2020; Available online: https://www.taylorfrancis.com/books/mono/10.4324/9780429346323/geography-transport-systems-jean-paul-rodrigue (accessed on 27 January 2025).
- Notteboom, T.; Rodrigue, J.-P. Maritime container terminal infrastructure, network corporatization, and global terminal operators: Implications for international business policy. J. Int. Bus. Policy 2022, 6, 67. [Google Scholar] [CrossRef]
- Yap, W.Y.; Ho, J. Port strategy and performance: Empirical evidence from major container ports and implications for role of data analytics. Marit. Policy Manag. 2023, 50, 608–628. [Google Scholar] [CrossRef]
- Monios, J.; Wilmsmeier, G. Deep adaptation to climate change in the maritime transport sector—A new paradigm for maritime economics? Marit. Policy Manag. 2020, 47, 853–872. [Google Scholar] [CrossRef]
- Nguyen, P.N.; Kim, H. Analysis of effectiveness for cargo operation productivity considering environmental efficiency on container ports in the Northeast Asian region. Transp. Policy 2024, 157, 111–123. [Google Scholar] [CrossRef]
- Acciaro, M.; Renken, K.; Dirzka, C. Integrated Port Cities: The Case of Hamburg. In European Port Cities in Transition; Carpenter, A., Lozano, R., Eds.; Strategies for Sustainability; Springer International Publishing: Cham, Switzerland, 2020; pp. 287–301. [Google Scholar]
- Ashrafi, M.; Walker, T.R.; Magnan, G.M.; Adams, M.; Acciaro, M. A review of corporate sustainability drivers in maritime ports: A multi-stakeholder perspective. Marit. Policy Manag. 2020, 47, 1027–1044. [Google Scholar] [CrossRef]
- Cullinane, K.; Ji, P.; Wang, T. The relationship between privatization and DEA estimates of efficiency in the container port industry. J. Econ. Bus. 2005, 57, 433–462. [Google Scholar] [CrossRef]
- Satta, G.; Vitellaro, F.; Njikatoufon, A.G.; Risitano, M. Green strategies in ports: A stakeholder management perspective. Marit. Econ. Logist. 2024, 1–27. [Google Scholar] [CrossRef]
- Scholz-Reiter, B.; Böse, F.; Teucke, M.; Piotrowski, J. Integrated Planning and Control on Ro-Ro Terminals. In Proceedings of the 7th International Workshop on Modeling & Applied Simulation, Campora, Italy, 17–19 September 2008; pp. 275–280. [Google Scholar]
- Zhang, C.; Liu, J.; Wan, Y.; Murty, K.G.; Linn, R.J. Storage space allocation in container terminals. Transp. Res. Part B Methodol. 2003, 37, 883–903. [Google Scholar] [CrossRef]
- Molina-Serrano, B.; González-Cancelas, N.; Soler-Flores, F. Analysis of the port sustainability parameters through Bayesian networks. Environ. Sustain. Indic. 2020, 6, 100030. [Google Scholar] [CrossRef]
- Wang, B.; Guo, X. Blockchain-enabled transformation: Decentralized planning and secure peer-to-peer trading in local energy networks. Sustain. Energy Grids Netw. 2024, 40, 101556. [Google Scholar] [CrossRef]
- Esmer, S.; İşler, B. Factors Effecting Service Demand At Ro-Ro Terminals. Soc. Sci. Stud. J. (SSSJournal) 2024, 8, 296–301. [Google Scholar]
- Bhuva, D.; Kumar, S. Securing space cognitive communication with blockchain. In Proceedings of the 2023 IEEE Cognitive Communications for Aerospace Applications Workshop (CCAAW), Cleveland, OH, USA, 20–22 June 2023; IEEE: Piscataway, NJ, USA, 2023; pp. 1–6. Available online: https://ieeexplore.ieee.org/abstract/document/10219188/ (accessed on 17 January 2025).
- Bhuva, D.R.; Kumar, S. A novel continuous authentication method using biometrics for IOT devices. Internet Things 2023, 24, 100927. [Google Scholar] [CrossRef]
Disclaimer/Publisher’s Note: The statements, opinions and data contained in all publications are solely those of the individual author(s) and contributor(s) and not of MDPI and/or the editor(s). MDPI and/or the editor(s) disclaim responsibility for any injury to people or property resulting from any ideas, methods, instructions or products referred to in the content. |
© 2025 by the authors. Licensee MDPI, Basel, Switzerland. This article is an open access article distributed under the terms and conditions of the Creative Commons Attribution (CC BY) license (https://creativecommons.org/licenses/by/4.0/).