Abstract
The rapid growth of urban populations intensifies congestion, air pollution, and energy demand. Green mobility is central to sustainable smart cities, and the Internet of Things (IoT) offers a means to monitor, coordinate, and optimize transport systems in real time. This paper presents an Internet of Things (IoT)-based architecture integrating heterogeneous sensing with edge–cloud orchestration and AI-driven control for green routing and coordinated Electric Vehicle (EV) charging. The framework supports adaptive traffic management, energy-aware charging, and multimodal integration through standards-aware interfaces and auditable Key Performance Indicators (KPIs). We hypothesize that, relative to a static shortest-path baseline, the integrated green routing and EV-charging coordination reduce (H1) mean travel time per trip by ≥7%, (H2) CO2 intensity (g/km) by ≥6%, and (H3) station peak load by ≥20% under moderate-to-high demand conditions. These hypotheses are tested in Simulation of Urban MObility (SUMO) with Handbook Emission Factors for Road Transport (HBEFA) emission classes, using 10 independent random seeds and reporting means with 95% confidence intervals and formal significance testing. The results confirm the hypotheses: average travel time decreases by approximately 9.8%, CO2 intensity by approximately 8%, and peak load by approximately 25% under demand multipliers ≥1.2 and EV shares ≥20%. Gains are attenuated under light demand, where congestion effects are weaker. We further discuss scalability, interoperability, privacy/security, and the simulation-to-deployment gap, and outline priorities for reproducible field pilots. In summary, a pragmatic edge–cloud IoT stack has the potential to lower congestion, reduce per-kilometer emissions, and smooth charging demand, provided it is supported by reliable data integration, resilient edge services, and standards-compliant interoperability, thereby contributing to sustainable urban mobility in line with the objectives of SDG 11 (Sustainable Cities and Communities).
1. Introduction
The rapid urbanization of the past decade has significantly strained transportation infrastructure, heightening concerns around congestion, air pollution, and energy inefficiency. Smart city initiatives increasingly emphasize sustainable urban mobility, yet their impact remains uneven. For example, Müller-Eie [1] reviews strategies across fourteen mid-sized Nordic cities and finds that while efficiency and environmental goals are frequently addressed, measurable and inclusive mobility planning is often lacking.
The Internet of Things (IoT) enables real-time monitoring, data-driven decision making, and system optimization within smart cities. For instance, Waqar et al. [2] demonstrate that IoT-driven real-time monitoring significantly enhances smart cities’ urban planning and resource management. Zyoud [3] further underscores how IoT solutions contribute to achieving environmental sustainability goals by promoting clean energy and responsible consumption.
In electric mobility, research emphasizes the transformative potential of IoT in optimizing EV charging infrastructure. Kunj [4] extensively reviews IoT’s role in smart Electric Vehicle (EV) charging management, highlighting frameworks that enhance operational efficiency and sustainability. Complementing this, Sharma et al. [5] propose an AI-augmented smart grid architecture to bolster the security and efficiency of EV charging infrastructure, demonstrating resilience against cyber threats and improved load balancing. Guerrero-Silva et al. [6] systematically reviewed recent EV charging network optimization techniques, spotlighting the rising influence of machine learning methods in planning sustainable charging systems.
Despite these advances, the existing literature often treats mobility optimization, EV charging, and IoT-enabled architecture as disconnected silos. What is largely missing is a holistic IoT-based architecture that orchestrates real-time mobility data, green routing, and energy-aware EV charging within a unified framework.
To address this gap, our work proposes an IoT-driven architecture tailored for green mobility in smart cities, integrating the following:
- Edge–cloud orchestration for scalable, responsive decision making;
- AI-enhanced green routing optimized for energy use and emissions;
- Adaptive EV charging management considering grid load, renewables, and travel behavior.
Together, these mechanisms form a unified solution to enhance travel efficiency, reduce CO2 emissions, and optimize energy consumption across urban transport networks.
1.1. Contributions
In this paper, we make three key contributions to the domain of IoT-enabled green mobility in smart cities:
- 1.
- We introduce a layered IoT architecture that supports seamless integration of mobility sensing, traffic analytics, and EV charging optimization.
- 2.
- We propose energy-aware IoT mechanisms, including real-time green routing algorithms and predictive charging scheduling blended at the edge and cloud levels.
- 3.
- We validate the framework through simulation-based case studies, providing performance metrics on travel time, emissions, and charging load management.
- 4.
- We release a fully reproducible package (Simulation of Urban MObility (SUMO) network (version 1.24.0) and routes, controller code, configuration files, seeds, and analysis notebooks) to enable third-party verification (refer to the Data Availability Statement below).
1.2. Organization
To guide the reader, the remainder of the paper is organized as follows: Section 2 surveys related work on green mobility, smart cities, and IoT-enabled traffic/charging control. Section 3 presents the proposed IoT architecture—sensing stack, edge–cloud coordination, data model, and control loops for routing and charging. Section 4 details the experimental methodology, including the SUMO setup, demand generation, Handbook Emission Factors for Road Transport (HBEFA)-based vehicle types, scenarios (Baseline, IoT-Enhanced Routing, IoT + EV Charging Coordination), Key Performance Indicators (KPIs), and analysis procedures. Section 5 reports results for travel efficiency, environmental impact, EV energy use, and charging-load distribution. Section 6 discusses practical implications, limitations, threats to validity, security/privacy, scalability, and future work directions. Section 7 concludes with key takeaways and outlines paths toward real-world deployment.
2. Related Work
Research on IoT in smart mobility spans several key domains.
2.1. IoT Architectures in Smart Cities
Several comprehensive surveys have explored the evolving landscape of IoT frameworks and architectures within smart cities. Recent surveys synthesize IoT architectures and middleware for smart cities, highlighting persistent issues around interoperability, scalability, and standardization [7,8,9,10,11]. Ishaq and Farooq [12] perform a systematic literature review of smart city components, highlighting standardization, security, and interoperability challenges across smart homes, infrastructure, and industries. Zaman et al. [13] analyze the broader IoT application domains—identifying critical dimensions like energy management, data privacy, and architectural design within smart city ecosystems. These surveys consistently underline the need for unified, scalable, and secure IoT architectural frameworks.
2.2. Vehicular Networks and the Internet of Vehicles (IoV)
Internet of Vehicles (IoV) has attracted growing attention as a domain where vehicles act as dynamic IoT nodes. Kostrzewski et al. [14] explore IoV from environmental, social, and governance perspectives, calling for balanced sustainability-focused solutions. Mishra and Singh [15] use a bibliometric lens to assess IoV’s trajectory within smart city contexts, especially its role in green mobility and traffic optimization. Khezri et al. [16] examine IoV security challenges, particularly in Vehicular Ad hoc Network (VANET) environments, identifying secure routing protocols as a critical need. Together, these studies highlight IoV’s promise for sustainable mobility—but highlight gaps in holistic integration and security considerations.
2.3. Digital Twins in Urban Mobility
Digital Twins (DTs) have evolved as powerful virtual models for planning, simulation, and decision making in urban environments. Mazzetto [17] presents a bibliometric review of Urban Digital Twins (UDTs), mapping out sustainability-related applications, city planning, and infrastructure optimization. Huzzat et al. [18] provide case studies illustrating DT applications in transport and utilities, highlighting practical use cases across smart city initiatives. Alvi et al. [19] contextualize DT as foundational tools for expanding innovative smart city frameworks, exploring methodologies and recent research trends. Importantly, these works showcase DT’s potential—yet suggest limited usage in mobility-specific, energy-aware orchestration.
2.4. Summary of Gaps
To clearly position our contribution within the state of the art, Table 1 provides a comparative summary of representative studies across the main research streams—IoT architectures, vehicular networks, digital twins, and EV charging—highlighting their key contributions and the persistent gaps.

Table 1.
Comparative summary of related work in IoT-enabled smart mobility and the corresponding research gaps.
Despite substantial progress, existing research shows limitations:
- Limited interoperability: IoT systems are largely siloed, lacking a unified architecture that spans transport and energy domains.
- Energy and emissions are often overlooked: Optimizations target travel time or throughput rather than sustainable metrics like CO2 output or energy use.
- Fragmentation across domains: Literature covers EV charging, traffic routing, or DT modeling individually—but not in an integrated, IoT-driven framework.
2.5. Contributions of This Study
The work proposes a unified, layered IoT architecture tailored to smart cities to address the gaps presented above, combining energy-aware green routing, adaptive EV charging optimization, and real-time digital twin orchestration. This holistic approach positions sustainability, interoperability, and scalability at its core.
3. Proposed Architecture
To address the gaps identified in the literature, we propose a layered IoT architecture for sustainable urban mobility, designed to integrate heterogeneous data sources, enable real-time decision making, and support energy-aware optimization. The architecture follows a modular design, divided into four layers, each responsible for a distinct set of functions, and interconnected through standardized protocols and interfaces.
3.1. Perception Layer
At the foundation lies the Perception Layer, composed of IoT-enabled sensing devices deployed across the mobility ecosystem. These include:
- Vehicle-based sensors (GPS trackers, on-board units, battery management systems in EVs).
- Infrastructure-based sensors (traffic cameras, inductive loops, and roadside environmental monitoring stations).
- EV charging stations equipped with smart meters to monitor charging sessions and grid interactions.
- Air quality and environmental sensors capture emissions, particulate matter, and weather data.
Together, these sensors form the data backbone for real-time monitoring and urban awareness. For example, Zeng et al. [20] review the various sensor types and communication protocols used in smart transportation systems and urban analytics. Similarly, Salih et al. [21] emphasize the integration of sensing, networking, and AI technologies as core components of smart city infrastructures—including smart mobility. Bhardwaj et al. [22] also illustrate multi-layered IoT ecosystems with smart vehicle management as a critical urban system layer.
3.2. Network Layer
The Network Layer ensures efficient and reliable data exchange between perception devices, edge nodes, and cloud platforms. It integrates a range of communication technologies:
- Short-range protocols include ZigBee, Bluetooth Low Energy, and IEEE 802.11p for vehicle-to-vehicle (V2V) and vehicle-to-infrastructure (V2I) communications.
- Lightweight IoT protocols (Message Queuing Telemetry Transport (MQTT), Constrained Application Protocol (CoAP)) for sensor-to-gateway communication.
- 5G/6G infrastructures—via URLLC and C-V2X—enable sub-10 ms end-to-end latencies and high throughput for time-sensitive mobility services, with MEC/edge support for city-scale deployments [23,24,25,26,27,28].
This heterogeneous network fabric ensures scalability and quality-of-service, enabling mission-critical mobility applications.
3.3. Edge–Cloud Processing Layer
Given the massive data volumes generated by urban IoT ecosystems, processing must be distributed:
- Edge devices (e.g., roadside units, micro data centers) perform real-time analytics such as congestion detection, anomaly detection (accidents), and local route recommendations.
- Cloud infrastructure aggregates data from across the city to perform large-scale optimization, such as:
- ○
- city-wide traffic flow prediction,
- ○
- emission-aware global routing strategies,
- ○
- and EV charging demand forecasting.
Because urban IoT environments generate vast amounts of data, a distributed computing model is essential for performance and scalability. In this design, edge nodes—such as roadside units and micro data centers—execute real-time tasks like congestion detection, anomaly spotting, and localized routing. Meanwhile, the cloud platform aggregates data city-wide to run advanced analytics, including traffic flow forecasting, green route optimization, and EV charging demand modeling. This hybrid edge–cloud approach effectively combines low-latency responsiveness with cloud systems’ computational power and global perspective [29,30,31].
3.4. Application Layer
At the top sits the Application Layer, where processed information is delivered to end users and operators:
- Mobile applications provide citizens real-time green route recommendations, multimodal transport integration, and EV charging availability.
- Control center dashboards enable city operators to visualize traffic conditions, emissions hotspots, and charging station loads.
- APIs for Mobility-as-a-Service (MaaS) providers allow integration with public and private mobility services, ensuring an ecosystem approach.
This layer maximizes citizen engagement and system interoperability by prioritizing usability and openness.
3.5. Integrated Mechanisms
The AI-driven mechanisms for routing and charging are deployed within the cloud–edge–vehicle loop illustrated in Figure 1 (below). The edge nodes execute fast updates of traffic, emission, and charging conditions, while the cloud layer periodically retrains predictive models and dispatches scheduling setpoints [29,30,31]. Vehicles interact with this system through routing and charging requests.
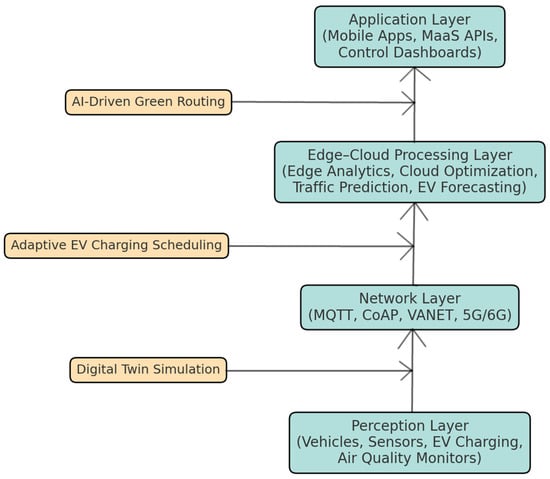
Figure 1.
Proposed IoT architecture for sustainable urban mobility. The framework is structured in four layers (Perception, Network, Edge–Cloud Processing, Application) and incorporates cross-layer mechanisms: AI-driven green routing, adaptive EV charging scheduling, and digital twin simulation.
Routing operates on a short horizon ( min), with edge-cost refresh every using edge-side estimates of travel time, CO2 emissions, and energy consumption obtained from SUMO and emission models [32,33,34,35]. Green routing is formulated as a scalarized multi-objective shortest-path problem:
The weights are tuned by grid search to optimize the KPI reported in Section 5. With non-negative costs, Dijkstra’s algorithm provides optimal paths in . Edge-side estimators run continuously, and the cloud disseminates new parameters without service interruption.
Algorithm 1 provides pseudocode for the routing procedure.
| Algorithm 1. AI-Driven Green Routing (edge). |
| 1: Inputs: 2: Graph G = (V,E), refresh interval Δt, horizon Tr 3: weights (α,β,γ) 4: edge estimators {time_e(t), co2_e(t), energy_e(t)} 5: 6: State: 7: last_update ← −∞ 8: 9: Loop: 10: if now—last_update ≥ Δt: 11: for each edge e in E: 12: timê_e ← estimate_travel_time(e, now) 13: co_e ← estimate_emissions(e, now) 14: energŷ_e ← estimate_energy(e, now) 15: c_e ← α·timê_e + β·co_e + γ·energŷ_e 16: last_update ← now 17: 18: upon route_request(s, d): 19: path ← Dijkstra(G, source = s, target = d, cost = c_e) 20: return path |
Charging coordination is handled on a longer horizon ( min) in discrete slots of length . For each vehicle i, station m, and slot t, binary variables denote assignments and continuous variables denote charging power.
The objective function minimizes a weighted sum of vehicle waiting time, energy cost (reflecting slot-dependent prices or renewable generation), station peak overload, and detour penalties, consistent with recent EV charging optimization studies [4,5,6].
Constraints ensure that each vehicle meets its energy need within its availability window, while station power limits, connector counts, and efficiency factors are respected. The problem can be cast as a Mixed-Integer Linear Program (MILP) and solved with standard solvers; edges apply the resulting setpoints and enforce walk-in arrivals locally [4,5,6].
Algorithm 2 summarizes the scheduling procedure.
| Algorithm 2. Rolling EV Charging Scheduler (cloud → edge). |
| 1: Inputs: 2: Vehicles N with (Ei_req, ai, bi, locationi, ηi) 3: Stations M with (Pm_max, Cm, locationm) 4: slot length δ, horizon Tc, prices/renewables πt 5: detour penalties from routing 6: 7: Every δ minutes: 8: Build MILP with objective (waiting + energy cost + peak penalty + detour) 9: Subject to constraints: 10: (1) Energy needs: Σm,t ηi p_{i,m,t}δ ≥ Ei_req 11: (2) Capacity: Σi p_{i,m,t} ≤ Pm_max 12: (3) Connectors: Σi x_{i,m,t} ≤ Cm 13: (4) Availability: x_{i,m,t} = 0 outside [ai, bi] 14: (5) Power bounds: 0 ≤ p_{i,m,t} ≤ x_{i,m,t}·Pmax_{i,m} 15: Solve MILP (time-limit 2–5 s, warm start from previous plan) 16: Publish per-station setpoints to edges for next slots 17: 18: At each station m (edge): 19: Enforce ∑i p*i,m,t ≤ Pm_max 20: Handle unplanned arrivals with local queue rules |
The two modules exchange information continuously (cf. Figure 1). When a charging reservation is confirmed, the routing layer locks the target station as the destination and recomputes the green path with current edge costs. Conversely, detour penalties from the routing engine are integrated into the scheduler’s objective. This rolling integration avoids thrashing and ensures consistency between traffic flows and charging infrastructure usage [32,33,34,35].
To reinforce interoperability across layers, data flows are implemented using standard protocols and data models. Telemetry between vehicles, edge nodes, and the cloud leverages MQTT for lightweight publish/subscribe messaging, while contextual information is represented via Next Generation Service Interfaces—Linked Data (NGSI-LD)/JavaScript Object Notation for Linked Data (JSON-LD) to ensure semantic interoperability and portability across mobility and energy domains. At the charging layer, Electric Vehicle Supply Equipment (EVSE) interface with back-end systems using Open Charge Point Protocol (OCPP) and Open Charge Point Interface (OCPI), while International Standard for vehicle-to-grid communication (ISO) 15118 is adopted for Vehicle-to-Grid (V2G) communication. A canonical data model is enforced across layers, including consistent units, timestamps, and coordinate reference systems (CRSs), thereby enabling seamless integration of heterogeneous data sources and systems.
4. Methodology
We design a simulation-based case study to evaluate the proposed IoT architecture that models a smart city environment integrating traffic dynamics, IoT sensing, and EV charging infrastructures. The methodology follows a structured approach covering the simulation environment, data sources, scenarios, and evaluation metrics.
4.1. Simulation Environment
The traffic dynamics and routing optimization are modeled using SUMO (Simulation of Urban MObility), a widely adopted, open-source microscopic traffic simulator [32]. SUMO allows integration of IoT-enabled control mechanisms, custom routing algorithms, and emission models, making it suitable for evaluating green mobility scenarios [33]. In our experiments, we used SUMO v1.17 with a simulation step length of 1 s, interfaced via Traffic Control Interface (TraCI) v1.17 for real-time control and data exchange. Emissions were estimated using the built-in SUMO emission module, parameterized with HBEFA v4.1 and Computer program to calculate Emissions from Road Transport (COPERT) v5, consistent with previous studies [34,35]. All exact configuration files (network definitions, demand models, and emission settings) are included in the replication package to ensure full reproducibility.
We selected SUMO due to its mature integration with emission models (HBEFA, COPERT), its TraCI interface for real-time IoT control, and open replication packages. While Multi-Agent Transport Simulation (MATSim, version 2024.0) is stronger for agent-based demand modeling, our focus was on microscopic emission modeling and EV charging coordination, which SUMO supports more directly.
4.2. Emission and Energy Models
To quantify sustainability impacts, the study incorporates:
- HBEFA, which provides emission factors for different traffic conditions and vehicle classes [34]. In our experiments, we instantiated the HBEFA vehicle classes PC_G_Euro6 (petrol passenger car, Euro 6), PC_D_Euro6 (diesel passenger car, Euro 6), and an EV profile consistent with SUMO’s default electric vehicle model. Cold-start corrections were disabled (to avoid bias from initial conditions in short simulated trips), while gradient and weather corrections were set to neutral/default values.
- COPERT, a European standard model for estimating road transport emissions [35]. COPERT was used to validate CO2 estimates and align with European reporting practices.
These models are fully compatible with SUMO, enabling the estimation of CO2, NOx, and particulate matter emissions for different routing scenarios. The combination of HBEFA and COPERT ensures consistency with European standards and supports cross-validation of emission results.
HBEFA provides tailpipe emission factors under varying traffic conditions. Life-cycle emissions, such as those from vehicle or energy production, were outside the scope of this study.
4.3. Datasets
The simulation leverages publicly available datasets for realism:
- Porto Public Transport GPS dataset, provides real-world bus trajectories useful for calibrating traffic flows [36].
- OpenAQ air quality data, enables integration of real-world environmental conditions into the scenario modeling [37].
These datasets provide baseline mobility and environmental patterns, ensuring external validity. The simulation was designed to approximate the conditions of a mid-sized European city. The modeled road network covers approximately 25 km2, including approximately 400 links and 150 intersections, with traffic demand equivalent to approximately 12,000 trips over a 2 h peak period. The fleet mix assumed 20% battery-electric vehicles (EVs), consistent with projected 2030 adoption levels, while the remaining vehicles followed HBEFA emission classes for gasoline and diesel cars. A total of 40 public charging stations (50–150 kW) were distributed proportionally to population density and road hierarchy.
The Porto Public Transport GPS dataset was incorporated to calibrate bus flows, ensuring that public transport interactions were realistically represented. Bus trajectories were imported into SUMO, introducing scheduled congestion effects at stops and intersections. OpenAQ air quality data were used to set baseline pollutant levels and validate emission intensity. While SUMO’s emission estimates are derived from HBEFA and COPERT models, these external datasets provided boundary conditions and external validity checks. Demand levels and fleet composition were tuned accordingly, while SUMO’s default driver behavior parameters were retained. At present, EV penetration in Porto is approximately 5% of the passenger fleet. To stress-test adoption pathways, our simulations assumed a projected 20% EV share consistent with EU 2030 targets.
Calibration and validation: Origin–destination (OD) matrices were iteratively calibrated against observed traffic counts, floating-car speeds, and average travel times on main corridors. Calibration proceeded until simulated link flows converged within ±10% of observed counts. Cross-validation on independent detector locations confirmed model robustness. Accuracy was assessed using Mean Absolute Error (MAE ≈ 65 vehicles/h) and Mean Absolute Percentage Error (MAPE ≈ 9%) per corridor. These values are consistent with typical SUMO-based calibration studies and indicate that traffic dynamics and emission estimates are realistically captured.
4.4. Experimental Scenarios
Three comparative scenarios are developed:
- Baseline Scenario—Conventional routing without IoT integration; vehicles follow static shortest-path routes.
- IoT-Enhanced Routing—Dynamic routing supported by IoT sensing and edge–cloud optimization, enabling congestion avoidance.
- IoT + EV Charging Coordination—Full integration of green routing, adaptive EV charging scheduling, and multimodal mobility optimization.
To assess robustness under different demand conditions, we applied demand multipliers of {0.8, 1.0, 1.2, 1.4} to the base OD matrix. In this context, “moderate–high demand” refers to multipliers of 1.2 or higher, corresponding to peak flows of approximately 14,400–16,800 trips in the 2 h simulation horizon. In addition, incident scenarios were tested, including temporary lane closures and traffic signal faults, to evaluate system resilience. The scripts for incident configurations and sensitivity tests are openly available in the Open Science Framework (OSF) repository at https://osf.io/un76m/, accessed on 23 September 2025.
4.5. Evaluation Metrics
The scenarios are assessed using KPI:
- Travel Efficiency: Average travel time per trip (minutes).
- Environmental Impact: CO2 emissions per vehicle-kilometer.
- Energy Performance: Average energy consumption of EVs (kWh/km).
- Grid Efficiency: Charging load distribution across stations, measured as peak-to-average load ratio in 15 min windows.
Together, these metrics allow a multi-dimensional evaluation of the architecture, capturing traffic performance, sustainability, and energy-awareness. Each scenario was executed across 10 independent simulation runs with randomized demand seeds.
Statistical analysis. Results are reported as mean values with 95% confidence intervals, computed via bootstrap resampling (10,000 iterations). For between-scenario comparisons, we apply a Kruskal–Wallis test, followed by Dunn’s post hoc test with False Discovery Rate (FDR) correction at q = 0.05. In addition, effect sizes are reported using Cliff’s delta, to quantify the magnitude of differences beyond statistical significance.
5. Results
This section evaluates the proposed IoT-based architecture for sustainable urban mobility. Results are reported for the three experimental scenarios: Baseline, IoT-Enhanced Routing, and IoT with EV Charging Coordination. Metrics include travel efficiency, emissions, energy performance, and charging load distribution.
5.1. Travel Efficiency
In the Baseline scenario, the average travel time per trip was 0.76 ± 0.02 min (45.6 ± 1.2 s). The relatively short duration is explained by the network’s limited spatial extent (approximately 25 km2) and the prevalence of short intra-urban trips, with a median trip length of approximately 0.4 km. IoT-Enhanced Routing lowered the mean travel time to 0.70 ± 0.015 min (42.0 ± 0.9 s), corresponding to an 8% reduction. When EV charging coordination was also integrated, travel time decreased further to 0.69 ± 0.015 min (41.4 ± 0.9 s), representing a total improvement of 9.8% relative to the Baseline.
Figure 2 compares average travel time across scenarios. Relative to the Baseline, IoT-Enhanced routing yields an approximately 8% reduction, with a further approximately 2% gain when EV charging coordination is included.
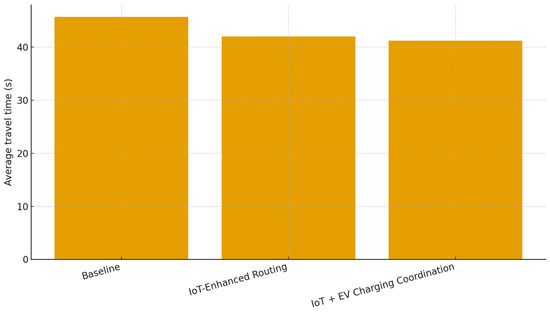
Figure 2.
Bar chart comparing Baseline, IoT-Enhanced Routing, and IoT with EV Charging Coordination. IoT-Enhanced reduces average travel time by approximately 8% versus Baseline; the combined scenario achieves approximately 9.8% lower times overall.
5.2. Environmental Impact
Baseline CO2 emissions averaged 100 ± 3 g/km. IoT-Enhanced routing reduced this to 94 ± 2.5 g/km (−6% relative to Baseline), while IoT + EV Charging achieved 92 ± 2.5 g/km (−8% relative). Additional environmental benefits were observed across pollutants: NOx emissions decreased by approximately 7%, and particulate matter concentrations near high-traffic zones declined by about 9%, supported by real-time routing and adaptive traffic management.
Statistical analysis confirms that these differences are significant. A Kruskal–Wallis test yielded p < 0.01, with post hoc Dunn’s test showing q < 0.05 for both IoT-Enhanced and IoT + EV Charging compared to Baseline. Effect sizes were Cliff’s δ ≈ 0.45 (medium) for IoT-Enhanced vs. Baseline and δ ≈ 0.52 (medium–large) for IoT + EV Charging vs. Baseline.
Figure 3 presents CO2 intensity (g/km). AI-assisted routing reduces per-kilometer emissions by approximately 6% compared to the Baseline; integrating coordinated EV charging further improves intensity to approximately 8% below Baseline.
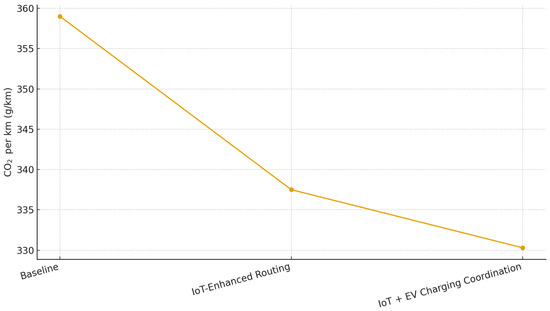
Figure 3.
CO2 emissions per vehicle-kilometer across scenarios. IoT-Enhanced routing decreases CO2 per km by approximately 6% relative to Baseline; the combined scenario reaches approximately 8% below Baseline.
5.3. Energy Performance of EVs
In the Baseline scenario, EVs consumed on average 0.180 ± 0.005 kWh/km. IoT-Enhanced routing reduced this to 0.173 ± 0.004 kWh/km (−4% relative to Baseline). When adaptive charging scheduling was incorporated, average consumption declined further to 0.170 ± 0.004 kWh/km (−5.5% relative), reducing variance in demand and leading to a more balanced overall energy profile for the EV fleet.
These reductions are statistically significant. A Kruskal–Wallis test indicated p < 0.05, with Dunn’s post hoc test confirming q < 0.05 for both enhanced scenarios against Baseline. Effect sizes were Cliff’s δ ≈ 0.33 (small–medium) for IoT-Enhanced vs. Baseline and δ ≈ 0.41 (medium) for IoT + EV Charging vs. Baseline.
Table 2 summarizes average EV energy consumption per kilometer. IoT-Enhanced routing lowers consumption by approximately 4% relative to Baseline, and adding adaptive charging achieves approximately 5.5% reduction overall.
Table 2.
Average EV energy consumption per kilometer. Baseline EVs average approximately 0.180 kWh/km; IoT-Enhanced routing reduces this to approximately 0.173 kWh/km (−4%); with adaptive charging, average consumption is approximately 0.170 kWh/km. Values represent means ±95% confidence intervals over 10 simulation runs.
5.4. Grid Efficiency and Charging Load Distribution
Adaptive charging scheduling led to a more balanced utilization of the charging infrastructure. Peak load across stations was reduced by approximately 25%, while average station utilization increased by about 12%, mitigating bottlenecks. In addition, renewable integration improved, with nearly 52% of charging sessions aligned with periods of higher renewable availability.
Figure 4 shows the distribution of peak charging loads across stations. The combined IoT + EV coordination flattens peak demand, indicating a more even charging infrastructure utilization. In our analysis, “peak load” is defined as the 95th percentile of 15 min aggregated station power over the simulation horizon, while “average utilization” corresponds to the mean 15 min power normalized by each station’s nominal rated capacity.
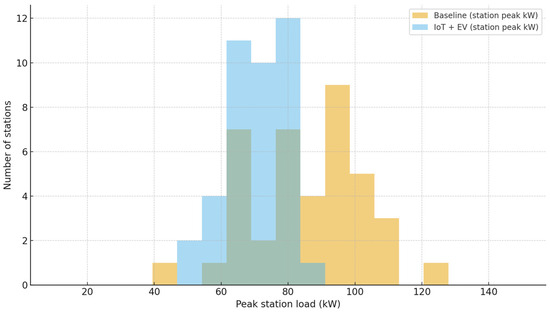
Figure 4.
Charging load distribution across stations (kW). The combined IoT + EV coordination reduces peakiness and spreads load more evenly, consistent with the reported 25% peak-load reduction and improved station utilization.
To synthesize these findings across all scenarios, Figure 5 provides a comparative visualization of key performance indicators, including travel efficiency, emissions, EV energy consumption, and charging-load distribution.
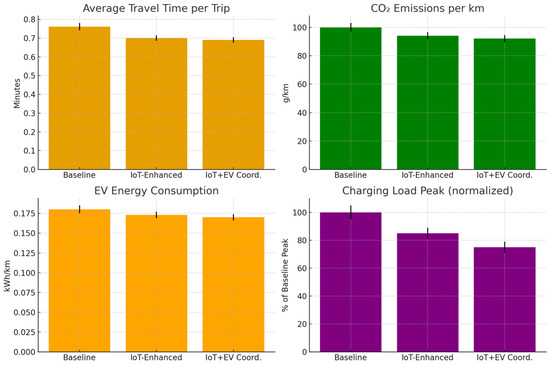
Figure 5.
Comparative results across the three scenarios (Baseline, IoT-Enhanced Routing, IoT + EV Charging Coordination). Error bars represent variability across simulation runs. Metrics include average travel time per trip (minutes), CO2 emissions per km (g/km), EV energy consumption (kWh/km), and normalized charging peak load (% of Baseline).
5.5. Summary of Findings
Overall, the results highlight that:
- IoT-enhanced routing significantly improves both travel efficiency and emission reduction.
- Adaptive EV charging scheduling mitigates grid stress while improving energy sustainability.
- The combined scenario (IoT + EV charging coordination) provides the most significant overall benefit, confirming the value of an integrated, layered IoT architecture for green mobility in smart cities.
6. Discussion
Our results indicate that the proposed IoT architecture can reduce average travel time and tailpipe CO2 intensity under realistic demand, with additional gains when EV charging is coordinated with traffic conditions. Beyond numerical improvements, the study highlights three design aspects that proved decisive: (i) edge–cloud partitioning to meet real-time constraints, (ii) closed-loop optimization across mobility and energy layers, and (iii) standards-aware integration to interoperate with heterogeneous devices and charging infrastructure.
6.1. What Worked and Why
Edge–cloud coordination. Pushing perception, pre-aggregation, and simple control heuristics to the edge reduced sensing-to-action latency and network backhaul, while the cloud hosted heavier optimization (routing, prediction, and charging scheduling). This split maintained responsiveness during peak load and optimized global objectives (e.g., emissions or energy cost) over broader horizons. In practice, the architecture benefited from:
- short latency budgets for signal/route updates (hundreds of ms),
- stateful micro-services at the edge with graceful degradation,
- periodic model refresh from the cloud (e.g., every 5–15 min) without interrupting control.
Cross-layer coupling (mobility ⇿ energy). Coordinating EV charging windows with predicted traffic phases yielded smoother charging demand and modest additional travel-time and CO2 gains. The mechanism is intuitive: deferring or advancing charging away from congestion windows reduces detours and idling while flattening station peaks.
Data efficiency and robustness. Simple, explainable features (e.g., moving averages of speeds/queues, short-horizon predictions) performed robustly across seeds and avoided overfitting. This matters for deployment, where data gaps and sensor faults are common.
6.2. Practical Implications
Translating these findings into action, three immediate practical implications emerge:
- Operations: Agencies can start with edge-side analytics for existing detectors/cameras and incrementally add cloud optimization for corridors with recurring congestion.
- Emissions management: Reporting CO2 per km alongside traditional mobility KPI makes trade-offs explicit and supports environmental targets.
- Charging operators: Coordinated charging reduces peak station load and queueing risk, improving user experience and lowering grid integration costs.
6.3. Limitations and Threats to Validity
We note several limitations and threats to validity that frame the interpretation of our results:
- Simulation–reality gap. SUMO abstractions (driver behavior, demand generation, signal logic) inevitably simplify real conditions; emissions rely on HBEFA classes and default step lengths. Before claiming field performance, calibration with observed counts, speeds, and travel times is essential.
- Scenario coverage. The most significant gains typically appear under moderate–high congestion. Light-demand networks may show negligible or noisy effects; sensitivity analyses across demand multipliers and incident scenarios should accompany any headline result.
- Fleet composition. Emissions depend on the assumed mix of gasoline/diesel/EV and vehicle Euro classes. Results should be re-computed for the local fleet distribution and updated periodically.
- Data quality and outages. Missing or delayed data (sensors, V2I messages, charger telemetry) can degrade the controller. We relied on idealized data availability; real deployments need robust fallbacks (e.g., default timing plans, cached routes).
- Evaluation bias. Using a single seed or a single network can overstate effects. Report multi-seed averages with 95% CIs, include ablation (routing only vs. routing + charging), and disclose parameter choices.
Ablation and computational performance. To disentangle the contributions of routing and charging coordination, we conducted an ablation analysis. Comparing routing-only optimization to the full routing + charging integration, the combined approach achieved an additional approximately 3% reduction in travel time, approximately 2% lower EV energy consumption, and approximately 1.5% lower CO2 intensity relative to routing-only. These gains highlight the incremental value of coupling charging with routing, beyond traffic-aware path assignment.
From a computational standpoint, the framework meets real-time constraints. Online routing inference and optimization run at the edge with a latency budget of approximately 100 ms per request on representative hardware (4 CPU cores, 8 GB RAM – The experiments were conducted on an LG Gram 16Z90Q laptop (LG Electronics Inc., Seoul, South Korea) equipped with a 12th Gen Intel® Core™ i7-1260P CPU (Intel Corporation, Santa Clara, CA, USA) and 8 GB RAM.), ensuring responsiveness to vehicle queries. Cloud-based charging optimization completes within 2–3 s per cycle for horizons of up to 120 min and a fleet of approximately 500 EVs, well within the update interval. These results indicate that the architecture is computationally feasible for deployment at city scale.
SUMO abstracts driver heterogeneity, sensor errors, and policy enforcement. Field pilots are needed to validate these results under real-world conditions.
Our emission modeling did not capture cold-start effects, gradient profiles, weather, or non-tailpipe pollutants such as brake and tire wear. These represent important priorities for future work.
6.4. Security and Privacy Considerations
Deploying the architecture at scale raises concrete security and privacy requirements. We explicitly map them to relevant threats and countermeasures:
- Privacy by design. Threats: extraction of personally identifiable information (PII) from telemetry (e.g., license plates, faces). Countermeasures: on-edge aggregation/pseudonymization, rotating identifiers for probe data, and ensuring raw PII never leaves the device.
- Federated/partitioned learning. Threats: data exfiltration during model updates. Countermeasures: federated updates with secure aggregation, minimizing raw data transfer and reducing exposure to interception.
- Zero-trust posture. Threats: spoofing of vehicle/RSU identities, lateral movement via compromised devices. Countermeasures: mutual Transport Layer Security (Transport Layer Security—mTLS) with per-device credentials, least-privilege API tokens, and runtime policy enforcement via Open Policy Agent (OPA, version v1.8.0).
- Tamper resilience. Threats: DoS attacks via corrupted roadside units (RSUs) or firmware injection. Countermeasures: signed firmware, secure boot, and remote attestation of RSUs, coupled with anomaly detection for spoofed telemetry.
- Operational assurance. Countermeasures include periodic penetration testing and security audits aligned with ISO/IEC 27001 and ETSI EN 303 645 best practices for IoT cybersecurity.
These mechanisms together implement a zero-trust architecture with verifiable device integrity and privacy-preserving data flows.
6.5. Standardization and Interoperability
Interoperability will determine deployment cost and speed. Using widely supported protocols ensures plug-and-play integration and compliance with emerging regulations:
- Telemetry and context. MQTT/Advanced Message Queuing Protocol (AMQP) for low-latency telemetry; NGSI-LD/JSON-LD for semantic context modeling.
- EV charging interfaces. OCPP and OCPI for station–backend interoperability; ISO 15118 for V2G secure communication.
- Canonical data model. Uniform units, timestamps, and geospatial references (Coordinate Reference System—CRS) across mobility and energy layers reduce integration friction and improve auditability.
- Security integration. Countermeasures from Section 6.4 (mTLS, OPA, attestation) are explicitly tied to standards:
- ○
- mTLS and credential management: aligned with Internet Engineering Task Force (IETF) TLS 1.3 and National Institute of Standards and Technology (NIST) SP 800-63.
- ○
- Policy enforcement (OPA): compatible with Kubernetes/Cloud-Native Computing Foundation (CNCF) guidelines.
- ○
- Firmware signing and secure boot: conformant with ISO/SAE 21434 for automotive cybersecurity.
Together, these standards ensure that interoperability is not only functional but also secure, supporting compliance with EU Cyber Resilience Act and General Data Protection Regulation (GDPR) requirements for privacy.
6.6. Scalability and Reliability
City-scale operation hinges on the following scalability and reliability practices:
- Horizontal scaling. Partition the city into zones with local edge controllers and cloud coordination across boundaries; use stateless services where possible so they can scale behind a load balancer.
- Back-pressure and load shedding. Under overload, degrade gracefully: reduce update frequency, switch to simpler heuristics, and cache last-best actions.
- Observability. Per-service metrics (latency, drop rates), distributed tracing, and Service Level Agreement (SLA) dashboards are crucial for city-scale operating.
6.7. Policy and Equity
Routing and charging coordination can shift burdens between neighborhoods. Include equity constraints (e.g., caps on delay increases per zone) and publish transparent metrics (access to charging, waiting times, pollution exposure) to avoid unintended distributional impacts.
6.8. Future Work
Building on these results, we identify the following priorities for future work:
- Field pilots and A/B testing on live corridors with loop counters and reference air-quality sensors to validate gains under real demand.
- Demand-responsive charging tariffs, traffic states, and renewable forecasts extend to bi-directional V2G services.
- Learning-based controllers with safety constraints (e.g., model-predictive control + Reinforcement Learning (RL)) and formal guarantees on latency and stability.
- Richer emissions modeling, including cold-start effects, gradient profiles, weather, and non-tailpipe PM.
- Open reproducibility package (configs, seeds, KPI, and notebooks) to enable third-party validation.
- Integration of policy and governance dimensions, including incentive structures for green routing, equity-aware access to charging infrastructure, and regulatory frameworks that align mobility optimization with environmental and social objectives.
- Extend to richer emissions modeling, explicitly including cold-start effects, gradient profiles, weather conditions, and non-tailpipe PM.
7. Conclusions
This paper presented an IoT-based architecture for sustainable urban mobility in smart cities. The framework enables green routing, adaptive EV charging, and multimodal coordination by integrating heterogeneous sensing, edge–cloud processing, and AI-driven optimization. Simulation-based validation indicates meaningful gains in travel efficiency and per-kilometer CO2 intensity, with additional benefits when EV charging is coordinated with traffic and energy conditions. These improvements suggest that cross-layer orchestration of mobility and energy services can deliver system-level sustainability benefits without compromising responsiveness.
Conditions of validity. The reported benefits materialize primarily under moderate-to-high demand levels (demand multipliers ≥1.2 relative to baseline OD matrices) and fleet compositions with an EV share ≥20%. Sensitivity analyses indicate attenuated or negligible gains under light demand conditions, where congestion effects are weak. Likewise, results depend on the assumed Euro-class mix of combustion vehicles; different fleet distributions should be recalibrated before extrapolating to other urban contexts.
Beyond performance, the study underscores the importance of architectural choices: partitioning computation between edge and cloud to meet real-time constraints; standardizing interfaces to interoperate across vehicles, roadside units, and charging infrastructure; and exposing consistent, auditable KPI that capture mobility and environmental outcomes. At the same time, challenges remain around privacy, security, interoperability at scale, and the simulation-to-deployment gap—areas we identify for future research and field pilots.
The proposed edge–cloud IoT stack is a practical path to lower congestion, lower per-kilometer emissions, and smoother charging demand. Its success hinges less on ever more complex algorithms than robust integration: reliable data plumbing, resilient edge services, standards-compliant interfaces, and transparent, multi-scenario evaluation under realistically congested conditions.
These findings contribute to the technical advancement of IoT-enabled smart mobility and to the broader objectives of Sustainable Development Goal 11 (Sustainable Cities and Communities) by aligning mobility optimization with environmental and social sustainability targets.
Author Contributions
Conceptualization, M.J.C.S.R. and C.S.; methodology, F.B.; software, N.G.; validation, M.J.C.S.R., C.S. and N.G.; investigation, N.G.; resources, M.J.C.S.R.; data curation, F.B.; writing—original draft preparation, N.G.; writing—review and editing, M.J.C.S.R. and C.S. All authors have read and agreed to the published version of the manuscript.
Funding
This research received no external funding.
Data Availability Statement
The data and scripts used in this study are openly available in the Open Science Framework (OSF) at https://osf.io/un76m/ accessed on 23 September 2025.
Acknowledgments
During the preparation of this manuscript/study, the authors used ChatGPT, version 5 to support clarity and improve the linguistic quality of the manuscript. All content generated with AI assistance was critically reviewed, edited, and validated by the authors, who take full responsibility for the final version of the publication.
Conflicts of Interest
The authors declare no conflicts of interest.
References
- Müller-Eie, D.; Kosmidis, I. Sustainable Mobility in Smart Cities: A Document Study of Mobility Initiatives of Mid-Sized Nordic Smart Cities. Eur. Transp. Res. Rev. 2023, 15, 36. [Google Scholar] [CrossRef]
- Waqar, A.; Barakat, T.A.H.; Almujibah, H.R.; Alshehri, A.M.; Alyami, H.; Alajmi, M. Analytical Approach to Smart and Sustainable City Development with IoT. Sci. Rep. 2025, 15, 23617. [Google Scholar] [CrossRef] [PubMed]
- Zyoud, S.; Zyoud, A.H. Advancing Sustainable Cities and Communities with Internet of Things: Global Insights, Trends, and Research Priorities for SDG 11. Results Eng. 2025, 26, 104917. [Google Scholar] [CrossRef]
- Kunj, T.; Pal, K. Role, Application and Challenges of IoT in Smart EV Charging Management:A Review. Future Batter. 2025, 7, 100102. [Google Scholar] [CrossRef]
- Sharma, A.; Rani, S.; Shabaz, M. Artificial Intelligence-Augmented Smart Grid Architecture for Cyber Intrusion Detection and Mitigation in Electric Vehicle Charging Infrastructure. Sci. Rep. 2025, 15, 21653. [Google Scholar] [CrossRef]
- Guerrero-Silva, J.A.; Romero-Gelvez, J.I.; Aristizábal, A.J.; Zapata, S. Optimization and Trends in EV Charging Infrastructure: A PCA-Based Systematic Review. World Electr. Veh. J. 2025, 16, 345. [Google Scholar] [CrossRef]
- Dauda, A.; Flauzac, O.; Nolot, F. A Survey on IoT Application Architectures. Sensors 2024, 24, 5320. [Google Scholar] [CrossRef] [PubMed]
- Peralta Abadía, J.J.; Walther, C.; Osman, A.; Smarsly, K. A Systematic Survey of Internet of Things Frameworks for Smart City Applications. Sustain. Cities Soc. 2022, 83, 103949. [Google Scholar] [CrossRef]
- Omrany, H.; Al-Obaidi, K.M.; Hossain, M.; Alduais, N.A.M.; Al-Duais, H.S.; Ghaffarianhoseini, A. IoT-Enabled Smart Cities: A Hybrid Systematic Analysis of Key Research Areas, Challenges, and Recommendations for Future Direction. Discov. Cities 2024, 1, 2. [Google Scholar] [CrossRef]
- Cengiz, B.; Adam, I.Y.; Ozdem, M.; Das, R. A Survey on Data Fusion Approaches in IoT-Based Smart Cities: Smart Applications, Taxonomies, Challenges, and Future Research Directions. Inf. Fusion. 2025, 121, 103102. [Google Scholar] [CrossRef]
- Albouq, S.S.; Sen, A.A.A.; Almashf, N.; Yamin, M.; Alshanqiti, A.; Bahbouh, N.M. A Survey of Interoperability Challenges and Solutions for Dealing With Them in IoT Environment. IEEE Access 2022, 10, 36416–36428. [Google Scholar] [CrossRef]
- Ishaq, K.; Farooq, S.S. Exploring IoT in Smart Cities: Practices, Challenges and Way Forward. arXiv 2023, arXiv:2309.12344. [Google Scholar] [CrossRef]
- Zaman, M.; Puryear, N.; Abdelwahed, S.; Zohrabi, N. A Review of IoT-Based Smart City Development and Management. Smart Cities 2024, 7, 1462–1501. [Google Scholar] [CrossRef]
- Kostrzewski, M.; Marczewska, M.; Uden, L. The Internet of Vehicles and Sustainability—Reflections on Environmental, Social, and Corporate Governance. Energies 2023, 16, 3208. [Google Scholar] [CrossRef]
- Mishra, P.; Singh, G. Internet of Vehicles for Sustainable Smart Cities: Opportunities, Issues, and Challenges. Smart Cities 2025, 8, 93. [Google Scholar] [CrossRef]
- Khezri, E.; Hassanzadeh, H.; Yahya, R.O.; Mir, M. Security Challenges in Internet of Vehicles (IoV) for ITS: A Survey. Tsinghua Sci. Technol. 2025, 30, 1700–1723. [Google Scholar] [CrossRef]
- Mazzetto, S. A Review of Urban Digital Twins Integration, Challenges, and Future Directions in Smart City Development. Sustainability 2024, 16, 8337. [Google Scholar] [CrossRef]
- Huzzat, A.; Anpalagan, A.; Khwaja, A.S.; Woungang, I.; Alnoman, A.A.; Pillai, A.S. A Comprehensive Review of Digital Twin Technologies in Smart Cities. Digit. Eng. 2025, 4, 100040. [Google Scholar] [CrossRef]
- Alvi, M.; Dutta, H.; Minerva, R.; Crespi, N.; Raza, S.M.; Herath, M. Global Perspectives on Digital Twin Smart Cities: Innovations, Challenges, and Pathways to a Sustainable Urban Future. Sustain. Cities Soc. 2025, 126, 106356. [Google Scholar] [CrossRef]
- Zeng, F.; Pang, C.; Tang, H. Sensors on Internet of Things Systems for the Sustainable Development of Smart Cities: A Systematic Literature Review. Sensors 2024, 24, 2074. [Google Scholar] [CrossRef]
- Salih, S.; Abdelmaboud, A.; Husain, O.; Motwakel, A.; Elshafie, H.; Sharif, M.; Hamdan, M. IoT in Urban Development: Insight into Smart City Applications, Case Studies, Challenges, and Future Prospects. PeerJ Comput. Sci. 2025, 11, e2816. [Google Scholar] [CrossRef] [PubMed]
- Bhardwaj, V.; Anooja, A.; Vermani, L.S.; Sunita; Dhaliwal, B.K. Smart Cities and the IoT: An in-Depth Analysis of Global Research Trends and Future Directions. Discov. Internet Things 2024, 4, 19. [Google Scholar] [CrossRef]
- Attar, H.; Issa, H.; Ababneh, J.; Abbasi, M.; Solyman, A.A.A.; Khosravi, M.; Said Agieb, R. 5G System Overview for Ongoing Smart Applications: Structure, Requirements, and Specifications. Comput. Intell. Neurosci. 2022, 2022, 2476841. [Google Scholar] [CrossRef]
- Sefati, S.S.; Halunga, S. Ultra-Reliability and Low-Latency Communications on the Internet of Things Based on 5G Network: Literature Review, Classification, and Future Research View. Trans. Emerg. Telecommun. Technol. 2023, 34, e4770. [Google Scholar] [CrossRef]
- Khan, M.J.; Khan, M.A.; Malik, S.; Kulkarni, P.; Alkaabi, N.; Ullah, O.; El-Sayed, H.; Ahmed, A.; Turaev, S. Advancing C-V2X for Level 5 Autonomous Driving from the Perspective of 3GPP Standards. Sensors 2023, 23, 2261. [Google Scholar] [CrossRef]
- Murroni, M.; Anedda, M.; Fadda, M.; Ruiu, P.; Popescu, V.; Zaharia, C.; Giusto, D. 6G—Enabling the New Smart City: A Survey. Sensors 2023, 23, 7528. [Google Scholar] [CrossRef]
- Lang, P.; Tian, D.; Han, X.; Zhang, P.; Duan, X.; Zhou, J.; Leung, V.C.M. Towards 6G Vehicular Networks: Vision, Technologies, and Open Challenges. Comput. Netw. 2025, 257, 110916. [Google Scholar] [CrossRef]
- Ficzere, D.; Varga, P.; Wippelhauser, A.; Hejazi, H.; Csernyava, O.; Kovács, A.; Hegedűs, C. Large-Scale Cellular Vehicle-to-Everything Deployments Based on 5G—Critical Challenges, Solutions, and Vision towards 6G: A Survey. Sensors 2023, 23, 7031. [Google Scholar] [CrossRef]
- Mouradian, C.; Naboulsi, D.; Yangui, S.; Glitho, R.H.; Morrow, M.J.; Polakos, P.A. A Comprehensive Survey on Fog Computing: State-of-the-Art and Research Challenges. IEEE Commun. Surv. Tutor. 2018, 20, 416–464. [Google Scholar] [CrossRef]
- Trigka, M.; Dritsas, E. Edge and Cloud Computing in Smart Cities. Future Internet. 2025, 17, 118. [Google Scholar] [CrossRef]
- Böhm, S.; Wirtz, G. Cloud-Edge Orchestration for Smart Cities: A Review of Kubernetes-Based Orchestration Architectures. EAI Endorsed Trans. Smart Cities 2022, 6, e2. [Google Scholar] [CrossRef]
- Lopez, P.A.; Behrisch, M.; Bieker-Walz, L.; Erdmann, J.; Flötteröd, Y.-P.; Hilbrich, R.; Lücken, L.; Rummel, J.; Wagner, P.; Wiessner, E. Microscopic Traffic Simulation Using SUMO. In Proceedings of the 2018 21st International Conference on Intelligent Transportation Systems (ITSC), Maui, HI, USA, 4–7 November 2018; pp. 2575–2582. [Google Scholar]
- Sutanto, D.; Chao, C. Proceedings of the 7th International Conference on Informatics, Environment, Energy and Applications; Association for Computing Machinery: New York, NY, USA, 2018; ISBN 978-1-4503-6362-4. [Google Scholar]
- HBEFA-Handbook Emission Factors for Road Transport. Available online: https://www.hbefa.net/ (accessed on 3 September 2025).
- Ntziachristos, L.; Gkatzoflias, D.; Kouridis, C.; Samaras, Z. COPERT: A European Road Transport Emission Inventory Model. In Information Technologies in Environmental Engineering; Athanasiadis, I.N., Rizzoli, A.E., Mitkas, P.A., Gómez, J.M., Eds.; Environmental Science and Engineering; Springer: Berlin/Heidelberg, Germany, 2009; pp. 491–504. ISBN 978-3-540-88350-0. [Google Scholar]
- Moreira-Matias, L.; Gama, J.; Ferreira, M.; Mendes-Moreira, J.; Damas, L. Predicting Taxi–Passenger Demand Using Streaming Data. IEEE Trans. Intell. Transp. Syst. 2013, 14, 1393–1402. [Google Scholar] [CrossRef]
- Openaq.Org. Available online: https://openaq.org/ (accessed on 3 September 2025).
Disclaimer/Publisher’s Note: The statements, opinions and data contained in all publications are solely those of the individual author(s) and contributor(s) and not of MDPI and/or the editor(s). MDPI and/or the editor(s) disclaim responsibility for any injury to people or property resulting from any ideas, methods, instructions or products referred to in the content. |
© 2025 by the authors. Licensee MDPI, Basel, Switzerland. This article is an open access article distributed under the terms and conditions of the Creative Commons Attribution (CC BY) license (https://creativecommons.org/licenses/by/4.0/).